Embed Size (px)
Citation preview

Capacity Development Project for Air Pollution Control in Ulaanbaatar City Phase 2 Mongolia Technical Manual 08 Manual for Conducting and Updating of Dispersion Simulation
SUURI-KEIKAKU CO., LTD. - 37 -
4 Export of Emission Data from Access File 4.1 Power Plant Open “StationarySources.mdb” and after right-clicking “Q_PowerPlant_Emission_Inventory” query, click [Design View].
After right-clicking on the area that table is displayed, click [Show Table].
Select “PowerPlantInventory_2015_Amgalan_MonRef97” table in [Tables] tab and click [Add].

Capacity Development Project for Air Pollution Control in Ulaanbaatar City Phase 2 Mongolia Technical Manual 08 Manual for Conducting and Updating of Dispersion Simulation
SUURI-KEIKAKU CO., LTD. - 38 -
Apply the setting of each field to the items of “PowerPlantInventory_2015_Amgalan_MonRef97” table.
To delete the old table, right-click this table and click [Remove Table].
Click [Make Table] in [Design] tab
Set the table name (Here it is “PowerPlant_Emission_2015_Amgalan”).

Capacity Development Project for Air Pollution Control in Ulaanbaatar City Phase 2 Mongolia Technical Manual 08 Manual for Conducting and Updating of Dispersion Simulation
SUURI-KEIKAKU CO., LTD. - 39 -
Click [Run] and make new table.
Click [Yes].
Select the created table and click [Export]-[Excel] in [Design] tab.
After setting the file save location at [Browse], click [OK].
Click [Close].

Capacity Development Project for Air Pollution Control in Ulaanbaatar City Phase 2 Mongolia Technical Manual 08 Manual for Conducting and Updating of Dispersion Simulation
SUURI-KEIKAKU CO., LTD. - 40 -
4.2 HOB Open “StationarySources.mdb” and after right-clicking “Q_HOB_Emission_Inventory_2014” query, click [Design View].
After right-clicking on the area that table is displayed, click [Show Table].
Select “HOBInventory_2015_MonRef97” table in [Tables] tab and click [Add].

Capacity Development Project for Air Pollution Control in Ulaanbaatar City Phase 2 Mongolia Technical Manual 08 Manual for Conducting and Updating of Dispersion Simulation
SUURI-KEIKAKU CO., LTD. - 41 -
Apply the setting of each field to the items of “HOBInventory_2015_MonRef97” table.
To delete the old table, right-click this table and click [Remove Table].
Click [Make Table] in [Design] tab

Capacity Development Project for Air Pollution Control in Ulaanbaatar City Phase 2 Mongolia Technical Manual 08 Manual for Conducting and Updating of Dispersion Simulation
SUURI-KEIKAKU CO., LTD. - 42 -
Set the table name (Here it is “HOB_Emission_2015”).
Click [Run] and make new table.
Click [Yes].
Select the created table and click [Export]-[Excel] in [Design] tab.
After setting the file save location at [Browse], click [OK].

Capacity Development Project for Air Pollution Control in Ulaanbaatar City Phase 2 Mongolia Technical Manual 08 Manual for Conducting and Updating of Dispersion Simulation
SUURI-KEIKAKU CO., LTD. - 43 -
Click [Close].
4.3 CFWH Select the table organizing emissions by grid and click [Export]-[Excel] in [Design] tab (Here it is “CFWH_emis_grid1km_2015” table).
After setting the file save location at [Browse], click [OK].
Capacity Development Project for Air Pollution Control in Ulaanbaatar City Phase 2 Mongolia Technical Manual 08 Manual for Conducting and Updating of Dispersion Simulation
SUURI-KEIKAKU CO., LTD. - 44 -
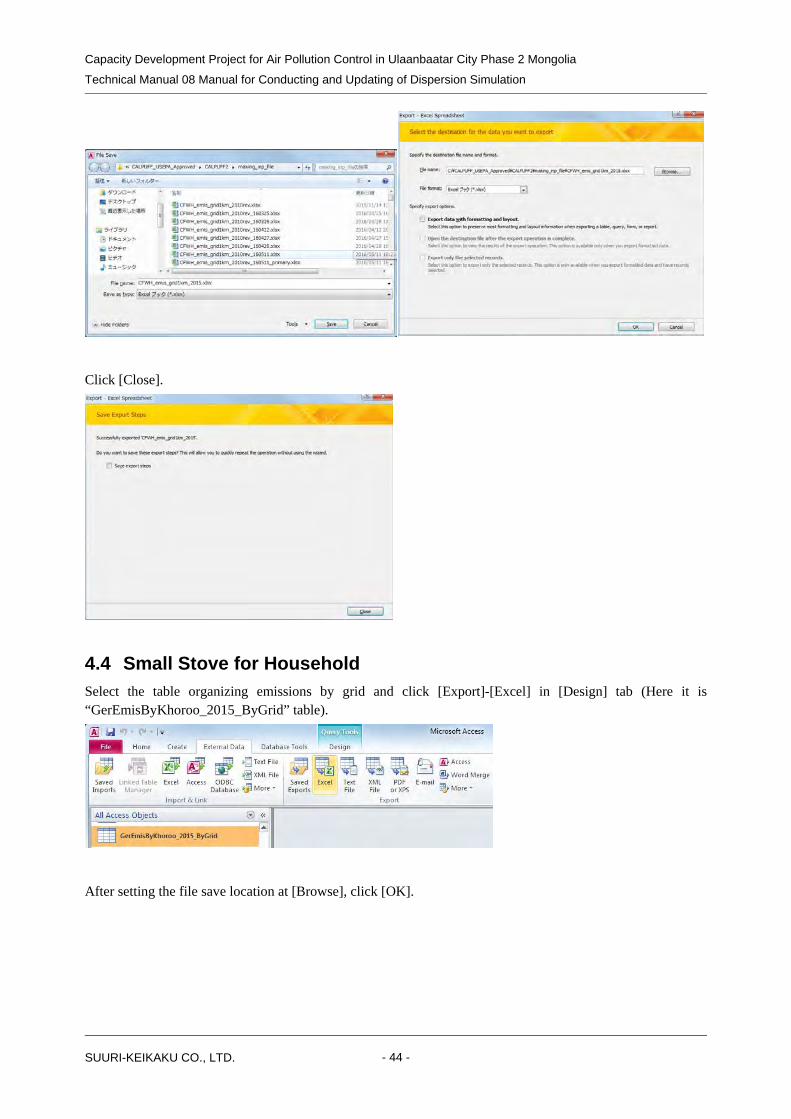
Click [Close].
4.4 Small Stove for Household Select the table organizing emissions by grid and click [Export]-[Excel] in [Design] tab (Here it is “GerEmisByKhoroo_2015_ByGrid” table).
After setting the file save location at [Browse], click [OK].

Capacity Development Project for Air Pollution Control in Ulaanbaatar City Phase 2 Mongolia Technical Manual 08 Manual for Conducting and Updating of Dispersion Simulation
SUURI-KEIKAKU CO., LTD. - 45 -
Click [Close].
4.5 Mobile Sources 4.5.1 Vehicle Exhaust Gas in Major Road
Select the table organizing emissions by grid and click [Export]-[Excel] in [Design] tab (Here it is “t67_EmissionMajorRoadByLink_LineSource” table).
After setting the file save location at [Browse], click [OK].

Capacity Development Project for Air Pollution Control in Ulaanbaatar City Phase 2 Mongolia Technical Manual 08 Manual for Conducting and Updating of Dispersion Simulation
SUURI-KEIKAKU CO., LTD. - 46 -
Click [Close].
4.5.2 Fugitive Dust by Travelling Vehicle in Major Road
Select the table organizing emissions by grid and click [Export]-[Excel] in [Design] tab (Here it is “t67_EmissionMajorRoadByLink_LineSource_FD” table).
After setting the file save location at [Browse], click [OK].

Capacity Development Project for Air Pollution Control in Ulaanbaatar City Phase 2 Mongolia Technical Manual 08 Manual for Conducting and Updating of Dispersion Simulation
SUURI-KEIKAKU CO., LTD. - 47 -
Click [Close].
4.5.3 Vehicle Exhaust Gas in Minor Road
Select the table organizing emissions by grid and click [Export]-[Excel] in [Design] tab (Here it is “t72_EmissionMinorRoadByGrid” table).
After setting the file save location at [Browse], click [OK].

Capacity Development Project for Air Pollution Control in Ulaanbaatar City Phase 2 Mongolia Technical Manual 08 Manual for Conducting and Updating of Dispersion Simulation
SUURI-KEIKAKU CO., LTD. - 48 -
Click [Close].
4.5.4 Fugitive Dust by Travelling Vehicle in Minor Road (Paved Road)
Select the table organizing emissions by grid and click [Export]-[Excel] in [Design] tab (Here it is “t75_EmissionMinorRoadByGrid_FD_Paved” table).
After setting the file save location at [Browse], click [OK].

Capacity Development Project for Air Pollution Control in Ulaanbaatar City Phase 2 Mongolia Technical Manual 08 Manual for Conducting and Updating of Dispersion Simulation
SUURI-KEIKAKU CO., LTD. - 49 -
Click [Close].
4.5.5 Fugitive Dust by Travelling Vehicle in Major Road(Unpaved Road)
Select the table organizing emissions by grid and click [Export]-[Excel] in [Design] tab (Here it is “t75_EmissionMinorRoadByGrid_FD_Unpaved” table).
After setting the file save location at [Browse], click [OK].

Capacity Development Project for Air Pollution Control in Ulaanbaatar City Phase 2 Mongolia Technical Manual 08 Manual for Conducting and Updating of Dispersion Simulation
SUURI-KEIKAKU CO., LTD. - 50 -
Click [Close].
4.6 Other Source (Fugitive Ash from Ash Pond of Power Plant) Select the table organizing emissions by grid and click [Export]-[Excel] in [Design] tab (Here it is “PPAsh_emis_grid1km_2015” table).
After setting the file save location at [Browse], click [OK].

Capacity Development Project for Air Pollution Control in Ulaanbaatar City Phase 2 Mongolia Technical Manual 08 Manual for Conducting and Updating of Dispersion Simulation
SUURI-KEIKAKU CO., LTD. - 51 -
Click [Close].

Capacity Development Project for Air Pollution Control in Ulaanbaatar City Phase 2 Mongolia Technical Manual 08 Manual for Conducting and Updating of Dispersion Simulation
SUURI-KEIKAKU CO., LTD. - 52 -
5 Converting to the Source Input Format for CALPUFF 5.1 Point Source Open the Excel file in export destination folder and the file of elevation data by grid (UB_altitude.xlsx).
Copy ”sheet1-1” of “UB_altitude.xlsx” to the Excel file in export destination folder
Add columns to calculate the emissions of SO2, SO4 and NO3.
Input formulas to calculate the emission of SO4 and NO3.
SO4 Emission =SO2 Emission x conversion ratio from SO2 to SO4 x 96/64

Capacity Development Project for Air Pollution Control in Ulaanbaatar City Phase 2 Mongolia Technical Manual 08 Manual for Conducting and Updating of Dispersion Simulation
SUURI-KEIKAKU CO., LTD. - 53 -
SO2 Emission = SO2 Emission x (1- conversion ratio from SO2 to SO4)
NO3 Emission =PM10 Emission x NO3 contribution ratio by composition analysis of PM10
Click [Filter] in “Data” tab and add filter function to the first row.
Select ”▼” at [X_m] and [Y_m] and filter in calculation range in east-west and south-north directions.

Capacity Development Project for Air Pollution Control in Ulaanbaatar City Phase 2 Mongolia Technical Manual 08 Manual for Conducting and Updating of Dispersion Simulation
SUURI-KEIKAKU CO., LTD. - 54 -
Select ”▼” at [SO2_TPY] and filter to point source that SO2 emission is not zero.

Capacity Development Project for Air Pollution Control in Ulaanbaatar City Phase 2 Mongolia Technical Manual 08 Manual for Conducting and Updating of Dispersion Simulation
SUURI-KEIKAKU CO., LTD. - 55 -
Only rows extracted by the above filter function are displayed
Copy the point sources generated by filter function and paste them on another sheet, and set the name of each sheet to "13b" and "13d".
Using the "13b" sheet, create the string information on point sources (13b) among CALPUFF input data. First, delete monthly operation patterns that are unnecessary for creating “13b”.
Capacity Development Project for Air Pollution Control in Ulaanbaatar City Phase 2 Mongolia Technical Manual 08 Manual for Conducting and Updating of Dispersion Simulation
SUURI-KEIKAKU CO., LTD. - 56 -
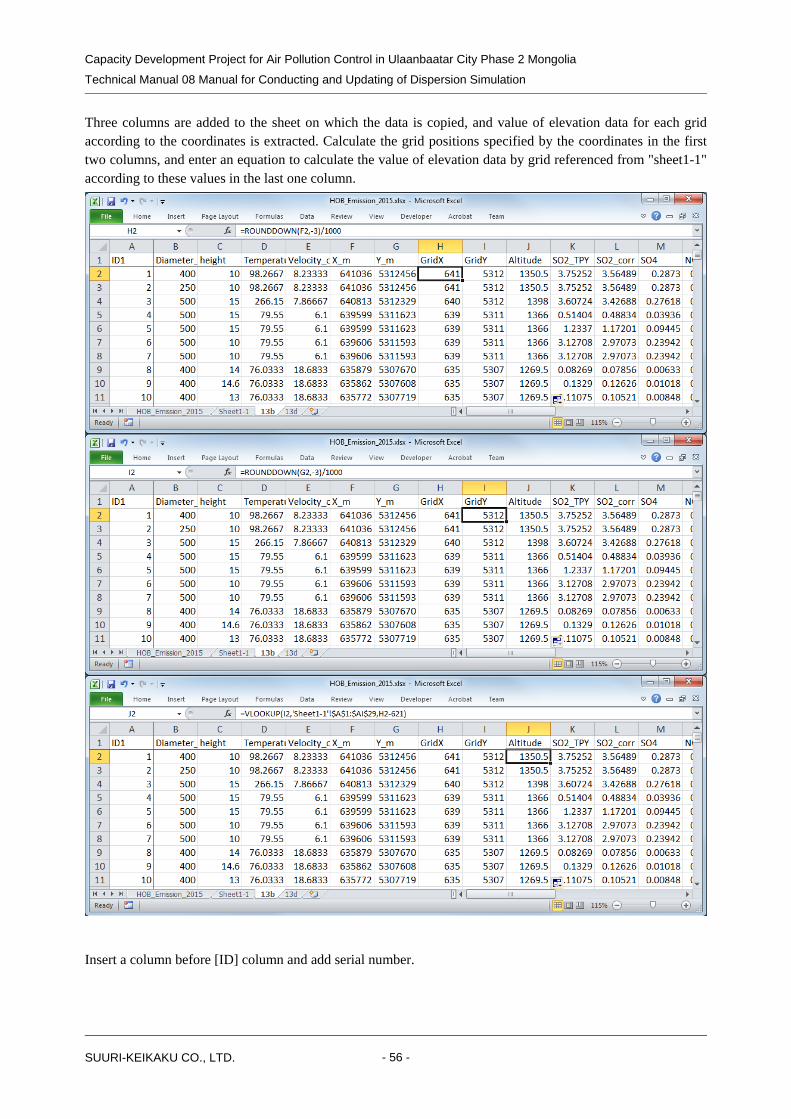
Three columns are added to the sheet on which the data is copied, and value of elevation data for each grid according to the coordinates is extracted. Calculate the grid positions specified by the coordinates in the first two columns, and enter an equation to calculate the value of elevation data by grid referenced from "sheet1-1" according to these values in the last one column.
Insert a column before [ID] column and add serial number.

Capacity Development Project for Air Pollution Control in Ulaanbaatar City Phase 2 Mongolia Technical Manual 08 Manual for Conducting and Updating of Dispersion Simulation
SUURI-KEIKAKU CO., LTD. - 57 -
Create string of information on point source to be inserted in CALPUFF input file. Input the formulas to each column as follows. The contents of “<>” are column names, and when entering these formulas, specify the corresponding cell.
=CONCATENATE(<UID>,"! SRCNAM = stac",TEXT(<ID1>,"0000")," !")
=CONCATENATE(<UID>,"! X = ",<X_m>/1000,",",<Y_m>/1000,",",< height>,",",<Altitude>,",", TEXT(<Diameter_mm>/1000,"0.###"),",",TEXT(<Velocity_of_flue_gas>,"0.###"),",",TEXT(<Temperature_of_flue_gas>+273.15,"0.###"),",0,",TEXT(<SO2_corr>/(365*24*3600)*10^6,"0.00000E+00"),",",TEXT(<SO4>/(365*24*3600)*10^6,"0.00000E+00"),",",TEXT(<NOx_TPY>/(365*24*3600)*10^6,"0.00000E+00"),",",TEXT(<Dust_TPY>/(365*24*3600)*10^6,"0.00000E+00"),",0,",TEXT(<PM10_TPY>/(365*24*3600)*10^6,"0.00000E+00"),",",TEXT(<NO3>/(365*24*3600)*10^6,"0.00000E+00"),",",TEXT(<CO_TPY>/(365*24*3600)*10^6,"0.00000E+00")," !")
=CONCATENATE(<UID>,"! SIGYZI = 10007,208 !")
=CONCATENATE(<UID>,"! ZPLTFM = 0 !")
=CONCATENATE(<UID>,"! FMFAC = 1.0 !")
!END!
7 Set 1000 in power plant and 800 in HOB. 8 Set 20 in PP2 and PP3 (75 t/h), 30 in PP3 (220t/h), 100 in PP4 and Amgalan Heat Supply Station, and 70 in HOB.

Capacity Development Project for Air Pollution Control in Ulaanbaatar City Phase 2 Mongolia Technical Manual 08 Manual for Conducting and Updating of Dispersion Simulation
SUURI-KEIKAKU CO., LTD. - 58 -
Copy the created strings and paste them the relevant part of CALPUFF input file.
Since boundary between cells is pasted as tab, replace tab with new line.
Create of “13d”

Capacity Development Project for Air Pollution Control in Ulaanbaatar City Phase 2 Mongolia Technical Manual 08 Manual for Conducting and Updating of Dispersion Simulation
SUURI-KEIKAKU CO., LTD. - 59 -
Source ID and monthly operating pattern is the only necessary column, so delete other lines.
Insert a column before [ID] column and add serial number.
Create strings by pollutant setting operating pattern.
=CONCATENATE(<UID>,"! SRCNAM = stac",TEXT(<ID1>,"0000")," !")
=CONCATENATE(<UID>,"! IVARY = 2 !")
=CONCATENATE(<UID>,"! <Pollutant> = ",TEXT(<JAN>,"0.0000"),", ",TEXT(<FEB>,"0.0000"),",",TEXT(<MAR>,"0.0000"),",",TEXT(<APR>,"0.0000"),",",TEXT(<MAY>,"0.0000"),",",TEXT(<JUN>,"0.0000"),",",TEXT(<JUL>,"0.0000"),",",TEXT(<AUG>,"0.0000"),",",TEXT(<SEP>,"0.0000"),",",TEXT(<OCT>,"0.0000"),",",TEXT(<NOV>,"0.0000"),",",TEXT(<DEC>,"0.0000")," !")
!END!
Since operating pattern needs to be created by pollutant, definition of “Unique ID” differs.

Capacity Development Project for Air Pollution Control in Ulaanbaatar City Phase 2 Mongolia Technical Manual 08 Manual for Conducting and Updating of Dispersion Simulation
SUURI-KEIKAKU CO., LTD. - 60 -
Pollutant Unique ID SO2 (<UID>-1)*7+1 SO4 (<UID>-1)*7+2 NOX (<UID>-1)*7+3 NO3 (<UID>-1)*7+4 TSP (<UID>-1)*7+5 PM10 (<UID>-1)*7+6 CO (<UID>-1)*7+7

Capacity Development Project for Air Pollution Control in Ulaanbaatar City Phase 2 Mongolia Technical Manual 08 Manual for Conducting and Updating of Dispersion Simulation
SUURI-KEIKAKU CO., LTD. - 61 -
Copy the created strings and paste them the relevant part of CALPUFF input file.
Since boundary between cells is pasted as tab, replace tab with new line.

Capacity Development Project for Air Pollution Control in Ulaanbaatar City Phase 2 Mongolia Technical Manual 08 Manual for Conducting and Updating of Dispersion Simulation
SUURI-KEIKAKU CO., LTD. - 62 -
5.2 Area Source Open the Excel file in export destination folder and the file of elevation data by grid (UB_altitude.xlsx).
Copy ”sheet1-1” of “UB_altitude.xlsx” to the Excel file in export destination folder
Add columns to calculate the emissions of SO2, SO4 and NO3.

Capacity Development Project for Air Pollution Control in Ulaanbaatar City Phase 2 Mongolia Technical Manual 08 Manual for Conducting and Updating of Dispersion Simulation
SUURI-KEIKAKU CO., LTD. - 63 -
Input formulas to calculate the emission of SO4 and NO3.
SO4 Emission =SO2 Emission x conversion ratio from SO2 to SO4 x 96/64
SO2 Emission = SO2 Emission x (1- conversion ratio from SO2 to SO4)
NO3 Emission =PM10 Emission x NO3 contribution ratio by composition analysis of PM10

Capacity Development Project for Air Pollution Control in Ulaanbaatar City Phase 2 Mongolia Technical Manual 08 Manual for Conducting and Updating of Dispersion Simulation
SUURI-KEIKAKU CO., LTD. - 64 -
Click [Filter] in “Data” tab and add filter function to the first row.
Select ”▼” at [MinX] and [MinY] and filter in calculation range in east-west and south-north directions.
Select ”▼” at [SO2_TPY] and filter to grid that SO2 emission is not zero.

Capacity Development Project for Air Pollution Control in Ulaanbaatar City Phase 2 Mongolia Technical Manual 08 Manual for Conducting and Updating of Dispersion Simulation
SUURI-KEIKAKU CO., LTD. - 65 -
Only rows extracted by the above filter function are displayed
Copy the grids generated by filter function and paste them on another sheet, and set the name of each sheet to "14b", “14c”, and "14d".

Capacity Development Project for Air Pollution Control in Ulaanbaatar City Phase 2 Mongolia Technical Manual 08 Manual for Conducting and Updating of Dispersion Simulation
SUURI-KEIKAKU CO., LTD. - 66 -
Using the "14b" sheet, create the string information on area sources (14b) among CALPUFF input data. First, add two columns and create the source name.
Three columns are added to the sheet on which the data is copied, and value of elevation data for each grid according to the coordinates is extracted. Calculate the grid positions specified by the coordinates in the first two columns, and enter an equation to calculate the value of elevation data by grid referenced from "sheet1-1" according to these values in the last one column.

Capacity Development Project for Air Pollution Control in Ulaanbaatar City Phase 2 Mongolia Technical Manual 08 Manual for Conducting and Updating of Dispersion Simulation
SUURI-KEIKAKU CO., LTD. - 67 -
Create string of information on point source to be inserted in CALPUFF input file. Input the formulas to each column as follows. The contents of “<>” are column names, and when entering these formulas, specify the corresponding cell.
=CONCATENATE(D2," ! SRCNAM = ",E2," !")
=CONCATENATE(D2," ! X = 5,",J2,",50,",TEXT(L2/(365*24*3600),"0.00000E+00"),",", TEXT(M2/(365*24*3600),"0.00000E+00"),",",TEXT(N2/(365*24*3600),"0.00000E+00"),",",TEXT(Q2/(365*24*3600),"0.00000E+00"),",0,",TEXT(O2/(365*24*3600),"0.00000E+00"),",",TEXT(P2/(365*24*3600),"0.00000E+00"),",",TEXT(R2/(365*24*3600),"0.00000E+00")," ! !END!")

Capacity Development Project for Air Pollution Control in Ulaanbaatar City Phase 2 Mongolia Technical Manual 08 Manual for Conducting and Updating of Dispersion Simulation
SUURI-KEIKAKU CO., LTD. - 68 -
Copy the created strings and paste them the relevant part of CALPUFF input file.
Since boundary between cells is pasted as tab, replace tab with new line.
Create of “14c”.
Delete the columns other than the information on grid.

Capacity Development Project for Air Pollution Control in Ulaanbaatar City Phase 2 Mongolia Technical Manual 08 Manual for Conducting and Updating of Dispersion Simulation
SUURI-KEIKAKU CO., LTD. - 69 -
Add two columns and create the source name.
Insert eight columns before [MinX] column and input column name and formula respectively. Column name and formula is as follows.
Column name
LTX RTX RBX LBX LTY RTY RBY LBY
Contents X of upper left
X of upper right
X of bottom right
X of bottom left
Y of upper left
Y of upper right
Y of bottom right
Y of bottom left
Formula MinX/1000 LTX+1 RTX LTX MinY/1000+1 LTY MinX/1000 RBY

Capacity Development Project for Air Pollution Control in Ulaanbaatar City Phase 2 Mongolia Technical Manual 08 Manual for Conducting and Updating of Dispersion Simulation
SUURI-KEIKAKU CO., LTD. - 70 -
Create string of information on point source to be inserted in CALPUFF input file. Input the formulas to each column as follows. The contents of “<>” are column names, and when entering these formulas, specify the corresponding cell.
=CONCATENATE(<UID>,"! SRCNAM = ",<SourceName>," ! ")
=CONCATENATE(<UID>,"! XVERT = ",<LTX>,",",<RTX>,",",<RBX>,",",<LBX>," ! ")
=CONCATENATE(<UID>,"! YVERT = ",<LTY>,",",<RTY>,",",<RBY>,",",<LBY>," !")
!END!

Capacity Development Project for Air Pollution Control in Ulaanbaatar City Phase 2 Mongolia Technical Manual 08 Manual for Conducting and Updating of Dispersion Simulation
SUURI-KEIKAKU CO., LTD. - 71 -
Copy the created strings and paste them the relevant part of CALPUFF input file.
Since boundary between cells is pasted as tab, replace tab with new line.

Capacity Development Project for Air Pollution Control in Ulaanbaatar City Phase 2 Mongolia Technical Manual 08 Manual for Conducting and Updating of Dispersion Simulation
SUURI-KEIKAKU CO., LTD. - 72 -
Create of “14d”
Grid number, column number, and row number is the only necessary column, so delete other lines.
Add two columns at the end and create the source name.
Create strings by pollutant setting operating pattern.
=CONCATENATE(<Unique ID>," ! SRCNAM = ",<SourceName>," !")
=CONCATENATE(<Unique ID>," ! IVARY = 3 !")
=CONCATENATE(<Unique ID>," ! <Pollutant> = <Winter1>, <Winter2>, <Winter3>, <Winter4>, <Winter5>, <Winter6>, <Winter7>, <Winter8>, <Winter9>, <Winter10>, <Winter11>, <Winter12>,")

Capacity Development Project for Air Pollution Control in Ulaanbaatar City Phase 2 Mongolia Technical Manual 08 Manual for Conducting and Updating of Dispersion Simulation
SUURI-KEIKAKU CO., LTD. - 73 -
<Winter13>, <Winter14>, <Winter15>, <Winter16>, <Winter17>, <Winter18>, <Winter19>, <Winter20>, <Winter21>, <Winter22>, <Winter23>, <Winter24>,
<Spring1>, <Spring2>, <Spring3>, <Spring4>, <Spring5>, <Spring6>, <Spring7>, <Spring8>, <Spring9>, <Spring10>, <Spring11>, <Spring12>,
<Spring13>, <Spring14>, <Spring15>, <Spring16>, <Spring17>, <Spring18>, <Spring19>, <Spring20>, <Spring21>, <Spring22>, <Spring23>, <Spring24>,
<Summer1>, <Summer2>, <Summer3>, <Summer4>, <Summer5>, <Summer6>, <Summer7>, <Summer8>, <Summer9>, <Summer10>, <Summer11>, <Summer12>,
<Summer13>, <Summer14>, <Summer15>, <Summer16>, <Summer17>, <Summer18>, <Summer19>, <Summer20>, <Summer21>, <Summer22>, <Summer23>, <Summer24>,
<Autumn1>, <Autumn2>, <Autumn3>, <Autumn4>, <Autumn5>, <Autumn6>, <Autumn7>, <Autumn8>, <Autumn9>, <Autumn10>, <Autumn11>, <Autumn12>,
<Autumn13>, <Autumn14>, <Autumn15>, <Autumn16>, <Autumn17>, <Autumn18>, <Autumn19>, <Autumn20>, <Autumn21>, <Autumn22>, <Autumn23>, <Autumn24> !
!END!
Since operating pattern needs to be created by pollutant, definition of “Unique ID” differs.
Pollutant Unique ID SO2 (<UID>-1)*7+1 SO4 (<UID>-1)*7+2 NOX (<UID>-1)*7+3 NO3 (<UID>-1)*7+4 TSP (<UID>-1)*7+5 PM10 (<UID>-1)*7+6 CO (<UID>-1)*7+7

Capacity Development Project for Air Pollution Control in Ulaanbaatar City Phase 2 Mongolia Technical Manual 08 Manual for Conducting and Updating of Dispersion Simulation
SUURI-KEIKAKU CO., LTD. - 74 -
Copy the created strings and paste them the relevant part of CALPUFF input file.

Capacity Development Project for Air Pollution Control in Ulaanbaatar City Phase 2 Mongolia Technical Manual 08 Manual for Conducting and Updating of Dispersion Simulation
SUURI-KEIKAKU CO., LTD. - 75 -
Since boundary between cells is pasted as tab, replace tab with new line.
5.3 Line Source Open the Excel file in export destination folder and the file of elevation data by grid (UB_altitude.xlsx).
Copy ”sheet1-1” of “UB_altitude.xlsx” to the Excel file in export destination folder

Capacity Development Project for Air Pollution Control in Ulaanbaatar City Phase 2 Mongolia Technical Manual 08 Manual for Conducting and Updating of Dispersion Simulation
SUURI-KEIKAKU CO., LTD. - 76 -
Add columns to calculate the emissions of SO2, SO4 and NO3.
Input formulas to calculate the emission of SO4 and NO3.
SO4 Emission =SO2 Emission x conversion ratio from SO2 to SO4 x 96/64
SO2 Emission = SO2 Emission x (1- conversion ratio from SO2 to SO4)

Capacity Development Project for Air Pollution Control in Ulaanbaatar City Phase 2 Mongolia Technical Manual 08 Manual for Conducting and Updating of Dispersion Simulation
SUURI-KEIKAKU CO., LTD. - 77 -
Click [Filter] in “Data” tab and add filter function to the first row.
Select ”▼” at [StartX], [StartY], [EndX], [EndY], [MidX], and [MidY] and filter in calculation range in east-west and south-north directions.

Capacity Development Project for Air Pollution Control in Ulaanbaatar City Phase 2 Mongolia Technical Manual 08 Manual for Conducting and Updating of Dispersion Simulation
SUURI-KEIKAKU CO., LTD. - 78 -
Select ”▼” at [SO2_TPY] and filter to line source that SO2 emission is not zero.
Only rows extracted by the above filter function are displayed

Capacity Development Project for Air Pollution Control in Ulaanbaatar City Phase 2 Mongolia Technical Manual 08 Manual for Conducting and Updating of Dispersion Simulation
SUURI-KEIKAKU CO., LTD. - 79 -
Copy the line sources generated by filter function and paste them on another sheet, and set the name of each sheet to "15b" and "15c".
Using the "15b" sheet, create the string information on line sources (15b) among CALPUFF input data. Insert a column before [ID] column and add serial number (UID).
Three columns are added to the sheet on which the data is copied, and value of elevation data for each grid according to the starting point coordinates is extracted. Calculate the grid positions specified by the coordinates in the first two columns, and enter an equation to calculate the value of elevation data by grid referenced from "sheet1-1" according to these values in the last one column.

Capacity Development Project for Air Pollution Control in Ulaanbaatar City Phase 2 Mongolia Technical Manual 08 Manual for Conducting and Updating of Dispersion Simulation
SUURI-KEIKAKU CO., LTD. - 80 -
Like the starting point, refer to the elevation at the end point and the midpoint.
Create string of information on point source to be inserted in CALPUFF input file. Input the formulas to each column as follows. The contents of “<>” are column names, and when entering these formulas, specify the corresponding cell.
=CONCATENATE(<UID>,"! SRCNAM = ",<UID>,"-Ln",<LinkID>," !")

Capacity Development Project for Air Pollution Control in Ulaanbaatar City Phase 2 Mongolia Technical Manual 08 Manual for Conducting and Updating of Dispersion Simulation
SUURI-KEIKAKU CO., LTD. - 81 -
=CONCATENATE(<UID>,"! X = ",<StartX>/1000,",",<StartY>/1000,",",<EndX>/1000,",",<EndY>/1000,", 0.5,",MIN(<AltitudeS>,<AltitudeE>,<AltitudeM>),",",TEXT(<SO2_corr>/(3600*24*365)*10^6,"0.00000E+00"),",",TEXT(<SO4>/(3600*24*365)*10^6,"0.00000E+00"),",",TEXT(<NOx_tpy>/(3600*24*365)*10^6,"0.00000E+00"),",0,0,",TEXT(<PM_tpy>/(3600*24*365)*10^6,"0.00000E+00"),",",TEXT(<PM10_tpy>/(3600*24*365)*10^6,"0.00000E+00"),",",TEXT(<CO_tpy>/(3600*24*365)*10^6,"0.00000E+00")," ! !END!")
Copy the created strings and paste them the relevant part of CALPUFF input file.
Since boundary between cells is pasted as tab, replace tab with new line.

Capacity Development Project for Air Pollution Control in Ulaanbaatar City Phase 2 Mongolia Technical Manual 08 Manual for Conducting and Updating of Dispersion Simulation
SUURI-KEIKAKU CO., LTD. - 82 -
Create of “13d”
[LinkID] and road distance is the only necessary column, so delete other lines.
Insert a column before [ID] column and add serial number.
Create strings by pollutant setting operating pattern.
=CONCATENATE(<Unique ID>,"! SRCNAM = ",<UID>,"-Ln",<LinkID>," !")
=CONCATENATE(<Unique ID>,"! IVARY = 3 !")
=CONCATENATE(<Unique ID>," ! <Pollutant> = <Winter1>, <Winter2>, <Winter3>, <Winter4>, <Winter5>, <Winter6>, <Winter7>, <Winter8>, <Winter9>, <Winter10>, <Winter11>, <Winter12>,")

Capacity Development Project for Air Pollution Control in Ulaanbaatar City Phase 2 Mongolia Technical Manual 08 Manual for Conducting and Updating of Dispersion Simulation
SUURI-KEIKAKU CO., LTD. - 83 -
<Winter13>, <Winter14>, <Winter15>, <Winter16>, <Winter17>, <Winter18>, <Winter19>, <Winter20>, <Winter21>, <Winter22>, <Winter23>, <Winter24>,
<Spring1>, <Spring2>, <Spring3>, <Spring4>, <Spring5>, <Spring6>, <Spring7>, <Spring8>, <Spring9>, <Spring10>, <Spring11>, <Spring12>,
<Spring13>, <Spring14>, <Spring15>, <Spring16>, <Spring17>, <Spring18>, <Spring19>, <Spring20>, <Spring21>, <Spring22>, <Spring23>, <Spring24>,
<Summer1>, <Summer2>, <Summer3>, <Summer4>, <Summer5>, <Summer6>, <Summer7>, <Summer8>, <Summer9>, <Summer10>, <Summer11>, <Summer12>,
<Summer13>, <Summer14>, <Summer15>, <Summer16>, <Summer17>, <Summer18>, <Summer19>, <Summer20>, <Summer21>, <Summer22>, <Summer23>, <Summer24>,
<Autumn1>, <Autumn2>, <Autumn3>, <Autumn4>, <Autumn5>, <Autumn6>, <Autumn7>, <Autumn8>, <Autumn9>, <Autumn10>, <Autumn11>, <Autumn12>,
<Autumn13>, <Autumn14>, <Autumn15>, <Autumn16>, <Autumn17>, <Autumn18>, <Autumn19>, <Autumn20>, <Autumn21>, <Autumn22>, <Autumn23>, <Autumn24> !
!END!
Since operating pattern needs to be created by pollutant, definition of “Unique ID” differs.
Pollutant Unique ID SO2 (<UID>-1)*6+1 SO4 (<UID>-1)*6+2 NOX (<UID>-1)*6+3 TSP (<UID>-1)*6+4 PM10 (<UID>-1)*6+5 CO (<UID>-1)*6+6

Capacity Development Project for Air Pollution Control in Ulaanbaatar City Phase 2 Mongolia Technical Manual 08 Manual for Conducting and Updating of Dispersion Simulation
SUURI-KEIKAKU CO., LTD. - 84 -
Copy the created strings and paste them the relevant part of CALPUFF input file.
Since boundary between cells is pasted as tab, replace tab with new line.

Capacity Development Project for Air Pollution Control in Ulaanbaatar City Phase 2 Mongolia Technical Manual 08 Manual for Conducting and Updating of Dispersion Simulation
SUURI-KEIKAKU CO., LTD. - 85 -

Capacity Development Project for Air Pollution Control in Ulaanbaatar City Phase 2 Mongolia Technical Manual 08 Manual for Conducting and Updating of Dispersion Simulation
SUURI-KEIKAKU CO., LTD. - 86 -
6 Conducting Dispersion Simulation and Organizing the Calculation Result
6.1 Conducting Dispersion Simulation 6.1.1 Outline
Conduct the dispersion simulation of CALPUFF using the emission data created in 3.2 and the meteorological model created with CALMET.
Set input file, output file, calculation term, calculated target substance, projection, datum, calculation range, and calculation resolution in CALPUFF. These settings have to be the same setting as those by the other processor. In this manual, set the parameter to consider the chemical reaction model in CALPUFF INP file.In addition, INP file can be set to narrow down the analysis target range inside the calculation range, and subdivide the grid in the analysis target range. For source data, paste the content of file converting data to the relevant part of CALPUFF INP file and correct the parameters such as the number of sources.
Dispersion simulation for each source is conducted in order to confirm the contribution by source.
6.1.2 Conducting Method
Open INP file in “CALPUFF” folder.
Set data file of meteorological model (METDAT), output file name (PUFLST, CONDAT).

Capacity Development Project for Air Pollution Control in Ulaanbaatar City Phase 2 Mongolia Technical Manual 08 Manual for Conducting and Updating of Dispersion Simulation
SUURI-KEIKAKU CO., LTD. - 87 -
Set target calculation term (METRUN). When setting “0”, you have to set the calculation starting date and time (IBYR, IBMO, IBDY, and IBHR). When setting “1”, the term included in meteorological model is target calculation term.
In addition, set time zone (XBTZ), the length of run (IRLG), the number of chemical species (NSPEC), and chemical species to be emitted (NSE).

Capacity Development Project for Air Pollution Control in Ulaanbaatar City Phase 2 Mongolia Technical Manual 08 Manual for Conducting and Updating of Dispersion Simulation
SUURI-KEIKAKU CO., LTD. - 88 -
Set chemical mechanism flag (MCHEM). Set “1” to consider pseudo-first-order chemical reaction model using “MESOPUFF II” scheme in this manual.
Set the information on pollutant. Set the substances name for the number of calculated substances set by NSPEC.

Capacity Development Project for Air Pollution Control in Ulaanbaatar City Phase 2 Mongolia Technical Manual 08 Manual for Conducting and Updating of Dispersion Simulation
SUURI-KEIKAKU CO., LTD. - 89 -
For each contaminant, set whether these substances are target of calculation output or not (MODELED) and whether they are target of emission or not (EMITTED).
Set the projection of output data (PMAP etc.). These setting have to be the same as CALMET etc.
Set the datum of output data (DATUM). These setting have to be the same as CALMET etc.

Capacity Development Project for Air Pollution Control in Ulaanbaatar City Phase 2 Mongolia Technical Manual 08 Manual for Conducting and Updating of Dispersion Simulation
SUURI-KEIKAKU CO., LTD. - 90 -
Set the number of grid of meteorological model data (NX, NY, and NZ), horizontal grid spacing (DGRIDKM), the number of vertical grid and the height to divide the grid (ZFACE), and the bottom-left coordinate of grid. These setting have to be the same as CALMET etc.
Set the range of calculation grid (IBCOMP, JBCOMP, IECOMP, and JECOMP). Set the range specified above with grid number.

Capacity Development Project for Air Pollution Control in Ulaanbaatar City Phase 2 Mongolia Technical Manual 08 Manual for Conducting and Updating of Dispersion Simulation
SUURI-KEIKAKU CO., LTD. - 91 -
When outputting calculation results as grid data, set “LSAMP” to "T" and set the range of output grid (IBSAMP, JBSAMP, IESAMP, and JESAMP). Set the grid number within the range specified above. Set the nesting factor of the sampling grid for specifying the grid interval within the set range (MESHDN).
Example: When “DGRIDKM” is set to 5km and you want to set the grid interval for outputting the calculation result to 1km, “MESHDN” where “DGRIDKM”/”MESHDN” becomes 1, that is, may be set to 5.
Set the substance to be output to the LIST file among the calculated pollutants.

Capacity Development Project for Air Pollution Control in Ulaanbaatar City Phase 2 Mongolia Technical Manual 08 Manual for Conducting and Updating of Dispersion Simulation
SUURI-KEIKAKU CO., LTD. - 92 -
Setting the emission data of point source
Set the number of sources (NPT1), the unit of emission (IPTU9), and the number of emission patterns (NSPT1) at “13a”. “NSPT1” is the value by multiplying “NPT1” by “NSE” (number of pollutants).
Set source name (SRCNAM), X coordinate, Y coordinate, stack height, elevation, stack diameter, flow gas velocity, flow gas temperature and emission (X) for each source at “13b”. Adjust the horizontal and vertical dispersion width (SIGYZI) as necessary.
9 Note that “tons/yr” (4) is ton in the American Survey Act and “metric tons/yr” (7) is ton in the metric method, so these are strictly different each other. In the case of Mongolia “7” seems appropriate to be used.

Capacity Development Project for Air Pollution Control in Ulaanbaatar City Phase 2 Mongolia Technical Manual 08 Manual for Conducting and Updating of Dispersion Simulation
SUURI-KEIKAKU CO., LTD. - 93 -
Set source name (SRCNAM), emission pattern type (IVARY) and emission pattern by substance for each source at “13d”. For “IVARY”, you can set "1" (for each time), "2" (for each month), "3" (for each season and time), etc. If not set “IVARY”, emission pattern is regarded as constant.
Setting the emission data of area source
Set the number of sources (NAR1), the unit of emission (IARU), and the number of emission patterns (NSAR1) at “14a”. “NSAR1” is the value by multiplying “NAR1” by “NSE” (number of pollutants).

Capacity Development Project for Air Pollution Control in Ulaanbaatar City Phase 2 Mongolia Technical Manual 08 Manual for Conducting and Updating of Dispersion Simulation
SUURI-KEIKAKU CO., LTD. - 94 -
Set source name (SRCNAM), effective emission height, elevation, vertical dispersion width, and emission (X) for each source at “14b”.
Set source name (SRCNAM), X coordinate (XVERT) and Y coordinate (YVERT) of four points for each source at “14c”. Set in order of upper left, upper right, bottom right, and bottom left, respectively.

Capacity Development Project for Air Pollution Control in Ulaanbaatar City Phase 2 Mongolia Technical Manual 08 Manual for Conducting and Updating of Dispersion Simulation
SUURI-KEIKAKU CO., LTD. - 95 -
Set source name (SRCNAM), emission pattern type (IVARY) and emission pattern by substance for each source at “14d”. For “IVARY”, you can set "1" (for each time), "2" (for each month), "3" (for each season and time), etc. If not set “IVARY”, emission pattern is regarded as constant.
Setting the emission data of line source
Set the number of sources (NLINES), the unit of emission (ILNU), and the number of emission patterns (NSLN1) at “15a”. “NSLN1” is the value by multiplying “NLINES” by “NSE” (number of pollutants).

Capacity Development Project for Air Pollution Control in Ulaanbaatar City Phase 2 Mongolia Technical Manual 08 Manual for Conducting and Updating of Dispersion Simulation
SUURI-KEIKAKU CO., LTD. - 96 -
Set average building length (XL), average building height (HBL), average building width (WBL), average line source width (WML), average separation between buildings (DXL), and average buoyancy parameter (FPRIMEL).
Set source name (SRCNAM), X and Y coordinate of starting and ending point, emission height, elevation, and emission (X) for each source at “15b”.

Capacity Development Project for Air Pollution Control in Ulaanbaatar City Phase 2 Mongolia Technical Manual 08 Manual for Conducting and Updating of Dispersion Simulation
SUURI-KEIKAKU CO., LTD. - 97 -
Set source name (SRCNAM), emission pattern type (IVARY) and emission pattern by substance for each source at “15c”. For “IVARY”, you can set "1" (for each time), "2" (for each month), "3" (for each season and time), etc. If not set “IVARY”, emission pattern is regarded as constant.
Set number of calculation point other than grid (NREC), and X coordinate, Y coordinate, elevation, and height above ground (X) for calculation point as necessary. Example of calculation point is ambient monitoring station.

Capacity Development Project for Air Pollution Control in Ulaanbaatar City Phase 2 Mongolia Technical Manual 08 Manual for Conducting and Updating of Dispersion Simulation
SUURI-KEIKAKU CO., LTD. - 98 -
Move the “CALPUFF” folder in command prompt, input “calpuff.exe <input file name>.INP”, and press [Enter] (Here it is “CPUF_PP_CM2_2015.INP”). After starting the calculation, you can check this running progress.
When showing “TERMINATION PHASE” message and completing calculation, you check to make output files. Output file is ” CPUF_PP_CM2_2015_CON” in this case.

Capacity Development Project for Air Pollution Control in Ulaanbaatar City Phase 2 Mongolia Technical Manual 08 Manual for Conducting and Updating of Dispersion Simulation
SUURI-KEIKAKU CO., LTD. - 99 -
6.2 Output of Calculation Result 6.2.1 Outline
Since the calculation result of CALPUFF is compressed data, it cannot be opened with a text editor such as Notepad. Therefore, extract the calculated concentration for each grid or each specified point from the compressed data using the CALPOST processor.
In CALPOST, set the input file, output file, calculation term, output target substance, output range, calculation result the period (1 hour average, daily average, annual average, etc.).
CALPUFF calculation is conducted with NOx, but the substance of environmental standard is NO2. Therefore, set the equation to convert NOx to NO2. The conversion formula in CALPOST is [NO2] = a[NOx] and value of “a” is specified as 0.75 according to the standard for environmental impact assessment in China10, but it is necessary to consider to set this value matching to the current situation of Mongolia.
6.2.2 Conducting Method
Open INP file in “CALPOST” folder.
Set the result file calculated by CALPUFF as input file (MODDAT).
10 Guidelines for environmental impact assessment Atmospheric environment (in Chinese) (HJ2.2-2008)

Capacity Development Project for Air Pollution Control in Ulaanbaatar City Phase 2 Mongolia Technical Manual 08 Manual for Conducting and Updating of Dispersion Simulation
SUURI-KEIKAKU CO., LTD. - 100 -
Set output file name (PSTLST), and the destination folder of output result file (PLPATH).
Set the part of output file (TUNAM).
Set target calculation term (METRUN). When setting “0”, you have to set the calculation starting date and time (ISYR, ISMO, ISDY, ISHR, ISMIN, and ISSEC) and calculation ending date and time (IEYR, IEMO, IEDY, IEHR, IEMIN, and IESEC). When setting “1”, the calculated term by CALPUFF is target calculation term. In addition, set time zone (BTZONE).

Capacity Development Project for Air Pollution Control in Ulaanbaatar City Phase 2 Mongolia Technical Manual 08 Manual for Conducting and Updating of Dispersion Simulation
SUURI-KEIKAKU CO., LTD. - 101 -
Set outputted target species (ASPEC). When setting “NO2” as outputted target species, set the ratio for converting from NOx to NO2 (RNO2NOX). The value in “Guidelines for environmental impact assessment Atmospheric environment” in China is “RNO2NOX” = 0.75.

Capacity Development Project for Air Pollution Control in Ulaanbaatar City Phase 2 Mongolia Technical Manual 08 Manual for Conducting and Updating of Dispersion Simulation
SUURI-KEIKAKU CO., LTD. - 102 -
Set the target calculation result for output. When outputting the calculation result of each grid, set “LG=T” and set the target output range of calculation result with grid number (IBGRID, JBGRID, IEGRID, and JEGRID). On the other hand, when outputting the calculation result of each point specified in CALPUFF, set “LD=T”
Set the unit of output concentration (IPRTU).

Capacity Development Project for Air Pollution Control in Ulaanbaatar City Phase 2 Mongolia Technical Manual 08 Manual for Conducting and Updating of Dispersion Simulation
SUURI-KEIKAKU CO., LTD. - 103 -
Set the flag to calculate one hour averages (L1HR), three hours averages (L3HR), 24 hours averages (L24HR), and run-length averages (LRUNL). Set the selecting averaged term to “T” and set the others to “F”.
Set to output the concentration from top to Nth place among the concentration for each point.

Capacity Development Project for Air Pollution Control in Ulaanbaatar City Phase 2 Mongolia Technical Manual 08 Manual for Conducting and Updating of Dispersion Simulation
SUURI-KEIKAKU CO., LTD. - 104 -
Set the format of output. Set either list format (LPLT) or grid format (LGRD) to "T".
Move the “CALPOST” folder in command prompt, input “calpost.exe <input file name>.INP”, and press [Enter] (Here it is “Calpost_PP_CM2_2015.INP”).

Capacity Development Project for Air Pollution Control in Ulaanbaatar City Phase 2 Mongolia Technical Manual 08 Manual for Conducting and Updating of Dispersion Simulation
SUURI-KEIKAKU CO., LTD. - 105 -
When showing “Stop – Program terminated” message and completing calculation, you check to make output files. Output file is ”rank(0)_pm10_2880hr_conc_ppc2_2.dat” in this case.
When opening the output file, the following figure is displayed. X coordinate, Y coordinate, and concentration by calculation point is outputted.
6.3 Organizing Calculation Result 6.3.1 Outline
The results calculated for each source type output in 6.2 are summarized in the table below and the total concentration for each grid is calculated. For this tabulation, Excel or Access is used. The result of this

Capacity Development Project for Air Pollution Control in Ulaanbaatar City Phase 2 Mongolia Technical Manual 08 Manual for Conducting and Updating of Dispersion Simulation
SUURI-KEIKAKU CO., LTD. - 106 -
tabulation is used to confirm the accuracy of the model, to create a concentration distribution chart, etc. and to evaluate the emission reduction plan.
6.3.2 Conducting Method
Open the calculation result file of concentration by grid outputted by CALPOST and copy the relevant range.
Open excel file and paste the copied data.
Select the pasted column and click [Data]-[Text to Columns].

Capacity Development Project for Air Pollution Control in Ulaanbaatar City Phase 2 Mongolia Technical Manual 08 Manual for Conducting and Updating of Dispersion Simulation
SUURI-KEIKAKU CO., LTD. - 107 -
Select [Fixed width – Fields are aligned in columns with spaces between each field] in [Original data type] and click [Next].
Check whether the black arrow line crosses the numerical value in the preview of the data. If it crosses, move and adjust the arrow with dragging. When adjustment is completed, click [Next].
Click [Finish]

Capacity Development Project for Air Pollution Control in Ulaanbaatar City Phase 2 Mongolia Technical Manual 08 Manual for Conducting and Updating of Dispersion Simulation
SUURI-KEIKAKU CO., LTD. - 108 -
Data is divided into each column according to delimiter position.
Insert one row at the first row and input column name to each column

Capacity Development Project for Air Pollution Control in Ulaanbaatar City Phase 2 Mongolia Technical Manual 08 Manual for Conducting and Updating of Dispersion Simulation
SUURI-KEIKAKU CO., LTD. - 109 -
For other sources as well, paste the calculation results to Excel file and calculate the total emissions by grid in the rightmost column.
Insert three columns at the first column and name each column as “IXIY”, “Column”, and “Row” in order from the left.

Capacity Development Project for Air Pollution Control in Ulaanbaatar City Phase 2 Mongolia Technical Manual 08 Manual for Conducting and Updating of Dispersion Simulation
SUURI-KEIKAKU CO., LTD. - 110 -
Calculate the following for each added column.
IXIY = Column x 1000 + Row
Column = X Coordinate – X Reference coorinate of bottom left + 0.5
Row = Y Coordinate - Y Reference coorinate of bottom left + 0.5
Draw cross-section diagram of concentration by source using this table, and draw concentration distribution map by importing the table into Access.
6.4 Comparing between Calculated Value and Measured Value and Considering the Improvement Accuracy of Dispersion Simulation Model
To evaluate the accuracy of dispersion simulation model, draw correlation diagram between the calculation value by dispersion simulation and the measurement value in ambient monitoring stations. However, if the number of monitoring station whose measured value is more than the number of effective measurement time is less than three stations, this value by this method become reference value and cannot use to evaluate. Draw scatter diagram with the horizontal axis as calculated value and the vertical axis as measured value and draw the approximation straight line with intercept zero. If there is the data of the ambient monitoring station that assumes not to be affected by source, the concentration at that station is taken as the value of intercept. This value is called the background concentration.

Capacity Development Project for Air Pollution Control in Ulaanbaatar City Phase 2 Mongolia Technical Manual 08 Manual for Conducting and Updating of Dispersion Simulation
SUURI-KEIKAKU CO., LTD. - 111 -
When slope of approximation straight line is close to 1 as much as possible within the range of 0.8 to 1.2 and correlation coefficient is 0.71 or more, it means that the calculation result by dispersion simulation model can reproduces the actual situation more accurately. On the other hand, when correlation coefficient is less than 0.71, it means that there is no consistency between calculated value and measured value.
Also, when slope of approximation straight line is larger than 1.2 or smaller than 0.8, it means that the calculation result by dispersion simulation model is underestimated or overestimated for measured value. In either case, the accuracy of the calculation result of dispersion simulation model is not good, so after modifying the setting of input data such as meteorological data and emission data etc., dispersion simulation needs to be conducted again.
If possible, it is recommended to verify not only correlation between monitoring stations but also correlation of hourly concentrations at the same monitoring station. For example, by comparing the measured value with the calculated value with respect to temporal change of one hour concentration and monthly change of monthly average concentration, correlation of concentration change at a monitoring station can be verified. Figure 6.4-1 shows an example of comparing measured values and calculated values of monthly average concentrations.
Figure 6.4-1 Example of Comparing Measured Values and Calculated Values of Monthly Average
concentrations

Capacity Development Project for Air Pollution Control in Ulaanbaatar City Phase 2 Mongolia Technical Manual 08 Manual for Conducting and Updating of Dispersion Simulation
SUURI-KEIKAKU CO., LTD. - 112 -
Upper left: dispersion simulation model with good accuracy (correlation coefficient: 0.909) Upper right: correlation is not good (correlation coefficient: 0.471) Bottom left: calculation result is overestimated (correlation coefficient: 0.839) Bottom right: calculation result is underestimated (correlation coefficient: 0.851)
Figure 6.4-2 Comparison Example between Measured Value and Calculated Value
6.5 Drawing Cross-section Diagram of Concentration by Sources When updating the calculation result in “AllData” sheet, the update is reflected on “S-N SO2” sheet and “S-N PM10” sheet. These sheets are data lists for preparing cross-section diagram of concentration by sources and when updating the values of these sheets, cross-section diagram of concentration by sources is redrawn on “SO2 graph” and “PM10 graph” sheet.

Capacity Development Project for Air Pollution Control in Ulaanbaatar City Phase 2 Mongolia Technical Manual 08 Manual for Conducting and Updating of Dispersion Simulation
SUURI-KEIKAKU CO., LTD. - 113 -
6.6 Drawing Concentration Distribution Map 6.6.1 Import to Calculation Result Organization File to Access File
Open “Simulation.mdb” and select [Excel] button of [Import & Link] in [External Data] tab.

Capacity Development Project for Air Pollution Control in Ulaanbaatar City Phase 2 Mongolia Technical Manual 08 Manual for Conducting and Updating of Dispersion Simulation
SUURI-KEIKAKU CO., LTD. - 114 -
After click [Browse], select the calculation result organization file and click [OK].
Select result organization sheet, and click [Next] (Here it is “AllData” sheet.).
Check [First Row Contains Column Headings] is checked and click [Next].

Capacity Development Project for Air Pollution Control in Ulaanbaatar City Phase 2 Mongolia Technical Manual 08 Manual for Conducting and Updating of Dispersion Simulation
SUURI-KEIKAKU CO., LTD. - 115 -
Select [Let Access add primary key.] and Click [Next].
Input the table name in the [Import to Table:] textbox and click [Finish].
(Here it is “CONCENTRATION_bySimulation_grid1km_2015”.)
Click [Close].

Capacity Development Project for Air Pollution Control in Ulaanbaatar City Phase 2 Mongolia Technical Manual 08 Manual for Conducting and Updating of Dispersion Simulation
SUURI-KEIKAKU CO., LTD. - 116 -
6.6.2 Drawing Concentration Distribution Map
Open template file, click [File]-[Save As], and saved as other name.
Join the table of emission by grid to “SO2 Concentration” layer
If the table is already a joined table, select [Joins and Relates]-[Remove Join(s)]-[Remove All] and remove the existing join of table.
Right-click “SO2 Concentration” layer and select [Joins and Relates]-[Join].

Capacity Development Project for Air Pollution Control in Ulaanbaatar City Phase 2 Mongolia Technical Manual 08 Manual for Conducting and Updating of Dispersion Simulation
SUURI-KEIKAKU CO., LTD. - 117 -
When showing the following dialog, click button.
Select the table of emission by grid to join and click [Add].
(Here it is “CONCENTRATION_bySimulation_grid1km_2015” table)

Capacity Development Project for Air Pollution Control in Ulaanbaatar City Phase 2 Mongolia Technical Manual 08 Manual for Conducting and Updating of Dispersion Simulation
SUURI-KEIKAKU CO., LTD. - 118 -
Show the selected table in the dropdown textbox of “2.”. When clicking the dropdown button of “1.” and selecting “IXIY”, show “IXIY” in “3.” automatically. After then, click [OK].
If the following dialog may be shown, click [No].
Right-click “SO2 Concentration” layer and click [Properties].
Click [Symbology] tab and select [Quantities]-[Graduated colors]. Click and select the target column name at the drop down button of [Value] (Here it is [Total_SO2].).

Capacity Development Project for Air Pollution Control in Ulaanbaatar City Phase 2 Mongolia Technical Manual 08 Manual for Conducting and Updating of Dispersion Simulation
SUURI-KEIKAKU CO., LTD. - 119 -
Select the color pattern in [Color Ramp] to use for the distribution map. Click the value in [Range] and input the upper limit value of rank.
When double-clicking color in [Symbol] column, since the following dialog is shown, select color.
The results of selecting rank and color are as follows.

Capacity Development Project for Air Pollution Control in Ulaanbaatar City Phase 2 Mongolia Technical Manual 08 Manual for Conducting and Updating of Dispersion Simulation
SUURI-KEIKAKU CO., LTD. - 120 -
When click [Reverse Sorting] after you right-click on the [Range] column, the display order of rank changes.
Input label to display in legend by rank. When all setting completed, click [OK].
Click “Total_SO2” of “SO2 Concentration” layer and make it editable and change to “ug/m3”.

Capacity Development Project for Air Pollution Control in Ulaanbaatar City Phase 2 Mongolia Technical Manual 08 Manual for Conducting and Updating of Dispersion Simulation
SUURI-KEIKAKU CO., LTD. - 121 -
Change the title of this map. Move the cursor to the textbox of title, right-click it, and click [Properties].
Input a title in [Text] (Here it is “SO2 Concentration – All Sources”.).
Complete drawing the concentration distribution map by ArcGIS.

Capacity Development Project for Air Pollution Control in Ulaanbaatar City Phase 2 Mongolia Technical Manual 08 Manual for Conducting and Updating of Dispersion Simulation
SUURI-KEIKAKU CO., LTD. - 122 -
To export the distribution map to PDF file, click [File]-[Export Map].
Setting the destination and file name and click [Save].

Capacity Development Project for Air Pollution Control in Ulaanbaatar City Phase 2 Mongolia Technical Manual 08 Manual for Conducting and Updating of Dispersion Simulation
SUURI-KEIKAKU CO., LTD. - 123 -
Create the PDF file of concentration distribution map.

Capacity Development Project for Air Pollution Control in Ulaanbaatar City Phase 2 Mongolia Technical Manual 08 Manual for Conducting and Updating of Dispersion Simulation
SUURI-KEIKAKU CO., LTD. - 124 -
7 Method of Estimating the Emission of PM10 Considering Condensed Dust and Conducting Dispersion Simulation
7.1 Background Among the various pollutants, the only PM concentration measured at the measuring station was significantly higher than the calculated concentration using the previous dispersion simulation model. Various causes were thought such as error of the equipment of the measuring station, error of the emission factor, and contribution of generating the secondary particle, so in order to make it clear, the dust in the air was collected using the FRM sampler and component analysis of the collected dust was also conducted. As a result, it was shown that POM (Particulate Organic Matter) and sulfate are major source factor in the dust collected in winter and the main source is volatile organic matter due to fuel combustion (Figure 7.1-1). From these results, it is thought that these sources are greatly affected by condensed dust.
Figure 7.1-1 Comparing the origin source concentration in PM10 and PM2.5 sample from Dec.15,'14
to Jan.06,'15
In addition, Dr. Mizohata attempted PMF (Positive Matrix Factorization) analysis using the seasonal PM chemical composition analysis data obtained by previous observations and announced the obtained results at the seminar in February 2016. The number of source factors was unknown, but as a result of trial and error for 4 to 8 factors, source profiles consisting of 7 source factors and their contribution concentrations were finally derived.
7.2 Calculation Method of the Emission Considering Condensed Dust 7.2.1 Outline of PM10 Generating Process The image of generating processes of PM10 is shown in Figure 7.2-1. The generating processes of PM10 consist of the following three processes.

Capacity Development Project for Air Pollution Control in Ulaanbaatar City Phase 2 Mongolia Technical Manual 08 Manual for Conducting and Updating of Dispersion Simulation
SUURI-KEIKAKU CO., LTD. - 125 -
1. Generating Process of Primary Particle
Primary particles are generated by fuel combustion or fugitive dust. The particle generated through condensation of product in the process of moisture in the stack gas reacting with SO2 or NO2 is also included as the primary particle.
2. Generating Process of Condensed Dust
Condensed Dust is produced through gas or liquid (volatile matter or vapor etc.) in the stack is condensed into particles by rapid cooling and/or mixing in the air after the stack gas is emitted.
3. Generating Process of Secondary Particle by Chemical Reaction
Secondary particles are generated by chemical reaction in the air after the stack gas is emitted.
Source: JICA Experts
Figure 7.2-1 Image of Generating Process of PM10
3. Generating Process of Secondary Particle by Chemical Reaction (Calculated by CALPUFF) 3.a H2SO4+2NH3→(NH4)2SO4 (Sulfate) 3.b HNO3+NH3⇔NH4NO3 (Nitrate)
1. Generating Process of Primary Particle (Calculated by CALPUFF) 1.a PM10 by fuel combustion 1.b PM10 by non-fuel combustion (Fugitive dust etc.) 1.c SO2+H2O+O2→H2SO4 (Sulfate) 1.d 3NO2+H2O→2(H++NO3
-)+NO (Nitrate)
2. Generating Process of Condensed Dust (Estimated from the contribution by sources by PMF) 2.a OC by fuel combustion 2.b Sulfate 2.c Nitrate
Concentration at measuring and calculating point ・Total of fuel combustion (1.a+2.a) ・Total of Sulfate (1.c+2.b+3.a) ・Total of Nitrate (1.d+2.c+3.b) ・ PM10 by non-fuel combustion (1.b)
Receptor
Stack

Capacity Development Project for Air Pollution Control in Ulaanbaatar City Phase 2 Mongolia Technical Manual 08 Manual for Conducting and Updating of Dispersion Simulation
SUURI-KEIKAKU CO., LTD. - 126 -
7.2.2 Estimation Method of the Emission of PM10 Considering Condensed Dust
The calculation of PM10 emission can only be done by using emission factor from the result of flue gas measurement and monitoring survey described previously in 1.a and 1.b. Also in CALPUFF, generating process for condensed dust is not considered in. Therefore, to estimate PM10 emission considering the condensed dust, the PM10 emission estimation method by the process of 1.c, 1.d, and 2.a to 2.c is set as following.
1. PM10 emission calculated by using emission factor from the result of flue gas measurement and
monitoring survey (1.a, 1.b)
PM10 emission by source was calculated by multiplying activity data such as coal consumption to emission factor based on the result of flue gas measurement and monitoring survey.
2. Process of gas condensation and become particles in the stack (1.c, 1.d)
PM10 emission generated by chemical reaction from SO2 to SO4 (1.c) and from NO2 to NO3 (1.d) in stack were calculated.
Conversion ratio of reaction from SO2 to SO4 in stack was set as 5.011, SO2 and SO4 emission were estimated by the following formulas
SO4 Emission after reaction = SO2 Emission of emission inventory * 5/100 * 98/64
SO2 Emission after reaction = SO2 Emission of emission inventory * (1-5/100)
Also, NO3 emission included in PM10 was estimated using the NO3 ratio by the component analysis of the sample taken from sources (Table 7.2-1). These calculation results were added to PM10 concentration.
NO3 Emission = PM10 Emission * NO3 Ratio of each source / 100
Table 7.2-1 NO3 Ratio of Each Source by the Component Analysis
Source Ratio (%) Power plant 0.07 HOB 0.18 CFWH 0.04 Small stove for household 0.08 Vehicle exhaust gas 0.00
Source: JICA Experts
3. Generating process of condensed dust (2.a~2.c)
To estimate the emission of each source with consideration of generating process for the condensed dust, 1) the calculated concentration with consider ratio of generating process of primary and secondary particle, 2) average concentration of PM10at monitoring station, and 3) the PM10 contribution ratio of each source estimated by PMF were utilized.
When calculated concentration with consideration of generating process of primary and secondary particle is set as C1, PM10 average concentration at monitoring station is set as CAQ, and the PM10 contribution ratio of
11 Prediction Manual of SPM Committee of SPM Control Measure 1997 (in Japanese)

Capacity Development Project for Air Pollution Control in Ulaanbaatar City Phase 2 Mongolia Technical Manual 08 Manual for Conducting and Updating of Dispersion Simulation
SUURI-KEIKAKU CO., LTD. - 127 -
each source estimated by PMF is set as A, Cs that is PM10 average concentration of each source at monitoring station and R, the ratio to estimate the emission considered generating process for condensed dust are calculated by the following formula. PM10 emission considering the condensed dust was estimated by multiplying R to PM10 emission of emission inventory every source (Figure 7.2-2 and Figure 7.2-3).
CS=CAQ×A/100
R=CS/C1
Figure 7.2-2 Estimation Image of PM10 Concentration of Each Source at Monitoring Stations using
the result of PMF

Capacity Development Project for Air Pollution Control in Ulaanbaatar City Phase 2 Mongolia Technical Manual 08 Manual for Conducting and Updating of Dispersion Simulation
SUURI-KEIKAKU CO., LTD. - 128 -
Source: JICA Experts
Figure 7.2-3 Estimation Image of PM10 Emission Considering Condensed Dust
For PM10 contribution ratio of each source estimated by PMF in winter, Dr. Mizohata presented the ratio in the seminar on February 2, 2016, as shown in Table 7.2-3. The emission Es (the emission virtually added condensed dust) was estimated by multiplying E1 (emission of each sources in emission inventory) to R.
In 7 source factors in Table 7.2-2, since LF7-3 and LF7-7 are particle matters and do not generate condensed dust, and the contributions of LF7-2 and LF7-3 are low, these source factors are excluded from the source of condensed dust. Regarding LF7-2, UB city does not have refuse incineration and general waste is burned in the open air. On the other hand, LF7-2 may include tire combustion in ger stove, but further discussion of this cause is needed.
JICA Experts pointed out that there are many buildings under construction and the contribution of cement composition may enlarge, however, since the contribution is low (1.6%), this source factor is also excluded from the source of condensed dust.
According to these reason, the sources of condensed dust are set to coal combustion, vehicle exhaust gas, sulfate, and nitrate.
PM10 concentration by generating process of primary and secondary particle (C1)
Unknown PM10 concentration (Assumed as condensed dust)
PM10 concentration of each source using distribution ratio (CS ug/m3)
PM10 emission considering condensed dust (ES=E1*R)
Additional ratio for condensed dust (R=CS/C1)
PM10 emission considering only primary particle (E1)
Dispersion Simulation

Capacity Development Project for Air Pollution Control in Ulaanbaatar City Phase 2 Mongolia Technical Manual 08 Manual for Conducting and Updating of Dispersion Simulation
SUURI-KEIKAKU CO., LTD. - 129 -
Table 7.2-2 Concentration and Ratio of Each Source Factor Estimated by PMF
Source Factor by PMF Concentration
ug/m3 %
LF7-4: Motor Vehicle 30.3 13.1 LF7-1: Coal Combustion 146.3 63.6 LF7-2: Refuse Incineration 3.6 1.6 LF7-3: Cement 3.4 1.5 LF7-7: Crustal 20.6 9.0 LF7-5: Sulfate 10.9 4.8 LF7-6: Nitrate 15.2 6.6 Total 230.3 100.0
Source: JICA Experts Sum of ratio do not become the Total values because each value is rounded at the first decimal place.
Table 7.2-3 Concentration by Source Factor and Ratio of Generation Process for Condensed Dust
Coal Combusti
on
Vehicle Exhaust
Gas Crustal Sulfate Nitrate
Refuse Incinerati
on Cement
Averaged PM10 Concentration at monitoring station (CAQ)
161.34
PM10 distribution ratio of source estimated by PMF (A, %)
63.60 13.10 9.00 4.80 6.60 1.60 1.50
PM10 concentration of each source (Cs=CAQ*A/100, ug/m3)
102.61 21.14 14.52 7.74 10.65 2.58 2.42
Concentration by CALPUFF (C1, ug/m3) 58.51 2.23 31.81 5.15 2.81
R=Cs/C1 1.754 9.469
1.503 3.791
Source: JICA Experts
The condensed dust with considering PM10 emission is shown in Table 7.2-4, Figure 7.2-4, and Figure 7.2-5.

Capacity Development Project for Air Pollution Control in Ulaanbaatar City Phase 2 Mongolia Technical Manual 08 Manual for Conducting and Updating of Dispersion Simulation
SUURI-KEIKAKU CO., LTD. - 130 -
Table 7.2-4 Emission by Source before and after Considering Condensed Dust (2015)
PM10 SO4 NO3 Total Before After Before After Before After Before After
PP 14,786.62 25,935.72 908.98 1,366.19 10.35 39.24 15,705.94 27,341.15 HOB 623.25 1,093.18 114.75 172.48 1.12 4.25 739.13 1,269.91 CFWH 145.10 254.51 23.03 34.62 0.06 0.22 168.19 289.34
Small stove for household (Traditional stove)
3,007.86 5,275.78 104.01 156.32 2.41 9.12 3,114.27 5,441.23
Small stove for household (Improved stove)
629.17 1,103.57 142.89 214.76 0.50 1.91 772.56 1,320.23
Vehicle exhaust gas (Major road)
235.04 2,225.56 22.54 33.87 0.00 0.00 257.57 2,259.43
Vehicle exhaust gas (Minor road)
36.72 347.72 3.52 5.29 0.00 0.00 40.24 353.01
Fugitive dust from road 2,860.51 2,860.51 2,860.51 2,860.51
Fugitive ash from ash pond in PPs 409.64 409.64 409.64 409.64
Total 22,733.90 39,506.18 1,319.71 1,983.53 14.44 54.74 24,068.05 41,544.44 Unit: ton Source: JICA Experts
Source: JICA Experts
Figure 7.2-4 PM10 Emission by Source before and after Considering Condensed Dust (2015)

Capacity Development Project for Air Pollution Control in Ulaanbaatar City Phase 2 Mongolia Technical Manual 08 Manual for Conducting and Updating of Dispersion Simulation
SUURI-KEIKAKU CO., LTD. - 131 -
Source: JICA Experts
Figure 7.2-5 Contribution by Source before and after Considering Condensed Dust (2015)
7.3 Estimation Method of PM10 Concentration Flow diagram of dispersion simulation by using the emission considering condensed dust is shown inFigure 7.3 1.
Figure 7.3-1 Flow diagram of dispersion simulation by using the emission considering condensed dust
1. Generating Process of Primary Particle Considering Condensed Dust (1.a to 1.d and 2.a to 2.c)
Based on the above, the dispersion simulation of CALPUFF was conducted using the emission with consideration of generating process for condensed dust as input data. On this occasion, concentrations calculated from SO4 and NO3 emission in generating process of primary particle were added to PM10 concentration (Figure 7.3-2).
Air quality data
Emission data
Emission data conversion preprocessor
6.1Dispersion simulation model (CALPUFF)
6.2Calculation result output Postprocessor
(CALPOST)
6.4Estimation the ratio of condensed dust using calculated value and measured value by source (R)
Input data of dispersion model
4, 5
Calculation ofconcentration by source based on the analysis
result of PMF
6.3Arranging calculation result
3.3Meteorological model
Emission by source considering condensed dust
Emission data
Emission data conversion preprocessor
6.1Dispersion simulation model (CALPUFF)
6.2Calculation result output Postprocessor
(CALPOST)
Input data of dispersion model
5
6.5Arranging the calculation
result considering condensed dust
3.3Meteorological model
Emission data by source considering
condensed dust
6.3Arranging calculation result

Capacity Development Project for Air Pollution Control in Ulaanbaatar City Phase 2 Mongolia Technical Manual 08 Manual for Conducting and Updating of Dispersion Simulation
SUURI-KEIKAKU CO., LTD. - 132 -
Figure 7.3-2 Estimation Image of PM10 Concentration Considered Condensed Dust
2. Generating Process of Secondary Particle by Chemical Reaction (3.a~3.b)
A pseudo-first-order chemical reaction model is applied as a chemical reaction model of CALPUFF. This chemical model considers the following generating process from SO2 to SO4, and from NOx to NO3 and HNO3.
After reactant SO2 is emitted into the air, SO4 ion is generated by the reaction to moisture, ozone and hydrogen peroxide etc. in the air, and product particle of ammonium sulfate is produced by reaction of SO4 ion and ammonia.
After reactant NOx is emitted to the air, NOx reacts in two different processes. The first process is NO3 generating process by the reaction between NOx and moisture in the air. The second process is ammonium nitrate generating process by the reaction between ammonia and the nitric acid gas to be generated by the reaction to OH radical and so on by ozone or the photochemical reaction. Besides, since this reaction is a reversible reaction depending on temperature and relative humidity, nitric acid gas and ammonium nitrate are in the equilibrium state.
PM10 concentration by generating process of primary and secondary particle (C1)
Unknown PM10 concentration (Assumed as condensed dust)
PM10 concentration of each source estimated by PMF (CS ug/m3)
PM10 emission considering condensed dust (ES=E1*R)
Additional ratio for condensed dust (R=CS/C1)
PM10 concentration considering condensed dust
Dispersion Simulation
Setting R approaching contribute ratio and calculating ambient PM10 concentration

Capacity Development Project for Air Pollution Control in Ulaanbaatar City Phase 2 Mongolia Technical Manual 08 Manual for Conducting and Updating of Dispersion Simulation
SUURI-KEIKAKU CO., LTD. - 133 -
The image of each generating process is shown in Figure 7.3-3. SO4, NO3 and HNO3 concentration were calculated by CALPFF dispersion simulation using SO2 and NOx emission as input data, and were added to PM10 concentration.
Source: A User’s Guide for the CALPUFF Dispersion Model (Ver 5)
Figure 7.3-3 Generating Process of SO4 and NO3 (3.a and 3.b)
7.3.1 Converting to the Source Input Format for CALPUFF
Copy excel file created in Chapter 5 and save as new file. Open saved file and cancel the filtering function.
Update the formula to calculate SO4 and NO3 emission. This update is reflected to all rows.
SO4 Emission = SO2 Emission x conversion ratio from SO2 to SO4 x 96/64 x Additional ratio of condensed dust (R)
NO3 Emission =PM10 Emission x NO3 contribution ratio by composition analysis of PM10 x Additional ratio of condensed dust (R)

Capacity Development Project for Air Pollution Control in Ulaanbaatar City Phase 2 Mongolia Technical Manual 08 Manual for Conducting and Updating of Dispersion Simulation
SUURI-KEIKAKU CO., LTD. - 134 -
Add one column at the right of Dust (or TSP) and PM10 column. This calculation result is reflected to all rows.
TSP Emission = TSP Emission x Additional ratio of condensed dust (R)
PM10 Emission = PM10 Emission x Additional ratio of condensed dust (R)

Capacity Development Project for Air Pollution Control in Ulaanbaatar City Phase 2 Mongolia Technical Manual 08 Manual for Conducting and Updating of Dispersion Simulation
SUURI-KEIKAKU CO., LTD. - 135 -
Add the filtering function and specify the range of coordinate values of X and Y.
Add one column at the right of Dust (or TSP) and PM10 column in “13b”, “14b”, and “15b” sheet.
Copy the value of emissions from the above calculation sheets and paste them the relevant part of “13b”, “14b”, and “15b” in CALPUFF input file.

Capacity Development Project for Air Pollution Control in Ulaanbaatar City Phase 2 Mongolia Technical Manual 08 Manual for Conducting and Updating of Dispersion Simulation
SUURI-KEIKAKU CO., LTD. - 136 -
Regarding the formula in the column that creates the string of source information to be inserted in CALPUFF input file, correct the cell that specifies TSP and PM10 emission to the cell of the value considering condensed dust.

Capacity Development Project for Air Pollution Control in Ulaanbaatar City Phase 2 Mongolia Technical Manual 08 Manual for Conducting and Updating of Dispersion Simulation
SUURI-KEIKAKU CO., LTD. - 137 -
7.3.2 Conducting Dispersion Simulation and Organizing the Calculation Result by Using the Emission Considering Condensed Dust
Repeat step 5 and 6.1 to 6.3 using the estimated emissions.
The result of dispersion simulation using the emission of PM10 considering condensed dust is shown in Figure 7.3-4. Also, the concentration ratio by source in sulfate and nitrate is shown in Figure 7.3-5.

Capacity Development Project for Air Pollution Control in Ulaanbaatar City Phase 2 Mongolia Technical Manual 08 Manual for Conducting and Updating of Dispersion Simulation
SUURI-KEIKAKU CO., LTD. - 138 -
Source: JICA Experts
Figure 7.3-4 PM10 Contribution Ratio at CLEM-5
Left: Sulfate, Right: Nitrate Source: JICA Experts
Figure 7.3-5 Sulfate and Nitrate Contribution Ratio as CLEM-5

Capacity Development Project for Air Pollution Control in Ulaanbaatar City Phase 2 Mongolia Technical Manual 08 Manual for Conducting and Updating of Dispersion Simulation
SUURI-KEIKAKU CO., LTD. - 139 -
8 Evaluation of Air Pollution Control Measure Plan 8.1 Conducting the Dispersion Simulation Based on Air Pollution
Control Measure Plan Figure 8.1-1 shows the flow diagram of estimation of emission and conduct of dispersion simulation based on control measures. Two calculation methods are assumed depending on whether the reduction of PM emission in emission inventory and the reduction of condensed dust in PM emission are proportional to each other when estimating the emissions considering condensed dust after control measure.
Figure 8.1-1 Flow Diagram for Estimation of Emission and Conduct of Dispersion Simulation Based
on Air Pollution Control Measures
8.1.1 In the Case of Proportion
In this case, condensed dust will be assumed to decrease at the same ratio as the emission reduction in emission inventory. Therefore, estimate the emissions considering condensed dust according to the following formula. The image of the estimate of emissions is shown in Figure 8.1-2. An example of control measure is the case that coal consumption expected to decrease by replacement to a boiler or a stove with high efficiency combustion.
Es′ = E1′ ∗ R
Es’: Emission considering condensed dust after control measures
E1’: Emission considering only primary particle after control measures
R: Additional ratio of condensed dust (Value of each source calculated in 7.2)
Emission data considering the condensed dust
Emission Data
Condition based on control measure
Emission data based on control measure
If the reduction amount of condensed dust is
proportional to the one of emission
If the reduction amount of condensed dust is
NOT proportional to the one of emission
Considering the condition for the ratio of condensed dust
Emission multiply R Emission of condensed dust multipy the reduction ratio
Pre-processor for emission data
Dispersion simulation model (CALPUFF)
Post-processor for outputting the calculation result(CALPOST)
Input data for model
Gathering of the calculation result considering condensed
dust
Meteorological Model
Gathering of the calculation result
Emission data considering the condensed dust
Drawing the distribution map
Drawing the cross-section
diagram
Calculating exposure by grid
Population by grid

Capacity Development Project for Air Pollution Control in Ulaanbaatar City Phase 2 Mongolia Technical Manual 08 Manual for Conducting and Updating of Dispersion Simulation
SUURI-KEIKAKU CO., LTD. - 140 -
Figure 8.1-2 Image of the Estimate of Emissions in the Case of Proportion
8.1.2 In the Case of Not Proportion
In this case, the reduction of condensed dust will be assumed to change due to different factors from the emission reduction in emission inventory. Estimate the emissions considering condensed dust according to the following formula. The image of the estimate of emissions is shown in Figure 8.1-3. An example of control measure is the case that since the installation of cyclone in HOB reduces the emission of particulate matter, especially primary particles, but the volatile matter from which condensed dust is produced does not decrease, the emission of condensed dust is the same as before control measure.
Es′ = E1′ + E𝑐𝑐𝑐𝑐
E𝑐𝑐𝑐𝑐 = 𝐸𝐸1 ∗ (𝑅𝑅 − 1) ∗ 𝑋𝑋
Es’: Emission considering condensed dust after control measures
E1’: Emission considering only primary particle after control measures
Ecd: Emission of condensed dust after control measures
E1: Emission considering only primary particle before control measures
R: Additional ratio of condensed dust (Value of each source calculated in 7.2)
X: Reduction ratio of condensed dust (X=1: Not reduction of condensed dust, X=0: Condensed dust disappears)

Capacity Development Project for Air Pollution Control in Ulaanbaatar City Phase 2 Mongolia Technical Manual 08 Manual for Conducting and Updating of Dispersion Simulation
SUURI-KEIKAKU CO., LTD. - 141 -
Figure 8.1-3 Image of the Estimate of Emissions in the Case of Not Proportion
8.2 Evaluation of Air Pollution Control Measure Plan Compare emissions and concentrations (maximum concentration, average concentration) before and after implementation of control measures plan, and verify the reduction effect of emissions and concentration. On the other hand, when narrowing down the areas to which control measure is applied, the reduction effect of emission and concentration in the applicable area should be verified.
To evaluate the influence to citizens in UB city, the exposure that PM10 concentration weighted by population (PWE; Population-Weighted Exposure) was calculated. Using PWE, the concentration considered the size of population can be calculated. The method in WB (2011)12 was used as calculation method of PWE.
𝑃𝑃𝑃𝑃𝐸𝐸 =∑(𝐶𝐶𝑖𝑖 × 𝑃𝑃𝑖𝑖)
𝑃𝑃𝑃𝑃
PWE: PWE in calculation area (µg/m3)
Ci: Concentration in grid i (µg/m3)
Pi: Population in grid i
PT: Total population in calculation area
In addition, obtain information on costs for implementing control measures and estimate the cost for implementing control measures based on this information. Estimate the cost to reduce 1ton or 1µg/m3 by dividing the estimated cost by the reduction amount of emission or concentration. The smaller this amount is, the more cost-effectiveness is.
Obtain information on costs by interviewing administrative organizations such as ministries and agencies that control measure jurisdiction and companies that produce improved fuels and flow gas treatment equipment.
As examples of utilization of these methods, a case where a cyclone is installed into a HOB without a flow gas treatment equipment is shown.
12 Air Quality Analysis of Ulaanbaatar Improving Air Quality to Reduce Health Impacts, WB 2011

Capacity Development Project for Air Pollution Control in Ulaanbaatar City Phase 2 Mongolia Technical Manual 08 Manual for Conducting and Updating of Dispersion Simulation
SUURI-KEIKAKU CO., LTD. - 142 -
Example: Installation of cycleon for control measure to HOB
In the case of cyclone is installed to all boilers without stack gas treatment equipment (164 units) in HOB emission inventory for 2015, emission estimation and dispersion simulation were conducted.
1. Setting
Dust collection efficiency of cyclone was set to 60%. Since only particle matter can be collected by cyclone, amount of condensed dust was set to be the same as before control measure.
2. Chenge PM10 emission
Change of emission is the following figure. Reduction ratio was 51.64%.
排出量の変化は以下の Figure の通りである。削減率は 51.64%であった。
3. Change PM10 concentration
PM10 concentration distribution is shown in the following figures. In addition, Maximum PM10 concentration and PWE is shown in the following table.
Before After Reduction amount Maximum concentration 12.99 8.17 4.72 PWE 4.85 3.10 1.76
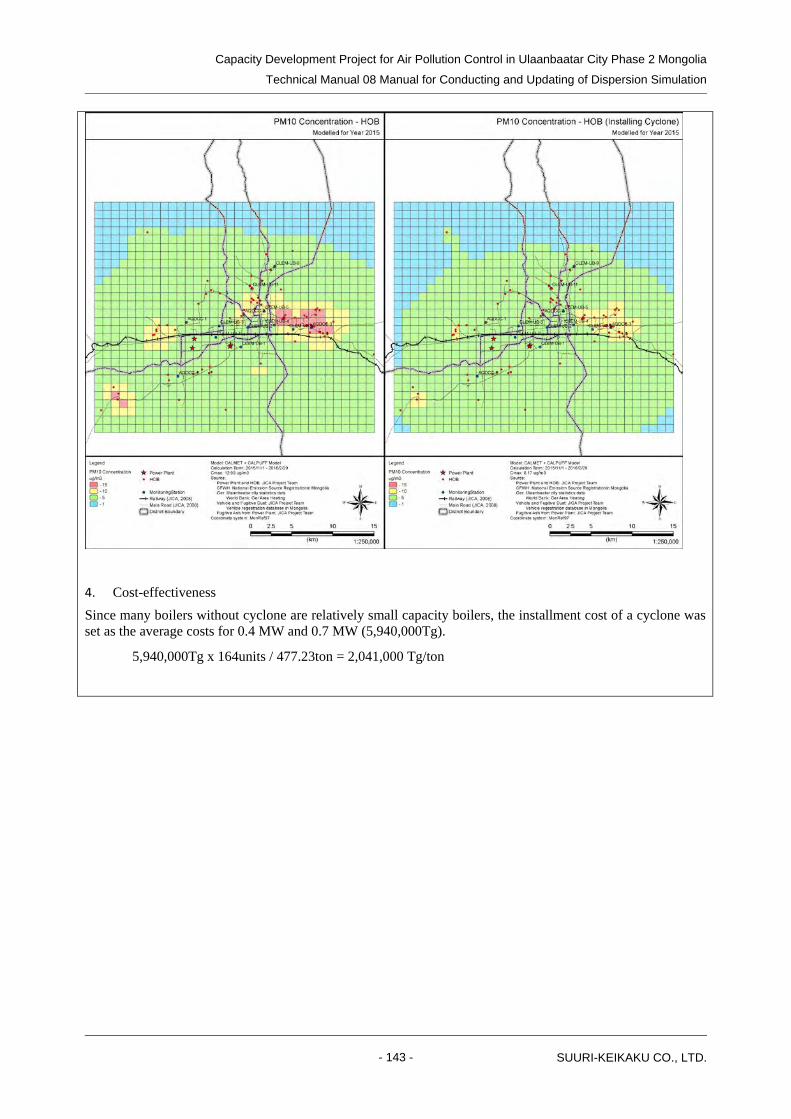
Capacity Development Project for Air Pollution Control in Ulaanbaatar City Phase 2 Mongolia Technical Manual 08 Manual for Conducting and Updating of Dispersion Simulation
SUURI-KEIKAKU CO., LTD. - 143 -
4. Cost-effectiveness Since many boilers without cyclone are relatively small capacity boilers, the installment cost of a cyclone was set as the average costs for 0.4 MW and 0.7 MW (5,940,000Tg).
5,940,000Tg x 164units / 477.23ton = 2,041,000 Tg/ton