Embed Size (px)
Citation preview

Methods to measure stakeholder preferences
Stina Alriksson Dep of biology and environmental science

• Trade-off between factors • Statistical analysis • Numerical results • Results on individual level • Quantitative and qualitative analysis
Conjoint analysis!

Conjoint analysis
Consider jointly Stated preference Experimental plan (fractional factorial design) 4-6 factors (attributes) in 2-3 levels Widely used in marketing, transportation, health care and
environmental valuation (environmental economics)

An example:
Brand: Renault Clio Seat Ibiza Volvo V60 Year: 2002 2014 2012 Price (SEK): 17 000 140 000 237 000 Horse power: 58 102 163 Km: 150 000 0 40 000
Rank the following cars according to how likely you are to buy them:

Study 1 – Why aren’t advanced high strength steels more widely used? Aim: To identify how the steel stakeholder groups (suppliers, producers, customers, and R&D) value the typical characteristics of AHSS, such as: • weight reduction • impact strength (durability) • price • scrap steel content • origin of the steel
Alriksson & Henningsson (2015) Why arn’t advanced high strenght steels more widely used? Accepted in Journal of Industrial ecology. DOI: 10.1111/jiec.12212

Design conjoint analysis
Container Impact strength
Weight (ton)
Chromium content (%)
Swedish steel
Scrap content (%)
Price excluding tax (SEK)
A Normal 2.3 1.0 Yes 20 23500 B High 2.3 0.0 Yes 60 18500 C High 1.6 0.0 Yes 20 23500 D High 2.3 1.0 No 60 23500 E Normal 1.6 0.0 No 60 23500 F High 1.6 1.0 No 20 18500 G Normal 1.6 1.0 Yes 60 18500 H Normal 2.3 0.0 No 20 18500
Web questionnaire. Approximately 800 addresses, 134 responses (17%).

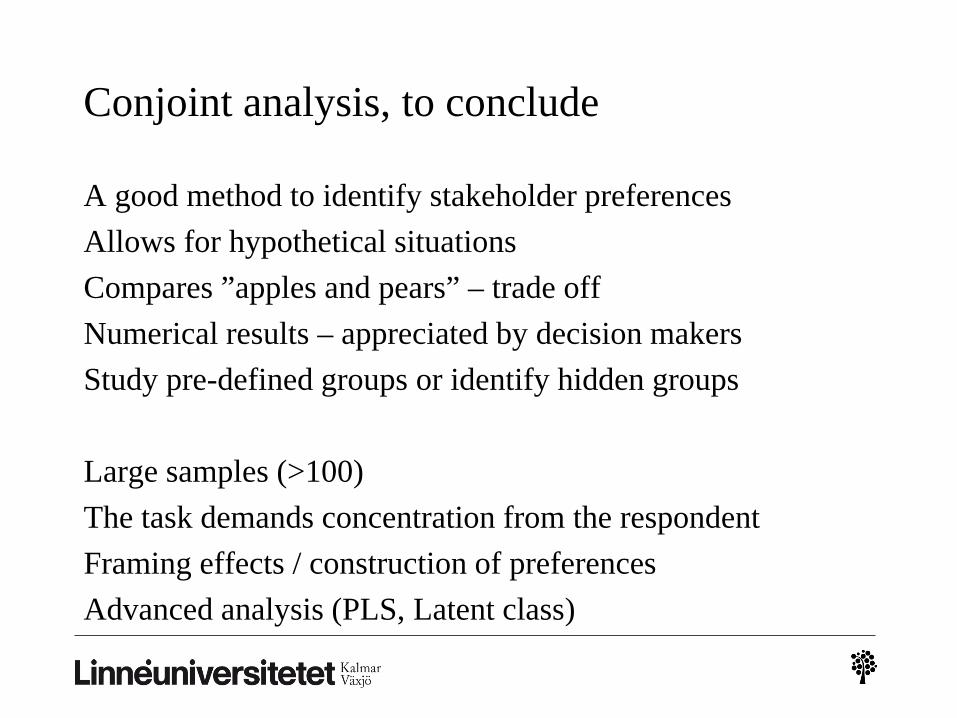
Conjoint analysis, to conclude
A good method to identify stakeholder preferences Allows for hypothetical situations Compares ”apples and pears” – trade off Numerical results – appreciated by decision makers Study pre-defined groups or identify hidden groups Large samples (>100) The task demands concentration from the respondent Framing effects / construction of preferences Advanced analysis (PLS, Latent class)
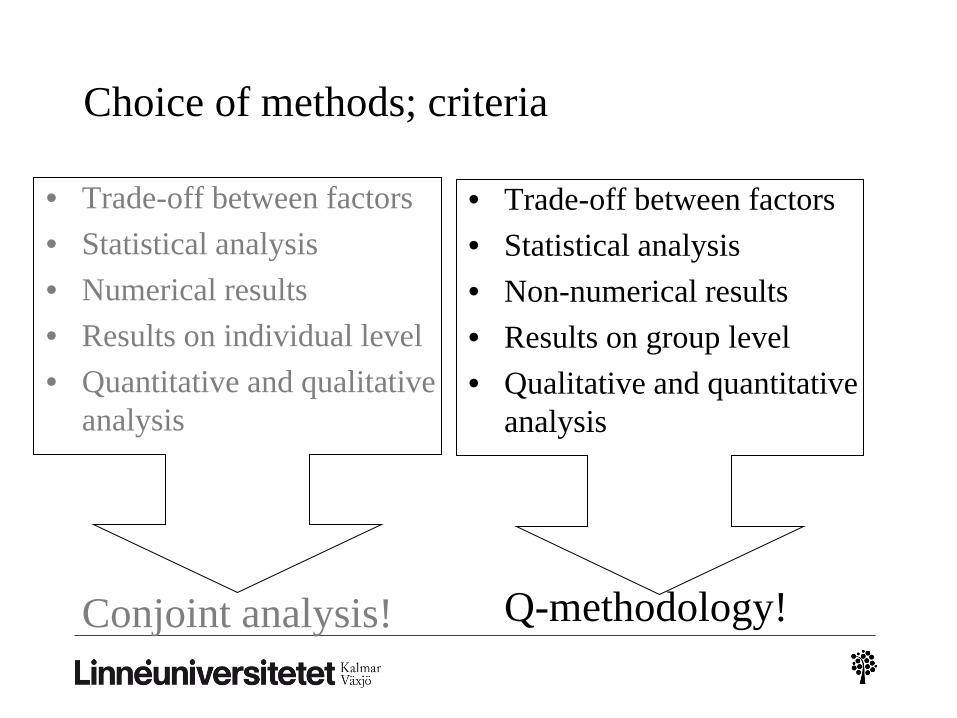
Choice of methods; criteria
• Trade-off between factors • Statistical analysis • Numerical results • Results on individual level • Quantitative and qualitative
analysis
Conjoint analysis!
• Trade-off between factors • Statistical analysis • Non-numerical results • Results on group level • Qualitative and quantitative
analysis
Q-methodology!

Q-methodology compared to conjoint analysis
• Fewer samples (<30) • Compares people, not attributes • Presents ”discourses” • Factor analysis
• Useful in change projects to illustrate different viewpoints • Widely used in all types of change processes (public
participation, process management, fire management, landscape valuation, agriculture, forestry etc.)

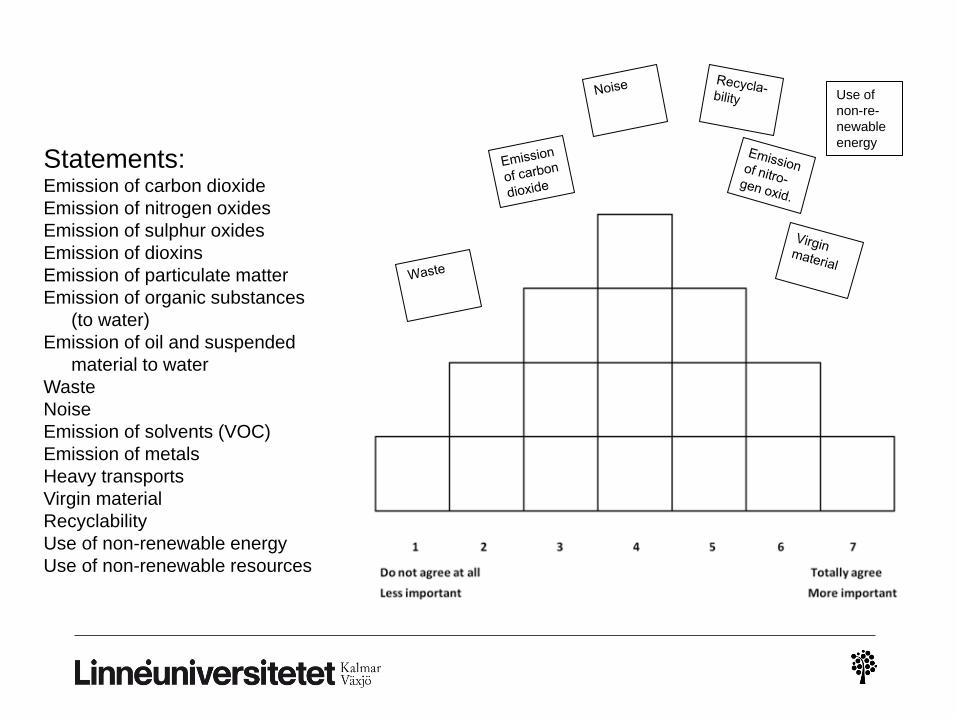
Statements: Emission of carbon dioxide Emission of nitrogen oxides Emission of sulphur oxides Emission of dioxins Emission of particulate matter Emission of organic substances
(to water) Emission of oil and suspended
material to water Waste Noise Emission of solvents (VOC) Emission of metals Heavy transports Virgin material Recyclability Use of non-renewable energy Use of non-renewable resources
Use of non-re-newable energy

Q-methodology
Alriksson S and Filipsson M (2015): Risk perception and worry in environmental decision making – a case study within the Swedish steel industry. Submitted.
Aim: The study aimed to assess if risk perception and personal worries influenced environmental decision making within the Swedish steel industry. • Perceived risks • Environmental worries • Day-to-day work 38 decision-makers: * Höganäs AB, Höganäs * Ovako, Smedjebacken * Outokumpu, Avesta * Outokumpu, Eskilstuna * Ruukki, Malmö * Ruukki, Danderyd * Sandvik Kantahl, Hallstahammar * Sandvik, Sandvik * SSAB, Luleå * SSAB, Borlänge * SSAB, Oxelösund

Risk perception: Risk aware-discourse
Eight members, four men and four women All of them worked at ore based steel works, no scrap based steel works
were represented They represented four different plants All were members of the top management of the plant Their work titles were for example
Environmental manager (two persons), Head of strategical projects, Manager EHS (environment, health and safety) (two persons) Energy supply manager
Emission of carbon dioxide was the most important statement Commercial risk

Risk perception: Economist-discourse
Seven members, five men and two women Four of them worked at ore based steel works while three worked at
scrap based steel works They represented five different plants All except one were members of the top management of the plant Their work titles were for example: production manager, site manager,
environmental coordinator, environmental manager, manager QEHS (quality, environment, health and safety).
Emissions of carbon dioxide, use of non-renewable resources and use of
non-renewable energy were important statements Focused on economic risks,

Perceived risk for the facility/operation

Number of responses for each statement

Number of responses for each statement

Conjoint analysis, to conclude
A good method to identify stakeholder preferences Allows for hypothetical situations Compares ”apples and pears” – trade off Numerical results – appreciated by decision makers Study pre-defined groups or identify hidden groups Large samples (>100) The task demands concentration from the respondent Framing effects / construction of preferences Advanced analysis (PLS, Latent class)

Q-methodology, to conclude
Reveal discourses, (viewpoints) Trade-offs between the statements Study pre-defined groups or previously unknown groups Small samples (<40 respondents) Easier for the respondent than conjoint analysis Time consuming for the researcher Advanced analysis (factor analysis)


![How to reduce emission of nitrogen oxides [NOx] from](https://img.dokumen.tips/doc/110x75/616a4dd111a7b741a35108dc/how-to-reduce-emission-of-nitrogen-oxides-nox-from-.jpg)