Embed Size (px)
Citation preview

ACHEMINFO
4. Canada's and Alberta's Chemicals
Industry and Markets
4.1 Overview
The chemicals market in Alberta is large and complcx, though not as diverse as in the northerneastern part of ihe United States and eastern Canada. Tlie oil and gas, and agriculturalindustries are large chemical markets in Alberta, while cosmetics, soaps, cleaners, inks,adhesives. sealants, pharmaceuticals, and other specialty chemical market segments tend tobe much smaller. New bio-based chemical producers in Alberta may have to compete withsome larger, well established suppliers of low-priced petroleum-based chemicals. Anoverview of some keyaspectsof Canada's and Albeila's chemical markets is provided below.This overview is intended to provide some insights on the market segments in which futurebiochemical producers in Albertamight compete.
Canada's chemicals manufacturing industry is included in the North American IndustrialClassification System (NAICS) code 325. The industry is large and very diverse in terms ofproducts and manufacturing processes. It is often useful to distinguish between commodityand/or pseudo-commodity chemicals (including polymers) and formulated products andspecialty chemicals (FPSC). The industry contains many unique segments and thousands ofchemical products in pure and mixed form. It also encompasses synthetic resins (polymers)production. Details of thedefinition and economic statistics for the industry and its segmentscan be obtained by linking to Industry Canada's website (wwvv.ic.uc.ca/cliemicals'). as shownin the table below.
Table 8: Statistical Data Sources for Canada's Chemical Sector(Click on the hyperlinks belovtr to access economic statistics)
Total Sector:
NAICS 325 - Chciiiicals and cht-mical nruducts ftoliih
Basic I'clrochemicals, Polymer, Fertilizers, Inorganic('onimodiiv and P$cudo-Commodit\' Products
Pormulalcd Products and
Speciallv ChcmicaU IFPSC)NAICM Hi 1 1 - IV;lniclii:inic;ils NAICS .^2532 • Pc.^iliciilis iiml iilhtr iiiirit!iilltirnl Hiirmu'aUNAICS 'Jil? - Iniiiislrul NAICS ''251 - I'lriniiHri-iilicals :iml mcdicimrs
NAICS .12513 -S\nllii-lirii\i-s;iiiilpionifiim NAICS "2551 - I'iiinls ;ii\il rii;ilii)iis
NAICS 3251XI - Alk.ili ami rhlorini- NAICS 32552 - .Adliosixos and <c'al;intsNAICS ?251X9 - (hhi'r iniiruanic irlurmii'aK NAICS ^?5(»1 - Soans am! tlcanini' comnoumUNAICS li'sm . OlhiT hnsii; orpanic i-hi-miraU
NAICS ."252 1 - S\mlti'lir r>-sin< and nihK»r;
NAICS .U522 - Svnlhclic lihrcs and rilnm<-nis
NAICS .'>2531.3 -Cheinlciil Icrtllizcrs(exnmi rmiiislii
NAICS 325314 - Mi.-teJ laiili/ers
NAICS 32562 • ToiliM nnrnariilioiis
NAICS '?'5')1 - I'rinlinn inks
NAICS •'•S'P . FNTilosivos
NAICS 1?5W1 - Ciislnm miimiHindinp
NAICS 325W'> - Other cht-miail nroducls
20

ACHEMtNFO
4.2 Size and Trends
Manufacturing shipments for the Canadian chemical sector totalled $42.5 billion in 2010 withcommodity products such as petrochemicals, polymers, fertilizers, inorganic chemicals, andgases making up 58% of the total value. Specialty chemicals, formulated products, andpharmaceuticals made up 42% of manufacturing shipments in 2010. Excludingpharmaceuticals, total manufacturing shipments were close to $33 billion, with approximately73% being industrial and polymer products.'̂
Alberta's chemical industry is largely comprised of petrochemical, polymer (i.e.,polyethylene) and fertilizer production. Its products are mostly exported to the Far East andUnited States. In comparison to Ontario and Quebec, where the great majority of the restCanadian chemical industry resides, there are lower levels of manufacturing FPSC in Alberta.In general. FPSC tend to be made in eastern Canada, closer to larger manufacturing andconsumer markets in Canada and the northeastern part of the United Stales. However, as anexception. Albetla has a large upstream oil and gas industry, which has attracted FPSCformulators servicing regional demand {see Oilfield Chemicals, for example, later in thisreport).
Table 9: Manufacturing Shipments for CanadianChemical Sector, 2010
($ billion)
Grouped Industry SegmentsManufacturing
Shipments% of Total
Estimated
Alberta Portion
of Canada Total
Petrochemicals, oraanic chemicals and polvmers $16.6 .•?9% High (>70%)
Fertilizers and other aericultural chemicals $4.0 9% Hieh (>70%)Inorganic chemicals and gases $4.1 10% Low <20%
Formulated products and other chemicals S9.2 22% Low <20%
Pharmaceuticals $8.7 20% Very Low (<5%)
Total chemical scctor $42.5 100%
Source: Industry Canada. Available al; Iiitn://w\vvv.ic.t!c.ca/cic/siie/diemicals-chimi{itccs.nsrcniz/bt0l203,liltiil.High means over 70% Medium is 20% to 70%, and low means less than 20% of Canada total.
The Canadian chemical industry grew steadily in the early part of the previous decade.Between 2002 and 2006, average annual growth in the value of manufacturing shipments washigh at 5.1%." However, much of this growth was the result of increasing prices. The growthin the mass quantity of salesduring this period was lower.'̂ The value of shipments between
" Includes Petrochemicals, organicchcmicals and polymers. Fertilizers andother agricultural chemicals, andInorganic chemicals and gases, in the table below." Industry Canada. http://www.ic-gc.ca/eic/site/tdo-dcd.nsf/eng/Home. Excludes pharmaceuticals.
No statistics are available for total sales volume ofchemicals due to the large number ofdiverse products.
21

ACHEMINFO
2006 and 2008 was flat, and in 2009. the industry performance reflected the effects of theeconomic downtum in North America and around the world. The value of shipments in 2009was about 20% below 2008 levels. Industry shipments declined as prices and sales volumesdropped formany petrochemicals, polymers and otherchemical products. Some plants closedin Canada during the last five years. In 2010, the Canadian indusuy began to recover alongwith increases in North American and global demand.
Canada's chemical industry has had a large trade deficit for many years. It totalled $13 billionin 2010.''' Canada enjoys a trade surplus for some petrochemicals and polymers, inorganicchemicals (e.g.. sodium chlorate, sulphuric acid), and fertilizers, a large portion of which areproduced in Alberta. These chemicals arc competitive in export markets due to rawmaterial(e.g., natural gas) and energy price competitiveness, and are made in large-scale plants withgood economies of scale. Mowever. there are trade deficits for practically all formulatedproducts and specialty chemicals, including pharmaceuticals that accounted for the largesttrade deficit contribution in the industry in 2010 - at approximately $7 billion.
Table 10: Trends in Chemical Industry Shipments, Trade,Establishments and Employment
Year Shipments imports ExportsDomestic
Consumption'"Trade Balance Rs(ablishments Employment
(S billions) ($ billions) (S billions) <S billions) ($ billions)
2000 $37 $29 $19 $48 -$11 2,061 83,252
2001 S38 $31 S20 S50 -$11 2.067 87,861
2002 S41 $33 $20 $53 -$13 2.145 88,129
2003 S43 $33 S20 $56 -S13 2.122 87.166
2004 $47 $36 S24 $58 -$11 3,315 84.091
2005 $49 $37 $27 $59 -$11 3,049 81,882
2006 $50 $39 $29 $60 -$10 2,955 79.990
2007 S49 $40 $32 S57 -$8 2.945 78.709
2008 S50 $42 $32 S60 -SIO 2,834 80.934
2009 $41 $40 S27 $54 -$14 2.734 79.087
2010 $43 $41 $28 $55 .$13 2,734*=' 77,670
Noll's: liicUides Phamiaceulicals.(1) Donicsiic Consumpiion iscalculalt-d as shipments plu-s impons less ejcpons.(2) lriduslr\ Canada esiimalcs
I on Siatistics Canada
" Industry Canada, Available at: hlti>://\vvv\v.ic.uc.ca/eic/silc/chemicals-chimiH>ics.nsf/eni '̂bt0l203.lilml.Accessed: January 26. 2011.
Prior 10 2004, data covers incorporated establishments with employees, primarily engaged in manufacturingand with sales of manufactured goods equal or greater than S30.000. Thisapplies lo all othersimilar tables inthis repon. Source: Industry Canada.
22
ACHEMINFO
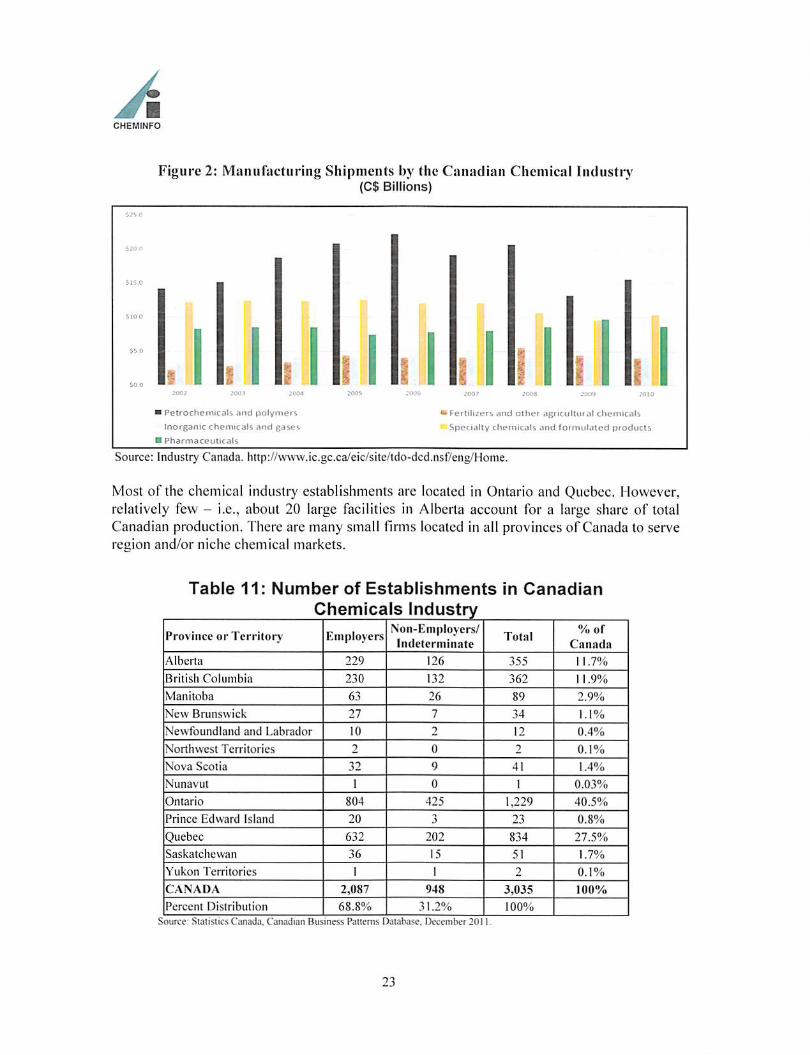
Figure 2: Maiitifacturing Shipments by the Canadian Chemical Industry(C$ Billions)
a
I Peirochcmicaib t»nd palv"i«'S
Inorganic chemrc jK nml
I Pharmaceulic«ils
'FcrCihzers and other dgrrcultcn <3t chc*tniC<4l^
Specialty chemicals arrd formufdied products
Source: Industry Canada. http://www.ic.gc.ca/eic/site/ido-dcd.nsf/eng/Home.
Most of the chemical industry establishments are located in Ontario and Quebec. However,relatively few - i.e., about 20 large facilities in Alberta account for a large share of totalCanadian production. There are many small firms located in all provinces of Canada to serveregion and/or niche chemical markets.
Table 11: Number of Establishments in Canadian
Province or Territory EmployersNon-Employers/Indctcrniinate
Total%of
Ciinnda
Alberta 229 126 355 11.7%
British Columbia 230 132 362 11.9%
Manitoba 63 26 89 2.9%
New Brunswick 27 7 34 1.1%
Newfoundland and Labrador 10 2 12 0.4%
Nonhwest Territories 2 0 2 0.1%
Nova Scotia 32 9 41 1.4%
Nunavut I 0 1 0.03%
Ontario 804 425 1,229 40.5%
Prince Edward Island 20 3 23 0.8%
Quebec 632 202 834 27.5%
Saskatchewan 36 15 51 1.7%
Yukon Territories I I 2 0.1%
CANADA 2,087 948 3,035 100%
Percent Distribution 68.8% 31.2% 100%
Sourcc: SlalislicsCaniida. Canadian Business Patterns Database. Ucccmbcr 2011.
23
ACHEMINFO
Tens of thousands of chemical customers in Canada obtain products from distributors andsub-distributors. Some of the major Canadian chemical distributors are Univar. Brenntag,Canada Color and Chemicals, and L.V. Lomas. There arc many more distributors, somefocused on regional marketsor market segments (e.g.. oil and gas, cleaning chemicals, etc.).
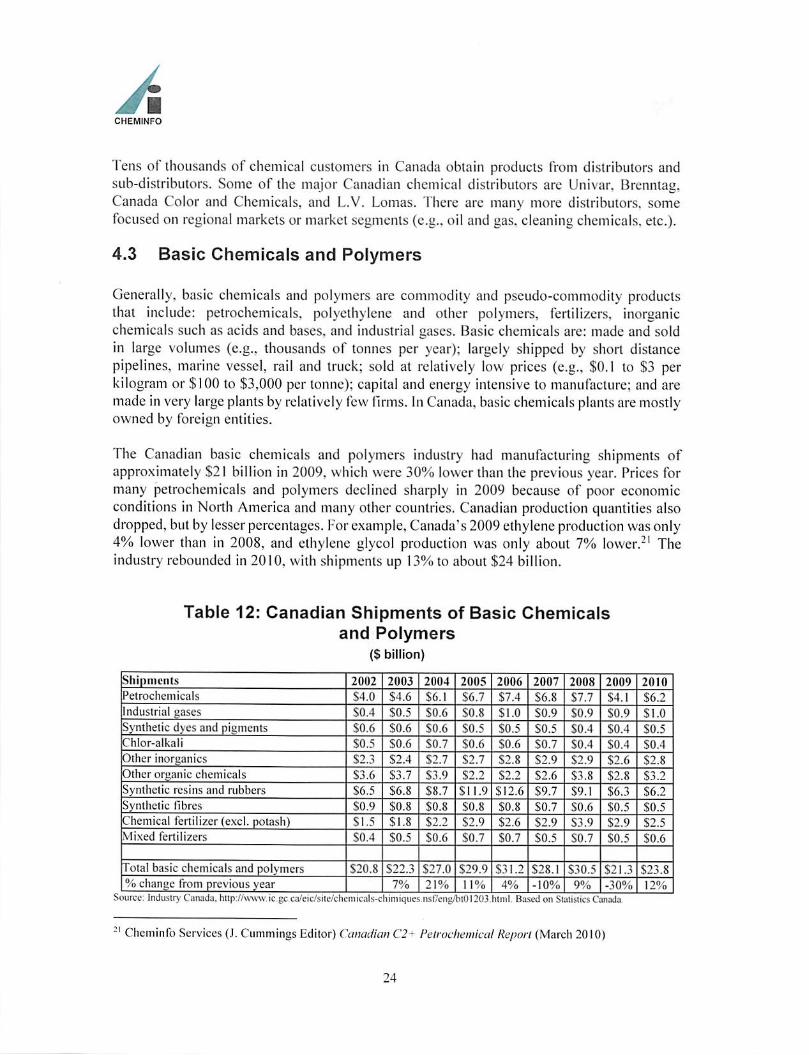
4.3 Basic Chemicals and Polymers
Generally, basic chemicals and polyiners are commodity and pseudo-commodity productsthat include: petrochemicals, polyethylene and other polymers, fertilizers, inorganicchemicals such as acids and bases, and industrial gases. Basic chemicals are: made and soldin large volumes (e.g.. thousands of tonnes per year); largely shipped by short distancepipelines, marine vessel, rail and truck; sold at relatively low prices (e.g., $0.1 to $3 perkilogram or $100 to $3,000 per tonne); capital and energy intensive to manufacture; and aremadein very large plants by relatively few firms. In Canada, basicchemicals plantsare mostlyowned by foreign entities.
The Canadian basic chemicals and polymers industry had manufacturing shipments ofapproximately $21 billion in 2009. which were 30% lower than the previous year. Prices formany petrochemicals and polymers declined sharply in 2009 because of poor economicconditions in North America and many other countries. Canadian production quantities alsodropped, but by lesser percentages. Forexample, Canada's 2009ethyleneproduction wasonly4% lower than in 2008, and ethylene glycol production was only about 7% lower.-' Theindustry rebounded in 2010, with shipments up 13%to about $24 billion.
Table 12: Canadian Shipments of Basic Chemicalsand Polymers
(S billion)
Shipments 2002 2003 2004 2005 2006 2007 2008 2009 2010
Petrochemicals $4,0 S4.6 S6,l $6.7 $7.4 $6.8 S7,7 S4,l S6.2
Industrial ^ases S0,4 $0.5 $0,6 $0,8 $1.0 S0.9 S0.9 S0,9 Sl.OSynthetic dyes and pigments S0,6 S0.6 S0.6 $0.5 $0.5 S0.5 S0,4 S0,4 S0.5"hlor-alkali S0.5 $0.6 $0.7 S0,6 S0.6 S0.7 S0.4 S0,4 $0.4
Other inornaiiics S2.3 S2.4 S2.7 S2,7 S2.8 $2.9 S2.9 $2,6 S2,8
Other oraanic chemicals S3.6 $3.7 $3.9 S2,2 S2.2 $2,6 $3.8 $2,8 $3.2
Synthetic resins and rubbers S6.5 S6.8 $8.7 $ 11,9 $12.6 $9.7 S9,l $6.3 S6.2
Synthetic fibres $0.9 $0.8 $0.8 $0.8 $0,8 $0.7 S0.6 $0,5 S0,5
Chemical fertilizer (excl. potash) $1.5 $1.8 $2.2 $2,9 $2.6 $2.9 S3,9 $2,9 S2,5
Mixed fertilizers $0.4 $0.5 $0.6 $0.7 S0.7 $0.5 SO,7 S0.5 $0.6
Total basic chemicals and polymers S20.8 S22.3 $27.0 $29,9 S31.2 S28.1 S30.5 $21.3 $23,8% change from previous year 7% 21% il% 4% -10% 9% •30% 12%
Cheminfo Services (J. Cummings Editor)Canadian C2+ PetrochemicalReport (March 2010)
24

ACHEMINFO
The Canadian and US markets for basic chemicals and the great majority of commoditypolymers can be considered mature. Most of the products, which are broadly used, havereached saturation penetration levels in the cconomy. For example, polyethylene replacedolher materials in packaging (e.g., paper bags,glass bottles), construction (e.g.. metal pipes),and many olher appiicalions from the 1960s through the 1980s. As a result. Canadian salesvolumes for commodity chemicals and polymers tend to track overall economic activity.Demand for some products may even be in slow dccline as they arc under pressure due loenvironmental factors. For example, solvcnls have been under environmental pressure in avariety of formulated products (paints, adhesives. etc.) since they are a source of volatileorganic compounds (VOC)-^, which contribute lo ground level ozone concentrations (smog).In ihis category, toluene, for example, has been losing sales in the paints, coatings andadhesives markets, which have been trending toward water-based products. Given marketmaturity in North America, chemical and polymer markets, investors have been moreinterested in locating new plants to serve faster-growing markets - as in Asia.
4.3.1 Petrochemicals and Polymers
Major petrochemicals include ethylene. propylene, butylenes. butadiene, elhylene glycol,styrene and methanol. Some of these are used lo make polymers, such as polyethylene,polypropylene"^ rubber, polyethylene lerephthalate (PET), and polystyrene.
Most ofCanada's petrochemicals and polymers industries are located in Alberta. This is homelo most of Canada's largest and newest plants. These plants rely on access lo relatively low-priced natural gas and ethane (which is extracted from natural gas) available in the province.There are also petrochemical and polymerplants in Ontario and Quebec, but practically nonein other provinces. In the 1970s and 1980s, Ontario and Quebec had more prominentpetrochemical and polymer industries. However, some plants in these provinces that did nothave access to competitively priced feedstocks and low energy prices did not grow, could notmaintain competitiveness, and eventually closed. Examples of plants that closed over the lastfive lo ten years are: Petromonl's ethylene and polyethylene facilities in Varennes. QC; andBasell's polypropylene plants in Sarnia, ON and Montreal. QC.
" VOCsare a precursor to formation of ground level ozone or smog.There is no polypropylene made in Canada.
25

ACKEMINFO
Alberta's petrochemical eihylene plants are the most competitive in Canada. The majorreasons for Alberta's competitive advantage over producers in Ontario as well as some USproducers are:
• access to low-priced natural gas for fuel and fccdsloclc;• ethylene plants have access to ethane, which Is a very cost competitive, energy-efficient,
high ethylene-yielding feedstock;• larger plant capacities versus plants in Ontario;• proximity to large markets in northwest part of North America;• relatively new plants; and• presence of salt caverns forstorage {also available in Ontario's Sarnia valley).
Petrochemical plants in Ontario have remained competitive in different ways. Imperial Oil'sethylene plant accesses competitively priced ethane and propane feedstocks; is integrated tothe Imperial Oil refinery from which it receives some low cost feedstocks and to which it cantransfer some co-products for upgrading; and is integrated to value-adding polyethyleneproduction. Nova has relied on: relatively good economy of scale: integrated relationshipswith Sarnia area refineries (Shell Canada. Suncor, and Imperial Oil); and forward integrationto polyethylene and styrene production. More recently it has been investing to access andutilize more competitively priced natural gas liquids (ethane, propane) from the Marcellusregion, in the northeast United States.
Also, eastern Canadian plants are closer to large markets in the densely populated and heavilyindustrialized north-eastern part of North America. Plants in Ontario and Quebec can reachcustomers in these provinces as well as customers in the northeast US slates with relativelylow transportation costs. Their transportation costs to reach this large regional market wouldbe lowerthan western Canadian and offshore producers.
4.3.2 Inorganic Chemicals
The inorganic chemicals segment encompasses a very broad range of products with uniqueproduction processes, supply and market structures, and competitive environments. It isbeyond the scope this study to delineate all of the chemical-specific information. IVIajorinorganic chemicals made in Canada include; chlorine, caustic, carbon black, sulphuric andother acids, sodium chlorate, and hydrogen peroxide. The markets for most of these productsin North American are mature. Similarly, the production technologies arc mature, sothe R&Dassociated with supply ofthese chcmicals is relatively low. More "applications" research maybe occurring where these chemicals are used (e.g.. pulp and paper, mining). Major sitingfactors in the commodity inorganic chemicals industr>' usually include: low priced electricity;proximity to large customers in the pulp and paper industry and other markets; and proximityto low priced raw materials.
26
ACHEMINFO
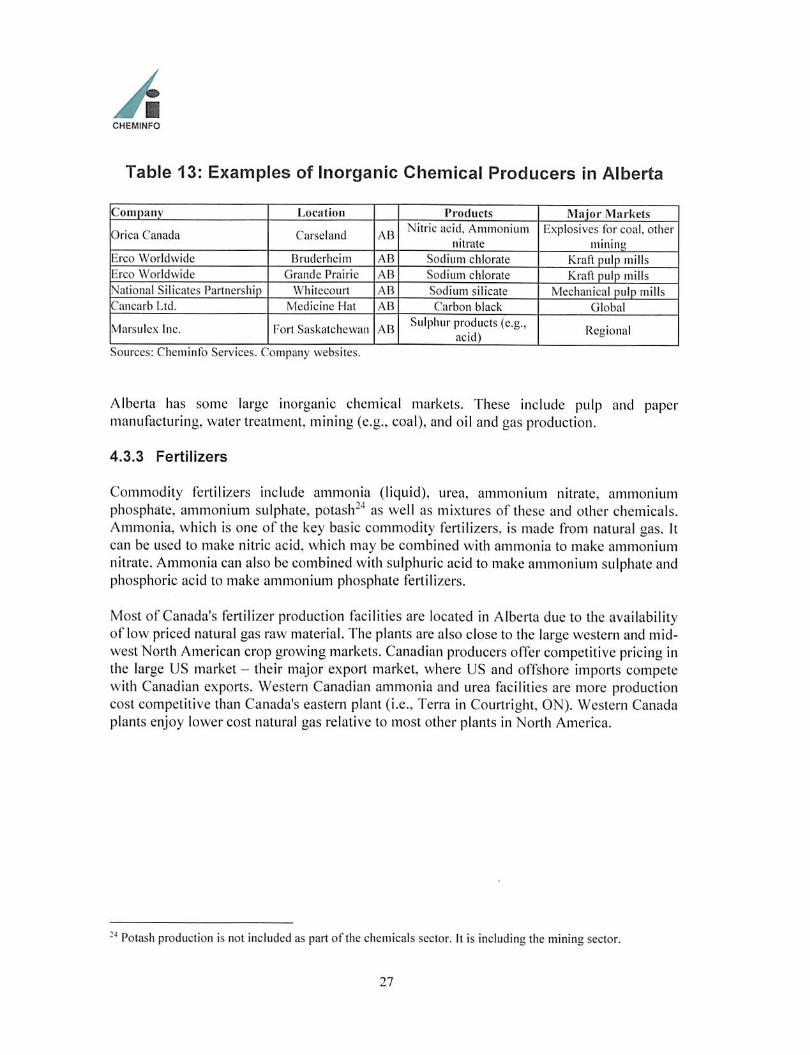
Table 13: Examples of Inorganic Chemical Producers In Alberta
Company Location Products Mnior Markets
Drica Canada Carseland ABNitric acid. Ammonium
nitrate
Explosives for coal, othermininu
-.rco Worldwide Bruderheim AB Sodium chlorate Kran pulp millsiirco Worldwide Grande Prairie AB Sodium chlorate KraA pulp millsS'ational Silicates Partnership Whilecourt AB Sodium silicate Mechanical pulp millsC'ancarb Ltd. Medicine Hat AB Carbon black Global
Vlarsulex Inc. Fort Saskatchewan ABSulphur products (e.g.,
acid)Regional
Sourccs; Cheminfo Services. Company websites.
Alberta has some large inorganic chemical markets. These include pulp and papermanufacturing, water treatment, mining(e.g.. coal), and oil and gas production.
4.3.3 Fertilizers
Commodity fertilizers include ammonia (liquid), urea, ammonium nitrate, ammoniumphosphate, ammonium sulphate, potash"'' as well as mixtures of these and other chemicals.Ammonia, which is one of the key basic commodity fertilizers, is made from natural gas. Itcan be used to make nitric acid, which may be combined with ammonia to make ammoniumnitrate. Ammonia can also becombined with sulphuric acid to makeammonium sulphate andphosphoric acid to make ammonium phosphate fertilizers.
Most of Canada's fertilizer production facilities are located in Alberta due to the availabilityof lowpriced natural gas raw material. The plantsare also close to the large western andmidwest North American crop growing markets. Canadian producers offer competitive pricing inthe large US market - their major export market, where US and offshore imports competewith Canadian exports. Western Canadian ammonia and urea facilities are more productioncost competitive than Canada's eastern plant (i.e., Terra in Courtright. ON). Western Canadaplants enjoy lower cost natural gas relative to most other plants in North America.
•* Potash production isnot included as partof thechemicals sector. It is including the mining sector.
27

ACKEMINFO
Table 14: Canada's Major Fertilizer Producers and Their Products(X denotes production capability)
Company Plant Location Ammonia Urea
Nitric
Acid
Ammonium
Nitrate
Ammonium
Phosphate,Sulphate
Acrium Rcdwatcr, AB X X X X
Aarium Fort Sask. AB X X X
Agrium Carscland, AB X X
Aurium Joffrc, AB X
Cimadian
FertilizersMcdicine Hat, AB X X
Orica Carseland, AB X X
Saskferco Belle Plaine. SK X X
Koch Brandon. MB X X X X X
Terra Industries Courtieht. ON X X X X
Camford Information Services. Product Profiles. Company websites.Additional fertilizer products or mixtures may also be produced at tlie facilities siiown.
4.3.4 Other Basic Organic Chemicals (NAICS 32519)
The Other Basic Organic Cliemicals (NAICS 32519) segment is comprised of establishments,not classified in any other chemical segment, and pritnarily engaged in manufacturing organiccliemicals. Some of the larger products of this segment include: ethanol, other alcohols,acyclic hydrocarbon, esters, and biodiesel. Producers of these chemicals are mostly located inOntario, Qucbec and Alberta. Many are located close to petroleum refineries andpetrochemical plants, which provide feedstocks. However, new bioethanol and biodieselplants are being located in regions where renewable raw materials are available. Theseinclude: corn for bioethanol in Ontario and Quebec; wheat for bioethanol in western Canada;canola in western Canada for biodiesel; and tallow (animal fats) and used cooking oils invarious parts of Canada for making biodiesel.
Most of the markets for these chemicals are mature. An exception has been the Canadianrenewable fuels {i.e., ethanol and biodiesel) market, where numerous new plants have beeninstalled or are in the process of being installed. The ethanol and biodiesel fuel markets havebeen driven by government requirements for minimum levels of renewable fuels in gasoline,diesel and healing oil. The Government of Canada announced its Renewable FuelsRegulations in September 2010 requiring gasoline fuel producers and importers to haveaverage annual renewable fuel contentequal to 5%of the volume of gasoline that theyproduceor import. The 5% requirement for gasoline came into force on December 15. 2010. TheRegulations also include provisions requiring an average 2% renewable fuel content in dieselfuel and heating distillate oil based on annual volumes.-'̂ The Canadian biofuels and otherbiobased chemicals have been supported by financial assistance from governments and their
" Environment Canada. http://ec.gc.ca/energie-energy/default.asp?lang=En&n=828C9342-i
28

ACKEMINFO
agcncies. There have also been biofuel tax exemptions by provinces and the federalgovernment.
4.4 Formulated Products and Speciality Chemicals
Formulated products and speciality chemicals (FPSC) products are typically sold in lowervolumes (e.g., grams, kilograms, tonnes) at relatively high priccs (e.g., $3 to $5,000+ perkilogram, $3,000 lo $5,000,000+ per tonne), require low amounts of energy to make, andoften involve formulation and blending by small and medium-sized facilities. Formulationsarc often custom blended to meet diverse user needs. Products are typically packaged indrums, cans, pails, and bags, and usually delivered to customers in trucks.
A summary table provides context regarding key elements of these segments of the chemicalsindustry.
Surfactants;
Soaps and cleaners;Paints and coatings;Adhesives and sealants;
Toiletries and cosmetics;
Pesticides;Explosives;Dyes and pigments;Oilfield chemicals; and
Lubricants.
These segments represent some of the larger markets in which biochemicals might compete.There may be additional potential markets that have not been reviewed in this report.
It should be noted there are no publicly-available data from Statistics Canada was identifiedthat provide the economic size of the Canadian surfactants, oilfield chemicals and lubricantsindustries. Statistics Canada includes economic activity for these industries within otherchemical segments or other industries.
29

ACHEUINFO
Table 15: Summary Characteristics of the Formulated Products andSpecialty Chemical Segments
Pc^ticidps aad
uthcr
agriculliiratchcmicdlA
I^hflrituctuticah
and medicines
Hainb and
coHtlnsAAdhe^hn ami
$e>ilani!i
Soap andcleaning
coinpoundf)
XcHlet
preparationsl*rindRg inks Kkplosives
Curium
compoundingof rcslns
Other chemicals
(e.g.! Oilfieldcheinleats)
NAICS-> 32532 3254 32<^5I J2552 32561 32562 32S9I 32592 325991 325999
Msflet
Mniciurc
\rnny sc^meius,I>pc8ofproducts.
cu^toiTxrs
Many ;>c^men(Sstypes of products,
ciijioincrs.
Many&egit)enls.
i>pcs ofproducts.
ciLsioniers.
Many iiurkcisegmcnK
I^TTCS ofpnxJuci>.
customers
Many marketsegments.
r)*pcsofproducts,
cuslomers.
Many marketsegments,
tvpes ofproducts,
customers
Many marketsegments.
t)pes ofproducts,
citsromers.
MImng.conxtruciion.
Many inaikctsegments, i>pes
of resin
product:^,cusion>ers.
Mnnv iiiarkei
segmetSs. >anedtype* of
pfoduct.s.customers.
(MiierslnpMostly foreign.Sonic Cnimdian
Mostly foreign.Some C'niudian.
Mo$(lyCaiutdiun.
Sotnu US
firnu
MostlyCanndinn.
Some L'S
fimi^
MostlyCanadian
Some US
finns.
MosllyCanadian.
Some t'S
fimis
Mostlyforeign.Some
Canadian
Mix of foreign.tnd Canadian.
Mosily CanadaSome foretgn
Ml* of foreignrind C*uiudian
IVi^liicuon
processes
Liquid nnJ sofid^blcnJin^
Packagmj! Littleclvimca)
synthcsj^ foractive iii^rcUieni^
in CnnaUa.
Liquid and soltdsMeiiding.
Packa^inj;. I.itl!eclwrnical
synllic&is fornctive ingredients
in Canada.
Liquid ftitdsolids
blending.Packaging.
Liquid andsolids
blendingPackaging.
Liquid afxlsoIkIs
blendingSome spray
drying.Packaging.
Liqtiid andbohd<
blending.Packaging.
Liquid andsolids
blending.Packaging.
Liquid andsolids
blending.Packaging.
Resiits, fillen.
addilises
mi.^lng,extr^islon.
Packaging
Ofganicchcmical
s>'nthesi& Liquidand solids
blending.Packaging.
Miscellaneous
tlpslreamlinkages
SynihciicchcniicaU
Rcscnrch and
dcvclopnieniorgai>i/Anon.s.
SyntheticclicniicaU
pnnJuction foraciive ingivdienis.
Research onJdevelopmentorganizations.
Synilwiic
resliis
Pigit^nlsandd>e*.
liKirganlcdicmicals.
Organicchcmieals
Oiher
chemicals
Packa&inu.
Synlhelicresrns
Pigtnents unddyes
Inorgonicchemicals.
Organicchemicals
Other
ch«micaU.
PackaAinu.
Inorganicdietnicals.
Organicchcmicals.
Oth«r
chemicals.
Inorganicchemicals
Organicchcmicals
Otherchemicals.
Packaging
S) nlhelicresiis
Pigments anddjts.
inorganicclwnncals.
Organicchemicals.
Otlief
chcmicalsl^ckacinc
Inorganicclwinical^
Organicchemicals.
Other
chemicals.
Packaging.
Synthetictcsins.
Oilier organicclwmicals.
Inorganicchcmicals.
MInerfils.
Packaging.
S>ntlKtic resins.Pigments and
dyes.Inorganic
chcinicula.Ocguitic
chemicalsPackaging.
DowiLHti^am
linkages
Agriculnir&lprtxincls
wMcHalcrs,disiribiitorss
Rciallcrs.
famvrs.
Consumers,
coininerclal
estnbUsUments.
Pluinnacies.
Hospitals,doctors,
vcterinanans
WholesalingRetailing
Mnniit'iicdxnng(auio. rail,
fumitiirv. etc.).Const RKliotL
Consumer
VhintenajKC
(iniflicmarkiiigR.
briducs. ere.)
InduHirinl
manufacrunng.Construction.
Consumer
Industrial,
Commercial.
Consumer
Insitulional.
Consumer.
Insririflional.
C ommercial
PublishingPackaging,
^^anu^^tu^ng
Commercial
Consumer.
Coal mining.Other mining.
Plastics
processing.
Ponnulated
cliemical
products.Resins.
Pctn>chcinleals.
ReHnencs.
Oitntnen
upgmdert.Oil Andg^sproducliotv
30

ACHEMINFO
PM(icidc5 »nd
other
agrirultunlchemkals
l^harmacriKinib
ami mcdicineit
Paints and
coatings
Adhesive* and
«calaR&
Soap andcleaninB
compound!!
Toilet
preparationsPrincing jnk« Ktploiivrs
Custom
compoundingof rr»in4
Other chemimis
(e.g.« Oilfieldchemicals)
NAICS^ 32532 3254 32551 32552 32561 32562 32591 32592 325991 325999
Annual
capacity,prodiiclioii.
capacsiy
U3C
No availablequaniily dala.
Fsthnaiedai SO to100 kilotodncs of
active ii>^rcdicnlsprodiKiion p«r
vcar.
N'n Available
i|iiBil(it> dnia
About 30(MOO
kllOtOlllKS of
production peryeor.
No available
quantity data.
Estinittied at-230
kilotohiKS peryear.
No n\&ilablc
qiiniility dnta.
(Unulieds ofkilolomtusor
product.
No nvailabl^
quatitity daifl.
Hundreds of
kilotonnes of
product.
No available
quantity dam.
Tens of
kilotonnes of
product.
No asntlablc
quaiuily dniA.
Miuidreds
kilotonnes of
pioducl.
No available
quanlily data.
Thousnnd& ofkilotonnes of
product
No available
quantity dntn.
Thousands of
kilotonnes ofproduct.
("ompeiituccn>ironirKn(
Canadn relics
UrjMlv on ro(ci|maciive ingredienls
Canada relies
laigcly on foreignpatented active
ingredicnis
Canada lacks
production ofn^v unique
mdu$mal
coating iyp^-
Canada bcks
production oTmony unique
indi;sthal
adhesises and
sealants
Canadian
plaius areismnllcr wtih
poorer
economies oT
scale
Canadian
plants aresmaller with
poorer
economies of
&cale
Canadian
plants aresnuller with
poorer
economies of
scale
Caiuulian
plants in goodlocaiion to
sen e Can.i*la'*
mining »cctor.
Ca;iadian plantsare smaller with
poorer
ecoitomies of
Can^ian plantNarc smaller with
poorer
ecor>omics of
scale
Impons as %ordomcstic
demand
<3010)
58®® KiU 31% MU 75^0 I0««i 10S*«
Provincial
aikl re^iionalimponanccin Cajuda
HIcnditig,packaging carricd
out across
Canada l^r|Wdemands in
Wesiem Caiiacln
Uleiiding.packaging earned
oii( ni05tly inOiiiano anJ
Qtichcc.
Manufacturingspread oiit
across Canada.
Manuiactunng
more
miponant to
Ontario and
Quebec.
Manul^tunngmore iniporiani
to Oniario and
(Jucbcc.
Manufaciunng
more
Important toOntario and
Quebec.
Manufactunng
more
inipofiant toOntario and
Quebec.
IVoduct^
imponanl towestern and
northern
Conudn.
Manufactiinngmore important10 Onlano and
Qucbec.
Manu&cturingmore important
(0 Oniario.
Quebec. Alberto
Sources; Cheminfo Services eslimafes.
Statistics Canada for trade data.
31