Embed Size (px)
Citation preview

3D reflection seismic investigation for mine planning and exploration in the Kevitsa Ni-Cu-PGE
deposit, Northern Finland Alireza Malehmir* (Uppsala University), Christopher Juhlin (Uppsala University), Chris Wijns (First Quantum
Minerals Ltd), Milovan Urosevic (Curtin University), Petri Valasti (First Quantum Minerals Ltd), Emilia
koivisto (University of Helsinki), Ilmo Kukkonen (Geological Survey of Finland), Pekka Heikkinen (University
of Helsinki), Markku Paananen (Geological Survey of Finland)
Summary
A 3D reflection seismic survey was conducted over an area
of about 9 km2 at the Kevitsa Ni-Cu-PGE (platinum group
elements) deposit, northern Finland. The principal objective
of the survey was to image major fault and fracture zones at
depth. Understanding the geometry of these zones is
important for designing a steep open-pit for mining. Initial
processing results suggest that the 3D seismic survey has
been successful in imaging both gently dipping and steeply
dipping reflections as shallow as 50 ms (or about 150 m),
many of which correlate with fault systems and lithological
contacts observed at the surface. Several new target areas
can be identified in the seismic data that require further
investigations for their mineralization potential.
Introduction
Although it is generally believed that future mining is
underground mining, there are probably many open-pittable
deposits buried under shallow cover of 20-300 m. This
thickness can still render the deposit blind to conventional
geochemical and geophysical measurements at surface. To
be successful in exploration, extensive geological and
geophysical studies are required to thoroughly model
geological structures hosting the ore at depth and in three-
dimension. Although a wealth of drill holes is eventually
required, by filling the gap, reflection seismic methods can
be used to partly reduce the drilling cost by optimally
drilling only in key or strategically important areas. There
are not many published accounts of the use of 3D reflection
seismic methods in mine planning in the crystalline
environment, especially in Europe. 3D reflection seismic
methods have been used in South Africa with encouraging
results, allowing imaging of fault systems that in turn
control the geometry of the ore horizon (Stevenson et al.,
2003). Nevertheless, 3D reflection seismic surveys have
been used for the exploration of deep-seated deposits with
several examples from Canada and Australia (e.g.,
Milkereit et al., 2000; Adam et al., 2003; Malehmir and
Bellefleur, 2009; Harrison and Urosevic, 2009).
In this study, we present preliminary results from a 3D
reflection seismic survey conducted over the Ni-Cu-PGE
Kevitsa deposit, northern Finland (Figure 1). Kevitsa is a
large deposit with measured and indicated resources of 165
million tones grading 0.30% nickel, and 0.42% copper.
Mining is planned to start with an open pit. The stripping
ratio is expected to be in the order of 4:1. The main
objectives of this study are (i) to evaluate the capability of
the 3D reflection seismic methods to image fracture and
fault systems at and near the Kevitsa deposit, which is
important for designing the final geometry of the open pit,
and (ii) to identify new target areas for deep (< 1.5 km)
exploration of both Ni-PGE and base-metal mineralization.
Kevitsa deposit and general geology
The Kevitsa deposit is located in northern Finland in the
central Lappland, comprised of Paleoproterozoic basement
gneisses, greenstone belts and major igneous intrusions. At
about 2.05 Ga, igneous activity generated a series of
layered intrusions, one of which, the Kevitsa intrusion,
hosts the Kevitsa deposit (pers., comm., Tapani Mutanen,
1997). The Kevitsa intrusion is an oval shape intrusion
oriented NE-SW with long axis of 7 km (Figure 1). The
bedrock geology comprises mafic to ultramafic rocks,
including olivine pyroxenite, peridotite, gabbro and
granophyre. The intrusion is characterized by internal
layering defined by changes in composition resulting from
successive pulses of magma and not simple differentiation
of a single pulse.
Figure 1: Geological map (modified from GTK) of the Kevitsa Ni-
Cu-PGE deposit, showing locations of the previous 2D seismic profiles (E2-E5) and the 3D survey area (boxed area).
© 2011 SEGSEG San Antonio 2011 Annual Meeting 12371237

3D reflection seismics for mine planning and exploration
Mineralization in the Kevitsa deposit occurs within an
olivine-pyroxenite zone of the Kevitsa intrusion, which
contains up to 5% sulfide, the majority of which is found as
granular masses interstitial to the silicate mineral crystals.
The silicate mineralogy is predominantly composed of
olivine and orthopyroxene with finely disseminated
sulfides. The sulfides comprise pyrrhotite (manily),
pentlandite, chalcopyrite, troilite and pyrite. Other copper
and nickel sulfides include cubanite, millerite and
heazlewoodite, with minor associated gold, cobalt and PGE
concentrations (pers. comm., KMOY geologists).
Data acquisition and processing
Prior to the 3D data acquisition, the Geological Survey of
Finland through a nation-wide seismic program, the HIRE
project, acquired four short (each about 4-6 km long) high-
resolution seismic profiles (Figure 1). The 2D seismic
profiles successfully allowed imaging general structures of
the Kevitsa deposits. In order to image the very shallow
structures (< 1 km) of the deposit for mine planning and
potentially to find new targets for detailed exploration and
increasing the mine-life, a 3D seismic survey was
conducted over an area of about 9 km2
in winter 2010.
Using two recording systems (a Seistronix, operated by
HiSeis and a Sercel 408, operated by Uppsala University)
with a joint capability of recording of up to 1000 channels,
nearly 3000 shot points were fired using an hydraulic
hammer.
Each shot point consisted of three sweeps which were
decoded and stacked together during the data processing to
increase the S/N (Park et al., 1996). In areas with no source
accessibility, an explosive source was used to increase the
fold. The 3D survey area was divided into 9 swaths. The
swaths were advanced in the following way: when moving
north the receiver lines were overlapped by 50% while
when moving east shot lines were overlapped 50%. In that
way a uniform and smooth coverage was achieved.
Receiver and source spacing were 15 m and 45 m,
respectively. In total 35 receiver lines each 70 m apart and
34 source lines each 80 m apart were used to allow a
nominal receiver and source density of about 800 and 400
per square kilometer to be achieved, respectively (Figure
2).
Significant effort was made into the decoding of the
seismic sweeps. Noisy and low-quality sweeps were
rejected during the decoding. The seismic data are
generally good to excellent with strong reflections
occasionally observed in a few raw shot gathers. Prior to
the main processing work, a series of tests was conducted
to obtain an optimum CDP bin size. First, seismic data
were binned using a 15 by 15 m bin size to quickly evaluate
the data quality in the resulting seismic cube. Later, in
order to increase the seismic resolution, the bin size was
reduced to 10 by 10 m, leading to an average fold coverage
of about 60 in most part of the seismic cube, except at its
margins (Figure 2). The main contactor performed the steps
mentioned above.
Key processing steps
Several recent seismic data processing studies suggest that
a prestack DMO and poststack migration algorithm can be
useful in imaging complex structures of major mining areas
and allow diffractions to be preserved that might originate
from faults or smaller bodies like mineralization zones
(e.g., Adam et al., 2003; Urosevic et al., 2005; Malehmir
and Bellefleur, 2009). We used this strategy for the
processing of the data. The key processing steps prior to
stacking the data involved:
• Geometry check, trace editing and polarity reversal
• Ambient and coherent noise attenuation
• Refraction and residual static corrections
• Velocity analysis
• NMO and DMO corrections.
Figure 3 shows an example shot gather recorded into two
receiver lines after various processing steps. Frequency and
surface-consistent deconvolution filters were designed to
obtain the highest frequency content with useful signal.
Surface consistent spiking deconvolution using a 100 ms
operator length helped to improve resolution and to
compensate for the effects of variable coupling conditions
due to source and receivers being placed on exposed
bedrock or overburden.
Obtaining good refraction static corrections was demanding
due to the high topographic relief combined with highly
Figure 2: CDP fold coverage, shots and receiver locations of the Kevitsa 3D survey.
© 2011 SEGSEG San Antonio 2011 Annual Meeting 12381238

3D reflection seismics for mine planning and exploration
fractured and broken rocks near the surface. A careful
inspection of a few shot gathers with clear refracted arrivals
allowed us to identify two thick (about 80-120 m) low-
velocity zones in the area. The identification of these
refractors along with a series of geotechnical boreholes
were helpful in examining and validating the estimated
refraction static model. The 3D refraction static corrections
were estimated using nearly 2,500,000 first arrivals
automatically picked, but manually inspected. Resulting
source and receiver static corrections including the effects
of large topographic variations, varies from 0 up to 80 ms.
Near-surface travel time distortions were largely removed
after applying refraction static corrections and the
coherency of reflections were markedly improved (Figure
3).
The stacked volume is highly sensitive to lateral and
vertical velocity changes. An extensive wealth of borehole
sonic seismic data in the study area already suggested a
large velocity variation in the bedrock ranging from 5300
m/s to as high as 7400 m/s (Figure 4). To obtain an
optimum velocity function, we ran a series of iterative
velocity analyses, interactively controlled by inspecting
stacked velocity panels. Before DMO corrections, surface-
consistent residual statics were estimated using only NMO
corrected gathers. DMO corrections were applied to obtain
a dip-independent stacking velocity. This improved the
continuity of dipping reflections and successfully allowed
us to image a series of diffraction type signals by increasing
the signal-to-noise ratio and simultaneously imaging crossing seismic events.
Preliminary results and interpretations
Figure 5 shows two time-slices through the unmigrated
seismic cube at 150 and 200 ms, respectively. The time-
slice at 150 ms clearly shows a series of parallel reflections
that are crosscut by a set of reflections of a different
orientation. A curved shape seismic signal in the middle of
the time-slice seems to be a diffraction with a controlled
scattering directivity towards the southwest. Similar to the
time-slice at 150 ms, the time-slice at 200 ms also shows a
series of parallel reflections in the northwestern part of the
cube crosscut by a series of almost northwest-southeast
striking reflections. A bright-spot seismic anomaly in the
southeastern part of the seismic cube attracts immediate
attention and might be a potential target for further
investigations. Since the seismic data is not yet migrated, at
this stage neither the relationship between these reflections
nor their true geometry is clear.
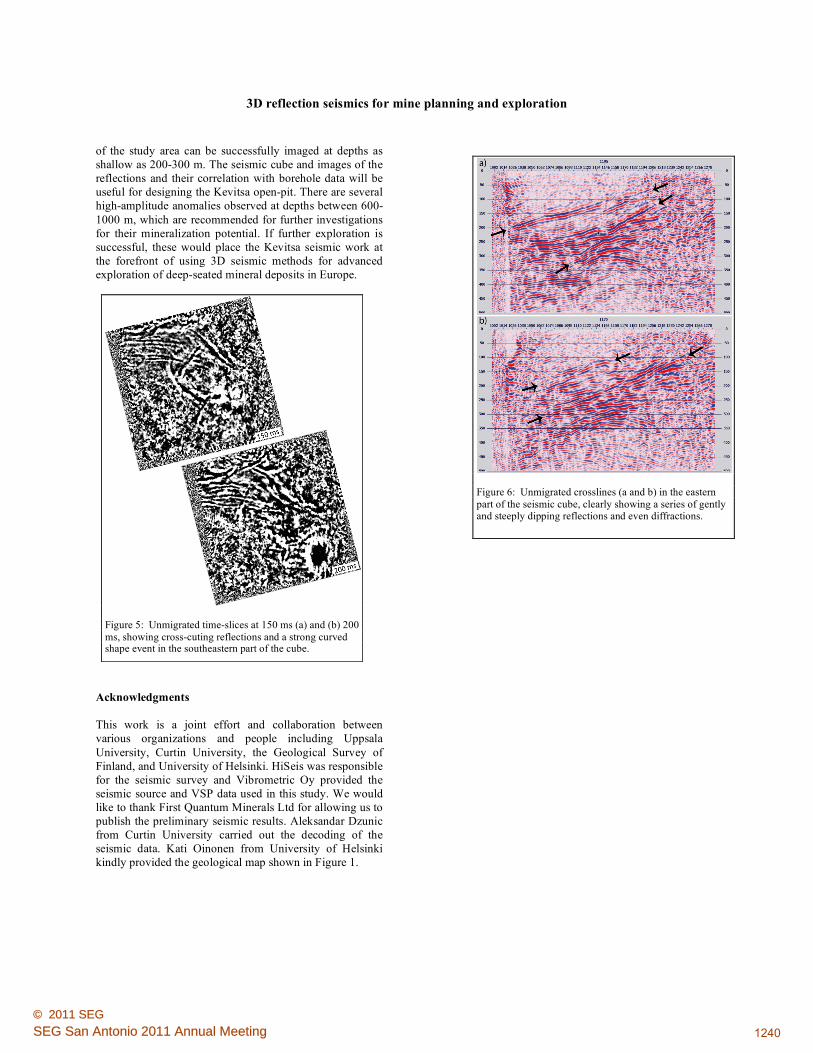
Figure 6 show two unmigrated crossline sections clearly
indicating complex geological structures at this location
with reflections with various dips and a strong diffraction at
about 300 ms.
Conclusions
Reflection seismic results from the Kevitsa Ni-Cu-PGE
demonstrate that the complex structures and fault systems
Figure 3: An example shot record (shown for two reciver
lines) before (a) and after (b) various processing steps.
Note the increase in the signal quality in (b) and specially the reflection marked by the arrows.
Figure 4: Sonic and VSP data indicate a large velocity variation within the bedrock in the Kevitsa area.
© 2011 SEGSEG San Antonio 2011 Annual Meeting 12391239
3D reflection seismics for mine planning and exploration
of the study area can be successfully imaged at depths as
shallow as 200-300 m. The seismic cube and images of the
reflections and their correlation with borehole data will be
useful for designing the Kevitsa open-pit. There are several
high-amplitude anomalies observed at depths between 600-
1000 m, which are recommended for further investigations
for their mineralization potential. If further exploration is
successful, these would place the Kevitsa seismic work at
the forefront of using 3D seismic methods for advanced
exploration of deep-seated mineral deposits in Europe.
Acknowledgments
This work is a joint effort and collaboration between
various organizations and people including Uppsala
University, Curtin University, the Geological Survey of
Finland, and University of Helsinki. HiSeis was responsible
for the seismic survey and Vibrometric Oy provided the
seismic source and VSP data used in this study. We would
like to thank First Quantum Minerals Ltd for allowing us to
publish the preliminary seismic results. Aleksandar Dzunic
from Curtin University carried out the decoding of the
seismic data. Kati Oinonen from University of Helsinki
kindly provided the geological map shown in Figure 1.
Figure 5: Unmigrated time-slices at 150 ms (a) and (b) 200
ms, showing cross-cuting reflections and a strong curved shape event in the southeastern part of the cube.
Figure 6: Unmigrated crosslines (a and b) in the eastern
part of the seismic cube, clearly showing a series of gently and steeply dipping reflections and even diffractions.
© 2011 SEGSEG San Antonio 2011 Annual Meeting 12401240

EDITED REFERENCES
Note: This reference list is a copy-edited version of the reference list submitted by the author. Reference lists for the 2011
SEG Technical Program Expanded Abstracts have been copy edited so that references provided with the online metadata for
each paper will achieve a high degree of linking to cited sources that appear on the Web.
REFERENCES
Adam, E., G. Perron, G. Arnold, L. Matthews, and B. Milkeriet, 2003, 3D seismic imaging for VMS
deposit exploration, Matagami, Quebec, in D. W. Eaton, B. Milkereit, and M. H. Salisbury, eds.,
Hardrock seismic exploration: SEG, 229–246.
Harrison, C., and M. Urosevic, 2009, Toward direct detection of gold bearing formations using seismic
methods, St. Ives gold camp, western Australia: ASEG Conference.
Milkereit, B., E. K. Berrer, A. R. King, A. H. Watts, B. Roberts, E. Adam, D. W. Eaton, J. Wu, and M. H.
Salisbury, 2000, Development of 3D seismic exploration technology for deep nickel-copper deposits
— A case history from the Sudbury basin, Canada: Geophysics, 65, 1890–1899,
doi:10.1190/1.1444873.
Malehmir, A., and G. Bellefleur, 2009, 3D seismic reflection imaging of volcanic-hosted massive sulfide
deposits, insights from reprocessing of the Halfmile Lake data, New Brunswick, Canada:
Geophysics, 74, B209–B219. doi:10.1190/1.3230495
Mutanen, T., 1997, Geology and ore petrology of the Akanvaara and Koitelainen mafic layered intrusions
and the Keivitsa-Satovaara layered complex, northern Finland: arkisto.gsf.fi/bul/BT395.pdf.
Park, C. B., R. D. Miller, D. W. Steeples, and R. A. Black, 1996, Swept impact seismic technique (SIST):
Geophysics, 61, 1789–1803, doi:10.1190/1.1444095.
Pretorius, C. C., M. R. Muller, M. Larroque, and C. Wilkins, 2003, A review of 16 years of hardrock
seismics on the Kaapvaal Craton, in D.W. Eaton, B. Milkereit, and M. H. Salisbury, eds., Hardrock
seismic exploration: SEG, 247–268.
Stevenson, F., R. M. A. Higgs, and R. J. Durrheim, 2003, Seismic imaging of precious and base-metal
deposits in Southern Africa, in D. W. Eaton, B. Milkereit, and M. H. Salisbury, eds., Hardrock
seismic exploration: SEG, 141–156.
Urosevic, M., E. Stolz, and S. Massey, 2005, Seismic exploration of complex mineral deposits — Yilgarn
Craton, Western Australia: 67th Annual International Conference and Exhibition, EAGE, Extended
Abstracts, Z99.
© 2011 SEGSEG San Antonio 2011 Annual Meeting 12411241