Embed Size (px)
Citation preview
To meet a test indicator for grades 3-8 and 10, at least 75% of students tested must score proficient or higher
on that test. Other indicator requirements are: 11th grade Ohio Graduation Tests, 85%; Attendance Rate, 93%; Graduation Rate, 90%.
StateIndicators
2011-2012 School Year Report Card
The state requirement is 75 percent
The state requirement is 75 percent
The state requirement is 75 percent
The state requirement is 75 percent
The state requirement is 75 percent
The state requirement is 85 percent
The state requirement is 93 percent
The state requirement is 90 percent
3rd Grade Achievement1. Reading2. Mathematics
4th Grade Achievement3. Reading4. Mathematics
5th Grade Achievement5. Reading6. Mathematics7. Science
6th Grade Achievement 8. Reading 9. Mathematics
7th Grade Achievement10. Reading11. Mathematics
8th Grade Achievement12. Reading13. Mathematics14. Science
Ohio Graduation Tests (10th Grade)
15. Reading16. Mathematics17. Writing18. Science19. Social Studies
Ohio Graduation Tests (11th Grade)
20. Reading21. Mathematics22. Writing23. Science24. Social Studies
Attendance Rate25. All Grades
2010-11 Four-Year Graduation Rate26. School
The state requirement is 75 percent
The state requirement is 75 percent
The six designations are • Excellent with Distinction • Excellent • Effective • Continuous Improvement • Academic Watch • Academic Emergency
Value-AddedAdequateYearly Progress
Performance Index
Indicators
The School Report Card for the 2011-2012 school year shows the progress schools have made based on four measures of performance.
The combination of the four measures is the basis for assigning state designations to districts, buildings and community schools.
Your School’sDesignation:
PerformanceIndex
State Indicators Performance
Index
On the Web: reportcard.ohio.gov
StateIndicators
(0-120 points)
*
Your School2011-2012
Your District
2011-2012State
2011-2012
Percentage of Students at and above the Proficient Level
Any result at or above the state standard is indicated by a .-- = Not Calculated/Not Displayed when there are fewer than 10 in the group.
Cumulative results for students who took the tests as 10th or 11th graders.*
Current Principal: Current Superintendent:
Value-AddedComponentScore
� = met+ = above– = below
Value-AddedMeasure
Value-AddedComponentScore
� = met+ = above– = below
Value-AddedMeasure
AYP
IRN# 029413
Paul L Dunbar Elementary School @ Kentucky3805 Terrett Ave, Cleveland, OH 44113-2847—Grades P,K-8—Cuyahoga County
Academic Watch 2
Not Met
= Met
Eric S. Gordon (216) 574-8000 Kathy A. Baker (216) 476-6810
Number of State Indicators
Met out of 13
74.8
56.7% 54.7%
57.9%46.4%
47.0%27.6%32.9%
64.2%44.6%
48.8%37.1%
58.7%49.8%30.9%
63.1%55.5%68.4%44.4%51.0%
79.0% 79.8%
83.3%78.4%
76.8%67.5%72.5%
86.7%79.9%
79.5%73.6%
83.0%79.6%71.5%
86.0%82.6%87.1%76.7%81.6%
-- --
84.6%84.6%
41.7%25.0%16.7%
56.3%37.5%
31.3%37.5%
41.7%50.0%16.7%
----------
80.9%72.8%83.1%61.6%66.8%
92.6%89.9%93.0%85.6%87.8%
----------
91.1% 94.5%92.6%
56.0% 79.7%--
2
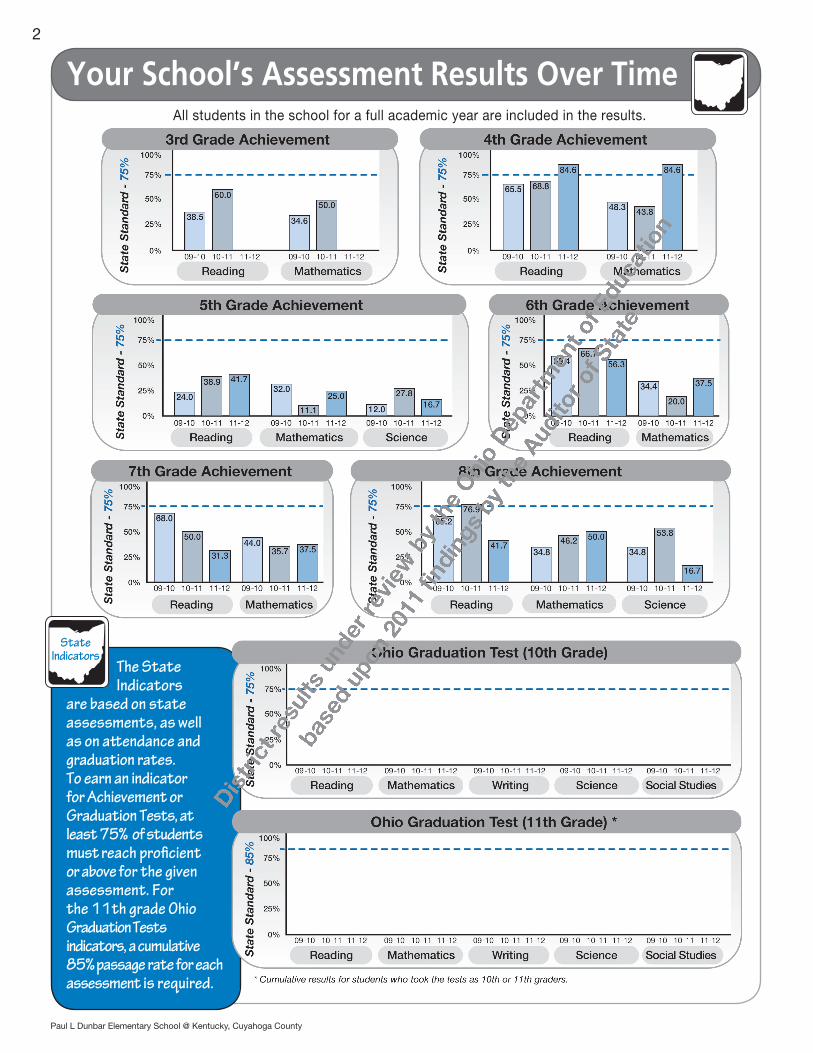
All students in the school for a full academic year are included in the results.
The State Indicators
are based on state assessments, as well as on attendance and graduation rates. To earn an indicator for Achievement or Graduation Tests, at least 75% of students must reach proficient or above for the given assessment. For the 11th grade Ohio Graduation Tests indicators, a cumulative 85% passage rate for each assessment is required.
StateIndicators
Your School’s Assessment Results Over Time
Paul L Dunbar Elementary School @ Kentucky, Cuyahoga County
3
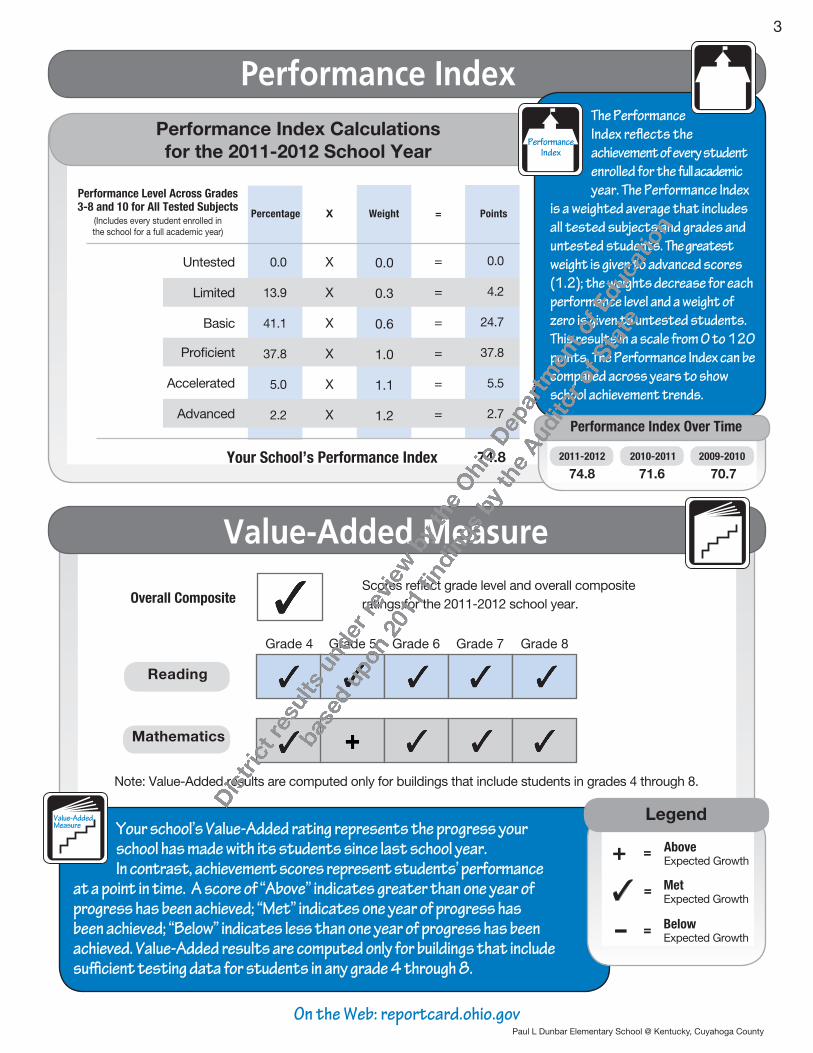
Overall CompositeScores reflect grade level and overall composite ratings for the 2011-2012 school year.
Value-Added Measure
Grade 4 Grade 5 Grade 6 Grade 7 Grade 8
Reading
Mathematics
On the Web: reportcard.ohio.gov
Your school’s Value-Added rating represents the progress your school has made with its students since last school year. In contrast, achievement scores represent students’ performance
at a point in time. A score of “Above” indicates greater than one year of progress has been achieved; “Met” indicates one year of progress has been achieved; “Below” indicates less than one year of progress has been achieved. Value-Added results are computed only for buildings that include sufficient testing data for students in any grade 4 through 8.
Met Expected Growth
=
- Below Expected Growth
=
+ Above Expected Growth
=
Legend
Performance Index
Performance Level Across Grades 3-8 and 10 for All Tested Subjects
(Includes every student enrolled in the school for a full academic year)
X =WeightPercentage Points
Your School’s Performance Index
Performance Index Calculations for the 2011-2012 School Year
0.0
0.3
0.6
1.0
1.1
1.2
Untested
Limited
Basic
Proficient
Accelerated
Advanced
X
X
X
X
X
X
=
=
=
=
=
=
The Performance Index reflects the achievement of every student enrolled for the full academic year. The Performance Index
is a weighted average that includes all tested subjects and grades and untested students. The greatest weight is given to advanced scores (1.2); the weights decrease for each performance level and a weight of zero is given to untested students. This results in a scale from 0 to 120 points. The Performance Index can be compared across years to show school achievement trends.
PerformanceIndex
2011-2012 2010-2011 2009-2010
Performance Index Over Time
Note: Value-Added results are computed only for buildings that include students in grades 4 through 8.
Value-AddedComponentScore
� = met+ = above– = below
Value-AddedComponentScore
� = met+ = above– = below
Value-AddedMeasure
Paul L Dunbar Elementary School @ Kentucky, Cuyahoga County
0.0
13.9
41.1
37.8
5.0
2.2
0.0
4.2
24.7
37.8
5.5
2.7
74.874.8 71.6 70.7
AllStudents
AllStudents
Asian orPacific Islander
Asian orPacific Islander
Econ.Disadvtgd
Econ.Disadvtgd
Multi-Racial Multi-RacialHispanic HispanicStudents with
DisabilitiesStudents with
DisabilitiesLimited English
ProficientLimited English
ProficientWhite,
non-HispanicWhite,
non-Hispanic
American Indian/Alaska Native
American Indian/Alaska Native
Black,non-Hispanic
Black,non-Hispanic
4
Grades 3-8 and 10Reading
andMathematics
Adequate YearlyProgress
All Studen
ts
Perc
ent P
rofic
ient
Perc
ent T
este
d
Economica
lly Disa
dvantaged
Asian/Pacifi
c Isla
nder
Black, n
on-Hisp
anic
America
n Indian/Alask
a Native
Hispanic
Multi-Racia
l
White, n
on-Hisp
anic
Students
with Disa
bilities
Limite
d English
Proficie
nt
Reading
Mathematics
Reading
Mathematics
Graduation Rate
Attendance Rate*
Legend
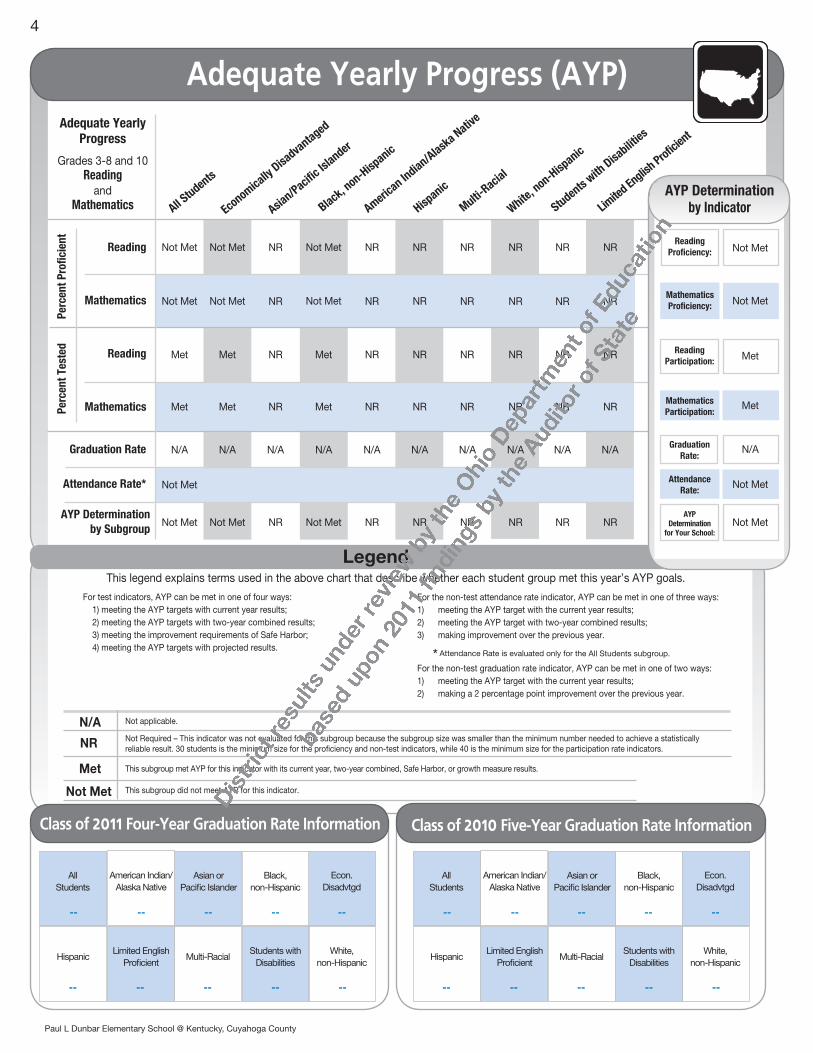
Adequate Yearly Progress (AYP)
ReadingProficiency:
MathematicsProficiency:
ReadingParticipation:
MathematicsParticipation:
AttendanceRate:
AYP Determination by Indicator
GraduationRate:
AYP Determination by Subgroup
AYP Determination
for Your School:
This legend explains terms used in the above chart that describe whether each student group met this year’s AYP goals.
For test indicators, AYP can be met in one of four ways: 1) meeting the AYP targets with current year results; 2) meeting the AYP targets with two-year combined results; 3) meeting the improvement requirements of Safe Harbor; 4) meeting the AYP targets with projected results.
Class of 2010 Five-Year Graduation Rate Information
For the non-test attendance rate indicator, AYP can be met in one of three ways:1) meeting the AYP target with the current year results;2) meeting the AYP target with two-year combined results;3) making improvement over the previous year.
For the non-test graduation rate indicator, AYP can be met in one of two ways:1) meeting the AYP target with the current year results;2) making a 2 percentage point improvement over the previous year.
Attendance Rate is evaluated only for the All Students subgroup.*
NR
N/A
Met
Not Met
Not Required – This indicator was not evaluated for this subgroup because the subgroup size was smaller than the minimum number needed to achieve a statistically reliable result. 30 students is the minimum size for the proficiency and non-test indicators, while 40 is the minimum size for the participation rate indicators.
This subgroup met AYP for this indicator with its current year, two-year combined, Safe Harbor, or growth measure results.
This subgroup did not meet AYP for this indicator.
Not applicable.
Class of 2011 Four-Year Graduation Rate Information
Not Met
Not Met
Met
Not Met
Not Met
Met
NR
NR
NR
Not Met
Not Met
Met
NR
NR
NR
NR
NR
NR
NR
NR
NR
NR
NR
NR
NR
NR
NR
NR
NR
NR
Met Met NR Met NR NR NR NR NR NR
Not Met Not Met NR Not Met NR NR NR NR NR NR
N/A N/A N/A N/A N/A N/A N/A N/A N/A N/A
Not Met
Not Met
Met
Met
N/A
Not Met
Not Met
Paul L Dunbar Elementary School @ Kentucky, Cuyahoga County
Not Met
----
----
----
----
----
----
----
----
----
----
-- = Not Calculated/Not Displayed when there are fewer than 10 in the group.
ReadingWritingMathematicsScienceSocial Studies
ReadingWritingMathematicsScienceSocial Studies
ReadingWritingMathematicsScienceSocial Studies
ReadingWritingMathematicsScienceSocial Studies
ReadingWritingMathematicsScienceSocial Studies
Black,non-Hispanic
AmericanIndian/
Alaska Native
Asian orPacificIslander
Hispanic Multi-Racial
White,non-Hispanic
Non-DisabledStudents
Studentswith
DisabilitiesMigrant
Non-Econ.
Disadvtgd
Econ.Disadvtgd
LimitedEnglish
ProficientFemale Male
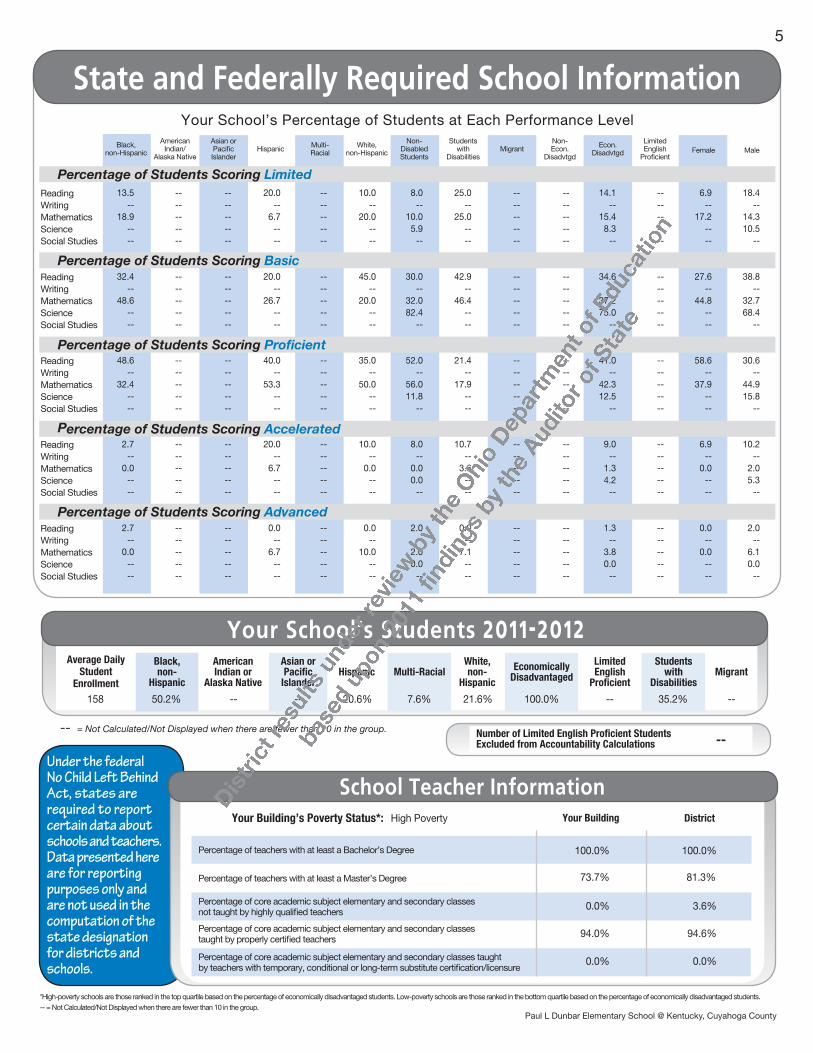
Your School’s Percentage of Students at Each Performance Level
Percentage of Students Scoring Limited
Percentage of Students Scoring Basic
Percentage of Students Scoring Proficient
Percentage of Students Scoring Accelerated
Percentage of Students Scoring Advanced
State and Federally Required School Information5
Number of Limited English Proficient Students Excluded from Accountability Calculations
Average DailyStudent
Enrollment
Black,non-
Hispanic
AmericanIndian or
Alaska Native
Asian orPacific
IslanderHispanic Multi-Racial
White,non-
Hispanic
Studentswith
DisabilitiesMigrantEconomically
Disadvantaged
LimitedEnglish
Proficient
Your School’s Students 2011-2012
Under the federal No Child Left Behind Act, states are required to report certain data about schools and teachers. Data presented here are for reporting purposes only and are not used in the computation of the state designation for districts and schools.
Your BuildingYour Building’s Poverty Status*: District
Percentage of teachers with at least a Bachelor’s Degree
Percentage of teachers with at least a Master’s Degree
Percentage of core academic subject elementary and secondary classes not taught by highly qualified teachers
Percentage of core academic subject elementary and secondary classes taught by properly certified teachers
Percentage of core academic subject elementary and secondary classes taught by teachers with temporary, conditional or long-term substitute certification/licensure
School Teacher Information
*High-poverty schools are those ranked in the top quartile based on the percentage of economically disadvantaged students. Low-poverty schools are those ranked in the bottom quartile based on the percentage of economically disadvantaged students.-- = Not Calculated/Not Displayed when there are fewer than 10 in the group.
158
--
Paul L Dunbar Elementary School @ Kentucky, Cuyahoga County
High Poverty
13.5--
18.9----
32.4--
48.6----
48.6--
32.4----
2.7--
0.0----
2.7--
0.0----
----------
----------
----------
----------
----------
----------
----------
----------
----------
----------
20.0--
6.7----
20.0--
26.7----
40.0--
53.3----
20.0--
6.7----
0.0--
6.7----
----------
----------
----------
----------
----------
10.0--
20.0----
45.0--
20.0----
35.0--
50.0----
10.0--
0.0----
0.0--
10.0----
8.0--
10.05.9
--
30.0--
32.082.4
--
52.0--
56.011.8
--
8.0--
0.00.0
--
2.0--
2.00.0
--
25.0--
25.0----
42.9--
46.4----
21.4--
17.9----
10.7--
3.6----
0.0--
7.1----
----------
----------
----------
----------
----------
----------
----------
----------
----------
----------
14.1--
15.48.3
--
34.6--
37.275.0
--
41.0--
42.312.5
--
9.0--
1.34.2
--
1.3--
3.80.0
--
----------
----------
----------
----------
----------
6.9--
17.2----
27.6--
44.8----
58.6--
37.9----
6.9--
0.0----
0.0--
0.0----
18.4--
14.310.5
--
38.8--
32.768.4
--
30.6--
44.915.8
--
10.2--
2.05.3
--
2.0--
6.10.0
--
50.2% -- -- 20.6% 7.6% 21.6% 100.0% -- 35.2% --
100.0% 100.0%
73.7% 81.3%
0.0% 3.6%
94.0% 94.6%
0.0% 0.0%
6
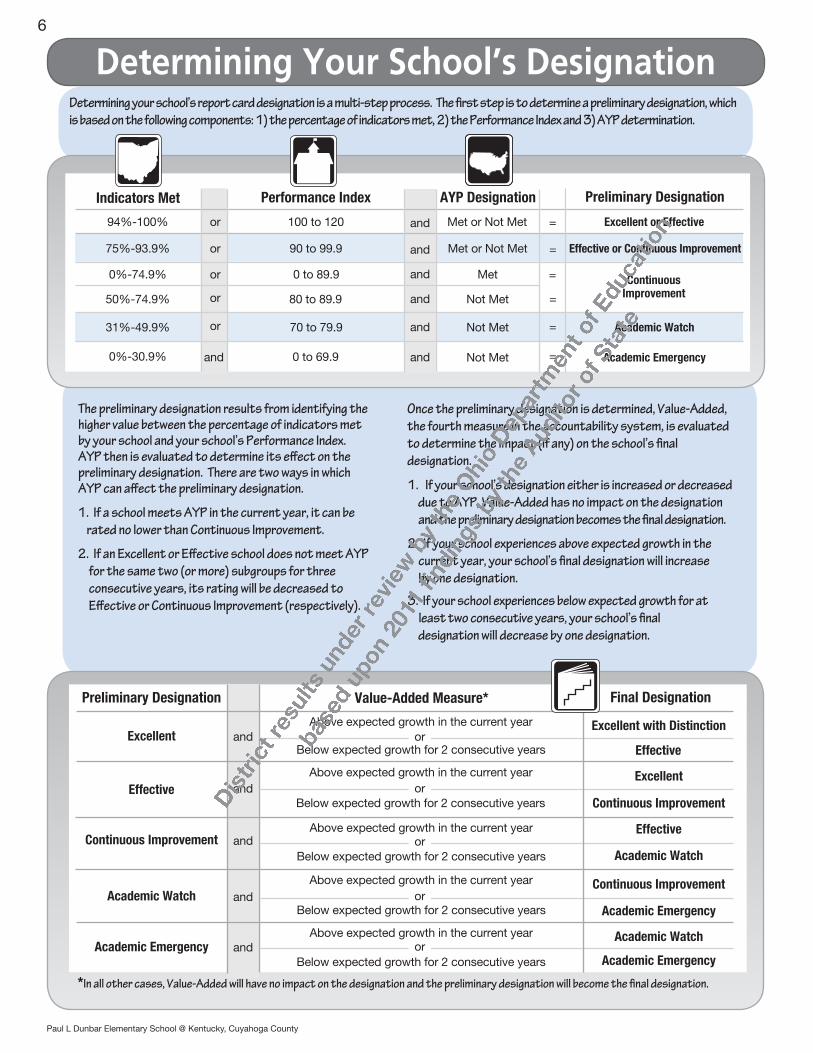
1. If a school meets AYP in the current year, it can be rated no lower than Continuous Improvement.
2. If an Excellent or Effective school does not meet AYP for the same two (or more) subgroups for three consecutive years, its rating will be decreased to Effective or Continuous Improvement (respectively).
Once the preliminary designation is determined, Value-Added, the fourth measure in the accountability system, is evaluated to determine the impact (if any) on the school’s final designation.
1. If your school’s designation either is increased or decreased due to AYP, Value-Added has no impact on the designation and the preliminary designation becomes the final designation.
2. If your school experiences above expected growth in the current year, your school’s final designation will increase by one designation.
3. If your school experiences below expected growth for at least two consecutive years, your school’s final designation will decrease by one designation.
The preliminary designation results from identifying the higher value between the percentage of indicators met by your school and your school’s Performance Index. AYP then is evaluated to determine its effect on the preliminary designation. There are two ways in which AYP can affect the preliminary designation.
Determining your school’s report card designation is a multi-step process. The first step is to determine a preliminary designation, which is based on the following components: 1) the percentage of indicators met, 2) the Performance Index and 3) AYP determination.
Determining Your School’s Designation
Indicators Met Performance Index AYP Designation Preliminary Designation
94%-100% 100 to 120or
or
or
or
or
and
and
and
and
and
andand
Met or Not Met Excellent or Effective
75%-93.9%
0%-74.9%
50%-74.9%
31%-49.9%
0%-30.9%
90 to 99.9
80 to 89.9
0 to 89.9
70 to 79.9
0 to 69.9
Met or Not Met
Not Met
Not Met
Not Met
Met
Effective or Continuous Improvement
Academic Watch
Academic Emergency
ContinuousImprovement
=
=
=
=
=
=
Preliminary Designation Value-Added Measure* Final Designation
Excellent
Effective
Continuous Improvement
Academic Watch
Academic Emergency
Above expected growth in the current yearand
and
and
and
and
Excellent with Distinction
Effective
Above expected growth in the current year
Above expected growth in the current year
Above expected growth in the current year
Above expected growth in the current year
Excellent
Continuous Improvement
Academic Emergency
Academic Watch
Academic Emergency
Continuous Improvement
Academic Watch
Effective
*In all other cases, Value-Added will have no impact on the designation and the preliminary designation will become the final designation.
or
or
or
or
or
Value-AddedComponentScore
� = met+ = above– = below
Below expected growth for 2 consecutive years
Below expected growth for 2 consecutive years
Below expected growth for 2 consecutive years
Below expected growth for 2 consecutive years
Below expected growth for 2 consecutive years
Paul L Dunbar Elementary School @ Kentucky, Cuyahoga County
7
The National Assessment of Educational Progress (NAEP), often referred to as “The Nation’s Report Card,” is the only nationally representative and continuing assessment that enables the comparison of performance in Ohio and other states in various subject areas. Schools and students within each state are selected randomly to be a part of the assessment. Not all students in the state or in a particular school take the assessment. Data are reported at the state level only, and there are no individual student or even school summary results. The assessments are conducted in mathematics, reading, science, writing, the arts, civics, economics, geography and U.S. history.
To view Ohio’s most recent NAEP results, go to:
and search for key word “NAEP”
http://education.ohio.gov
Paul L Dunbar Elementary School @ Kentucky, Cuyahoga County


![[Cvl] SNI 03 2847 2002 Dilengkapi Penjelasan](https://img.dokumen.tips/doc/110x75/55cf97cd550346d03393bb61/cvl-sni-03-2847-2002-dilengkapi-penjelasan.jpg)