Embed Size (px)
Citation preview
Stephen F. Austin State University Stephen F. Austin State University
SFA ScholarWorks SFA ScholarWorks
Electronic Theses and Dissertations
5-2019
FACIES AND DIAGENESIS ANALYSES OF THE FORT TERRETT FACIES AND DIAGENESIS ANALYSES OF THE FORT TERRETT
FORMATION OF THE LOWER CRETACEOUS EDWARDS GROUP, FORMATION OF THE LOWER CRETACEOUS EDWARDS GROUP,
NEAR JUNCTION, TEXAS NEAR JUNCTION, TEXAS
Richard Alden Urwin Jr. Stephen F. Austin State University, [email protected]
Follow this and additional works at: https://scholarworks.sfasu.edu/etds
Part of the Geology Commons, Oil, Gas, and Energy Commons, Sedimentology Commons, and the
Stratigraphy Commons
Tell us how this article helped you.
Repository Citation Repository Citation Urwin, Richard Alden Jr., "FACIES AND DIAGENESIS ANALYSES OF THE FORT TERRETT FORMATION OF THE LOWER CRETACEOUS EDWARDS GROUP, NEAR JUNCTION, TEXAS" (2019). Electronic Theses and Dissertations. 276. https://scholarworks.sfasu.edu/etds/276
This Thesis is brought to you for free and open access by SFA ScholarWorks. It has been accepted for inclusion in Electronic Theses and Dissertations by an authorized administrator of SFA ScholarWorks. For more information, please contact [email protected].
FACIES AND DIAGENESIS ANALYSES OF THE FORT TERRETT FORMATION OF FACIES AND DIAGENESIS ANALYSES OF THE FORT TERRETT FORMATION OF THE LOWER CRETACEOUS EDWARDS GROUP, NEAR JUNCTION, TEXAS THE LOWER CRETACEOUS EDWARDS GROUP, NEAR JUNCTION, TEXAS
Creative Commons License Creative Commons License
This work is licensed under a Creative Commons Attribution-Noncommercial-No Derivative Works 4.0 License.
This thesis is available at SFA ScholarWorks: https://scholarworks.sfasu.edu/etds/276
FACIES AND DIAGENESIS ANALYSES OF THE FORT TERRETT FORMATION OF THE LOWER
CRETACEOUS EDWARDS GROUP, NEAR JUNCTION, TEXAS
By
Richard A Urwin Jr, Bachelor of Science
Presented to the Faculty of the Graduate School of
Stephen F. State University
In Partial Fulfillment
Of the Requirements
For the Degree of Master of Science
STEPHEN F. AUSTIN STATE UNIVERSITY
May 2019
FACIES AND DIAGENESIS ANALYSES OF THE FORT TERRETT FORMATION OF THE LOWER
CRETACEOUS EDWARDS GROUP, NEAR JUNCTION, TEXAS
By
Richard A. Urwin Jr., B.S. Geology
APPROVED:
Dr. LaRell Nielson, Thesis Director
Dr. Kevin Stafford, Committee Member
Dr. Julie Bloxson, Committee Member
Dr. Joseph Musser, Committee Member
Pauline M. Sampson, Ph.D. Dean of Research and Graduate Studies
i
ABSTRACT
The Fort Terrett Formation was deposited on the western edge of the
Comanche Shelf in central Texas. The predominate lithology of the Fort Terrett
Formation is limestone which caps the hills that surround Junction, Texas.
Deposition of the Fort Terrett Formation occurred within shallow, quiet waters
during the Lower Cretaceous. Rose (1974) developed a general stratigraphic
correlation and lithostratigraphic framework for the Cretaceous Shelf and
established a regional correlation. Four stratigraphic divisions have been
recognized in the Fort Terrett Formation. These are: a basal nodular unit, a
burrowed unit, a dolomitic unit, and the Kirschberg evaporites. Wilkerson (2018)
provided the addition of the Walnut Formation as part of the local stratigraphy.
However, both the Walnut Formation and Kirschberg evaporites have been
omitted from the local stratigraphy. In the Junction area, measured sections by
Rose (1972) of the Fort Terrett Formation contain the lower two units which are
the burrowed unit, distinguishable by bioturbation, and the basal nodular unit.
Nine sections of the Fort Terrett Formation were measured along road cuts on I-
10 near Junction, Texas and hand samples collected. This data was used to
divide the Fort Terrett Formation into three lithostratigraphic units. The lower unit

ii
contained thick-bedded limestone representing an open marine carbonate
platform. The middle unit contains extensive chert nodules and fossils that
indicate intertidal to subtidal facies. The upper unit contains thick bedded
limestone with dolomite indicating shallow intertidal facies. This study has divided
the Fort Terrett Formation into 6 facies in the Junction area to determine
depositional environment. Diagenesis of the Fort Terrett Formation is complex
ranging from shallow marine diagenesis, burial, hydrothermal, and telogenesis.
Dolomization of the Fort Terrett is also the focal point of several previous study.
This study is to provide a new perspective on late stage dolomization by burial
and hydrothermal activity.

iii
ACKNOWLEDGMENTS
The completion of this thesis would not be possible without the support of
several people. I want to express my gratitude to those that have motivated and
encouraged me through this process and time at Stephen F. Austin State
University. I want to extend my thanks and sincere appreciation to my thesis
advisor and committee for reading and editing my thesis. Dr. Nielson gave me
the project as well as assisted with field work. Dr. Stafford assisted with my
petrographic analyses, mineralogy, and dolomization models. I would also like to
thank Dr. Bloxson and Dr. Musser for their assistance with edits as well as advice
for my thesis defense. I also want to thank the Geology Department at Stephen
F. Austin State University for funding, access to research and laboratory
equipment, and office space. I want to give my appreciation to several of my
classmates. Kaleb Henry, Austin Wilkerson, Ryan Elbel, Alex Blizzard, Bernie
Smith, Annie Robinson, and Heather Daily. Without their comradery, motivation,
and support I would have found graduate school daunting. Lastly, I am incredibly
thankful for the love and support of my family. My mother, Kathy Jenkins, and my
father, Dale Jenkins, for instilling a sense of pride and responsibility. My brothers
Kyle Jenkins and Kade Jenkins, sisters in law Lauren Jenkins and Katie Jenkins,

iv
and extended family. Their faith and motivation continued to propel me to
complete my thesis and finish graduate school.
v
TABLE OF CONTENTS
ABSTRACT ..................................................................................................................................... i
ACKNOWLEDGMENTS .............................................................................................................. iii
TABLE OF CONTENTS ............................................................................................................... v
LIST OF FIGURES...................................................................................................................... vii
INTRODUCTION ........................................................................................................................... 1
CREATACEOUS GEOLOGIC ELEMENTS .............................................................................. 3
STRATIGRAPHY OF JUNCTION AREA ................................................................................. 12
HENSEL FORMATION .......................................................................................................... 17
GELN ROSE FORMATION ................................................................................................... 20
FORT TERRETT FORMATION ............................................................................................ 21
SEGOVIA FORMATION ........................................................................................................ 25
STUDY AREA .............................................................................................................................. 26
METHODOLOGY ........................................................................................................................ 31
STRATIGRAPHIC ANALYSIS .................................................................................................. 33
BASAL UNIT ............................................................................................................................ 36
THIN BED UNIT ...................................................................................................................... 38
DOLOMITIZED UNIT .............................................................................................................. 41
PETROGRAPHIC ANALYSES ................................................................................................. 44
FACIES ANALYSES ............................................................................................................... 44
SPARSE BIOMICRITE (F1) .............................................................................................. 48
DOLOMITIZED SPARSE BIOMICRITE (F2) .................................................................. 50
BIVALVE PACKED BIOMICRITE (F3) ............................................................................. 53
PELOIDAL MICROSPAR (F4) .......................................................................................... 56
POROSITY RICH SPARSE BIOMICRITE (F5) .............................................................. 58
DOLOMITIZED MICRITE (F6) .......................................................................................... 60
vi
DIAGENESIS ............................................................................................................................... 62
SHALLOW MARINE DIAGENESIS ...................................................................................... 64
EARLY BURIAL DIAGENESIS ............................................................................................. 71
LATE BURIAL DIAGENESIS ................................................................................................ 76
TELOGENESIS ....................................................................................................................... 79
DOLOMIZATION MODEL .......................................................................................................... 85
DISCUSSION ............................................................................................................................. 107
CONCLUSIONS ........................................................................................................................ 113
REFERENCES .......................................................................................................................... 116
APPENDIX A. THIN SECTIONS ............................................................................................ 119
APPENDIX B. MEASURED SECTIONS ............................................................................... 136
VITA............................................................................................................................................. 158
vii
LIST OF FIGURES
Figure 1. Interior seaway of the Zuni sequence during Albian time (modified from Blakey,
2013) ............................................................................................................................................... 5
Figure 2. The interior seaway is regressing during very late Albian time (modified from
Blakey, 2013) ................................................................................................................................. 6
Figure 3. Regional deposition of Lower Edwards carbonates (modified from Rose,
1972). .............................................................................................................................................. 7
Figure 4. Asimplified stratigraphic column of the Comanche Shelf. (modified from Phelps
2013). .............................................................................................................................................. 8
Figure 5. Surface and subsurface correlations of the Edwards Group (modified from
Rose, 1972). ................................................................................................................................. 14
Figure 6. The generalized stratigraphic column of the Lower Cretaceous Group near
Junction, Texas (from Wilkerson, 2018). ................................................................................. 15
Figure 7. The general lithostratigraphy for the study area near Junction, ......................... 16
Figure 8. A paleogeographic representation of depositional systems in Texas of the
Trinity Group (from Payne 1982). ............................................................................................. 19
Figure 9. Diagram of diagenetic features of the depositional environments within the
Fort Terrett Formation (Trabelsi 1984). ................................................................................... 24
Figure 10. Regional extent of the Cretaceous age Fort Terrett Formation (Kft) where it
outcrops in Texas (Wilkerson 2018). ........................................................................................ 28
viii
Figure 11. Geologic map of Kimble County, Texas. This map outlines the geologic
formations that outcrop in Kimble County (modified from Wilkerson 2018). ...................... 29
Figure 12. Map showing the locations of the 9 measured sections used for the purpose
of this thesis. ................................................................................................................................ 30
Figure 13. The three mapped units in the study area per the USGS geologic formations
map................................................................................................................................................ 34
Figure 14. General lithostratigraphic section of the Fort Terrett Formation near Junction,
Texas. ........................................................................................................................................... 35
Figure 15. This outcrop shows the conformable surface between the basal unit and the
thin bed unit in the study area. .................................................................................................. 37
Figure 16. This outcrop shows a visual representation of the thin bed unit in the study
area. .............................................................................................................................................. 39
Figure 17. This outcrop shows the conformable surface between the Basal unit and the
thin bed unit in the study area. .................................................................................................. 40
Figure 18. This outcrop shows the surface between the thin bed unit and the dolomitized
unit in the study area. ................................................................................................................. 42
Figure 19. sedimentary features observed in hand samples collected at various road
cuts. ............................................................................................................................................... 43
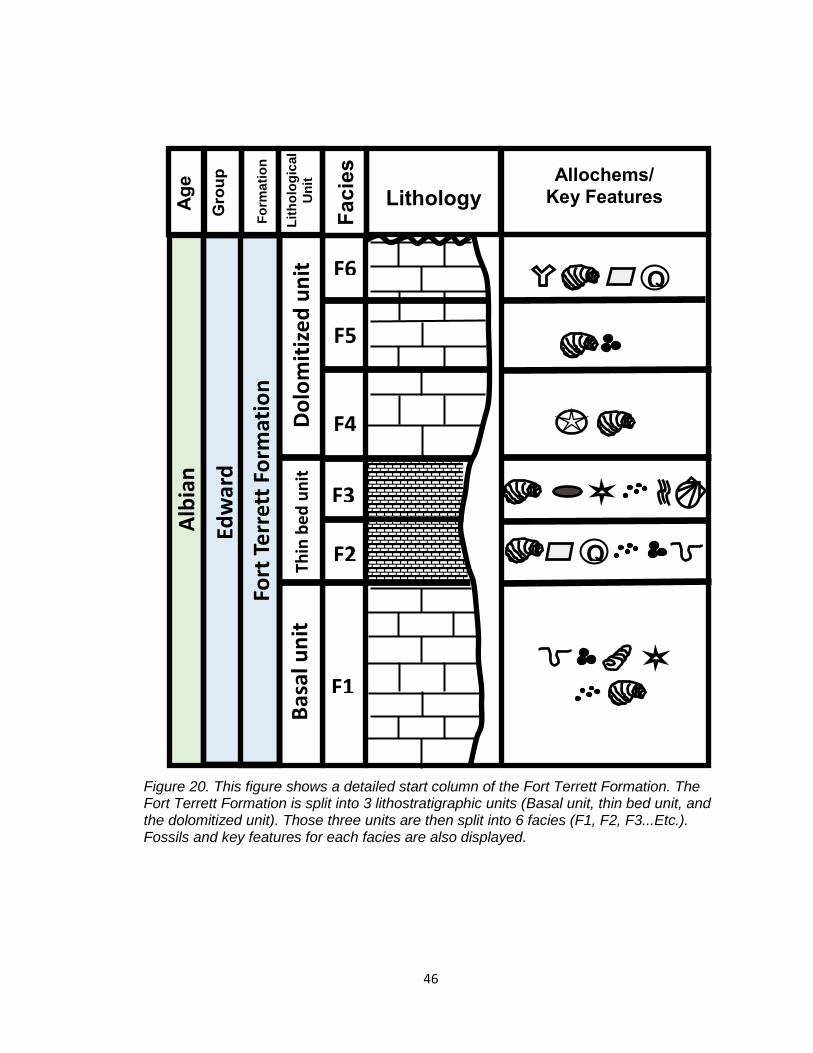
Figure 20. This figure shows a detailed start column of the Fort Terrett Formation. The
Fort Terrett Formation is split into 3 lithostratigraphic units (Basal unit, thin bed unit, and
the dolomitized unit). Those three units are then split into 6 facies (F1, F2, F3...Etc.).
Fossils and key features for each facies are also displayed. ............................................... 46
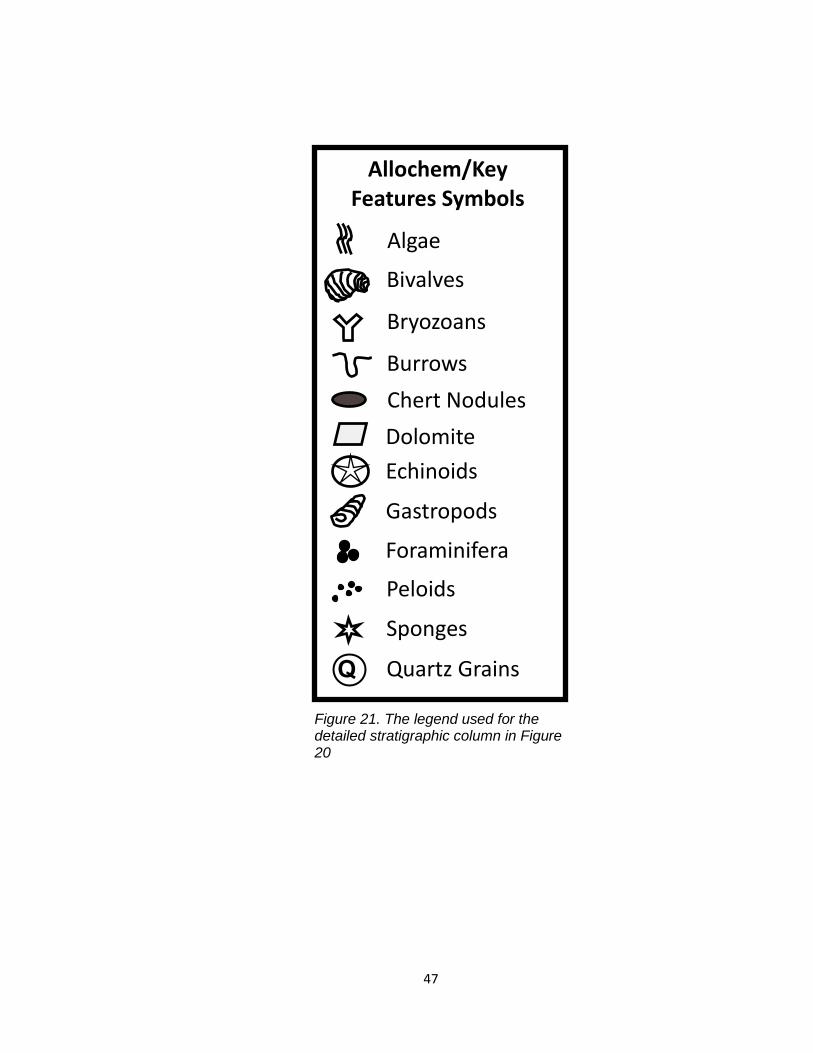
Figure 21. The legend used for the detailed stratigraphic column in Figure 20 ............... 47
ix
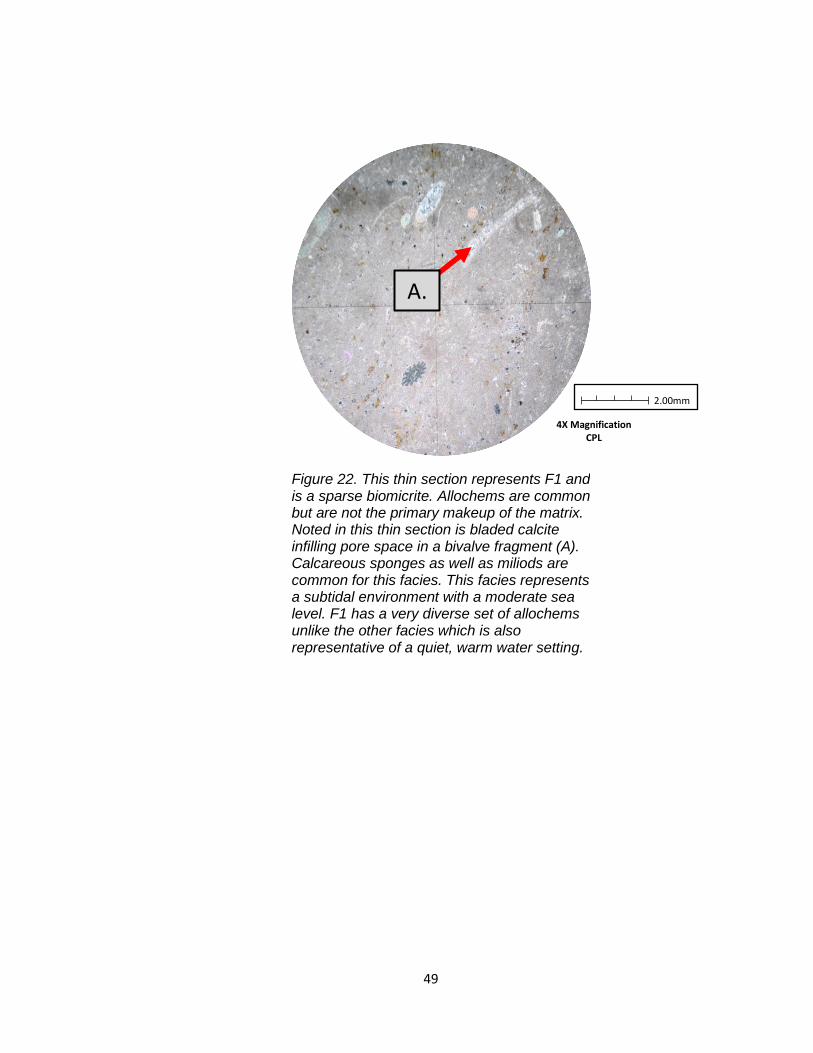
Figure 22. This thin section represents F1 and is a sparse biomicrite. Allochems are
common but are not the primary makeup of the matrix. ....................................................... 49
Figure 23. Represents F2 and is inferred as a dolomitized sparse biomicrite. ................. 52
Figure 24. This thin section represents F3 and the second facies of the thin bed unit.
Petrography analysis of F3 shows a packed biomicrite within an intertidal to shallow
subtidal environment................................................................................................................... 54
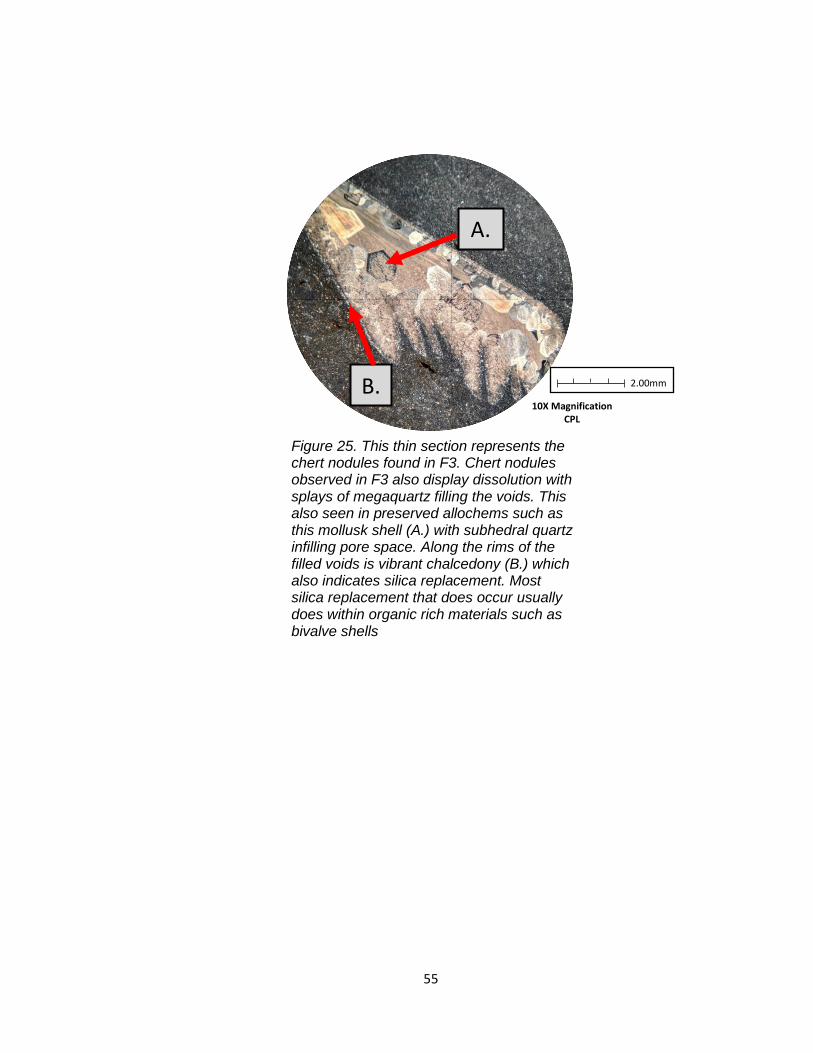
Figure 25. This thin section represents the chert nodules found in F3. Chert nodules
observed in F3 also display dissolution with splays of megaquartz filling the voids. ........ 55
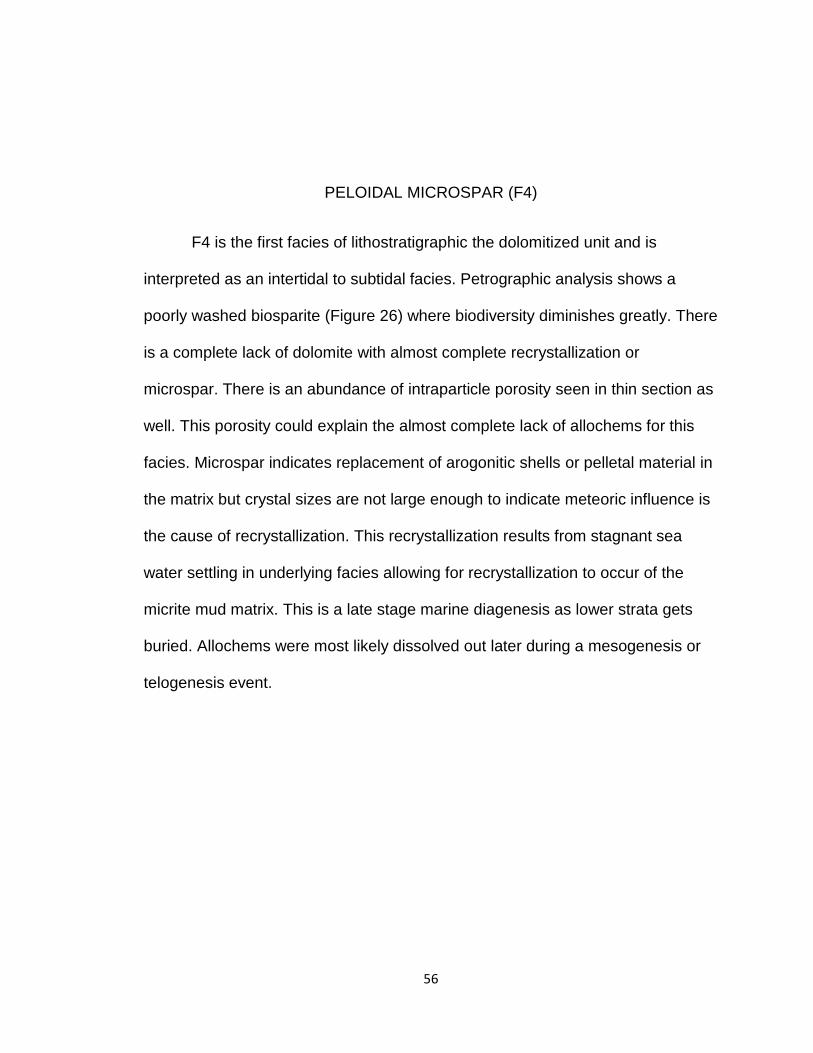
Figure 26. This thin section shows F4 which is the first facies of lithostratigraphic the
dolomitized unit and is interpreted as an intertidal to subtidal facies. Petrographic
analysis shows a poorly washed biosparite with a significant lack of biodiversity. There
are also no indications of dolomite with very little micrite. .................................................... 57
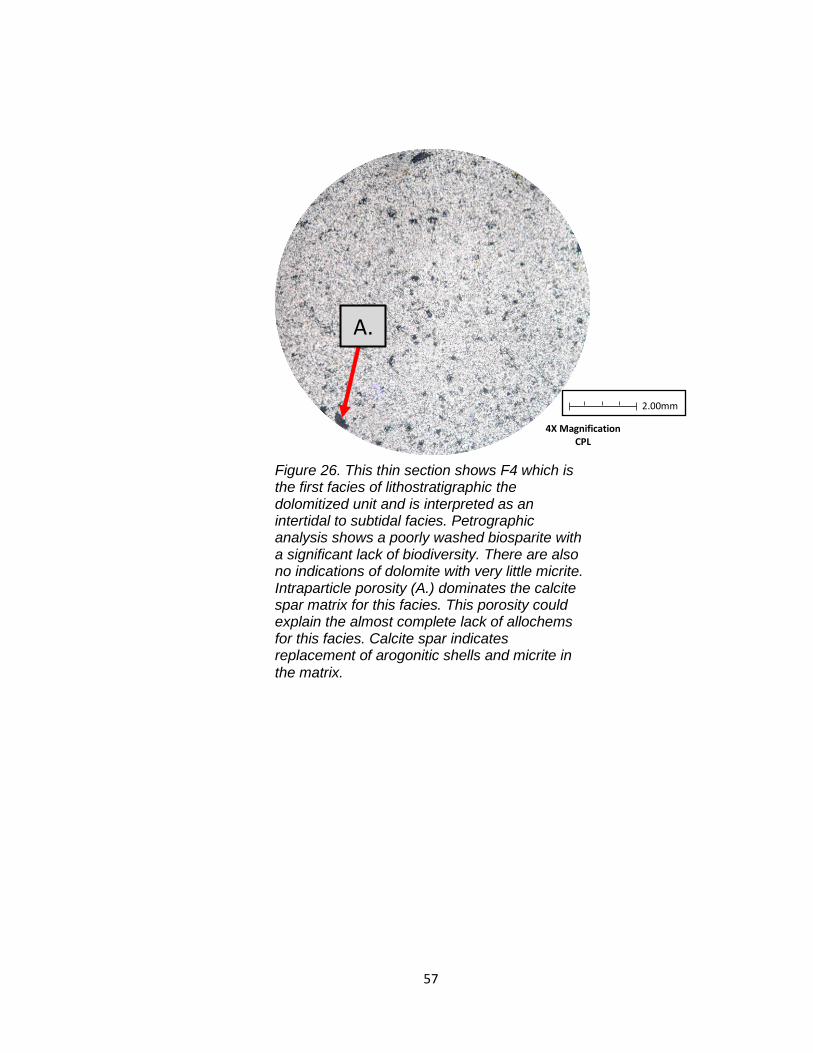
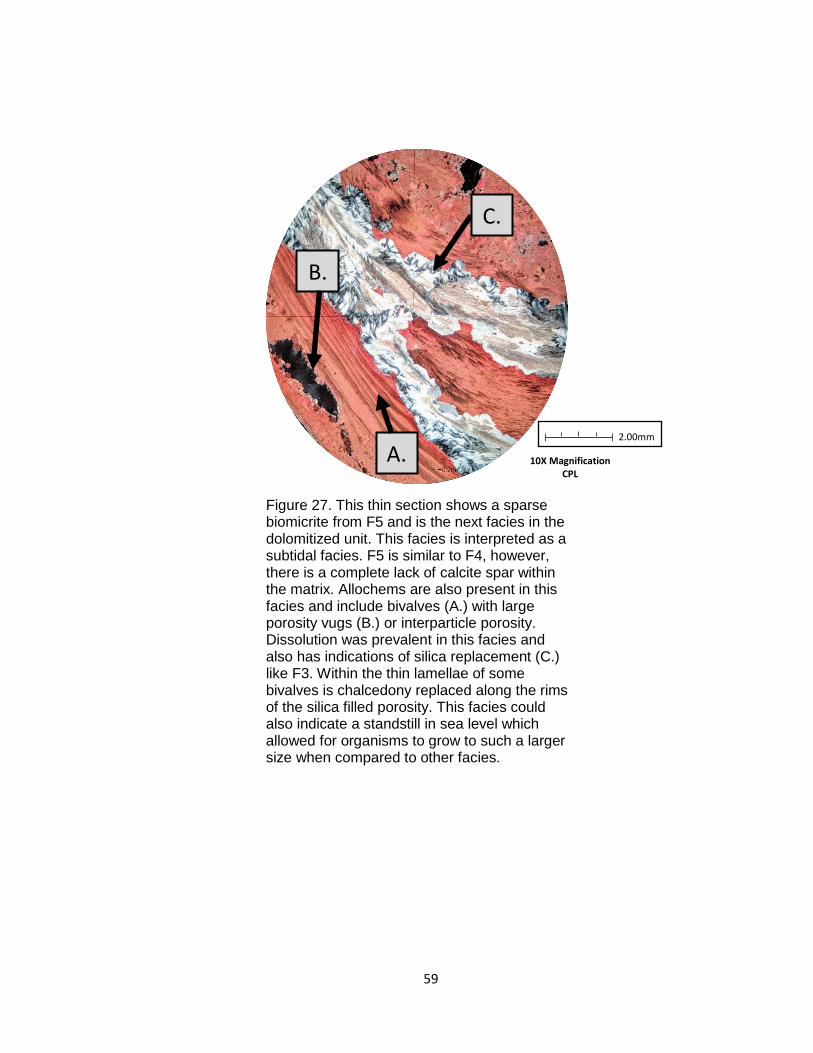
Figure 27. This thin section shows a sparse biomicrite from F5 and is the next facies in
the dolomitized unit. This facies is interpreted as a subtidal facies. F5 is similar to F4,
however, there is a complete lack of calcite spar within the matrix..................................... 59
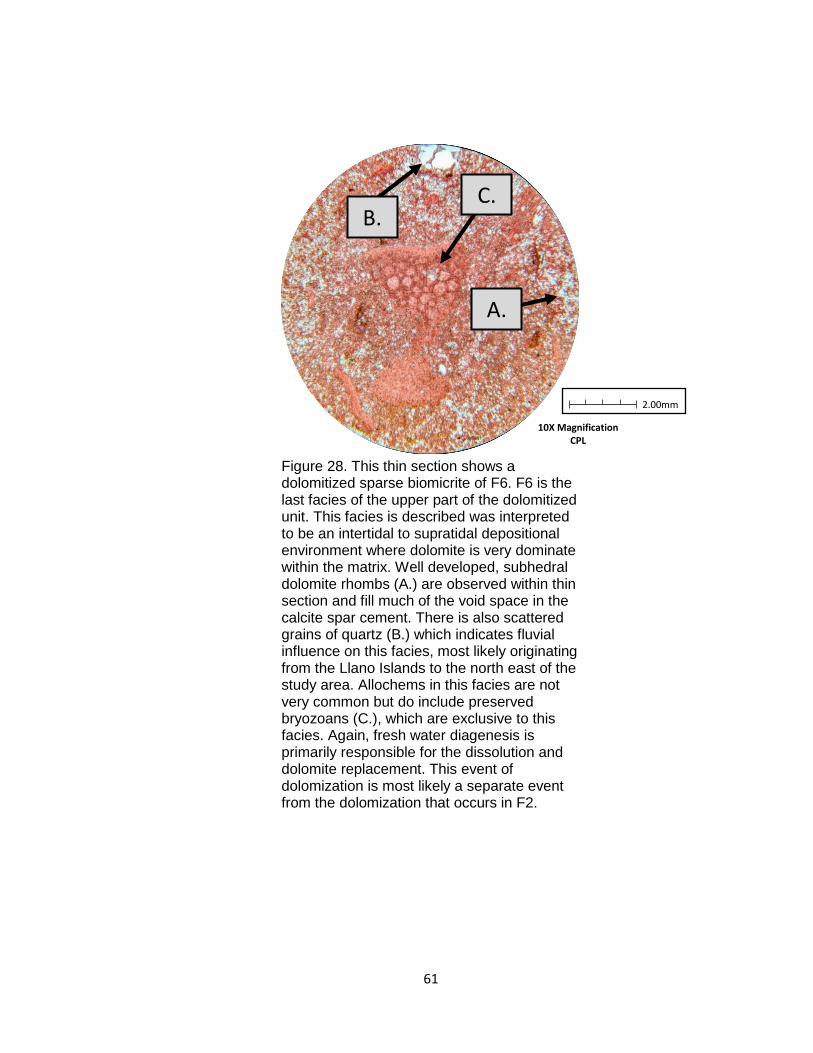
Figure 28. This thin section shows a dolomitized sparse biomicrite of F6. F6 is the last
facies of the upper part of the dolomitized unit. This facies is described was interpreted
to be an intertidal to supratidal depositional environment where dolomite is very
dominate within the matrix. ........................................................................................................ 61
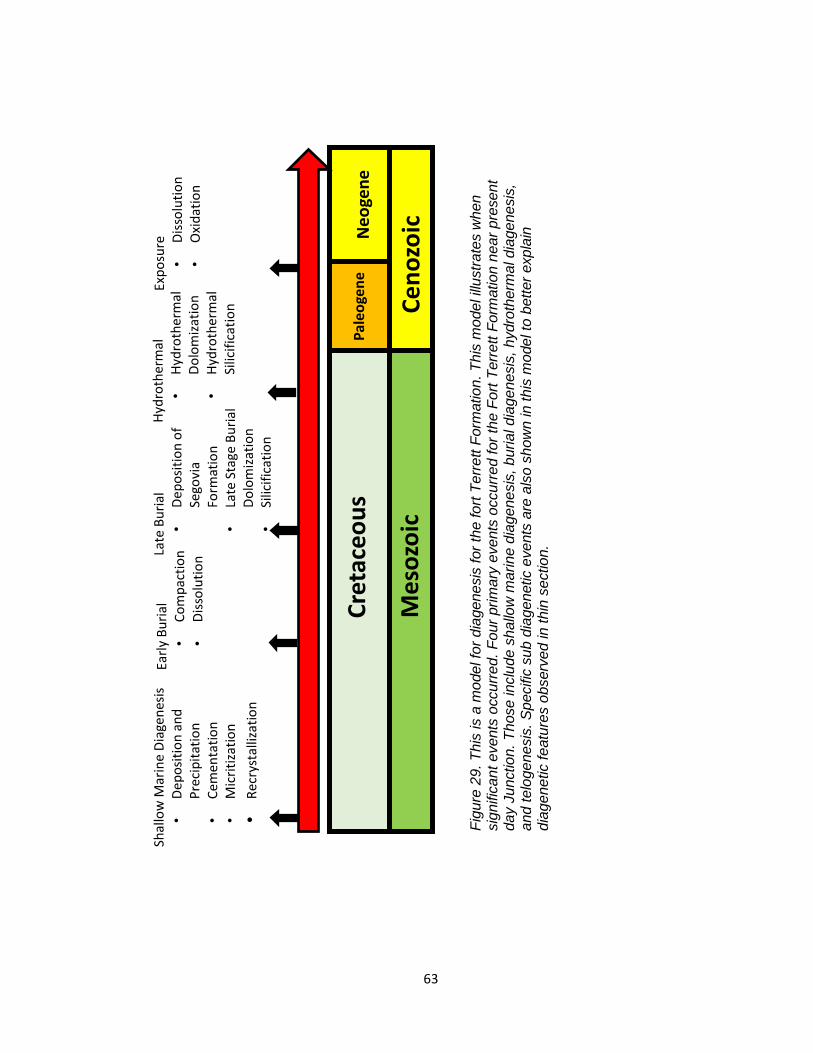
Figure 29. This is a model for diagenesis for the fort Terrett Formation. This model
illustrates when significant events occurred............................................................................ 63
Figure 30. This thin section shows a thin micritic envelope around an allochem which
suggest shallow marine diagenesis. ........................................................................................ 66
Figure 31. This thin section shows a gastropod surrounded by bivalves and peloids.
Allochems in this thin section have micritic envelopes indicating shallow marine
diagenesis. ................................................................................................................................... 67
x
Figure 32. This thin section shows a bioturbated bivalve shell with micrite filling the pore
space. These burrows are not as complete around the rim of other allochems but still
illustrate how algal microboring are infilled with micrite. ....................................................... 68
Figure 33. This thin section shows a dissolved bivalve shell filled in with drussy mosaic
calcite. This is representative of selective dissolution and is also responsible dissolution
of select allochems ..................................................................................................................... 69
Figure 34. This thin section shows F4 which is a microspar facies. Allochems are
completely removed from this facies and only the “ghost” remnants of those allochems
remain. These allochems were selectively dissolved later after the precipitation of the
microspar. ..................................................................................................................................... 70
Figure 35. This thin section shows a broken bivalve which suggests light to moderate
compaction occurred. Burial diagenesis is evident by fractures, broken allochems that
aren’t imbricated, and styolites. ................................................................................................ 73
Figure 36. This thin section shows a fracture though a sparse biomicrite infilled with
calcite and silica. ......................................................................................................................... 74
Figure 37. This thin section shows a chert thin section where no sponge spicules or
radiolarians were found, which suggests that the chert nodules in the Fort Terrett
Formation are of an inorganic origin. ....................................................................................... 75
Figure 38. This thin section shows dolomite as a primary cement in F6 of the Fort
Terrett Formation. This type of dolomization is evident of saddle dolomite that occurs
during late stage diagenesis. ..................................................................................................... 77
Figure 39. This thin section shows a chalcedony filled pore space. .................................. 78
Figure 40. This thin section shows an allochem surrounded by oxide cementation. This
suggests fresh water flushing dissolved the rim of the bivalve shell which allowed for
oxide rich waters to fill the void space. .................................................................................... 81
xi
Figure 41. This thin section shows selective dissolution of a milliod with high Mg calcite
precipitating around the rim. High mg calcite is distinguished by the powdery white color.
Some crystals exhibit a slight reddish hue, indicating the Alizeran Red staining is not as
effective on high Mg calcite ....................................................................................................... 82
Figure 42. This thin section shows iron staining which indicates telogenesis occurring on
the Fort Terrett Formation. Iron rich waters infiltrated facies during exposure and left
behind iron staining that was either dark brown or orange. .................................................. 83
Figure 43. These thin sections shows vuggy dissolution that occurred during
telogenesis. Both thin sections shown have enhanced porosity that occurred after the
exposure of the Fort Terrett Formation. ................................................................................... 84
Figure 44. These thin sections shows dolomite observed during the petrographic
analysis. Two types of dolomite are seen and are described as euhedral, having rhombic
crystal habits in F2 or xenotopic, infilling much of the void space as a cement in F6. ..... 97
Figure 45. This thin section shows moldic porosity within a bivalve shell. This is
significant for the reflux model due to the enhanced porosity by dissolution. .................... 98
Figure 46. This thin section shows euhedral, planar dolomite in micrite matrix with
overgrowth centers which indicates Type 3 dolomite. ........................................................... 99
Figure 47. This thin section shows dolomite in a micrite matrix but also shows selective
dolomization within a foraminifera. Dolomite as a cementation indicates Type 4 dolomite
and is very common in F6 of the Fort Terrett Formation. ................................................... 100
Figure 48. The seepage reflux model that is been proposed multiple times for the Fort
Terrett Formation. ..................................................................................................................... 101
Figure 49. This is a diagram showing the classification system for dolomite textures
used by Gregg and Sbibley (1984). This classification was constructed to differentiate
dolomites based on crystal morphology, crystal edge geometries, and matrix. .............. 102
xii
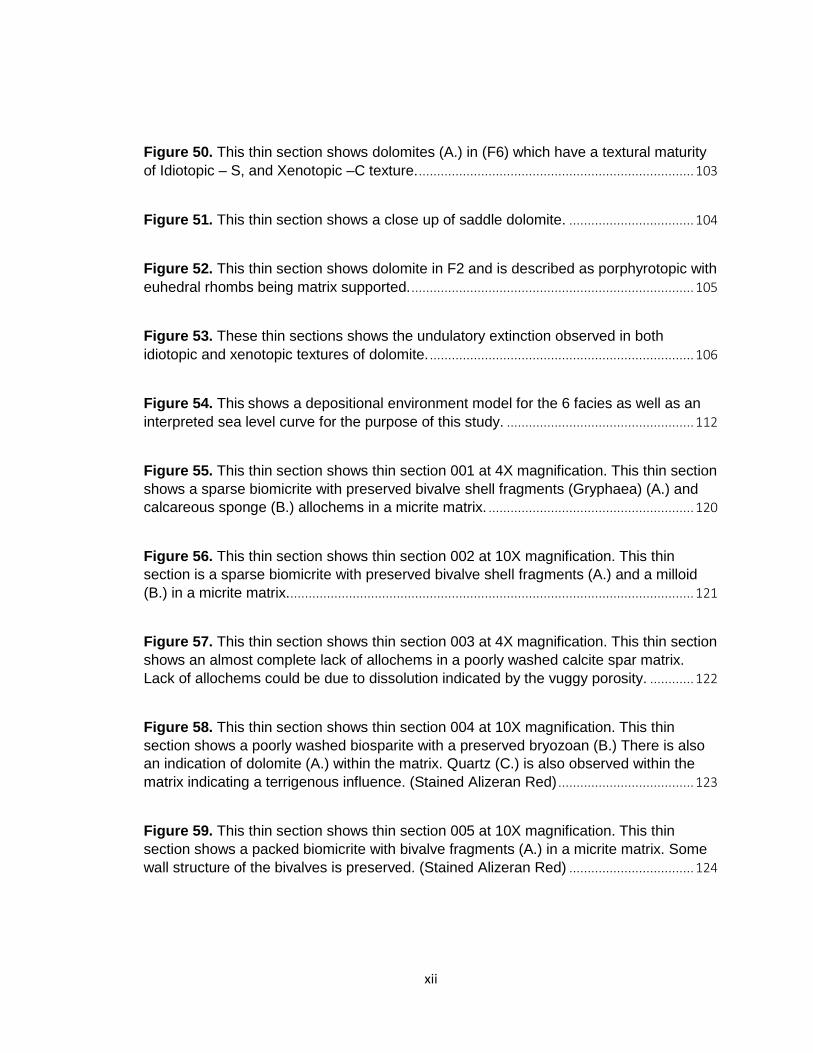
Figure 50. This thin section shows dolomites (A.) in (F6) which have a textural maturity
of Idiotopic – S, and Xenotopic –C texture. ........................................................................... 103
Figure 51. This thin section shows a close up of saddle dolomite. .................................. 104
Figure 52. This thin section shows dolomite in F2 and is described as porphyrotopic with
euhedral rhombs being matrix supported. ............................................................................. 105
Figure 53. These thin sections shows the undulatory extinction observed in both
idiotopic and xenotopic textures of dolomite. ........................................................................ 106
Figure 54. This shows a depositional environment model for the 6 facies as well as an
interpreted sea level curve for the purpose of this study. ................................................... 112
Figure 55. This thin section shows thin section 001 at 4X magnification. This thin section
shows a sparse biomicrite with preserved bivalve shell fragments (Gryphaea) (A.) and
calcareous sponge (B.) allochems in a micrite matrix. ........................................................ 120
Figure 56. This thin section shows thin section 002 at 10X magnification. This thin
section is a sparse biomicrite with preserved bivalve shell fragments (A.) and a milloid
(B.) in a micrite matrix............................................................................................................... 121
Figure 57. This thin section shows thin section 003 at 4X magnification. This thin section
shows an almost complete lack of allochems in a poorly washed calcite spar matrix.
Lack of allochems could be due to dissolution indicated by the vuggy porosity. ............ 122
Figure 58. This thin section shows thin section 004 at 10X magnification. This thin
section shows a poorly washed biosparite with a preserved bryozoan (B.) There is also
an indication of dolomite (A.) within the matrix. Quartz (C.) is also observed within the
matrix indicating a terrigenous influence. (Stained Alizeran Red) ..................................... 123
Figure 59. This thin section shows thin section 005 at 10X magnification. This thin
section shows a packed biomicrite with bivalve fragments (A.) in a micrite matrix. Some
wall structure of the bivalves is preserved. (Stained Alizeran Red) .................................. 124
xiii
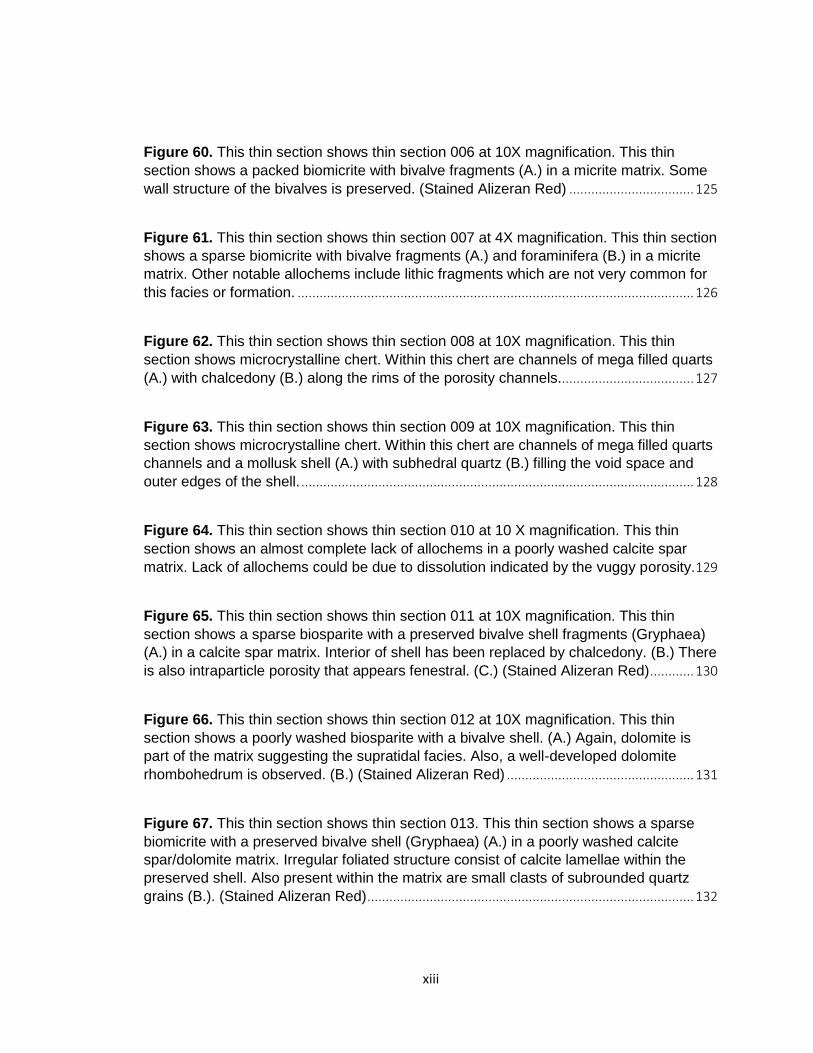
Figure 60. This thin section shows thin section 006 at 10X magnification. This thin
section shows a packed biomicrite with bivalve fragments (A.) in a micrite matrix. Some
wall structure of the bivalves is preserved. (Stained Alizeran Red) .................................. 125
Figure 61. This thin section shows thin section 007 at 4X magnification. This thin section
shows a sparse biomicrite with bivalve fragments (A.) and foraminifera (B.) in a micrite
matrix. Other notable allochems include lithic fragments which are not very common for
this facies or formation. ............................................................................................................ 126
Figure 62. This thin section shows thin section 008 at 10X magnification. This thin
section shows microcrystalline chert. Within this chert are channels of mega filled quarts
(A.) with chalcedony (B.) along the rims of the porosity channels..................................... 127
Figure 63. This thin section shows thin section 009 at 10X magnification. This thin
section shows microcrystalline chert. Within this chert are channels of mega filled quarts
channels and a mollusk shell (A.) with subhedral quartz (B.) filling the void space and
outer edges of the shell. ........................................................................................................... 128
Figure 64. This thin section shows thin section 010 at 10 X magnification. This thin
section shows an almost complete lack of allochems in a poorly washed calcite spar
matrix. Lack of allochems could be due to dissolution indicated by the vuggy porosity. 129
Figure 65. This thin section shows thin section 011 at 10X magnification. This thin
section shows a sparse biosparite with a preserved bivalve shell fragments (Gryphaea)
(A.) in a calcite spar matrix. Interior of shell has been replaced by chalcedony. (B.) There
is also intraparticle porosity that appears fenestral. (C.) (Stained Alizeran Red) ............ 130
Figure 66. This thin section shows thin section 012 at 10X magnification. This thin
section shows a poorly washed biosparite with a bivalve shell. (A.) Again, dolomite is
part of the matrix suggesting the supratidal facies. Also, a well-developed dolomite
rhombohedrum is observed. (B.) (Stained Alizeran Red) ................................................... 131
Figure 67. This thin section shows thin section 013. This thin section shows a sparse
biomicrite with a preserved bivalve shell (Gryphaea) (A.) in a poorly washed calcite
spar/dolomite matrix. Irregular foliated structure consist of calcite lamellae within the
preserved shell. Also present within the matrix are small clasts of subrounded quartz
grains (B.). (Stained Alizeran Red) ......................................................................................... 132
xiv
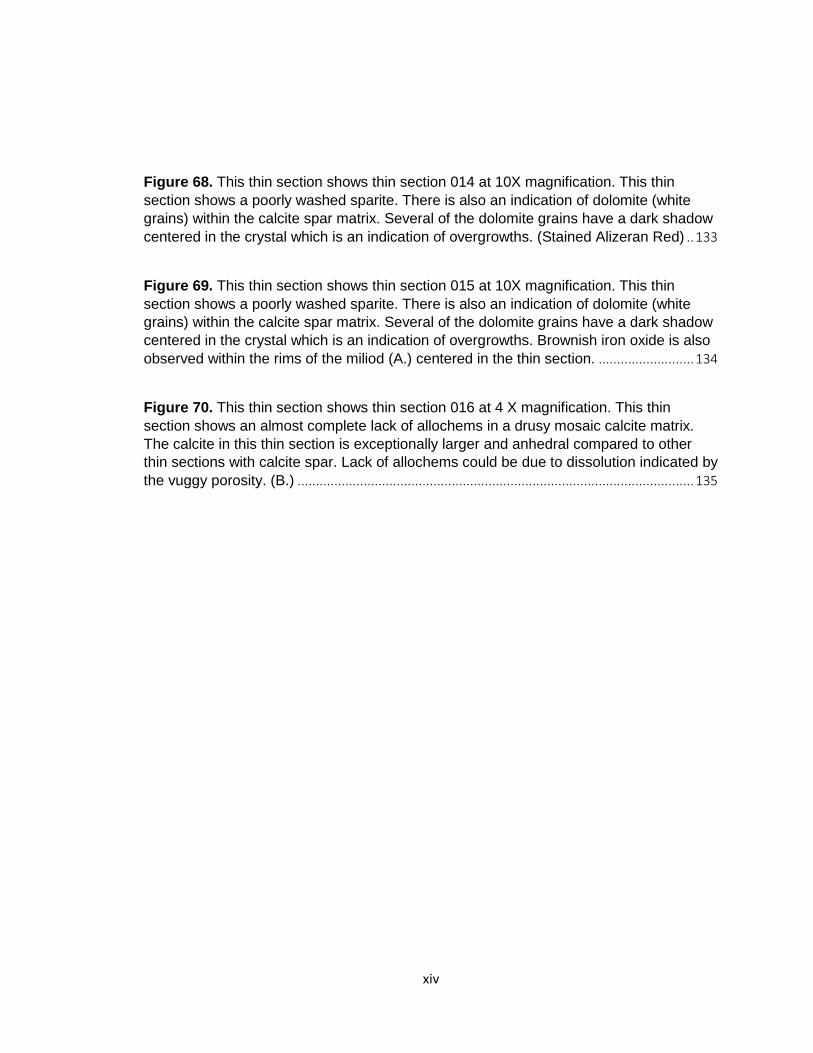
Figure 68. This thin section shows thin section 014 at 10X magnification. This thin
section shows a poorly washed sparite. There is also an indication of dolomite (white
grains) within the calcite spar matrix. Several of the dolomite grains have a dark shadow
centered in the crystal which is an indication of overgrowths. (Stained Alizeran Red) .. 133
Figure 69. This thin section shows thin section 015 at 10X magnification. This thin
section shows a poorly washed sparite. There is also an indication of dolomite (white
grains) within the calcite spar matrix. Several of the dolomite grains have a dark shadow
centered in the crystal which is an indication of overgrowths. Brownish iron oxide is also
observed within the rims of the miliod (A.) centered in the thin section. .......................... 134
Figure 70. This thin section shows thin section 016 at 4 X magnification. This thin
section shows an almost complete lack of allochems in a drusy mosaic calcite matrix.
The calcite in this thin section is exceptionally larger and anhedral compared to other
thin sections with calcite spar. Lack of allochems could be due to dissolution indicated by
the vuggy porosity. (B.) ............................................................................................................ 135
1
INTRODUCTION
Carbonate rocks of middle Cretaceous age dominate much of the
surface and subsurface in west central Texas. These carbonate units were
deposited on the Comanche Shelf and represent the lower Edwards Group in
the rock record. A major transgression created an interior seaway that
dominated most of the central United States and stretched north into the Arctic
Sea. The development of this interior seaway created the Zuni Sequence
during Aptian time. Waters on the Comanche Shelf were warm and quiet
which allowed a carbonate factory to develop. Many of the facies of the Lower
Cretaceous carbonates represent progradation of subtidal, intertidal, and
sabkha facies. Eustatic sea level change, climate variations, and tectonics are
the primary factors controlling the depositional environment of the Edwards
Group. These cycles mainly represent large 3rd and 4th order sequences.
One of the major units in the Edwards Group is the Fort Terrett
Formation. The regional extent of this unit has been delineated and its
lithology has been defined, but it varies significantly from place to place. The
purpose of this study was to examine the Fort Terrett Formation of the
Edwards Group and divide it into recognizable formations and sequences by

2
conducting a stratigraphic, petrographic, and facies analyses to either support
previous studies or add new information. A dolomization model will also be
constructed detailing how the Fort Terrett Formation became dolomitized.
3
CREATACEOUS GEOLOGIC ELEMENTS
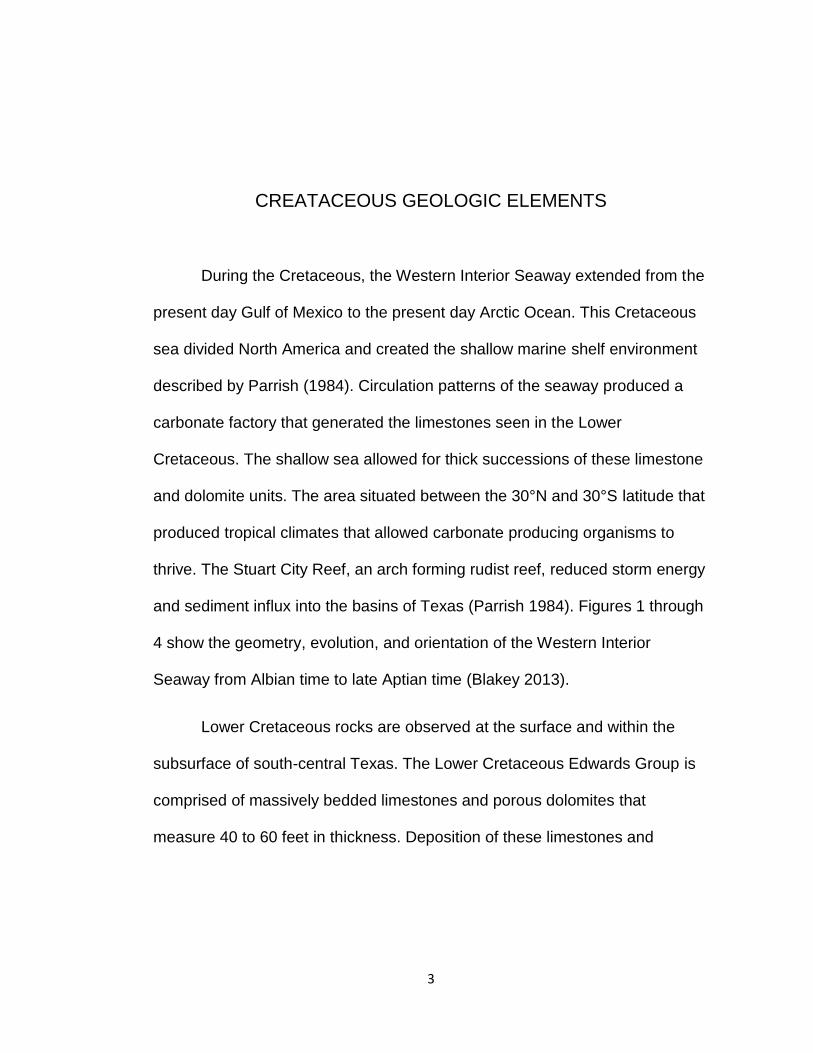
During the Cretaceous, the Western Interior Seaway extended from the
present day Gulf of Mexico to the present day Arctic Ocean. This Cretaceous
sea divided North America and created the shallow marine shelf environment
described by Parrish (1984). Circulation patterns of the seaway produced a
carbonate factory that generated the limestones seen in the Lower
Cretaceous. The shallow sea allowed for thick successions of these limestone
and dolomite units. The area situated between the 30°N and 30°S latitude that
produced tropical climates that allowed carbonate producing organisms to
thrive. The Stuart City Reef, an arch forming rudist reef, reduced storm energy
and sediment influx into the basins of Texas (Parrish 1984). Figures 1 through
4 show the geometry, evolution, and orientation of the Western Interior
Seaway from Albian time to late Aptian time (Blakey 2013).
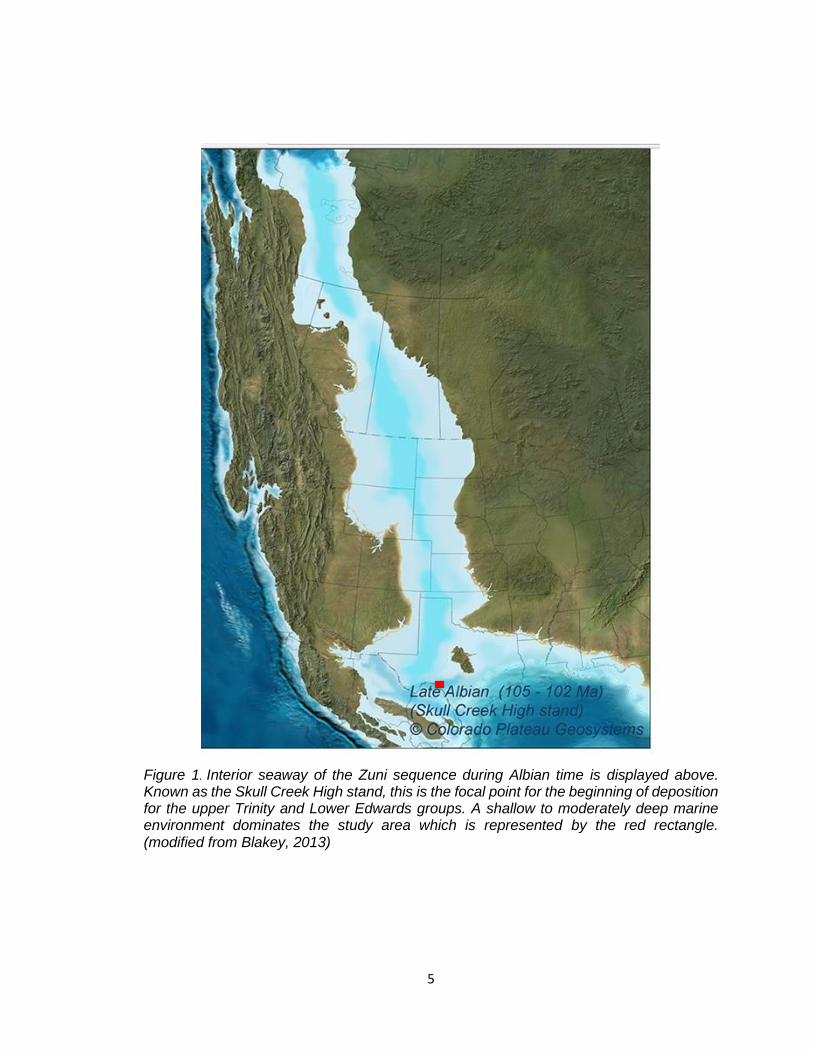
Lower Cretaceous rocks are observed at the surface and within the
subsurface of south-central Texas. The Lower Cretaceous Edwards Group is
comprised of massively bedded limestones and porous dolomites that
measure 40 to 60 feet in thickness. Deposition of these limestones and

4
dolomites occurred along the Comanche Shelf in shallow waters during Albian
and Aptian time (Figures 1 & 2).
5
Figure 1. Interior seaway of the Zuni sequence during Albian time is displayed above. Known as the Skull Creek High stand, this is the focal point for the beginning of deposition for the upper Trinity and Lower Edwards groups. A shallow to moderately deep marine environment dominates the study area which is represented by the red rectangle. (modified from Blakey, 2013)
6
Figure 2. The interior seaway is regressing during very late Albian time. Deposition of the upper Trinity and lower Edwards Groups continues. A shallow marine environment dominates the location of the study area (red rectangle). (modified from Blakey, 2013)
7
Texas-Tyler Basin
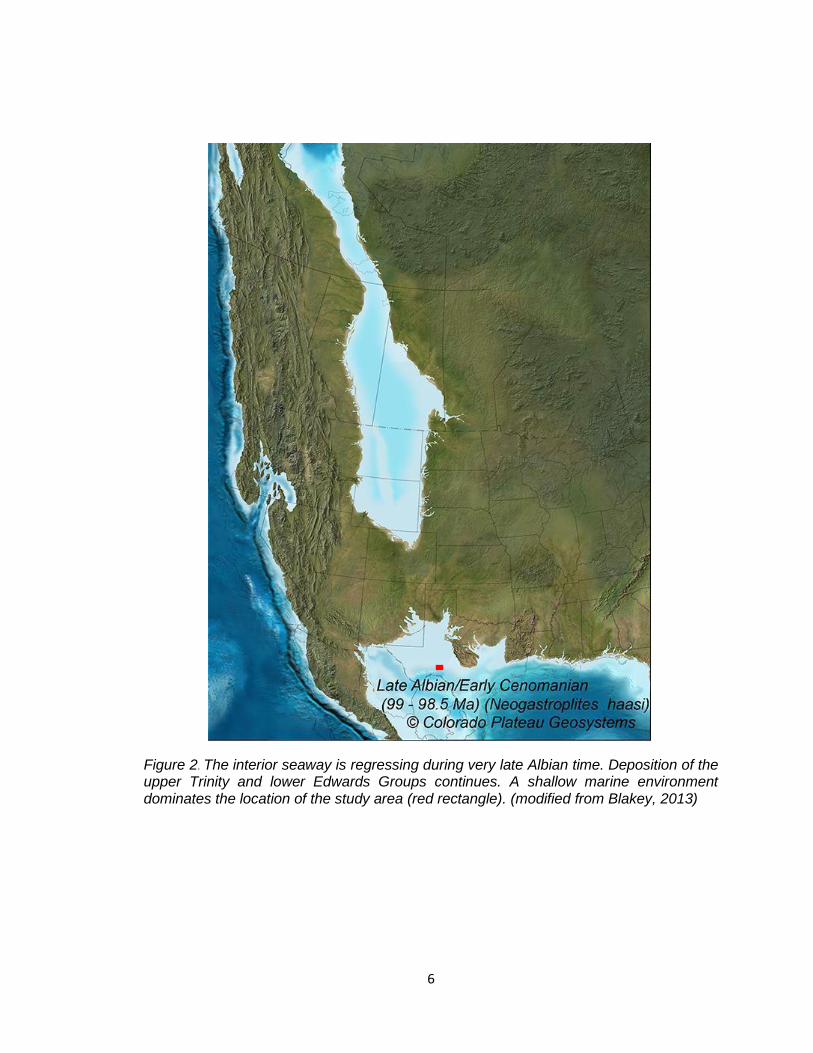
Figure 3. Regional deposition of Lower Edwards carbonates (lines) along with the geologic elements in Texas of the Lower Cretaceous. These geologic elements control deposition of the lower Edwards Group carbonates. The Comanche Shelf (blue), Maverick Basin (yellow), Devils River Trend (orange), and Stuart City Reef (Green). (modified from Rose, 1972).
8
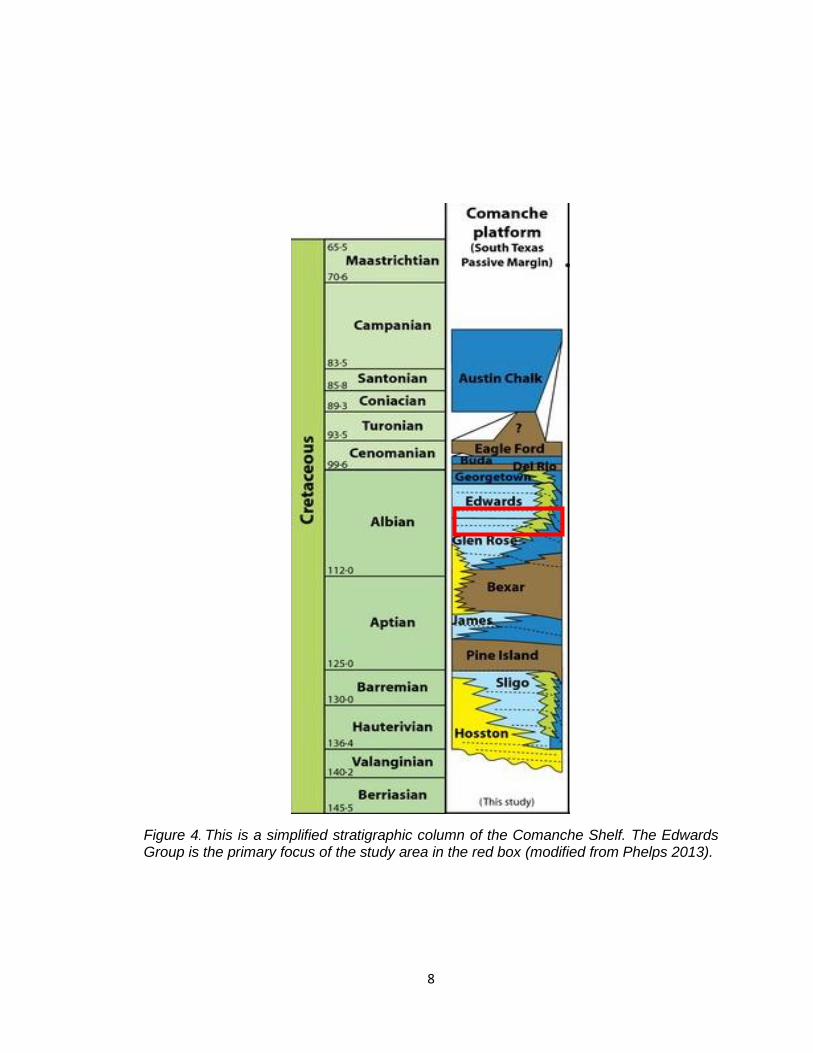
Figure 4. This is a simplified stratigraphic column of the Comanche Shelf. The Edwards Group is the primary focus of the study area in the red box (modified from Phelps 2013).
9
This marine environment consisted of medium- to high-energy
sedimentation (Trabelsi 1984). The shallow marine platform stretched across
most of western Texas, wrapping around central Texas, and extended into
north Texas near Fort Worth. To the southeast of the Comanche Shelf is the
Stuart City Reef that trends along the boundary of ancestral Gulf of Mexico.
The Stuart City Reef contains a rudist reef complex and forms an arch style-
architecture across the southeastern portion of Texas. The reef allowed for
calm waters throughout its development and shielded the study area from
wave dominated processes. Formation of the Stuart City Reef may have
begun during Glen Rose time (Winter 1961). Lower Cretaceous limestones
and rocks were directly influenced by the geometry of the Comanche Shelf
and associated basins. Figure 3 shows the Cretaceous geologic elements for
Texas. Two basins lay juxtaposed against the Comanche Shelf, the Maverick
Basin to the southeast and the North Texas-Tyler Basin to the northeast.
Separating the two basins are two large tectonic elements, the Central Texas
Platform and the San Marcos Arch in the southeastern portion of the shelf
(Adkins 1933).
Starting in the Mesozoic era, two major tectonic cycles impacted Texas.
The Absaroka sequence occurred during the Pennsylvanian to Jurassic and
the Zuni sequence occurred during the Cretaceous. The Zuni sequence, also
known as the Skull Creek Highstand, was primarily responsible for the interior
10
seaway in which many of the carbonates were deposited during the
Cretaceous period. The Zuni sequence also marks the widening of the Atlantic
Ocean along with the trailing plate margin of the Gulf of Mexico. The Zuni
sequence is further divided by (Sloss 1988) into three divisions, Zuni I, Zuni II,
and Zuni III. Vail (1977) and other sequence stratigraphers continued to
pursue additional divisions within the Zuni sequence. Since the work of Sloss
(1988) and Vail (1977), additional models have been further developed.
Parasequences of the Zuni sequence have been determined to be third and
fourth order cycles (Bally 1984). These parasequences are the primary focus
of this study (Figure 4).
Transgression and then later retreat of the interior seaway
demonstrated sea level rise and fall that caused deposition, subaerial erosion,
and a hiatus (Miall 2008). Siliciclastic sediments that were shed off the
mountains to the west during the orogenic events of the Jurassic dominate the
Zuni I sequence. Sandstones, shales, and carbonates were deposited
throughout the eastern platforms of the Comanche Shelf during the Zuni II
sequence. Nearing the end of the Cretaceous, tectonic events created uplift
throughout Western Laurentia and gradually caused relative sea level to fall.
This caused subaerial exposure of the marine sediments and sequences
which led to erosion and truncation of the Cretaceous units (Miall 2008).
11
The stratigraphic framework for the Lower Cretaceous units varies as
they trend from the Balcones Fault Zone, to the Llano Uplift region, and
moving west towards Junction, Texas. Exposures of the Lower Cretaceous are
readily observed in outcrops along the boundaries of the Llano Uplift and
upthrown blocks of the Balcones Fault Zone (Moore 1967). The carbonates of
the Edwards Group around Junction, Texas are divided into the Fort Terrett
Formation and the Segovia Formation (Rose 1974). These formations of the
Edwards Group as well as the Glen Rose Formation and Hensel Formation of
the upper Trinity Group are further defined in the stratigraphy section.
12
STRATIGRAPHY OF JUNCTION AREA
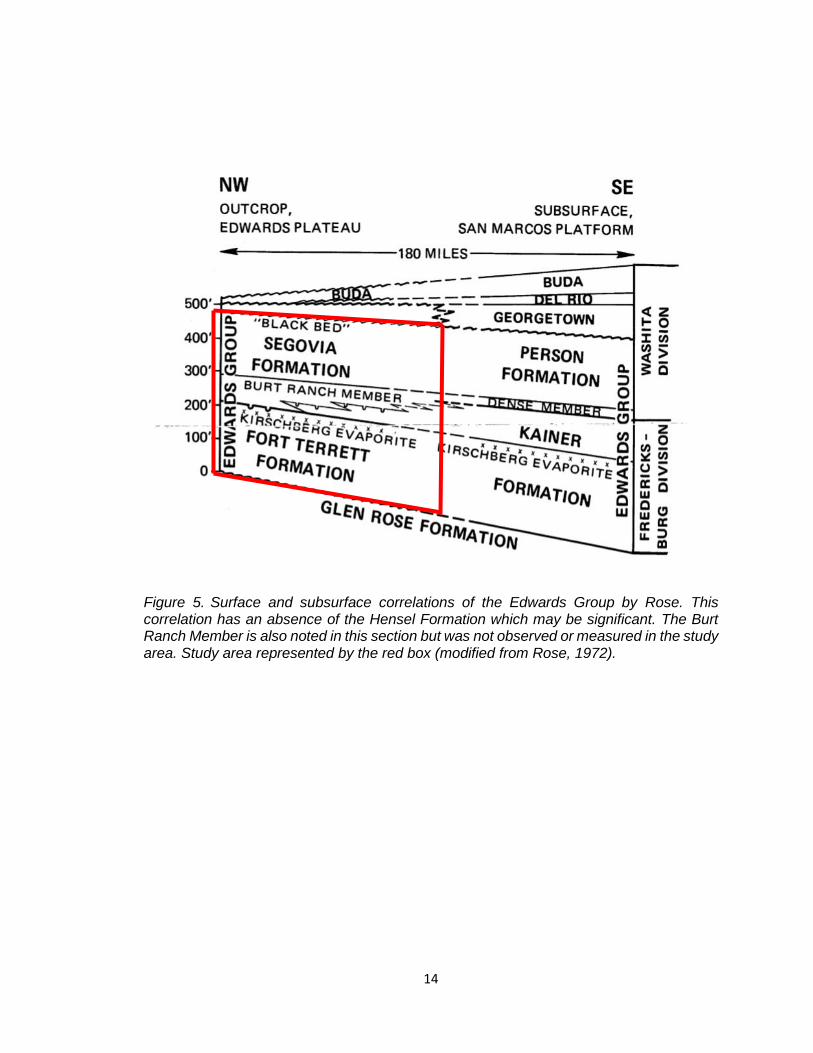
The Lower Cretaceous Edwards Group is split into several formations
and members around the Comanche Shelf. Figure 5 shows the interpretation
by Rose (1972) but includes a general lithostratigraphic description for the
entire Comanche shelf. The stratigraphy of the Junction, Texas area begins at
the base of the Hensel Formation with the Glen Rose Formation on top,
followed by a disconformable surface with the Fort Terrett Formation (Jones
and Kullman 1997). Disconformably overlying the Fort Terrett Formation is the
Segovia Formation. The Glen Rose Formation is disconformably below the
Fort Terrett Formation. The Burt Ranch Member is noted in Figure 5 but was
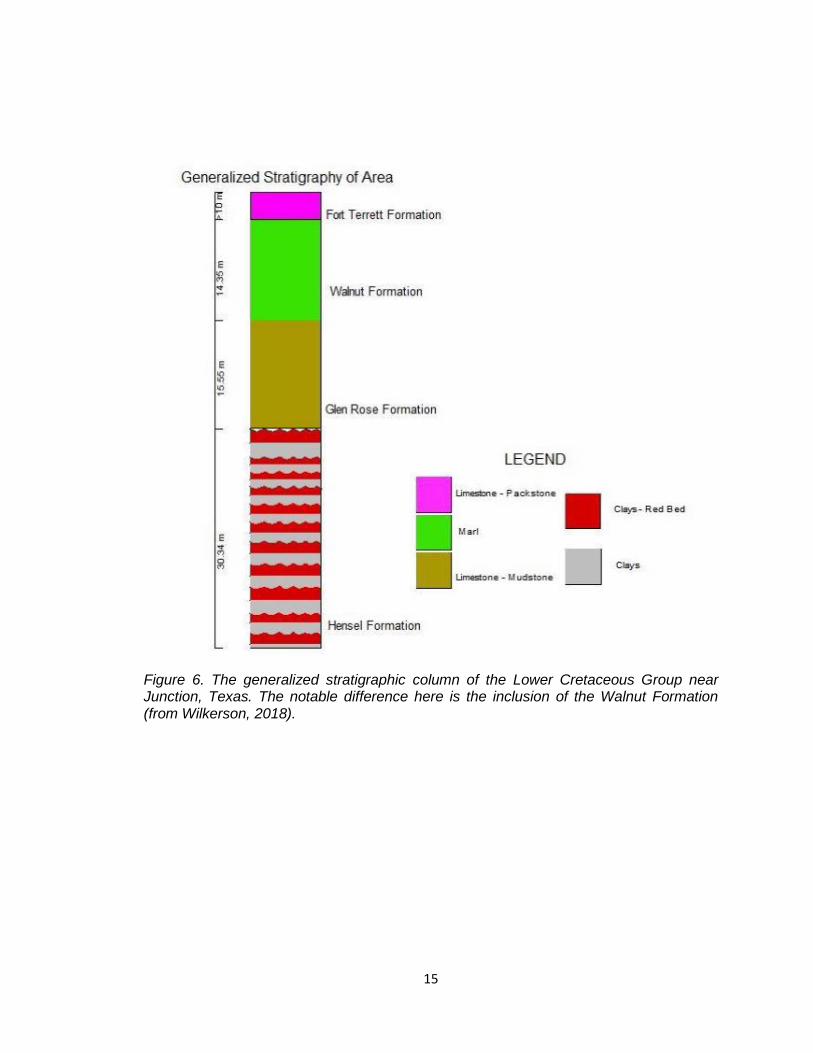
not observed or measured in the study area. Figure 6 (Wilkerson 2018) shows
a very similar stratigraphic column for the Lower Cretaceous near Junction.
However, the difference is the inclusion of the Walnut Formation based on the
observations of oysters, primarily Texigryphea, and interbedded marl beds.
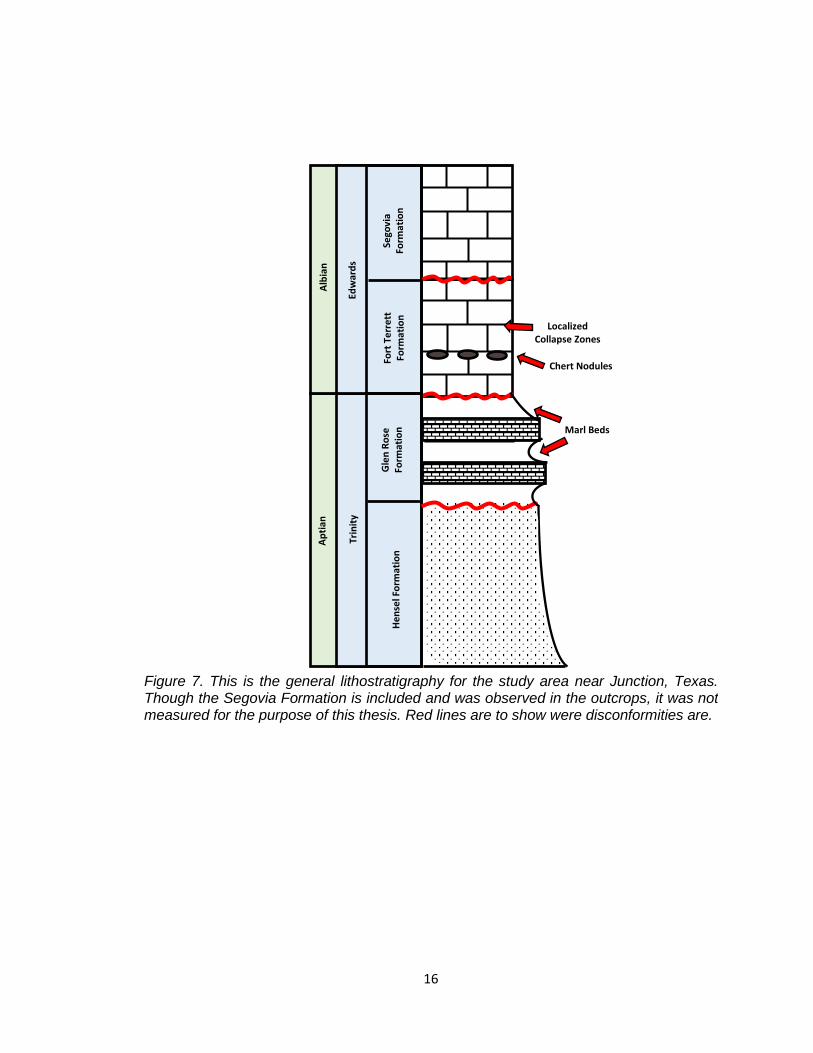
Figure 7 represents the stratigraphic section for observable formations around
Junction for this study. This interpretation does not include the Walnut
Formation nor the Kirschberg Evaporative unit described by Rose in 1972. The
Walnut Formation was not included due to the conclusion that the marl beds
are part of the Glen Rose Formation. Texigryphea is also a key fossil that has

13
been recorded in Glen Rose outcrops (Moore 1961). The Kirschberg
Evaporative unit is not included due to the complete lack of evaporite minerals
observed during petrographic analyses. The Segovia Formation was observed
further east of the study area on I-10 but was not measured or described for
this study.
14
Figure 5. Surface and subsurface correlations of the Edwards Group by Rose. This correlation has an absence of the Hensel Formation which may be significant. The Burt Ranch Member is also noted in this section but was not observed or measured in the study area. Study area represented by the red box (modified from Rose, 1972).
15
Figure 6. The generalized stratigraphic column of the Lower Cretaceous Group near Junction, Texas. The notable difference here is the inclusion of the Walnut Formation (from Wilkerson, 2018).
16
He
nse
l Fo
rmat
ion Tr
init
y
Ap
tian
Gle
n R
ose
Fo
rmat
ion
Fort
Te
rre
tt
Form
atio
n
Edw
ard
s
Alb
ian
Sego
via
Form
atio
n
Figure 7. This is the general lithostratigraphy for the study area near Junction, Texas. Though the Segovia Formation is included and was observed in the outcrops, it was not measured for the purpose of this thesis. Red lines are to show were disconformities are.
Marl Beds
Localized Collapse Zones
Chert Nodules
17
HENSEL FORMATION
The Hensel Formation consists of claystones and sandstones of the
upper Trinity Group. Previous studies describe the Hensel Formation stretching
from the Llano Uplift to west of Junction, Texas. Exposures are observed near
the Llano River drainage basin and along I-10 near Junction, Texas. The
Hensel Formation is described by Jones and Kullman (1997) to have distinct
lithofacies. The first is a basal terrestrial facies with intraclast supported
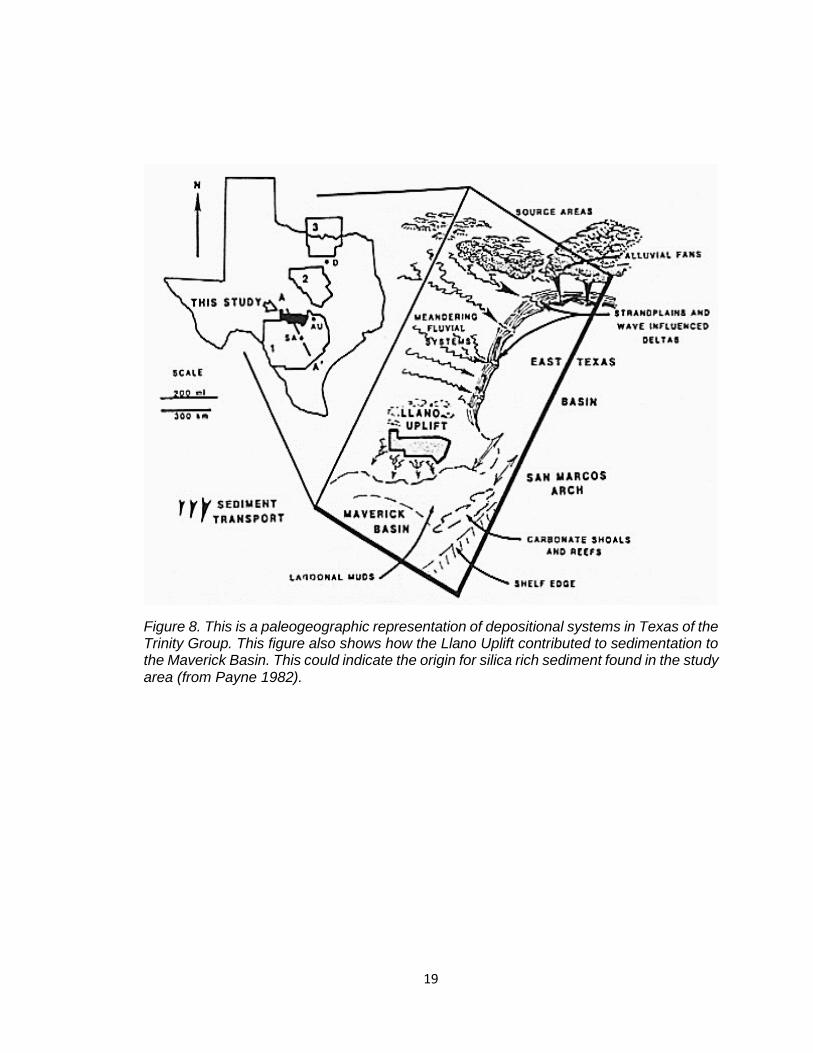
conglomerates, created by high energy fluvial processes (Figure 8). The second
is another terrestrial facies consisting of alluvial sandstones and mudstones.
Paleosols, calcrete, and rhizoconcretions are well developed in this middle
facies. The cycles of paleosols with interbedded limestones and claystones
exhibits a shallow marine depositional environment. The paleosols are an
indication that subaerial exposure occurred during a regressive cycle. The
limestones and claystones show transgression cycles occurred on the shallow
shelf, intertidal lagoons, or tidal flats (Wilkerson 2018). The third is the upper
facies and is comprised of fossiliferous siltstones that are interbedded with
fossiliferous limestones near the top. Fossils observed in the Hensel Formation
include foramnifiera, bivalves, and ostracods. The Hensel Formation is also the
18
lateral equivalent of the Glen Rose Formation west of the Llano Uplift (Jones
and Kullman 1997).
19
Figure 8. This is a paleogeographic representation of depositional systems in Texas of the Trinity Group. This figure also shows how the Llano Uplift contributed to sedimentation to the Maverick Basin. This could indicate the origin for silica rich sediment found in the study area (from Payne 1982).
20
GELN ROSE FORMATION
The Glen Rose Formation is also Aptian age along with the Lower
Edwards Group, however, the Glen Rose is part of the upper Trinity Group. The
Glen Rose is primarily a limestone with interbedded shales and is usually
fossiliferous and primarily composed of bivalves (Bergan 2009). Extensive
marls divide the fossiliferous beds. The upper Glen Rose is distinguishable by
iron staining observed in a marker bed. The lower Glen Rose is recognized by
medium to thick beds of limestones containing Carprinid pelecypods. Dolomites
observed in the Glen Rose are described to have occurred due to telogenetic
processes during diagenesis (Burkholder, 1973).
21
FORT TERRETT FORMATION
The Fort Terrett is found in the west central section of Texas. The most
predominate lithology of the Fort Terrett Formation is a thickly bedded
limestone. It is exposed on the upper hills of Junction as limestone caps.
Deposition of the Fort Terrett Formation occurred within shallow, warm waters
during Albian time of the Cretaceous (Rose 1972).
Rose (1972) divides the Fort Terrett Formation into four informal
members. In ascending order: a basal nodular member, a burrowed member,
a dolomitic member, and on top the Kirschberg Evaporite member. The basal
nodular member of the Fort Terrett has a low percentage of sand which is
terrigenous in source. It also contains a siltstone marl that grades upwards to
a nodular biomicrite with scattered bivalves and gastropods. These members
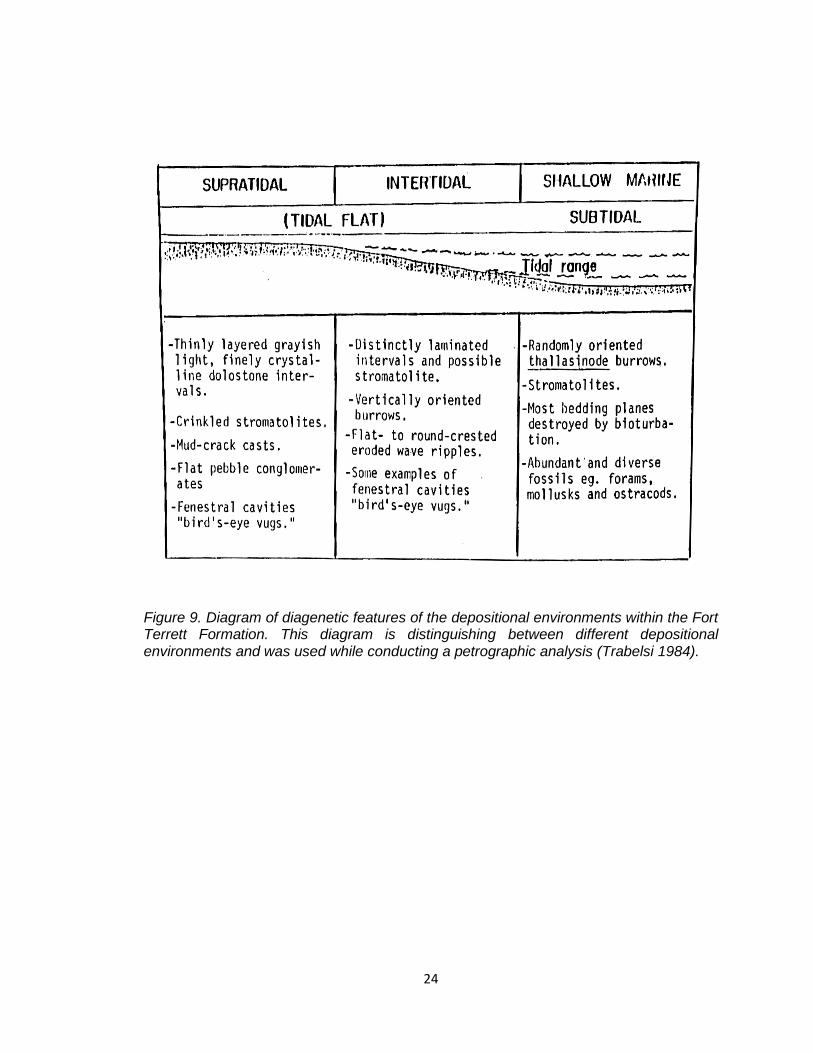
also indicate facies changes ranging from subtidal to supratidal (Figure 9)
(Trabelsi 1984).
The burrowed member ranges between 69 to 88 ft. (21-27 m)
thickness. However, the thickness decreases to roughly 55 ft. (17 m) in
exposure near the Llano Uplift (Trebelsi 1984). The burrowed member is a
massive micrite limestone with scattered dolomitized zones that are more
uncommon trending east toward the Llano Uplift. The burrowed member also
contains thin laminar beds of miliolids, fragments of mollusks, and
22
distinguishable ripple marks and cross bedding. High porosity and permeability
allows the borrowed member to be a significant water-bearing aquifer zone
within the Edwards Group (Trabelsi 1984).
The dolomitic member of the Fort Terrett Formation is comprised of thin
to thick beds that contain fine to medium dolomites. This dolomite bed
alternates with fine mudstone beds. Thickness of the dolomitic member ranges
from 12-27 ft. (4-8m), with thinner sections near the Llano Uplift. Sedimentary
structures observed within the dolomitic member include stromatolite hard
crusts, root casts, mud cracks, ripple marks, current ripples, and planar cross-
bedding (Trabelsi 1984).
The Kirschberg Evaporite Member of the Fort Terrett Formation exhibits
thin-bedded micrite, milioid grainstones and disseminated gray crystalline
dolostones. Distinctive collapse breccias occur in this member of the Fort
Terrett Formation and caused moderate folding structures while other outcrops
display a more horizontal orientation. (Trabelsi 1984). Dissolution of the
underlying sulfates within the Kirschberg evaporites could have caused the
collapse breccias. Trabelsi (1984) stated that the driving mechanisms for
collapse breccia zones could be major sea level regressions, extensive
subaerial exposure, and shifting from a semi-arid climate to subtropical

23
environments. This climate change pattern could be indicative of global
cooling cycles during Aptian (Trabelsi 1984).
24
Figure 9. Diagram of diagenetic features of the depositional environments within the Fort Terrett Formation. This diagram is distinguishing between different depositional environments and was used while conducting a petrographic analysis (Trabelsi 1984).
25
SEGOVIA FORMATION
The disconformity above the Fort Terrett Formation represents the
Segovia Formation which is Aptian in age (Lock 1999). The Segovia
Formation is seen on I-10 traveling West towards the town of Segovia. This
unit is predominately limestone with interbedded marls, dolomite beds, and
possibly breccia collapse zones similar to the ones observed in the Fort Terrett
Formation near Junction (Lock 1999). The Segovia Formation has not been
carefully studied in the Junction area. Described by Lock (1999), the Segovia
Formation is separated into three members. First is known as the Marl
Member, then the Minor Member, and lastly the Black Bed Member. The
Segovia Formation has excellent bed ammonite used as marker beds. These
ammonites can be found through much of the Segovia Formation as it extends
across west Texas. Similar to the Fort Terrett Formation and Glen Rose
Formation, the Segovia Formation is also interpreted to be a third order cycle,
showing a large transgression which produces a disconformity at the top of the
Fort Terrett Formation (Lock 1999).
26
STUDY AREA
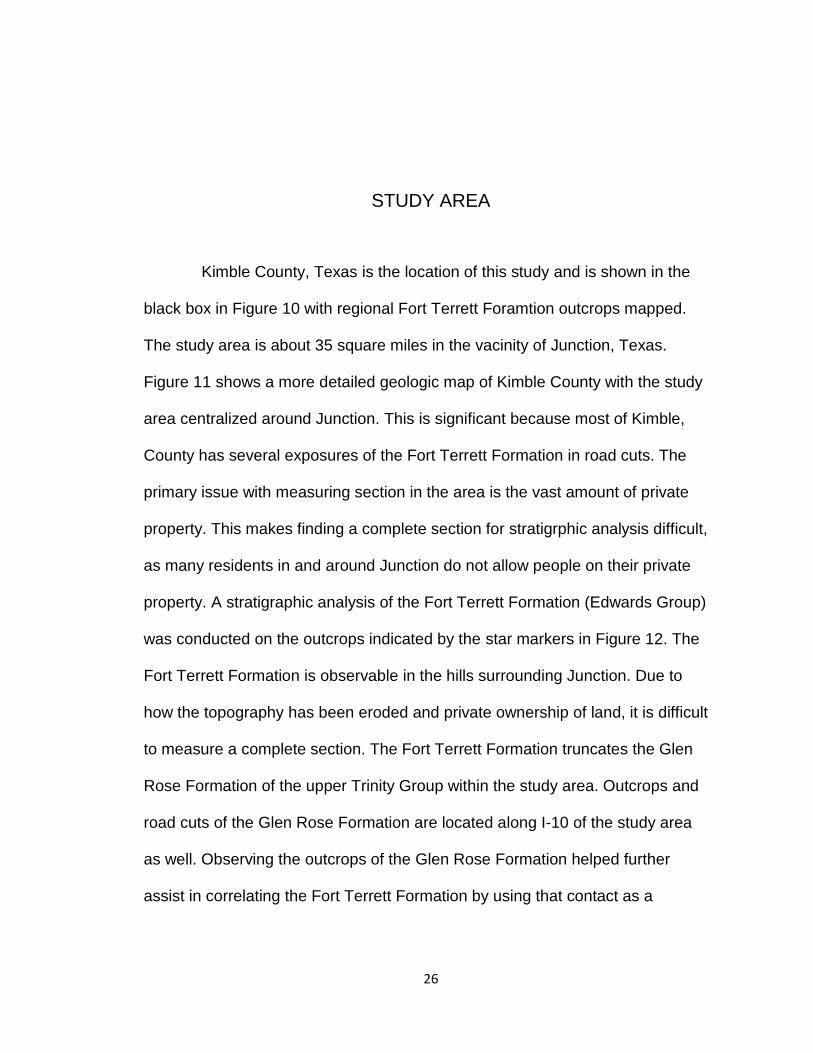
Kimble County, Texas is the location of this study and is shown in the
black box in Figure 10 with regional Fort Terrett Foramtion outcrops mapped.
The study area is about 35 square miles in the vacinity of Junction, Texas.
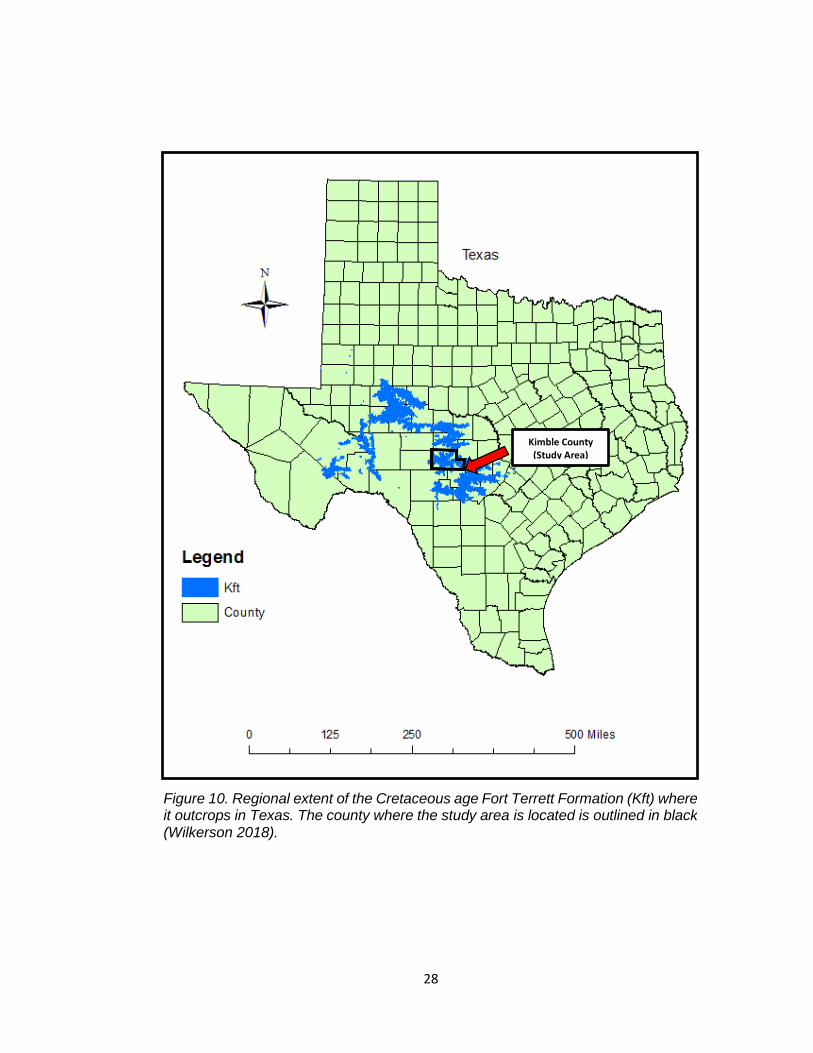
Figure 11 shows a more detailed geologic map of Kimble County with the study
area centralized around Junction. This is significant because most of Kimble,
County has several exposures of the Fort Terrett Formation in road cuts. The
primary issue with measuring section in the area is the vast amount of private
property. This makes finding a complete section for stratigrphic analysis difficult,
as many residents in and around Junction do not allow people on their private
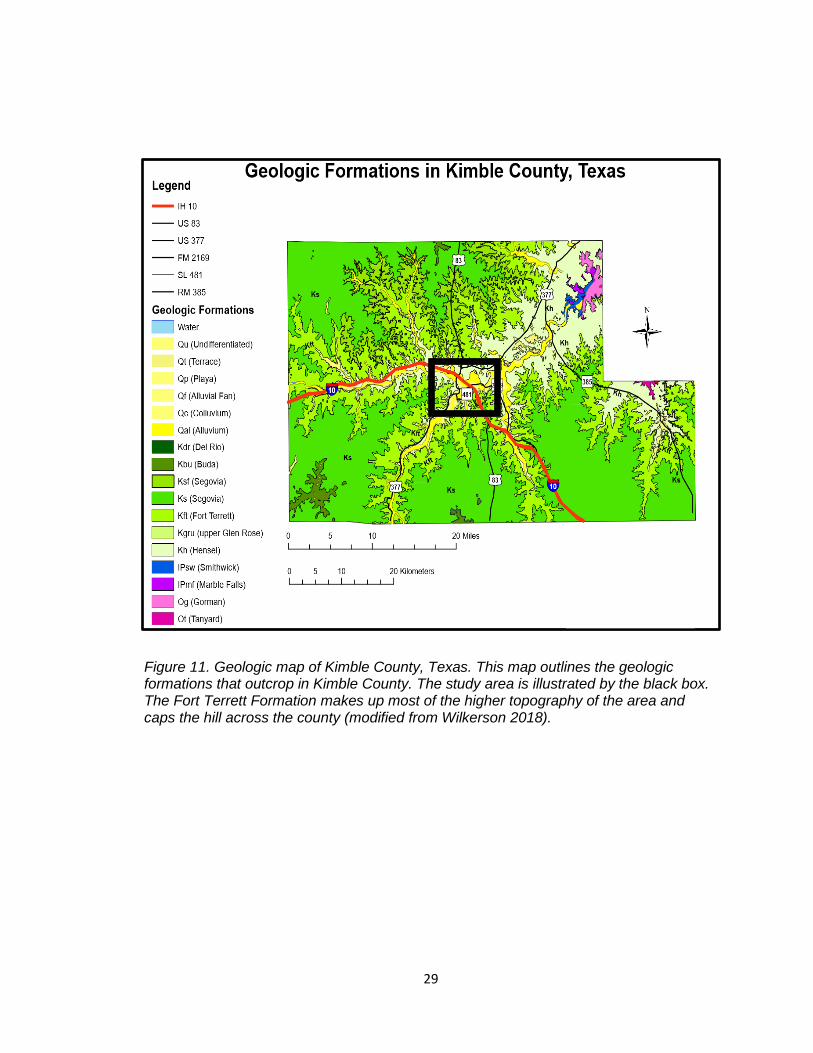
property. A stratigraphic analysis of the Fort Terrett Formation (Edwards Group)
was conducted on the outcrops indicated by the star markers in Figure 12. The
Fort Terrett Formation is observable in the hills surrounding Junction. Due to
how the topography has been eroded and private ownership of land, it is difficult
to measure a complete section. The Fort Terrett Formation truncates the Glen
Rose Formation of the upper Trinity Group within the study area. Outcrops and
road cuts of the Glen Rose Formation are located along I-10 of the study area
as well. Observing the outcrops of the Glen Rose Formation helped further
assist in correlating the Fort Terrett Formation by using that contact as a

27
datum.These thinnly bedded limestone units and chert layers have been
lumped together as one unit in previous studies and thesis but are dissected in
this study.
28
Figure 10. Regional extent of the Cretaceous age Fort Terrett Formation (Kft) where it outcrops in Texas. The county where the study area is located is outlined in black (Wilkerson 2018).
Kimble County (Study Area)
29
Figure 11. Geologic map of Kimble County, Texas. This map outlines the geologic formations that outcrop in Kimble County. The study area is illustrated by the black box. The Fort Terrett Formation makes up most of the higher topography of the area and caps the hill across the county (modified from Wilkerson 2018).
30
2 miles miles
Figure 12. This map shows the locations of the 9 measured sections used for the purpose of this thesis. Most measured sections are done along Interstate Highway 10, however, a couple are measured along Highway 377 and 484. This was done to create a greater spatial distribution.
31
METHODOLOGY
Nine sections were measured in the Junction area along I-10 using a
Jacob-Staff method and a measuring tape. Hand samples of limestone and
chert were collected along every section. Samples were labeled and bagged
and GPS locations were given for all sections. Photos of outcrops were taken.
Hand samples were described in the laboratory using a binocular microscope.
Forty samples were then selected based on the lithologies. Two chert
samples were selected from the study area. Thin sections were cut into 2X1”
billets. The billets were then studied using a petrographic microscope. A
petrographic analysis included a 300 point count manually, to determine rock
lithology based on the Folk (1959) classification for carbonate rock. Six different
facies were recognized based on lithology changes and biodiversity. Sixteen
billets were selcted based on their facies distribution, allochems, and unique
diagenetic features. Billets were then sent to Spectrum Petrographics in
Vancouver, Washington. Thin sections were cut and stained with Alizerin Red S
to differentiate dolomite from calcite. Diagenesis history of the Fort Terrett
Formation was also developed based on the petrogrpahic analysis. Lastly,
dolomization was further analuzed from diagenesis and a dolomization model

32
was constructed based on literature review, petrographic analysis, and an
examination of dolomization patterns.
33
STRATIGRAPHIC ANALYSIS
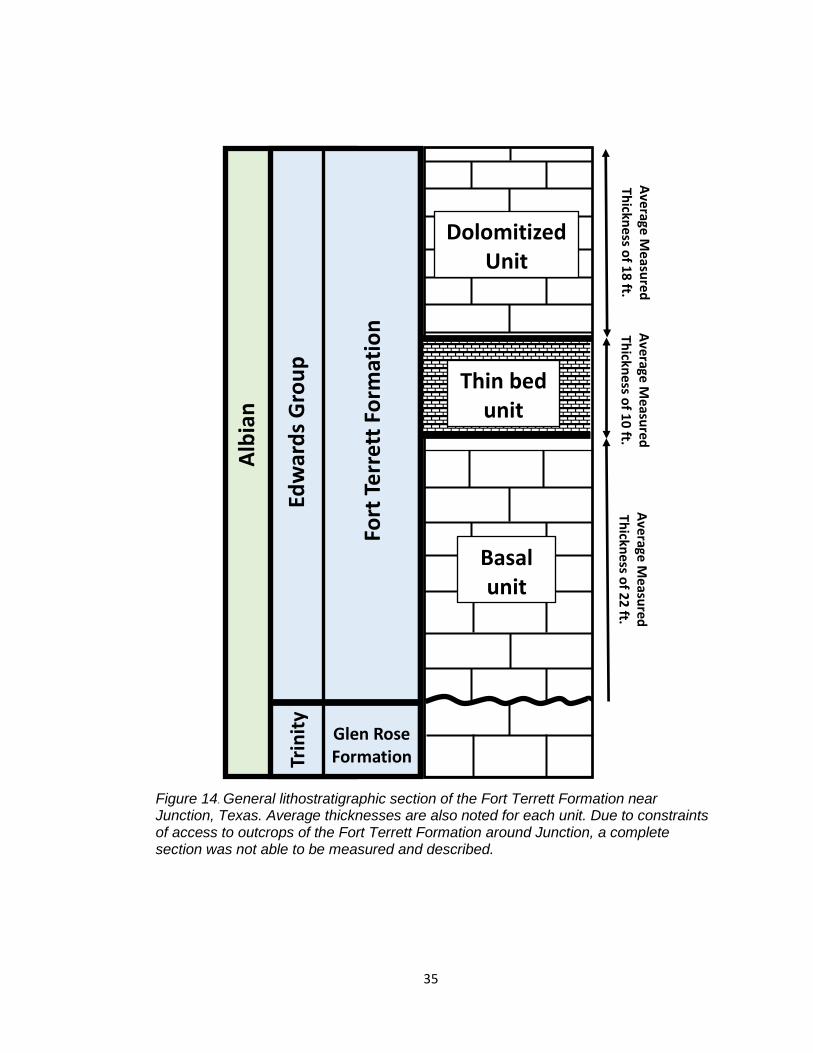
A stratigraphic analysis was done using 9 measured sections of the Fort
Terrett Formation near Junction, Texas. As previously noted, the Fort Terrett
Formation makes up the upper most topography of the Junction area (Figure 13)
The Fort Terrett Formation was split into 3 informal lithostratigraphic units
through the study area and described by lithology, allochems, sedimentary
features, and sedimentary structures. These 3 lithostratigraphic units will be
referred to as the basal unit, the thin bed unit, and the dolomitized unit for the
purpose of a general lithostratigraphic column (Figure 14) for Junction and a
stratigraphic correlation.
34
Kft
Kh
Kgr
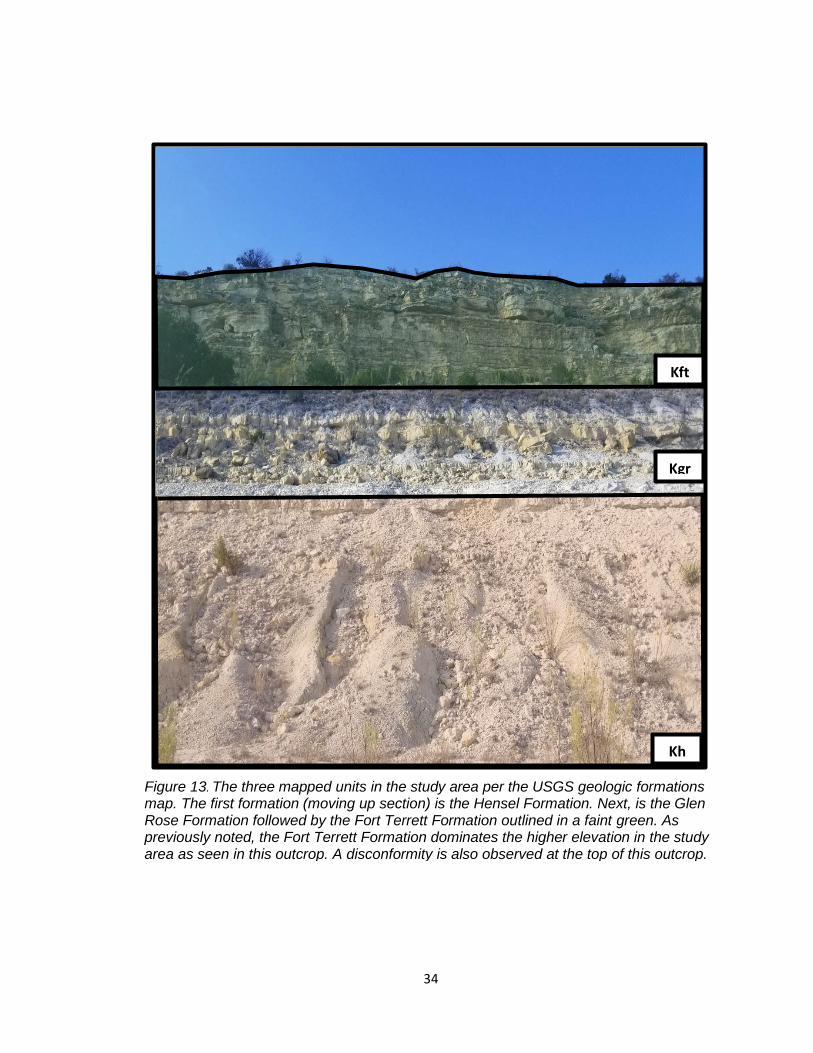
Figure 13. The three mapped units in the study area per the USGS geologic formations map. The first formation (moving up section) is the Hensel Formation. Next, is the Glen Rose Formation followed by the Fort Terrett Formation outlined in a faint green. As previously noted, the Fort Terrett Formation dominates the higher elevation in the study area as seen in this outcrop. A disconformity is also observed at the top of this outcrop.
35
Glen Rose Formation
Fort
Te
rre
tt F
orm
atio
n
Edw
ard
s G
rou
p
Trin
ity
Alb
ian
Ave
rage M
easure
d
Thickn
ess o
f 22
ft.
Ave
rage M
easu
red
Th
ickness o
f 18
ft. A
verage M
easure
d
Thickn
ess o
f 10
ft.
Basal unit
Thin bed unit
Dolomitized Unit
Figure 14. General lithostratigraphic section of the Fort Terrett Formation near Junction, Texas. Average thicknesses are also noted for each unit. Due to constraints of access to outcrops of the Fort Terrett Formation around Junction, a complete section was not able to be measured and described.
36
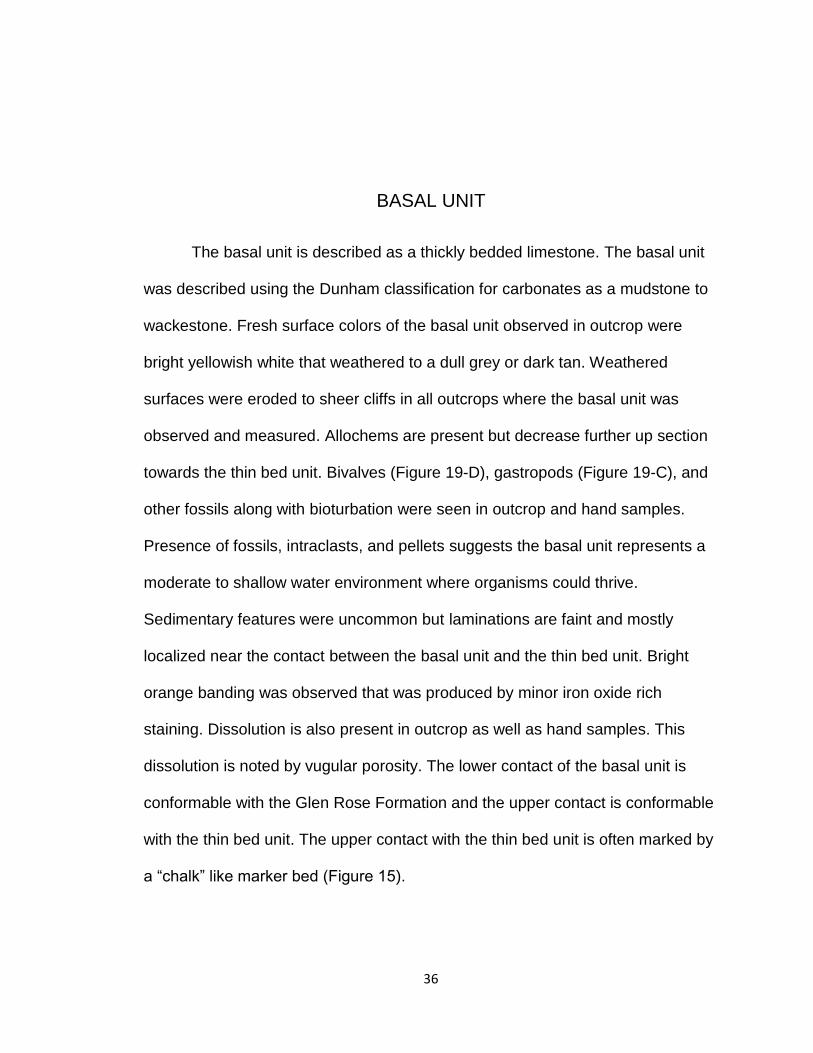
BASAL UNIT
The basal unit is described as a thickly bedded limestone. The basal unit
was described using the Dunham classification for carbonates as a mudstone to
wackestone. Fresh surface colors of the basal unit observed in outcrop were
bright yellowish white that weathered to a dull grey or dark tan. Weathered
surfaces were eroded to sheer cliffs in all outcrops where the basal unit was
observed and measured. Allochems are present but decrease further up section
towards the thin bed unit. Bivalves (Figure 19-D), gastropods (Figure 19-C), and
other fossils along with bioturbation were seen in outcrop and hand samples.
Presence of fossils, intraclasts, and pellets suggests the basal unit represents a
moderate to shallow water environment where organisms could thrive.
Sedimentary features were uncommon but laminations are faint and mostly
localized near the contact between the basal unit and the thin bed unit. Bright
orange banding was observed that was produced by minor iron oxide rich
staining. Dissolution is also present in outcrop as well as hand samples. This
dissolution is noted by vugular porosity. The lower contact of the basal unit is
conformable with the Glen Rose Formation and the upper contact is conformable
with the thin bed unit. The upper contact with the thin bed unit is often marked by
a “chalk” like marker bed (Figure 15).
37
Basal unit
Thin bed unit
“Chalk” Marker
Figure 15. This outcrop shows the conformable surface between the basal unit and the thin bed unit in the study area. This contact is also easily distinguished by the "chalk" like surface of the basal unit. Also noted in this figure (red arrow) is another chalk like surface that possibly indicates a facies changes in the Fort Terrett Formation (Rock hammer for scale).
38
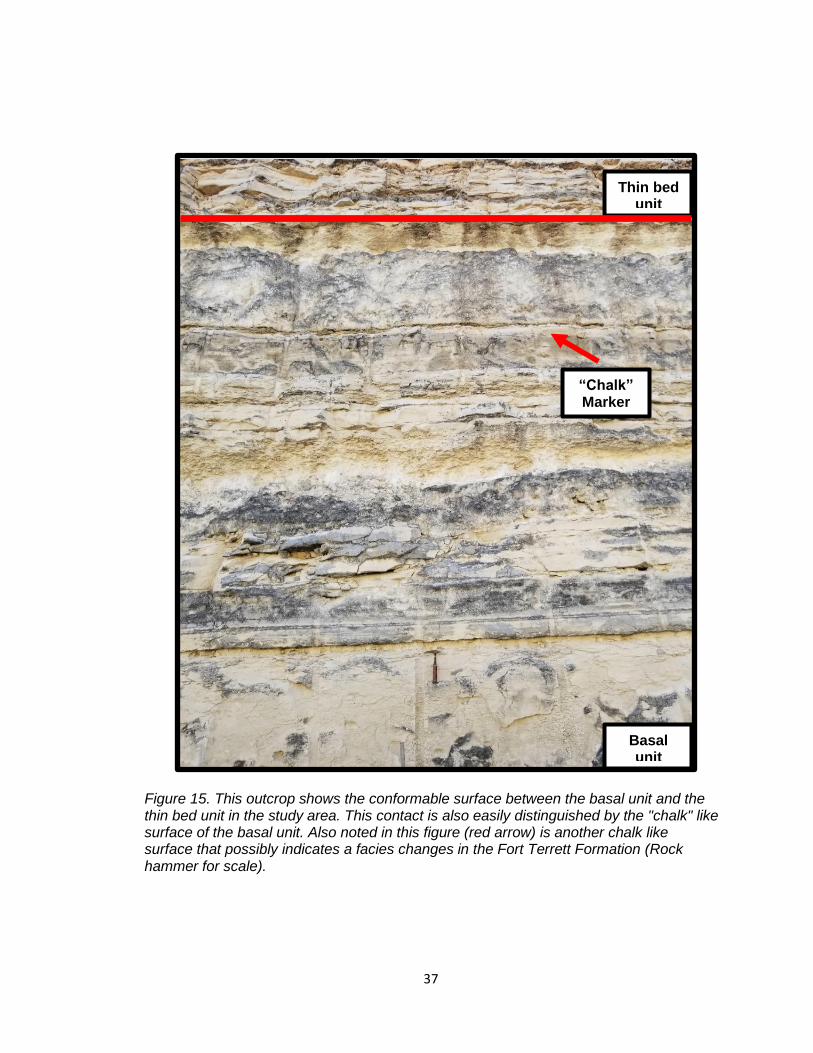
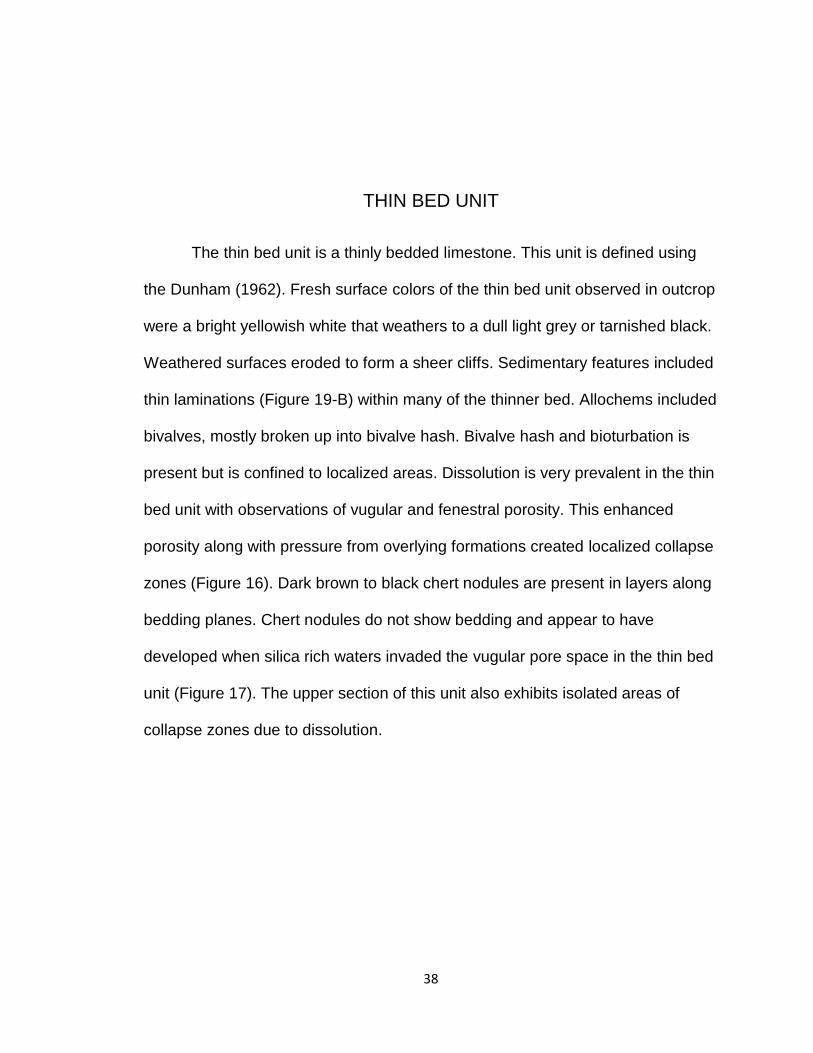
THIN BED UNIT
The thin bed unit is a thinly bedded limestone. This unit is defined using
the Dunham (1962). Fresh surface colors of the thin bed unit observed in outcrop
were a bright yellowish white that weathers to a dull light grey or tarnished black.
Weathered surfaces eroded to form a sheer cliffs. Sedimentary features included
thin laminations (Figure 19-B) within many of the thinner bed. Allochems included
bivalves, mostly broken up into bivalve hash. Bivalve hash and bioturbation is
present but is confined to localized areas. Dissolution is very prevalent in the thin
bed unit with observations of vugular and fenestral porosity. This enhanced
porosity along with pressure from overlying formations created localized collapse
zones (Figure 16). Dark brown to black chert nodules are present in layers along
bedding planes. Chert nodules do not show bedding and appear to have
developed when silica rich waters invaded the vugular pore space in the thin bed
unit (Figure 17). The upper section of this unit also exhibits isolated areas of
collapse zones due to dissolution.
39
Figure 16. This outcrop shows a visual representation of the thin bed unit in the study area. Note the then beds with linear chart nodules in them (red arrow). Dissolution is prevalent and creates small localities of collapse zones in this unit (Rock hammer for
scale).
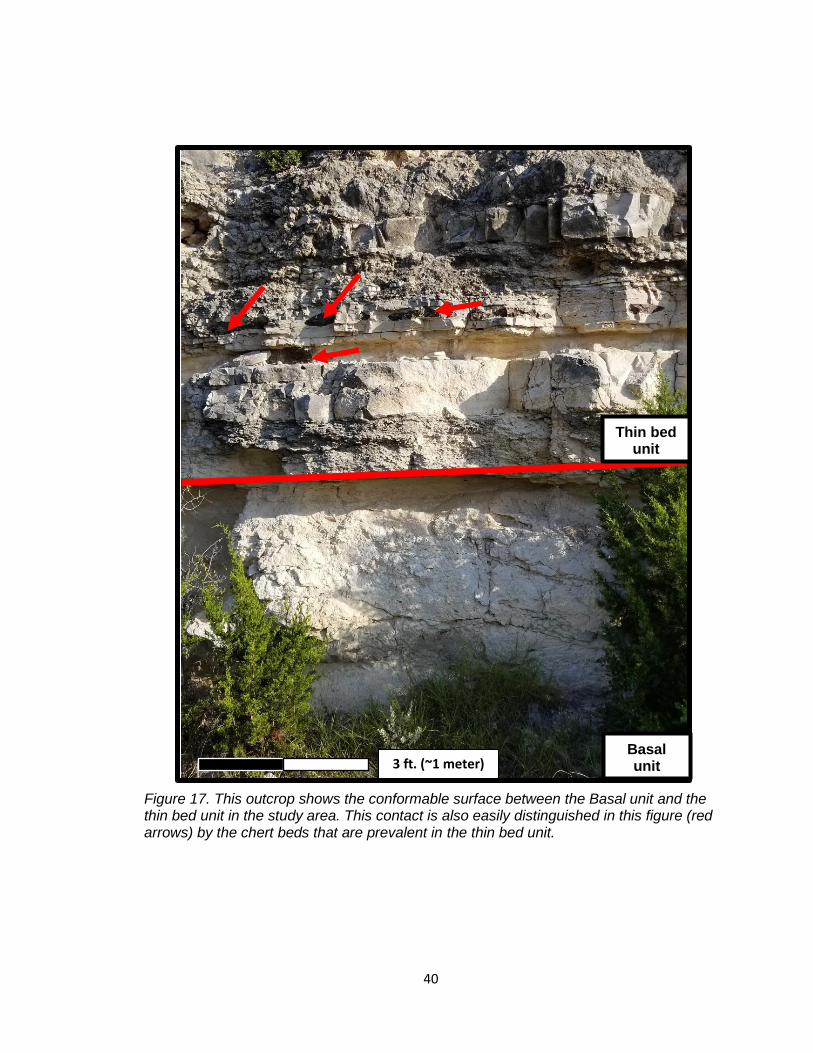
40
Basal unit
Thin bed unit
Figure 17. This outcrop shows the conformable surface between the Basal unit and the thin bed unit in the study area. This contact is also easily distinguished in this figure (red arrows) by the chert beds that are prevalent in the thin bed unit.
3 ft. (~1 meter)
41
DOLOMITIZED UNIT
The dolomitized unit is described as a thick to massive bedded limestone.
This unit is interpreted, using the Dunham (1962) classification of limestones, as
a mudstone to wackestone. Fresh surface colors of the dolomitized unit are a
bright yellowish white to white that weathers to a dull grey or tan. Outcrops of the
dolomitized unit weather to form a sheer cliff (Figure 18). Allochems are present
but not as prevalent as the thin bed unit. Allochems for the dolomitized unit
include bivalves, bryozoans, and peloids. Sedimentary features are not common
but bioturbated surfaces and minor patches of bivalve hash were noted in hand
samples. Bioturbation is represented by burrowed surfaces. The upper contact
for the dolomitized unit and the Fort Terrett Formation is heavily impacted by
dissolution. Dissolution includes vugular and fenestral porosity which is seen in
several hand samples (Figure 19-A). Laminations are also seen near the contact
between the thin bed unit and the dolomitized unit. These laminations look similar
to thin bedding in thickly bedded limestones.
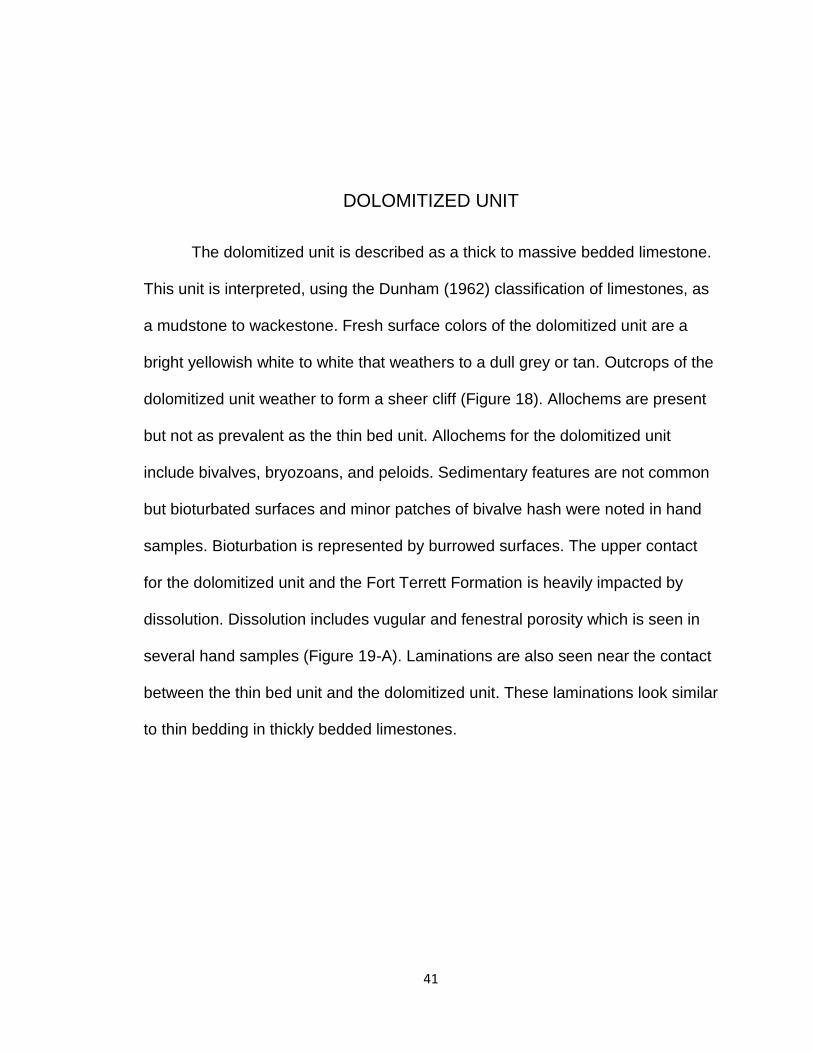
42
Thin bed unit
Dolomitized Unit
Figure 18. This outcrop shows the surface between the thin bed unit and the dolomitized unit in the study area. This surface is somewhat difficult to distinguish in many outcrops due to the increase dissolution seen in the dolomitized unit. The thicker, tarnished grey bed is used as the contact for these surfaces as well as the point where chert nodules are no longer observed.
3 ft. (~1 meter)
43
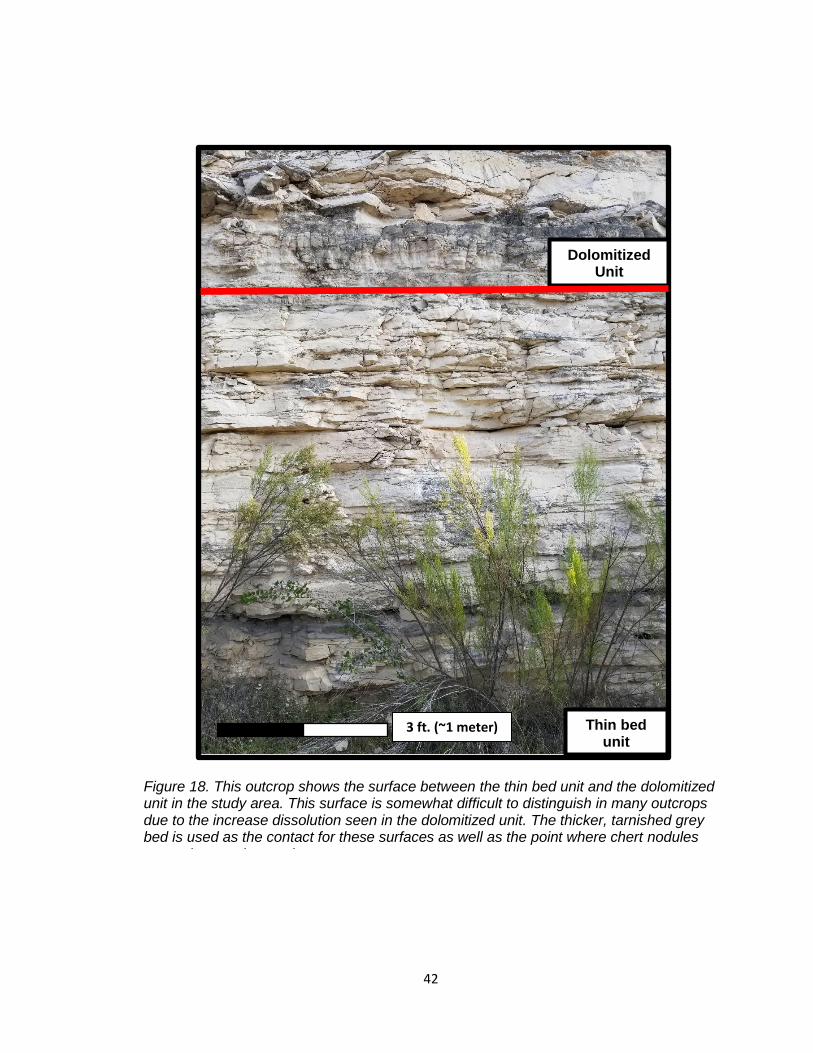
D.
Figure 19 shows sedimentary features observed in hand samples collected at various road cuts. A. shows vugular porosity which is also observable in thin section. B. shows thin laminations that can be seen within the thin bed unit of the measured sections. C shows a gastropod, which is an uncommon allochems observed in the Fort Terrett Formation near Junction. D. shows bioturbation as well as dissolution from the basal unit of the measured sections.
A.
C.
B.
44
PETROGRAPHIC ANALYSES
Forty samples were studied from each of the three units from different
measured sections. Billets from those forty samples underwent a preliminary
facies analysis and the billets were divided based on facies trends, allochems,
and their localities. Sixteen billets were selected and sent to Spectrum
Petrographics Inc. in Vancouver, Washington, to be cut into thin sections. Of the
sixteen samples chosen to be cut, fourteen were limestones of the three
lithostratigraphic units and the other two were from chert nodules. The
petrographic analyses was conducted using the Folk (1959) classification to
determine depositional environment and diagenesis. A 300 point count was done
to determine allochems, matrix, and lithic percentages for each thin section.
FACIES ANALYSES
Facies analyses of the Fort Terrett Formation was done using the 40
billets and 16 petrographic thin sections. Facies for the purpose of this thesis are
labeled as F1 through F6 to distinguish changes in depositional environment.
Based on the data collected by facies analyses, the Fort Terrett Formation was
divided into 6 significant facies changes. These facies changes were determined
by 3 factors: allochems, diagenetic features, and matrix percentages. Either one

45
or a combination of these factors allowed for 6 divisions to be made within the 3
lithostratigraphic units mapped in the Junction area. Figure 20 shows a detailed
stratigraphic column with these divisions as well as allochems and key features
identified in each facies. Figure 21 is the legend for allochems and key features
that are detailed in Figure 20.
46
F1
F6
F5
F4
F3
F2
Bas
al u
nit
D
olo
mit
ized
un
it
Thin
be
d u
nit
Fort
Te
rre
tt F
orm
atio
n
Edw
ard
s
Alb
ian
Q
Q
Ag
e
Gro
up
Fo
rmati
on
Lit
ho
log
ical
Un
it
Facie
s
Lithology Allochems/
Key Features
Figure 20. This figure shows a detailed start column of the Fort Terrett Formation. The Fort Terrett Formation is split into 3 lithostratigraphic units (Basal unit, thin bed unit, and the dolomitized unit). Those three units are then split into 6 facies (F1, F2, F3...Etc.). Fossils and key features for each facies are also displayed.
47
Figure 21. The legend used for the detailed stratigraphic column in Figure 20
Q
Bivalves
Bryozoans
Burrows
Chert Nodules
Foraminifera
Peloids
Sponges
Quartz Grains
Echinoids
Gastropods
Dolomite
Allochem/Key Features Symbols
Algae

48
SPARSE BIOMICRITE (F1)
Facies 1 (F1) consists of all of the Basal unit. Allochems include bivalves,
foraminifera, miliods, and calcareous sponges. Porosity in this facies was not
well established or observed in petrographic analysis. Only a couple fractures
were observed, in which calcite filled in the pore space. F1 was interpreted as a
shallow carbonate shelf lacking in biodiversity. Water depths could range from 10
meters to 50 meters which explains the sparse biodiversity in F1 as well as the
Basal unit. This facies is interpreted as a sparse biomictite (Figure 22). Lack of
allochems and a dominate micrite matrix allows for a moderate to shallow water
level. This facies is considerably thick ranging from 8 to 16 ft in measured
section. There are also no indication of porosity meaning F1 did not undergo
significant telogenesis events such as dissolution or dolomization.
49
A.
Figure 22. This thin section represents F1 and is a sparse biomicrite. Allochems are common but are not the primary makeup of the matrix. Noted in this thin section is bladed calcite infilling pore space in a bivalve fragment (A). Calcareous sponges as well as miliods are common for this facies. This facies represents a subtidal environment with a moderate sea level. F1 has a very diverse set of allochems unlike the other facies which is also representative of a quiet, warm water setting.
4X Magnification CPL
2.00mm
50
DOLOMITIZED SPARSE BIOMICRITE (F2)
F2 is the next facies division and also the beginning on the thin bed unit.
Petrography analysis of F2 shows a sparse biosparite (Figure 23) but with a
small increase in biodiversity from F1. There is also the presence of quartz grains
which suggest some terrigenous influence on this facies. This could be possible
due to lowering sea level and fluvial processes prograding toward the carbonate
platform or shelf. The Llano Uplift was an island during this time and was
proximal to the Junction area. Another difference from F1 is the presence of
dolomite within the micrite matrix. There is a small increase in porosity for F2 due
to dolomization occurring. The presence of dolomite suggests there is also a
significant diagenesis event happening in F2, post deposition. Dolomization
diagenesis and models for dolomite will be further discussed to explain this
event. Allochems are more prevalent in F2 than in F1 and include bivalves,
peloids, and various unidentifiable fossils within the matrix. F2 was interpreted as
an intertidal depositional environment as the first facies of the thin bed unit.
Dolomite and quartz are also present in a calcite spar matrix which indicates
minimal sediment influx from terrigenous sources. Oxidation is also seen as dark
brown patches of iron oxide that occupy interparticle porosity zones between the

51
calcite and dolomite. Thickness for this facies ranges from 2 to 5 ft. (0.6-1.5 m) in
measured section.
52
B.
A. 10X Magnification
PPL
C.
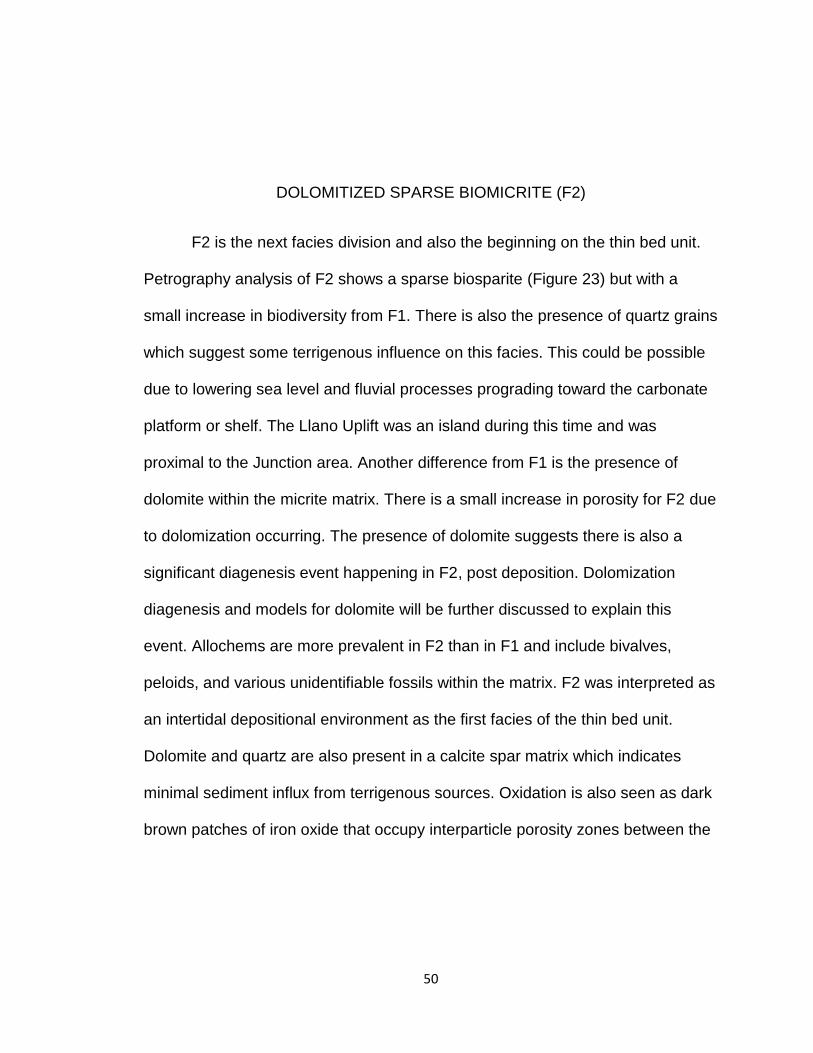
Figure 23. This thin section represents F2 and is inferred as a dolomitized sparse biomicrite.
Allochems (A) in F2 are more abundant and more abundant. There is also the addition of quartz grains (B), most likely imported from the Llano
Islands to the north east of the study area. Dolomite is also very prevalent within the matrix
which is not observed in F1. Dolomite is described as subhedral to euhedral dolomite within the
micrite matrix. Brown staining (C.) indicates fresh water flushing with iron rich waters.
2.00mm
53
BIVALVE PACKED BIOMICRITE (F3)
F3 is the next facies of lithostratigraphic the Thin bed unit. Petrography
analysis of F3 (Figure 24) shows a packed biomicrite within an intertidal to
shallow subtidal environment. The abundance of biodiversity such as bivalves,
micropeloids and calcareous sponges is significantly greater than the two
previous facies. This facies has indication that the bivalve fragments were
imbricated, possibly deposited on a tidal flat. The bivalve fragments are also
responsible for the primary porosity within this facies. There is a lack of sponge
spicules within the chert nodules which is indicative of inorganic origin. Chert
nodules observed in F3 (Figure 25) also display dissolution with splays of
megaquartz filling the voids. Along the rims of the filled voids is vibrant
chalcedony which also indicates silica replacement. Most silica replacement that
does occur usually does within organic rich materials such as bivalve shells,
ooids, burrows, and stromatolites (Jacka 1974) and there are indications of the
onset of localized biostromes. These small mounds could have been dissolved
out and replaced by silica rich waters. This replacement produced nodules that
are generally linear to each other in outcrop view.
54
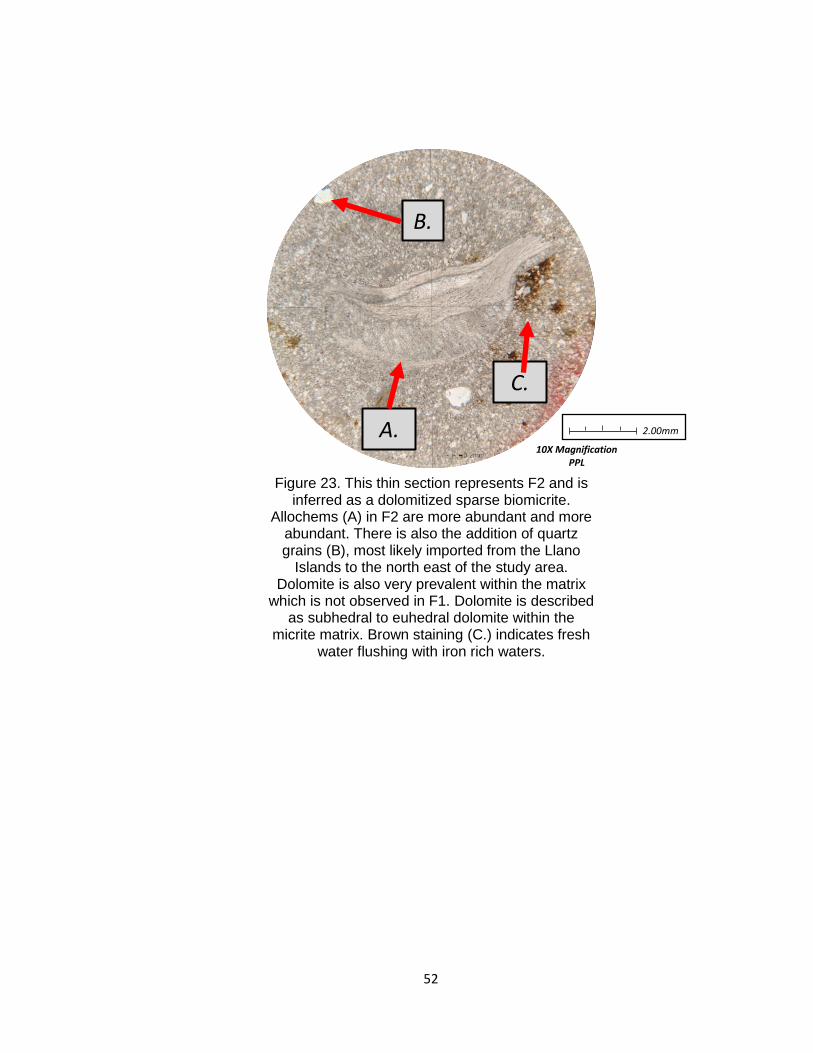
A.
Figure 24. This thin section represents F3 and the second facies of the thin bed unit. Petrography analysis of F3 shows a packed biomicrite within an intertidal to shallow subtidal environment. The abundance of biodiversity such as bivalves (A), micropeloids and calcareous sponges is significantly greater than the two previous facies. This facies has indication that the bivalve fragments were imbricated, possibly transported up against a tidal flat. The bivalve fragments are also responsible for the primary porosity within this facies.
10X Magnification PPL
2.00mm
55
A.
B.
Figure 25. This thin section represents the chert nodules found in F3. Chert nodules observed in F3 also display dissolution with splays of megaquartz filling the voids. This also seen in preserved allochems such as this mollusk shell (A.) with subhedral quartz infilling pore space. Along the rims of the filled voids is vibrant chalcedony (B.) which also indicates silica replacement. Most silica replacement that does occur usually does within organic rich materials such as bivalve shells
10X Magnification CPL
2.00mm
56
PELOIDAL MICROSPAR (F4)
F4 is the first facies of lithostratigraphic the dolomitized unit and is
interpreted as an intertidal to subtidal facies. Petrographic analysis shows a
poorly washed biosparite (Figure 26) where biodiversity diminishes greatly. There
is a complete lack of dolomite with almost complete recrystallization or
microspar. There is an abundance of intraparticle porosity seen in thin section as
well. This porosity could explain the almost complete lack of allochems for this
facies. Microspar indicates replacement of arogonitic shells or pelletal material in
the matrix but crystal sizes are not large enough to indicate meteoric influence is
the cause of recrystallization. This recrystallization results from stagnant sea
water settling in underlying facies allowing for recrystallization to occur of the
micrite mud matrix. This is a late stage marine diagenesis as lower strata gets
buried. Allochems were most likely dissolved out later during a mesogenesis or
telogenesis event.
57
A.
Figure 26. This thin section shows F4 which is the first facies of lithostratigraphic the dolomitized unit and is interpreted as an intertidal to subtidal facies. Petrographic analysis shows a poorly washed biosparite with a significant lack of biodiversity. There are also no indications of dolomite with very little micrite. Intraparticle porosity (A.) dominates the calcite spar matrix for this facies. This porosity could explain the almost complete lack of allochems for this facies. Calcite spar indicates replacement of arogonitic shells and micrite in
the matrix.
4X Magnification CPL
2.00mm
58
POROSITY RICH SPARSE BIOMICRITE (F5)
F5 is the next facies in the dolomitized unit and is interpreted as a subtidal
facies and. F5 is similar to F4, however, there is a complete lack of calcite spar
within the matrix. Petrographic analysis showed a sparse biomicrite (Figure 27).
Allochems are also present in this facies and include bivalves with large porosity
vugs or interparticle porosity. Dissolution was prevalent in this facies and also
has indications of silica replacement like F3. Within the thin lamellae of some
bivalves is chalcedony replaced along the rims of the silica filled porosity. This
facies could also indicate a standstill in sea level which allowed for organisms to
grow to such a larger size when compared to other facies.
59
A.
B.
C.
Figure 27. This thin section shows a sparse biomicrite from F5 and is the next facies in the dolomitized unit. This facies is interpreted as a subtidal facies. F5 is similar to F4, however, there is a complete lack of calcite spar within the matrix. Allochems are also present in this facies and include bivalves (A.) with large porosity vugs (B.) or interparticle porosity. Dissolution was prevalent in this facies and also has indications of silica replacement (C.) like F3. Within the thin lamellae of some bivalves is chalcedony replaced along the rims of the silica filled porosity. This facies could also indicate a standstill in sea level which allowed for organisms to grow to such a larger size when compared to other facies.
10X Magnification CPL
2.00mm
60
DOLOMITIZED MICRITE (F6)
F6 is the last facies of the upper part of the dolomitized unit and the Fort
Terrett Formation in the Junction area. Petrographic analysis of F6 is described
as a dolomitized micrite (Figure 28) and was interpreted to be a subtidal
depositional environment where dolomite is very dominate within the matrix.
Allochems are rare and mostly make up small bivalve fragments. Well
developed, euhedral dolomite rhombs are observed within thin section and filled
much of the void space in the micrite cement. The presence of dolomite indicates
this facies is an intertidal to supratidal facies, similar to F2, but dolomization is
not related to depositional environment in the Fort Terrett Formation.
Dolomization in F2 and F6 will be further explained in the diagenesis section.
61
C.
Figure 28. This thin section shows a dolomitized sparse biomicrite of F6. F6 is the last facies of the upper part of the dolomitized unit. This facies is described was interpreted to be an intertidal to supratidal depositional environment where dolomite is very dominate within the matrix. Well developed, subhedral dolomite rhombs (A.) are observed within thin section and fill much of the void space in the calcite spar cement. There is also scattered grains of quartz (B.) which indicates fluvial influence on this facies, most likely originating from the Llano Islands to the north east of the study area. Allochems in this facies are not very common but do include preserved bryozoans (C.), which are exclusive to this facies. Again, fresh water diagenesis is primarily responsible for the dissolution and dolomite replacement. This event of dolomization is most likely a separate event from the dolomization that occurs in F2.
B.
A.
10X Magnification CPL
2.00mm
62
DIAGENESIS
Several diagenetic events have occurred within the Fort Terrett
Formation which in includes syndepositional and post depositional events.
Changes in sea level are the primary factors contributing and controlling to earlier
diagenetic changes such as micritization, cementation, and dolomization. Post
depositional events that induced diagenetic changes includes burial and
compaction, hydrothermal diagenesis, and dissolution. Telogenesis resulted in
several significant changes such as enhancing porosity and oxidation. Three
main diagenetic events that occurred include shallow marine diagenesis,
burial/compaction, hydrothermal, and telogenesis. A model for diagenesis (Figure
29) has been constructed outlining the main events that impacted the Fort Terrett
Formation. Specific sub diagenetic events are also shown in this model to better
explain diagenetic features observed in thin section. Each diagenetic events is
further explained in the following sections along with the sub events that
accompany them. The model proposed is also supported by the petrographic
analyses of the Fort Terrett Formation.
63
Hyd
roth
erm
al
•H
ydro
ther
mal
D
olo
miz
atio
n
•H
ydro
ther
mal
Si
licif
icat
ion
Earl
y B
uri
al
•C
om
pac
tio
n
•D
isso
luti
on
Shal
low
Mar
ine
Dia
gen
esis
•D
epo
siti
on
an
d
Pre
cip
itat
ion
•
Cem
enta
tio
n
•M
icri
tiza
tio
n
•R
ecry
stal
lizat
ion
(Mic
rosp
ar)
Me
sozo
ic
Cre
tace
ou
s P
ale
oge
ne
Ne
oge
ne
Ce
no
zoic
Late
Bu
rial
•
Dep
osi
tio
n o
f Se
govi
a Fo
rmat
ion
•
Late
Sta
ge B
uri
al
Do
lom
izat
ion
•
Silic
ific
atio
n
Exp
osu
re
•D
isso
luti
on
•
Oxi
dat
ion
Fig
ure
29. T
his
is a
model fo
r dia
genesis
for
the fort
Terr
ett F
orm
ation
. T
his
model ill
ustr
ate
s w
hen
sig
nific
ant
events
occu
rre
d.
Four
prim
ary
events
occurr
ed f
or
the F
ort
Terr
ett F
orm
atio
n n
ea
r p
rese
nt
day J
unctio
n.
Those
inclu
de
sh
allo
w m
arine d
iage
ne
sis
, b
uria
l d
iage
ne
sis
, h
ydro
therm
al d
iage
ne
sis
, a
nd
te
loge
ne
sis
. S
pecific
su
b d
iage
netic e
vents
are
als
o s
how
n in t
his
mo
de
l to
bett
er
exp
lain
d
iage
ne
tic f
eatu
res o
bserv
ed in
th
in s
ectio
n.
64
SHALLOW MARINE DIAGENESIS
Shallow marine diagenesis is the first syndepositional event to occur in the
late Cretaceous. Micritization of lower facies as well as the presence of bladed
calcite in several allochems. The occurrence of bladed calcite within bioclastic
material suggests early marine diagenesis (Bathurst 1966). This also indicates
that earlier facies were developed in calm waters in a moderately subtidal
environment. Micritization is very prevalent throughout several thin sections of F1
which is observed in the matrix as well as a few allochems with micritic
envelopes. The process of micritization was explained by Bathusrt (1966) to be
the alteration of original skeletal or grain fabric to a microcrystalline texture. This
is done by boring blue-green burrowing into carbonate grains or fabric with an
eventual filling of the burrows with micrite. Figure 30 shows a thin micritic
envelope around a small bivalve and gastropods which indicates shallow marine
diagenesis. This process is also seen in a packed biomicrite (Figure 31) where
the outer shells of bivalves and a gastropod have been burrowed away and
subsequently filled with micrite. Figure 32 shows the micritization process where
burrowing occurred into the allochems versus just around the rim. Those
microborings in the allochems were then infilled with micrite. Small areas of
bladed calcite are also observed within the burrowed bivalve shell. Calcite spar is
65
observed in F4 and scattered allochems which may suggest meteoric diagenesis
and possible exposure of the Fort Terrett Formation. There is evidence of
burrowing and bioturbation but this is not exclusive to sabka or supratidal facies.
There were no instance of desiccations cracks or ryzoliths observed in the study
area or petrographic analyses. There is also a lack of calcite spar being a
primary cement or calcite rims around allochems that could suggest meteoric
flushing. In instances where calcite spar is present, sea levels became stagnant
and calcite spar is a result of recrystallization as water settled in lower lying
facies. Figure 33 shows an allochem selectively dissolved and replaced by
calcite spar. However the rest of the matrix is predominately micrite mud. In F4
(Figure 34) micro spar makes up the complete matrix of the facies and allochems
are completely removed from F4. Marine diagenesis is best comprised of
continual deposition of the Fort Terrett Formation in the Junction area with
periodic times of prolonged water stagnation in underlying facies. This process of
recrystallization is responsible for the calcite spar observed in F4 during the
petrographic analysis.
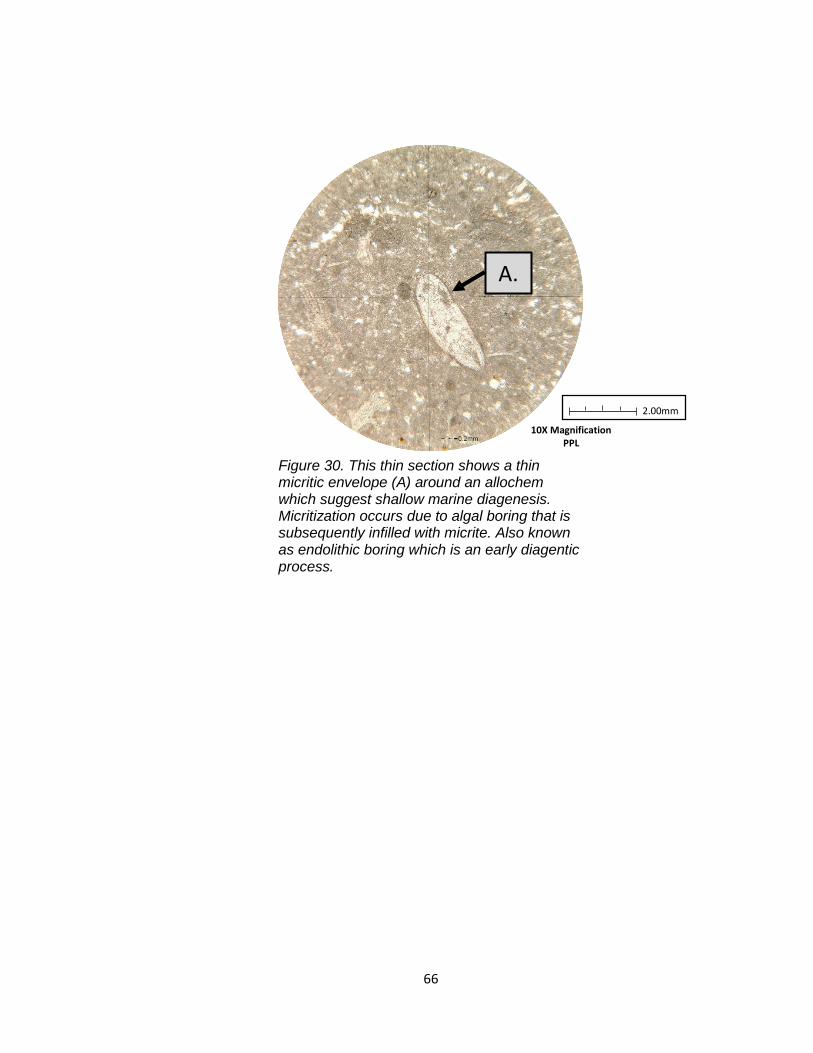
66
A.
10X Magnification PPL
Figure 30. This thin section shows a thin micritic envelope (A) around an allochem which suggest shallow marine diagenesis. Micritization occurs due to algal boring that is subsequently infilled with micrite. Also known as endolithic boring which is an early diagentic process.
2.00mm
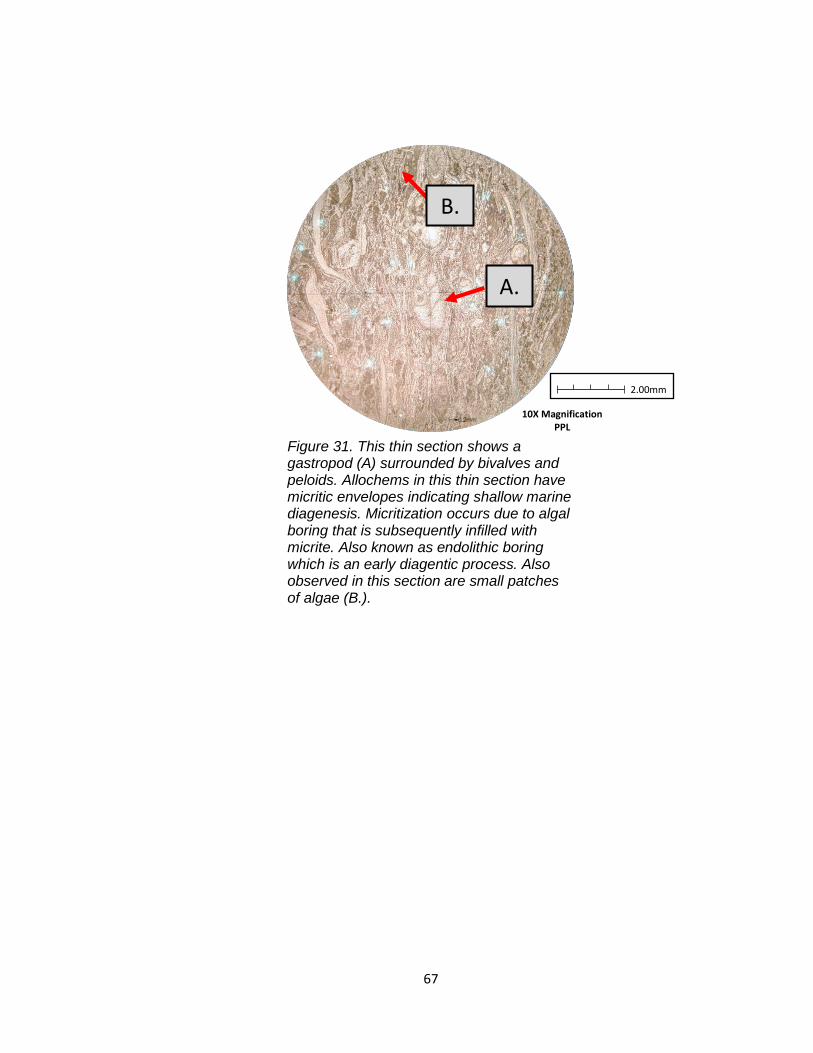
67
A.
10X Magnification PPL
Figure 31. This thin section shows a gastropod (A) surrounded by bivalves and peloids. Allochems in this thin section have micritic envelopes indicating shallow marine diagenesis. Micritization occurs due to algal boring that is subsequently infilled with micrite. Also known as endolithic boring which is an early diagentic process. Also observed in this section are small patches of algae (B.).
B.
2.00mm
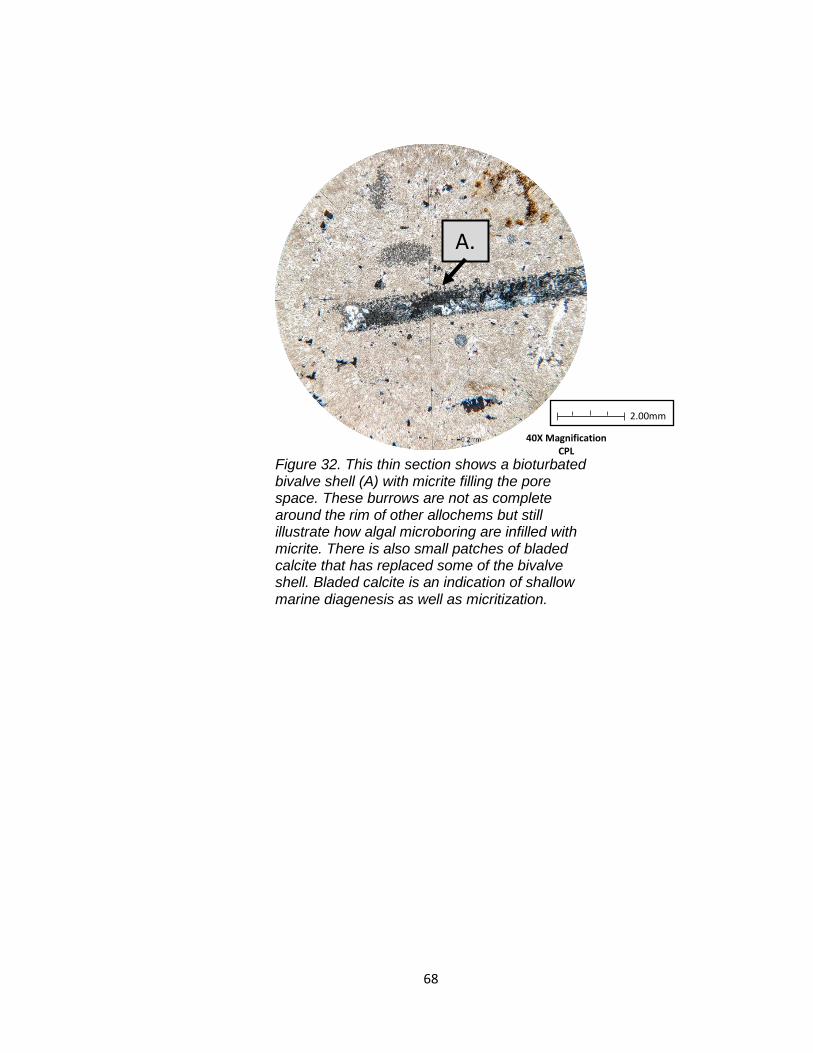
68
A.
40X Magnification CPL
Figure 32. This thin section shows a bioturbated bivalve shell (A) with micrite filling the pore space. These burrows are not as complete around the rim of other allochems but still illustrate how algal microboring are infilled with micrite. There is also small patches of bladed calcite that has replaced some of the bivalve shell. Bladed calcite is an indication of shallow marine diagenesis as well as micritization.
2.00mm
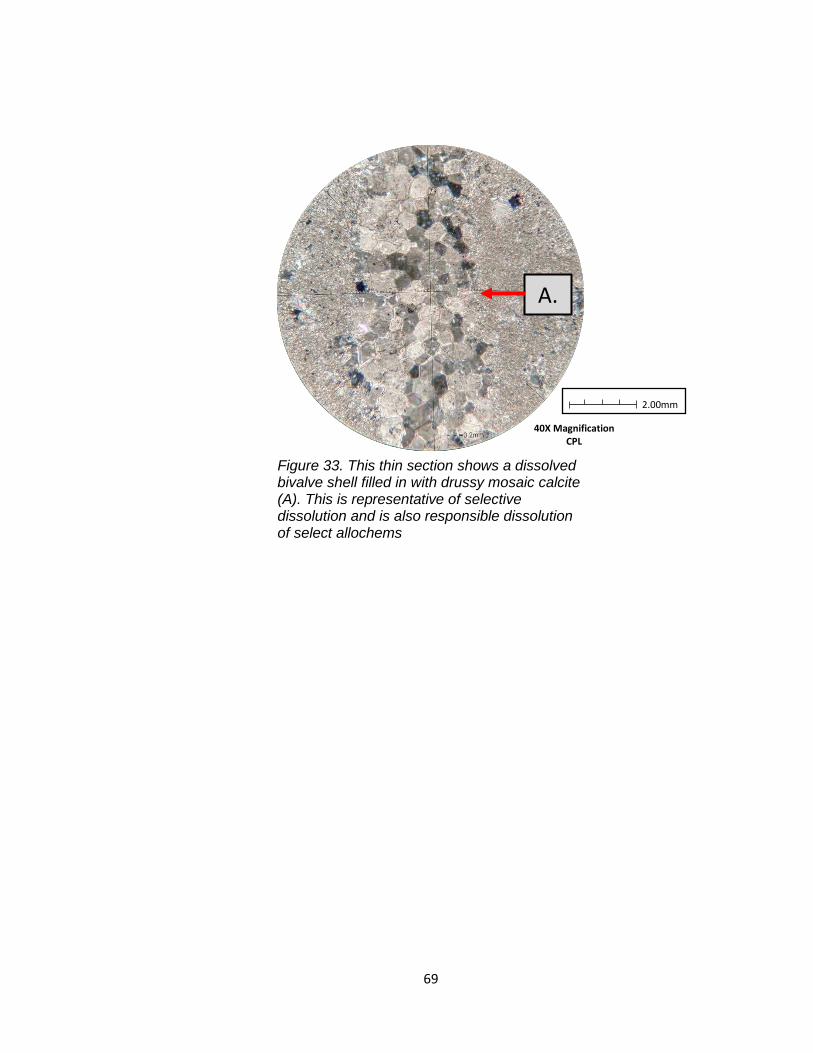
69
A.
40X Magnification CPL
Figure 33. This thin section shows a dissolved bivalve shell filled in with drussy mosaic calcite (A). This is representative of selective dissolution and is also responsible dissolution of select allochems
2.00mm
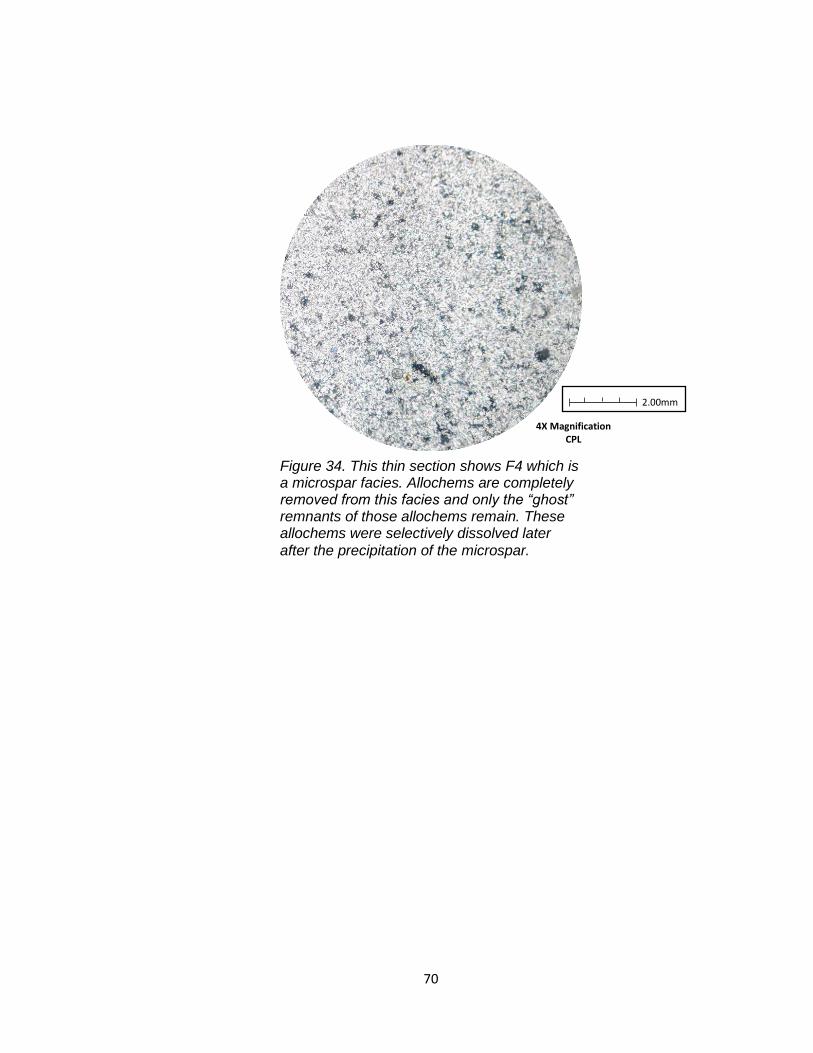
70
4X Magnification CPL
Figure 34. This thin section shows F4 which is a microspar facies. Allochems are completely removed from this facies and only the “ghost” remnants of those allochems remain. These allochems were selectively dissolved later
after the precipitation of the microspar.
2.00mm
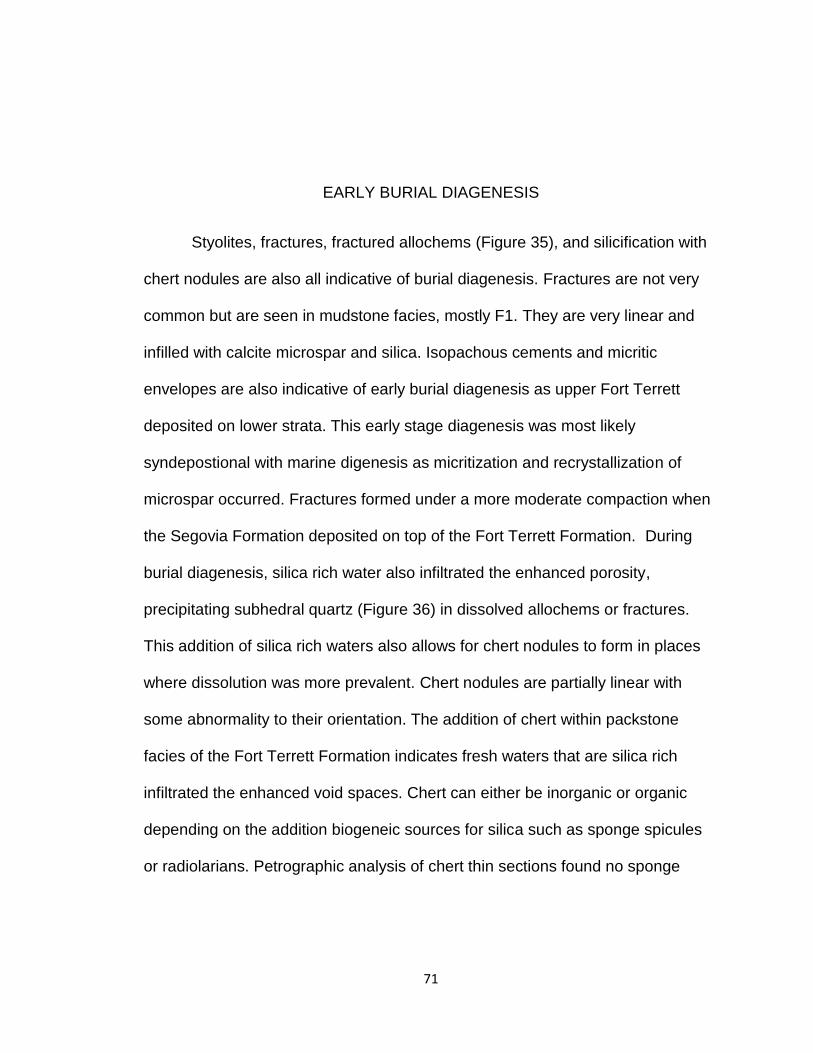
71
EARLY BURIAL DIAGENESIS
Styolites, fractures, fractured allochems (Figure 35), and silicification with
chert nodules are also all indicative of burial diagenesis. Fractures are not very
common but are seen in mudstone facies, mostly F1. They are very linear and
infilled with calcite microspar and silica. Isopachous cements and micritic
envelopes are also indicative of early burial diagenesis as upper Fort Terrett
deposited on lower strata. This early stage diagenesis was most likely
syndepostional with marine digenesis as micritization and recrystallization of
microspar occurred. Fractures formed under a more moderate compaction when
the Segovia Formation deposited on top of the Fort Terrett Formation. During
burial diagenesis, silica rich water also infiltrated the enhanced porosity,
precipitating subhedral quartz (Figure 36) in dissolved allochems or fractures.
This addition of silica rich waters also allows for chert nodules to form in places
where dissolution was more prevalent. Chert nodules are partially linear with
some abnormality to their orientation. The addition of chert within packstone
facies of the Fort Terrett Formation indicates fresh waters that are silica rich
infiltrated the enhanced void spaces. Chert can either be inorganic or organic
depending on the addition biogeneic sources for silica such as sponge spicules
or radiolarians. Petrographic analysis of chert thin sections found no sponge
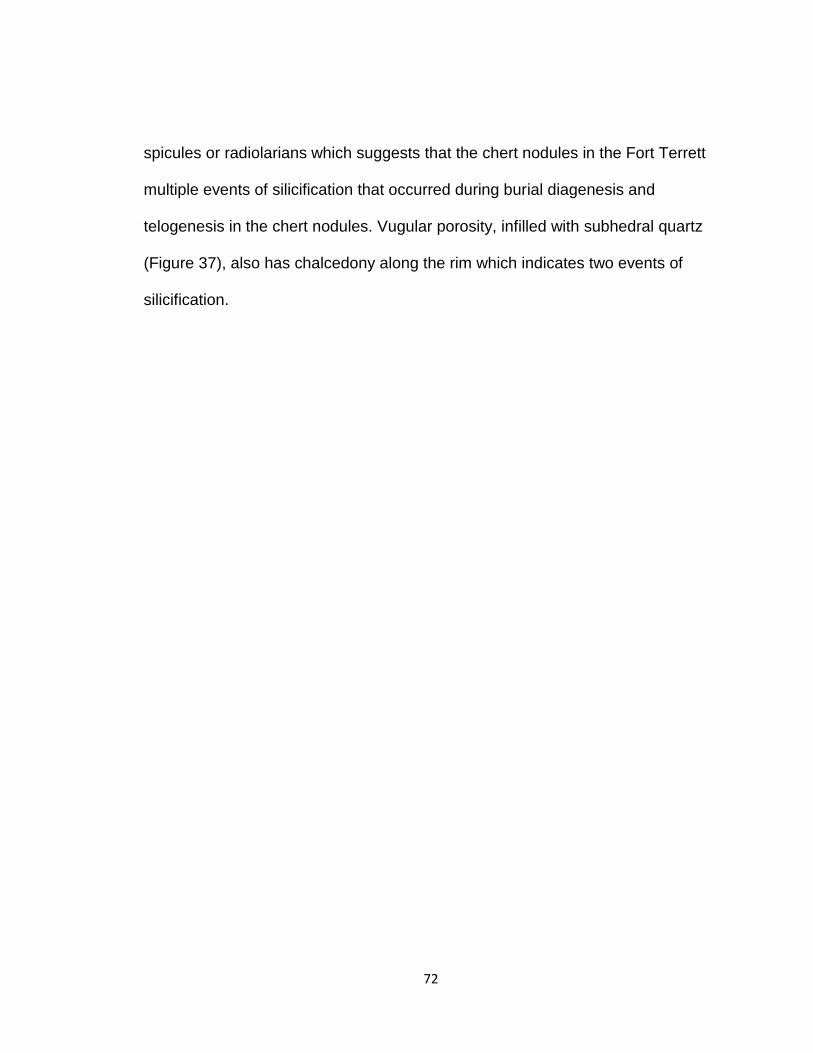
72
spicules or radiolarians which suggests that the chert nodules in the Fort Terrett
multiple events of silicification that occurred during burial diagenesis and
telogenesis in the chert nodules. Vugular porosity, infilled with subhedral quartz
(Figure 37), also has chalcedony along the rim which indicates two events of
silicification.
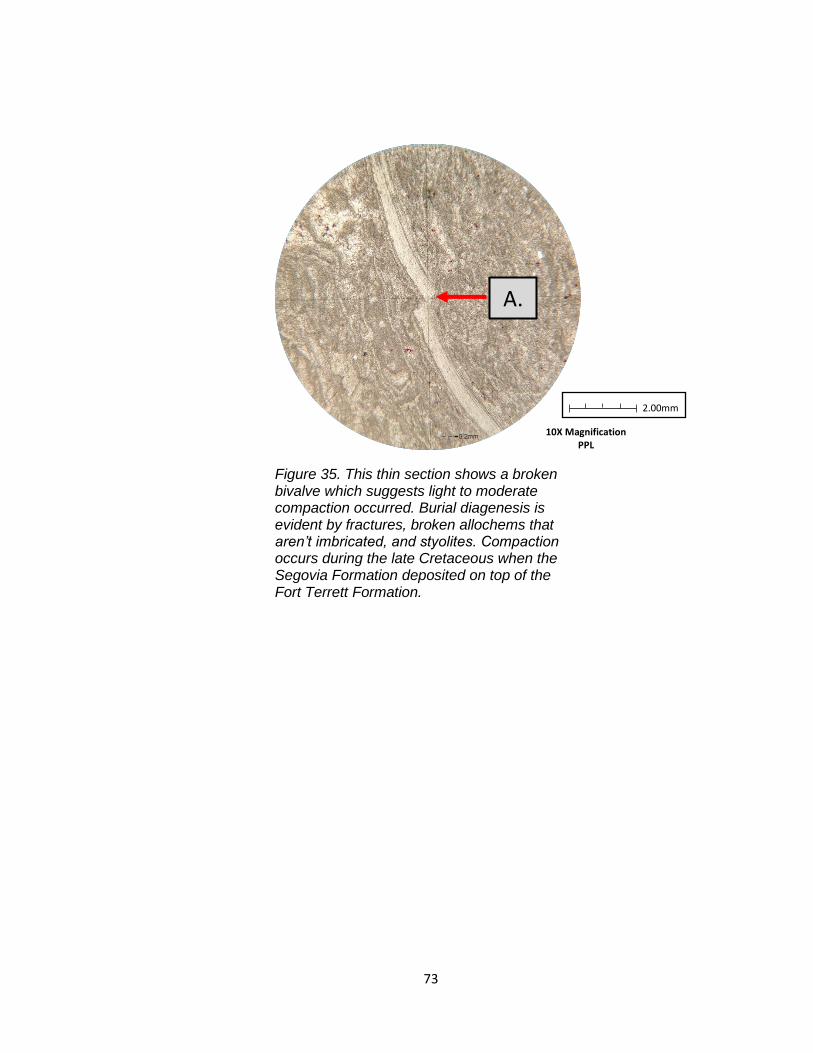
73
A.
10X Magnification PPL
Figure 35. This thin section shows a broken bivalve which suggests light to moderate compaction occurred. Burial diagenesis is evident by fractures, broken allochems that aren’t imbricated, and styolites. Compaction occurs during the late Cretaceous when the Segovia Formation deposited on top of the Fort Terrett Formation.
2.00mm
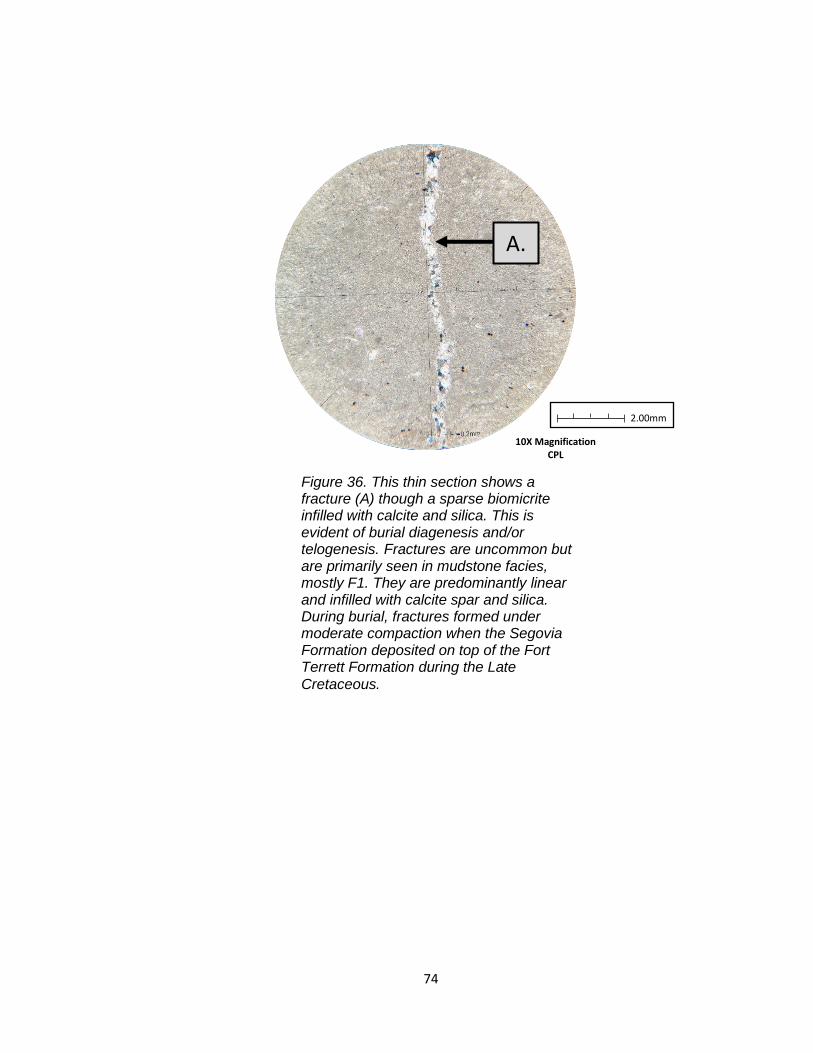
74
A.
10X Magnification CPL
Figure 36. This thin section shows a fracture (A) though a sparse biomicrite infilled with calcite and silica. This is evident of burial diagenesis and/or telogenesis. Fractures are uncommon but are primarily seen in mudstone facies, mostly F1. They are predominantly linear and infilled with calcite spar and silica. During burial, fractures formed under moderate compaction when the Segovia Formation deposited on top of the Fort Terrett Formation during the Late
Cretaceous.
2.00mm
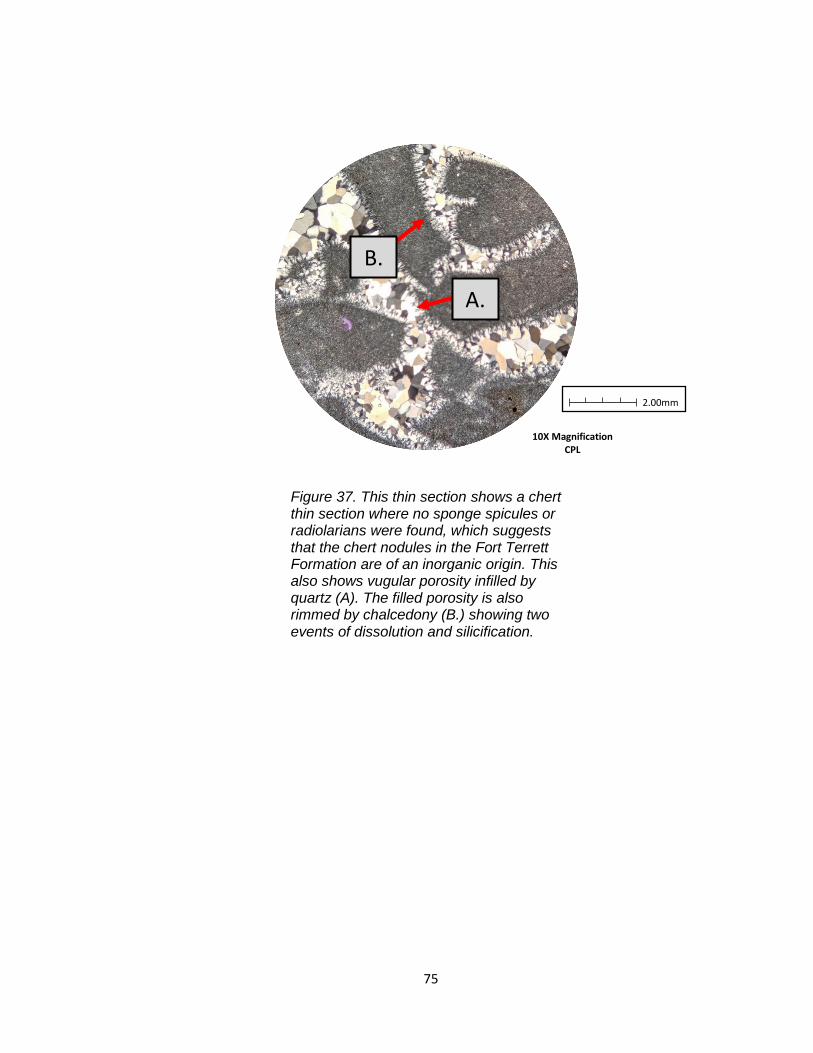
75
A.
10X Magnification CPL
Figure 37. This thin section shows a chert thin section where no sponge spicules or radiolarians were found, which suggests that the chert nodules in the Fort Terrett Formation are of an inorganic origin. This also shows vugular porosity infilled by quartz (A). The filled porosity is also rimmed by chalcedony (B.) showing two events of dissolution and silicification.
B.
2.00mm
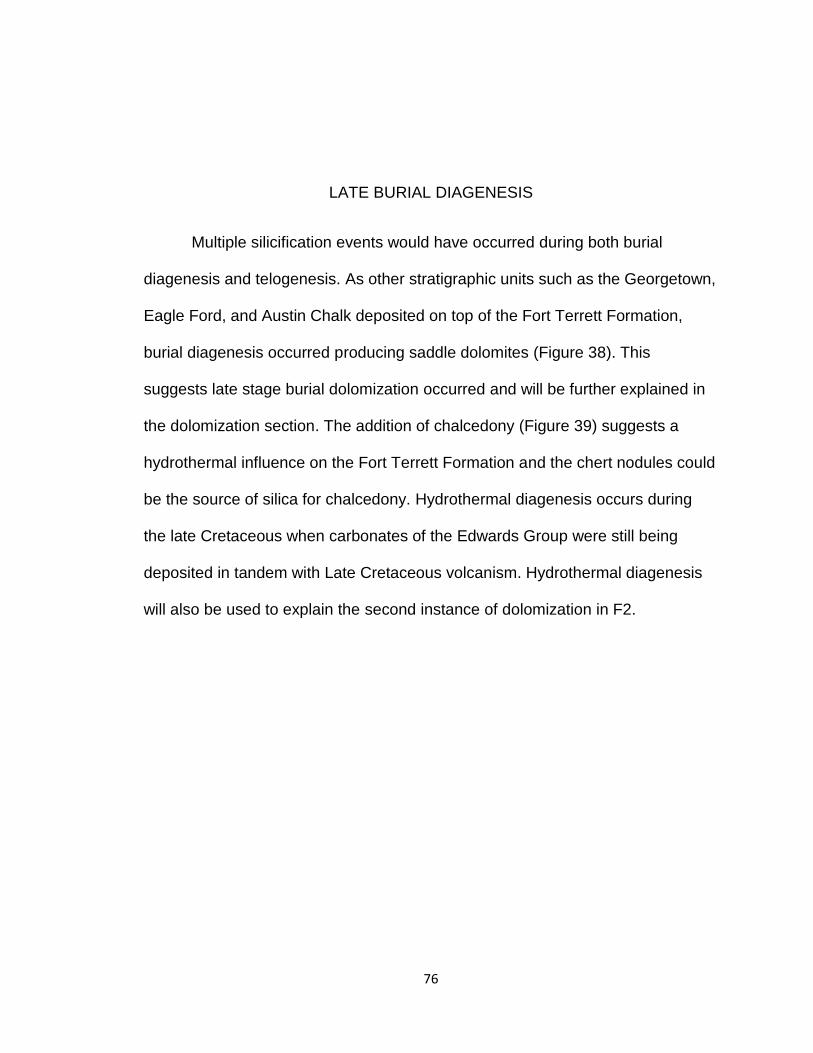
76
LATE BURIAL DIAGENESIS
Multiple silicification events would have occurred during both burial
diagenesis and telogenesis. As other stratigraphic units such as the Georgetown,
Eagle Ford, and Austin Chalk deposited on top of the Fort Terrett Formation,
burial diagenesis occurred producing saddle dolomites (Figure 38). This
suggests late stage burial dolomization occurred and will be further explained in
the dolomization section. The addition of chalcedony (Figure 39) suggests a
hydrothermal influence on the Fort Terrett Formation and the chert nodules could
be the source of silica for chalcedony. Hydrothermal diagenesis occurs during
the late Cretaceous when carbonates of the Edwards Group were still being
deposited in tandem with Late Cretaceous volcanism. Hydrothermal diagenesis
will also be used to explain the second instance of dolomization in F2.
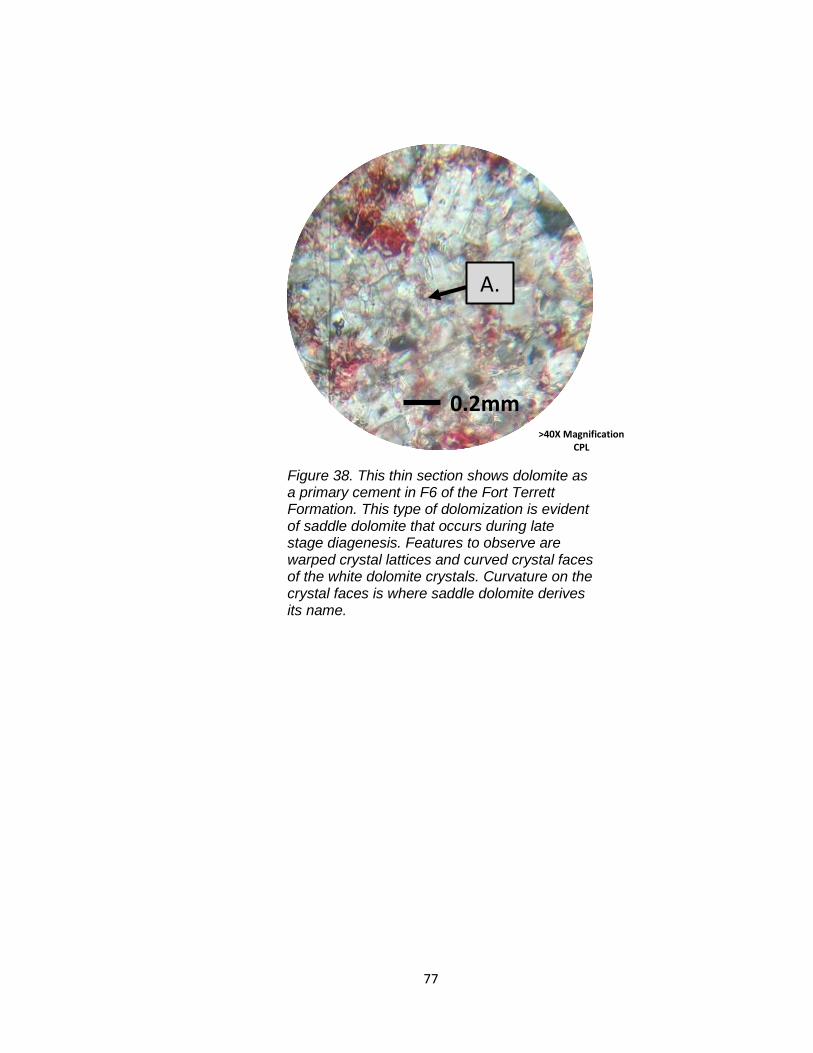
77
0.2mm
Figure 38. This thin section shows dolomite as a primary cement in F6 of the Fort Terrett Formation. This type of dolomization is evident of saddle dolomite that occurs during late stage diagenesis. Features to observe are warped crystal lattices and curved crystal faces of the white dolomite crystals. Curvature on the crystal faces is where saddle dolomite derives its name.
>40X Magnification CPL
A.
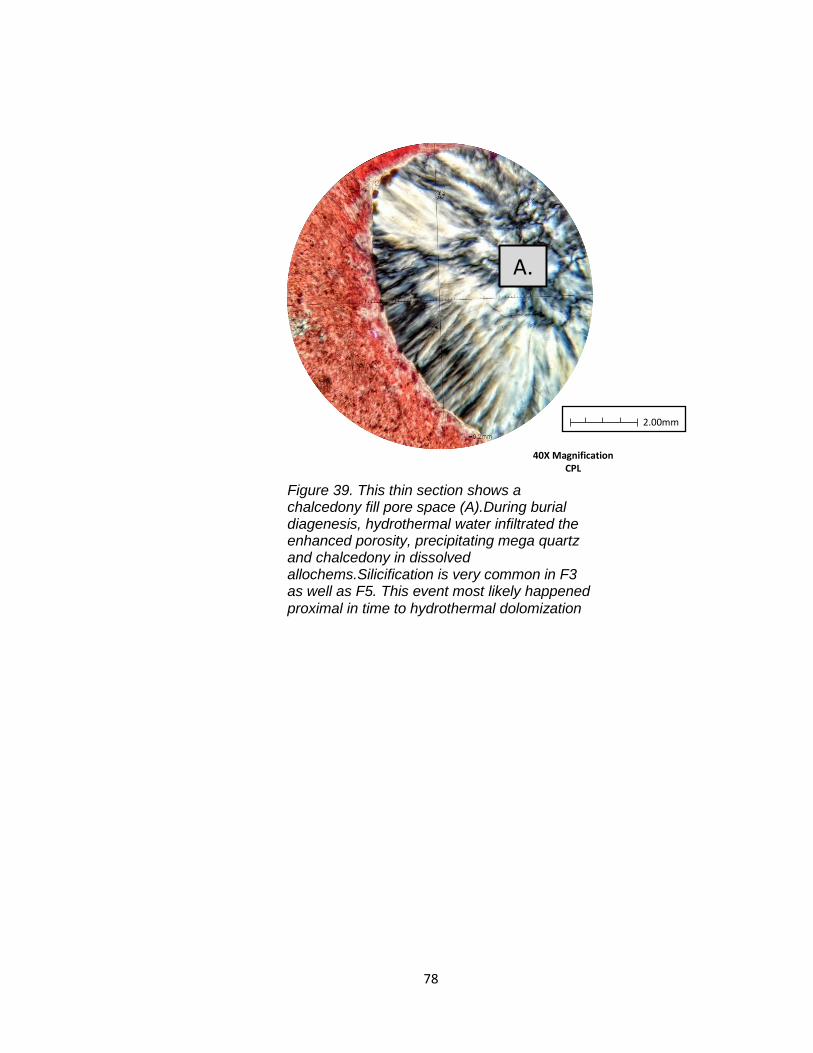
78
A.
40X Magnification CPL
Figure 39. This thin section shows a chalcedony fill pore space (A).During burial diagenesis, hydrothermal water infiltrated the enhanced porosity, precipitating mega quartz and chalcedony in dissolved allochems.Silicification is very common in F3 as well as F5. This event most likely happened
proximal in time to hydrothermal dolomization
2.00mm
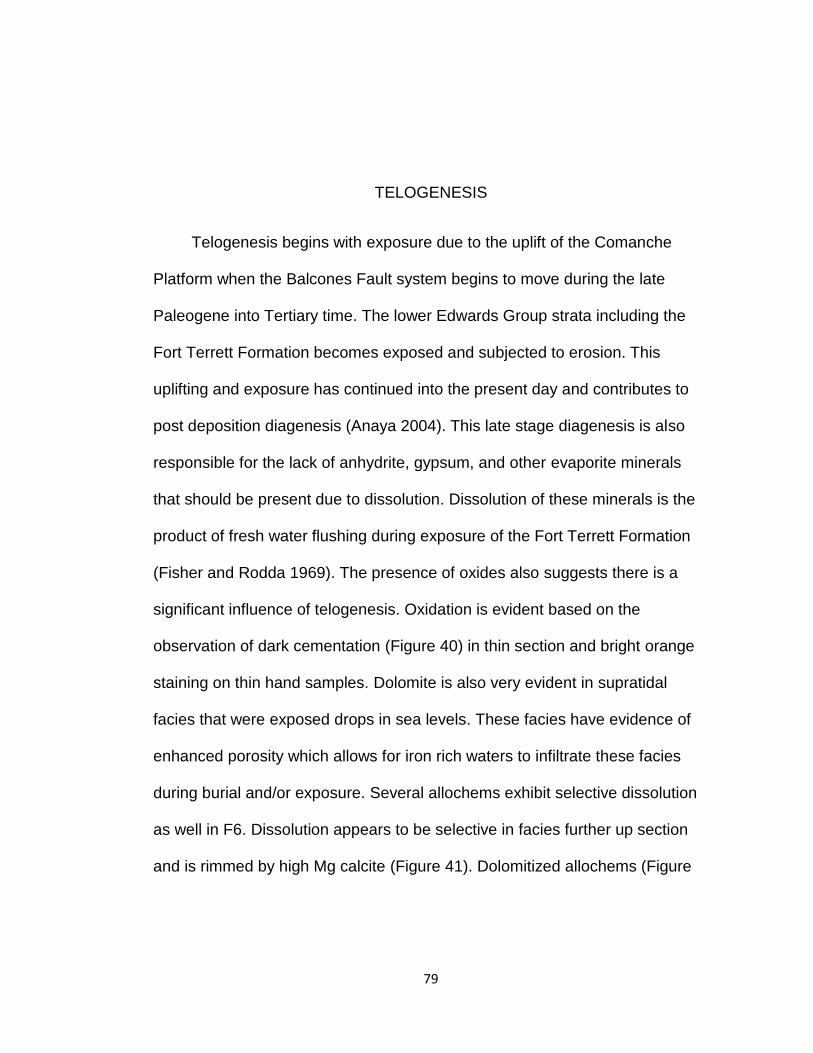
79
TELOGENESIS
Telogenesis begins with exposure due to the uplift of the Comanche
Platform when the Balcones Fault system begins to move during the late
Paleogene into Tertiary time. The lower Edwards Group strata including the
Fort Terrett Formation becomes exposed and subjected to erosion. This
uplifting and exposure has continued into the present day and contributes to
post deposition diagenesis (Anaya 2004). This late stage diagenesis is also
responsible for the lack of anhydrite, gypsum, and other evaporite minerals
that should be present due to dissolution. Dissolution of these minerals is the
product of fresh water flushing during exposure of the Fort Terrett Formation
(Fisher and Rodda 1969). The presence of oxides also suggests there is a
significant influence of telogenesis. Oxidation is evident based on the
observation of dark cementation (Figure 40) in thin section and bright orange
staining on thin hand samples. Dolomite is also very evident in supratidal
facies that were exposed drops in sea levels. These facies have evidence of
enhanced porosity which allows for iron rich waters to infiltrate these facies
during burial and/or exposure. Several allochems exhibit selective dissolution
as well in F6. Dissolution appears to be selective in facies further up section
and is rimmed by high Mg calcite (Figure 41). Dolomitized allochems (Figure
80
42) that have been dissolved also display evidence of dedolomization where
dolomite has been reverted back to calcite but still retains the dolomite texture.
Dissolution is observed in every facies except F1 with void spaces having high
Mg calcite along the rims, similar to what’s seen in Figure 41. Dissolution
(Figure 43) is evident of telogenesis due to the lack of mineralization in the
void space such as dolomite and silica from burial diagenesis. The lack of
these minerals only suggests this dissolution is post uplift and exposure. This
will be used to further explain why seepage reflux or evaporative pumping for
dolomization by enhanced porosity does not fit as a model for dolomization in
the Fort Terrett Formation near Junction.
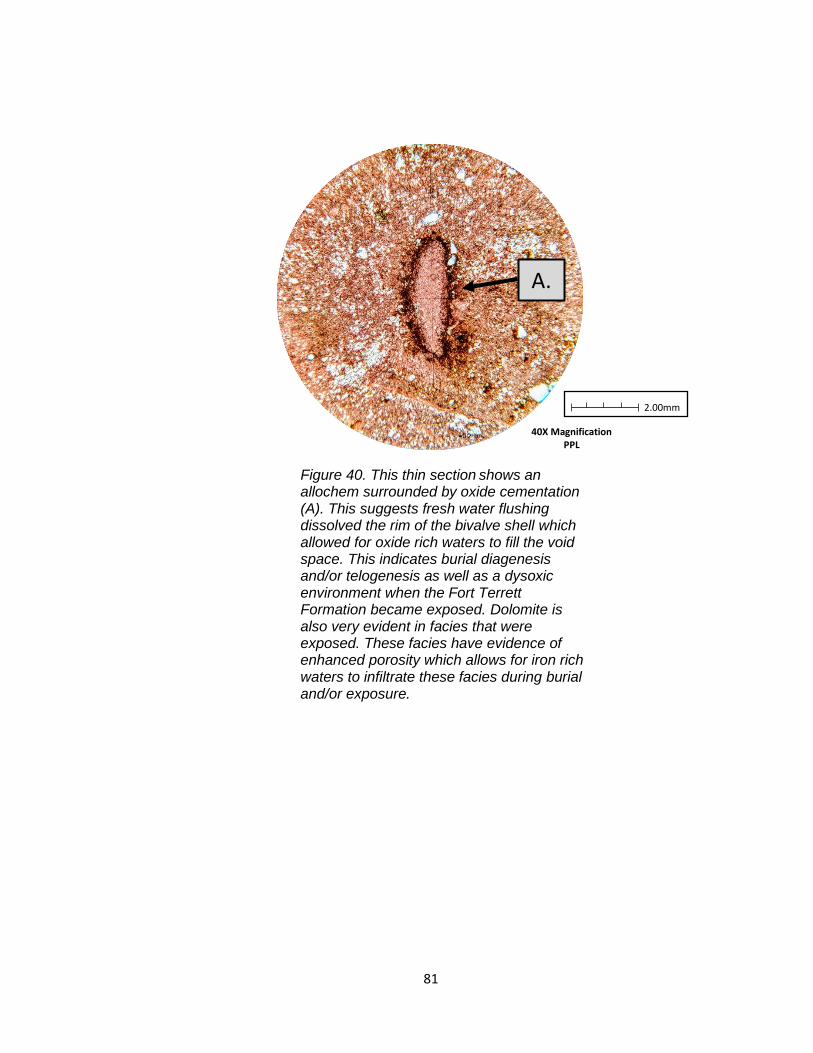
81
A.
40X Magnification PPL
Figure 40. This thin section shows an allochem surrounded by oxide cementation (A). This suggests fresh water flushing dissolved the rim of the bivalve shell which allowed for oxide rich waters to fill the void space. This indicates burial diagenesis and/or telogenesis as well as a dysoxic environment when the Fort Terrett Formation became exposed. Dolomite is also very evident in facies that were exposed. These facies have evidence of enhanced porosity which allows for iron rich waters to infiltrate these facies during burial and/or exposure.
2.00mm
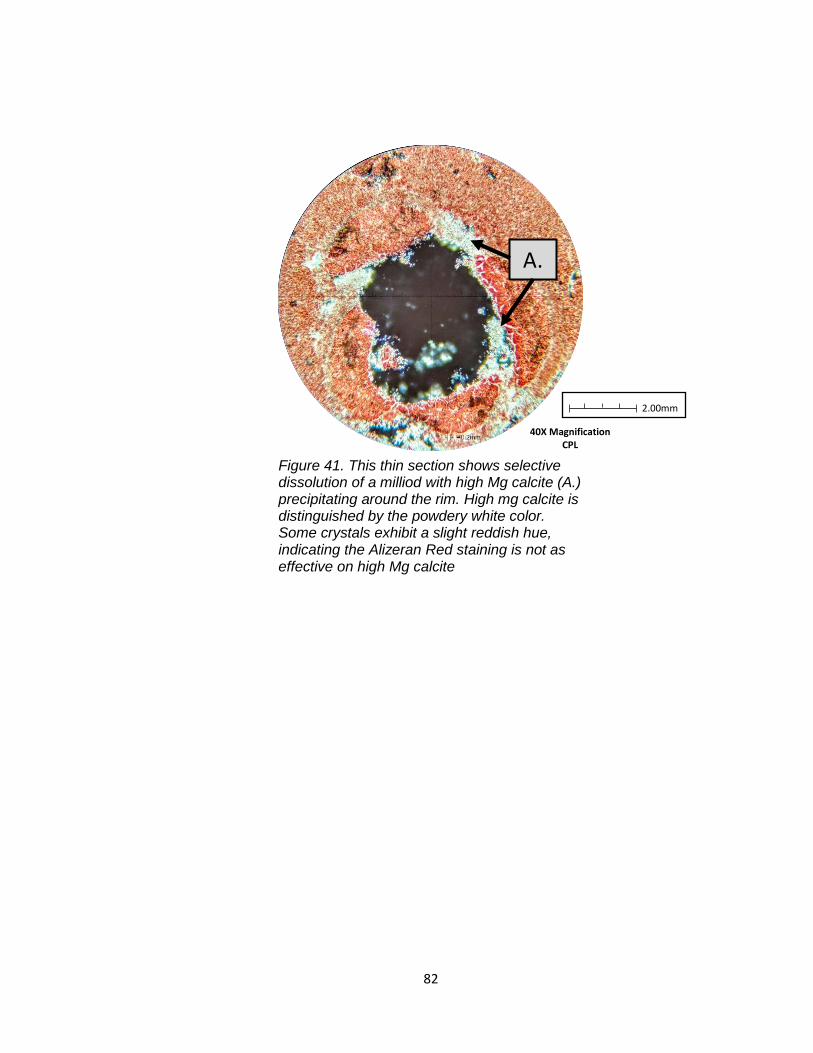
82
A.
40X Magnification CPL
Figure 41. This thin section shows selective dissolution of a milliod with high Mg calcite (A.) precipitating around the rim. High mg calcite is distinguished by the powdery white color. Some crystals exhibit a slight reddish hue, indicating the Alizeran Red staining is not as effective on high Mg calcite
2.00mm
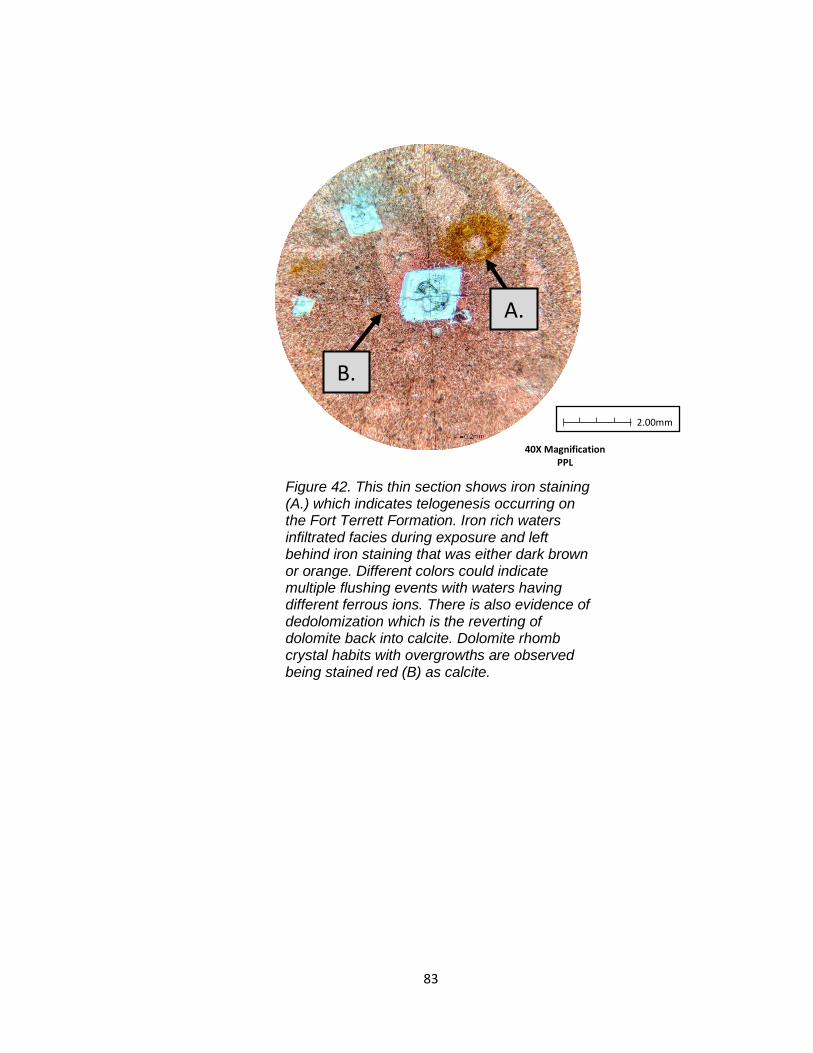
83
A.
40X Magnification PPL
B.
Figure 42. This thin section shows iron staining (A.) which indicates telogenesis occurring on the Fort Terrett Formation. Iron rich waters infiltrated facies during exposure and left behind iron staining that was either dark brown or orange. Different colors could indicate multiple flushing events with waters having different ferrous ions. There is also evidence of dedolomization which is the reverting of dolomite back into calcite. Dolomite rhomb crystal habits with overgrowths are observed being stained red (B) as calcite.
2.00mm
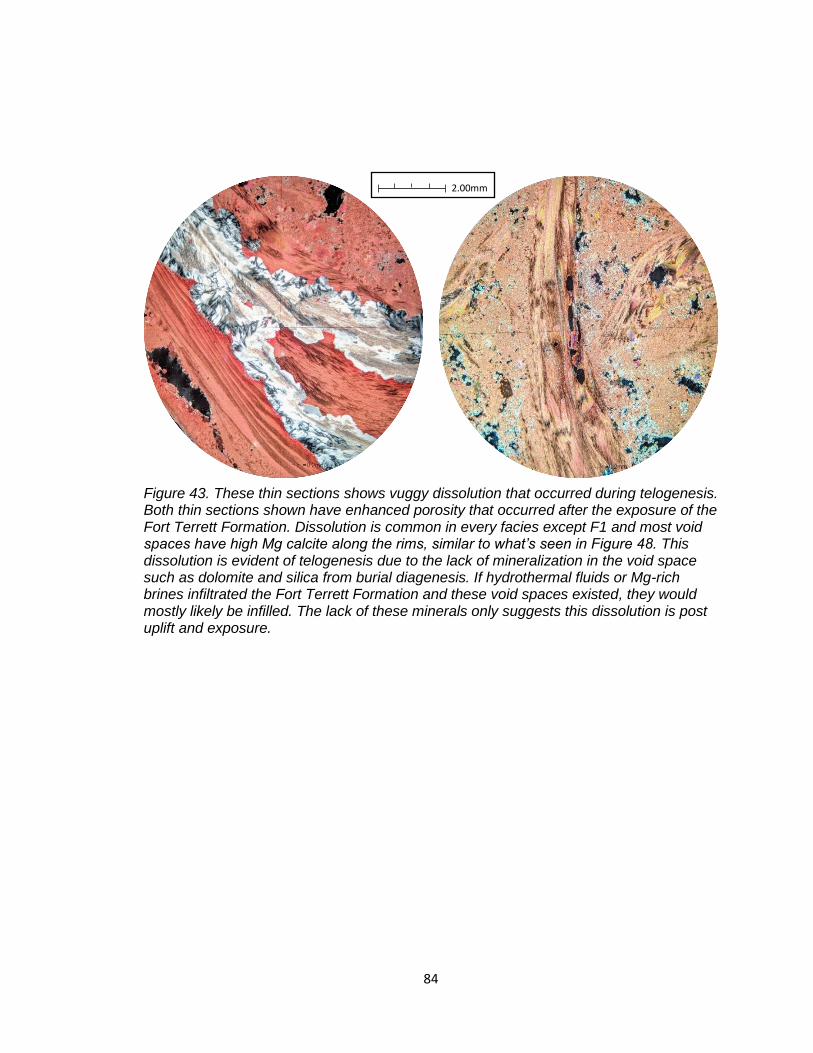
84
Figure 43. These thin sections shows vuggy dissolution that occurred during telogenesis. Both thin sections shown have enhanced porosity that occurred after the exposure of the Fort Terrett Formation. Dissolution is common in every facies except F1 and most void spaces have high Mg calcite along the rims, similar to what’s seen in Figure 48. This dissolution is evident of telogenesis due to the lack of mineralization in the void space such as dolomite and silica from burial diagenesis. If hydrothermal fluids or Mg-rich brines infiltrated the Fort Terrett Formation and these void spaces existed, they would mostly likely be infilled. The lack of these minerals only suggests this dissolution is post uplift and exposure.
2.00mm
85
DOLOMIZATION MODEL
The Fort Terrett Formation contains various zones of dolomization and
dedolimization, specifically F2 and F6 of the facies model. Dolomite observed
during the petrographic analysis (Figure 44) are described as euhedral, having
rhombic crystal habits in F2 or xenotopic, infilling much of the void space as a
cement in F6. Several rhombs also exhibited “shadows” or dim cloudy centers
which is also indicative of overgrowths or zoning. Dolomization for the Fort
Terrett Formation has been heavily debated and each model proposed will be
dissected below.
Several models for dolomization have been proposed for the Fort Terrett
Formation in both Kimble and Mason Counties in central Texas. Butler and
Kinsman (1969) proposed supratidal dolostone formations were
penecontemporaneously dolomitized. This model is known as the Persian Gulf
model and illustrates that large anhydrite nodules in sabkha deposits would be
dissolved, then eventually replaced by silica. This phenomenon seems to be
comparable to dolomization within the Fort Terrett Formation, however, the
Persian Gulf model also distinguished crystal sizes of dolomite rhombs. In
sabkha facies, crystal face diameters could range from 1 to 20 microns. The
86
issue with this model is dolomization that occurs in subtidal to intertidal
deposits could exhibit crystal faces up to 80 microns. There are also several
instances where allochems or burrows are selectively dolomitized. In the Fort
Terrett Formation, the largest crystal faces reach only about 3 microns and
there is very little evidence of anhydrite nodules or selective dolomization
(Butler 1969).
The next model proposed involves a method of dolomization using the
base of a fresh water lens. Postulated by Hansahw in 1971, the fresh water
lens would penetrate high porosity formations where Mg rich water settling
near the bottom would precipitate dolomite in subtidal to intertidal facies.
However, in 1974 Steinen conducted a case study of fresh water lens
dolomization on the island of Barbados. His study concluded that fresh water
lenses could in fact penetrate metastable carbonates but that no dolomization
took place at the base of the lens or below it. The following model was
established by Jacka (1975) from Texas Tech University. His study of
subsurface carbonates in the Permian Basin explained dolomization of
aragonitic mud or shells could produce neomorphic dolomite with euhedral
rhombic fabrics. He also indicated that the dolomite could be replaced by
calcite but maintaining that dolomite fabric or texture. This showed
dedolomiaztion was common when aragonitic material was dolomitized. The
point of conjecture for this “model” is that Jacka infers that neomorphic
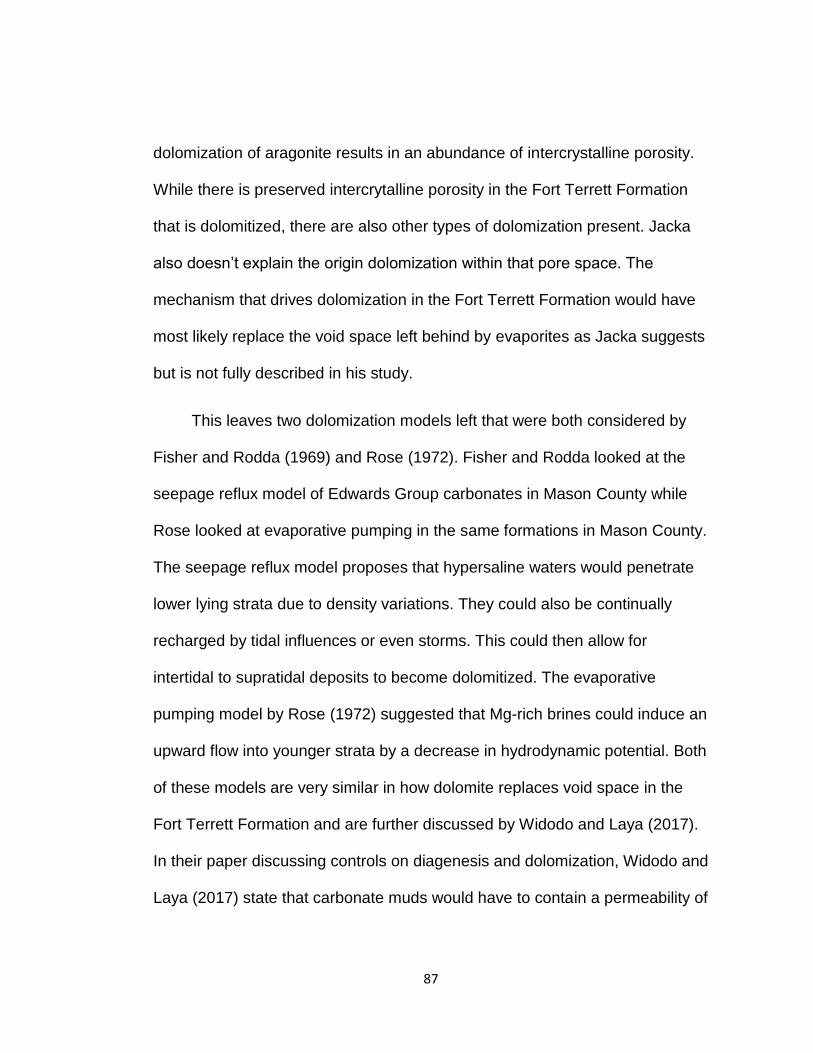
87
dolomization of aragonite results in an abundance of intercrystalline porosity.
While there is preserved intercrytalline porosity in the Fort Terrett Formation
that is dolomitized, there are also other types of dolomization present. Jacka
also doesn’t explain the origin dolomization within that pore space. The
mechanism that drives dolomization in the Fort Terrett Formation would have
most likely replace the void space left behind by evaporites as Jacka suggests
but is not fully described in his study.
This leaves two dolomization models left that were both considered by
Fisher and Rodda (1969) and Rose (1972). Fisher and Rodda looked at the
seepage reflux model of Edwards Group carbonates in Mason County while
Rose looked at evaporative pumping in the same formations in Mason County.
The seepage reflux model proposes that hypersaline waters would penetrate
lower lying strata due to density variations. They could also be continually
recharged by tidal influences or even storms. This could then allow for
intertidal to supratidal deposits to become dolomitized. The evaporative
pumping model by Rose (1972) suggested that Mg-rich brines could induce an
upward flow into younger strata by a decrease in hydrodynamic potential. Both
of these models are very similar in how dolomite replaces void space in the
Fort Terrett Formation and are further discussed by Widodo and Laya (2017).
In their paper discussing controls on diagenesis and dolomization, Widodo and
Laya (2017) state that carbonate muds would have to contain a permeability of
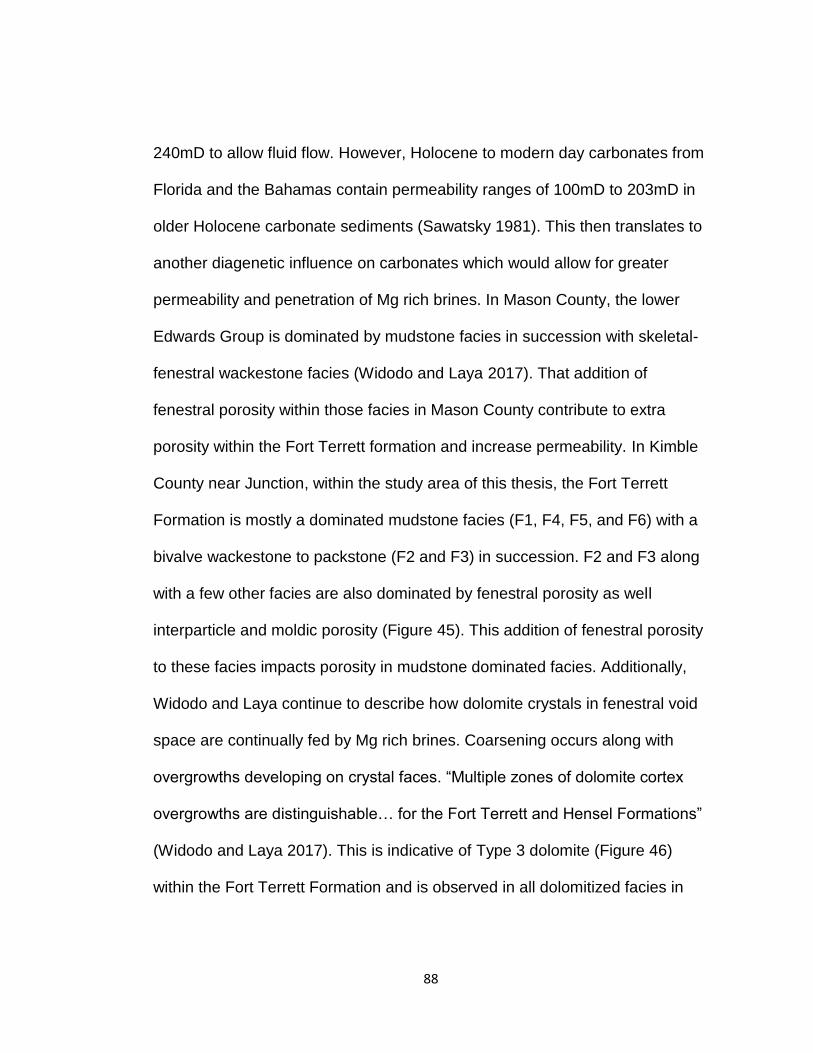
88
240mD to allow fluid flow. However, Holocene to modern day carbonates from
Florida and the Bahamas contain permeability ranges of 100mD to 203mD in
older Holocene carbonate sediments (Sawatsky 1981). This then translates to
another diagenetic influence on carbonates which would allow for greater
permeability and penetration of Mg rich brines. In Mason County, the lower
Edwards Group is dominated by mudstone facies in succession with skeletal-
fenestral wackestone facies (Widodo and Laya 2017). That addition of
fenestral porosity within those facies in Mason County contribute to extra
porosity within the Fort Terrett formation and increase permeability. In Kimble
County near Junction, within the study area of this thesis, the Fort Terrett
Formation is mostly a dominated mudstone facies (F1, F4, F5, and F6) with a
bivalve wackestone to packstone (F2 and F3) in succession. F2 and F3 along
with a few other facies are also dominated by fenestral porosity as well
interparticle and moldic porosity (Figure 45). This addition of fenestral porosity
to these facies impacts porosity in mudstone dominated facies. Additionally,
Widodo and Laya continue to describe how dolomite crystals in fenestral void
space are continually fed by Mg rich brines. Coarsening occurs along with
overgrowths developing on crystal faces. “Multiple zones of dolomite cortex
overgrowths are distinguishable… for the Fort Terrett and Hensel Formations”
(Widodo and Laya 2017). This is indicative of Type 3 dolomite (Figure 46)
within the Fort Terrett Formation and is observed in all dolomitized facies in
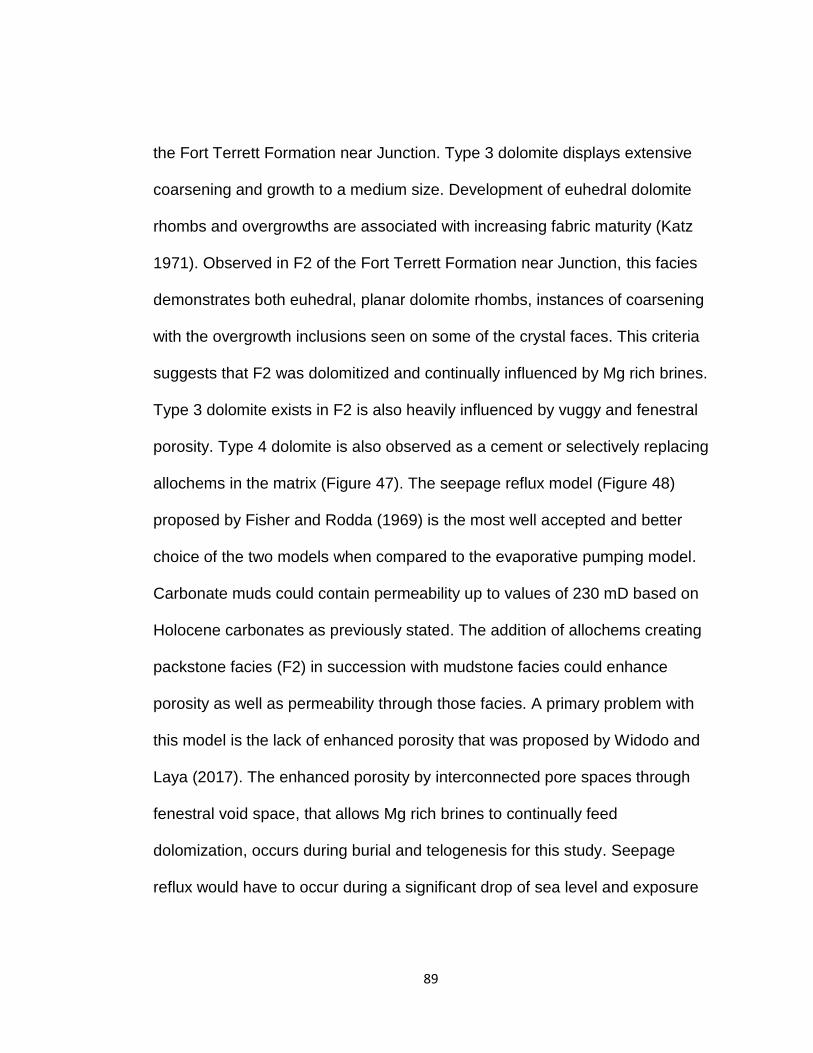
89
the Fort Terrett Formation near Junction. Type 3 dolomite displays extensive
coarsening and growth to a medium size. Development of euhedral dolomite
rhombs and overgrowths are associated with increasing fabric maturity (Katz
1971). Observed in F2 of the Fort Terrett Formation near Junction, this facies
demonstrates both euhedral, planar dolomite rhombs, instances of coarsening
with the overgrowth inclusions seen on some of the crystal faces. This criteria
suggests that F2 was dolomitized and continually influenced by Mg rich brines.
Type 3 dolomite exists in F2 is also heavily influenced by vuggy and fenestral
porosity. Type 4 dolomite is also observed as a cement or selectively replacing
allochems in the matrix (Figure 47). The seepage reflux model (Figure 48)
proposed by Fisher and Rodda (1969) is the most well accepted and better
choice of the two models when compared to the evaporative pumping model.
Carbonate muds could contain permeability up to values of 230 mD based on
Holocene carbonates as previously stated. The addition of allochems creating
packstone facies (F2) in succession with mudstone facies could enhance
porosity as well as permeability through those facies. A primary problem with
this model is the lack of enhanced porosity that was proposed by Widodo and
Laya (2017). The enhanced porosity by interconnected pore spaces through
fenestral void space, that allows Mg rich brines to continually feed
dolomization, occurs during burial and telogenesis for this study. Seepage
reflux would have to occur during a significant drop of sea level and exposure
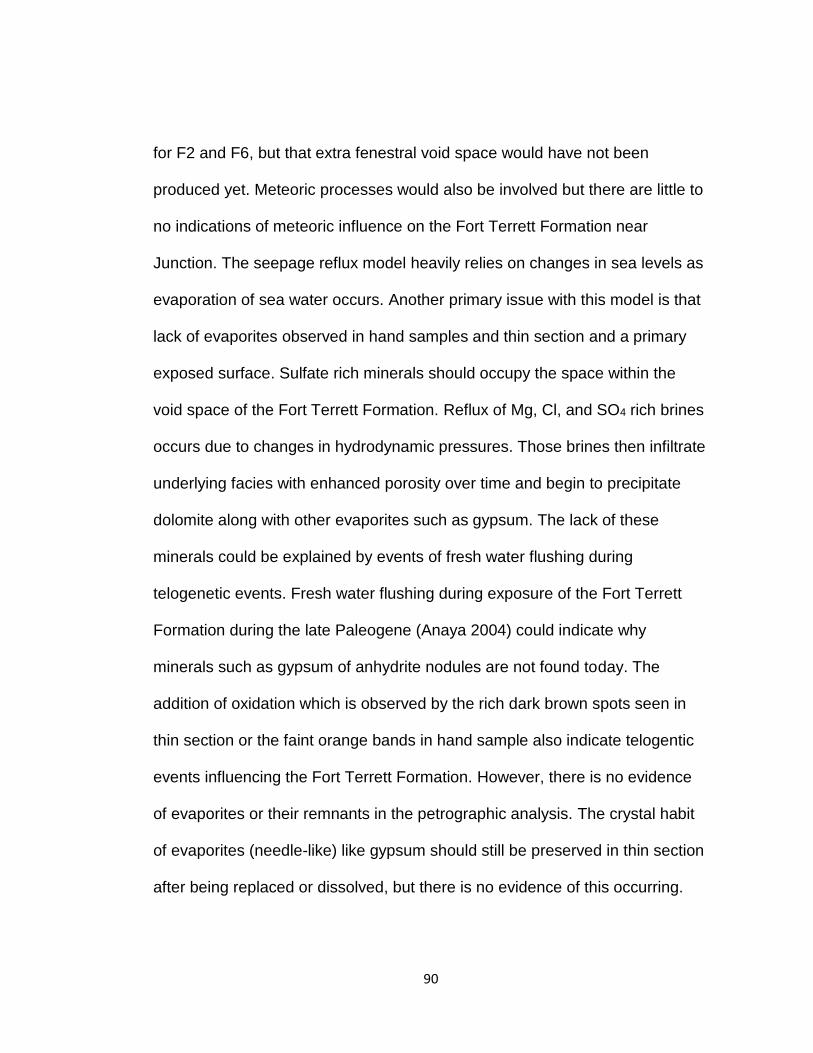
90
for F2 and F6, but that extra fenestral void space would have not been
produced yet. Meteoric processes would also be involved but there are little to
no indications of meteoric influence on the Fort Terrett Formation near
Junction. The seepage reflux model heavily relies on changes in sea levels as
evaporation of sea water occurs. Another primary issue with this model is that
lack of evaporites observed in hand samples and thin section and a primary
exposed surface. Sulfate rich minerals should occupy the space within the
void space of the Fort Terrett Formation. Reflux of Mg, Cl, and SO4 rich brines
occurs due to changes in hydrodynamic pressures. Those brines then infiltrate
underlying facies with enhanced porosity over time and begin to precipitate
dolomite along with other evaporites such as gypsum. The lack of these
minerals could be explained by events of fresh water flushing during
telogenetic events. Fresh water flushing during exposure of the Fort Terrett
Formation during the late Paleogene (Anaya 2004) could indicate why
minerals such as gypsum of anhydrite nodules are not found today. The
addition of oxidation which is observed by the rich dark brown spots seen in
thin section or the faint orange bands in hand sample also indicate telogentic
events influencing the Fort Terrett Formation. However, there is no evidence
of evaporites or their remnants in the petrographic analysis. The crystal habit
of evaporites (needle-like) like gypsum should still be preserved in thin section
after being replaced or dissolved, but there is no evidence of this occurring.
91
There is also no direct evidence of an exposed surface near the study area to
suggest sea levels lowered far enough. The lack of extensive bioturbation in
these facies, ryzoliths, and desiccation cracks contributes to an issue with this
model.
The models proposed for the purpose of this thesis are low grade
hydrothermal dolomization by burial and hydrothermal fluid activity. Burial
dolomization will be used to explain hydrothermal dolomization by shallow
burial while hydrothermal dolomization will be used to explain fluid migration
and subsequent dolomization for the purpose of this thesis. Hydrothermal
diagenesis for the purpose of this study will be an increase in transient
temperatures of 5°C or more. Hydrothermal activity is generally discussed in
association with magmatic systems and heated waters near 100 °C.
Hydrothermal is commonly used for dolomization precipitated into a host rock
at a temperature higher than the ambient temperature of that rock (Davies,
Smith Jr. 2006). Late stage burial dolomization would have most likely
occurred after the deposition of the Austin Chalk during very late Cretaceous
(Campanian age) and produced saddle dolomite. This could have had
deposition of several formation on top of the Fort Terrett Formation before they
were exposed and eroded away. This would include the Segovia (avg
thickness of 69 m), Georgetown (avg thickness of 8 m), Del Rio (avg thickness
of 10 m), Buda (avg thickness of 12 m), Eagle Ford (avg thickness of 80 m),
92
and Austin Chalk formations (avg thickness of 130 m) burying the Fort Terrett
Formation roughly 300 meters. This doesn’t account for possible tertiary
clastic material or other possible carbonate strata that could have been
deposited in the area. This burial could account for an increase in rock
temperature of ~10°C when using a 30°C/Km increase standard. Saddle
dolomite is defined as being xenotopic, fine grained, having curved surfaces,
and a sweeping extinction, which indicates a distorted crystal lattice. Using the
dolomite texture classification (Figure 49) proposed by Gregg and Sibley
(1984) for burial dolomites, dolomite textures have been established to better
understand origin. Dolomites in the upper facies (F6) (Figure 50) exhibit a
textural maturity for Idiotopic – S, and Xenotopic –C texture, which presents
almost mosaic, with irregular boundaries and poor to moderate sweeping
undulatory extinction. Crystals are anhedral to subhedral, averaging 0.2mm-
0.5mm across, and infilling as the predominate matrix. Xenotopic-C (cement)
dolomites are infilling, irregular dolomite crystals that have been referred to as
baroque or saddle-shaped crystals (Figure 51). Saddle dolomites are easily
observed in thin section by a sweeping extinction and round edges that turn
towards terminations (Gregg, Sibley 1984). Idiotopic-S (subhedral) dolomites
are classified as low-porosity dolomites. This texture is defined by straight
boundaries and preserved crystal faces. This texture can also include
xenotopic dolomites (Gregg, Sibley 1984). Saddle dolomite is also useful as a
93
geothermal indicator, due to being produced in a temperature range of 60°-
150°C (Radke and Mathis, 1980). This occurrence of saddle dolomite is
evident of late stage diagenesis and hydrothermal activity. The appearance of
saddle dolomite normally occurs as pore-filling cement or in veins and
fractures (Hird et al., 1987) which is observed in F6. Burial was deep enough
to induce a type hydrothermal dolomization that was the product of an
increase in local geothermal temperature and pressure.
The second event of dolomization is explained by hydrothermal activity.
Dolomite in F2 is described as porphyrotopic with euhedral rhombs being
matrix supported (Figure 52). Free-floating rhombs in a limestone matrix have
been categorized as a texture called idiotopic-P (porphyrotopic). These
dolomites have been described to have sweeping extinction (Figure 53) under
crossed polarized light or a “dirty” appearance (Katz, Mathews 1977).
Friedman (1965) described this kind of dolomite texture as porphyrotopic in his
texture classification system for burial (late stage) dolomization. This type of
late stage dolomization will be explained by the addition of hydrothermal fluids
into an already geothermally active system. Late Cretaceous volcanic activity
reached a maximum during Austin Chalk and lower Taylor Group deposition
around 80mya (Ewing and Caran 1982). Though this volcanism occurred
roughly 100 miles east of present day Junction, it could have increased the
geothermal gradient for the area. Hydrothermal mineralization was
94
conventionally accepted with White’s (1957) definition of hydrothermal. His
definition states hydrothermal being “aqueous solutions that are warm or hot
relative to the surrounding environment.” This is without any indication of
needing a proximal magmatic source, fault systems, or fluid source. The
addition of silica precipitates, within some of the facies, especially facies with
significant porosity, also suggests hydrothermal diagenesis. Chalcedony is a
common hydrothermal alteration of silica or quartz. Natural chalcedony
typically forms at near surface conditions (<1 km) at low temperatures. These
conditions are restricted to sedimentary rocks and low-temperature
hydrothermal environments such as shallow burial (White, Corwin 1961). As
stated above for burial dolomization, ambient temperatures increased roughly
10°C. With the addition of hydrothermal fluids from proximal volcanism, the
regional geothermal gradient would have increased. This would have allowed
for hydrothermal fluids to penetrate and precipitate chalcedony and
hydrothermal dolomite.
Dolomite emplacement in the Fort Terrett Formation near Junction has
been heavily debated and the seepage reflux model has been argued by
many in previous works. This is analogous to the Fort Terrett Formation in
Mason County where Widodo and Laya (2017) use the seepage reflux model
to describe dolomization patterns seen there. However, enhanced porosity in
the Fort Terrett Formation as the primary mechanism for fluid flow of Mg rich
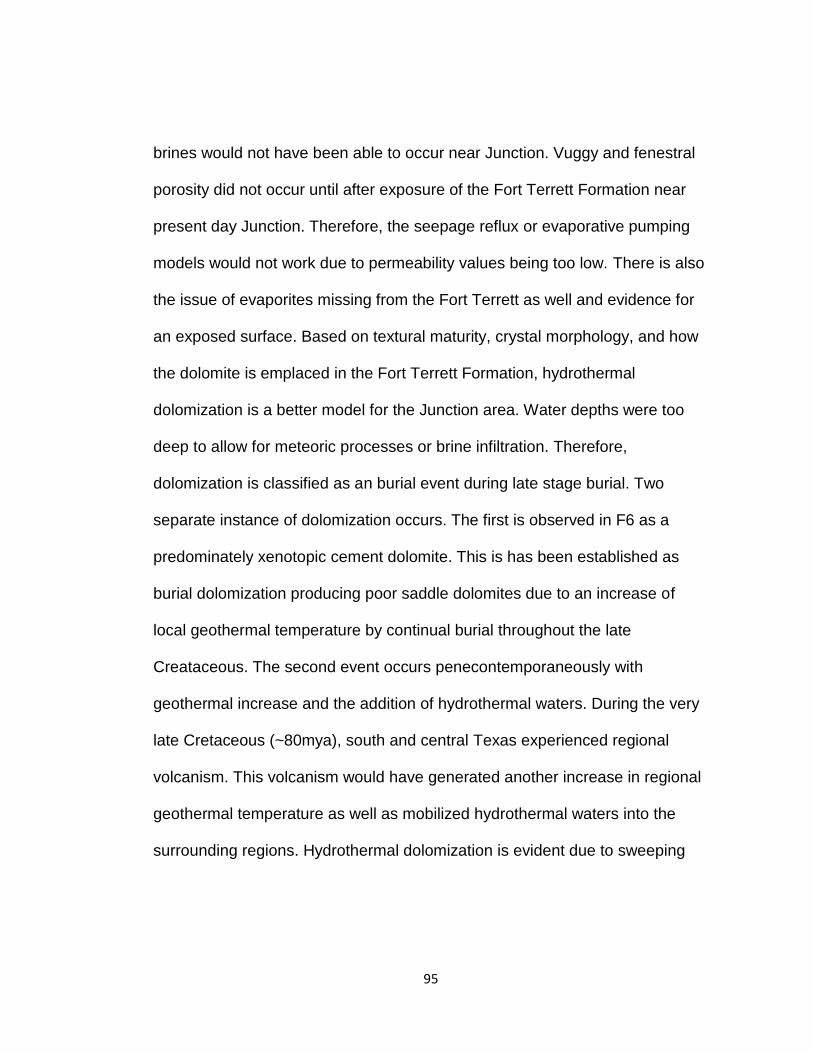
95
brines would not have been able to occur near Junction. Vuggy and fenestral
porosity did not occur until after exposure of the Fort Terrett Formation near
present day Junction. Therefore, the seepage reflux or evaporative pumping
models would not work due to permeability values being too low. There is also
the issue of evaporites missing from the Fort Terrett as well and evidence for
an exposed surface. Based on textural maturity, crystal morphology, and how
the dolomite is emplaced in the Fort Terrett Formation, hydrothermal
dolomization is a better model for the Junction area. Water depths were too
deep to allow for meteoric processes or brine infiltration. Therefore,
dolomization is classified as an burial event during late stage burial. Two
separate instance of dolomization occurs. The first is observed in F6 as a
predominately xenotopic cement dolomite. This is has been established as
burial dolomization producing poor saddle dolomites due to an increase of
local geothermal temperature by continual burial throughout the late
Creataceous. The second event occurs penecontemporaneously with
geothermal increase and the addition of hydrothermal waters. During the very
late Cretaceous (~80mya), south and central Texas experienced regional
volcanism. This volcanism would have generated another increase in regional
geothermal temperature as well as mobilized hydrothermal waters into the
surrounding regions. Hydrothermal dolomization is evident due to sweeping

96
extinctions observed in idiotopic dolomites from F2 as well as the addition of
chalcedony in several facies.
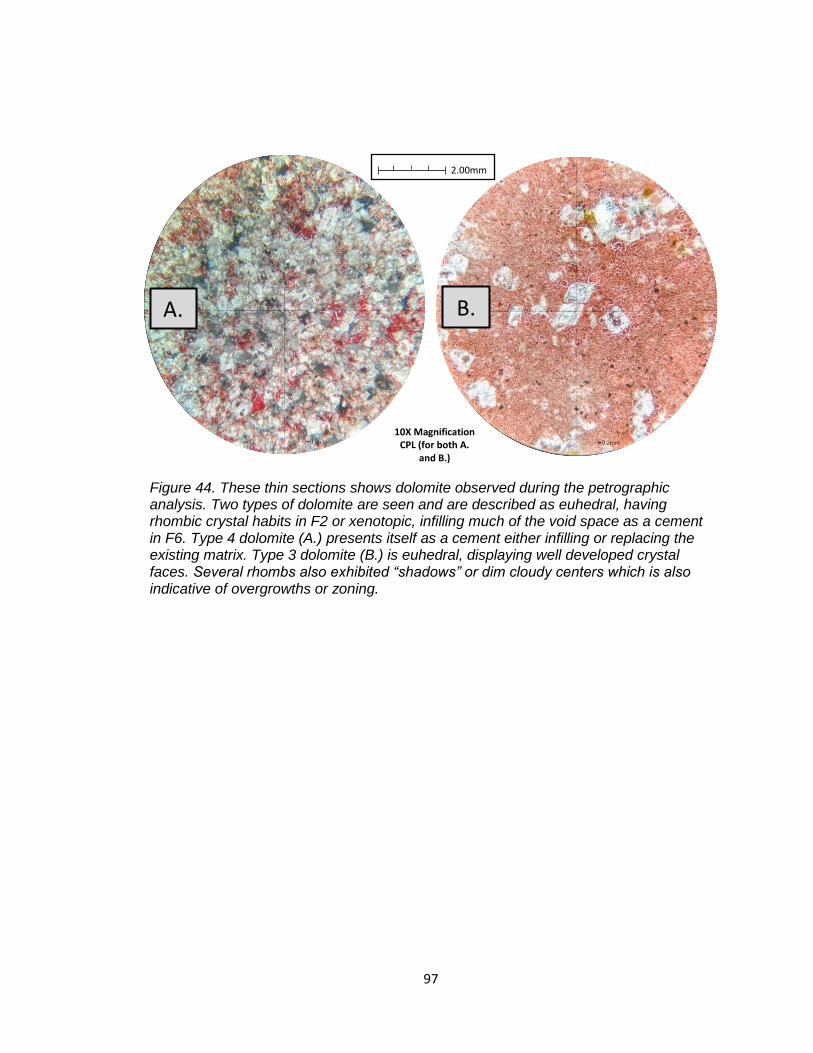
97
A. B.
Figure 44. These thin sections shows dolomite observed during the petrographic analysis. Two types of dolomite are seen and are described as euhedral, having rhombic crystal habits in F2 or xenotopic, infilling much of the void space as a cement in F6. Type 4 dolomite (A.) presents itself as a cement either infilling or replacing the existing matrix. Type 3 dolomite (B.) is euhedral, displaying well developed crystal faces. Several rhombs also exhibited “shadows” or dim cloudy centers which is also indicative of overgrowths or zoning.
10X Magnification CPL (for both A.
and B.)
2.00mm
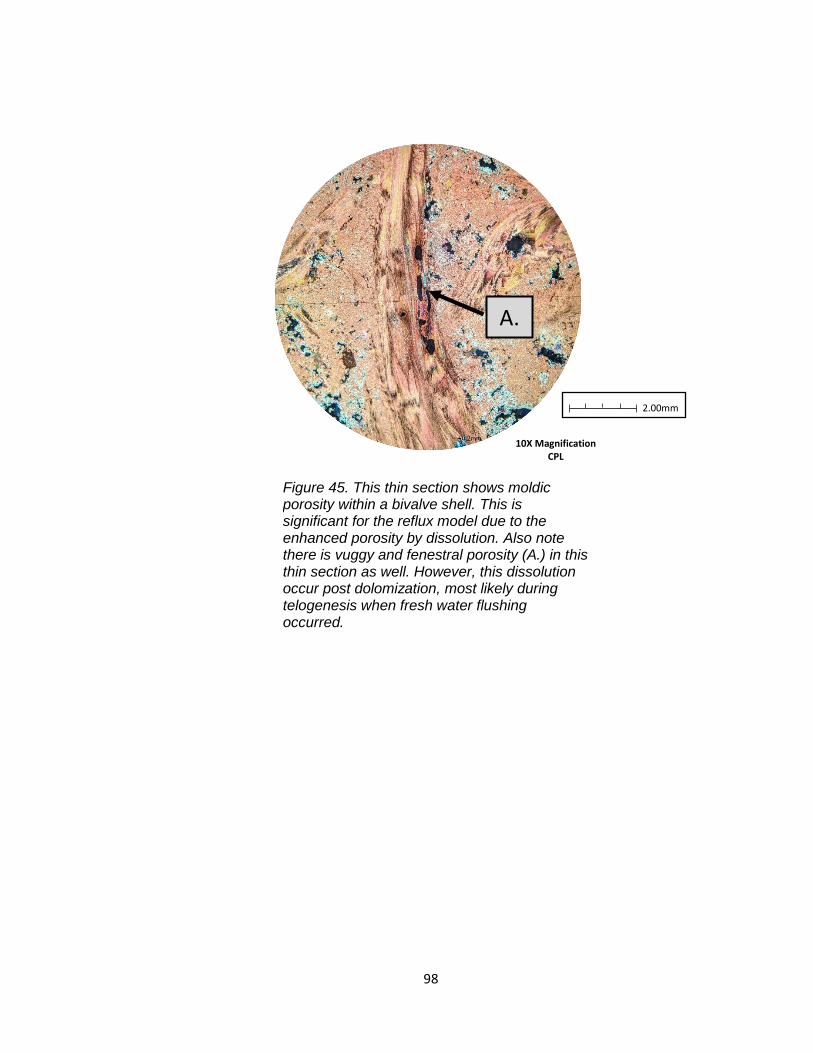
98
A.
10X Magnification CPL
Figure 45. This thin section shows moldic porosity within a bivalve shell. This is significant for the reflux model due to the enhanced porosity by dissolution. Also note there is vuggy and fenestral porosity (A.) in this thin section as well. However, this dissolution occur post dolomization, most likely during telogenesis when fresh water flushing occurred.
2.00mm
99
A.
B.
10X Magnification PPL
Figure 46. This thin section shows euhedral, planar dolomite (A) in micrite matrix with overgrowth centers which indicates Type 3 dolomite. There is also indications of dedolomization (B.) where a faint dolomite rhomb has been replaced by calcite but has maintained the crystal habit of the dolomite as well as the overgrowth.
2.00mm
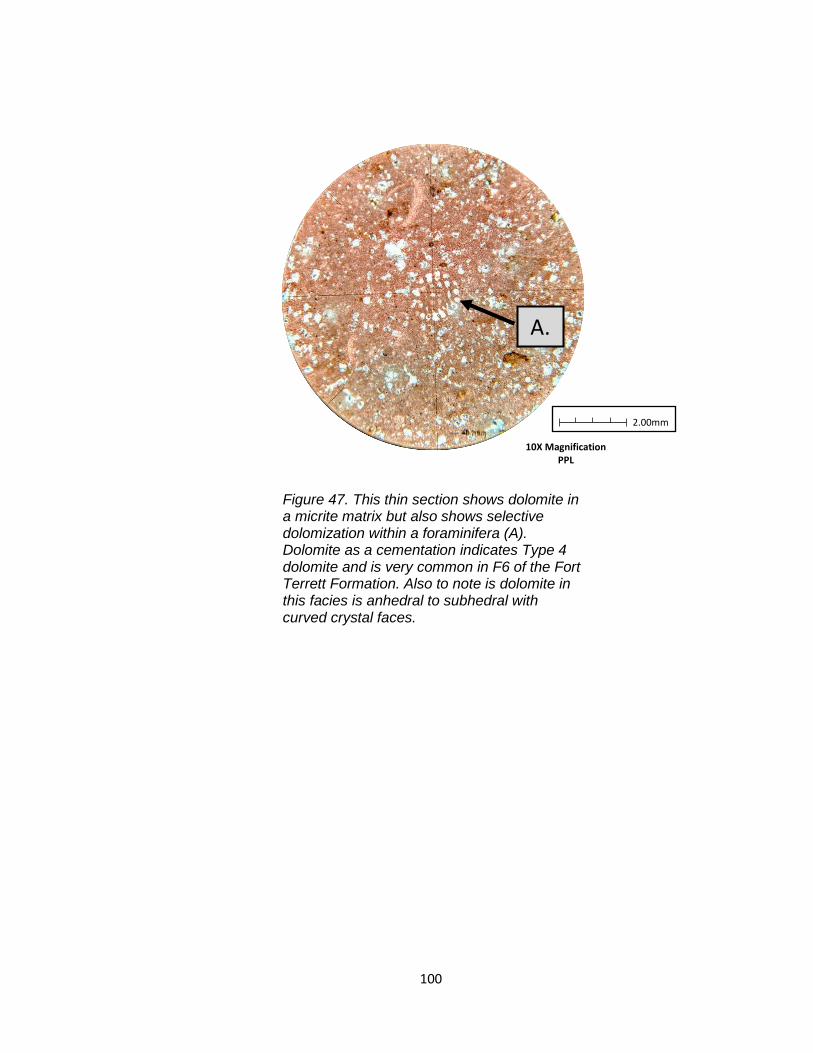
100
A.
Figure 47. This thin section shows dolomite in a micrite matrix but also shows selective dolomization within a foraminifera (A). Dolomite as a cementation indicates Type 4 dolomite and is very common in F6 of the Fort Terrett Formation. Also to note is dolomite in this facies is anhedral to subhedral with curved crystal faces.
10X Magnification PPL
2.00mm
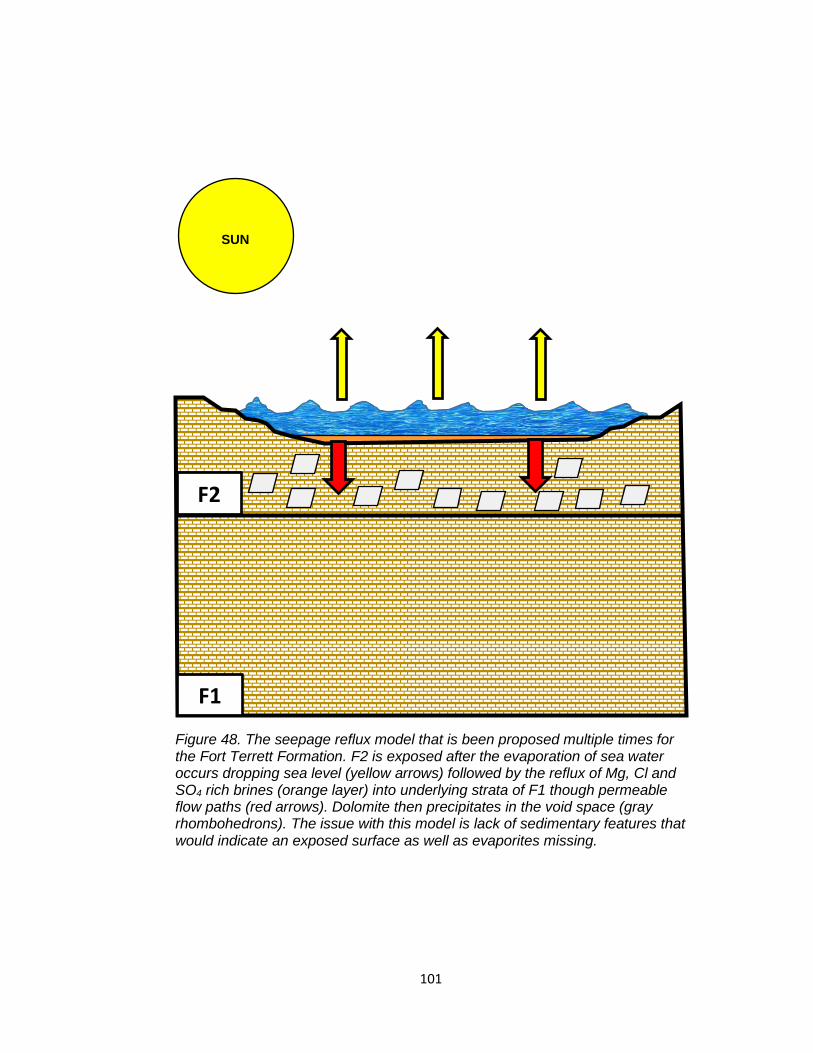
101
F2
F1
Figure 48. The seepage reflux model that is been proposed multiple times for the Fort Terrett Formation. F2 is exposed after the evaporation of sea water occurs dropping sea level (yellow arrows) followed by the reflux of Mg, Cl and SO4 rich brines (orange layer) into underlying strata of F1 though permeable flow paths (red arrows). Dolomite then precipitates in the void space (gray rhombohedrons). The issue with this model is lack of sedimentary features that would indicate an exposed surface as well as evaporites missing.
SUN
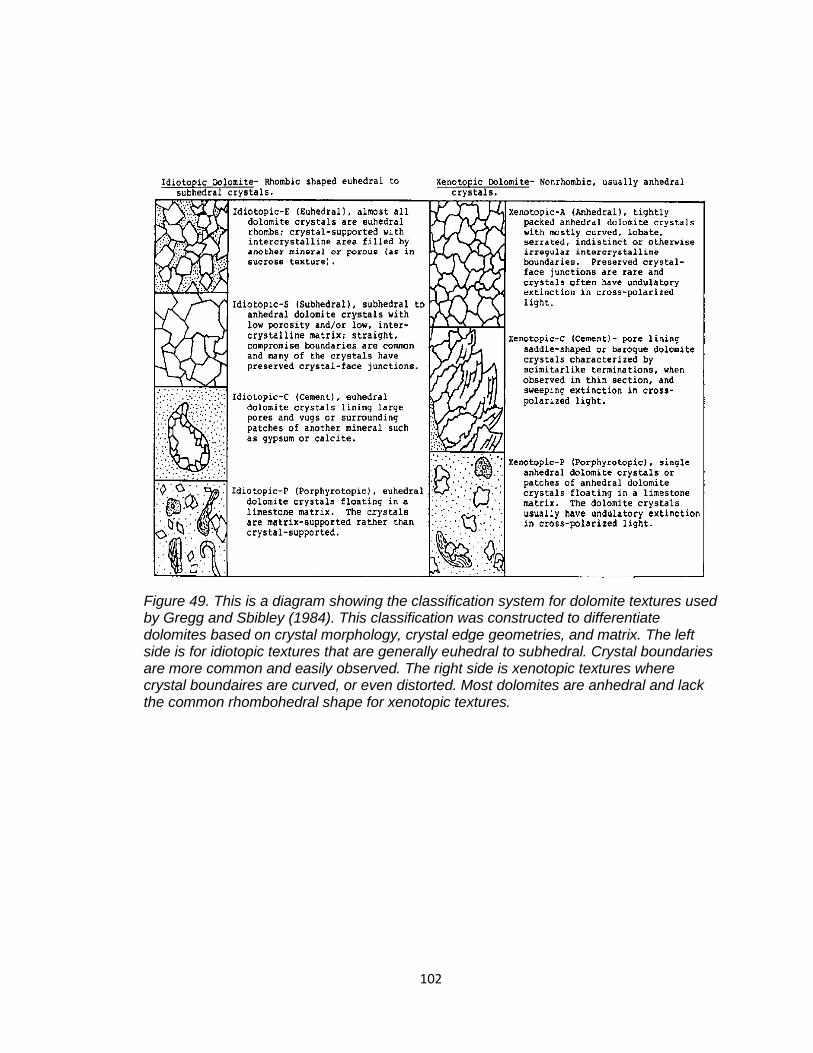
102
Figure 49. This is a diagram showing the classification system for dolomite textures used by Gregg and Sbibley (1984). This classification was constructed to differentiate dolomites based on crystal morphology, crystal edge geometries, and matrix. The left side is for idiotopic textures that are generally euhedral to subhedral. Crystal boundaries are more common and easily observed. The right side is xenotopic textures where crystal boundaires are curved, or even distorted. Most dolomites are anhedral and lack the common rhombohedral shape for xenotopic textures.
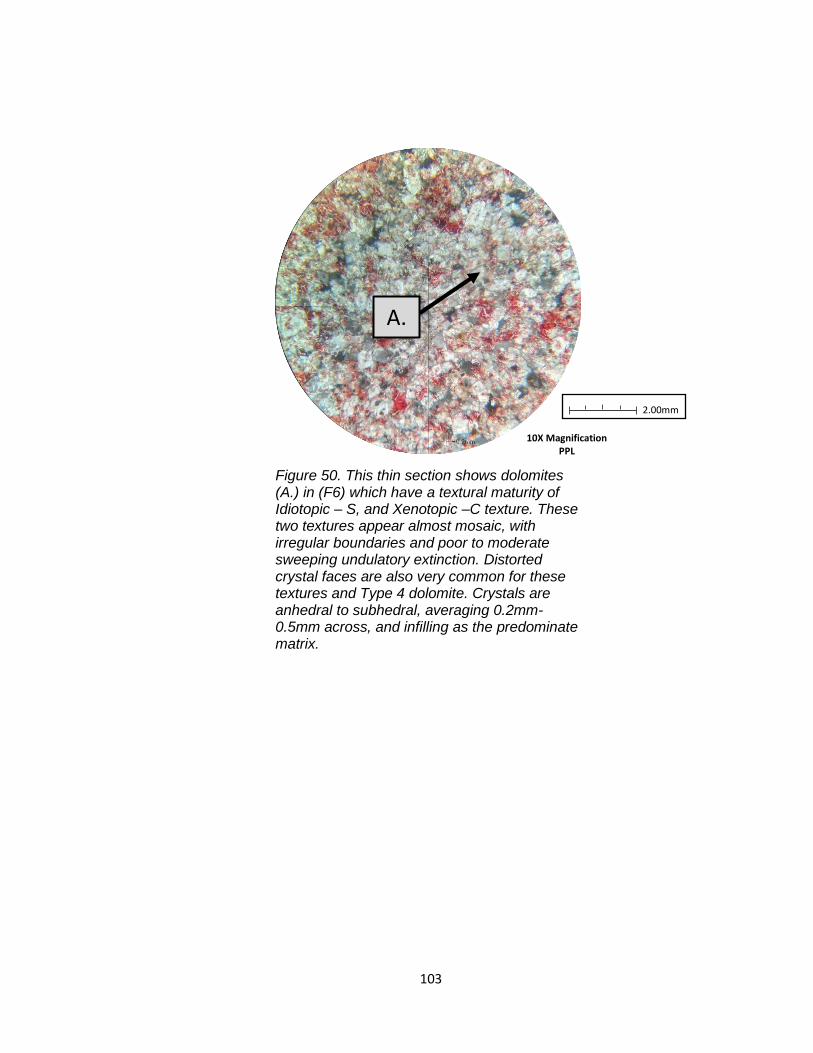
103
A.
Figure 50. This thin section shows dolomites (A.) in (F6) which have a textural maturity of Idiotopic – S, and Xenotopic –C texture. These two textures appear almost mosaic, with irregular boundaries and poor to moderate sweeping undulatory extinction. Distorted crystal faces are also very common for these textures and Type 4 dolomite. Crystals are anhedral to subhedral, averaging 0.2mm-0.5mm across, and infilling as the predominate matrix.
2.00mm
10X Magnification PPL
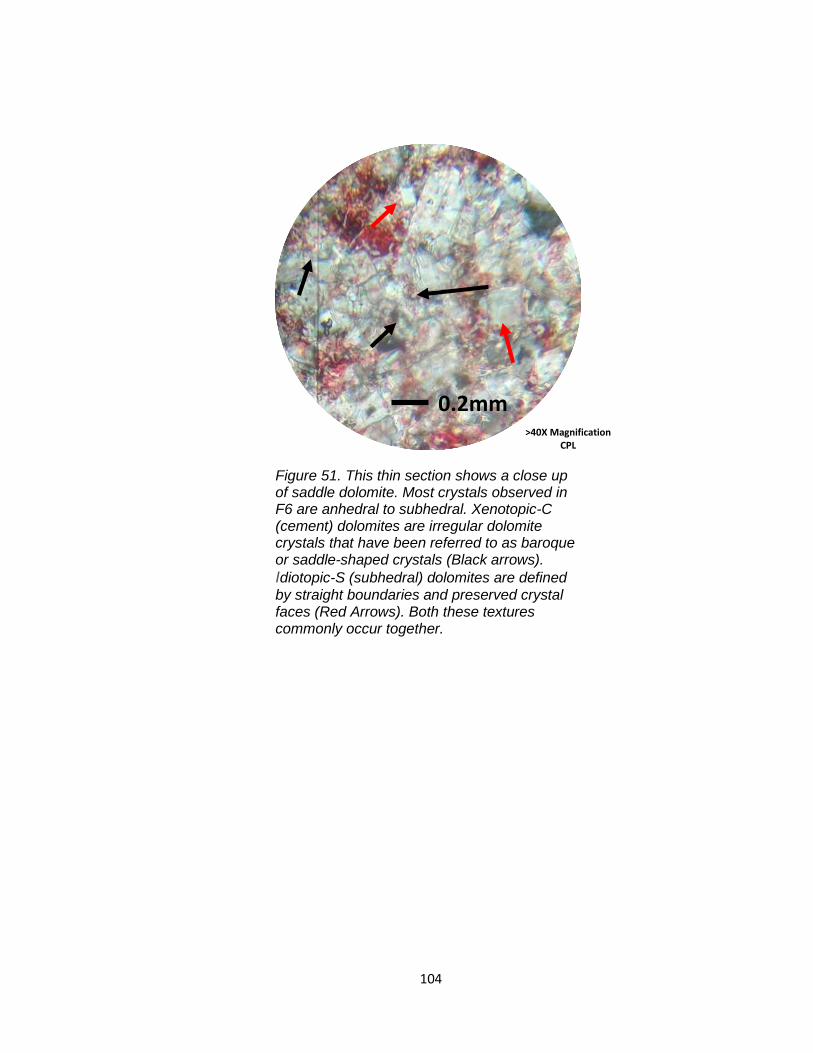
104
0.2mm
>40X Magnification CPL
Figure 51. This thin section shows a close up of saddle dolomite. Most crystals observed in F6 are anhedral to subhedral. Xenotopic-C (cement) dolomites are irregular dolomite crystals that have been referred to as baroque or saddle-shaped crystals (Black arrows).
Idiotopic-S (subhedral) dolomites are defined
by straight boundaries and preserved crystal faces (Red Arrows). Both these textures commonly occur together.
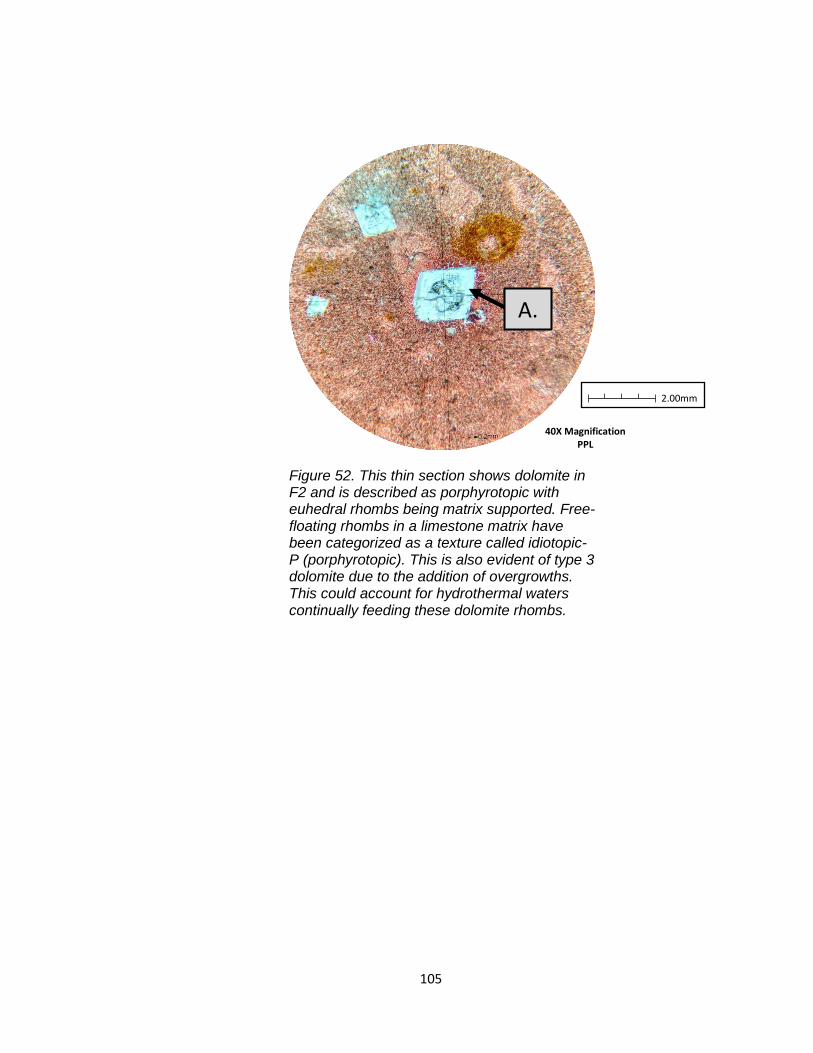
105
A.
40X Magnification PPL
Figure 52. This thin section shows dolomite in F2 and is described as porphyrotopic with euhedral rhombs being matrix supported. Free-floating rhombs in a limestone matrix have been categorized as a texture called idiotopic-P (porphyrotopic). This is also evident of type 3 dolomite due to the addition of overgrowths. This could account for hydrothermal waters continually feeding these dolomite rhombs.
2.00mm
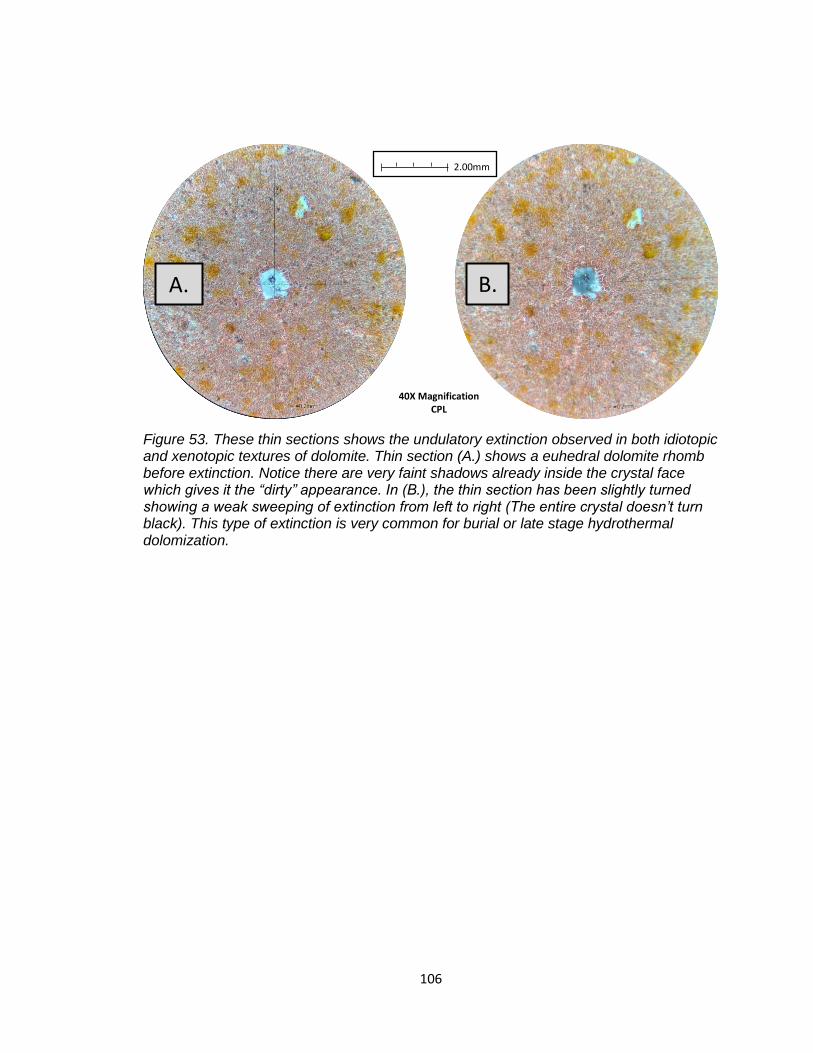
106
Figure 53. These thin sections shows the undulatory extinction observed in both idiotopic and xenotopic textures of dolomite. Thin section (A.) shows a euhedral dolomite rhomb before extinction. Notice there are very faint shadows already inside the crystal face which gives it the “dirty” appearance. In (B.), the thin section has been slightly turned showing a weak sweeping of extinction from left to right (The entire crystal doesn’t turn black). This type of extinction is very common for burial or late stage hydrothermal dolomization.
A. B.
40X Magnification CPL
2.00mm
107
DISCUSSION
The Fort Terrett Formation has undergone several facies changes as
well as diagenetic alterations since deposition in the late Albian. Facies and
petrographic analysis has shown that the Fort Terrett lithology ranges from
bioclastic wackestones to packstones with a diverse set of allochems mostly
comprised of bivalves, peloids, milioids, and gastropods. Chert nodules are
common in the thin bed unit where dissolution is the very prevalent. Dolomite is
also common in facies with a high percentage of void space as euhedral, Type
4 dolomite as seen in F2 or as weak, subhedral saddle dolomite in F6. Dolomite
in F2 is well developed dolomite and matrix supported where F6 dolomite is
predominately a cement by either infilling or replacing. Based on the transition
of facies, a depositional environment model (Figure 54) was constructed to
illustrate where these changes take place in the Fort Terrett Formation as well
as interpreted sea level changes. Sea level changes are just for the purpose of
this study and do not reflect overall changes for the entire Western Interior
Seaway or the Comanche Shelf. The following will dissect Figure 54 to clarify
the transition in facies trends as well as discuss the criteria used to distinguish
changes in the fort Terrett Formation.
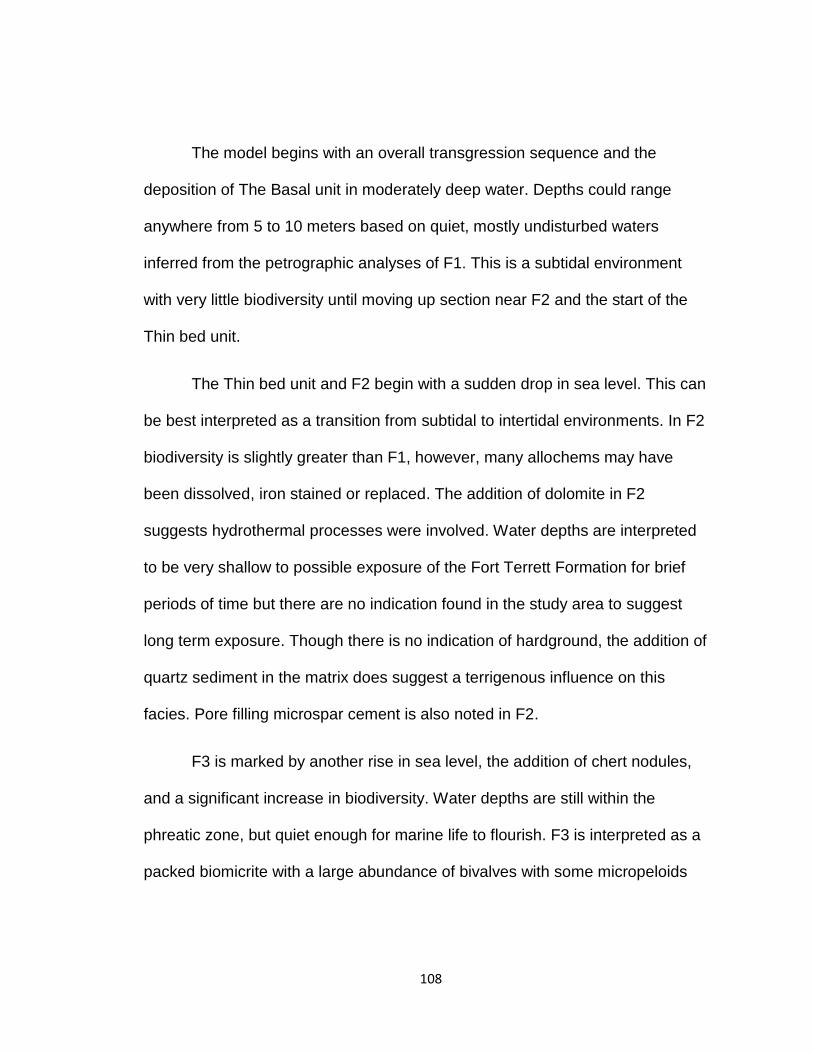
108
The model begins with an overall transgression sequence and the
deposition of The Basal unit in moderately deep water. Depths could range
anywhere from 5 to 10 meters based on quiet, mostly undisturbed waters
inferred from the petrographic analyses of F1. This is a subtidal environment
with very little biodiversity until moving up section near F2 and the start of the
Thin bed unit.
The Thin bed unit and F2 begin with a sudden drop in sea level. This can
be best interpreted as a transition from subtidal to intertidal environments. In F2
biodiversity is slightly greater than F1, however, many allochems may have
been dissolved, iron stained or replaced. The addition of dolomite in F2
suggests hydrothermal processes were involved. Water depths are interpreted
to be very shallow to possible exposure of the Fort Terrett Formation for brief
periods of time but there are no indication found in the study area to suggest
long term exposure. Though there is no indication of hardground, the addition of
quartz sediment in the matrix does suggest a terrigenous influence on this
facies. Pore filling microspar cement is also noted in F2.
F3 is marked by another rise in sea level, the addition of chert nodules,
and a significant increase in biodiversity. Water depths are still within the
phreatic zone, but quiet enough for marine life to flourish. F3 is interpreted as a
packed biomicrite with a large abundance of bivalves with some micropeloids
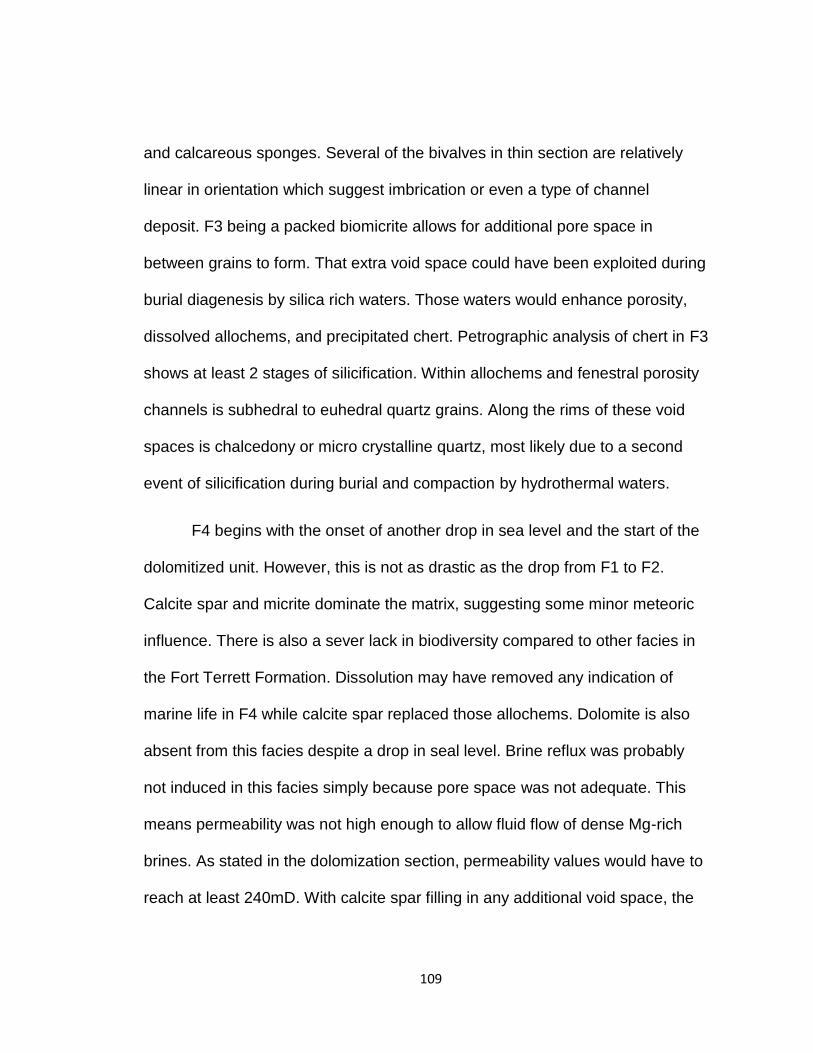
109
and calcareous sponges. Several of the bivalves in thin section are relatively
linear in orientation which suggest imbrication or even a type of channel
deposit. F3 being a packed biomicrite allows for additional pore space in
between grains to form. That extra void space could have been exploited during
burial diagenesis by silica rich waters. Those waters would enhance porosity,
dissolved allochems, and precipitated chert. Petrographic analysis of chert in F3
shows at least 2 stages of silicification. Within allochems and fenestral porosity
channels is subhedral to euhedral quartz grains. Along the rims of these void
spaces is chalcedony or micro crystalline quartz, most likely due to a second
event of silicification during burial and compaction by hydrothermal waters.
F4 begins with the onset of another drop in sea level and the start of the
dolomitized unit. However, this is not as drastic as the drop from F1 to F2.
Calcite spar and micrite dominate the matrix, suggesting some minor meteoric
influence. There is also a sever lack in biodiversity compared to other facies in
the Fort Terrett Formation. Dissolution may have removed any indication of
marine life in F4 while calcite spar replaced those allochems. Dolomite is also
absent from this facies despite a drop in seal level. Brine reflux was probably
not induced in this facies simply because pore space was not adequate. This
means permeability was not high enough to allow fluid flow of dense Mg-rich
brines. As stated in the dolomization section, permeability values would have to
reach at least 240mD. With calcite spar filling in any additional void space, the
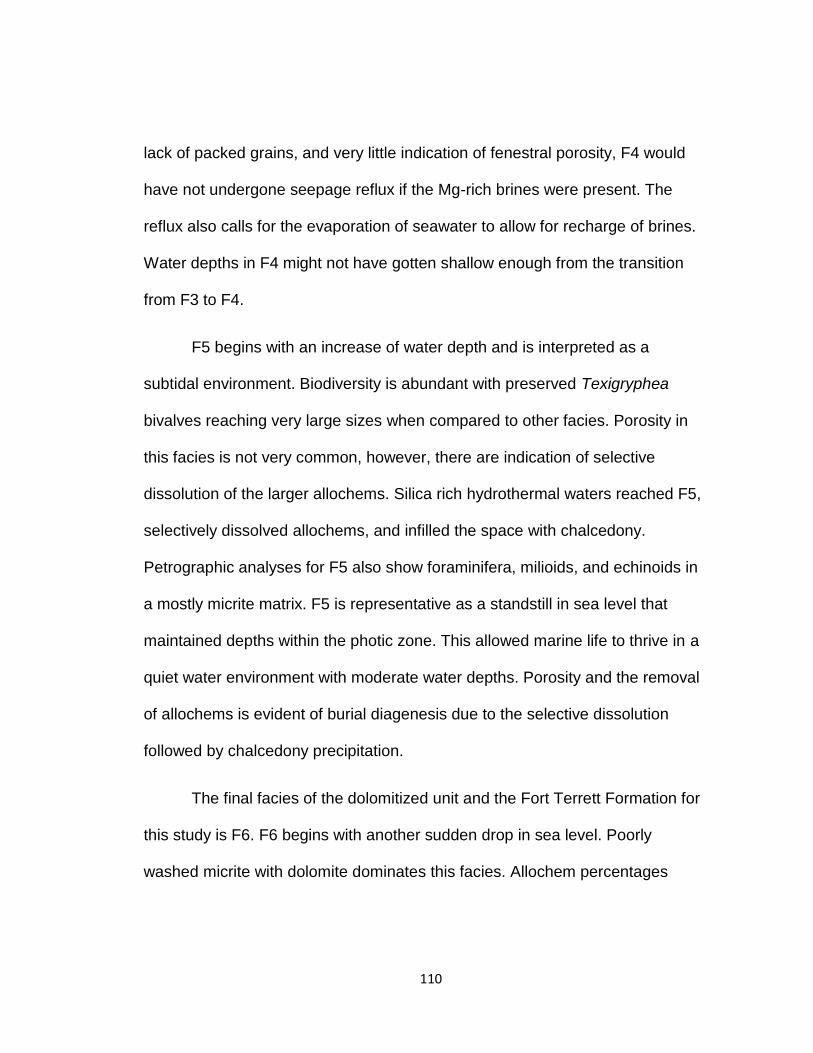
110
lack of packed grains, and very little indication of fenestral porosity, F4 would
have not undergone seepage reflux if the Mg-rich brines were present. The
reflux also calls for the evaporation of seawater to allow for recharge of brines.
Water depths in F4 might not have gotten shallow enough from the transition
from F3 to F4.
F5 begins with an increase of water depth and is interpreted as a
subtidal environment. Biodiversity is abundant with preserved Texigryphea
bivalves reaching very large sizes when compared to other facies. Porosity in
this facies is not very common, however, there are indication of selective
dissolution of the larger allochems. Silica rich hydrothermal waters reached F5,
selectively dissolved allochems, and infilled the space with chalcedony.
Petrographic analyses for F5 also show foraminifera, milioids, and echinoids in
a mostly micrite matrix. F5 is representative as a standstill in sea level that
maintained depths within the photic zone. This allowed marine life to thrive in a
quiet water environment with moderate water depths. Porosity and the removal
of allochems is evident of burial diagenesis due to the selective dissolution
followed by chalcedony precipitation.
The final facies of the dolomitized unit and the Fort Terrett Formation for
this study is F6. F6 begins with another sudden drop in sea level. Poorly
washed micrite with dolomite dominates this facies. Allochem percentages
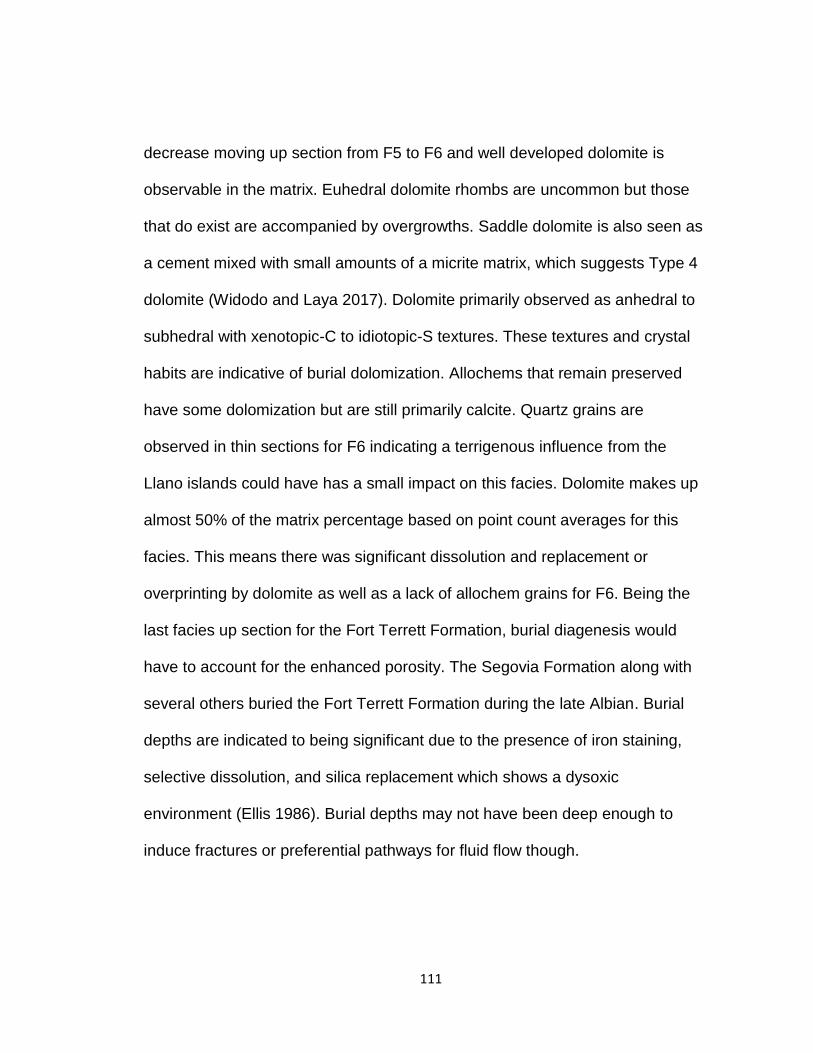
111
decrease moving up section from F5 to F6 and well developed dolomite is
observable in the matrix. Euhedral dolomite rhombs are uncommon but those
that do exist are accompanied by overgrowths. Saddle dolomite is also seen as
a cement mixed with small amounts of a micrite matrix, which suggests Type 4
dolomite (Widodo and Laya 2017). Dolomite primarily observed as anhedral to
subhedral with xenotopic-C to idiotopic-S textures. These textures and crystal
habits are indicative of burial dolomization. Allochems that remain preserved
have some dolomization but are still primarily calcite. Quartz grains are
observed in thin sections for F6 indicating a terrigenous influence from the
Llano islands could have has a small impact on this facies. Dolomite makes up
almost 50% of the matrix percentage based on point count averages for this
facies. This means there was significant dissolution and replacement or
overprinting by dolomite as well as a lack of allochem grains for F6. Being the
last facies up section for the Fort Terrett Formation, burial diagenesis would
have to account for the enhanced porosity. The Segovia Formation along with
several others buried the Fort Terrett Formation during the late Albian. Burial
depths are indicated to being significant due to the presence of iron staining,
selective dissolution, and silica replacement which shows a dysoxic
environment (Ellis 1986). Burial depths may not have been deep enough to
induce fractures or preferential pathways for fluid flow though.
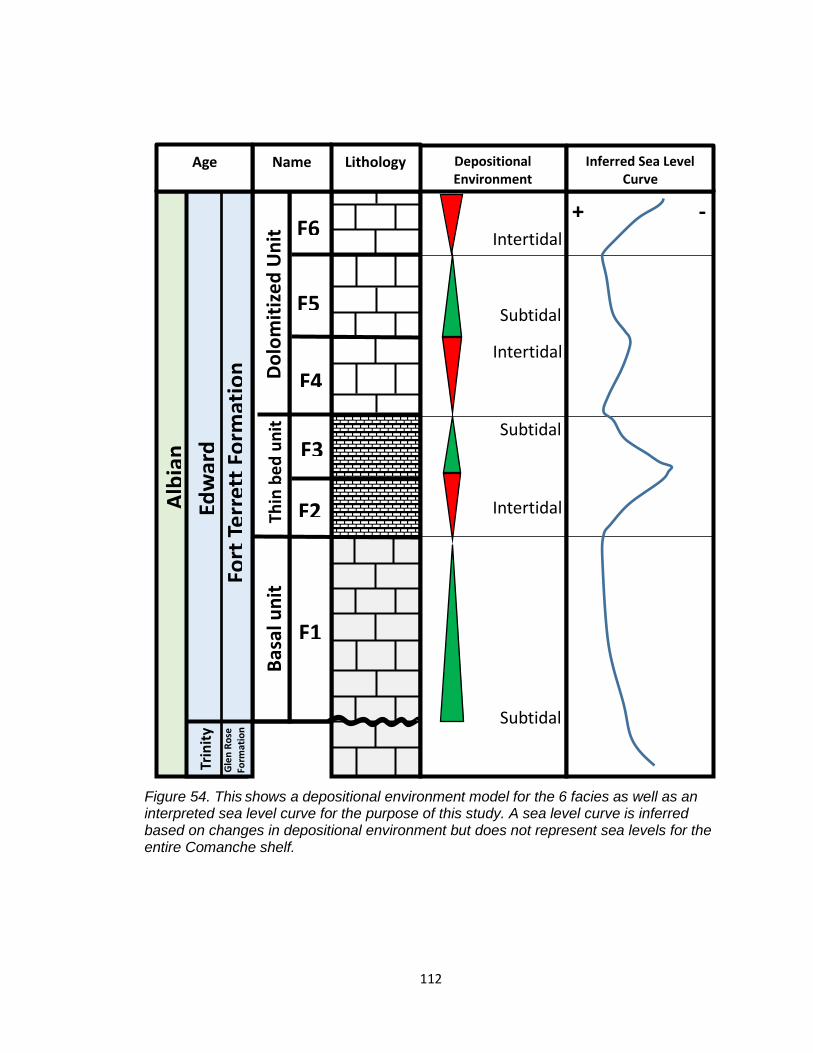
112
Figure 54. This shows a depositional environment model for the 6 facies as well as an interpreted sea level curve for the purpose of this study. A sea level curve is inferred based on changes in depositional environment but does not represent sea levels for the entire Comanche shelf.
Subtidal
Subtidal
Intertidal
Intertidal
Subtidal
Intertidal
F1
F6
F5
F4
F3
F2
Bas
al u
nit
D
olo
mit
ize
d U
nit
Th
in b
ed
un
it
Fort
Te
rre
tt F
orm
atio
n
Edw
ard
s
Alb
ian
+ - G
len
Ro
se
Form
atio
n
Trin
ity
Depositional Environment
Inferred Sea Level Curve
Lithology Name Age
113
CONCLUSIONS
The Fort Terrett Formation is found in outcrops near Junction, Texas in
road cuts and dominates the upper topography surrounding Junction. Based
on stratigraphic analysis and comparison of lithostratigraphy from Wilkerson
(2018) and Rose (1972), the Fort Terrett Formation is disconformably bounded
by the Glen Rose Formation below and the Segovia Formation above. The
Walnut Formation was omitted from the stratigraphic column by concluding the
marl beds were part of the Glen Rose Formation and the Texigryphea is also a
key fossil for the Glen Rose Formation. The second notable formation not
observed was the Kirschberg Evaporative unit. Though the Kirshberg
Evaporites are prevalent further North West toward the Llnao Uplift, the
evaporites were not deposited near junction. There is a complete lack of
evaporite minerals or traces that they were diagenetically altered. Deposition
of the Fort Terrett occurred within the shallow, quiet waters during the late the
Albian of the Lower Cretaceous on the Comanche Platform shelf margin. The
Fort Terrett Formation is primarily a bivalve rich wackestone to packestone
limestones in hand samples. Petrographic analyses of the 16 thin sections cut
showed a range of sparse biomicrites, poorly washed sparites, and packed
114
biomicrites. From those 16 thin sections a facies and diagenesis analysis was
conducted and determined there were 6 significant facies changes in the Fort
Terrett Formation near Junction. These changes were dependent on lithology
changes, bioclastic percentage and diversity, diagenetic features, and matrix.
Porosity was also valuable in assessing facies trends as well as determining
diagenetic events. Facies changes in the Fort Terrett Formation included
transitions between subtidal and intertidal depositional environments.
Supratidal environments have been proposed by previous studies, however,
there is a lack of evidence to suggest exposure during the deposition of the
Fort Terrett Formation near Junction. Subtidal to intertidal environment
changes were noted by an increase in biodiversity such as bivalves.
Dolomization in the Fort Terrett Formation is very well noted in previous
studies in Kimble County as well as most of west central Texas. Dolomization
for the Fort Terrett Formation near Junction includes several models that have
been proposed, however, the Burial Dolomization and Hydrothermal Fluid
Dolomization models are used for the purpose of this thesis. Burial of the Fort
Terrett Formation by several stratigraphic units up to the Austin Chalk, as well
as the addition of hydrothermal waters from Late Cretaceous volcanism are
responsible for the dolomization events that occurred. Dolomization is just one
of several diagenetic events to occur to the Fort Terrett Formation. Four
primary diagenetic events are modeled for the study area and this thesis.

115
Shallow marine diagenesis, early burial, late burial associated with
hydrothermal activity, and telogenesis are the controlling events on diagenetic
changes observed in the petrographic analysis. The Fort Terrett Formation
undergoes several mineralogy changes due to diagenesis and changes in
depositional environment. The addition of chert, micro spar, dolomite, and
oxide staining is evident that there are dynamic changes to this carbonate.
Many of these changes are also analogous with facies and diagenetic
analyses done on the Fort Terrett Formation in surrounding counties and also
modernizes the depositional model for deposition near Junction, Texas. This
thesis also provides a new, modern model for dolomization in the Fort Terrett
Formation near Junction, Texas
116
REFERENCES
Adkins, W.S., 1933, The Mesozoic Systems in Texas in the Geology of Texas: Stratigraphy: University of Texas. Bulletin 3232, v. 1. Baily, Albert and Palmer, Allision, The Geology of North America: An Overview, 1989
Barnes, V.E., 1976, Geologic Atlas of Texas, University of Texas-Austin, Bureau of Economic Geology Geologic Atlas of Texas, scale 1:250,000, William Battle Phillips Memorial Edition
Barnes, V.E., 1944, Gypsum in the Edwards Limestone of Central Texas: Texas Mineral Resources, University of Texas Pub. 4301, pp. 35-46. Bergan G.R., Pittman, J.G, 1990, Nearshore Clastic-Carbonate Facies in the Glen Rose Formation (Lower Cretaceous) in North-Central Texas: Dallas Geologic Society.
Blakey, R, Map of Lower Cretaceous Aptain-Albain: Colorado System Geosystem.
Burholder, J., Lumsden, D., 1973, Petrographic analysis of a subsurface portion of the Glen Rose Formation (Lower Cretaceous), South Texas: Gulf Coast Association of Geologic Societies, v. 23, pp. 278-287.
D.E. WhiteThermal waters of volcanic origin Geological Society of America Bulletin, 68(1957), pp. 1637-1658
Fisher, W.L., and Rodda, P.U., 1967, Stratigraphy and genesis of dolomite, Edwards Formation (Lower Cretaceous) of Texas, In E.E. Angino and R,G. Hardy, eds. Proceedings of Third Forum on Geology of Industrial Minerals: Kansas Geologic Survey Society Dist Pub. 34, pp. 52-75.
Fisher, W.L., and Rodda, P.U., 1969, Edwards Formation (Lower Cretaceous), Texas: Dolomitization in a carbonate platform system: AAPG, V. 53, pp. 55-72. Folk, R. L., 1965, Some aspects of recrystallization in ancient limestones, in Pray, L. C., and Murray, R. C., eds., Dolomitization and Limestone Diagenesis: Soc. Econ. Paleontologists Mineralogists Spec. Pub. No. 13, p. 14-48. Friedman, G. M., 1965, Terminology of crystallization textures and fabrics in sedimentary rocks: Journal of Sedimentary Petrology, vol. 35, p. 643-655. Gregg, J.M., Sibley, D.F., 1984, Burial Dolomization and the Origin of Xenotopic Dolomite Texture: Journal of Sedimentary Petrology, Vol. 54, No. 3, P. 908--931
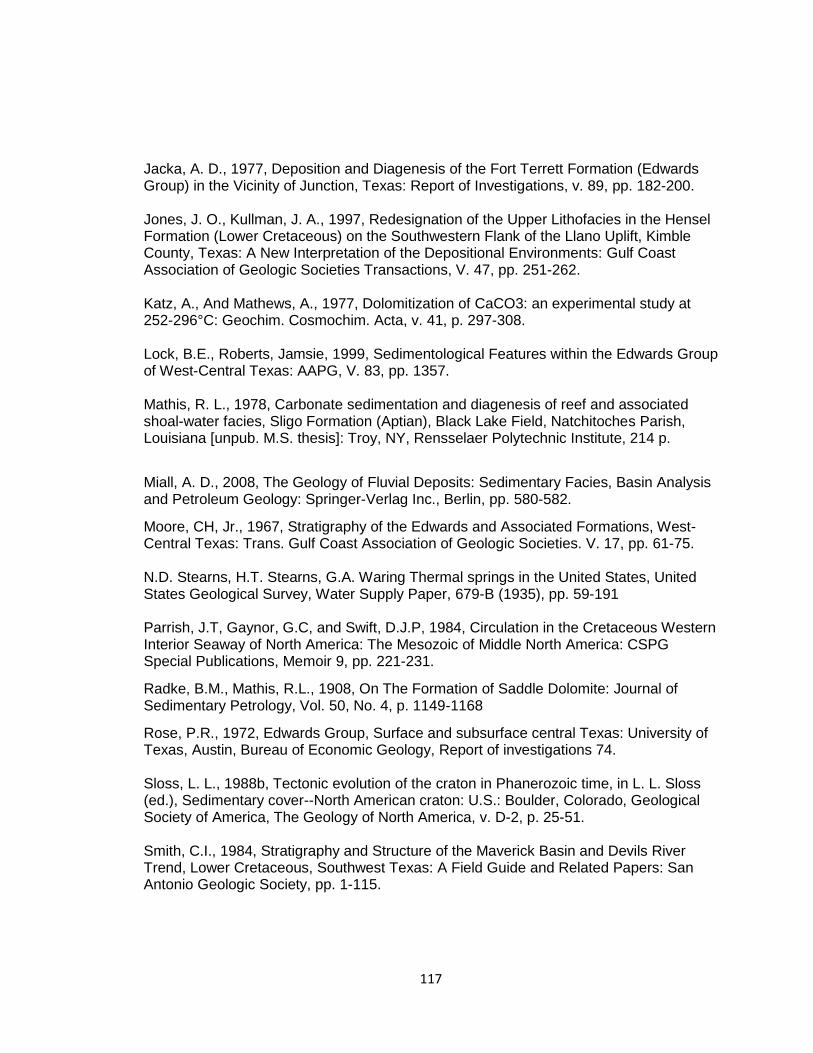
117
Jacka, A. D., 1977, Deposition and Diagenesis of the Fort Terrett Formation (Edwards Group) in the Vicinity of Junction, Texas: Report of Investigations, v. 89, pp. 182-200.
Jones, J. O., Kullman, J. A., 1997, Redesignation of the Upper Lithofacies in the Hensel Formation (Lower Cretaceous) on the Southwestern Flank of the Llano Uplift, Kimble County, Texas: A New Interpretation of the Depositional Environments: Gulf Coast Association of Geologic Societies Transactions, V. 47, pp. 251-262. Katz, A., And Mathews, A., 1977, Dolomitization of CaCO3: an experimental study at 252-296°C: Geochim. Cosmochim. Acta, v. 41, p. 297-308.
Lock, B.E., Roberts, Jamsie, 1999, Sedimentological Features within the Edwards Group of West-Central Texas: AAPG, V. 83, pp. 1357. Mathis, R. L., 1978, Carbonate sedimentation and diagenesis of reef and associated shoal-water facies, Sligo Formation (Aptian), Black Lake Field, Natchitoches Parish, Louisiana [unpub. M.S. thesis]: Troy, NY, Rensselaer Polytechnic Institute, 214 p.
Miall, A. D., 2008, The Geology of Fluvial Deposits: Sedimentary Facies, Basin Analysis and Petroleum Geology: Springer-Verlag Inc., Berlin, pp. 580-582.
Moore, CH, Jr., 1967, Stratigraphy of the Edwards and Associated Formations, West-Central Texas: Trans. Gulf Coast Association of Geologic Societies. V. 17, pp. 61-75. N.D. Stearns, H.T. Stearns, G.A. Waring Thermal springs in the United States, United States Geological Survey, Water Supply Paper, 679-B (1935), pp. 59-191 Parrish, J.T, Gaynor, G.C, and Swift, D.J.P, 1984, Circulation in the Cretaceous Western Interior Seaway of North America: The Mesozoic of Middle North America: CSPG Special Publications, Memoir 9, pp. 221-231.
Radke, B.M., Mathis, R.L., 1908, On The Formation of Saddle Dolomite: Journal of Sedimentary Petrology, Vol. 50, No. 4, p. 1149-1168
Rose, P.R., 1972, Edwards Group, Surface and subsurface central Texas: University of Texas, Austin, Bureau of Economic Geology, Report of investigations 74. Sloss, L. L., 1988b, Tectonic evolution of the craton in Phanerozoic time, in L. L. Sloss (ed.), Sedimentary cover--North American craton: U.S.: Boulder, Colorado, Geological Society of America, The Geology of North America, v. D-2, p. 25-51. Smith, C.I., 1984, Stratigraphy and Structure of the Maverick Basin and Devils River Trend, Lower Cretaceous, Southwest Texas: A Field Guide and Related Papers: San Antonio Geologic Society, pp. 1-115.
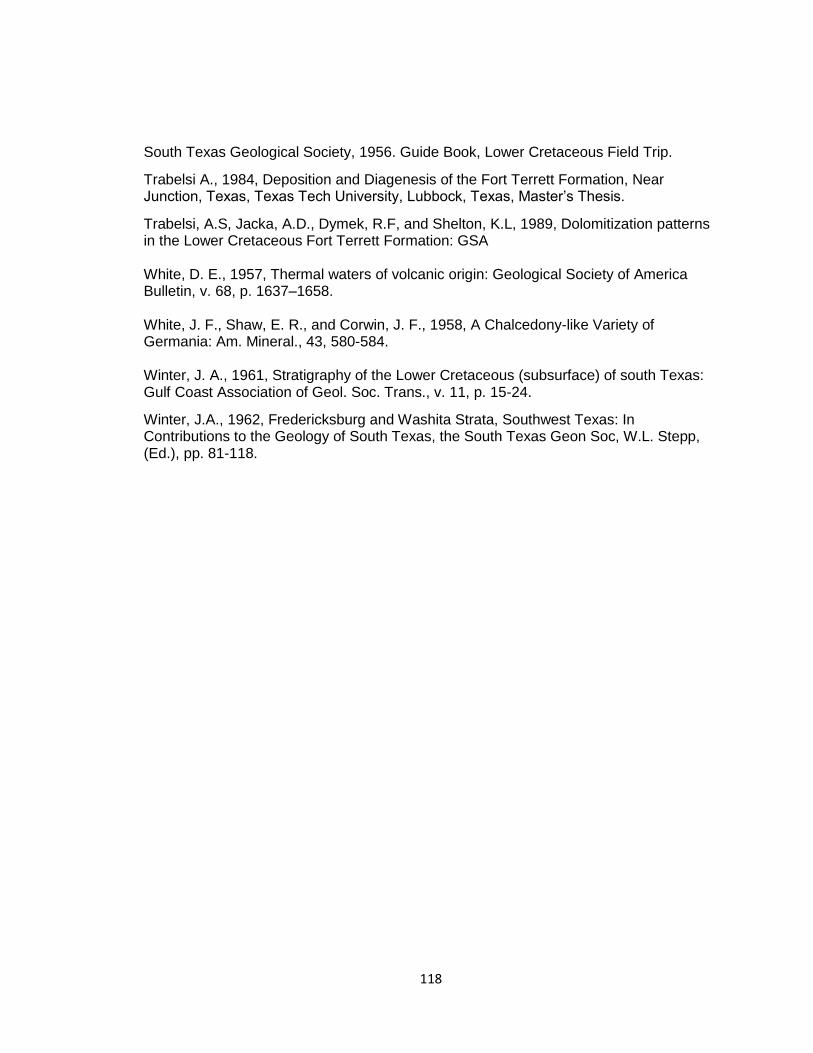
118
South Texas Geological Society, 1956. Guide Book, Lower Cretaceous Field Trip.
Trabelsi A., 1984, Deposition and Diagenesis of the Fort Terrett Formation, Near Junction, Texas, Texas Tech University, Lubbock, Texas, Master’s Thesis.
Trabelsi, A.S, Jacka, A.D., Dymek, R.F, and Shelton, K.L, 1989, Dolomitization patterns in the Lower Cretaceous Fort Terrett Formation: GSA White, D. E., 1957, Thermal waters of volcanic origin: Geological Society of America Bulletin, v. 68, p. 1637–1658. White, J. F., Shaw, E. R., and Corwin, J. F., 1958, A Chalcedony-like Variety of Germania: Am. Mineral., 43, 580-584. Winter, J. A., 1961, Stratigraphy of the Lower Cretaceous (subsurface) of south Texas: Gulf Coast Association of Geol. Soc. Trans., v. 11, p. 15-24.
Winter, J.A., 1962, Fredericksburg and Washita Strata, Southwest Texas: In Contributions to the Geology of South Texas, the South Texas Geon Soc, W.L. Stepp, (Ed.), pp. 81-118.

119
APPENDIX A. THIN SECTIONS
Appendix A. is the petrography done on all 16 thin sections used for the
petrographic and facies analyses of the Fort Terrett Formation. Included is a brief
description of each thin section as well as the matrix percentages. Thin sections
are numbered 001-016 for reference for this thesis.
120
B.
A.
Figure 55. This thin section shows thin section 001 at 4X magnification. This thin section shows a sparse biomicrite with preserved bivalve shell fragments (Gryphaea) (A.) and calcareous sponge (B.) allochems in a micrite matrix.
Matrix Percentage
Micrite 82%
Bivalve Fragments 8%
Miliod 7%
Calcareous Sponges 2%
Other < 1%
4X Magnification CPL
2.00mm
121
Figure 56. This thin section shows thin section 002 at 10X magnification. This thin section is a sparse biomicrite with preserved bivalve shell fragments (A.) and a milloid (B.) in a micrite matrix.
Matrix Percentage
Micrite 80%
Bivalve Fragments 12%
Miliod 6%
Calcareous Sponges 1%
Other < 1%
10X Magnification PPL
B.
A.
2.00mm
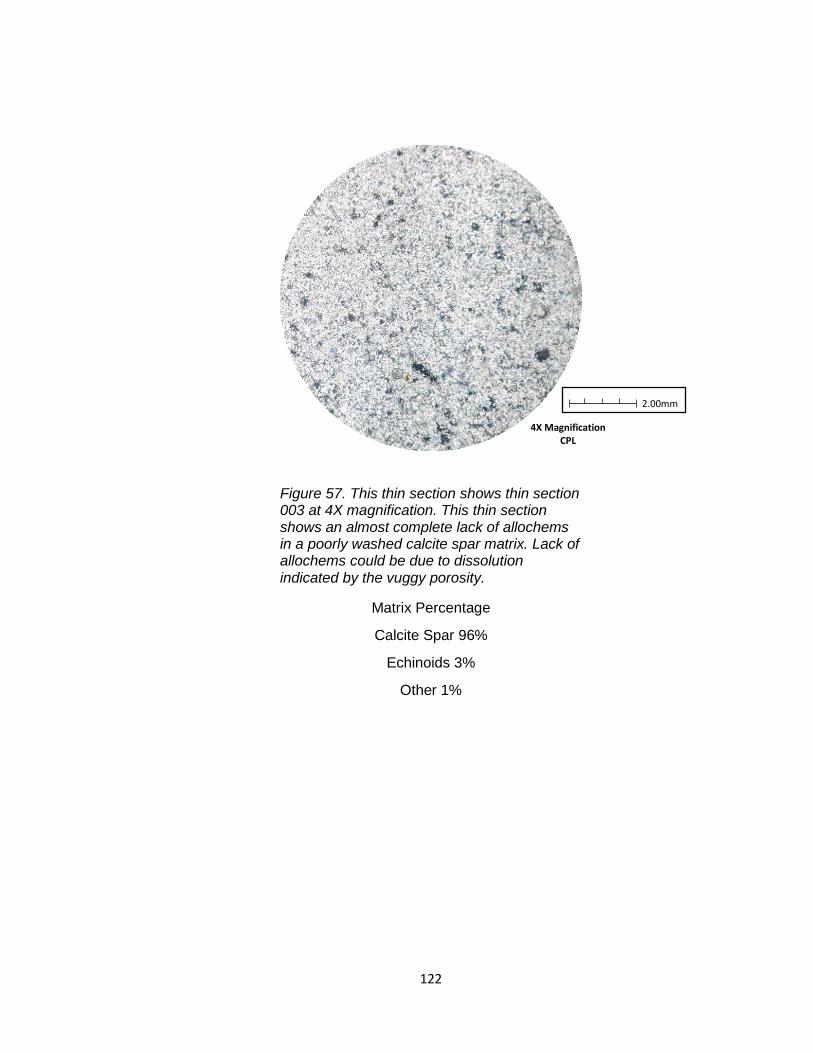
122
Figure 57. This thin section shows thin section 003 at 4X magnification. This thin section shows an almost complete lack of allochems in a poorly washed calcite spar matrix. Lack of allochems could be due to dissolution indicated by the vuggy porosity.
Matrix Percentage
Calcite Spar 96%
Echinoids 3%
Other 1%
4X Magnification CPL
2.00mm
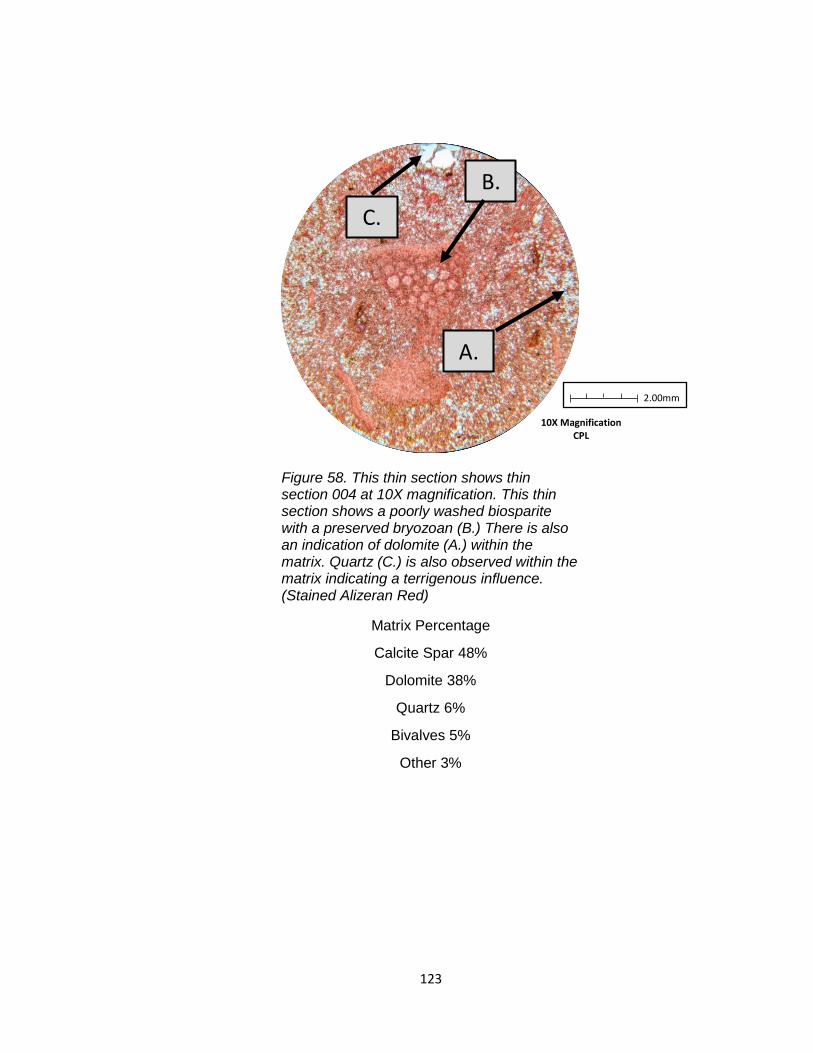
123
B.
C.
A.
Figure 58. This thin section shows thin section 004 at 10X magnification. This thin section shows a poorly washed biosparite with a preserved bryozoan (B.) There is also an indication of dolomite (A.) within the matrix. Quartz (C.) is also observed within the matrix indicating a terrigenous influence. (Stained Alizeran Red)
Matrix Percentage
Calcite Spar 48%
Dolomite 38%
Quartz 6%
Bivalves 5%
Other 3%
10X Magnification CPL
2.00mm
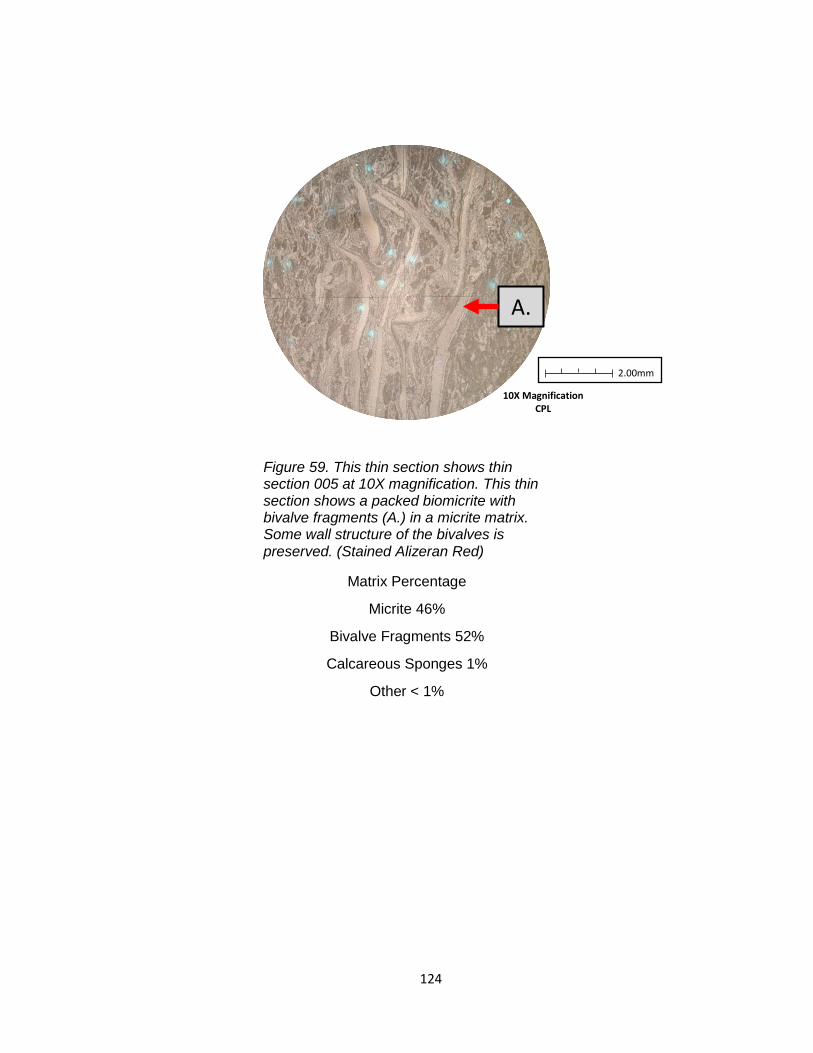
124
A.
Figure 59. This thin section shows thin section 005 at 10X magnification. This thin section shows a packed biomicrite with bivalve fragments (A.) in a micrite matrix. Some wall structure of the bivalves is preserved. (Stained Alizeran Red)
Matrix Percentage
Micrite 46%
Bivalve Fragments 52%
Calcareous Sponges 1%
Other < 1%
10X Magnification CPL
2.00mm
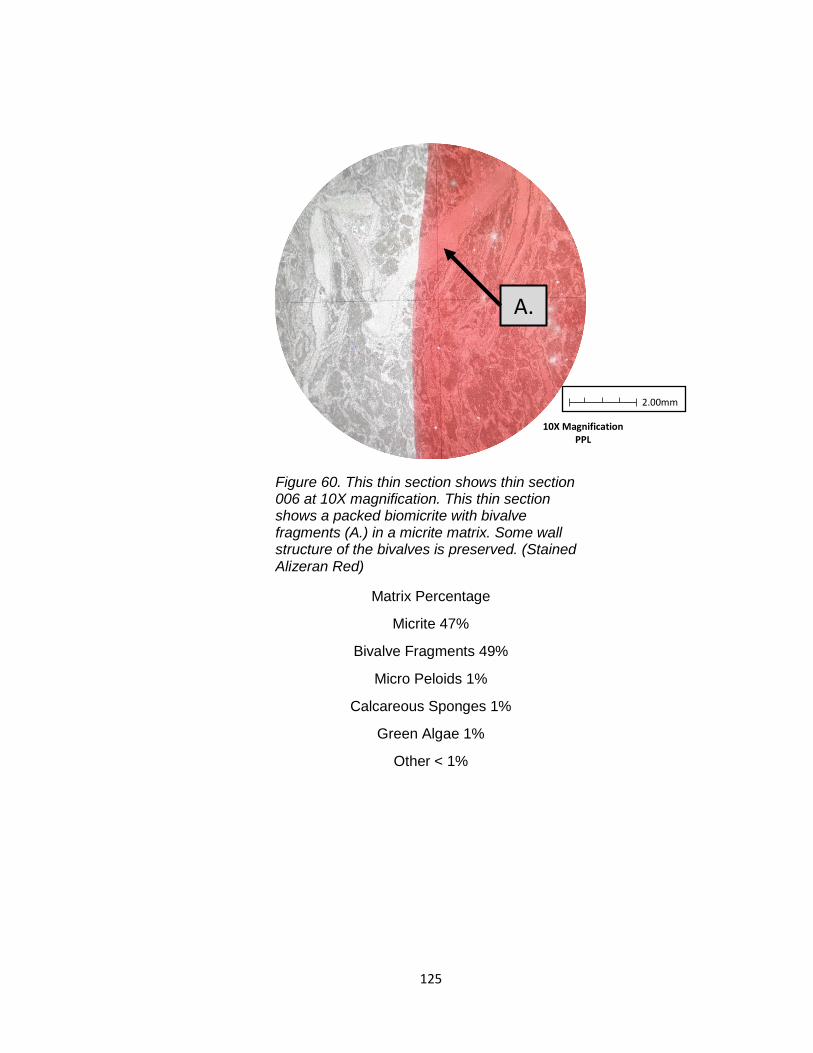
125
A.
Figure 60. This thin section shows thin section 006 at 10X magnification. This thin section shows a packed biomicrite with bivalve fragments (A.) in a micrite matrix. Some wall structure of the bivalves is preserved. (Stained Alizeran Red)
Matrix Percentage
Micrite 47%
Bivalve Fragments 49%
Micro Peloids 1%
Calcareous Sponges 1%
Green Algae 1%
Other < 1%
10X Magnification PPL
2.00mm
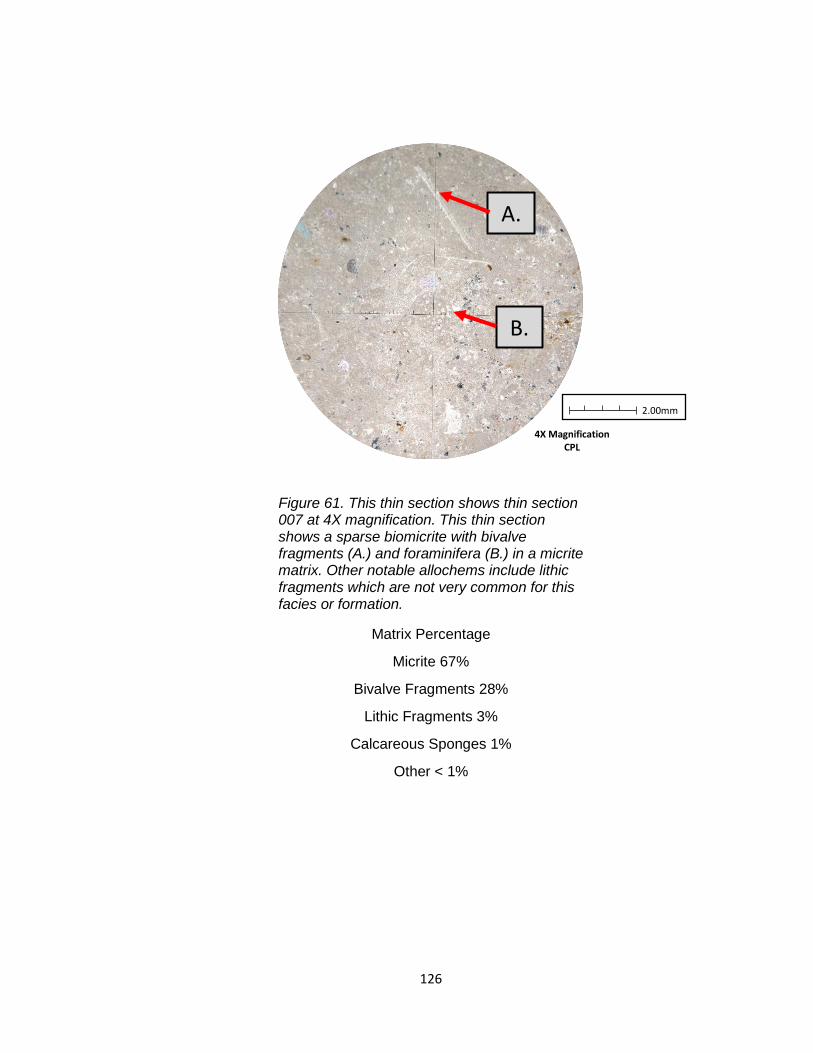
126
B.
A.
Figure 61. This thin section shows thin section 007 at 4X magnification. This thin section shows a sparse biomicrite with bivalve fragments (A.) and foraminifera (B.) in a micrite matrix. Other notable allochems include lithic fragments which are not very common for this facies or formation.
Matrix Percentage
Micrite 67%
Bivalve Fragments 28%
Lithic Fragments 3%
Calcareous Sponges 1%
Other < 1%
4X Magnification CPL
2.00mm
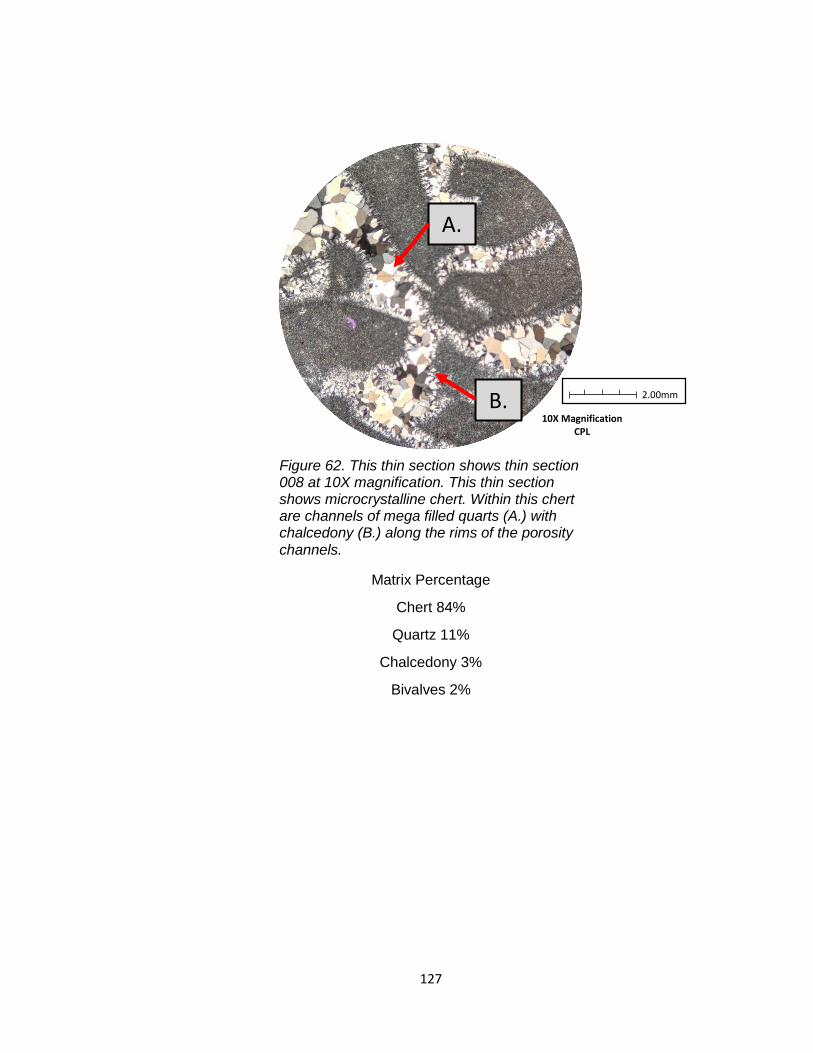
127
B.
A.
Figure 62. This thin section shows thin section 008 at 10X magnification. This thin section shows microcrystalline chert. Within this chert are channels of mega filled quarts (A.) with chalcedony (B.) along the rims of the porosity channels.
Matrix Percentage
Chert 84%
Quartz 11%
Chalcedony 3%
Bivalves 2%
10X Magnification CPL
2.00mm
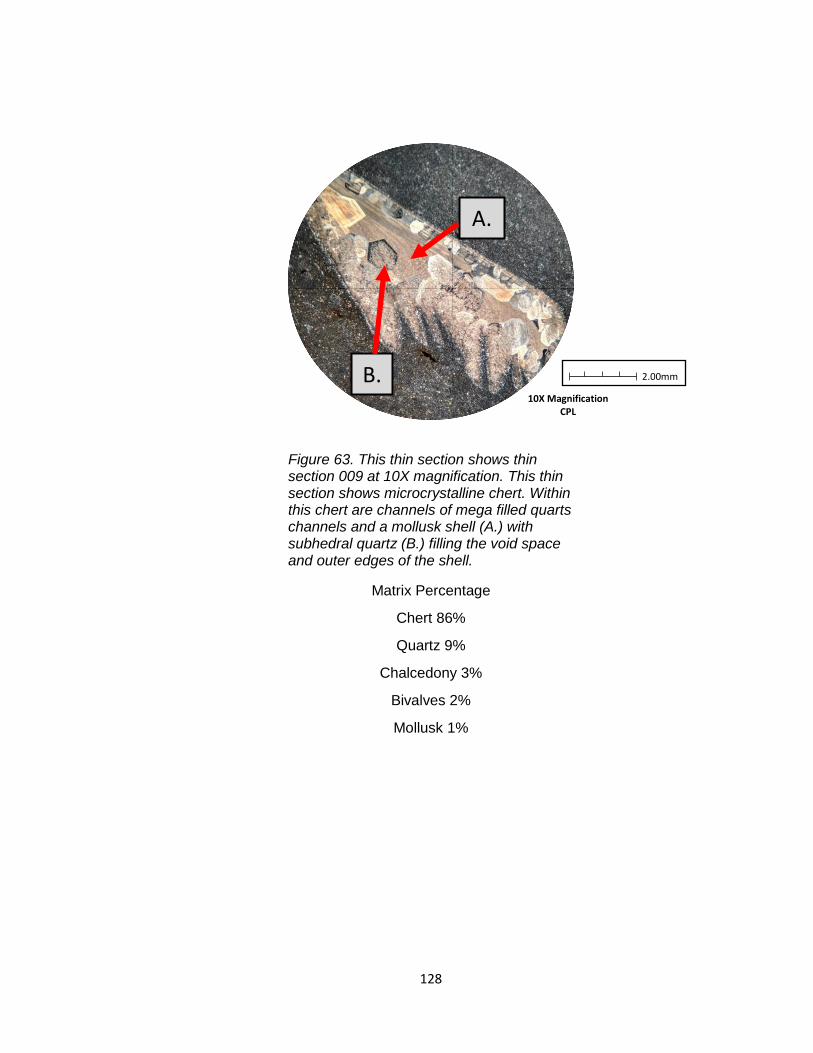
128
A.
B.
Figure 63. This thin section shows thin section 009 at 10X magnification. This thin section shows microcrystalline chert. Within this chert are channels of mega filled quarts channels and a mollusk shell (A.) with subhedral quartz (B.) filling the void space and outer edges of the shell.
Matrix Percentage
Chert 86%
Quartz 9%
Chalcedony 3%
Bivalves 2%
Mollusk 1%
10X Magnification CPL
2.00mm
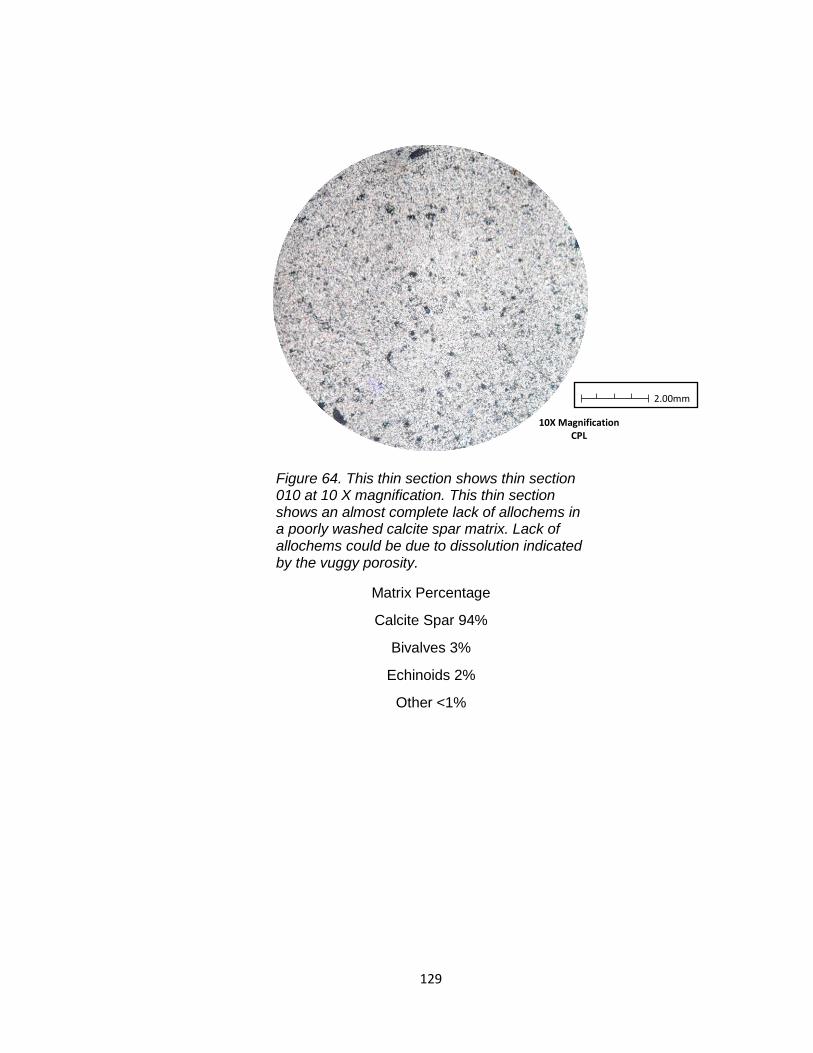
129
Figure 64. This thin section shows thin section 010 at 10 X magnification. This thin section shows an almost complete lack of allochems in a poorly washed calcite spar matrix. Lack of allochems could be due to dissolution indicated by the vuggy porosity.
Matrix Percentage
Calcite Spar 94%
Bivalves 3%
Echinoids 2%
Other <1%
10X Magnification CPL
2.00mm
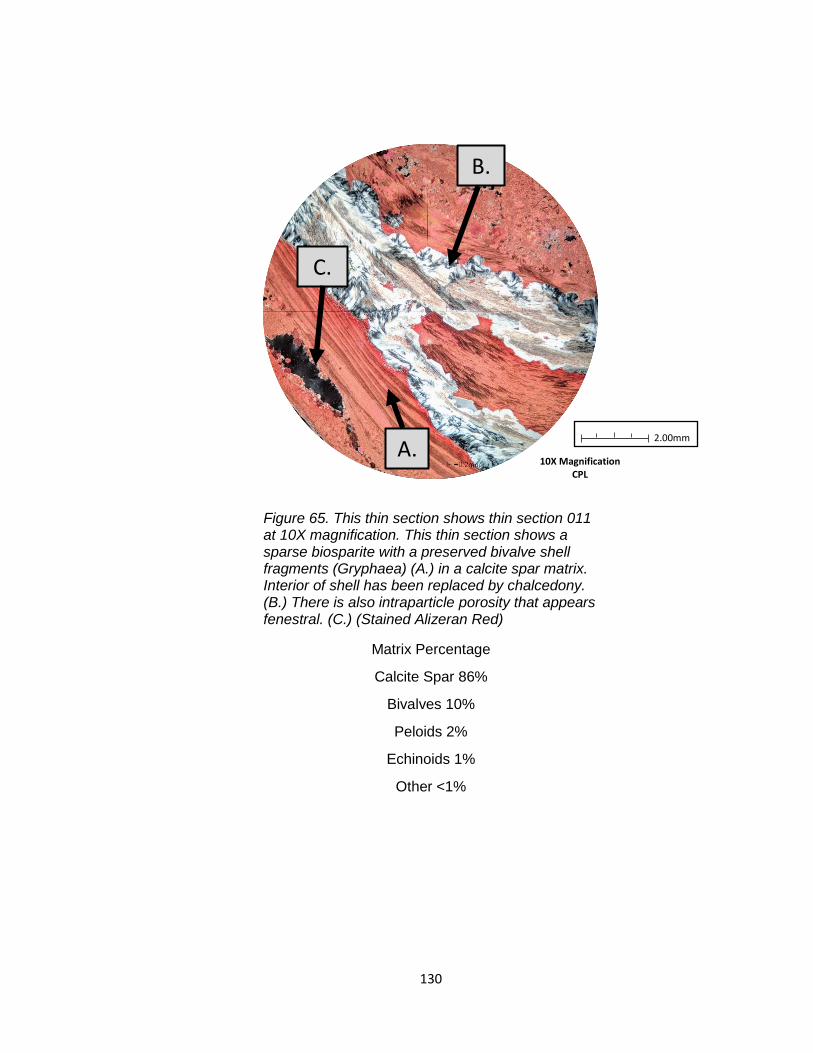
130
A.
B.
C.
Figure 65. This thin section shows thin section 011 at 10X magnification. This thin section shows a sparse biosparite with a preserved bivalve shell fragments (Gryphaea) (A.) in a calcite spar matrix. Interior of shell has been replaced by chalcedony. (B.) There is also intraparticle porosity that appears fenestral. (C.) (Stained Alizeran Red)
Matrix Percentage
Calcite Spar 86%
Bivalves 10%
Peloids 2%
Echinoids 1%
Other <1%
10X Magnification CPL
2.00mm
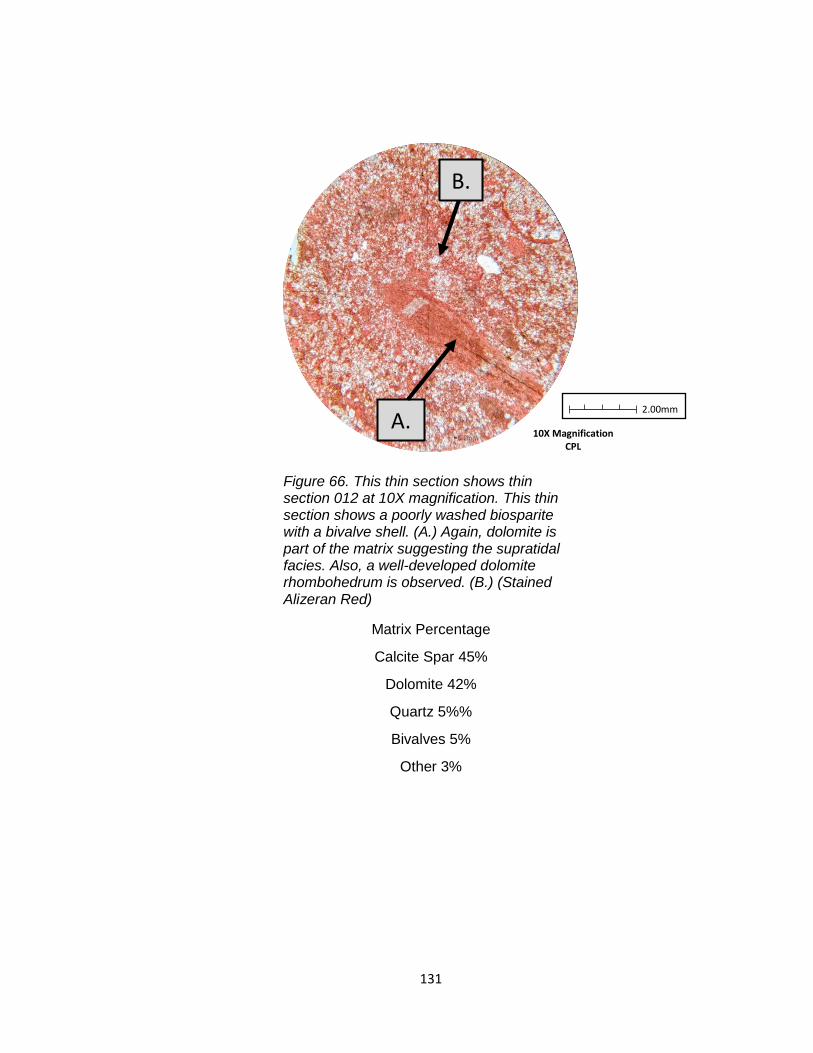
131
A.
B.
Figure 66. This thin section shows thin section 012 at 10X magnification. This thin section shows a poorly washed biosparite with a bivalve shell. (A.) Again, dolomite is part of the matrix suggesting the supratidal facies. Also, a well-developed dolomite rhombohedrum is observed. (B.) (Stained Alizeran Red)
Matrix Percentage
Calcite Spar 45%
Dolomite 42%
Quartz 5%%
Bivalves 5%
Other 3%
10X Magnification CPL
2.00mm
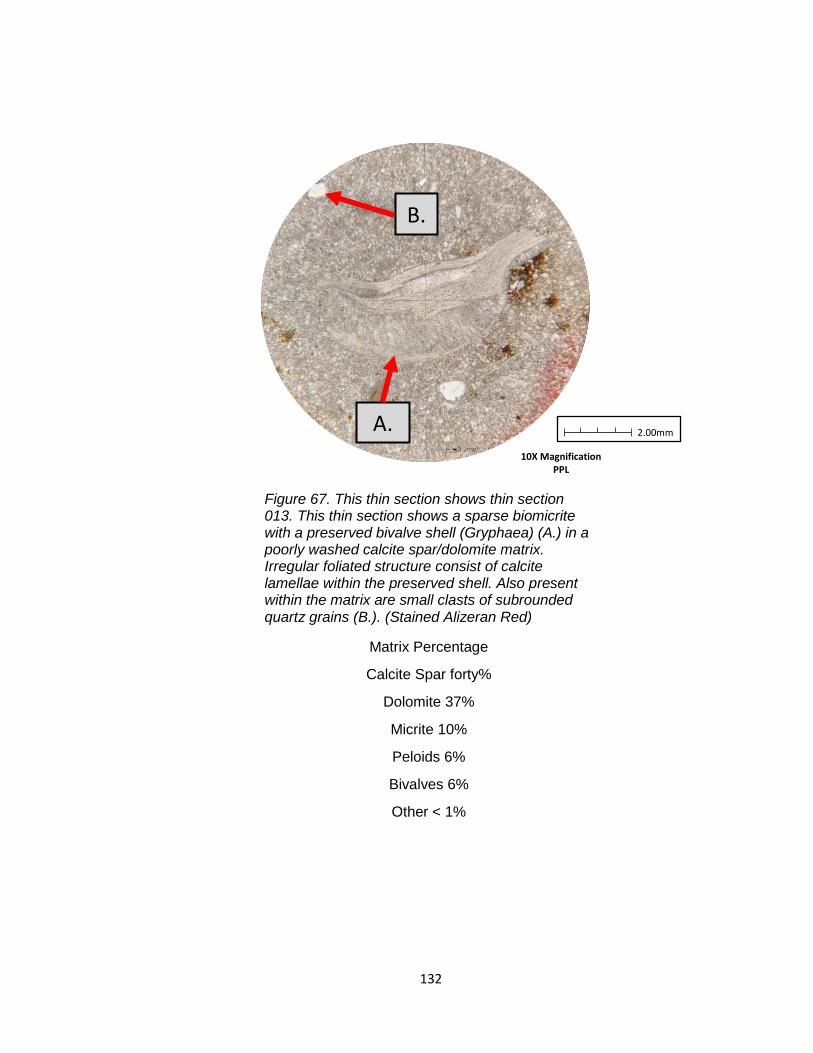
132
B.
A.
Figure 67. This thin section shows thin section 013. This thin section shows a sparse biomicrite with a preserved bivalve shell (Gryphaea) (A.) in a poorly washed calcite spar/dolomite matrix. Irregular foliated structure consist of calcite lamellae within the preserved shell. Also present within the matrix are small clasts of subrounded quartz grains (B.). (Stained Alizeran Red)
Matrix Percentage
Calcite Spar forty%
Dolomite 37%
Micrite 10%
Peloids 6%
Bivalves 6%
Other < 1%
10X Magnification PPL
2.00mm
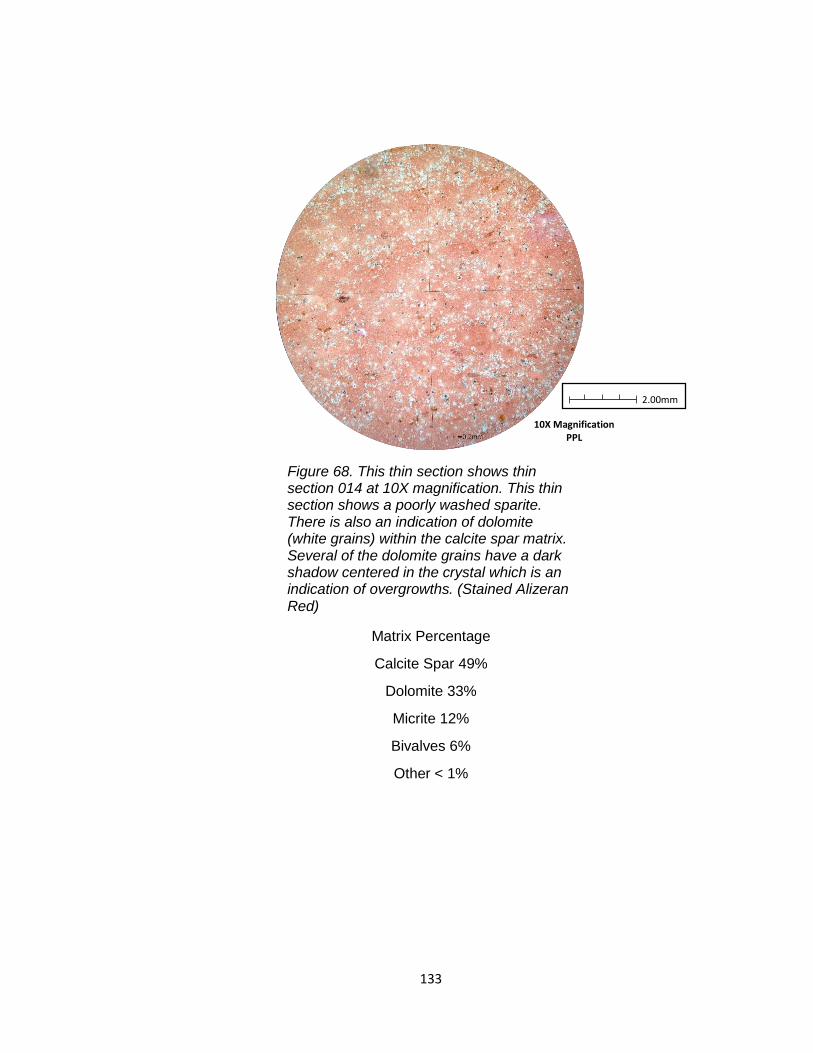
133
Figure 68. This thin section shows thin section 014 at 10X magnification. This thin section shows a poorly washed sparite. There is also an indication of dolomite (white grains) within the calcite spar matrix. Several of the dolomite grains have a dark shadow centered in the crystal which is an indication of overgrowths. (Stained Alizeran Red)
Matrix Percentage
Calcite Spar 49%
Dolomite 33%
Micrite 12%
Bivalves 6%
Other < 1%
10X Magnification PPL
2.00mm

134
A.
Figure 69. This thin section shows thin section 015 at 10X magnification. This thin section shows a poorly washed sparite. There is also an indication of dolomite (white grains) within the calcite spar matrix. Several of the dolomite grains have a dark shadow centered in the crystal which is an indication of overgrowths. Brownish iron oxide is also observed within the rims of the miliod (A.) centered in the thin section.
Matrix Percentage
Calcite Spar 51%
Dolomite 31%
Micrite 9%
Bivalves 5%
Other 4%
10X Magnification PPL
2.00mm
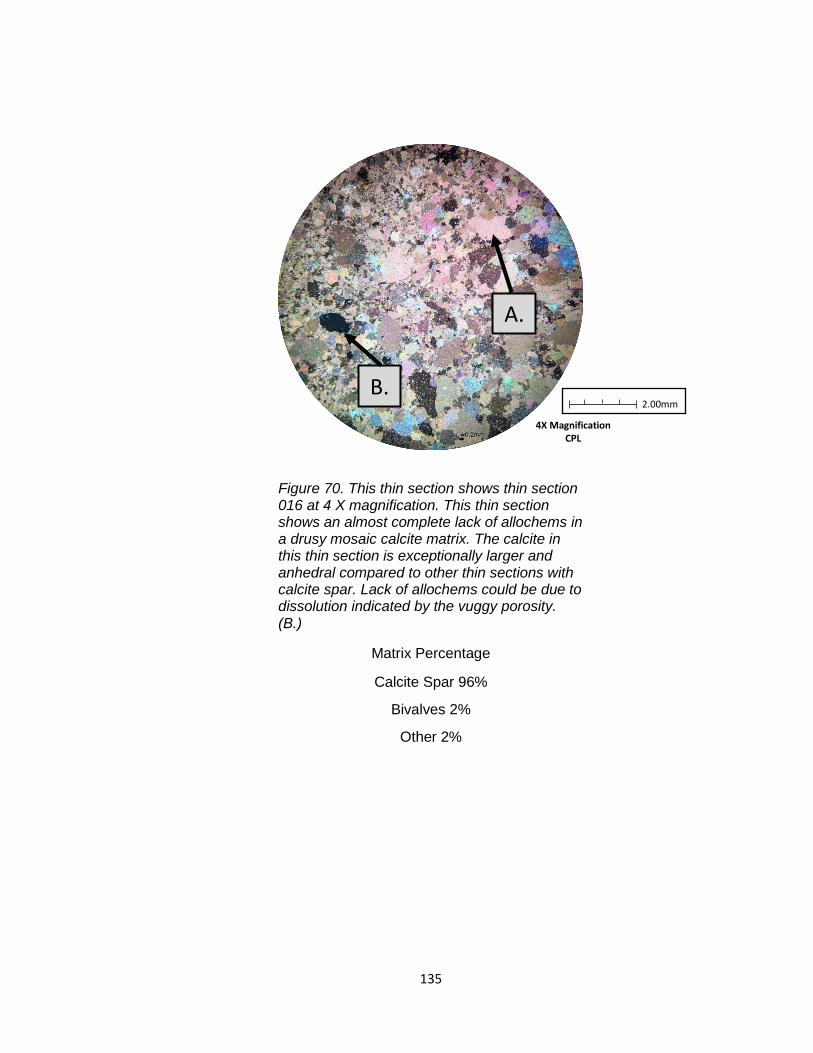
135
B.
A.
Figure 70. This thin section shows thin section 016 at 4 X magnification. This thin section shows an almost complete lack of allochems in a drusy mosaic calcite matrix. The calcite in this thin section is exceptionally larger and anhedral compared to other thin sections with calcite spar. Lack of allochems could be due to dissolution indicated by the vuggy porosity. (B.)
Matrix Percentage
Calcite Spar 96%
Bivalves 2%
Other 2%
4X Magnification CPL
2.00mm
136
APPENDIX B. MEASURED SECTIONS
Appendix B will contain measured section descriptions as well as correlation
charts for the study are. These were used to generate a facies model for the
study area as well as correlate lithological changes. The map below shows the
locations of the measured sections as well as transects for both correlations. The
red line is for (A-A’) and the blue line is for (B-B’). Figures in this section are not
listed in the LIST OF FIGURES.
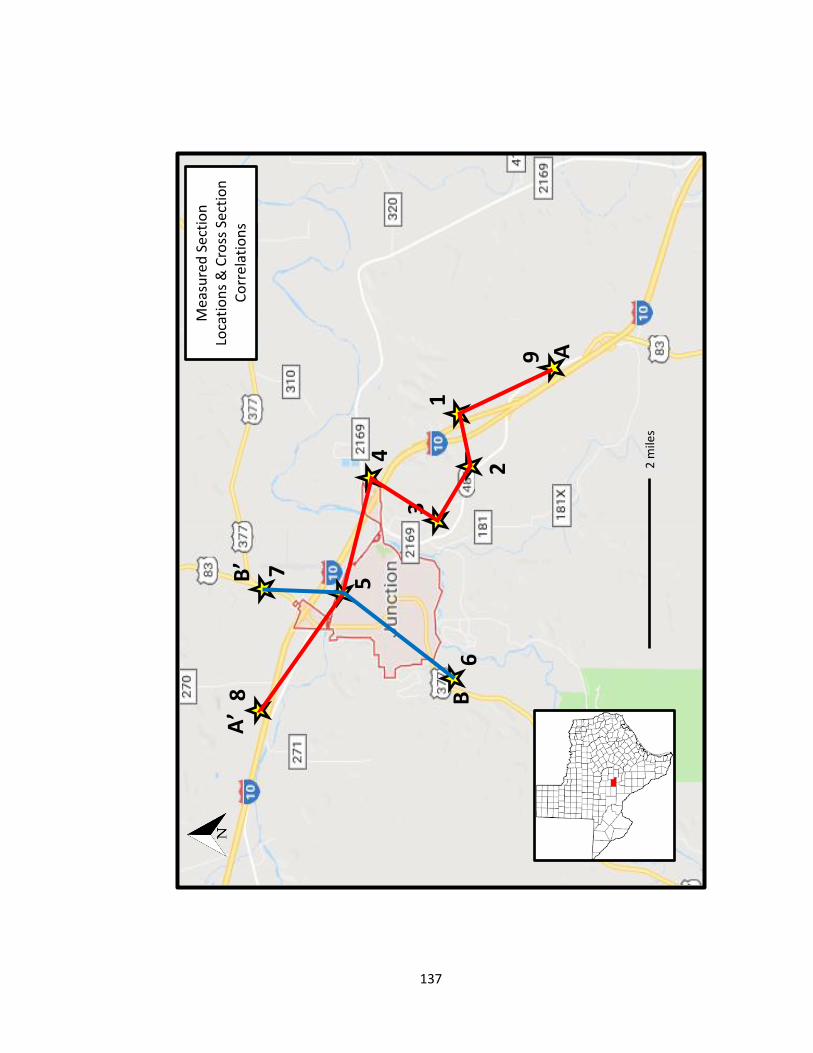
137
2 m
iles
1
2 4
3
5
9
8
7
6
A
A’
B’
B
Mea
sure
d S
ecti
on
Lo
cati
on
s &
Cro
ss S
ecti
on
C
orr
elat
ion
s
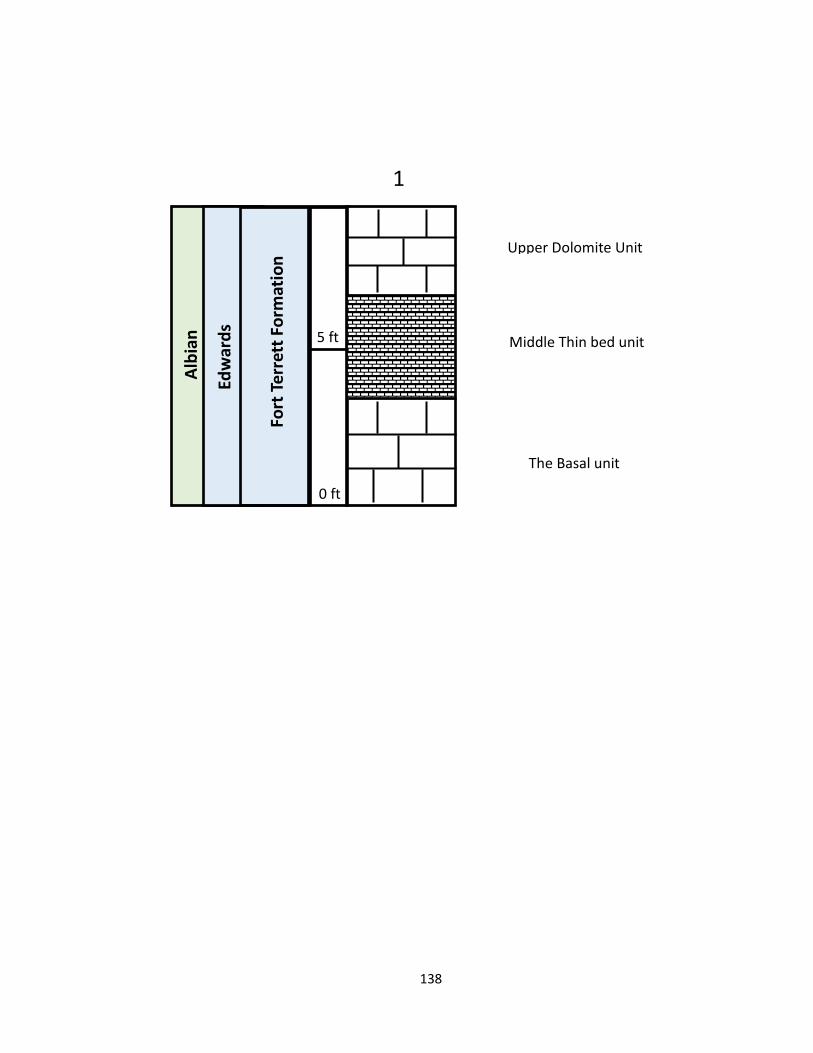
138
5 ft
0 ft
1
Fort
Ter
rett
Fo
rmat
ion
Edw
ard
s
Alb
ian
The Basal unit
Middle Thin bed unit
Upper Dolomite Unit
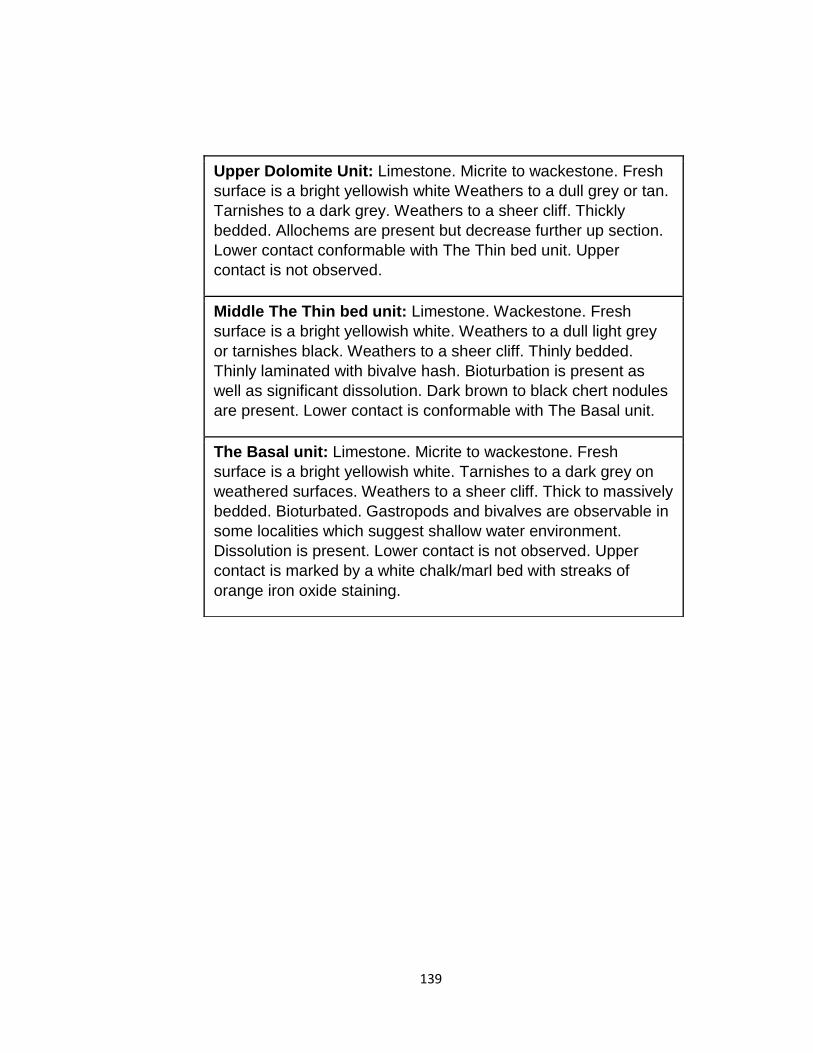
139
Upper Dolomite Unit: Limestone. Micrite to wackestone. Fresh
surface is a bright yellowish white Weathers to a dull grey or tan.
Tarnishes to a dark grey. Weathers to a sheer cliff. Thickly
bedded. Allochems are present but decrease further up section.
Lower contact conformable with The Thin bed unit. Upper
contact is not observed.
Middle The Thin bed unit: Limestone. Wackestone. Fresh
surface is a bright yellowish white. Weathers to a dull light grey
or tarnishes black. Weathers to a sheer cliff. Thinly bedded.
Thinly laminated with bivalve hash. Bioturbation is present as
well as significant dissolution. Dark brown to black chert nodules
are present. Lower contact is conformable with The Basal unit.
The Basal unit: Limestone. Micrite to wackestone. Fresh
surface is a bright yellowish white. Tarnishes to a dark grey on
weathered surfaces. Weathers to a sheer cliff. Thick to massively
bedded. Bioturbated. Gastropods and bivalves are observable in
some localities which suggest shallow water environment.
Dissolution is present. Lower contact is not observed. Upper
contact is marked by a white chalk/marl bed with streaks of
orange iron oxide staining.
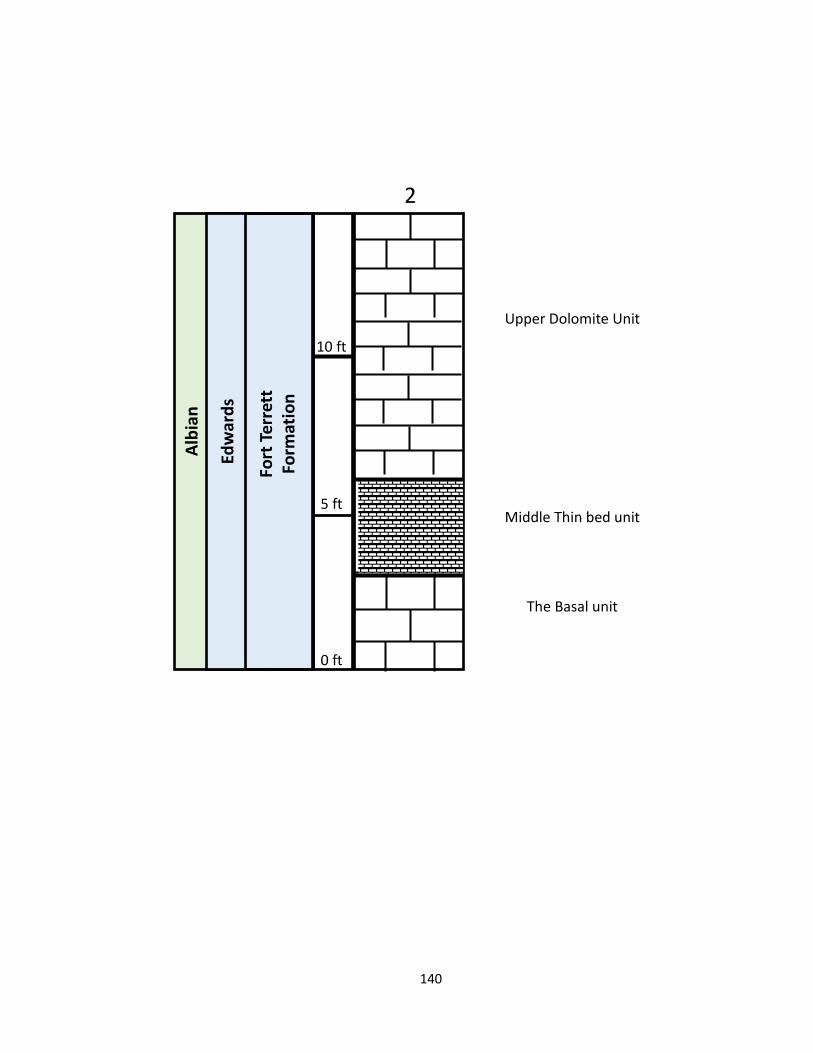
140
The Basal unit
Middle Thin bed unit
Upper Dolomite Unit
2
10 ft
5 ft
0 ft
Fort
Ter
rett
Fo
rmat
ion
Edw
ard
s
Alb
ian
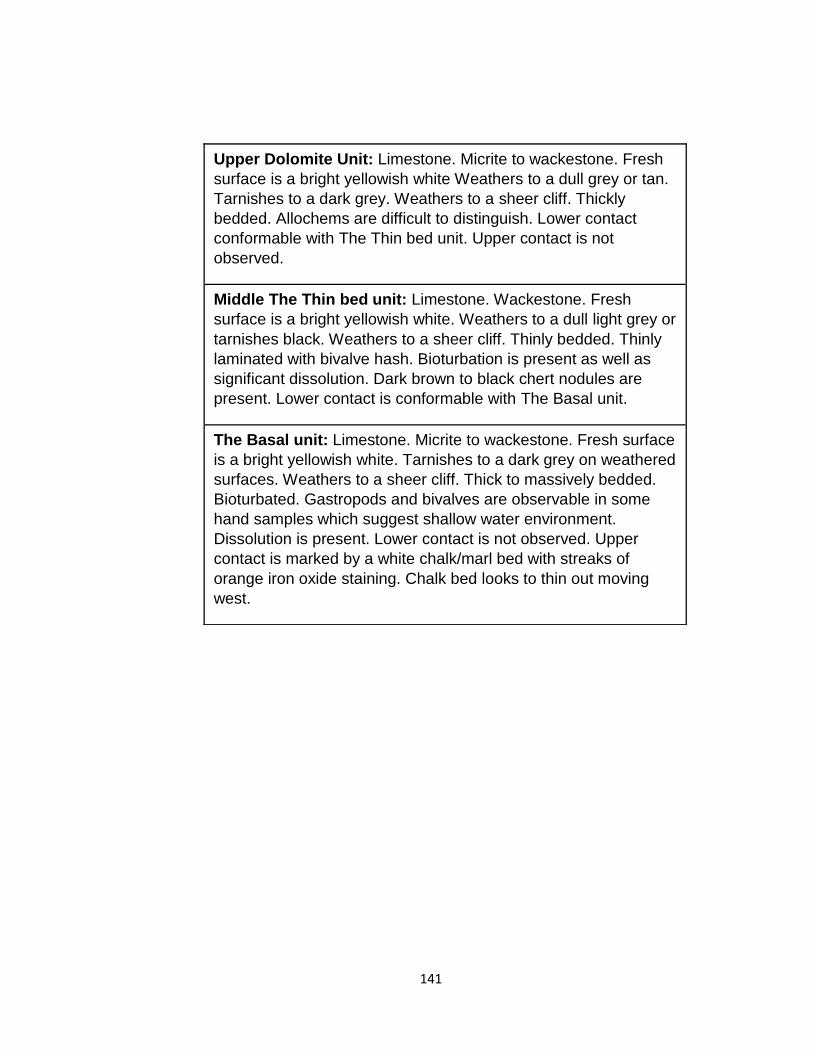
141
Upper Dolomite Unit: Limestone. Micrite to wackestone. Fresh
surface is a bright yellowish white Weathers to a dull grey or tan.
Tarnishes to a dark grey. Weathers to a sheer cliff. Thickly
bedded. Allochems are difficult to distinguish. Lower contact
conformable with The Thin bed unit. Upper contact is not
observed.
Middle The Thin bed unit: Limestone. Wackestone. Fresh
surface is a bright yellowish white. Weathers to a dull light grey or
tarnishes black. Weathers to a sheer cliff. Thinly bedded. Thinly
laminated with bivalve hash. Bioturbation is present as well as
significant dissolution. Dark brown to black chert nodules are
present. Lower contact is conformable with The Basal unit.
The Basal unit: Limestone. Micrite to wackestone. Fresh surface
is a bright yellowish white. Tarnishes to a dark grey on weathered
surfaces. Weathers to a sheer cliff. Thick to massively bedded.
Bioturbated. Gastropods and bivalves are observable in some
hand samples which suggest shallow water environment.
Dissolution is present. Lower contact is not observed. Upper
contact is marked by a white chalk/marl bed with streaks of
orange iron oxide staining. Chalk bed looks to thin out moving
west.
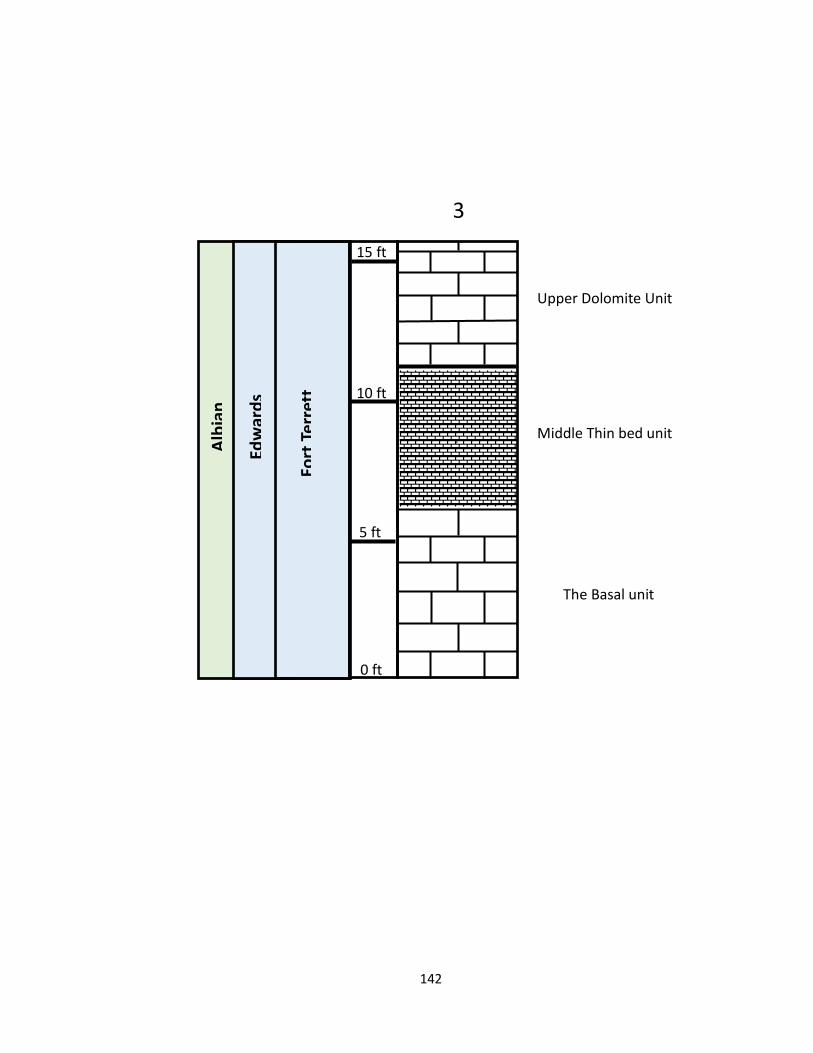
142
The Basal unit
Middle Thin bed unit
Upper Dolomite Unit
10 ft
5 ft
0 ft
Fort
Ter
rett
Edw
ard
s
Alb
ian
15 ft
3
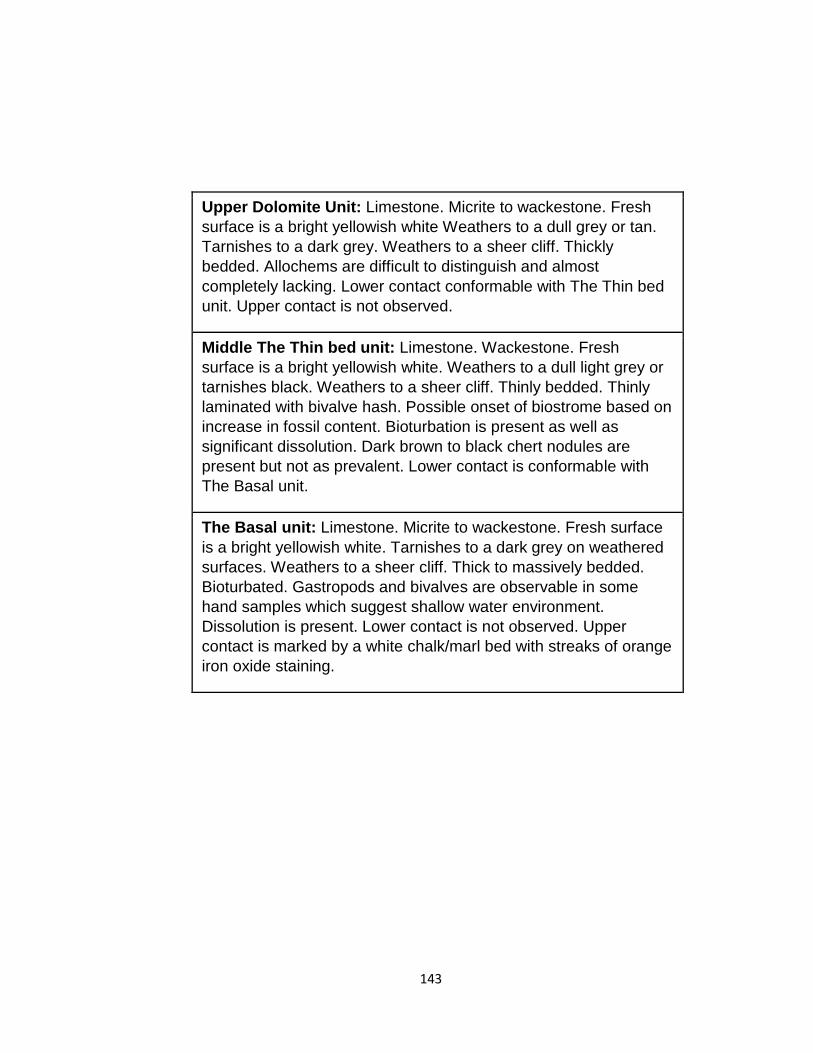
143
Upper Dolomite Unit: Limestone. Micrite to wackestone. Fresh
surface is a bright yellowish white Weathers to a dull grey or tan.
Tarnishes to a dark grey. Weathers to a sheer cliff. Thickly
bedded. Allochems are difficult to distinguish and almost
completely lacking. Lower contact conformable with The Thin bed
unit. Upper contact is not observed.
Middle The Thin bed unit: Limestone. Wackestone. Fresh
surface is a bright yellowish white. Weathers to a dull light grey or
tarnishes black. Weathers to a sheer cliff. Thinly bedded. Thinly
laminated with bivalve hash. Possible onset of biostrome based on
increase in fossil content. Bioturbation is present as well as
significant dissolution. Dark brown to black chert nodules are
present but not as prevalent. Lower contact is conformable with
The Basal unit.
The Basal unit: Limestone. Micrite to wackestone. Fresh surface
is a bright yellowish white. Tarnishes to a dark grey on weathered
surfaces. Weathers to a sheer cliff. Thick to massively bedded.
Bioturbated. Gastropods and bivalves are observable in some
hand samples which suggest shallow water environment.
Dissolution is present. Lower contact is not observed. Upper
contact is marked by a white chalk/marl bed with streaks of orange
iron oxide staining.
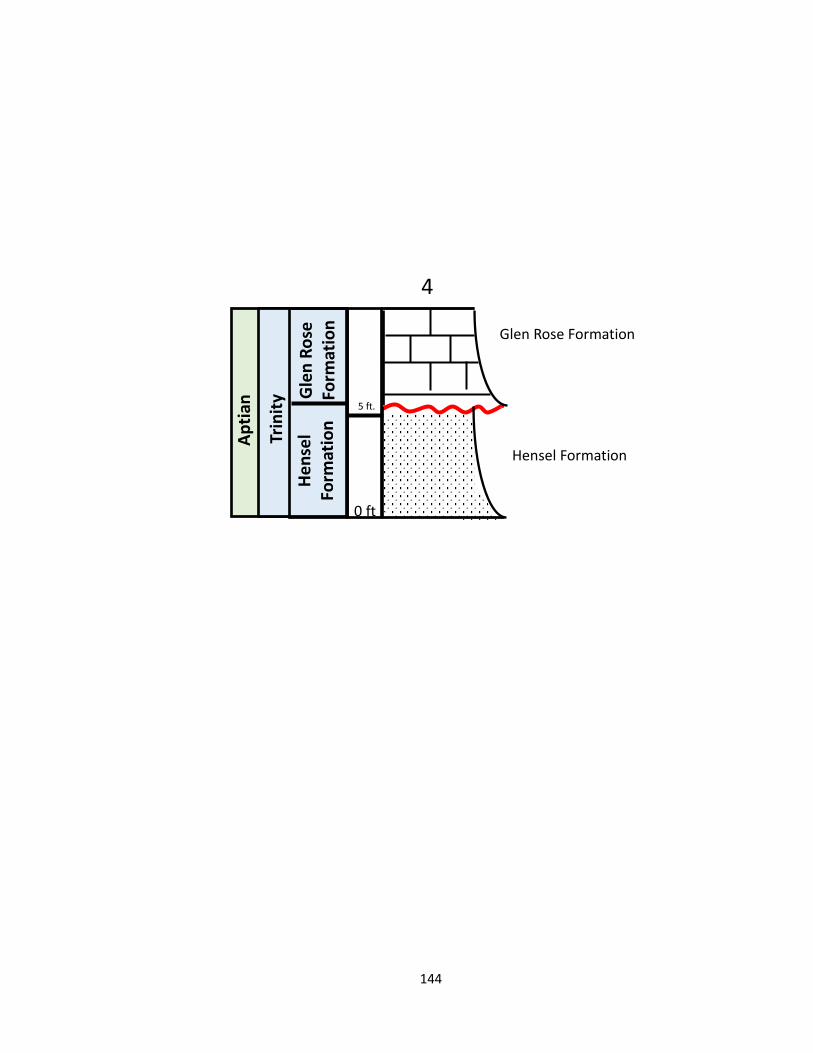
144
5 ft.
0 ft
He
nse
l Fo
rmat
ion
Trin
ity
Ap
tian
Hensel Formation
Glen Rose Formation
4 G
len
Ro
se
Form
atio
n

145
Glen Rose Formation: Marl to Limestone. Wackestone.
Fresh surface is a bright yellowish white. Weathers to a
dull tan. Weathers to a steep slope. Thinly bedded and
interbedded limestones. Bivalves are abundant near the
upper surface. Burrowed. Lower contact is disconformable
with the Hensel Formation.
Hensel Formation: Marl to siltstone. Interbedded red
paleosol beds are observed and are intermittent. Fresh
surface that isn’t a red bed is yellowish white. Weathers to
a slight grey or light tan. Upward fining is observed moving
from a claystone to a siltstone. Exogyra fossils were
observed and collected. Lower contact not observed
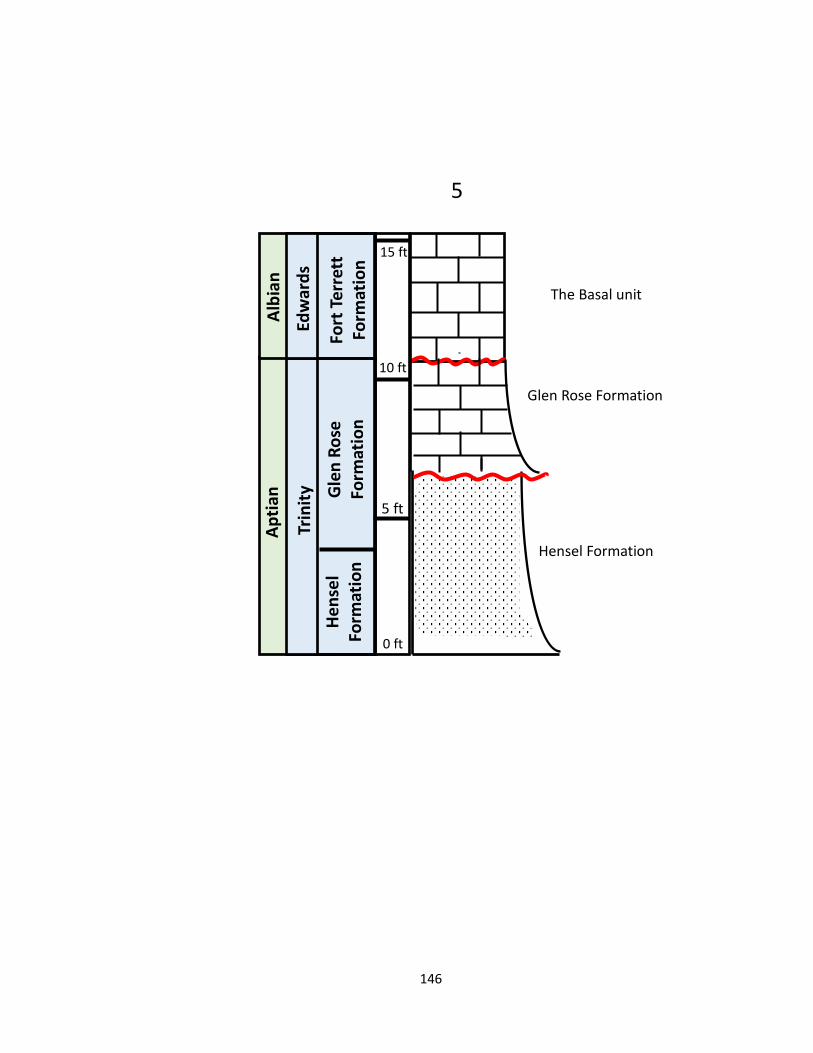
146
He
nse
l Fo
rmat
ion
Trin
ity
Ap
tian
Hensel Formation
Glen Rose Formation
5
10 ft
5 ft
0 ft
15 ft
Gle
n R
ose
Fo
rmat
ion
Fo
rt T
erre
tt
Form
atio
n
Edw
ard
s
Alb
ian
The Basal unit
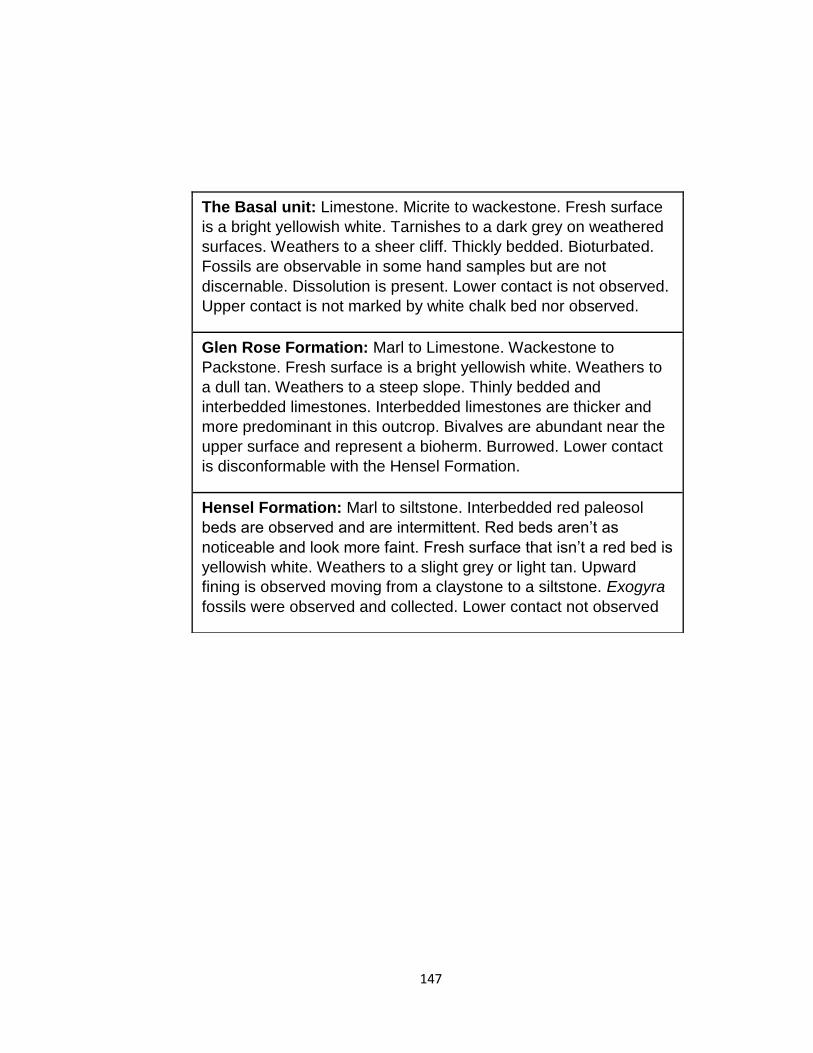
147
The Basal unit: Limestone. Micrite to wackestone. Fresh surface
is a bright yellowish white. Tarnishes to a dark grey on weathered
surfaces. Weathers to a sheer cliff. Thickly bedded. Bioturbated.
Fossils are observable in some hand samples but are not
discernable. Dissolution is present. Lower contact is not observed.
Upper contact is not marked by white chalk bed nor observed.
Glen Rose Formation: Marl to Limestone. Wackestone to
Packstone. Fresh surface is a bright yellowish white. Weathers to
a dull tan. Weathers to a steep slope. Thinly bedded and
interbedded limestones. Interbedded limestones are thicker and
more predominant in this outcrop. Bivalves are abundant near the
upper surface and represent a bioherm. Burrowed. Lower contact
is disconformable with the Hensel Formation.
Hensel Formation: Marl to siltstone. Interbedded red paleosol
beds are observed and are intermittent. Red beds aren’t as
noticeable and look more faint. Fresh surface that isn’t a red bed is
yellowish white. Weathers to a slight grey or light tan. Upward
fining is observed moving from a claystone to a siltstone. Exogyra
fossils were observed and collected. Lower contact not observed
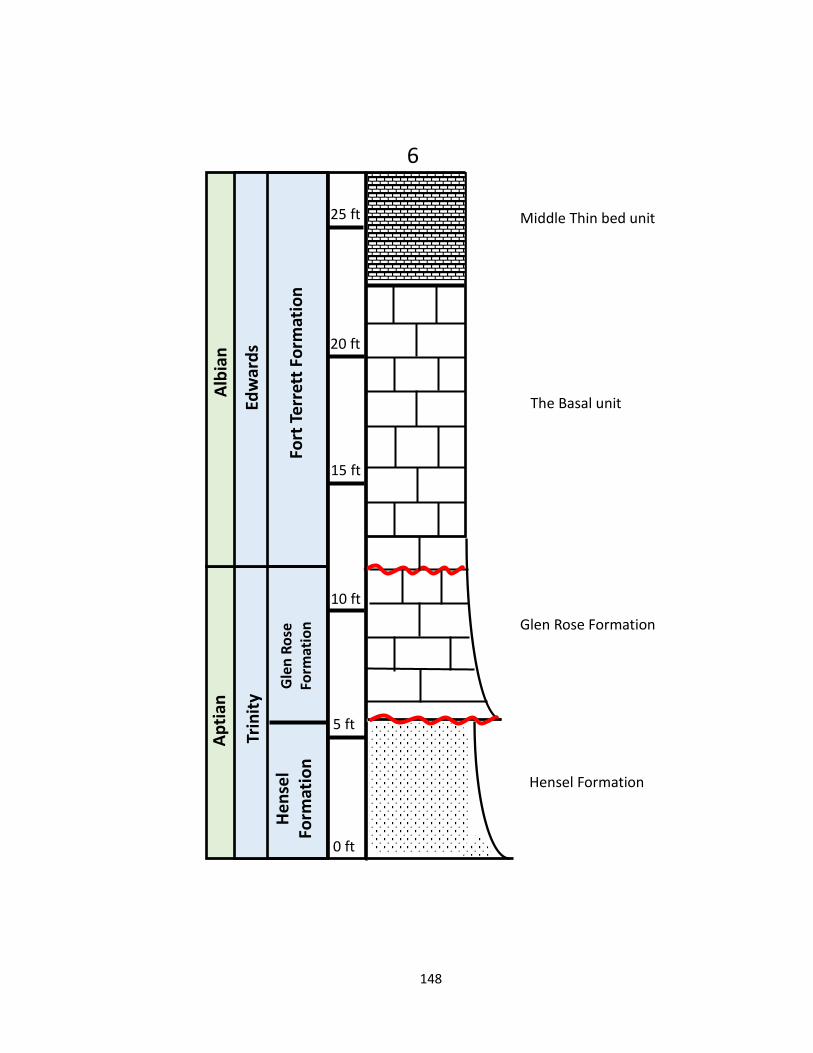
148
6
He
nse
l Fo
rmat
ion
Trin
ity
Ap
tian
Hensel Formation
Glen Rose Formation
10 ft
5 ft
0 ft
15 ft
20 ft
Gle
n R
ose
Fo
rmat
ion
Fo
rt T
erre
tt F
orm
atio
n
Edw
ard
s
Alb
ian
The Basal unit
25 ft Middle Thin bed unit
149
Middle The Thin bed unit: Limestone. Wackestone. Fresh surface
is a bright yellowish white. Weathers to a dull light grey or tarnishes
black. Weathers to a sheer cliff. Thinly bedded. Thinly laminated
with bivalve hash. Bioturbation is present as well as significant
dissolution. Dark brown to black chert nodules are present. Lower
contact is conformable with The Basal unit
The Basal unit: Limestone. Micrite to wackestone. Fresh surface is
a bright yellowish white. Tarnishes to a dark grey on weathered
surfaces. Weathers to a sheer cliff. Thick to massively bedded.
Bioturbated. Gastropods and bivalves are observable in some
localities which suggest shallow water environment. Dissolution is
present. Lower contact is disconformable with the Glen Rose
Formation. Upper contact is marked by a white chalk/marl bed with
streaks of orange iron oxide staining.
Glen Rose Formation: Marl to Limestone. Wackestone to
Packstone. Fresh surface is a bright yellowish white. Weathers to a
dull tan. Weathers to a steep slope. Thinly bedded and interbedded
limestones. Interbedded limestones are thicker and more
predominant in this outcrop. Marl/Claystone beds are also much
thick to massively bedded. Bivalves are abundant near the upper
surface. Burrowed. Lower contact is disconformable with the Hensel
Formation.
Hensel Formation: Marl to siltstone. Interbedded red paleosol beds
are not observed here. Fresh surface that isn’t a red bed is
yellowish white. Weathers to a slight grey or light tan. Upward fining
is observed moving from a silty sandstone to a silty claystone.
Exogyra fossils were observed and collected. Lower contact not
observed
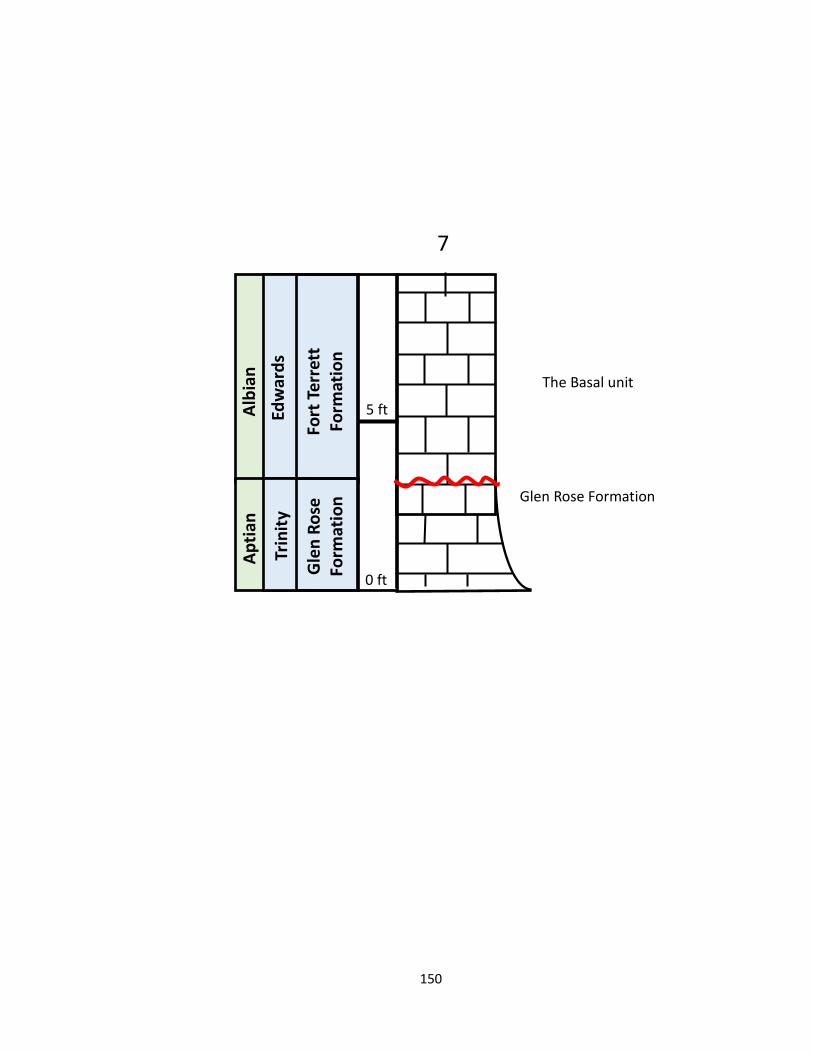
150
5 ft
0 ft
Fort
Ter
rett
Fo
rmat
ion
Edw
ard
s
Alb
ian
The Basal unit
Glen Rose Formation
7
Gle
n R
ose
Fo
rmat
ion
Trin
ity
Ap
tian
151
Glen Rose Formation: Marl to Limestone. Wackestone.
Fresh surface is a bright yellowish white. Weathers to a
dull tan. Weathers to a steep slope. Thinly bedded and
interbedded limestones. Bivalves are abundant near the
upper surface. Burrowed. Lower contact is disconformable
with the Hensel Formation.
Hensel Formation: Marl to siltstone. Interbedded red
paleosol beds are observed and are intermittent. Fresh
surface that isn’t a red bed is yellowish white. Weathers to
a slight grey or light tan. Upward fining is observed moving
from a claystone to a siltstone. Exogyra fossils were
observed and collected. Lower contact not observed
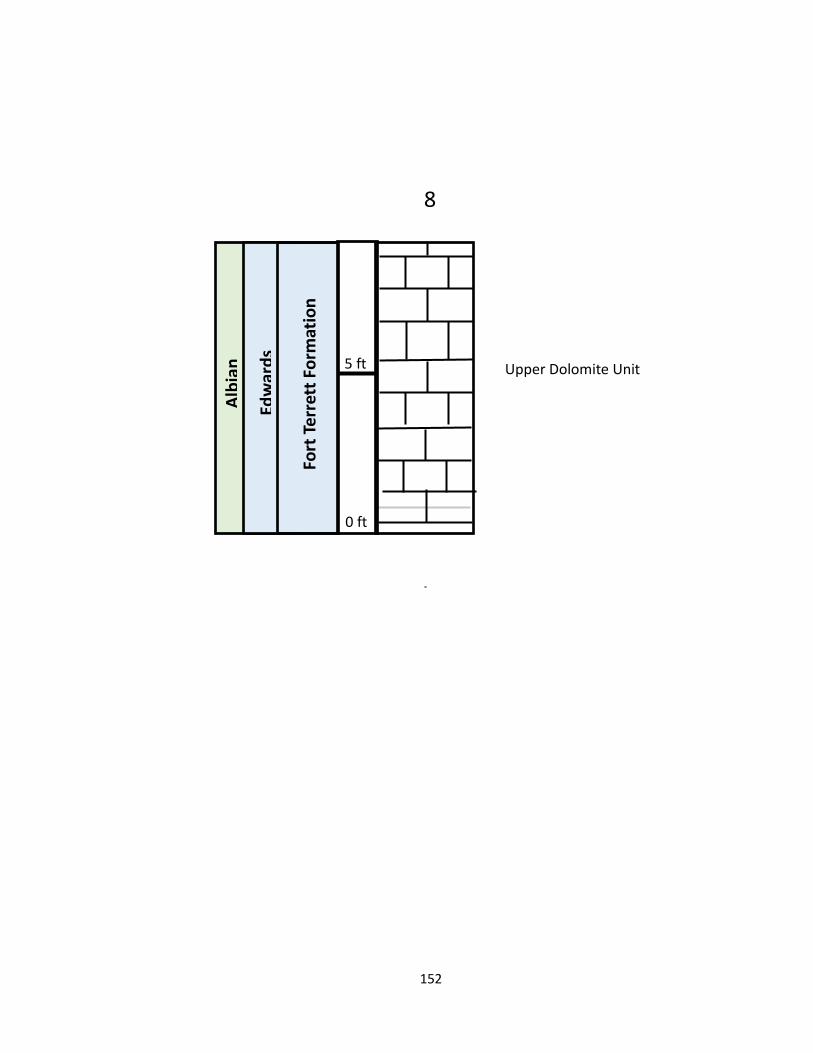
152
8
5 ft
0 ft
Fort
Ter
rett
Fo
rmat
ion
Edw
ard
s
Alb
ian
Upper Dolomite Unit
153
Upper Dolomite Unit: Limestone. Micrite to
wackestone. Fresh surface is a bright yellowish white
Weathers to a dull grey or tan. Tarnishes to a dark
grey. Weathers to a sheer cliff. Thickly bedded. Thick
laminations or bedding in between massive beds.
Dissolution may have enhanced bedding plane
appearance in this outcrop. Dissolution is heavily
present. Allochems are not observed. Lower contact
not observed. Upper contact is not observed.
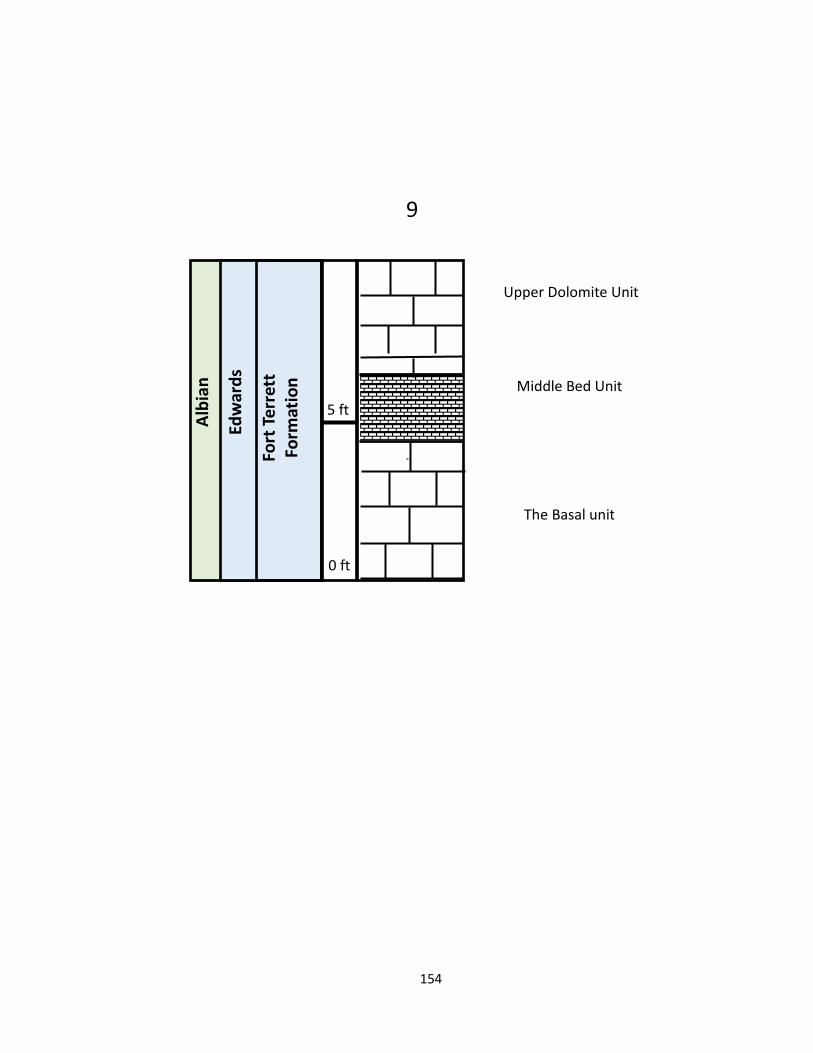
154
9
5 ft
0 ft
Fort
Ter
rett
Fo
rmat
ion
Edw
ard
s
Alb
ian
The Basal unit
Middle Bed Unit
Upper Dolomite Unit
155
Upper Dolomite Unit: Limestone. Micrite to wackestone.
Fresh surface is a bright yellowish white Weathers to a dull
grey or tan. Tarnishes to a dark grey. Weathers to a sheer
cliff. Thickly bedded. Allochems are difficult to distinguish
and almost completely lacking. Lower contact conformable
with middle the Thin bed unit. Upper contact is not
observed but shows some brecciation.
Middle The Thin bed unit: Limestone. Wackestone. Fresh
surface is a bright yellowish white. Weathers to a dull light
grey or tarnishes black. Weathers to a sheer cliff. Thinly
bedded. Thinly laminated with bivalve hash. Possible onset
of biostrome based on increase in fossil content.
Bioturbation is present as well as significant dissolution.
Dark brown to black chert nodules are present but not as
prevalent. Lower contact is conformable with the the Basal
unit
The Basal unit: Limestone. Micrite to wackestone. Fresh
surface is a bright yellowish white. Tarnishes to a dark grey
on weathered surfaces. Weathers to a sheer cliff. Thick to
massively bedded. Bioturbated. Gastropods and bivalves
are observable in some hand samples which suggest
shallow water environment. Dissolution is present. Lower
contact is not observed. Upper contact is marked by a
white chalk/marl bed with streaks of orange iron oxide
staining.
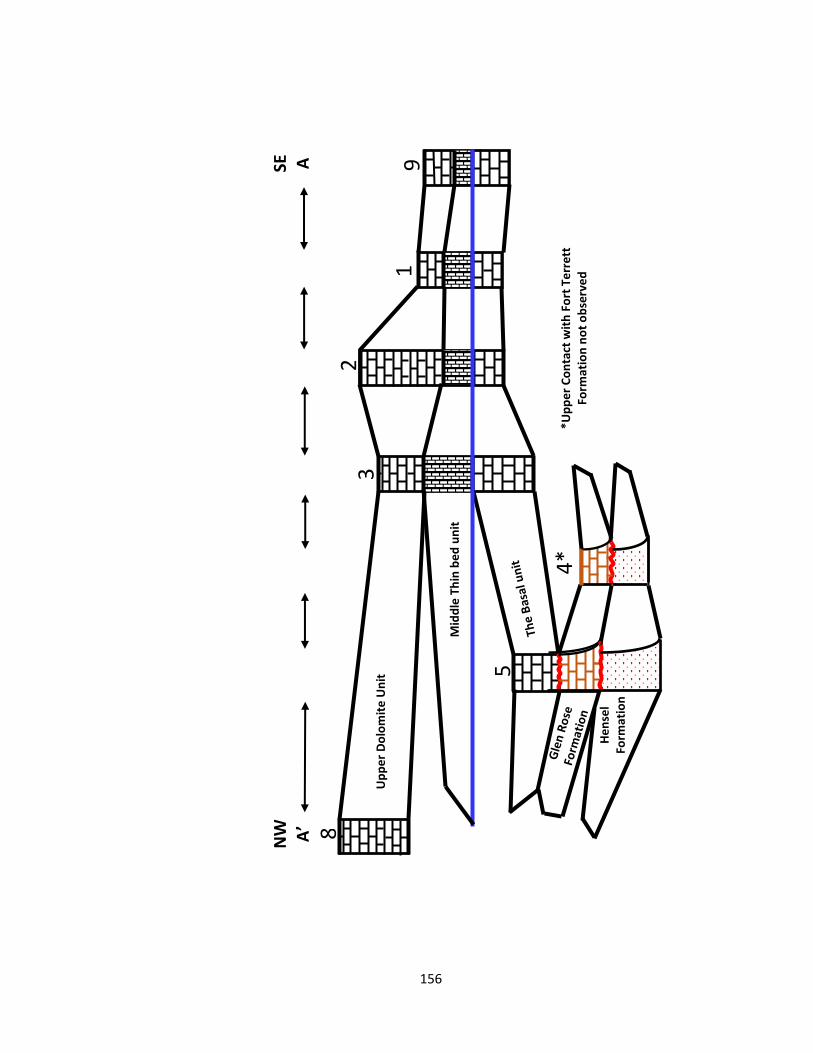
156
3
1
9
2
8
4*
5
NW
A’
SE
A
Mid
dle
Th
in b
ed
un
it
Up
pe
r D
olo
mit
e U
nit
He
nse
l Fo
rmat
ion
*Up
pe
r C
on
tact
wit
h F
ort
Te
rre
tt
Form
atio
n n
ot
ob
serv
ed
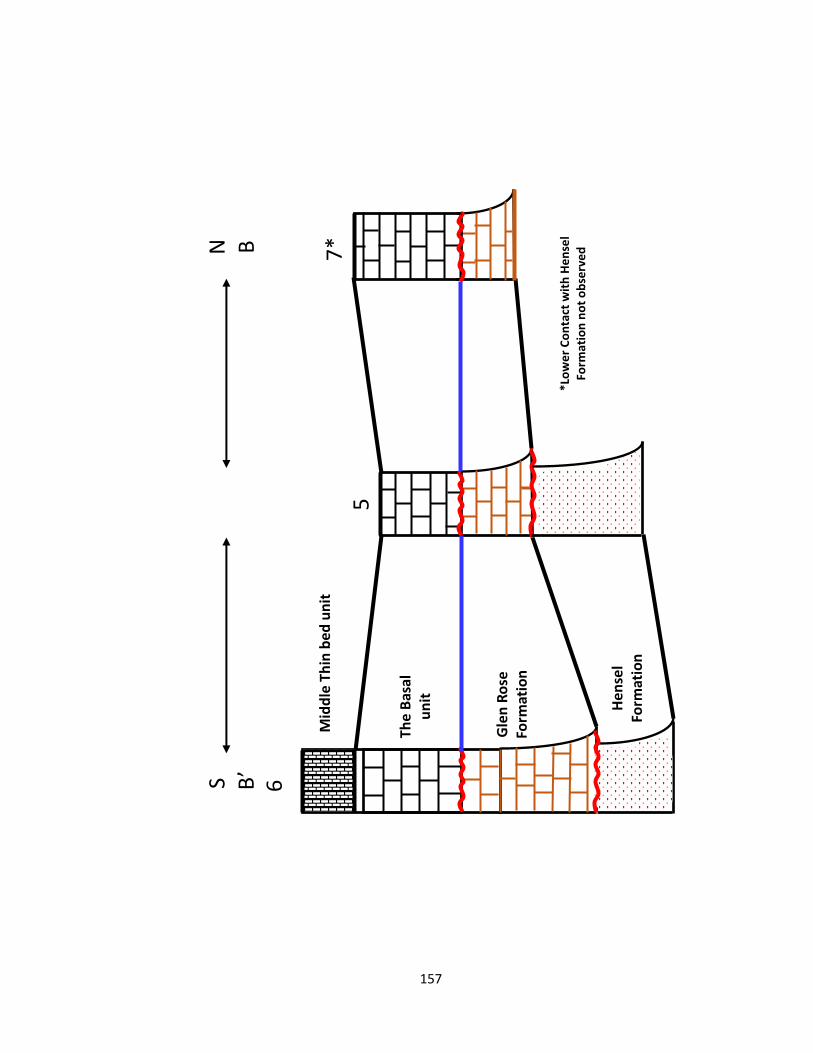
157
6
7*
5
S B’
N
B
The
Bas
al
un
it
Mid
dle
Th
in b
ed u
nit
Hen
sel
Form
atio
n
Gle
n R
ose
Fo
rmat
ion
*Lo
we
r C
on
tact
wit
h H
en
sel
Form
atio
n n
ot
ob
serv
ed
158
VITA
After completing his work at Montgomery High School in Montgomery,
Texas in 2009, Richard Urwin briefly attended Lone Star Community College
while determining a career path. During the 2011 academic year, he
transferred to Stephen F. Austin State University and received his Bachelor of
Science in Geology in 2015 while working as a fitness assistant at Planet
Fitness as well as a Community Assistant for Residence Life at SFA. In
August 2016, he entered graduate school at Stephen F. Austin State
University and worked as a graduate Teaching Assistant for Introduction to
Geology. During the summer of 2018, Richard worked as an intern Geologist
for Inspiration Energy in Tyler, Texas. In the spring semester of 2019, he
received his degree of Master of Science in Geology.
Permanent Address: 14809 Lake Mount Pleasant Road
Montgomery, Texas 77356
Typed using GSA style manual.
This Thesis was typed by Richard A. Urwin Jr.


![Facies, biostratigraphy, diagenesis, and depositional environments …paleopolis.rediris.es/cg/1510/CG1510.pdf · 2015-07-24 · Carnets de Géologie [Notebooks on Geology] - vol](https://img.dokumen.tips/doc/110x75/5e26ebfe9e73443b3738f557/facies-biostratigraphy-diagenesis-and-depositional-environments-2015-07-24.jpg)