Embed Size (px)
Citation preview

1058 IEEE TRANSACTIONS ON ANTENNAS AND PROPAGATION, VOL. 37. NO. 8, AUGUST 1989
Characterization of UHF Multipath Radio Channels in Factory Buildings
Abstract-Wide-band multipath measurements at 1300 MHz have been made in five factory buildings in Indiana. Root mean square (rms) delay spread ( U ) values were found to range between 30 and 300 ns. Median U values were 96 ns for line-of-sight (LOS) paths along aisleways and 105 ns for obstructed paths across aisles. Worst case U of 300 ns was measured in a modern open plan metal-working factory. Delay spreads were not correlated with transmitter-receiver (T-R) separation or factory topogra- phy, but were affected by factory inventory, building construction materials, and wall locations. Wide band path loss measurements consistently agreed with continuous wave (CW) measurements made at identical locations. It is shown here that such empirical data suggest independent and identical uniform distributions on the phases of resolvable multipath signal components. Average factory path loss was found to be a function of distance to the 2.2 power. Wide-band factory propagation measurements have not been previously reported in the literature.
I. INTRODUCTION
NDOOR RADIO PROPAGATION has been an active area I of research in recent years. UHF propagation measurements in and around houses and office buildings have been reported by several researchers [1]-[8]. Only a few papers, however, have been concerned with wide-band impulse response mea- surements [4], [7], [9]. Such data are necessary for determin- ing limits on data rates due to channel intersymbol interference and also provide insight as to the location and intensity of scatterers within buildings. In [7], the data have been used to develop a statistical channel model for office buildings.
There are gross physical differences between office build- ings and typical factories. Building construction techniques, floor arrangements, building contents, and placement of walls and other partitions, all factors which greatly affect propaga- tion, differ considerably between an office building and a factory. Unlike buildings and houses, factories typically have very few internal partitions. Aisles are arranged in an orthogonal, intersecting fashion and are flanked by metal machinery or inventory. Ceiling and walls in newer factories are made of ribbed steel, and metal ceiling trusswork is used.
This paper details the results of over 950 impulse response measurements made in five large factories in Indiana. Such measurements are important for development of wireless
Manuscript received November 30, 1887; revised September 29, 1988. This work was supported by NSF EngineeFing Research Grant CDR 8500022 and by a grant from the Purdue University Computer Integrated Design, Manufacturing and Automation Center (CIDMAC). Portions of this paper were presented at the 1988 IEEE Global Communications Conference, Hollywood, FL, November 30, 1988.
The author is with the Bradley Department of Electrical Engineering, Virginia Polytechnic Institute and State University, Blacksburg, VA 24061,
IEEE Log Number 8927724.
factory communication systems which are envisaged to pro- vide high data rate links between mobile robots, automated machinery, personnel, and remote terminals in factories of the future. Wide-band factory propagation data have not previ- ously been published.
In this paper, the experiment and factory buildings are described and an overview of the measured data is presented. Large scale path loss data as a function of transmitter-receiver (T-R) separation are shown to agree well with companion narrow band fading measurements [lo]. It is shown here that such agreement implies an independent and identical (iid) uniform distribution on the phases of the resolvable paths. Excess delay and rms delay spread data are presented for various topographies and buildings. It is shown that while delay spread values are comparable to those reported in large office buildings [4], the severity of multipath depends on the age of the factory and the type of inventory produced, and not so much on whether or not a line-of-sight (LOS) path exists.
11. EXPERIMENTAL DESIGN Since extensive propagation data from within factory
buildings have not previously appeared in the literature, several experiments which give insight into the radio commun- ication channels were performed. The experiments were designed to determine typical multipath power delay profiles (i.e., power impulse response measurements) within a factory and in a variety of factory buildings. Companion narrow-band measurements have been reported by Rappaport and McGil- lem which reveal time varying characteristics of factory radio channels, local fading distributions due to receiver motion, channel path loss, and shadowing effects of common factory obstructions [lo], [ 1 11.
A . Measurement Apparatus Using an apparatus similar to that in [7], the channel
impulse response was measured in the time domain by repetitively transmitting a 10 ns pulse and receiving on a digital storage oscilloscope the attenuated, distorted, and delayed versions of the pulse. The measurement apparatus, shown in block diagram form in Fig. 1, consists of a periodic pulse-modulated transmitter with average output power of 14 dBm (at 500 ns repetition period) followed by an adjustable RF attenuator. The receiver consists of a low noise amplifier followed by a square law envelope detector and a 350 MHz digital storage oscilloscope. A directional coupler permits continuous wave (CW) envelope measurements to be made simultaneously with a modified communications receiver [ 101,
0018-926X/89/0800-1058$01 .00 0 1989 IEEE
RAPPAPORT: UHF MULTIPATH RADIO CHANNELS 1059
1500 MHr BPF
Coaxial
HP 84%A decade
a~tonultor +
-15 dB
1000 MHZ to
2000MHZ BPF
15 dB
ZFDC-15-5 coupler L LNA 50 dB
MITE0 AFD4 - 50n amp 9
video - detedor
digitizing oscilloscope
7A 16A IC - R7000 1W amp
t
(b)
Fig. 1 . Block diagram of multipath measurement system. (a) Transmitter. (b) Receiver
[ 1 I]. Measurements were recorded by digitizing the oscillo- scope display and recording the display on flexible disk. For each measurement, the transmitter power, attenuator setting and pulse repetition period were recorded for determining power delivered to the antenna. The transmitter power and oscilloscope vertical scale setting were adjusted so that largest multipaths had near full-scale display deflection. The impulse response measurements have a limited (3 25 dB) dynamic range due to the linear display scale of the oscilloscope. The equipment was mounted on two industrial push carts equipped with novel discone antennas [ 151. Antenna heights of 2 m were used, as this height is representative for handheld and mobile radios likely to be used in factories.
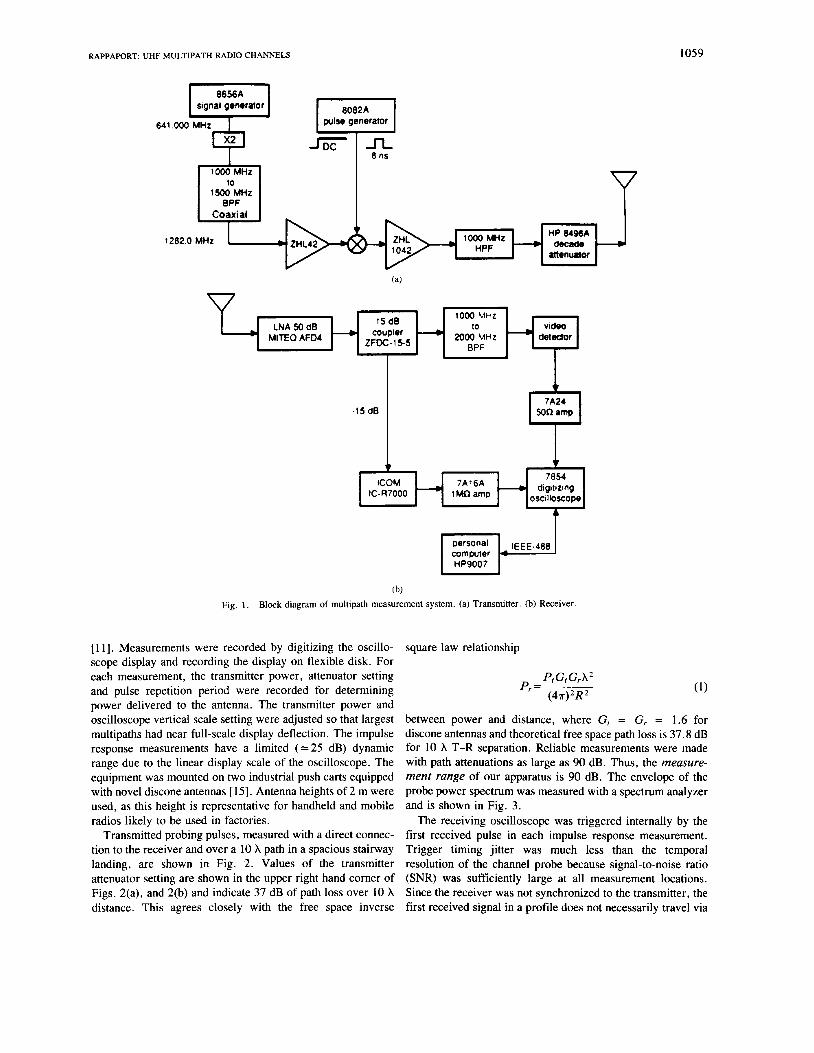
Transmitted probing pulses, measured with a direct connec- tion to the receiver and over a 10 X path in a spacious stairway landing, are shown in Fig. 2. Values of the transmitter attenuator setting are shown in the upper right hand comer of Figs, 2(a), and 2(b) and indicate 37 dB of path loss over 10 X distance. This agrees closely with the free space inverse
square law relationship
P, G, G, h (47r) R
P,=
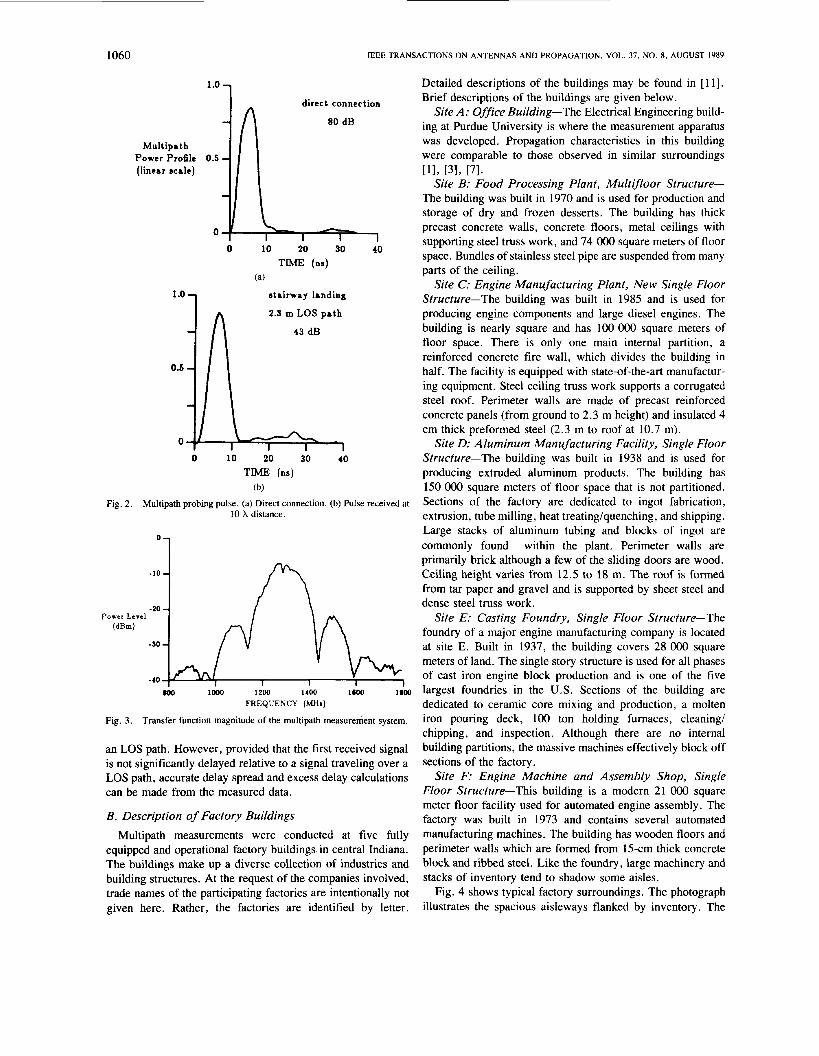
between power and distance, where G, = G, = 1.6 for discone antennas and theoretical free space path loss is 37.8 dB for 10 h T-R separation. Reliable measurements were made with path attenuations as large as 90 dB. Thus, the meusure- ment range of our apparatus is 90 dB. The envelope of the probe power spectrum was measured with a spectrum analyzer and is shown in Fig. 3.
The receiving oscilloscope was triggered internally by the first received pulse in each impulse response measurement. Trigger timing jitter was much less than the temporal resolution of the channel probe because signal-to-noise ratio (SNR) was sufficiently large at all measurement locations. Since the receiver was not synchronized to the transmitter, the first received signal in a profile does not necessarily travel via
1060 IEEE TRANSACTIONS ON ANTENNAS AND PROPAGATION, VOL. 37, NO. 8, AUGUST 1989
- direct connection
80 dB
2.3 m LOS path
0.6 -
0 -
0 10 20 30 40 TIME (ns)
(b)
10 X distance. Fig. 2. Multipath probing pulse. (a) Direct connection. (b) Pulse received at
O l
800 loo0 1200 1400 1M)o 1800 FREQUENCY (MI)
Fig. 3. Transfer function magnitude of the multipath measurement system
an LOS path. However, provided that the first received signal is not significantly delayed relative to a signal traveling over a LOS path, accurate delay spread and excess delay calculations can be made from the measured data.
B. Description of Factory Buildings Multipath measurements were conducted at five fully
equipped and operational factory buildings. in central Indiana. The buildings make up a diverse collection of industries and building structures. At the request of the companies involved, trade names of the participating factories are intentionally not given here. Rather, the factories are identified by letter.
Detailed descriptions of the buildings may be found in [ 1 11. Brief descriptions of the buildings are given below.
Site A: Office Building-The Electrical Engineering build- ing at Purdue University is where the measurement apparatus was developed. Propagation characteristics in this building were comparable to those observed in similar surroundings
Site B: Food Processing Plant, Multifloor Structure- The building was built in 1970 and is used for production and storage of dry and frozen desserts. The building has thick precast concrete walls, concrete floors, metal ceilings with supporting steel truss work, and 74 OOO square meters of floor space. Bundles of stainless steel pipe are suspended from many parts of the ceiling.
Site C: Engine Manufacturing Plant, New Single Floor Structure-The building was built in 1985 and is used for producing engine components and large diesel engines. The building is nearly square and has 100 OOO square meters of floor space. There is only one main internal partition, a reinforced concrete fire wall, which divides the building in half. The facility is equipped with state-of-the-art manufactur- ing equipment. Steel ceiling truss work supports a corrugated steel roof. Perimeter walls are made of precast reinforced concrete panels (from ground to 2.3 m height) and insulated 4 cm thick preformed steel (2.3 m to roof at 10.7 m).
Site D: Aluminum Manufacturing Facility, Single Floor Structure-The building was built in 1938 and is used for producing extruded aluminum products. The building has 150 OOO square meters of floor space that is not partitioned. Sections of the factory are dedicated to ingot fabrication, extrusion, tube milling, heat treating/quenching, and shipping. Large stacks of aluminum tubing and blocks of ingot are commonly found within the plant. Perimeter walls are primarily brick although a few of the sliding doors are wood. Ceiling height varies from 12.5 to 18 m. The roof is formed from tar paper and gravel and is supported by sheet steel and dense steel truss work.
Site E: Casting Foundry, Single Floor Structure-The foundry of a major engine manufacturing company is located at site E. Built in 1937, the building covers 28 OOO square meters of land. The single story structure is used for all phases of cast iron engine block production and is one of the five largest foundries in the U.S. Sections of the building are dedicated to ceramic core mixing and production, a molten iron pouring deck, 100 ton holding furnaces, cleaning/ chipping, and inspection. Although there are no internal building partitions, the massive machines effectively block off sections of the factory.
Site F: Engine Machine and Assembly Shop, Single Floor Structure-This building is a modern 21 OOO square meter floor facility used for automated engine assembly. The factory was built in 1973 and contains several automated manufacturing machines. The building has wooden floors and perimeter walls which are formed from 15-cm thick concrete block and ribbed steel. Like the foundry, large machinery and stacks of inventory tend to shadow some aisles.
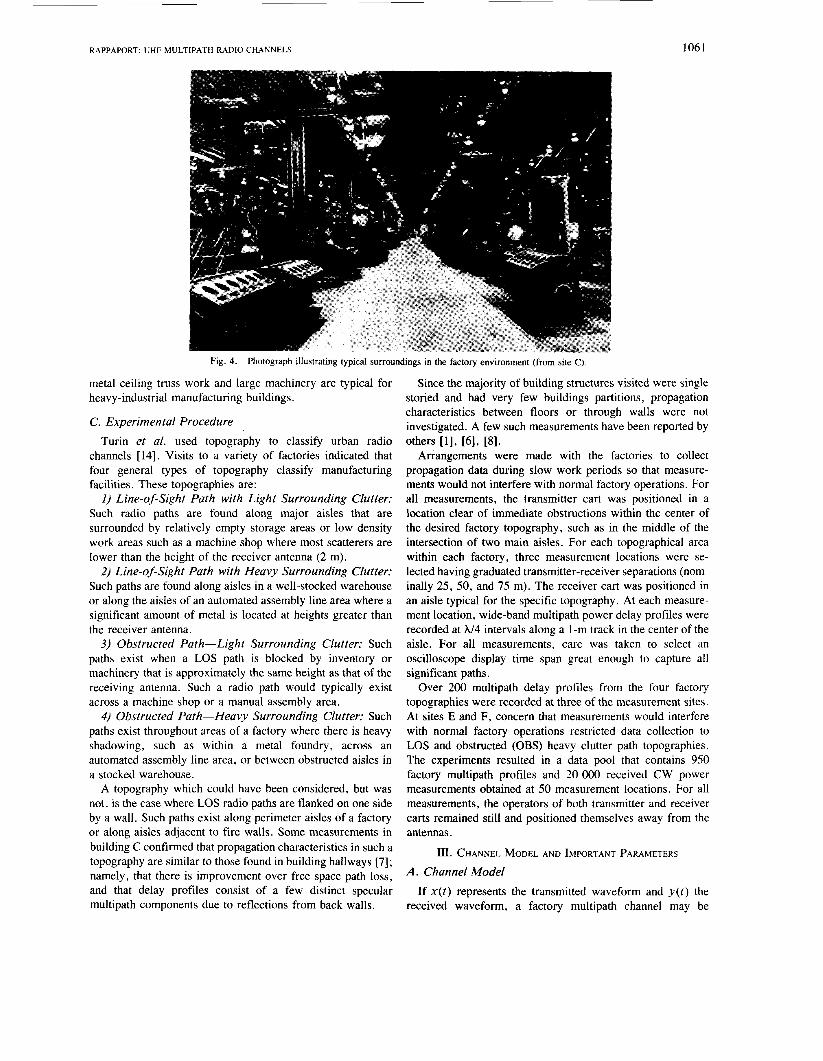
Fig. 4 shows typical factory surroundings. The photograph illustrates the spacious aisleways flanked by inventory. The
[11, 131, 171.
RAPPAPORT: UHF MULTIPATH RADIO CHANNELS 1061
Fig. 4. Photograph illustrating typical surroundings in the factory environment (from site C).
metal ceiling truss work and large machinery are typical for heavy-industrial manufacturing buildings.
C. Experimental Procedure Turin et al. used topography to classify urban radio
channels [ 141. Visits to a variety of factories indicated that four general types of topography classify manufacturing facilities. These topographies are:
I ) Line-of-Sight Path with Light Surrounding Clutter: Such radio paths are found along major aisles that are surrounded by relatively empty storage areas or low density work areas such as a machine shop where most scatterers are lower than the height of the receiver antenna (2 m).
2) Line-of-Sight Path with Heavy Surrounding Clutter: Such paths are found along aisles in a well-stocked warehouse or along the aisles of an automated assembly line area where a significant amount of metal is located at heights greater than the receiver antenna.
3) Obstructed Path-Light Surrounding Clutter: Such paths exist when a LOS path is blocked by inventory or machinery that is approximately the same height as that of the receiving antenna. Such a radio path would typically exist across a machine shop or a manual assembly area.
4) Obstructed Path-Heavy Surrounding Clutter: Such paths exist throughout areas of a factory where there is heavy shadowing, such as within a metal foundry, across an automated assembly line area, or between obstructed aisles in a stocked warehouse.
A topography which could have been considered, but was not, is the case where LOS radio paths are flanked on one side by a wall. Such paths exist along perimeter aisles of a factory or along aisles adjacent to fire walls. Some measurements in building C confirmed that propagation characteristics in such a topography are similar to those found in building hallways [7]; namely, that there is improvement over free space path loss, and that delay profiles consist of a few distinct specular multipath components due to reflections from back walls.
Since the majority of building structures visited were single storied and had very few buildings partitions, propagation characteristics between floors or through walls were not investigated. A few such measurements have been reported by others [l], [6], [8].
Arrangements were made with the factories to collect propagation data during slow work periods so that measure- ments would not interfere with normal factory operations. For all measurements, the transmitter cart was positioned in a location clear of immediate obstructions within the center of the desired factory topography, such as in the middle of the intersection of two main aisles. For each topographical area within each factory, three measurement locations were se- lected having graduated transmitter-receiver separations (nom- inally 25, 50, and 75 m). The receiver cart was positioned in an aisle typical for the specific topography. At each measure- ment location, wide-band multipath power delay profiles were recorded at h/4 intervals along a 1-m track in the center of the aisle. For all measurements, care was taken to select an oscilloscope display time span great enough to capture all significant paths.
Over 200 multipath delay profiles from the four factory topographies were recorded at three of the measurement sites. At sites E and F, concern that measurements would interfere with normal factory operations restricted data collection to LOS and obstructed (OBS) heavy clutter path topographies. The experiments resulted in a data pool that contains 950 factory multipath profiles and 20 OOO received CW power measurements obtained at 50 measurement locations. For all measurements, the operators of both transmitter and receiver carts remained still and positioned themselves away from the antennas.
111. CHANNEL MODEL AND IMPORTANT PARAMETERS A. Channel Model
If x ( t ) represents the transmitted waveform and y ( t ) the received waveform, a factory multipath channel may be

1062 IEEE TRANSACTIONS ON ANTENNAS AND PROPAGATION, VOL. 37. NO. 8 , AUGUST 1989
characterized by the impulse response h ( t ) . The received signal y ( t ) is an attenuated and time delayed version of the transmitted signal x ( t ) . For a discrete channel model, this implies [19]
v ( t )=C a k ( f ) X ( f - T k ( f ) ) . (2) k
Note that the received signal in (2) is a function of both time and delay ( r k ) . Since measurements were made during slow factory activity, the (Yk and Tk imposed by the channel are virtually independent of time. Using this fact, the impulse response is given by
h ( t ) = x a k S ( t - T k ) (3) k
where 6( . ) is the unit impulse function and ro denotes the arrival of the first observable pulse.
For transmitted signal of the form
x ( t ) = Re [p(t)ej2"fc'] where
(4) 1 for O s t s lO-*s
'(')= I 0: elsewhere
the channel output is
y ( t ) = jm x ( { ) h ( t - { ) d{=Re [r( t )eJ2"fc '] ( 5 ) - m
where
r ( t ) = C ake-J21rfcrkp(t-Tk).
The channel may be equivalently described by the baseband impulse response h b ( f ) having an output r ( t ) which is the complex envelope of y ( t ) . The low-pass characterization removes the high frequency variations caused by the carrier making it analytically easier to handle. Thus, it suffices to characterize the low-pass equivalent channel impulse response hb(t) which is given by
k
h b ( t ) = ake - J 2 r r f c 7 k 6 ( t - rk ) . (6) k
In (6), (Yk represents a real attenuation factor, eJ2*fcrk represents a linear phase shift due to propagation, and T k is the time delay of the kth path in the channel.
By modulating an RF carrier with a 10 ns sounding probe, the output of the low pass channel closely approximates the impulse response hb(t). As in [7], instead of measuring the output r ( t ) , Jr(t)l is measured. Letting Ok represent the linear phase term in (6), the multipath power profile display becomes
1 r ( t ) ( = r(t)r*(t) = Re [ 7 7 aJakP(f-TJ)
* p ( t - j-k)e-J(8j-8k)
Note that if lrJ - T k I > 10 ns for all j # k , then
assumed there are unresolvable subpaths that combine to form one observable path. The rms duration of the probe is 7.8 ns, and this value may alternatively be used to determine the time delay resolution. Although the digitizing oscilloscope provides (a i , rk ) values at intervals between 1 and 7.8 ns depending on sweep rate, the power profile is quantized into bins having 7.8 ns durations (for calculating multipath parameters such as delay spread, all (ai, rk) values are used). Within each bin, the ai are averaged to obtain an equivalent A i at time delay TK. Thus, although the measurement is expressed by (7), the data have been reduced to represent each power profile as follows:
Ir(t>12= l hb( t ) I2=C A : p 2 ( t - T ~ ) , K
TK+ I - TK= 7 . 8 ns. (8)
This data reduction technique is similar to one used by Turin [14], although we use discrete time samples instead of inflection points.
Because power impulse responses are recorded at XI4 intervals on a 1-m path, local (small scale) spatial fading of the individual multipath components is observed. Thus, each measurement is not only a function of time delay but also of space. For a position xo on a given path, the power impulse response can be expressed by
Thus fluctuations of multipath strengths and delays may be statistically characterized over local areas.
For 5 X to 10 X neighborhoods, other researchers have either shown or assumed that mobile and portable radio channels exhibit wide sense stationary (WSS) properties over space [16], [17]. For the WSS assumption, it is valid to estimate the measured sample records of a process by the sample average. Thus, (9) may be averaged over local spatial locations to determine a representative power impulse re- sponse at each measurement location. The local averaged impulse response is useful for computing path loss and for determining multipath parameters.
B. Multipath Channel Parameters Wide-band multipath channels are grossly quantified by
their mean excess delay (3 and rms delay spread (U) [4], [7], [16]-1181. The former is the first moment of the power delay profile and is defined to be
The latter is the square root of the second central moment of the profile and is defined to be
I r ( t ) 1 2 = Z a:p2(t-Tk) k
and the power profile measurement has a path resolution of 10 ns. For 17, - rkl < 10 ns, there is pulse overlap, and it is In ( 1 l ) , the delays of each profile are measured relative to a
RAPPAPORT: UHF MULTIPATH RADIO CHANNELS 1063
I
Excess Ik1.y (ns)
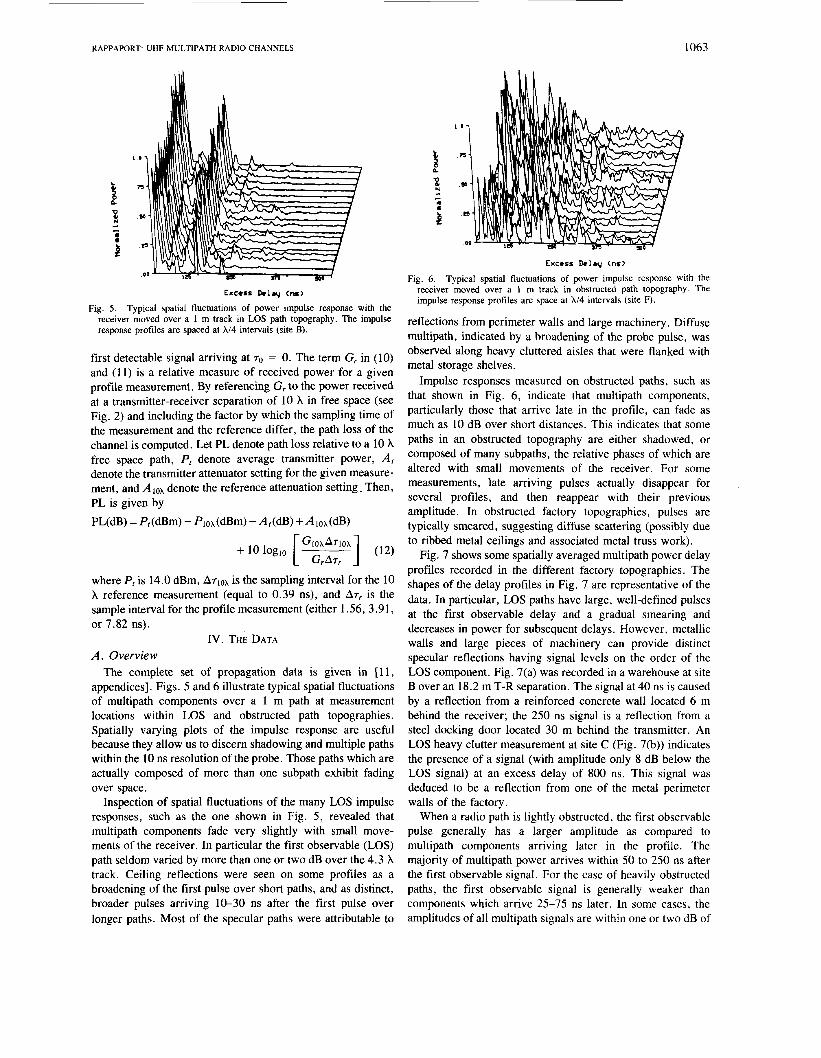
Fig. 6. Typical spatial fluctuations of power impulse response with the receiver moved over a 1 m track in obstructed path topography. The impulse response profiles are space at Xi4 intervals (site F).
reflections from perimeter walls and large machinery. Diffuse multipath, indicated by a broadening of the probe pulse, was observed along heavy cluttered aisles that were flanked with metal storage shelves.
Impulse responses measured on obstructed paths, such as that shown in Fig. 6, indicate that multipath components, particularly those that arrive late in the profile, can fade as much as 10 dB over short distances. This indicates that some paths in an obstructed topography are either shadowed, or composed of many subpaths, the relative phases of which are altered with small movements of the receiver. For some measurements, late arriving pulses actually disappear for several profiles, and then reappear with their previous amplitude. In obstructed factory topographies, pulses are typically smeared, suggesting diffuse scattering (possibly due to ribbed metal ceilings and associated metal truss work).
Fig. 7 shows some spatially averaged multipath power delay profiles recorded in the different factory topographies. The shapes of the delay profiles in Fig. 7 are representative of the data. In particular, LOS paths have large, well-defined pulses at the first observable delay and a gradual smearing and decreases in power for subsequent delays. However, metallic walls and large pieces of machinery can provide distinct specular reflections having signal levels on the order of the LOS component. Fig. 7(a) was recorded in a warehouse at site B over an 18.2 m T-R separation. The signal at 40 ns is caused by a reflection from a reinforced concrete wall located 6 m behind the receiver; the 250 ns signal is a reflection from a steel docking door located 30 m behind the transmitter. An LOS heavy clutter measurement at site C (Fig. 7(b)) indicates the presence of a signal (with amplitude only 8 dB below the LOS signal) at an excess delay of 800 ns. This signal was deduced to be a reflection from one of the metal perimeter walls of the factory.
When a radio path is lightly obstructed, the first observable pulse generally has a larger amplitude as compared to multipath components arriving later in the profile. The majority of multipath power arrives within 50 to 250 ns after the first observable signal. For the case of heavily obstructed paths, the first observable signal is generally weaker than components which arrive 25-75 ns later. In some cases, the amplitudes of all multipath signals are within one or two dB of
Excess D e l y (ra)
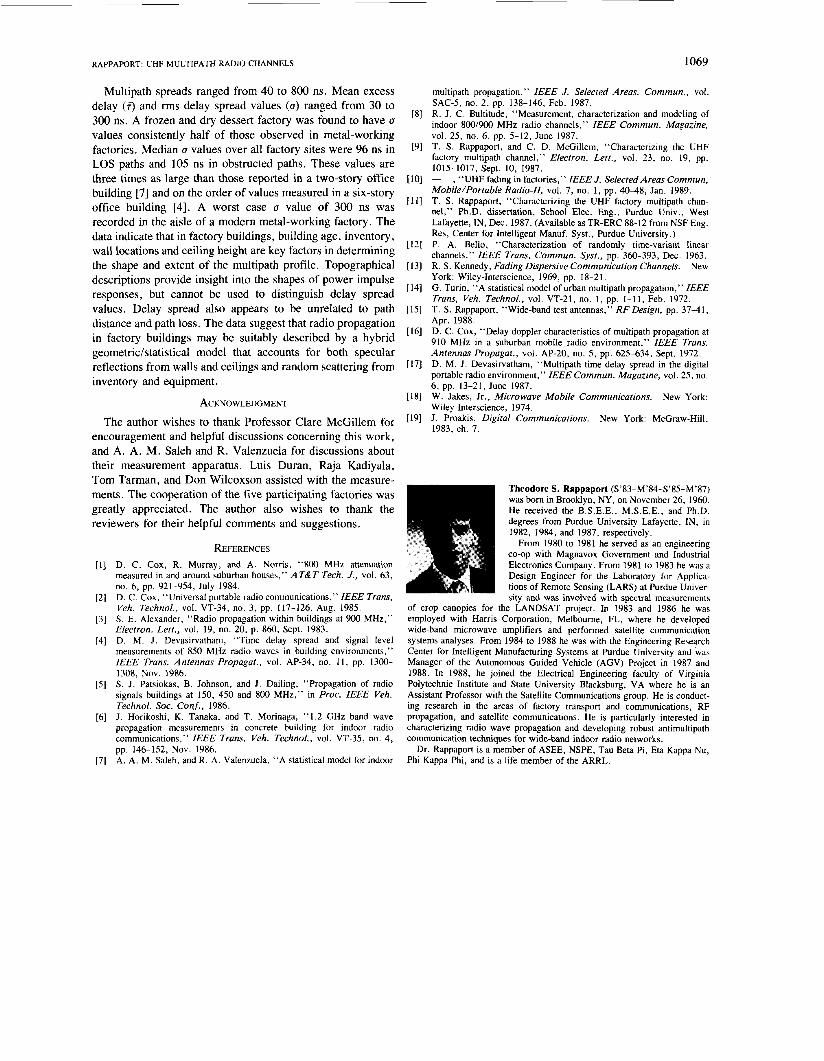
Fig. 5. Typical spatial fluctuations of power impulse response with the receiver moved over a 1 m track in LOS path topography. The impulse response profiles are spaced at X/4 intervals (site B).
first detectable signal arriving at 70 = 0. The term G, in (10) and (11) is a relative measure of received power for a given profile measurement. By referencing G, to the power received at a transmitter-receiver separation of 10 h in free space (see Fig. 2) and including the factor by which the sampling time of the measurement and the reference differ, the path loss of the channel is computed. Let PL denote path loss relative to a 10 h free space path, Pt denote average transmitter power, A, denote the transmitter attenuator setting for the given measure- ment, and A denote the reference attenuation setting. Then, PL is given by PL(dB) = P,(dBm) - Plox(dBm) -A,(dB) +Alox(dB)
where Pt is 14.0 dBm, is the sampling interval for the 10 h reference measurement (equal to 0.39 ns), and A7, is the sample interval for the profile measurement (either 1.56, 3.91, or 7.82 ns).
IV. THE DATA A. Overview
The complete set of propagation data is given in [ l l , appendices]. Figs. 5 and 6 illustrate typical spatial fluctuations of multipath components over a 1 m path at measurement locations within LOS and obstructed path topographies. Spatially varying plots of the impulse response are useful because they allow us to discern shadowing and multiple paths within the 10 ns resolution of the probe. Those paths which are actually composed of more than one subpath exhibit fading over space.
Inspection of spatial fluctuations of the many LOS impulse responses, such as the one shown in Fig. 5, revealed that multipath components fade very slightly with small move- ments of the receiver. In particular the first observable (LOS) path seldom varied by more than one or two dB over the 4.3 h track. Ceiling reflections were seen on some profiles as a broadening of the first pulse over short paths, and as distinct, broader pulses arriving 10-30 ns after the first pulse over longer paths. Most of the specular paths were attributable to

'"1
i, '7
il
b
0 a0 M1
Mccs C M Y 1-1
(e) Fig. 7. Typical spatially averaged power impulse responses from various
topographies. (a) LOS light clutter. @) LOS heavy clutter. (c) LOS along wall. (d) OBS light clutter. (e) OBS heavy clutter.
one another, and do not appear to decrease with time delay out to a few hundred nanoseconds. Paths that traverse large obstructions result in the majority of signal power arriving within 100 to 400 ns after the first observable signal.
B. Path Loss Equation (12) was used to compute path loss (sometimes
called large scale attenuation [ 1 1 , [ 2 ] ) for all of the individual power impulse response measurements and for each of the spatially averaged power impulse responses. The wide-band data were collected in identical locations as accompanying CW measurements made with a moving receiver [ l o ] , [ 1 1 1 , except for a few measurement locations where signals were too greatly attenuated to be detected by the pulse receiver. It was observed that for over 90 percent of the measurement locations, wide-band path loss varied only slightly (at most by only three dB) between individual profiles spaced h/4 apart. This confirms the well-accepted notion that local fading is due primarily to the fluctuations of the sum of phases of the received paths, and not variations in the multipath amplitudes.
The wide band path loss data from all factories is shown in Fig. 8(a), and is highly correlated with T-R separation
Signal Attenuation
(dB) W R 10h
free space transmission
6 = 2.16
30
. . ............ ..... . . . . .
....... n = l ......... . : . . . . . . . . . . ..... ..... . :
............. 8.J ............ ...... ..... ........ .....
I 6 = 2.16 I 30
........ ......... n = l ..... ..... ............. 8.J ............ ...... ..... ........
10 20 50 100 Distance (m)
(a)
: n=4
-\Site D
=Site F
Signal
(dB) W R 10 h
free space 2o transmission
Attenuation 30
10
10 20 50 100
Distance (m)
(b) Fig. 8. Path loss measurements with respect to 10 h free space transmission
from identical locations in five factories using (a) wide-band and (b) narrow-band equipment. (a) Wide-band measurements. (b) CW measure- ments (from [ 111).
(correlation coefficient for the data is 0.98). The bold line in the figure shows the least squares linear fit to the data, and indicates a relationship of path loss to the 2.16 power. As shown in Fig. 8(b), this value compares with a path loss exponent of 2.15 for the CW measurements taken at identical locations [ 101, [ 1 13.
For the general multipath problem where there exist N multipath components, each of which is resolvable and having real amplitude p i and phase O i , the wide-band measurement apparatus computes received power P, as the sum of individual path powers. A CW receiver measures power Pcw as the square of the envelope of the sum of all signals arriving at the antenna. To determine when wide-band and narrow- band path loss measurements yield equivalent results, one may first assume that the received paths form a random process where each path has a random amplitude and phase.
e ] denotes the ensemble average over p and 8, and the path amplitude correlation coefficient rg is defined to be
If
rij = Ep [ ~ i p j l ? ( 1 3 )

RAPPAPORT: UHF MULTIPATH RADIO CHANNELS 1065
then the average wide-band power measurement is given by
In (14a), the bar denotes sample average over a local measurement area. The average CW power measurement is given by
N N N =E z+2 E rijcos @;-e,) I i j , j # i
(14b) where the bar denotes time average for a CW measurement over a local measurement area.
Note that when cos (0; - e,) = 0 and/or rij = 0, the average CW and wide-band power measurements are equivalent. This can occur when either the path phases are identically and independently uniform distributed (iid uniform) over [0, 27r) or when the path amplitudes are uncorrelated. The iid uniform distribution of 0, is likely since multipath components travel distances that measure hundreds of wavelengths and are likely to arrive with arbitrary phases [13]. If for some reason it is believed that the phases are not independent, the wide-band and CW measurements will still be equal if the paths have uncorrelated amplitudes. However, if the phases of the paths are dependent upon each other, then the amplitudes are likely to be correlated, since the same mechanism which affects the path phases is likely to also affect the amplitudes. This situation is highly unlikely.
By moving the measurement apparatus over a distance of several wavelengths at each measurement location, the ex- pected value of the p : in (14) were computed and the 0; were assumed to be iid uniform. The agreement between path loss data collected using both wide-band and CW measurement systems is consistent with the iid uniform assumption on the multipath phases, and shows that for indoor radio channels, wide band path loss measurements can be expected to give very similar results when compared with data collected using narrow-band equipment. ’ C. RMS Delay Spread (a) and Mean Excess Delay (7) in Factories
Using the averaged power delay profiles from each of the 50 measurement locations within five factories, the rms delay spread (a) and the mean excess delay (7) were tabulated as a function of building and topography. Tables I and 11 list a values for T-R separations less than 25 m and exceeding 40 m.
It can be seen from the tables that delay spread values are not correlated with T-R distance or topography. This observa-
I A spread spectrum sounding apparatus, which uses 80 MHz RF bandwidth and has a receiver dynamic display range of about 45 dB, has provided path loss measurements that are within 2 dB of CW measurements made over identical paths ranging from 46 to 168 m [4]. As can be seen in Fig. 8, the spatially averaged wide band measurements agree with companion CW
TABLE I RMS DELAY SPREAD DATA (10-25 m PATHS)
RMS delay spread as a function of factory topography (ns) T-R separation of 10-25 m
- Topography Site B Site C Site D Site E Site F
LOS light clutter 87.6 118.8 51.1 - -
Obstructed light clutter 27.7 102.6 103.2 - -
LOS heavy clutter 45.6 46.9 106.7 48.7 124.3 LOS along wall - 122.4 -
Obstructed heavy clutter 70.9 101.5 52.0 79.3 49.6
- -
TABLE I1 RMS DELAY SPREAD DATA (40-75 m PATH)
RMS delay spread as a function of factory topography (ns) T-R separation of 40-75 m
Topography Site B Site C Site D Site E Site F
LOS light clutter 33.9 43.2 118.5 - -
LOS along wall - LOS heavy clutter 39.5 201.5 33.3 93.6 44.3
- - 92.7 - - Obstructed light clutter - 118.5 108.9 -
Obstructed heavy clutter 77.2 114.7 106.8 52.5 129.6
tion has been made by other researchers in the mobile radio channel, and was recently observed in an office building [7], [18], but disagrees with the findings made by another researcher using a more sensitive apparatus in a much larger office building [4].
a may often be related to 7. A multipath power delay profile that decays exponentially over time delay corresponds to the situation where a = 7. This situation also corresponds to a two-path impulse response with the second path arriving at a time delay of 27. For cases when 7 < a, the multipath power profile has a high concentration of power at small excess delay values and a much smaller distribution of power at larger delays [17]. However, when f > a, a significant amount of power arrives in the middle of the profile, and not in the earliest multipath components. A scatter plot showing the relationship of 7 versus a for various factory topographies is shown in Fig. 9. In the figure, the data points have been obtained from the spatially averaged power profiles from each of the 50 measurement sites. LOS measurements along a fire wall in site C best fit a slope of 7/a = 0.83. LOS light and LOS heavy cluttered areas were found to fit lines having slopes of ?/a = 1.13 and 1.15, respectively. The obstructed light clutter paths fit a slope of 1.25, whereas heavy clutter obstructed paths have ?/a = 1.57. The data further substanti- ate the fact that obstructed paths tend to have the majority of received power arrive at longer time delays, whereas LOS paths receive most of the signal early in the multipath delay profile.
Bello characterized frequency selective channels in terms of a Taylor series expansion of the average multipath power spectrum about a center frequency [12, p. 3871. In 1121, he showed that for wide sense stationary uncorrelated scattering - .
measurements to within + / - 2 dB for many locations. (WSSUS) channels, the rms delay spread (1 1) describes the

1066 IEEE TRANSACTIONS ON ANTENNAS AND PROPAGATION, VOL. 31, NO. 8, AUGUST 1989
X
I
0 LOS light x LOS heavy A LOS wall * OBS light
OBS h e h v
R M S delay spread U (U)
Fig, 9. Scatter plot of excess mean delay versus rms delay spread as a function of factory topography
o7 I 0 0
0 m 100 n o m tw I RMS Delay Spread U (U)
Fig. 10. Cumulative distribution of U for all LOS paths.
ratio of power in the first (linear) frequency selective term of the series expansion to the power in the flat fading (DC) component. For studying factory multipath channels, rms delay spread values have been computed for individual power delay profiles (as well as for profiles averaged over local areas) to provide a measure of the excess time delays at which multipath power is concentrated. Characterization of impulse response measurements in this manner provides a basis for comparison of propagation characteristics in different chan- nels.
Cumulative distribution functions (CDFs) of U for the various factories and topographies were computed. In order to simplify the data analysis, delay spread data for LOS paths in light and heavy cluttered topographies were classified as LOS. Similarly, data from both light and heavily obstructed clutter topographies were classified as obstructed (OBS) paths. Plots showing the CDFs of U for all LOS paths as a function of factory are shown in Fig. 10. The CDFs of U in obstructed paths as a function of factory are given in Fig. 11. Fig. 12 show that CDF of U over the entire data pool of wide band measurements. CDFs in Fig. 10-12 have been derived using U
values computed from individual multipath power delay profiles (not local averages) and 1 ns increments on the abcissa.
It is interesting to note the effects which building inventory and age have upon U . Site B contains considerably less metal inventory and more paper inventory than the other factories.
Probabilty U ,< a&*
1
O S
0.6
0.4
0 1
0
Fig. 11. Cumulative distribution of U for all OBS paths.
1
Probabilry o< hbrciua
0 ' ' I I I I
0.8 -
............ uniform distribution
I I I 0 loo 150 2m im a m
Rh4S Delay Spread U (as)
Fig. 12. Cumulative distribution of U for all paths. Plot represents U values from 950 power impulse response measurements. A uniform distribution having a mean of 100 ns is a reasonable approximation.
The building is also different in that it does not follow the typical open plan layout of the other buildings since concrete block walls are used to separate the various factory areas. Site B obstructed path measurements were taken in a large main (100 m x 60 m) warehouse and a smaller warehouse (80m x 50 m), and have respective median and worst case rms delay spread values of 56 and 129 ns. LOS measurements were made within the main warehouse and in a frozen food production area, and have respective median and worst case U
values of 49 and 13 1 ns. CDFs for delay spread measurements at site B are shown in Fig. 13(a) and 13(b). Referring to the entire data pool (Fig. 12), these values are consistently half of those found over all of the factories. The decreased delay spread is believed to be caused primarily by the nonconducting inventory. This premise is supported by rms delay spread results for LOS paths at site D made in the boxing/shipping area of an open plan style factory. There, measurements made in an aisle flanked by stacks of cardboard provided worst case U values less than 60 ns.
Distributions of U also illustrate the effect which building age has upon multipath propagation. Sites C and F, which both manufacture engine products, were the most modem factory sites visited. The building structures incorporate noticeably more metal than the other buildings. As an example of the modern construction, both of the factories have perimeter walls made of preformed insulated steel, whereas at other sites, perimeter walls are made of concrete, brick, or wood.

RAPPAPORT: UHF MULTIPATH RADIO CHANNELS
1
0.8 - 0.6 -
Probabilty U < abacula
0.4 - 0.2 -
0
I
OBS patbr at rite F
I I I
Pmbabilty U < abDCL.
04 -
I 0 bo 100 lbo I
h h y spnad d (U) (b)
Pmbabilty U < abui i .
0 M 100 IbO 200 360 #o RMS Delay Spread U (U)
(C)
1
O J
04
0.4
0 3
0
Pmbabilty U <
1 .
o.*]
0.2 1
1067
D
Fig. 13. Cumulative distributions of U values for line-of-sight and obstructed path topographies in a variety of buildings. (a) LOS paths in site B. (b) OBS paths in site B. (c) LOS paths in site C. (d) OBS paths in site C. (e) LOS paths in site F. (f) OBS paths in site F.
CDFs for U measurements at these sites are shown in Figs. 13(c)-13(f). Median rms delay spread values at site C and F on LOS paths (120 ns and 123 ns) and on obstructed paths (119 and 126 ns) were the largest observed. However, worst case delay spread values exceeded 140 ns in all topographies in all four of the metal-working factories, with a maximum worst case value of 300 ns recorded at site C . It is interesting to note that differences between worst case rms delay spread values in LOS and OBS topographies were less than 10 ns at all sites except site C. This clearly indicates severe multipath propaga- tion (large U) occurs whether or not a LOS path exists between the transmitter and receiver.
LOS paths in all buildings exhibit distinct flat regions on the CDF plots. Obstructed path data from all sites except site F, where only six measurement locations were used, have much smoother distributions of U . Such a finding indicates that multipath propagation along LOS aisles in a factory is caused primarily by distinct specular reflections from objects or walls at the ends of the aisles, and ceiling bounce within the aisle. The discrete nature of wall reflections in LOS topographies are also shown in Figs. 5 and 7. Other indoor measurements have shown this to be the case for propagation along building corridors [4], [ 7 ] .
The consistency of the flat regions between 50 and 80 ns in

1068
80 - T-R
Distance (4
40 -
20 -
0
IEEE TRANSACTIONS ON ANTENNAS AND PROPAGATION, VOL. 37. NO. 8. AUGUST 1989
* X
'c 0 0 A @ X. . * .
X . .x;s. X
*z * O 0 LOS light x LOS heavy A LOS wall
* ' s * OBS light 8 OBS heavy
P .. 'x'A O +
I I I I I I
the LOS U CDFs is believed to be related to measurement locations chosen within each factory and the course oscillo- scope sweep times. Effort was made to ensure that all measurements were taken across very comparable and typical topographies at all of the sites. Effects due to wall reflections were kept consistent by locating both the transmitter and the receiver in as central a location as possible for all measure- ments. The discrete distribution of U values for LOS paths clearly indicate that geometric considerations such as transmit- ter and receiver locations relative to walls play a key role in defining the shape and extent of the multipath delay profile in a factory. The more continuous and nearly uniform distribution of U for obstructed paths may be explained by noting that propagation is not largely confined to an aisleway. Rather, signals arrive by several paths which may include diffraction around obstructions and reflections from ceiling truss work and large objects in adjacent aisles. The data suggest the use of a hybrid propagation model that incorporates ray-tracing for specular reflection due to perimeter walls and a statistical characterization of multipath that is conditioned on building layout and inventory.
The entire pool of data indicates that for the average factory channel, the rms delay spread is slightly greater than 100 ns, and has an approximately uniform distribution between 30 to 170 ns as shown in Fig. 12. Worst case rms delay spread did not exceed 300 ns for a modern open plan factory. The fact that the distributions of U are similarly shaped over such a diverse collection of building structures and industries sug- gests that the measurements are indicative of typical rms delay spread values that would be encountered in any factory. Furthermore, one would intuitively expect nonmetallic inven- tory to attenuate signals and diminish the amount of multipath at site B, and would expect metallic inventory and walls to induce greater median multipath spreads in sites C and F. The U distributions in Fig. 13 clearly support the intuition.
Scatter plots using U values computed from the local spatially averaged power delay profiles were made to ascertain the correlation of rms delay spread on path loss or T-R separation. Figs. 14 and 15 show scatter diagrams of rms delay spread plotted against T-R separation and path loss, respectively, as a function of factory topography. The path loss values are referenced to a free space path of 10 A.
Fig. 14 indicates that U is uncorrelated with T-R separation for all topographies. The figure also demonstrates the uniform distribution of U over heavy cluttered obstructed paths, whereas LOS paths (and obstructed light clutter paths) are seen to have a distinctive bimodal distribution about 45 and 105 ns.
Fig. 15 indicates that U is also uncorrelated with path loss over all topographies. Such a finding is similar to that observed by Turin in the urban mobile radio channel [ 141, and similar to that observed by Saleh and Valenzuela [7] in a medium sized office building using an apparatus similar to the one here. The data suggest that in the factory, average U values are not dependent upon topography, but depend on building age and inventory. Worst case delay spreads are comparable regardless of topography. In contrast, Devasirvatham ob- served in an office building that a LOS path can reduce rms delay spread from 400 ns to under 100 ns [4], [17]. The
X
bu
. . 40 - Path Loss
W R 10 h free space
(dB) X
transmission 2o - 0%
A 0 LOS light I * * x LOS heavy A LOS wall * OBS light m OBS heavy
0 50 100 IS0 200 260 : RMS delay spread U Ina)
0
Fig. 15. Scatter plot of U versus path loss with respect to 10 X free space transmission as a function of factory topography.
insensitivity of delay to path topography is undoubtedly due to the open plan layout of factories and the abundance of reflecting objects.
V. CONCLUSION
Extensive wide-band propagation measurements have been made in five operational factories. Multipath power delay profiles were measured in 50 locations across four general topographies common to all factories. It was discovered that over local areas, individual multipath components do not fade significantly when a line-of-sight path exists between transmit- ter and receiver while some rapid path fading and shadowing occurs over obstructed paths. Path loss is highly correlated with transmitter-receiver separation. On the average, path loss is a function of distance to the 2.2 power. An independent and identical uniform distribution on the phases of multipath signals was shown to account for the good agreement between wide band and CW path loss measurements.
RAPPAPORT: UHF MULTIPATH RADIO CHANNELS 1069
Multipath spreads ranged from 40 to 800 ns. Mean excess delay ( f ) and rms delay spread values (a) ranged from 30 to 300 ns. A frozen and dry dessert factory was found to have a values consistently half of those observed in metal-working factories. Median a values over all factory sites were 96 ns in LOS paths and 105 ns in obstructed paths. These values are three times as large than those reported in a two-story office building [7] and on the order of values measured in a six-story office building [4]. A worst case cr value of 300 ns was recorded in the aisle of a modern metal-working factory. The data indicate that in factory buildings, building age, inventory, wall locations and ceiling height are key factors in determining the shape and extent of the multipath profile. Topographical descriptions provide insight into the shapes of power impulse responses, but cannot be used to distinguish delay spread values. Delay spread also appears to be unrelated to path distance and path loss. The data suggest that radio propagation in factory buildings may be suitably described by a hybrid geometric/statistical model that accounts for both specular reflections from walls and ceilings and random scattering from inventory and equipment.
ACKNOWLEDGMENT
The author wishes to thank Professor Clare McGillem for encouragement and helpful discussions concerning this work, and A . A . M. Saleh and R. Valenzuela for discussions about their measurement apparatus. Luis Duran, Raja Kadiyala, Tom Tarman, and Don Wilcoxson assisted with the measure- ments. The cooperation of the five participating factories was greatly appreciated. The author also wishes to thank the reviewers for their helpful comments and suggestions.
REFERENCES
D. C. Cox, R. Murray, and A. Norris, “800 MHz attenuation measured in and around suburban houses,” AT&T Tech. J., vol. 63, no. 6, pp. 921-954, July 1984. D. C. Cox. “Universal portable radio communications,” IEEE Trans, Veh. Techno/., vol. VT-34, no. 3, pp. 117-126, Aug. 1985. S. E. Alexander, “Radio propagation within buildings at 900 MHz,” Electron. Lett., vol. 19, no. 20, p. 860, Sept. 1983. D. M. J. Devasirvatham, “Time delay spread and signal level measurements of 850 MHz radio waves in building environments,” IEEE Trans. Antennas Propagat., vol. AP-34, no. 11, pp. 1300- 1308, Nov. 1986. S. J. Patsiokas, B. Johnson, and J. Dailing, “Propagation of radio signals buildings at 150, 450 and 800 MHz,” in Proc. IEEE Veh. Techno[. Soc. Cony., 1986. J. Horikoshi, K. Tanaka. and T. Morinaga, “1.2 GHz band wave propagation measurements in concrete building for indoor radio communications,” IEEE Trans. Veh. Techno/., vol. VT-35, no. 4 ,
A. A. M. Saleh, and R. A. Valenzuela, “A statistical model for indoor pp. 146-152, NOV. 1986.
multipath propagation,” IEEE J. Selected Areas. Commun., vol. SAC-5, no. 2, pp. 138-146, Feb. 1987. R. J . C. Bultitude, “Measurement, characterization and modeling of indoor 800/900 MHz radio channels,” IEEE Commun. Magazine, vol. 25, no. 6, pp. 5-12, June 1987. T. S. Rappaport, and C. D. McGillem, “Characterizing the UHF factory multipath channel,” Electron. Letf., vol. 23, no. 19, pp. 1015-1017, Sept. 10, 1987. -, “UHF fading in factories,” IEEE J. Selected Areas Commun, Mobile/Portable Radio-11, vol. 7, no. 1, pp. 4 0 4 8 , Jan. 1989. T. S. Rappaport, “Characterizing the UHF factory multipath chan- nel,’’ Ph.D. dissertation, School Elec. Eng., Purdue Univ., West Lafayette, IN, Dec. 1987. (Available as TR-ERC 88-12 from NSF Eng. Res, Center for Intelligent Manuf. Syst., Purdue University.) P. A. Bello, “Characterization of randomly time-variant linear channels,” IEEE Trans. Commun. Syst., pp. 360-393, Dec. 1963. R. S. Kennedy, Fading Dispersive Communication Channels. New York: Wiley-Interscience, 1969, pp. 18-21. G. Turin, “A statistical model of urban multipath propagation,” IEEE Trans, Veh. Techno/., vol. VT-21, no. 1, pp. 1-11, Feb. 1972. T. S. Rappaport, “Wide-band test antennas,” R F Design, pp. 37-41, Apr. 1988. D. C. Cox, “Delay doppler characteristics of multipath propagation at 910 MHz in a suburban mobile radio environment,” IEEE Trans. Antennas Propagat., vol. AP-20, no. 5, pp. 625-634, Sept. 1972. D. M. J . Devasirvatham, “Multipath time delay spread in the digital portable radio environment,” IEEE Commun. Magazine, vol. 25, no. 6, pp. 13-21, June 1987. W. Jakes, Jr., Microwave Mobile Communications. New York: Wiley-Interscience, 1974. J. Proakis, Digital Communications. New York: McGraw-Hill, 1983, ch. 7.
Theodore S. Rappaport (S’83-M’M-S’85-M’87) was born in Brooklyn, NY, on November 26, 1960. He received the B.S.E.E., M.S.E.E., and Ph.D. degrees from Purdue University Lafayette, IN, in 1982, 1984, and 1987, respectively.
From 1980 to 1981 he served as an engineering co-op with Magnavox Government and Industrial Electronics Company. From 1981 to 1983 he was a Design Engineer for the Laboratory for Applica- tions of Remote Sensing (LARS) at Purdue Univer- sity and was involved with spectral measurements
of crop canopies for the LANDSAT project. In 1983 and 1986 he was employed with Harris Corporation, Melbourne, FL, where he developed wide-band microwave amplifiers and performed satellite communication systems analyses. From 1984 to 1988 he was with the Engineering Research Center for Intelligent Manufacturing Systems at Purdue University and was Manager of the Autonomous Guided Vehicle (AGV) Project in 1987 and 1988. In 1988, he joined the Electrical Engineering faculty of Virginia Polytechnic Institute and State University Blacksburg, VA where he is an Assistant Professor with the Satellite Communications group. He is conduct- ing research in the areas of factory transport and communications, RF propagation, and satellite communications. He is particularly interested in characterizing radio wave propagation and developing robust antimultipath communication techniques for wide-band indoor radio networks.
Dr. Rappaport is a member of ASEE, NSPE, Tau Beta Pi, Eta Kappa Nu, Phi Kappa Phi, and is a life member of the ARRL.