Embed Size (px)
Citation preview

3.2 TUBE SHEET ANALYSIS
3.2.1 DISCUSSION OF LOADING
The loading which was applied to the three dimensional model used in this
study originated from the pressure history data previously described in
Section 2.0. The pressure-time history was obtained for the primary coolant
fluid, at the inlet and outlet sides of the primary face of the tubesheet.
The break was applied in the loop analysis at the steamgenerator coolant
outlet nozzle,.and the flou from inlet to outlet side of the tubesheet
was considered through an average tube. This is defined as that tube
whose total length is the mathematical average of the length of all the
tubes.
Figure 3.2-1 shows these time histories, and also that of the secondary
side pressure, which is assumed to remain at an operating level of 964
psia throughout the transient. This figure provides the pressure differential
considered to the worst case.
It can be seen that the primary outlet side experiences a step decrease
in pressure of 1200 psi, while the primary inlet and secondary side pressures
remains unchanged, within the first seven milliseconds.
Figure 3.2-2a shows the model, with the pressure loads at time equal to
0.0 seconds; Figure 3.2-2b shows the pressure loading at a time of 0.007
seconds, that time corresponding to the end of the step decrease. This
latter representation, however, is not the loading which was statically
analyzed. Due to the dynamic nature of the load, the pressure drop was
amplified by a load factor of 2, this magnitude being defined in standard
dynamics texts, e.g. Reference [15]. As a result, the three-dimensional
model was statically loaded as shown in Figure 3.2-2c.
Due to the nature of the load, LOCA is defined as a Faulted Condition.
Reference [10] prescribes that only stresses categorized as primary need
be considered for Faulted Conditions. A uniform temperature of 600'F was
designated as the reference temperature.
3.2-1

3.2.2 COMPUTATIONAL MODEL
The analysis of the Model D tubesheet under the LOCA loading was performed
coe[16] with the ANSYS computer code . The model used was a three dimensional
structure, consisting of the channel head, divider plate, tubesheet and
stub barrel, (see Figures 3.2-2 through 3.2-4). Each of these component
parts was represented by finite, flat, triangular shell elements. Interaction
between these parts was obtained by coupling the displacements of common
node points along their boundaries.
The corresponding three dimensional ANYSYS model is shown in Figures 3.2-5
through 3.2-13. As can be seen from these figures, the property of symmetry
was employed and only half the structure was modeled.
In making the transition from the actual components to the three dimensional
ANYSYS model, several assumptions were made. These were:
1. The penetration pattern of the model is a circular penetration area.
In actuality, the Model D tubesheet penetration area is not circular,
but contains several unperforated regions.
2. The U-tubes of the Model D steam generator are rolled into the entire
thickness of the tubesheet, resulting in a stiffening effect on
the tubesheet. In the calculation of the effective plate elastic
constants, this fact was neglected.
3. It was assumed that the tubesheet would react to the LOCA loading
primarily in one degree of freedom, that is, in the direction normal
to its plane. This, however, was not a limitation which was imposed
on the model, but rather a method of considering the application
of a static load case representing the actual dynamic load history.
The finite element model incorporates the material properties of each
of the component parts. The channel head is a carbon steel casting, designated
SA-216 Grade WCC. Its material properties which are of interest in this
study are the modulus of elasticity, E, and Poisson's Ratio v.
3.2-2

Values of these properties at 600°F [10 are:
E = 25.7 x 10⁶ psi
v = 0.3
The stub barrel is formed from low alloy steel plate designated SA-533
Grade A, Class 2. Its E and v properties [0], are identical to those of
the channel head.
The divider plate is a nickel-chrome-iron alloy, SB-168. Its material
properties are 6000F[12] are:
E = 29.2 x 10⁶ psi
v = 0.3
The tubesheet is manufactured from an alloy steel forging designated SA-508
Class 2. The basic properties of the material are obtained from Reference
[10]. However, the existence of the perforations necessitates modifying
the elastic constants, so that the model employs an "equivalent" solid
plate. The method used for this modification is described in Article A-8000
of Reference [10] and Reference [17]. Specifically the equivalent solid
plate constants (denoted by an asterisk) imposed on the model were:
E*= 0.43E = 11.05 x 10⁶ psi
S= v = 0.3
3.2.3 STRESS LIMITS
The limitations on the tubesheet stresses induced by the LOCA loads, are
those stress intensities categorized by Reference [10] as Primary in nature;
i.e. Primary Membrane (PM) and Primary Membrane plus Primary Bending
(PM + P B).
The Primary membrane stress, in relation to a perforated plate, is the
stress averaged across the ligament minimum width and through the thickness
3.2-3

of the plate. Also, the Primary membrane plus bending stresses, are those
averaged across the ligament minimum width, but not through the thickness
of the plate.
The stress limits imposed on the tubesheet under Faulted Condition limits
are provided in the Appendix F Criteriat ll]. For an elastic system
with an elastic component analysis, the stress limits for nuclear components
are:
P < the smaller of 2.4 S or 0.7 S m m u
P + PB < the smaller of 3.6 S or 1.05 S m Bm u
where
P = Primary Membrane Stress, psi m
PB = Primary Bending Stress, psi
S = Allowable Stress Intensity at temperature , psi m
S = Ultimate stress from engineering stress-strain curve, U
at temperature, psi
The above limits assume a Shape Factor of 1.5 for the ligaments.
The values of these limits for the tubesheet material (SA-508 Cl. 2) at
600'F, for mechanical properties of,
S = 26.7 ksi m
S = 80.0 ksi U
are calculated as:
P < 56.0 ksi = 0.7 S S+ - 0U
S--B 84.0 ksi = 1.05 Su
3.2-4

3.2.4 RESULTS
The results of the elastic analysis of the tubesheet of the Model D
steam generator under the non-symmetric LOCA loads indicate that the stress
intensities are within prescribed elastic limits.
The maximum Primary membrane plus Primary bending stress intensity occurs
on a ligament on the secondary side of the inlet portion of the tubesheet,
in the region defined by element 133 of Figure 3.2-17. The magnitude
of this stress intensity is 25,200 psi and is well within the limit of
84,000 psi, for this stress category.
The maximum Primary membrane stress intensity can be found in the region
of elements 107 and 108. These elements correspond to the region close
to the center of the tubesheet--divider plate area, on the inlet side.
The stress intensity was found to be 8,320 psi, much below the limit of
56?000 psi.
3.2.4.1 Effects of Individual Loads on Tubesheet
1. Pressure History
From the analysis of the model of the complete lower end of the steam
generator, as shown in Figure 3.2-5, only the results affecting the tube
sheet will be discussed. To further clarify the results, extra data is
presented in the figures to display the general nature of the effect of
LOCA loads and to substantiate expected trends. However, the basic objective
of the tubesheet analysis is to show that the stresses developed under
faulted conditions are below the limits specified in Section 3.2.3.
The perpendicular displacements of the tubesheet under the LOCA loading
are shown in Figures 3.2-14 and 3.2-15. The first figure displays the
shape of the tubesheet deflections, as they are plotted along a diameter
and are relative to the tubesheet center. When comparing the inset in
the figure, which shows the relative magnitudes of the pressure loads,
3.2-5

the tubesheet displacements is presented as expected. Figure 3.2-15 pre
sents an isogram of the tubesheet deflections. This figure represents
the tubesheet displacements in the middle surface of the tubesheet, as
it appears in plan view.
The calculated equivalent bending stresses in the tubesheet are shown
in Figure 3.2-16. This figure shows the radial stress in the tubesheet
along a diameter perpendicular to the divider plate. As shown in the
figure, the bending stress on the primary face of the tubesheet are
generally compressive for that side on which the primary pressure dominates.
On the outlet side of the primary face, the loading is dominated by the
secondary side pressure, and the bending stresses on this side of the
primary face are generally tensile. The stresses on the secondary face
behave in the manner shown, which would be the predictable pattern when
considering the pressure loads as shown in the inset diagram.
The irregular stress pattern at the center of the tubesheet is due to
several-factors. In this region, the model reflects the change in material
properties, as displayed by the divider plate and the perforated tube
sheet. In addition, there is an abrupt change of element caused by the
attempt to accurately model this region. Both of these factors attenuate
the results of the bending moment induced on the nodes in that area by
the divider plate. Nevertheless, the general trend of the plots, especially
that of the primary face, follows the expected pattern that would be caused
by the pressure distribution used in this analysis.
Article A-8000 of Reference [10] provides stress analysis techniques for
analyzing perforated plates. By modifying this method, due to the non
axisymmetric nature of the loads, the relationships of A-8142.1 can still
be applied by considering the principle stresses a and a m in place max min
of a and ae' which are the equivalent solid plate radial and tangential r
stresses respectively. To obtain the ligament stresses on the tubesheet,
the principle stresses were studied along six radial lines, as shown in
Figure 3.2-17. Element stresses for the primary face, secondary face
and midsurface regions of these lines were employed to calculate the
3.2-6

ligament stress intensities. Correlated by line number, Figures 3.2-18
through 20 are the ligament stress intensities due to the affect of the
LOCA loading.
2. Tubesheet Response due to SSE and LOCA
The total transverse seismic force acting on the tubesheet is given by
the product of the vertical acceleration and the mass of the tubesheet,
plus the vertical reaction of. the tube bundle.
The weight of the tubesheet, including enclosed primary water, is 65,300
pounds (169 lb-sec 2/in). The maximum relative tubesheet acceleration
and tube bundle reaction were computed from the response spectrum analysis
and are given in Table 3-2-1. The absolute acceleration of the tubesheet
is obtained by adding the relative acceleration to the maximum vertical
acceleration at the steam generator support points. The latter value
is obtained from the response spectrum curve, Figure 2.3-1.
The maximum equivalent transverse bending stress a that is expected to occur in the tubesheet during the SSE is computed by equation:[18]
3(3+v) 2 S= 82 pr
8h2
where
p= uniformily distributed transverse load
r = 68 in., radius of tubesheet
h 21 in., thickness of tubesheet
v 0.2, equivalent Poisson's ratio
The above equation is based on the tubesheet being represented as a simply
supported equivalent solid plate subjected to a uniform load. Since in
reality, the tubesheet is partially constrained along its boundary, the
stress computed by the simply supported formula is expected to be greater
than the actual value. The maximum equivalent transverse bending stress,
computed by the simply supported formula, is given in Table 3.2-1 as 126
psi, which is negligible.
3.2-7

Support movement of the steam generator due to blowdown forces, is of
the same order at magnitude as that due to SSE. Consequently, stresses
in the tubesheet induced by LOCA loads are also considered negligible.
3.2-8

TABLE 3.-2-1
SSE TUBESHEET ACCELERATIONS
Horizontal Acceleration
Component of Earthquake Motion
Relative vertical 2 acceleration (in/sec )
Support vertical 2 acceleration (in/sec-)
Absolute vertical 2 acceleration a(in/sec-)
Tube bundle reaction R (lbs)
TUBESHEET
x
10
-0
10
5020
y
8
0
8
4290
Vertica1 Acceleration
z
142
206
348
74700
SSE SEISMIC STRESS
Mass of tubesheet, m = 169 lb-sec 2/in
Total transverse load P ma + R = 145,864 lbs
Total distributed load p 10.04 lb/in2
Maximum equivalent transverse bending stress = 126 psi
160
206
266
84010

6443-
2400
2200
2000 STEAM GENERATOR PRIMARY INLET NOZZLE SIDE
1800
"" 1600
I 400
STEAM GENERATOR PRIMARY 1200 OUTLET NOZZLE SIDE
SECONDARY PRESSURE
1000
0 0.01 0.02 0.03 0.04 0.05 0.06
TIME (SECONDS)
Figure 3.2-1 Pressure History at Tube Sheet During LOCA

1 27AA2244
964
(A)
Pressure loads at t=0.0 sec,
1 CZ r, 2273
964
(C)
964
(B)
Pressure loads at t=0,007 sec.
Determination of static model
pressure shown in (C)
1) 2244-1044=1200
2) Equivalent static pressure
differential, using DLF:2.0,
=2.Oxl 200=2400
3) Therefore, pressure in
outlet pl enum:+2244-2 4 0 0 =-156
Pressure loads applied to static elastic model
Figure 3.2-2 Pressure Loads Due To LOCA
2273 2273

Figure 3.2-3 Channel Head, Tubesheet and Divider Plate Assembly

2.25 (REF). . . TUBE LANE
1.0625 (Lq§L)PRI. SIDE 0.248 (HIN) SEC SIDE
SECTION A-A
(0
Figure 3.2-4. Tube Sheet-Channel Head-Stub Barrel Assembly Dimensions

Orientation of Model
Figure. 3.2-5 3-D ANSYS Model of (1) Divider Plate, (2&3) Tubesheet, (4) Channel Head and (5) Stub Barrel.

55
57
7
besheet Interfac
Figure 3.2-6 Node-Points, Divider Plate Portion of 3-D ",\4SYS i'liodel
53I 45 _-
a4
61
/
I65
-�
35
Syc try TuTut

Tubesheet Interface
Figure 3.2-7 Elements, Divider Plate Portion of 3-D ANSYS Model

KEY TO MATERIAL NUMBERING i Divider Plate
2 - Perforated Plate Properties
3 - Unperforated Plate Properties
Figure 3.2-8 Tubesheet Properties, 3-D ANSYS Model
67
53
3"3
(A 0) -c U
(A
-o
0) 0)
-c (A 0) -o I-
-I -68.

67
53
39)
N/118& m I\1/I
'J \ , /it'\I/Ik/
/173 //10 "'3"--• / I\A•
"--.. l .id8
-1 _;Sy175 mmetry:.... I ne.I 1,;IJ
SSmetry Line
1i0
13138
130 / ..
135
134
133
* 123--. 32)
V5. b qu. U bq. '
Tubesheet Radii, Inches
itDivider Plate
Node Points, Tubesheet Portion of 3-D ANSYS Model
(A 0) -c U C
-4
(A
-ti It,
4.) 0) �1)
(A 0) -o I-
Figure 3.2-9

I
67
. 53
/
(.1 2) V
= 141
LI
4-4
243
-oyiern!ie ~ vie
122 1 o
-a.-54. 4 27.. T ut Symme6try Line
~Divider P
Finure 3.2 1-10 Elements, Tubesbeet Portion of 3-D ANSYS Model
I ate
l a "1 ... ..

C
rt�
ca
CL
(Dl
0
(D
ro~ Ff
j/Liz
I-.)
r
ru 4.>
pa
V
F
I-.)
FV
'*�) -.--
K
a.')
V
a'., -
VF\
Cý
rI- I
rT

11 itt
.~~4 1*j
:. 4 ~429 42 42 ' 1 2'1 141 149I U
- 149 '2 ~ 4~44 4 I I4
33931 83l f 37 37 37 37 3 13
3 3'30 302 185 8 3 37 3 3
P.0 335 ~35 3J45 34 30~ 344 31 q 4.3 33
~35 /35 35 351 35} ! 347 34l 3143 '6 33 335 'D
2 3 3)? 31 31 3i5 314 311 3t0 307 306 30 302 2
2Si 4 321 3317 3t 303 31 309 30 305 3(10 3 2 93
_29 _ 7 8~ 269 200 26*. 1 - __
ST 24 20 .27 7 276 27 3 2712 6
Elements, Channel Head Portion of 3-D ANSYS ModelFigure 3.2-12

LRPOW sAsNv a-c JO UOGjOd loAApg qnjS CL-Z-C ;a.An6Lj
SUOLIP301 VaWOU
SUOIIPDOI lulOd aPON
1 14
M t t v --- Ts 4 -71 t I
I T- av --- r E i -- Tc b -ý,T 4 -jc t, ai i
-ZT tgn
N, t WM 79 t -- T9 4 9 h
-2v i -- D -- T It fl h ff 11 h
DUKOI -rt, b _72, --- W b
111 of OR; -Tu v -- 19Dý --- 3o v 0 ---- Bob

0.015
BREAK LOCATION
OUTLET 0.010ILT
S0.005 (REF. FIG. 3.2-2c)
INLET SIDE
do= OUTLET SIDE
I-
LLi LLi
-t
S-0.005
.-
-0.010
-0.015 I I -70 -50 -30 -10 0 10 30 50 70
TUBESHEET RADII (INCHES)
Figure 3.2-14 Tubesheet Deflection Due to LOCA Perpendicular to Divider Plate (I

Figure 3.2.-15. Tubesheet Perpendiculr Displacement

ý.4,.
INLET
PI>P2>O>P3 (Ref. fiq. 3.2-2C)
BREAK-' LOCATION
0
-5
10
Figure 3.2-16. Tubesheet Equivalent Plate Stresses-Radial Stress Perpendicular to Divider Plate
OUTLET
I~ i � 1 I Primary Face I II ~ ~II~ Secondary Face- --Sii Ii]ii ii! Middle Surface----------.
-10 0 10 30 50
TUBESHEET RADII, INCHES
0 3
.3
Cl)
U') (I')
A 4',

LINE 4LINE 3
67
194
53
•-23• 2 31 17(1
a)-2-8_2_7 2. U)l
TueheUdi LINEe 5 LINE
23y 234 3e
0) 2 -24
.04
u. 2 2
-Gd; -54.11 -43 . 2. -T be h t a ~ r i e ~SymhitryL~re LIN
Figur 3. . 1 . R d i o1hi h L g40 t e se e e C l u a e
!

Unperforated Divider Lane
26 24 ~Mebrane (P
22' ,:: ~i'rimary Face (Pm'Pb.
Secon4jry Face. (m+PB) 20
Note: o.Refer' tojFigure 3.2 !,,or .1oca,O't 18 .. .. of , ines'.-" " • . '
- 16
I-I11 •'LINE 61 14
12 I- 1I0
8
6
4
2
0 -50 -40 -.30 -20 -1 0. 0
TUB3ESHET RADII, INCIES
Ligament Stress Intensities
20. 30 40 50
Figure 3.2-18

18
16 l
14 LINEA
12
10
8
6
4
2
0 -60 -50 -40 -30 -20 -10 0
TUBESHEET RADII, INCHES
Figure 3.2-19 Ligament Stress Intensities
m-mu rane ' •rm)
Primary Face (PrM + Pb)
Secondary Face (Pm + P B)

Primary Face (Prm + Pb)
-Secondary Face (Pro + PB
Note: Refer to Figure 3.2-17 for location
-40 -30 -20 -10 10
TUBESHEET RADII, INCHES
Unperf orated Divider Lane
10 20
Ligament Stress Intensities
V)
LLi
U
L/)
20
18
16
14
12
10
8
6
4
2
0-50 30 40 50
Figure 3.2-20

3.3 DIVIDER PLATE ANALYSIS
This section describes the stress analysis at the Model-D steam generator
divider plate during LOCA. In accordance with ASME Code, Section III, the
divider plate is not a primary to secondary pressure boundary. However,
the structural integrity has been investigated in order to show that no
failure will occur resulting in damage to adjacent boundaries.
3,.3, 1 APPLIED LOAD
The calculated pressure history which was applied as a differential pressure
across the divider plate, is shown in Figure 3.3-1. This pressure history
was calculated with a modified version of the BLODWN-2 code which accounted
for the effect of divider plate flexibility on the hydraulic transient
(hydro-elastic effects). As a result, the pressure-history takes into
account the change in volume of the steam generator inlet and outlet plenums
during deformation of the divider plate. The actual volume change of
the plenums, as calculated by the stress analysis, was higher than the
calculated volume change in the BLODWN-2 hydro-elastic model. Hence the
applied load is conservative. The load used in the analysis (Figure 3.3
2) neglects the perturbations in the calculated load (Figure 3.3-1). Since
the amplitudes of the perturbations are substantially less than the max
imum load, the gross response of the structure is not affected. The effects
of support movement due to LOCA and SSE were neglected, since the tubesheet
and channel head complex is very stiff and the resultant forces on the
divider plate wili be small inertial forces.
3,3.2 STRUCTURAL MODEL
The method of solution for this analysis is based upon computer code W
PETROS III Bl19,20]. The code is a finite difference program for the cal
culation of large elastic-plastic dynamically-induced deformation of plates
and shells, Figure 3.3-3 illustrates the finite difference mesh along
with boundary conditions, The model is structured such that the area
containing non-uniform mesh spacing is in a region of low strains.
3.3-1

3.3.3 MATERIAL PROPERTIES
The appropriate material (SB-168) properties are experimental values ex
tracted from Reference 121]. Figure 3.3-4 illustrates the engineering
stress-strain characteristics. The S value which is used to determine u
the limit on primary stresses is derived from these curves in accordance
with ASME Section III requirements, as follows:
S' nominal from curves = 94 KSI U
S' nominal from curves = 38 KSI y
S code value = 27.9 KSI
y
S 27.9 S = S' x =- 94 x2 = 69 KSI
u u 38 y
Figure 3.3-5 is the corresponding true stress-strain data and Figure 3.3-6
is the aluj•tet true stress-strain curve used in the analysis. Other
material properties (at 600*F) used in the analysis are:
E = 29.2 x 10⁶ PSI
S= 0,3
ib-sec 2
p = 0.00074 4
in
3.3.4 RESULTS OF ANALYSIS
The limit for primary membrane stresses under faulted conditions is defined
as 0,7S = 0,7(69) - 48.3 KSI. The maximum primary membrane stress dis
tribution at the junction of the divider plate to the tubesheet is shown
in Figure 3,-3',7, The maximum of 27 KSI occurs at the center of the tube
sheet and compares well with. the limit.
The membrane stress history of the center point of the divider plate is
shown in Figure 3.3-8, The maximum stress is 36 KSI and is in the direction
3.3-2

of a parallel to the line of symmetry. This also compares well with the
limit. Stresses along the curved edge of the divider plate will be sig
nificantly less due to the curvature.
The divider plate attains a maximum displacement of 7.4 inches after 40
msec. into the applied transient loading (See Figure 3.3-9). Since the
maximum pressure occurs at 32 msec., this indicates that there is some
dynamic effect. The displacement contours at 40 msec. are shown in Figure
3.3-10.
3.3-3

0 10 20 30 40 50 60 70 80 90
TIME AFTER BREAK (MSEC)
FIGURE 3.3-1 Pressure Difference Across Divider Plate (0 CO 10 01n
1200
1000
C,,
C
-4
Iw Lii ULL
Lii
C,, C,) Lii
800
600
400
200
0
-200

6899-6
1000
800
S600
LL. U
CM 400 C,,
LU
200
0 I I I 0 10 20 30 0.0 50 60 70
TIME AFTER BREAK (MSEC)
FIGURE 3.3-2 Smoothed Pressure History Across Divider Plate

6899-1
TUBESHEET LINE FIXED EDGE
0 10 20 30 40 50 60 70 80
Divider Plate - Finite Difference Mesh Model
0
I0
20
30
40
50
I-u-i
0
u
,,I
60
70
80
90
FIGURE 3.3-3

6899-2
I00
90 A
80 "-o 2 & 3 ._
_70
6- 60
S50
W, LEGEN, D
.=,,.
2' 30 CURVE I TEST AL-8
- 30 CURVE 2 TEST AL-3 UJ.'
CURVE 3 TEST AL-7 CURVE A AVERAGE
20
10
0 1 1
0 0.1 0.2 0.3 0,. 0.5
ENGINEERING STRAIN
Engineering Stress-Strain Curves for inconel at 600°FF-IGURPE 3.3-4

6899-3
180
160 -A
140
120
IOO
- 100
LEGEND c/3
LUCURVE I TEST AL-8 S80 -CURVE 2 TEST AL-3
CURVE 3 TEST AL-7 CURVE A AVERAGE
S60
40
20
0 I I 0 0.1 0,2 0.3 0.4 0.5 0.6 0.7 0.8 0.9
TRUE STRAIN
FIGURE 3.3-5 True Stress-Strain Curve for inconel at 6000F

140
120
100
80
60
'.O
20
00 0.1 0.2 0.3 0.11 0.5 0.6 0.7 0.8
REDUCED TRUE STRAIN
FIGURE 3.3-6 Reduced True Stress - Strain Curve for Inconel at 600°F
6899-4
ev, 0
Co a
Co Co LjJ
ICo
LJJ
I
u-A
32
28
24
20
16
12
8
4
0TUBESHEET LINE
FIGURE 3.3-7 Maximum Membrane Stress at Tubesheet Line
6899-9
0
C,,
-.J
0

6899-10
I0 20 30
TIME AFTER BREAK (MSEC)
40 50
FIGURE 3.3-8 Membrane Stress History at Point of Maximum Deflection on Divider Plate
40
36
32
28
24.
20
16
12
O0
C,,
C/13
I.-
0
8
4
00

10
8
LJJ
LLJJ
C-3
CL.
6
2
00 10 20 30 40 50
TIME AFTER BREAK (MSEC)
FIGURE 3.3-9 Displacement History of Point of Maximum Deflection, in the Center of the Divider Plate
6899-7

6899-8
TUBESHEET LINE
KEY
NO. INCHES
I 0.50
2 1.00
3 1.50 4 2.00
2.50 6 3.00 7 3.50
8 4.00 9 4.50
10 5.00
1 5.50
12 6.00
13 6.50 14 7.00
FIGURE 3.3-10 Displacement Contours at Maximum Pressure Differential, For Divider Plate
C,,
U0
LU z~

4.0 CONCLUSIONS
The structural integrity of the tubes, divider plate, and tubesheet
of current Westinghouse steam generators is assured during a Loss of
Coolant Accident at the steam generator coolant outlet nozzle in
combination with a Safe Shutdown Earthquake. The criteria used to
evaluate these components under this Faulted Condition are those of the
1971 ASME Section III Code, Appendix F. In addition, this study
establishes the minimum allowable tube wall which can sustain these
conditions (.026 in wall, for the model D) and that the critical flow
size on a Model D tube after forty years life (0.036 in wall) is
0.64 ins.
The following is a summary of maximum calculated stresses in the
components, compared with the code allowable limits.
Maximum Section III
Component Stress Calculated Limit Category Stress Intensity (KSI)
(KSI)
TUBE Pm 16.79 52.5 (.036 in wall) Pm + PB 55.0 78.75
THINNED Pm 23.0 52.5 TUBE
(.026 in wall) Pm + PB 75.1 78.75
TUBESHEET Pm 8.32 56.0
Pm + PB 25.2 84.0
DIVIDER Fm 36.0 48.3 FLATE
4.0-1

The calculated collapse pressure for the .036 in. wall tube at
600OF is approximately 3000 psi for 0% ovality and 1830 psi for
the maximum allowable 5% ovality. These are higher than the
maximum expected secondary side pressure minus containment
back pressure.
4.0-2

5.0 REFERENCES
1. Fabic, S. "Description of the BLODWN-2 Computer Code," W.CAP-7918,
October, 1970.
2. Bordelon, F. M. "A Comprehensive Space-Time Dependent Analysis of
Loss-of-Coolant (SATAN-4 Digital Code)", WCAP-7750, August, 1971.
3. Fabic, S. "Loss-of-Coolant Analysis: Comparison between BLODWN-2
Code Results and Test Data", WCAP-7401, November, 1969.
4. Moore, J. S. "Westinghouse PWR Core Behavior Following a Loss-of
Coolant Accident", WCAP-7422, August, 1971.
5. Dingwell, I. W., Bradshaw, R. T. "Static, Thermal, Dynamic Pipe
Stress Analysis Operating Manual", Arthur D. Little, Inc.
6., Greenstadt, J. "The Determination of the Characteristic Roots of a
Matrix by the Jacobi Method," in "Mathematical Methods for Digital
Computers," edited by Anthony Ralston, Chapter 7, pp. 84-91,
Whiley, New York, 1960.
7. "Reference Safety Analysis Report", RESAR-41, Westinghouse Nuclear
Energy Systems, December 1973, Chapter 5, pp. 5.2-38 - 5.2-42.
8. Smith, P. G. "Earthquake Analysis of Structures by the Response Spectrum Method," WCAP-7648, February 1971.
9. STASYS-2 User's Manual WCAP-7651, Westinghouse Electric Corporation, March 1971.
10. ASME Boiler and Pressure Vessel Code Section III, Nuclear Power Plant Components, 1971 Edition.
11. "Rules for the Evaluation of Faulted Conditions", Proposed
Appendix F of the ASME Section III Code.
12. ASME Code Case 1484.
13. Roark, R. J., "Formulas for Stress and Strain," McGraw-Hill Book
Company.
14. Eiber, R. J. et al, "Investigation of the Initiation and Extent of
Ductile Pipe Rupture," BMI-1866, Battelle Memorial Institute, July 1969.
5.0-1

15. Flugge, W., Handbook of Engineering Mechanics, 1962.
16. Swanson, J. A., "Engineering Analysis System (ANSYS) User's Manual,"
Swanson Analysis Systems, Inc. 1971.
17. O'Donnell, W. J., "A Study of Perforated Plates with Square Pene
tration Patterns," WRC Bulletin #124 September, 1967.
18. Timoshenko, S. P. and Woinowsky-Kreiger, S., "Theory of Plates and
Shells", McGraw-Hill, 1959, p. 57.
19. Atluri S., Witmer, E. A., Leech, J. W., Morino, L., "PETROS III
A Finite Difference Method and Program for the Calculation of Large
Elastic-Plastic Dynamically - Induced Deformation of Multilayer
Variable - Thickness Shells", MIT, ASRL TR 152-2, November, 1971.
20. Rinne, W. A., "Explanatory Manual for Utilization of the W PETROS
3B Computer Code", WTD-ASM-73-025, November 1973.
21. Iorio, N., "Tensile Properties of PWR Materials", TD-MET-73-054,
1973.
5.0-2

APPENDIX A
ADDITIONAL INFORMATION

UNITED STATES
ATOMIC ENERGY COMMISSION WASHINGTON. D.C. 20545
AUG 1 2 1974
'Mr. Romano Salvatori, Manager Nuclear Safety Department Westinghouse Electric Corporation P. 0. Box 355 Pittsburgh, Pennsylvania 15230
Dear Mr. Salvatori:
In order that we may complete our review of Westinghouse Electric Corporation topical report WCAP-7832 (Non-proprietary) entitled "Evaluation
of Steam Generator Tube, Tube Sheet and Divider Plate Under Combined LOCA
Plus SSE Conditions," additional information is required. Enclosure 1 identifies the required information.
After the requested information has been received, a schedule for completion of review of WCAP-7832 will be established.
If you have any questions concerning our request for additional information, please contact us.
D. B. Vassallo, Chief Light Water Reactors Project Branch 1-1 Directorate of Licensing
Enclosure: Request for Additional
Information on WCAP-7832
AUGI 9 1974
R. SALVATORI

MECHANICAL ENGINEERING BRANCH
DIRECTORATE OF LICENSING
REQUEST FOR ADDITIONAL INFORMATION
TOPICAL REPORT: WCAP-7832
EVALUATION OF STEAM GENERATOR TUBE, TUBE. SHEET AND DIVIDER PLATE UNDER COMBINED LOCA PLUS SEE CONDITIONS
1. The steam generator described in RESAR-3 contains a preheater section
consisting of a baffle plate and tube support plates attached to the
baffle and to the steam-.generator shell. In Section 2.3 of WCAP-7832
this sub-stxucture is apparently not included in the seismic model of the
steam generator. Discuss the effect-.of this structure on. the response
of this model
In Section 3.1
_a. Provide a description of the comput-er program.-STACYS used in the
tube analysis.
b. Provide the basis for the assumed 40 year-tube thirning.
c. Provide a reference or additional data on crack-propagation tests
on tubes loaded by combined internal pressue-m•-ax•ia bending
moments.
d. Provide a reference or additional data on the -tube collapse tests,
and the .analytical correlation and. analysis on=-whch the. extrapolation..
of test results to .tubes= of different yield strength and wall thickness
is--based.-
P
2.
A.
p. •+;

B. a. Describe the analyses eployed to assess the effect of a postulated
steam line break on the steam generator tubes and provide a
summary of the results.
b. Describe the analyses employed to assess the effect of a postulated
break at the feedwater nozzle on the preheater substructure and
provide a summary of the results.
c. Discuss the effects of local thinning due to wear and local crud
accumulation at the tube supports on the burst strength of the tubes.,
d. Identify the method by which corrosion phenomena were considered in
assessing the fatigue strength of the tubes.
3. a. Provide justification.for using different pressure-time histori
in the tube sheet analysis and the-divider-plate-analysis.
es
b. Provide a comparison of the maximum deflection and stress in th•
divider plate as calculated from ANSYS and PETROS.
e _
...--- *. .
°.
-V,
-t .-..
* 4 --.� .�, 'i�x�rws
- 'F.. *X.4..S...,.. r.C ..- v=. � � -t-,L,-t,'r"- r-�- � -,.-
: 77....
-I
I I
�.4< -. 5
p..,..
F.

October 31, 1974 Ns-pt -453
Mr. D. B. Vassallo, Chief Light Water Reactors Project Branch 1-1 Directorate of Licensing United States Atomic Energy Commission Washington, D.C. 20545
Dear Mr. Vassallo:
Enclosed are 15 copies of the additional information. requested in your letter of August 12, 1974 in order to complete your review of 14estinghouse Electric Corporation topical report WaP?-7S32 (non-proprietary) entitled "Evaluation of Steam Generator Tube, Tubesheet mnd Divider Plate under Combined LOCA Plus SSE Conditions."
WCAP-7832 presented an analysis of the steam generator structural integrity to demonstrate its capability to sustain stresses resulting fro= kimultneous LOCA and SSE loading conditions. Detailed discussion and analysis of other postulated chemical, matallurigical or mechanical considerations durinoperation are beyond the scope of this report, but may be referred to in the individual SAR!s. :H-owever, for purposes of additional clarification responscs to questions 2Ac, 2Ad, 23a, 2Bb, and 2Bc of your August 12, 1974 letter have been included in the attach=ent.
We request review of the attached information and establishment of a schedule for the completion of review of WCAI-7332.
We request consideration of WcA?-7832 and the additional information of the attachment in conjunction with future safety analysis report references.
Sincerely yours,
W9 1
Nuclear Safety Depaitment
S©Ic
Attachment
/
/

C C7
UNITED STATES
NUCLEAR REGULATORY COMMISSION
S...WASHINGTON, D. C. 20555
NOV 12 1975
Mr. C. Eicheldinger, Manager Nuclear Safety Department Westinghouse Electric Corporation P. 0. Box 355 NOV1 7 1975 Pittsburgh, Pennsylvania 15230
C. EICHELDINGER
Dear Mr. Eicheldinger: PWR NUCLEAR SAFETY
To cariplete our review of Westinghouse Electric Corporation report WCAP-7832 (Non-proprietary) entitled, "Evaluation of Steam Generator Tube, Tube Sheet and Divider Plate Under Canbined LOCA Plus SSE Conditions", additional information is required. The required information is identified in Enclosure 1.
To meet our review schedule, we need this additional information by December 19, 1975. If you cannot meet this schedule, please inform us within ten days after receipt of this letter of the date you plan to submit your response.
If you have any questions about our request for additional information, please contact us.
Sincerely,
D. B. Vassallo, Chief Light Water Reactors
Project Branch 1-1 Division of Reactor Licensing
Enclosure: Request for Additional
Information

. |v
ENCLOSURE 1
IMECHANICAL ENGINEERING BRANCH
OFFICE OF NUCLEAR REACTOR REGULATION
REFUEST FOR ADDITIONAL INFORMATION
WESTINGHOUSE REPORT: WCAP-7832
EVALJATION OF STEAM GERATOR TUBE, TUBE SHEET AND DIVIDER PLATE UNDER COMBINED LOCA PLUS SSE CONDITIONS
1. Regarding your reply to Item 2.B.d of our request for additional information, dated August 12, 1974, explain the increase in strength of service exposed tubes with no intergranular corrosion as compared with tubes of origin material, as shown in Figure VII -5 (p. 24d) of your reply.
2. (a) Define the term "stress intensity."
(b) Show that the maximum '"membrane plus bending" stress intensities in healthy and thinned tubes are lower than the allowable stress limits when effects due to normal and upset operating conditions, such as flow induced vibration and vortex shedding, are included in the analysis.
3. (a) Indicate the allowable stress limit in membrane plus bending for the divider plate material.
(b) Indicate the location in the divider plate where the maximum membrane plus bending stress intensity occurs, and show that it is below the limit in part (a).
C
Westinghouse Power Systems PWR Systems Division
Electric Corporation Company Box 355 Pits~urg Parsylvania 15230
December 19, 1975
Mr. D. B. Vassallo, Chief NS-CE-885
Light Water Reactors Project Branch 1-1 Division of Reactor Licensing Attn: Mr. Raymond R. Maccary Assistant Director for Engineering Division of Systems Safety Office of Nuclear Reactor Regulation United States Nuclear Regulatory Commission Washington, DC 20555
Dear Mr. Vassallo:
Enclosed are fifteen (15) copies of the additional information requested in your letter of November 12, 1975 in order to complete your review of Westinghouse Electric Corporation topical report WCAP-7832 (non-proprietary) entitled "Evaluation of Steam Generator Tube, Tubesheet and Divider Plate under Combined LOCA plus SSE Conditions."
WCAP-7832, submitted in December 1973, presents a detailed analysis of the steam generator structural design to demonstrate its capability to sustain stresses resulting from simultaneous LOCA and SSE loading conditions. We trust that your review of this added information will provide the desired clarification.
Your letter referred to your review schedule for this WCAP. Westinghouse wishes to be advised of the details of that schedule. This report has provided much of the material used mutually by the Technical Review Staff and by Westinghouse in the ongoing public hearings dealing with steam generator integrity and is expected to be instrumental to the eventual resolutions reached in those hearings.
Westinghouse considers that timely completion of your review and approval of this document would prove mutually beneficial for its use in safety analysis reports. We request that you consider this desire when setting the schedule for completion.
Very truly yours,
C. Eicheldinger, Manager Nuclear Safety Department
CE/lz Enclosures

Page l of 2
ATTACHMENT
1. Your request for information regarding the apparent increase in strength of service exposed tubes compared to virgin material* is answered as follows. The lead plug tests which were referenced had as their objectives determination of possible significant changes in ductility as a function of surface exposure. All of
the service exposed tubes without cracks came from one tube, and
thus one heat of Inconel. The virgin material, on the other hand,
was also from one different lot of Inconel. Thus the apparent differences in flow strength represent the normal variations in
yield strength exhibited by Inconel 600 tubing. For example, a
review of mill records for HAPD Inconel varied in yield strength
from 38,500 to 65,500. This indicates that considerable variation in yield strength is typical of normal production material.
*Inconel tubing exposed to primary cooling chemistry for one year,
W Forest Hills loop setup.

Page 2 of 2
2a The term stress intensity is defined as per ASME Code paragraph NB-3213.11, Section Ill, 1974.
2b As per Section III of the ASME Code, the Faulted Condition must consider Primary Stresses. The Primary Stresses of LOCA + SSE are the result of the rarefaction wave, the LOCA shaking, and the SSE event. WCAP-7832 and related attachments addressed these stresses. Stresses due to tube vibration at 100% load were not considered in the WCAP due to their relative minor contribution. Investigation of these tube stresses for healthy Series 51 and Model D tubes shows that the maximum bending stresses are less than 3.6 ksi at the top of the U-Bend of the outermost tube. The bending stress due to tube vibration at the top tube support plate for each is 1 ksi. The top tube support is the location of maximum stress due to the LOCA + SSE event, and the addition of this tube vibration stress would produce a negligible effect. This is shown as follows: In a thinned tube this bending due to vibration will result in a stress of 1.6 ksi for a model D tube thinned to .026 "and a stress of 2.2 ksi for a Series 51 tube thinned to .021".
The worst of all the above cases, the thinned Series 51 tube, will result in a total Stress Intensity of 77.3 ksi, this is less than the Section III Code allowable of 78.7 ksi.
3a The allowable stress limit in membrane plus bending for the divider plate material for Faulted Conditions is taken from Appendix F of Section III of the ASME Code and is l.5(.7)(Su) = 72.4 KSI.
3b By virtue of the full constraint at the periphery of the divider plate, the bending stresses in the divider plate are secondary in nature. This categorization of stress is appropriate as it has been shown that the perimeter of the divider plate meets Section III code allowable for primary membrane stress.

ATTACHMENT
ADDITIONAL INFORMATION FOR WCAP-7832 REVIEW
This WCAP presents an analysis of the Steam Generator structural integrity,
as designed, to demonstrate its capability to withstand the combined stresses
of a LOCA and a SSE. Detailed discussion of various off-design situations
and other accidents are not considered germane to that purpose. However,
for additional clarification, responses to questions 2Ac, 2Ad, 2Ba, 2Bb,
and 2Bc have been provided.
AEC Question 1: The steam generator described in RESAR-3 contains a preheater
section consisting of a baffle plate and tube support plates attached to the
baffle and to the steam generator shell. In Section 2.3 of WCAP-7832 this
substructure is apparently not included in the seismic model of the steam
generator. Discuss the effect of this structure on the response of this model.
Reply 1: The seismic mathematical model employed in WCAP-7832, and illustrated
in figure 2.3-2, does not include a preheater section. Baffle plate spacing
is uniform (50 inches) throughout the tube bundle. For a Model D Steam
Generator, baffle spacings are considerably shorter in the preheater region.
Consequently, natural frequencies of tubes in preheater regions are higher than
those of the model employed in WCAP-7832. As a result, tube stresses derived
from seismic inertia loads reported for the tubesheet region in WCAP-7832 are
conservative.
AEC Question 2.A.a.: Provide a description of the computer program STASYS
used in the tube analysis.
Reply 2 A a The STASYS -computer program provides a procedure for the solution
of a large class of one, two, and three-dimensional structural analysis prQblems.
Included among the capabilites of STASYS are static elastic and plastic analysis,
steady state and transient heat transfer, dynamic mode shape analysis, linear
and non-linear dynamic analysis, and plastic dynamic analysis.
The method of analysis used in STASYS is based on the finite element ideal
ization of the structure. The matrix displacement method is used for each
-1-

finite element. The governing equations for each element are assembled into
a system of simultaneous linear equations for the entire structure. A "wave
front" direct solution technique is employed to give accurate results in a
minimum of computer time.
The library of finite elements includes spars, beams, pipes, plane and
axisymmetric triangles, three dimensional solids, plates, plane and axi
symmetric shells, three dimensional shells, friction interface elements,
springs, masses, dampers, thermal conductors, hydraulic conductors, convection
elements, and radiation elements.
SUMMARIZED DESCRIPTION
OF SYASYS
TYPES OF ANALYSES
In this section the various types of analyses available in the STASYS program
are discussed. Included in each discussion are the basic equations being
solved and any other general comments as may be applicable.
1. STATIC ANALYSIS
1.1 Static Elastic Analysis
The static elastic analysis option of the program is used to solve for the
displacements and stresses in a linear elastic structure under the action of
applied displacements, forces, pressures, and temperatures.
Static Elastic.Analysis Theory
The basic equation for the static analysis is
[K] {Ax} = {AF } + {AF I + {AF th (2-1) app pres
where
-2-

[K] is the structure stiffness matrix, which is the sum of
the element stiffness matrices.
{Ax} is the incremental displacement vector due to the applied load
increment.
{AF } is the applied nodal force increment app
{AF } is the nodal force increment due to the applied pres
pressure load increment.
{AF th} is the nodal force increment due to the applied
temperature increment.
For a single load case, the incremental solution is identical to the total
solution, and equation 2-1 becomes:
[K] {x} = {F } + {F } + {F th (2-2) app pres t
Theset of simultaneous linear equations in Equation 2-1 (or 2-2) is solved
by the Wave Front Equation Solver, a direct solution technique. The maximum
number of degrees of freedom on the wave front at any time during the solution
is limited by core storage to about 150.
The resulting solution vector is printed out and used to calculate the
stresses in the elements. If more than one load set acts on the structure,
the incremental displacement solutions are summed and the element stresses
are the total stresses due to all the load increments.
1.2 Static Plastic Analysis
The static plastic analysis option of the program is used to solve for the
displacements, strains, and stresses in a structure or body undergoing plastic
deformation. The solution is limited to problems where the deflections are
small. The boundary conditions may be applied displacements, forces, pressures
and/or temperatures.
-3-

The program uses the Von Mises yield criteria and the Prandtl-Reuss flow
equations. The stress-strain relationship is defined by thd user as a tabular
function of temperature. Unloading and reversed loading is allowed, with
kinemitic hardenint&App~Lield in the case of stress-reversal.
At each loading level an elastic solution for incremental displacements is
obtained, the amount of plastic flow determined, and the load vector for the
next load increment is modified to account for this plastic flow increment.
This procedure causes the calculated plasticity to lag the loading increment,
resulting in calculated stresses which are somewhat higher than the true
stresses. The solution can be refined by taking smaller load increments or
by iterating 4oze times at each load increment. ,If 6everal iterations are
done at a given load step the program uses aextrapolation procedure to
estimate the plastic strain at the next load step, giving a plastic solution
which converges quite rapidly.
•Static Plastic Analysis Theory
The basic equation for the static plastic analysis is:
[K) {Ax} = {AFapp} + {AFpres} + {aFthI + {AF plast1 (2-3)
{AFplast) is the nodal force increment due to the plasticity
which occurred during the previous load step (or
estimated for this load step)
The resulting simultaneous linear equations are solved by the Wave Front
Equation Solver, as in the elastic analysis.
-4-

2. THERMAL AND FLOW ANALYSES
2.1 Steady State Thermal Analysis
The steady state thermal analysis option is used to solve for the steady
state temperature distribution in a heat conducting body. The boundary
conditions may be specified temperatures or specified heat flow rates.
Convection and radiation elements are included so that convection and
radiation boundary conditions can be handled. The material properties may
be temperature dependent, which, along with the radiation element, causes
a non-linear problem and requires an iterative solution.
Steady State Thermal Analysis Theory
.The basic equation for the steady state thermal analysis is
[K] {T) = {Qapp} + {Q gen (2-4)
where
[KT] is the structure thermal conductivity matrix,
which is the sum of the element conductivity
matrices.
(TI is the nod-al temp erature vector, which is the
soluti-an of the set of simultaneous equations
{Q appI is the applied heat flow rate at ie nodes (if any).
{Q gen is the heat flow at the nodes due to internal heat
generation in the elements.
-5-

The set of linear equations in Equation 2-4 is solved by the Wave Front
Equation Solver. The resulting solution vector of nodal displacements is
printed out. If the thermal conductivity of the material is temperature
dependent or if there are radiation elements the calculated temperature dis
tribution is used for the calculationr'of the mductVfity-mati.ix for the
next iteration.
2.2 Transient Thermal Analysis
The transient thermal analysis option of the program is used to solve for the
nodal point and element temperatures as a function of time.
The effect of temperature dependent material properties and radiation boundary
conditions is included bv evaluating the Tnifpr•-l properties and UA^
transfer coefficient based on the most recently calculated temperature.
2.2.1 Transient Thermal Analysis Theory
The basic equation for the transient thermal analysis is:
I [] + [T] T app genn +- [CT] Tn-I (2-5)
where
AT is the time difference between the time at step
n and the time at step n-l
[CT] is the specific heat matrix for the entire model
[IK] is the thermal conductivity matrix for the entire model
-6-

T is the (unknown) vector of nodal temperatures at time n
Qappn is the applied nodal heat fluxes at time n
Qgen is the nodal heat fluxes due to the internal heat n
generation at time n
TnI is the (known) vector of nodal temperatures at time n-I
The resulting simultaneous linear equations are solved by the Wave Front
Equation Solver at each time point during the transient.
2.2.2 Steady State Hydraulic Analysis
The steady state hydraulic analysis option of the program can be used Co solve
the flow balance problem in the network of flow paths (pipes). The program
calculates the pressure at each node of the model and the flow rate in each
fluid passage.
The flow balance problem is non-linear, and requires an iterative solution.
The boundary conditions are applied as a step and a number of iterations are
done to determine the solution. Additional sets of boundary conditions can
be applied for other solutions.
The solution technique used seems to be rapidly convergent, and about 5
iterations usually gives a reasonable convergence.
steady State Hydraulic Analysis Theory
The basic equation for the steady state hydraulic analysis is:
-7-

[1 --' = {Wapp} (2-6)
where
IKHI is the hydraulic conductance matrix for the entire
flow network'
( ~p} is the vector of the square roots of the nodal point
pressure
{ W } is the flow rates applied to the nodal points app
The resulting set.of equations fs.non:linear in pressure bezause of the
square root term, so an iterative solution procedure is used.
--8-

3. MODAL ANALYSES
There are two options available for modal analyses. The first option con
siders all the degrees of freedom in the structure and does not require
specification of dynamic degrees of freedom. It can be used for small
problems with less than 85 degrees of freedom. The second option requires
the specification of dynamic degrees of freedom and can handle much larger
structures.
3.1 Standard Modal Analysis
The standard modal analysis is used to determine the natural frequencies and
mode shapes for a linear elastic undamped structure. This analysis calculates
the complete set of eigenvalues and eigenvectors for the model, and is limited
to models having less than 85 unrestrained degrees of freedom.
The structure must be a linear elastic structure. If damping is present in
the model it is ignored, if non-linear elements are present they are treated
as linear, with their stiffness depending on their initial state (a gap will
produce no stiffness, a closed interface will have the interface stiffness).
SNladard Modal--nalysis Theory
The basic equation for the dynamic behavior of a structure is:
[M] fxj + [C] {x) + [K] {x} =- F(t)}
where
fM] is the total mass matrix of the structure, the sum of the
individual element masses,
[C] is the total viscous damping matrix of the structure, the
bum of the individual element damping matrices,
[K] is the total stiffness matrix of the structure, the sum ot
the individual element stiffness matrices,
-9-%

{x)
{x)
{F(t)}I
is the nodal point displacement vector,
is the nodal point velocity vector,
is the nodal point acceleration vector, -and
is the vector of applied nodal forces as functions
of ti2ne, t.
In the case of an undamped structure under free vibrations Equation 2-7
becomes
(2-8)
(2-9)
[M] {x} + [K] {x} = 0
If it is assumed that the motion is harmonic of the form
tx} = {x I coswt 0
Equation 2-3 becomes
[K] Ix w 2 [M] {xo}
which is an eigenvalue problem, and is often written
[KI ['*] = ( [M) (Tj Li'
(2-10)
(2-lij)
where
The equat
and then
[T] is the modal matrix,
[X] is the diagonal matrixlwhose terms are the squares of the
natural frequencies.
ion in 2-11 is transformed Uo the classical eigenvalue problem
[K] [by] ao[X] Id] (2-12)
solved by a Jacobi reduction.
The Jacobi reduction has the advantages of speed and accuracy, yielding a
complete set of eigenvalues and eigenvectors.
-10-

3.2 Reduced Modal Analysis
The reduced modal analysis option is used to determine the hatural frequencies
and mode shapes for a linear elastic, undamped structure. This analysis re
quires the specification of dunamic degrees of freedom of the model, which
are a subset of the total number of degrees of freedom. The dynamic degrees
of freedom are chosen so as to characterize the deformations of the structure
in the various modes of interest. The total number of degrees of freedom in
the model can be as large as for static problems, but the number of dynamic
degrees of freedom must be less than 85. 85 mqdes are usually ample for a
modal analysis of any reasonable structure.
The structure must be a linear elastfrc structure. If damping is present in
the model it is ignored, and any non-linear elements present are treated as
linear, with their stiffness depending on their initial state (a gap will
produce no stiffness, a closed interface will have the interface stiffness).
3.2.1 Reduced Modal Analysis Theory
The basic equations for the reduced modal analysis are the same as those fur
the standard modal analysis (Equations 2-7 through 2-12) except that the mass
and stiffness matrices are reduced to contain only the specified dynamic
degrees of freedom.
The reduced stiffness matrix can be thought of as the matrix of the influence
coefficients of the structure at the points and in the directions of the
dynamic. degrees of freedom, while the reduced mass matrix results from a
redistribution of the mass to the dynamic degrees of freedom in a manner cou
sistent with the possible static deformations of the structure due to imposed
deformations along the dynamic degrees of freedom.
-11-

4,. HARMONIC RESPONSE ANALYSES
4.1 Harmonic Response Analysis
The harmonic response analysis is a steady state solution of a linear elastic
system under a set of harmonic loads of known amplitude and frequency. These
boundary loads may be specified displacements, forces, or pressures. All
forcing functions for a given analysis must be at the same frequency and in
phase. Damping is allowed in the system, either as discrete viscous dampers
or as a damping matrix which is a specified linear combination of the mass
and stiffness matrices.
4.1.1 Harmonic Response Analysis Tb-or,
As in the modal analysis, the basic equatic- "or the j ehavior of a
structure is:
[Mj {x} + [C] {xl + [K] {x} - {F(t)} (2-13)
w1IuL9 Lim~ LeL1±Li az define folc**
Assuming the forcing function is of theform
{F(t)} = fF } e jt (2-14)
and the displacement is of the form "
{x} = {x I e j~t (2-15)
then Equation 2-13 becomes
-2 [M] + jw [c] + [K] {xo} = {F0 (2-16)
This is a set of simultaneous i. '-ar equations of the same form -s for the
static elastic solution, except that the matrix is complex.
The solution will have a displacement vector x0 w. ich is complex, having a
real and an imaginary portion,. representing an amplitude and a phase angle.
If there is no damping in the system the imaginary portion will be 0.0, rep
resenting a zero phase angle and the response is in phase with the forcing
function. -12-

5- NON-LINEAR DYNAMIC TRANSIENT ANALYSES
5.1 Non-linear Dynamic Transient Analysis
The non-linear dynamic transient analysis is a time-history solution of the
response of an arbitrary structure to a known force and/or displacement
forcing function. Tht°ructure may include non-linear elements, gaps, in
terfaces, plastic elements, and viscous and Coulomb dampers. Allowed forcing
functions include nodal displacements, nodal forces, pressures, and/or temper
atures. Output includes displacements and stresses as a function of time for
the complete structure.
_Non-Linear-D~ami& Trnsient Anal-v'is Theory
As in the modal analysis and the harmonic response analysis, the basic equa
tion for the dynamic behavior of a structure iz:
[M] {xW + [C] fx} + [K] Jx} = {F(t)} (2-17)
where {F(t)l may include the effects of applied displacements, forces,
pressure, temperatures, or non-linear effects such as plasticity.
If {x }I is assumed to be either of the form
{x t = {a) + {blt + {cit 2 (quadratic) (2-19)
or
xt {al + {bYt + ct2 + {djt 3 (cubic) (2-19)
-13-

{x } = {b) + 2{c}t
{xt I = {b} + 2{c}t + 3'1}t 2
{xt I = 2 {cI
(quadratic)
(cubic)
(quadratic)
{x I = 2 fc} + 6{dlt
Equation 2-18 and 2-19 can also be
terms of the displacement at times
solved for {a}, {b}. {c}, and
r, t-1, t-2, etc., to give:
xt} f I {x t} ,ix t-l}1, {xt-2}""") (2-2,
{it}= f2 x t}' {xt-l}' {xt-2I' . . . ) (2-2.
Substituting the expressions (2-24) - (2-25) into Equation 2-17 gives
4)
5)
C1 C2 2 '.[M] +-T [C] + [K] AT 2 AT {xt} = {F W)} + f
{(tXll, {xt 2 },. ... (2-26)
This equation ,a,± be s-_lved for x. In terms of the previaus (known) values of
the nodal displacements. Since [M], [C., and [K] are included in the equation,
they can also be time or displacement dependent.
-14-
then
and
(2-20)
(2-21)
(2-22)
(cubic) (2-23)
{d} in
[M, [CII,

6. LINEAR DYNAMIC TRANSIENT ANALYSES
6.1 Linear Dynamic Transient Analysis
The linear dypamic transieiit analysis is a time-history solution for the
response of a linear elastic structure to a known force and/or displacement
forcing function. The structure must not contain any non-linear elements
or include any damping. No element loads (pressure or temperature) are
allowed. The solution proceeds in two stages - a complete pass through
the transient to determine the displacement history, followed by a second
pass (if desired) to calculate the element stresses over a usually coarser
time interval.
Linear Dynamic Transient Analysis- Theory
The equations used in the linear dynamic transient analysis are similar to
those in the non-linear analysis except for two modifications.
The linear structure has constant [M] and [K] matrices, so the equation 2-7
can be reduced to a smaller number of dynamic degrees of freedom as is done
in the reduced modal analysis.
Equation 2-26, when written in terms of the reduced matrices and restricted
to a constant At can be inverted to obtain:
{xt) = {F(t)) + f([M],{{xt l} {xt2}, etc.) (2-27)
-15-

where
C 1 -1
At 2 - [M] + [K] (2-28)
This reduces the solution for the dynamic degrees of freedom to a series
of relatively small matrix multiplications after having once found the
[K]-i matrix.
Once the displacements at the dynamic degrees of freedom are known as a
function of time the stress solution at any time in the transient can be
calculated.
-16-

AEC Question 2.A.b.: Provide the basis for the assumed 40 year thinning.
Reply 2.A.b.: The 40 year thinning allowance (0.003 in.) is intended to
account for the corrosive effects of Reactor Coolant Fluid flowing
within Inconel Steam Generator tubing. A conservative weight loss rate 2 2 of 11.5 mg./ dm, _ mo. (31.9 iqg./dm in 2000 hrs.) is obtained from
reference I for Inconel in flowing 650 0 F primary fluid. For comparative
purposes, a weight loss rate of 15.4 mg/dm2 in 2000 hrs (5.55 mg/dm 2-mo.)
for stabilized Inconel, obtained in reference 2, is often referred to, as
a worst case rate. The equivalent thinning rate is 0.017 mils/year. This
rate is, essentially, short term data which, if projected over 40 years,
would result in 0.680 mils thinning. Reference 3 (page 137) indicates
that the corrosion rate is reduced by approximately a factor of 10, after
5000 hours. The total expected corrosive thinning in 40 years on the
inner tubing surface is found by combining the initial rate for the first
year (8760 hrs) with a rate reduced by 9/10 for 39 years: (0.017 r(1 yr) + (0.017 ( ) ( ) (39 years) = 0.083 mils. The assumed
yr yr 10 3 mil thinning rate in WCAP-7832, therefore, allows 2.917 mils for general,
uniform corrosive thinning on the secondary side. This
allowance is conservative in comparison with Ref. 2 test data on Inconel
in simulated secondary water chemistry which indicates that the weight
loss rate is of the same order of magnitude as for primary water chemistry.
The 3 mil allowance assumed in WCAP-7832 is for uniform corrosion only.
The local corrosive attack on the secondary surface which has been observed
recently on some plants is not included in the thinning alldwance. The
local attack is associated with sludge deposits and local chemical-hydraulic
interactions. Control and prevention of this local effect are contemplated
by proper secondary water chemistry.
References (Reply 2.A.b.)
1. Berry, W. E., Stiegelmeyer, W. N., Fink, W. F., "The Corrosion of
Inconel in High-Temperature Water (Phase II), "Battelle Memorial
Institute, December 15, 1958.
Equivalent to 11.5 mg/dmi2 _ mo.
-17-.

2. Berry, W. E. and Fink, W. F., "The Corrosion of Inconel in High
Temperature Water, "Battel Memorial Institute, April 4, 1958.
3. Depaul, D. J., "Corrosion and Wear Handbook for Water Cooled Reactors,"
USAEC, TID 7006, March 1957.
AEC Question 2.A.c.: Provide a reference or additional data on crack
propagation tests on tubes loaded by combined internal pressure and axial
bending moments.
Reply 2.A.c: External bending loads have an influence on the burst pressure
of flawed tubes. This effect has been observed at bending stress levels
up to 34,000 psi and is considered insignificant in that range (0-34,000 psi).
Tube movements, induced for example by a seismic event, can generate bending
stress which may facilitate plastic bulging of the crack area. However,
while bending stresses lower the pressure at which point stresses exceed
the yield strength, it is not certain that such stresses greatly affect
the fully plastic limit pressure of flawed tubes.
Examination and testing of tube specimens removed from operating steam
generators which have surface stress-corrosion cracks have indicated that
the ductibility of the uncracked tube material has not degraded. Several
tests were conducted with bending stresses superimposed on internally
pressurized tubes to determine if this load would accelerate crack
propagation. It is concluded from those tests that there is no strong
effect of bending stress on crack propagation. Further discussion,
data, and SEM photographs are included in the response to question 2Bd, and
the test data of Table 111-3.
Table 111-3 lists the burst pressure of tubes with through wall slits
subjected to combined bending and internal pressure. At an outer fiber
stress of 34,000 psi the largest effect on the burst pressure is less than
a ten percent decrease. The bending load was applied (on different
samples) with the crack located on the neutral axis, and on both the tension
and compression qides of the tube (beam).
-18-

Higher bending stresses could iot be investigated due to a tube collapse
limiting condition at the points of load application. A significant affect
on burst pressure is possible at higher bending stress levels but none was
observed at 34,000 psi. For comparison, note that the bending stress
calculated on pg. 3.1-15 is 23,000 psi. For comparison, note that the
bending stress calculated on pg. 3.1-15 is 23,000 psi for a tube wall
thinned to 0.026 in. Most likely bending stress will only have a strong
effect on the burst strength of flawed tubes at a bending moment close to
the limit moment of the tube.
-18a-

TABLE 111-3
COMBINED BENDING AND INTERNAL
PRESSURE BURST TESTS
Burst
Pressure (psi)
Load, P
(ibs)
Maximum Outer Flaw
Fiber Stress (psi) Location
3742-.8-BB-T
3742-.8-BB-C
3742-.8-BB-N
3742-.8-X
2800
2350
2400
2500
Tube Diameter
Wall Thickness
Flaw Length
Temperature 750F
I
1875
1875
1875
0
W4
34,000.
34,000
34,000
Tension Side (1)
Compression Side (2)
Neutral Axis (3)
0
0.875
0.050
0.80 inch through wall
-19-
Specimen
Number

AEC Question 2.A.d.: Provide a reference or additional data on the tube
collapse tests, and the analytical correlation and analysis on which the
extrapolation of test results to tubes of different yield strength and wall
thickness is based.
Reply 2.A.d.: Collapse tests have been conducted at the University of South
Florida, Tampa, Florida, under the auspices of W Tampa Division on slightly
oval (0-10%) straight and U-bend Inconel tubular specimens of various sizes.
Some of the significant test results are summarized below:
Nominal Tube Size (in) Ovality (%)
Dia. Thick. 0 3 5 7 10
5/8 .039 6300 4300 4000 3750 3050
7/8 .050 1 - 6800 4500 4200 3800 3100
3/4 .043 0 4 7300 4800 4250 3850 3300
The results shown above are for straight tubular specimens. Test results
indicate that collapse pressures of U-bends are higher than for straight
sections as shown in attached Figure 6 of reference 1. Pressure versus
ovality for straight tubes and for U-bend tubes (Inconel 600) illustrate the
effect of ovality on the normalized, dimensionless collapse pressure term
PP in Figure 5 of ref. 1. where: p is the pressure difference across ay t the tube wall, p is the mean tube radius, ay is the yield stress, and t is
the tube wall thickness.
Reference 1 (Reply 2A.d.): A. Lohmeier, and N. C. Small, "Collapse of
Ductile Heat Exchanger Tubes with Ovality Under External Pressure." Presented
at the 2nd International Conference on Structural Mechanics in Reactor
Technology."
-20-

pR ayt 1.0
0 3/4 - .043 inch tubes ay 51,000 (Stress Relieved)
_- __7/8 - .050 inch tubes oy - 51,000 (Stress Relieved)
7/8 .050 inch tubes ay 51,000 (as mfg.)
\ \
c.o 0
Theoretical Upper and Lover Bounds Based on Total Ovality A
Theoretical Upper N" and Lover Bounds Eased on Initial Ovality
Theoretical Results Based
on 0 /E - 1.64x10⁻³ E - ýjxiO6 0
y - 51,000 psi
0 1 2 3 4 5 6 7 8 9 10
Z Ovality
Figure 5 Comparison of Experimental Results for Collapse of Long-Oval Tubes under External Pressure with Theoretical Upper and Lower Bounds
1 2 3 4 5 6 7 8 9 10
Maximum Ovality 2
Figure 6 Experimental Results Showing Effect of Tube Bending Configuration on External Collapse Pressure
5
04
3
2
.9
.8
.7
.6
.5
.4
a
o•

AEC Question 2.B.a.: Describe the analysis employed to assess the effect
of a postulated steam line break on the steam generator tubes and provide a
summary of the results.
Reply 2.B.a.: Although steam line break is not in the scope of WCAP-7832,
since it evaluates LOCA plus SSE conditions, the following summary is
provided: An analysis of flow induced vibration of the tube bundle following
a postulated steam line break was performed. The tubes in the U-bend region
were assumed to be subjected to cross-flow. Mass flow rates, fluid densities
and cross-flow velocities were evaluated by a hydrodynamic analysis. Tube
deformations and bending stresses were evaluated based on flow-induced
vibration criteria. The flow induced vibration analysis considered both
vortex ahedding and fluid-elastic vibration mechanisms.
The res-ulting maximum tube deformation in the U-bend region is 6 mils and
the corresponding maximum bending stress in the tube is 560 psi. It was
concluded that these values are sufficiently small to insure the structural
integrity of the Model D (preheat) tube bundle and are representative of
the Model 51 series (non-preheat) Steam Generators.
AEC Question 2.B.b.: Describe the analyses employed to assess the effect of
a postulated break at the feedwater nozzle on the preheater substructure and
provide a summary of the results.
Reply 2.B.b.: A feedwater line break at the nozzle is not in the scope of
WCAP-7832, however the following summary is provided: A structural evaluation
of the Model D Steam Generator preheater region was performed for a postulated
break at the feedwater nozzle. Transient pressure loadings on the preheater
structure were evaluated by static three dimensional nonlinear finite element
analyses--ugampllficatioT fi-tofs to account for dynamic effects.
-22-

Maximum stresses in the components of the preheater structure were compared
to allowable stress limits defined in the Subsection NG, ASME Code,
Section III, for Faulted Conditions. The results are summarized below:
Location Maximum Value Allowable Value
Baffle Plate P = 29.0 ksi 36.4 ksi m
P = Pb = 47.8 54.6
Partition Plate P = 10.0 31.1 m
P + Pb = 26.0 46.6
Impingement Plate p = 250 psi 1110 psi
Model 51 Steam Generators which do not have a preheater section (feedwater
is introduced above the tube bundle) and would behave, in a general way,
similarly to a preheat generator during a steam line break.
AEC Question 2.B.c: Discuss the effects of local thinning due to wear and
local crud accumulation at the tube supports on the burst strength of the
tubes.
Reply 2.B.c.: A test program of tubes with simulated wear or local thinning
has been run on both 7/8 in. OD and 3/4 in. OD Inconel tubing. The tubes
had flats milled on the outer surface of varying axial lengths. The results,
presented in Figures 4-1 and 4-2, illustrate the influence of the axial length
of the thinned area on burst pressure. It can be seen that for a part wall
(24-27% remaining Figure 4.1 and 19-28% on Figure 4-2 for 3/4" tubes) infinitely
long defect, the burst pressure is approximately 2500 psi which is greater
than plant operating pressure (with zero on the steam side). For smaller length
defects, the burst pressure is substantially higher. E.g., for a 1" long, part
wall defect, the burst pressure is approximately 4200 psig, and for a 1/2"
long defect, the pressure is roughly 6200 psig.
Question 2.B.d.: Identify the method by which corrosion phenomena were
considered in assessing the fatigue strength of the tubes.
-23-

0.2 0.41 0.6 0.8 1.0 1.2 1.11 1.6 1.8 2.0 2.2
RECIPROCAL FLAW LENGTH (L IN-') L
Figure 4-1 Room Temperature tsurst Pressure of 7/8" Tubes with Machined Flats
®23a
11,000
12,000
10,000
0C.
C-,
la
0en
I-(jo
8000
6000
1O000
2000
o0. 0.0
S4-5

0.2 0.4 0.6 0.8 1.0 1.2 1.'I 1.6 1.8 2.0 2.2
RECIPROCAL FLAW LENGTH (I IN-')
'CALCULATED
Figure 4-2 Room Temperature Burst Pressure of 3/4" Tubes with Machined Flats
4-723b
14.000
12,000
10,000
U.'
C4,
co
LiJ
C,-
8000
6000
4000
2000
0.0
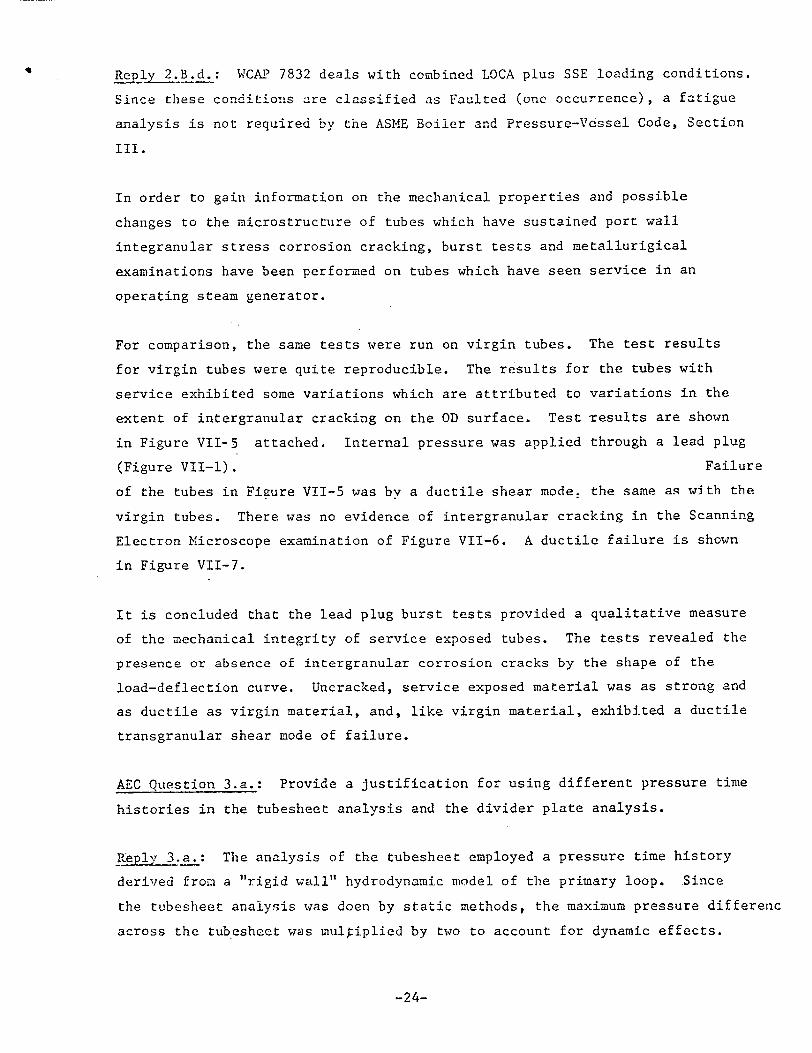
Reply 2.B.d.: WCAP 7832 deals with combined LOCA plus SSE loading conditions.
Since these conditions are classified as Faulted (onc occurrence), a fatigue
analysis is not required by the ASME Boiler and Pressure-Vessel Code, Section
III.
In order to gain information on the mechanical properties and possible
changes to the microstructure of tubes which have sustained port wall
integranular stress corrosion cracking, burst tests and metallurigical
examinations have been performed on tubes which have seen service in an
operating steam generator.
For comparison, the same tests were run on virgin tubes. The test results
for virgin tubes were quite reproducible. The results for the tubes with
service exhibited some variations which are attributed to variations in the
extent of intergranular cracking on the OD surface. Test tesults are shown
in Figure VII-5 attached. Internal pressure was applied through a lead plug
(Figure VII-l). Failure
of the tubes in Figure VII-5 was by a ductile shear mode: the same as with the
virgin tubes. There was no evidence of intergranular cracking in the Scanning
Electron Microscope examination of Figure VII-6. A ductile failure is shown
in Figure VII-7.
It is concluded that the lead plug burst tests provided a qualitative measure
of the mechanical integrity of service exposed tubes. The tests revealed the
presence or absence of intergranular corrosion cracks by the shape of the
load-deflection curve. Uncracked, service exposed material was as strong and
as ductile as virgin material, and, like virgin material, exhibited a ductile
transgranular shear mode of failure.
AEC Question 3.a.: Provide a justification for using different pressure time
histories in the tubesheet analysis and the divider plate analysis.
Reply 3.a.: The analysis of the tubesheet employed a pressure time history
derived from a "rigid wall" hydrodynamic model of the primary loop. Since
the tubesheet anaiysis was doen by static methods, the maximum pressure differenc
across the tubeshect was multiplied by two to account for dynamic effects.
-24-

BwUat -Ast" on virgin and NOK service exposed tubes.
10
S0 o 0
0 0.25 o.5e Crosshead Displacement, Inch
Figure VII-2
XHD Rate = 0.5 in./min
0.15
24a
15
Virgin Tt~beo

Lo-aA
Loaca
-Di splacem~ent
-�
DIAe +0 inCreaS'e ;n load revuired io compress
to-ad~ Plug.
-LoaOM3 Tube~
Di splacemenrt
r-. Schierncl+ic. oi leadL-plaq burs+ test,

g337-g347NOK Tubes
4
0 o 8.
S
2
C i• Il .4 , t .6
Crosshead Displacement, Inches
'Fit•k 4' • .
24c
.7
C;

" - •h•"- Virgin Tube
Tubes From
6 Intergranul arly Attacked Tube From Tube Sheet Region (Fig. VII-2)
4
2
0 0.1 0.2 0.3 0.4 0.5 0.6 0.7 0.8 Cross Head Displacement, Inches
Fig. VII-5 - Lead-plug burst test results showing high ductility in virgin tubes and in tube NBK B (15-46) and reduced ductility in NOK tubes from intergranular attack in tube sheet region.
24d

-. -'.r. /X- -- . - ,= •
r,- ' " -
-- - ) . . -
15-65 5C2
600X 15-65 I.D. 5C2
Figure VUI-6 SEM of Fracture Surface of Tube Ruptute Tests kLea4-PIlug Sil Tests) Showing intergranular Fracture Near O.D. and tuctile
Shear Area Near I.D. Tube A15-65
0;
0-
60X
600XO.D
RM-52399

Ix
V% 4X
Fig. VII-7 - High ductility was demonstrated after lead-plug burst test, Sec. (12A3-12A4).
FIG. VII-7
24f

In the analysis of the divider plate, a modified pressure history based on
a "flexible wall" hydrodynamic model was employed. It is well known that
hydraulic transient analyses, performed with the rigid boundaries assumption,
give greatly exagerated levels of the pressure fluctuations, hence, hydraulic
loads, acting over the flexible boundaries. This new pressure history resulted
in not only lower pressure differences across the divider plate, but also
lower differences across the tubesheet. The dynamic time history analysis of
the divider plate was performed using this revised pressure time history.
However, since the initial conservative pressure differences across the
tubesheet resulted in stress levels well below the allowable limits, it was
not reanalyzed using the less conservative "flexible wall" pressure time
history.
AEC Question 3.b.: Provide a comparison of the maximum deflection and stresses
in the divider plate as calculated from ANSYS and PETROS.
Reply 3.b.: The analysis of the divider plate requires the evaluation of
large deformations and large elastic-plastic dynamically-induced strains.
The PETROS code addresses this problem explicitly. The ANSYS code does not
have the capability for handling large strains and thus the resultant solution
is inappropriate and therefore not able to be used as a comparative measure
against PETROS. The PETROS code is amply verified by experiment and alternate
analyses in the following references.
References (Reply 3.b.):
1. Atluri, S., Witmer, E. A. Leech, J. W., Mori;io, L., "PETROS III a Finite Difference Method and Program for the Calculation of Large Elastic-Plastic Dynamically-Induced Deformations of Multilayer Variable-Thickness Shells", BRL CR60 (MIT-ASRL TR 152-2), November 1971.
2. Morino, L., Leech, J. W., and Witmer, E. A., "PETROS 2: A New FiniteDifference Method and Program for the Calculation of Large Elastic Plastic Dynamically-Induced Deformations of General Thin Shells", BRL CR 12 (MIT-ASRL TR 152-1), December 1969. (In two parts: AD708773 and AD708774).
-25-

ADDITIONAL CLARIFICATION
TO WCAP-7832
1. Replace pages 3.1-14 and 3.1-15 with the attached superseding pages
3.1-14, 3.1-14a, 3.1-14b and 3.1-15.
2. ERRATA
i) Figure 2.3-1: Change "Design Basis Earthquake" to "Safe Shutdown Earthquake".
ii) Pg. 1.1-1: Last word should be "mixture".
iii) Pg. 1.1-2: Fifth para., first sentence should read,
"The 51 Series have 3388 U-Tubes of 0.875 in.
O.D. and 0.050 in. nominal wall thickness; the
D Series Steam Generator has 4674 U-Tubes of
0.75 in. O.D. and 0.043 in. nominal wall
thickness."
.iv) Delete the character before "Figure 1.3-2" in that figure.
V) Pg. 3.1-13: Delete "from Ref. [6]" from second line.
3. Substitute attached Table 3.1-2 for that in the WCAP.
-26-

Therefore the total allowable crack length is 0.64 inch for the V series
3.1.6 TUBE THINNING
An investigation was performed to determine the margin of tube wall thinning
which could be tolerated without exceeding ASME Code, Section III Faulted
Condition stress limits when subjected to combined LOCA and SSE loads.
Section 3.1.3 outlines the Faulted Condition limits; these are:
Allowable Primary Membrane Stress, Pm = 52,500 psi
Allowable combined Primary Membrane and Bending Stress, Pm + PB = 78,750 psi
A parametric study, varying the tube wall thickness showed that D Series
tubes with a minimum wall thickness of:
t = 0.026 in. (0.75 in. nominal diameter tubing)
would have combined bending and membrane stresses of:
Pm + PB = 75,100 psi (0.75 in. nominal diameter)
which is less than the allowable limit.
For the 51 Series Steam Generator tubing (0.875 in nominal diameter and 0.050 in. nominal wall thickness) a simplified calculation to determine
minimum uniform wall thickness based on combined LOCA and SSE loading
conditions and ASME Code, Section III, Faulted Condition stress limits results in a value of 0.021 in. This thickness results in combined
bending and membrane stress of:
PM + Pb = 72,800 psi (0.875 in. nominal diameter tube)
3.1-14

The analysis for the study (on the D Series tubing) was identical to that described earlier in Section 3.1.1, with the exception of the tube
wall thickness being 26 mils. Figures 3.1-42 through 3.1-46 give the
stresses at the various node locations, due to the LOCA rarefaction wave;
Figures 3.1-47 through 3.1-51 give the stresses at the various node
locations due to shaking caused by LOCA; Figure 3.1-52 shows the maximum
stress intensity which occurs at Node 16.
The Primary Membrane Stress Intensity is a maximum at t = 0 seconds, when
the tube is under the influence of its highest internal pressure. At this
point in time:
Pm= 23,000 psi
This stress is calculated from torus geometry equations, as applicable
to the U-bend region using the smallest bend radius. The Primary Membrane
plus Primary Bending Stress Intensity (Pm + PB) is found to be a maximum
at the location associated with node 16, shown in Figure 3.1-52 at t = .06
seconds after the primary coolant outlet line severance. This value, when
combined with the maximum seismic bending stress of 5000 psi, is,
PM + PB = 75,100 psi
Summary
The minimal wall thicknesses determined here are based on several degrees
of conservatism. First, the maximum stress values which occur at different
locations in the tube bundle'have been treated as if they acted at the
same point. Second, the maximum stress levels resulting from each
* The vwri-us axial and circumferential (clock) positions, and the stress orientations at a specific point have been treated as an absolute summation
3.l-14a

contributing load do not necessarily occur simultaneously; but are
assumed to be simultaneous. Third, the ASME Faulted Condition stress
limits are conservative when based on Engineering Stress-Strain Curves
for determination of ultimate stress. A comparison of developed stresses
for any given plastic strain in Figure 3.3-4 against that of Figure 3.3-5 illustrates this point.
The mimimum wall thicknesses given here were governed by the conservatively
assumed stress state at a particular location in the tube bundle (Node 16,
tangent to the curved, U-bend region). The minimum wall thickness required to sustain LOCA plus SSE loadings at other locations (e.g., straight section
above the tube sheet: Node Location 1) would be substantially lower as can
be seen in Figures 3.1-3 through 3.1-I` for various Nodal locations.
3.1-14b

Summary
Table 3.1-2 summarizes tube wall thickness and the equivalent stresses
generated by combined DBA plus SSE loads.
3.1.7 EXTERNAL PRESSURE EFFECTS
Subsequent to primary system blowdown, the differential pressure across
the tubes will be secondary side pressure minus containment back pressure.
Westinghouse tests of the 51 serif.7/8 in. diameter, 0.050 in. wall
straight tube indicate that a collapse pressure of 6400 psi at room
temperature was obtained, for annealed Inconel material of 51,000 psi
yield strength, at 0% tube ovality. An analytical correlation based on
plastic limit analysis was developed in order that extrapolation of test
results to tubes of different yield strength and wall thickness would be
possible. This correlation was applied to determine the predicted
collapse pressure for straight Inconel tubing with minimum yield strength
for the ASTM material at design temperature and minimum specified wall
thickness. This results in a collapse pressure of approximately 3000 psi
for 0% ovality and 1830 psi for the maximum allowable 5% ovality at 600'F.
Tests on U-bend specimens
3.1-15

of different radii show that collapse pressure increases with reduced
bend radius and is always higher than the straight tube due to toroidal
surface curvature effects.
3.1-16

UNITED STATES L NUCLEAR REGULATORY COMMISSiON
WASHINGTON, D. C. 20555
NOV 12 975
Mr. C. Eicheldinger, Manager Nuclear Safety Department Westinghouse Electric Corporation P. O. Box 355 Pittsburgh, Pennsylvania 15230
C. EICHELDINGER
Dear' Mr. Bicheldinger: PWR NUCLEAR SAFETY
To complete our review of Westinghouse Elect~ic Corporation report WCAP-7832 (Non-proprietary) entitled, "Evaluation of Steam Generator Tube, Tube Sheet and Divider Plate Under Carbined LOCA Plus SSE Conditions", additional information is required. The required information is identified in Enclosiwe 1.
To meet our review schedule, we need this additional information by December 19, 1975. if you cannot meet this schedule, please inform us within ten days after receipt of this letter of the date you plan to submit your response.
If you have any questions about our request for additional information, please contact us.
Sincerely,
D. B. Vassallo, Chief Light Water Reactors
Project Branch 1-1 Division of Reactor Licensing
Enclosure: Request for Additional
Information

ENCLOSUPE 1
MECHANICAL ENGIN'ERNG BRANCH
OFFICE OF NUCLEAR REACTOR REGULATION
REQUEST FOR ADDITIONAL INFORMATION
WEST4NGHOUSE REPORT: WCAP-7832
EVALUATION OF STEAM GENERATOR TUBE, TUBE S=EET AND DIVIDER PLATE UNDER. COMBINED LOCA PLUS SSE CONDITIONS
1. Regarding your reeply to Item 2.B.d of our request for additional inforantion, dated August 12, 1974, explain the increase in strength of service exposed tubes with no intergranular corrosion as compared with tubes of origin material, as shown in Figure VII -5 (p. 24d) of your reply.
2. (a) Define the term "stress intensity."
(b) Show that the maximumn 'embrane plus bending" stress intensities in healthy and thinned tubes are lower than the allowable stress limits when effects due to normal and upset operating conditions, such as flow induced vibration and vortex shedding, are included in the analysis.
3. (a) Indicate the allowable stress limit in membrane rlus bending for the divider plate material.
(b) Indicate the location in the divider plate where the maximum membrane plus bending stress intensity occurs, and show that it is below the i1mit in part (a).
c:

Westinghouse Power Systems PWR Systems Division
Electric Corporation Company Box 355 Pittsburgn Pennsylvania 15230
December 19, 1975
Mr. D. B. Vassallo, Chief NS-CE-885
Light Water Reactors Project Branch 1-1 Division of Reactor Licensing Attn: Mr. Raymond R. Maccary Assistant Director for Engineering Division of Systems Safety Office of Nuclear Reactor Regulation United States Nuclear Regulatory Commission Washington, DC 20555
Dear Mr. Vassallo:
Enclosed are fifteen (15) copies of the additional information requested in your letter of November 12, 1975 in order to complete your review of Westinghouse Electric Corporation topical report WCAP-7832 (non-proprietary) entitled "Evaluation of Steam Generator Tube, Tubesheet and Divider Plate under Combined LOCA plus SSE Conditions."
WCAP-7832, submitted in December 1973, presents a detailed analysis of the steam generator structural design to demonstrate its capability to sustain stresses resulting from simultaneous LOCA and SSE loading conditions. We trust that your review of this added information will provide the desired clarification.
Your letter referred to your review schedule for this WCAP. Westinghouse wishes to be advised of the details of that schedule. This report has provided much of the material used mutually by the Technical Review Staff and by Westinghouse in the ongoing public hearings dealing with steam generator integrity and is expected to be instrumental to the eventual resolutions reached in those hearings.
Westinghouse considers that timely completion of your review and approval of this document would prove mutually beneficial for its use in safety analysis reports. We request that you consider this desire when setting the schedule for completion.
Very truly yours,
C. Eicheldinger, Manager Nuclear Safety Department
CE/lz Enclosures

Page 1 of 2
ATTACHMENT
1. Your request for information regarding the apparent increase in strength of service exposed tubes compared to virgin material* is answered as follows. The lead plug tests which were referenced had as their objectives determination of possible significant changes in ductility as a function of surface exposure. All of the service exposed tubes without cracks came from one tube, and thus one heat of Inconel. The virgin material, on the other hand, was also from one different lot of Inconel. Thus the apparent differences in flow strength represent the normal variations in yield strength exhibited-by Inconel 600 tubing. For example, a review of mill records for HAPD Inconel varied in yield strength from 38,500 to 65,500. This indicates that considerable variation in yield strength is typical of normal production material.
*Inconel tubing exposed to primary cooling chemistry for one year, W Forest Hills loop setup.

Page 2 of 2
2a The term stress intensity is defined as per ASME Code paragraph NB-3213.11, Section Ill, 1974.
2b As per Section III of the ASME Code, the Faulted Condition must consider Primary Stresses. The Primary Stresses of LOCA + SSE are the result of the rarefaction wave, the LOCA shaking, and the SSE event. WCAP-7832 and related attachments addressed these stresses. Stresses due to tube vibration at 100% load were not considered in the WCAP due to their relative minor contribution. Investigation of these tube stresses for healthy Series 51 and Model D tubes shows that the maximum bending stresses are less than 3.6 ksi at the top of the U-Bend of the outermost tube. The bending stress due to tube vibration at the top tube support plate for each is 1 ksi. The top tube support is the location of maximum stress due to the LOCA + SSE event, and the addition of this tube vibration stress would produce a negligible effect. This is shown as follows: In a thinned tube this bending due to vibration will result in a stress of 1.6 ksi for a model D tube thinned to .026 "and a stress of 2.2 ksi for a Series 51 tube thinned to .021".
The worst of all the above cases, the thinned Series 51 tube, will result in a total Stress Intensity of 77.3 ksi, this is less than the Section III Code allowable of 78.7 ksi.
3a The allowable stress limit in membrane plus bending for the divider plate material for Faulted Conditions is taken from Appendix F of Section III of the ASME Code and is 1.5(.7)(Su) = 72.4 KSI.
3b By virtue of the full constraint at the periphery of the divider plate, the bending stresses in the divider plate are secondary in nature. This categorization of stress is appropriate as it has been shown that the perimeter of the divider plate meets Section III code allowable for primary membrane stress.