Embed Size (px)
Citation preview

TECHNICAL REPORT STANDARD PAGE
1. Report No. FHWA/LA.11/434
2. Government Accession No. 3. Recipient's Catalog No.
4. Title and Subtitle Statewide Traffic Safety Study Phase II:
Identification of Major Traffic Safety Problem
Areas in Louisiana
5. Report Date April 2012 6. Performing Organization Code
7. Author(s)
Chester G.Wilmot, Haoqiang Fu, Mini
Radhakrishnan, and Meisam Akbarzadeh
8. Performing Organization Report No.
9. Performing Organization Name and Address Louisiana Transportation Research Center and
Department of Civil & Environmental Engineering
Louisiana State University
Baton Rouge, LA 70803
10. Work Unit No.
11. Contract or Grant No. LTRC Project No. 06-1SS
State Project No. 737-99-0649 12. Sponsoring Agency Name and Address Louisiana Transportation Research Center
4101 Gourrier Avenue
Baton Rouge, LA70808
13. Type of Report and Period Covered
Final Report
July 1, 2005-June 30, 2008 14. Sponsoring Agency Code
15. Supplementary Notes
Conducted in Cooperation with the U.S. Department of Transportation, Federal Highway Administration 16. Abstract
This report summarizes a study that seeks to identify the factors leading to the high crash rate
experienced on Louisiana highways. Factors were identified by comparing statistics from the Louisiana
Crash Database with those from peer states using the Fatality Analysis Reporting System (FARS)
database and to the nation as a whole using the General Estimates System (GES) database. Peer states for
Louisiana are Alabama, Arkansas, Colorado, Kentucky, Mississippi, Oklahoma, and Tennessee. A list of 23 problem areas were identified and were then further investigated to try and identify root causes. The
root causes were suggested as including high alcohol-impaired driving, high crash rates among young
drivers, low seatbelt usage, an elevated use of improper driver licenses, speeding, and inadequate
adherence to traffic control. Countermeasures were identified to address some of the main problem areas
and prioritized on their cost, need, and performance.
17. Key Words Road safety, crash rates, Louisiana
18. Distribution Statement Unrestricted. This document is available through
the National Technical Information Service,
Springfield, VA 21161 19. Security Classif. (of this report) Unclassified
20. Security Classif. (of this page)
Unclassified 21. No. of Pages 152
22. Price


Project Review Committee
Each research project has an advisory committee appointed by the LTRC Director. The
Project Review Committee is responsible for assisting the LTRC Administrator or Manager
in the development of acceptable research problem statements, requests for proposals, review
of research proposals, oversight of approved research projects, and implementation of
findings.
LTRC appreciates the dedication of the following Project Review Committee members in
guiding this research study to fruition.
LTRC Planning/Intermodal Research Manager
Chester G. Wilmot
Members
Cathy Gautreaux, Louisiana Motor Transport Association
Glenn Chustz, Louisiana Department of Transportation and Development
Gloria Jones, Louisiana Department of Motor Vehicles
John LeBlanc, Louisiana Department of Public Safety
Dan Magri, Louisiana Department of Transportation and Development
Terri Monaghan, Louisiana Department of Transportation and Development
Mary Stringfellow, Federal Highway Administration
Vicki Scott, Louisiana Department of Motor Vehicles
Directorate Implementation Sponsor
Richard Savoie


Statewide Traffic Safety Study Phase II: Identification of Major Traffic
Safety Problem Areas in Louisiana
by
Chester G.Wilmot
Haoqiang Fu
Mini Radhakrishnan
Meisam Akbarzadeh
Louisiana Transportation Research Center and
Department of Civil & Environmental Engineering
Louisiana State University
Baton Rouge, Louisiana 70803
LTRC Project No. 06-1SS
State Project No. 736-99-0649
conducted for
Louisiana Department of Transportation and Development
Louisiana Transportation Research Center
The contents of this report reflect the views of the author/principal investigator who is
responsible for the facts and the accuracy of the data presented herein. The contents do not
necessarily reflect the views or policies of the Louisiana Department of Transportation and
Development or the Louisiana Transportation Research Center. This report does not
constitute a standard, specification, or regulation.
April 2012


iii
ABSTRACT
This report summarizes a study that seeks to identify the factors leading to the high crash rate
experienced on Louisiana highways. Factors were identified by comparing statistics from the
Louisiana Crash Database with those from peer states using the Fatality Analysis Reporting
System (FARS) database and to the nation as a whole using the General Estimates System
(GES) database. Peer states for Louisiana are Alabama, Arkansas, Colorado, Kentucky,
Mississippi, Oklahoma, and Tennessee. A list of 23 problem areas were identified and were
then further investigated to try and identify root causes. The root causes were suggested as
including high alcohol-impaired driving, high crash rates among young drivers, low seatbelt
usage, an elevated use of improper driver licenses, speeding, and inadequate adherence to
traffic control. Countermeasures were identified to address some of the main problem areas
and prioritized on their cost, need, and performance.


v
ACKNOWLEDGMENTS
The research reported in this document was supported by funding from the Louisiana
Department of Transportation and Development (DOTD). Advice and assistance in the
execution of the project was provided by Dr. Helmut Schneider of the Information Services
and Decision Sciences Department of the E.J. Ourso School of Business at Louisiana State
University, Dr. Brian Wolshon of the Department of Civil and Environmental Engineering at
Louisiana State University, and Dr. Xiaoduan Sun of the Department of Civil Engineering at
the University of Louisiana at Lafayette. Dr. Haoqiang Fu conducted the majority of the
analysis, and graduate students Cherian Korah, Vamshi Madumba, Athira Jayadevan,
Meisam Akbarzadeh, Mini Radhakrishnan, and Hong Zhang contributed to individual aspects
of the study.

vii
IMPLEMENTATION STATEMENT
Eight major problem areas were identified as needing special attention in Louisiana in this
study. As the first step in addressing these concerns, countermeasures have been suggested
that legislators and administrators can implement such as implementing a point system for
drivers and extending the existing Graduated Driver Licensing law to include more stringent
requirements. To assist in identifying those countermeasures that are the most cost-effective,
a prioritization process was developed that identifies countermeasures that provide the
greatest benefit relative to the cost of their implementation. Certain actions are recommended
for implementation.


ix
TABLE OF CONTENTS
ABSTRACT ............................................................................................................................. iii
ACKNOWLEDGMENTS ........................................................................................................ v
IMPLEMENTATION STATEMENT .................................................................................... vii
TABLE OF CONTENTS ......................................................................................................... ix
LIST OF TABLES ................................................................................................................... xi
LIST OF FIGURES ............................................................................................................... xiii
INTRODUCTION .................................................................................................................... 1
OBJECTIVE ............................................................................................................................. 3
SCOPE ...................................................................................................................................... 5
METHODOLOGY ................................................................................................................... 7
Introduction ........................................................................................................................... 7
Data ....................................................................................................................................... 7
Identification of Traffic Safety Problems in Louisiana ........................................................ 9
Safety Performance Functions ............................................................................................ 15
Development of Countermeasures/Strategies ..................................................................... 16
Prioritization of Countermeasure/Strategies ....................................................................... 16
DISCUSSION OF RESULTS................................................................................................. 19
Louisiana’s General Traffic Safety Status .......................................................................... 19
Detailed Analysis of Problem Areas ................................................................................... 33
Analysis of Driver Characteristics .................................................................................. 33
Analysis of Occupant Characteristics ............................................................................. 58
Analysis of Pedestrian Characteristics ............................................................................ 61
Analysis of Roadway Characteristics ............................................................................. 63
Analysis of Crash Characteristics ................................................................................... 72
Analysis of Vehicle Characteristics ................................................................................ 89
Impact of Legislation on Traffic Safety .............................................................................. 91
Identifying the Effect of the Graduated Licensing Law on Traffic Safety ..................... 91
Identifying the Effectiveness of Open Container Law ................................................... 92
Identifying the Effectiveness of the BAC Law ............................................................... 92
Investigating Speed Limit Increase on Rural Two-Lane Roads in Louisiana .................... 93
Crash Severity Prediction ................................................................................................... 95
Problems Areas for Which Countermeasures Were Developed ......................................... 97
Prioritized Countermeasures ............................................................................................... 97
CONCLUSIONS................................................................................................................... 103
RECOMMENDATIONS ...................................................................................................... 109
ACRONYMS, ABBREVIATIONS, AND SYMBOLS ....................................................... 111

x
BIBLIOGRAPHY ................................................................................................................. 113
APPENDIX A ....................................................................................................................... 117
APPENDIX B ....................................................................................................................... 119
APPENDIX C ....................................................................................................................... 133

xi
LIST OF TABLES
Table 1 Comparing estimated alcohol and reported alcohol involvement ............................... 9
Table 2 Problem areas based on FARS comparison .............................................................. 22
Table 3 Problem areas as identified from GES comparison .................................................. 26
Table 4 Cox model estimation results and sample sizes ......................................................... 85
Table 5 Effectiveness of GDL law on young driver motor vehicle crash rates ...................... 92
Table 6 Effectiveness of open container law on alcohol-related motor vehicle crash rates ... 92
Table 7 Effectiveness of BAC law on alcohol-related motor vehicle crash rates .................. 93
Table 8 Effectiveness of BAC law on alcohol-related motorcycle crash rates....................... 93
Table 9 Mixed ordered logit model results ............................................................................. 95
Table 10 Impact of a 10 percent reduction in alcohol involvement ....................................... 96
Table 11 Impact of 10 percent increase in seatbelt usage ....................................................... 96
Table 12 Reduction in crash severity due to speed reduction ................................................. 97
Table 13 Scaled need for the problematic areas ..................................................................... 99
Table 14 Abbreviations for the six possible scenarios.......................................................... 100
Table 15 Crash reduction factors and costs of countermeasures .......................................... 117
Table 16 Prioritized countermeasures under cost-need-performance scenario .................... 119
Table 17 Prioritized countermeasures under cost-performance-need scenario .................... 120
Table 18 Prioritized countermeasures under need-performance-cost scenario .................... 122
Table 19 Prioritized countermeasures under need-cost-performance scenario .................... 124
Table 20 Priortized countermeasures under performance-cost-need scenario ..................... 125
Table 21 Priortized countermeasures under performance-need-cost scenario ..................... 127
Table 22 High priority countermeasures............................................................................... 129
Table 23 Relatively high priority countermeasures .............................................................. 130
Table 24 Comparison of rankings between FIS and B/C ratio method ................................ 133


xiii
LIST OF FIGURES
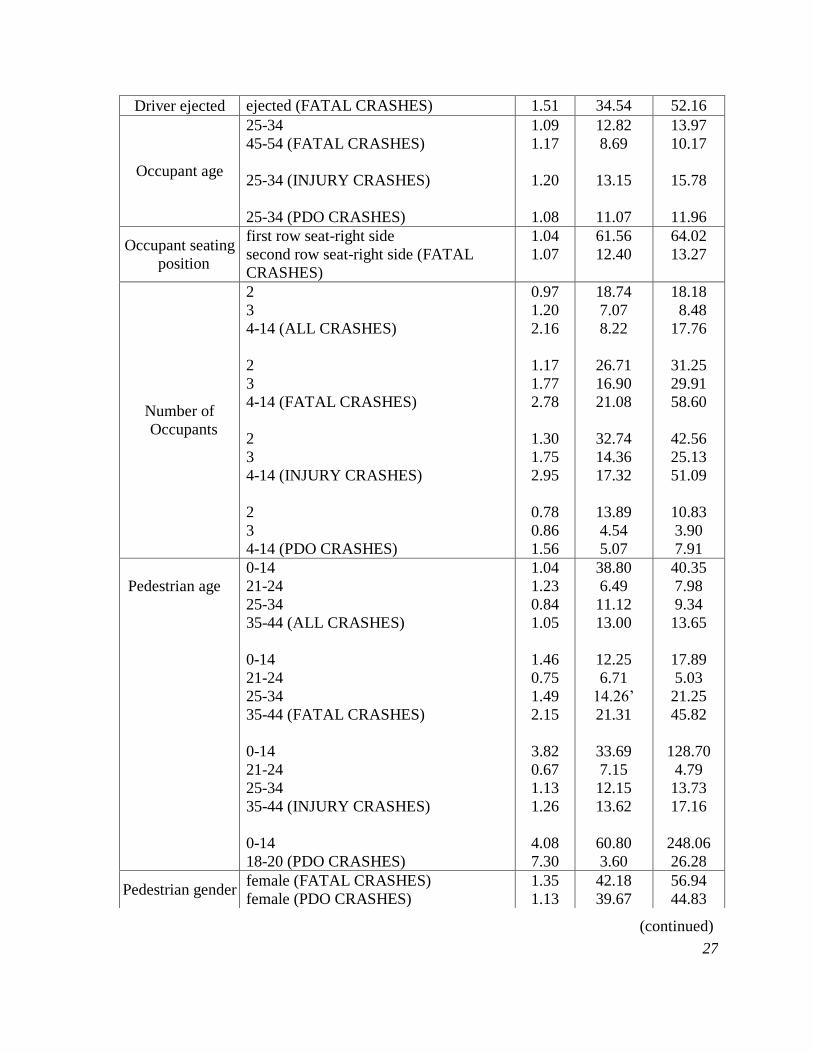
Figure 1 Comparison of fatality rates among states ................................................................ 19
Figure 2 Relative crash rates by severity ................................................................................ 21
Figure 3 Fatal and injury crash rates per 100,000 licensed drivers by gender ........................ 33
Figure 4 Fatalities due to inattention/distraction/illness/fatigue/sleep/blackout by age ......... 34
Figure 5 Seatbelt non-use by severity: all drivers vs. alcohol involved drivers ..................... 35
Figure 6 Highway type distribution for speed-related crashes ............................................... 36
Figure 7 Vehicle miles travelled by highway class ................................................................ 37
Figure 8 Crash rates per 100,000 licensed drivers by type of violation and driver age .......... 38
Figure 9 Motorcycle crash rates by year by severity in Louisiana ......................................... 40
Figure 10 Louisiana motor cyclist percent helmet use from 1999-2004 ................................ 41
Figure 11 Percent of alcohol-related crashes for motor cyclists and all drivers ..................... 42
Figure 12 RCIR values by time of day ................................................................................... 45
Figure 13 Single-vehicle RCIR when no safety restraints were used ..................................... 46
Figure 14 Seatbelt non-use percentage by gender and by number of passengers ................... 47
Figure 15 RCIR by passenger occupancy and age.................................................................. 48
Figure 16 Relative risks for young drivers by number of passengers ..................................... 49
Figure 17 RCIR values by passenger age group ..................................................................... 51
Figure 18 Young driver crash risks by passenger age ............................................................ 52
Figure 19 Relative crash rates for 15- to 17-year-old drivers ................................................. 54
Figure 20 Relative crash rates for 18- to 20-year-old female drivers ..................................... 56
Figure 21 Licensing problems in Louisiana............................................................................ 58
Figure 22 Seatbelt non-use rate per 1,000 population by age and gender .............................. 59
Figure 23 Seating position for occupants 17 years old and under by percentage ................... 60
Figure 24 Frequency distribution by pedestrian age and action ............................................ 61
Figure 25 Pedestrian alcohol-related crashes by age and action ............................................. 62
Figure 26 Center lane mile distribution by highway class ...................................................... 63
Figure 27 Fatality rates by highway class ............................................................................... 64
Figure 28 Crash rates by highway class .................................................................................. 65
Figure 29 Crash rates on rural two-lane highways by width and by alcohol involvement ..... 66
Figure 30 Fatal off-roadway crash distribution by most harmful event ................................. 67
Figure 31 Hour of day distribution of fatal off-roadway crashes ........................................... 68
Figure 32 Percentage of alcohol-related fatal off-roadway crashes by hour of day ............... 69
Figure 33 Crash percentages by posted speed limit ................................................................ 70
Figure 34 Percent crashes in Louisiana by traffic control signal ............................................ 71
Figure 35 Crash distribution by traffic signal type, severity, and driver age.......................... 72
Figure 36 Percent alcohol-related head-on crashes by hour of the day .................................. 73

xiv
Figure 37 Number of rear-end crashes for urban roads by hour of the day ............................ 74
Figure 38 Percentage distribution by highway class for sideswipe crashes ........................... 75
Figure 39 Percentage distribution by number of lanes for sideswipe crashes ........................ 76
Figure 40 Percentage distribution by time of day for sideswipe crashes ................................ 78
Figure 41 Over representation factors by day of week ........................................................... 79
Figure 42 ORF by hour of day ................................................................................................ 80
Figure 43 Crash percentage distribution by hour of day......................................................... 80
Figure 44 Alcohol-related crash percent distribution by hour of day ..................................... 81
Figure 45 Alcohol-related crash percent distribution by hour of day and day of week .......... 82
Figure 46 Louisiana EMS response time for rural and urban areas ........................................ 83
Figure 47 Louisiana urban EMS response time trend 1999-2004 .......................................... 84
Figure 48 Relative chance of repeat DUI offense by driver gender and race ......................... 86
Figure 49 Relative chance of repeat DUI offense by age group ............................................. 87
Figure 50 ORF by cargo type.................................................................................................. 90
Figure 51 Day of week frequency distribution for three cargo type trucks ............................ 90

INTRODUCTION
Highway safety is an enormous problem in Louisiana. Approximately 160,000 crashes occur
in the state each year, over 90,000 of which are on the state-maintained highway system. On
average, more than 900 people are killed and about 50,000 injured in automobile crashes in
Louisiana each year. In the last decade, Louisiana has consistently been featured among the
states with the highest fatality rate in the nation, and in 2001 it tied with Montana and South
Carolina for the highest rate. In that year, Louisiana’s fatality rate was 2.3 per 100 million
miles traveled, while the national average was 1.5.
Louisiana’s high crash rate has significant economic and social costs. Property damage, lost
productivity, medical expenses, and inflated motor vehicle insurance rates imposed an
estimated $5.3 billion burden on the state in 2002 (HRSG, 2004). These costs are not
distributed equally; fatality rates among 16- to 20-year olds in Louisiana are double that of
other ages (HSRG, 2005). While improvement of road safety is a national objective, the
conditions in Louisiana are sufficiently dire to justify an independent study into the cause of
these conditions and what can be done about it. That is the purpose of this study.
In Phase I of the Statewide Traffic Safety Study from which this study grew, effort was
focused on conducting a review of state-of-the-art road safety in Louisiana, in the nation, and
to a limited extent, internationally. The review included studies on factors influencing road
safety, identification of available data, safety legislation, safety initiatives and programs, and
safety related funding (Wilmot, et al., 2005). This study (Phase II) identifies the traffic safety
problem areas in the state and conducts detailed analysis on these areas to better understand
their underlying causes. After identifying the major causes for Louisiana high crash rates,
countermeasures are introduced and evaluated according to their effectiveness in combating
Louisiana traffic safety problems. Finally, strategies to improve Louisiana traffic safety are
recommended.


3
OBJECTIVE
The objective of this study was to identify and quantify the factors leading to the high crash
rate in the state of Louisiana. A secondary objective was to develop countermeasures to
address the identified factors and prioritize their application based on cost effectiveness.


5
SCOPE
The research in this study was restricted to traffic safety in Louisiana, and its main emphasis
is on identifying factors that distinguish Louisiana from other states in regard to traffic
safety. Because human factors are generally accepted as being the major cause of crashes
(Dewar and Olson, 2002), the study was directed to include as many human factors in the
analysis as possible. However, the scope did include consideration of roadway and vehicle
factors as well although they were not emphasized. The analysis included a tentative
consideration of countermeasures.
The study was aimed at identifying current conditions in Louisiana and comparing them with
peer states (Alabama, Arkansas, Colorado, Kentucky, Mississippi, Oklahoma, and
Tennessee) and the nation. To get a representative picture of current conditions, the most
recent six years of data available at the start of this study (1994-2004) was used, although
some aspects of the study used local data up to 2006 (e.g., investigation of the impact of
legislation on road safety).


7
METHODOLOGY
Introduction
The basic approach adopted in this study was to use data of past crashes to identify the
characteristics of crashes where Louisiana has unusually high values when compared to other
states. When possible, Louisiana is compared to peer states; otherwise, comparisons are
drawn to national averages. The data used in the analysis, and the method used to conduct the
analysis to draw comparisons, develop countermeasures, and prioritize their application are
explained below.
Data
Data used in this study included the FARS, GES, the Highway Safety Research Group crash
database, the DOTD crash database, and the DOTD segment data for the period
1999 - 2004. These data sources were reviewed and are described in the Phase I report of the
project (Wilmot et al., 2005). The LSU Highway Safety Research Group Web site, which is
maintained by Louisiana State University, was also used to obtain additional information,
such as demographics of driver and population. Traffic Safety Fact documentation from the
National Highway Traffic Safety Administration (NHTSA) was also accessed.
The FARS database consists of an annual record of all fatal crashes in the U.S. by state and
was used to compare Louisiana’s fatal crash record with peer states. FARS contains data on
approximately 40,000 fatal crashes per year. The GES database contains an annual, national
sample of police-reported traffic crashes of all severity levels. It was used to compare
Louisiana’s crash record with the nation as a whole. The GES data set contains information
on approximately 50,000 crashes per year.
The Louisiana Crash Database, which is a relational database, has several tables including a
crash table, vehicle table, occupancy table, pedestrian table, and two tables related to train-
related crashes. The train-related crash tables were not used in this analysis. For the period of
six years from 1999 to 2004, the crash table has 962,210 records; the vehicle table has more
than 1,828,325 records; the pedestrian table has 9,864 records, and the occupancy table has
494,163 records.
The DOTD crash database is an aggregated version of the Louisiana crash database, with
additional roadway information such as average daily traffic and road geometric data added
to it. This additional information was available only for state and national highways; parish

8
and city roads were excluded. All the data were stored in one crash table that has 962,284
records.
In general, crash databases have information on the crashes, vehicles, and persons involved.
Crash information includes general crash characteristics and the environmental and roadway
conditions at the time of each crash; vehicle information describes the vehicles involved in
each crash; and person information describes the characteristics of the people involved in the
crashes: drivers, passengers, pedestrians, and pedal cyclists.
The combined databases were reviewed for integrity and quality. A thorough understanding
of the variables and their relationships were obtained. The query functions in Microsoft
Access were used as the main tool for data query. The queries were often presented in the
form of pivot tables to facilitate data retrieval.
The Louisiana crash databases record crash severities in five categories: fatal,
incapacitating/severe, non-incapacitating/moderate, possible/complaint, and no injury. These
five crash severities were converted into fatal, injury, and property damage only (PDO)
crashes in the analysis conducted in this study. Fatal crashes correspond to severity 1; injury
crashes include severities 2 through 4, and PDO are equivalent to 5 on the original five-
category scale.
The data provides two ways of determining alcohol-related crashes. The first involves
reported driver Blood Alcohol Content (BAC) level (> 0), driver alcohol presence (yes), and
driver condition (drinking). If any of those variables are positive, the crash is considered
alcohol-related. However, BAC levels or other alcohol-identifying properties of the driver
are not always reported, resulting in underreporting of alcohol-related crashes if only
reported alcohol-involvement is relied upon (Pollock et al., 1987; Williams and Wells, 1993;
McCarthy et al., 2009). The NHTSA routinely imputes alcohol involvement in the FARS
database for cases where direct evidence of alcohol involvement is not available (Rubin,
Schafer, and Subramanian, 1998; NHTSA, 2002a). A similar process has been applied to the
Louisiana crash database by the Highway Safety Research Group (HSRG) in the Department
of Information Systems and Decision Sciences (ISDS) at LSU to add imputed estimates of
alcohol-involvement in the Louisiana data set (Schneider, 2005). In this procedure, 11
variables from the crash record are used to infer alcohol use including reported alcohol use,
hour of the day, day of the week, crash severity, driver restraint system use, driver age, driver
gender, vehicle body type, number of vehicles involved, most harmful event, and violations
charged. The Louisiana crash database includes this variable of estimated alcohol-related

9
crashes. A cross tabulation of reported and estimated alcohol-related crashes from the
Louisiana crash database are shown in Table 1. Within each crash severity category, the
percentages show the percentage satisfying both conditions simultaneously. For example,
among fatal crashes, both methods agree on 54.0 percent of the cases as being not related to
alcohol and 30.4 percent of the cases as being alcohol-related. However, the estimation
method identifies a further 15.1 percent as involving alcohol that were not designated as such
in the reported method. The percentages in each severity category add up to 100 percent.
Table 1
Comparing estimated alcohol and reported alcohol involvement
Estimated
alcohol
involvement
Reported alcohol involvement (%)
Fatal Injury PDO
no alcohol alcohol no alcohol alcohol no alcohol alcohol
no alcohol 54.0 0.5 89.5 0.1 94.7 0.0
alcohol 15.1 30.4 2.3 8.1 1.8 3.5
As expected, the results indicate that more alcohol-related crashes are identified using the
estimated method than the reported method, because many alcohol-related cases go
unreported. The more severe the crash, the greater the proportion of alcohol-related crashes.
Identification of Traffic Safety Problems in Louisiana
DOTD identified seven states as peers for transportation comparison purposes. The states
were selected using a wide array of measures, including population, congestion, safety, and
budget. The official peer states of Louisiana are Alabama, Arkansas, Colorado, Kentucky,
Mississippi, Oklahoma, and Tennessee. Texas and Florida were also included in the analysis
even though they are not peer states.
FARS contains fatal crash data by state and thus allows comparison of the fatal crash
characteristics between Louisiana and peer states. The GES database, on the other hand, has
data on crash severity (fatal, injury, and PDO) but does not have data at the state level. GES
is based on a random sample of police jurisdictions in the country and, therefore, provides an
estimate of national conditions. This enabled researchers to draw comparisons between
Louisiana (using Louisiana safety databases) and the rest of the nation with respect to crashes
of different severities.
10
During the comparison, FARS, GES, and the Louisiana crash database were employed.
Effort was made to compare every relevant variable available for comparison. Examples of
the variables that were used in the analysis are: roadway functional class, roadway alignment,
roadway profile, roadway surface conditions, traffic control devices, traffic flow, age of the
driver and occupants, injury severity, alcohol and drug involvement, restraint systems use,
vehicle maneuver, most harmful event, licensing state, rollover, vehicle speed, body type,
commercial vehicles, violations charged, previous driving while intoxicated (DWI)
convictions, temporal and atmospheric conditions, most harmful event, light condition, and
manner of collision. Statistics such as the crash rate per 100 million vehicle miles traveled,
per 1,000 licensed drivers, or by functional class of roadway, were also compared to assess
Louisiana’s traffic safety status in the nation and among peer states.
It is typical in safety analysis to account for exposure when reporting crash statistics so as to
account for the opportunity for crashes to occur by the presence of more or less traffic. Thus,
rather than report the total number of crashes occurring on a facility per year, it is generally
more meaningful to express crash incidence in terms of the number of crashes per 100
million vehicle miles traveled on the facility. Other rates may also be used, such as crashes
per million population, per 1000 licensed drivers, per registered vehicle, or per lane mile, but
these denominators in the rate calculation are generally not good measures of crash exposure.
More bothersome though, is the fact that the value of the denominator in the rate calculation
is often not known for subpopulations in which researchers are interested. For example, for
subdivisions of the population distinguished by age, gender, or ethnic group, the denominator
of vehicle miles traveled (VMT) is not known, and therefore the crash rate accounting for
exposure cannot be established. Other subdivisions of the data, such as alcohol-related versus
non alcohol-related crashes, or vehicles with different numbers of occupants, create the same
problem. In fact, the more data are broken down into subdivisions, the more difficult it
becomes to express crashes as a rate in terms of VMT, or other less pertinent denominators
such as population, drivers, registered vehicles, or lane miles of highway. Unfortunately, it is
essential to break down crashes in Louisiana if the source of the elevated crash statistics is to
be identified.
The approach adopted in this study to identify aberrant subgroups was to observe where the
proportion of crashes in these subgroups in Louisiana were different to those in peer states, or
in the nation. For example, the proportion of alcohol-related crashes in Louisiana were
compared to the proportion of alcohol-related crashes in peer states, and the proportion of
fatalities in a certain age group were compared between Louisiana and elsewhere. In
11
addition, the rate of change in the proportion of crashes of different types were observed over
time. This was done to detect whether conditions were deteriorating or improving over time.
The comparison was conducted by statistically comparing the proportion of crashes by
category between Louisiana and those in peer states or the nation. Because the FARS and
GES datasets generated approximately 40,000 and 50,000 observations per year,
respectively, the number of observations in each category was expected to be large enough to
justify a normal approximation to the binomial distribution and use of the following test
statistic to test the significance of the difference in proportions between the test and control
datasets in each category (Freund, 2004):
)1(11
*)1(*21
2
2
1
1
nnpp
n
x
n
x
z
where,
x1 = crash frequency of the crash category tested in the Louisiana data,
x2 = crash frequency of the same crash category in the control data (peer state or nation),
n1 = total crash frequency in the Louisiana data,
n2 = total crash frequency in the control crash data, and
21
21*
nn
xxp
The null hypothesis is that the two proportions are the same. The alternative hypothesis is
that the proportion of crashes in Louisiana is higher than in the control crash data (i.e., it is a
one-sided test). Subsequently, if the test statistic above is larger than the normal standard
deviate at the 95 percent level of significance (1.64), the null hypothesis is rejected,
indicating over representation of crash rates in Louisiana relative to the control environment.
To quantify the degree of over representation, an over representation factor (ORF) was
developed to indicate by its magnitude the degree to which conditions in Louisiana exceed
those elsewhere. The ORF is defined as:
)2(2
2
1
1
n
x
n
xORF
12
Clearly, if the ORF is less than one, the crash category in Louisiana is under-represented,
and, conversely, if larger than one, the classification is over represented. However, an over
represented area is not necessarily a problem area of traffic safety; rather, it is a potential
problem area only. For example, if rural two-lane road crashes in Louisiana are over-
represented, it may indeed mean rural two-lane roads in Louisiana have more traffic safety
problems, but it may also mean that Louisiana has proportionately more rural two-lane roads,
so a greater proportion of the crashes in the state occur on these types of roads. Thus, further
analysis of over-represented areas is often warranted to determine whether they represent
safety problems or not. ORFs were calculated for fatal, injury, and PDO crashes separately,
as well as for all crashes combined.
It must be noted that the test identifying a significant positive difference in proportion of
crashes of a certain category, or an ORF in excess of one does not necessarily indicate that
crashes in the category in question are more prevalent in Louisiana than elsewhere. If
conditions in the two environments (Louisiana and that of the comparison area) are the same,
then the difference in proportions will provide similar results to those that would be obtained
with a statistic that was normalized for exposure and other possible differences. However,
when the conditions in the two environments are different, the difference in proportions will
be biased up or down depending on the nature of the difference in environments. To
accommodate this, ORFs were used only as an indicator of a potential problem in this study,
and ORFs of a certain magnitude were required before further investigation was conducted.
In addition, confirmation of a problem by large ORFs in associated categories was required
before the ORF was allowed to motivate further investigation of the crash category.
Categories of crashes with moderate to severe potential safety problems were considered for
inclusion in the initial list of problem areas. The criteria used to classify categories as
moderate to severe problem areas were based on the ORF and the proportion of cases the
category forms of the whole. The former represents how serious the problem area is in
Louisiana and the latter how widespread it is. For example, if crashes involving 15-year-old
drivers in Louisiana were found to be over represented, the ORF and the proportion of 15-
year-old drivers among all drivers in Louisiana were taken into account. Those areas with at
least five percent of crash percentage and an ORF of at least 105 percent were first selected.
However, if an area had an ORF of at least 200 percent, then the area was selected no matter
how small the crash percentage was. Considerable effort was made to include as many
human factor areas in the analysis as possible. This first selection was conducted for fatal,
injury, and PDO crashes as well as for total crashes.
13
The list of areas from the first selection was then reviewed and some areas were eliminated.
Reasons for elimination included not having enough sample size for the area, items for which
reported values were possibly biased or incorrect, data incompatibility between GES and
Louisiana Crash Database, or the two databases having disproportionate amounts of missing
data. If the sample size was too small, then the confidence of the ORF was compromised; if
the definition of a variable was different in the two databases, then the ORF would be
meaningless; if the two databases had disproportionate amounts of missing data, then the
ORF value would not be reliable.
In the final preparation of the list of problem areas, more detailed analysis was conducted on
the Louisiana safety data. The objective was to try to find the root cause of the problems
behind the high ORF and crash percentages. Whether the identified categories were the
source of the problem, or whether they were merely correlated with other variables that were
the cause of the problem, was investigated. For example, if the age of a driver was found to
be significant in describing high crash rates, it was explored whether age, or factors
associated with age such as inexperience, caused the high crash rates. The product of this
process was a final list of the major factors associated with traffic safety problems in
Louisiana.
The methodology above employed compared conditions in Louisiana with conditions in peer
states or the nation. However, it is sometimes more convenient, or more appropriate, to
compare conditions in different categories within the same data set. When this occurs, it is no
longer comparing like with like, and the above procedure employing ORFs no longer applies.
For example, with the procedure using ORFs to measure the comparison, it is appropriate to
compare the proportion of crashes involving 15-17 old drivers in Louisiana with the
proportion of crashes of similar aged drivers in other states. However, to compare the
proportion of crashes of 15-17 old drivers with the proportion of crashes of another age
group in the same data set, the problem of exposure arises. That is, how much do the two
groups travel and, therefore, how much are they each being exposed to the possibility of
being in a crash. Under these conditions, the ORF is no longer an appropriate measure since
the denominators in the proportions are the same, and the ORF therefore becomes the
number of crashes in the two age groups. This does not reflect relative crash rate but the ratio
of crash incidence (i.e., crash occurrence), and crash incidence is heavily affected by
exposure (i.e., presence on the road). For example, if there are more drivers in one age group
than another, or if one age group travels more than the other, a large number of crashes in
one group may be due to greater exposure rather than a greater tendency to have a crash.

14
Some researchers have developed measures that incorporate exposure within the formulation
of their crash statistic (Thorpe, 1967; Carr, 1970). The most popular of these methods is the
so-called Quasi-Induced Exposure Technique. In this method, the number of not at fault
drivers in multi-vehicle crashes is taken as a proxy for exposure; the larger the number of not
at fault drivers, the greater the assumed exposure. Crash propensity is measured by a statistic
called the Relative Crash Involvement Ratio (RCIR), which is defined as the ratio of
proportion of drivers at fault in a specific subgroup to the drivers not at fault from the same
subgroup. For both single and multi-vehicle crashes, RCIR is calculated using not at fault
drivers for multi-vehicle crashes in the denominator. If the RCIR is greater than one, it
indicates that the particular subgroup of drivers is more prone to cause crashes. For example,
if data being analyzed show that among young drivers (e.g., drivers aged 15-17) there were
16,000 single-vehicle crashes of which 12,000 involved male drivers, and 20,000 multi-
vehicle crashes in which 7,500 male drivers and 12,500 female drivers were considered not at
fault, then the RCIR for young male and young female drivers in single-vehicle crashes is:
RCIR young male drivers in single-vehicle crashes =
RCIR young female drivers in single-vehicle crashes =
The quasi induced exposure technique was used in this study to measure the effect
passengers have on the safety record of teenage drivers. The effect of age and gender of
passengers and driver on road safety were studied using this approach.
Other problem areas studied in greater detail in this study include the effect of graduated
driving license laws on safety, the effect of mandatory helmet law on motorcycle crashes
(after repeal in 1999 and reenactment in 2004), the effect of blood alcohol content law on
both motor vehicle and motorcycle crashes, and, finally, the effect of open container law on
alcohol crashes.
To study the effect of legislation on crash rates, 20 percent of the data from the LADOTD
crash database was collected from 1995-2006. The data for the 12 years were combined into
one dataset. In the analysis, crash rate per month per unit population at each severity level
was used as the dependent variable. Four models were developed for each law investigated
for both motorcycle and motor vehicle crashes. Analysis of Variance (ANOVA) was used to
identify the effects of different independent factors on crash rate for each crash severity type.

15
Traffic laws were included among the independent variables in the form of dummy variables
and the significance of the dummy variable used to determine the significance of the law.
Initially, the variables which influenced crash rate were identified using one way ANOVA
and then the effect of traffic laws on crash rate in the presence of these variables was studied
using two-way ANOVA. If a variable was identified as significant in influencing crash rates
in both tests, it was included in identifying the effectiveness of legislation along with other
variables for further analysis.
Safety Performance Functions
A safety performance function is an expression describing the relationship between the
frequency or severity of crashes and features or characteristics of a road on which the crashes
occur. Safety performance functions serve multiple purposes. First, they can be used as a
means of identifying contributing factors/problem areas in place of ORFs (over-
representation factors) or RCIRs (Relative Crash Involvement Ratios). Second, safety
performance functions help identify effective countermeasures by quantifying their safety
impact.
In this study, a crash severity prediction model was developed that uses human and roadway
characteristics to predict crash severity given a crash has occurred. An ordered mixed logit
model was found to estimate these conditions most accurately. Fifteen independent variables
were considered as candidate variables: driver’s age, driver’s seatbelt use, driver’s alcohol
involvement, vehicle operating speed, driver ejected from the vehicle, airbag deployed, head-
on collision, driver distracted, reckless driving, failing to yield, tailgating, obscured vision,
driver gender, curved roadway crashes, and rural two-lane highway crashes. The independent
variables were evaluated based on the sign and the significance of the coefficients of the
factors. Goodness of fit was measured by the likelihood ratio index and by comparing the
aggregated shares of each severity level with the observed shares where aggregated shares
are the average probability of a crash at each severity level that the model predicted for all
the drivers involved in a crash times the total number of drivers.
The model was used to evaluate the impact on severity of a percentage change in alcohol
involvement, seatbelt use, and vehicle operating speed. Published crash reduction factors
were used to estimate the percentage change in crashes that would result from a particular
countermeasure, and then the model was used to estimate the countermeasure’s effect on
crash severity. The safety impact of countermeasures was assessed using the aggregated

16
share of crashes at each severity level before and after the implementation of a
countermeasure.
Development of Countermeasures/Strategies
For each of the major causes of Louisiana traffic safety problems identified, strategies and
countermeasures were developed. One of the major sources of potential countermeasures was
the National Cooperative Highway Research Program (NCHRP) Report 500, which provides
countermeasures and guidance for implementation in the 22 emphasis areas of the American
Association of State Highway and Transportation Officials (AASHTO) highway safety plan.
Effort was made to estimate the performance of each strategy and countermeasure
quantitatively through the assessment of a crash reduction factor (CRF). A CRF is defined as
the percentage crash reduction that is expected to follow implementation of a given
countermeasure. A related measure, an accident modification factor (AMF), is the factor
current crashes can be multiplied by to estimate the number of crashes that will occur after
implementation of a countermeasure. An AMF is (1-CRF) of the same countermeasure. For
example, a CRF of 10 percent is equivalent to an AMF of 0.9.
One of the countermeasures for which there is little information on CRFs is legislation −
either in promulgating new laws or changing existing laws. In order to have a better
understanding of the impact of legislation on certain problem areas such as alcohol-related
and teenage driver crashes, a special investigation was conducted to determine the impact of
past legislation on crashes in Louisiana. As mentioned earlier, Analysis of Variance was
used to estimate the effect of legislation on crashes in Louisiana in the presence of other
factors.
Prioritization of Countermeasure/Strategies
Countermeasures were evaluated based on a measure that combines the need, performance,
and cost of a countermeasure into a single value:
1. Need is the extent to which conditions in Louisiana are inferior to conditions
elsewhere. To estimate need, the difference in the number of crashes in Louisiana
and the nation at each severity level is multiplied by the standard cost of a crash at
that severity level and summed over the severities.
2. Performance is measured by the reduction in crashes that it is estimated would result
from implementing the countermeasure, where the reduction is measured in dollars in
the same way as need was measured previously.
17
3. Cost is the estimated cost of implementing the countermeasure.
It is postulated that priority is directly related to need and performance (i.e., priority increases
as need increases and the ability of the countermeasure to alleviate that need improves) and
inversely related to the cost of the countermeasure. Thus, a priority index is formulated that
increases with increased need and performance and decreases with increased cost:
)3(Cost
formanceNeed * PerindexPriority
The magnitude of the index reflects the priority of the countermeasure; a value of zero
indicates no priority (i.e., no motivation for implementation), while increasing positive
values of the index signify increasing priority. By multiplying the extent of the problem (as
expressed by need) by how much it can be improved (measured by performance), a measure
of achievable alleviation is obtained. By dividing this by the cost, a measure of alleviation
efficiency is established. Thus, countermeasures that receive the highest priority are those
that address serious remediable problems at lowest cost.
It is worthwhile noting that the priority index formulated in equation (3) differs from the
benefit/cost (B/C) ratio approach often adopted in selecting among countermeasures in other
studies. A B/C ratio is obtained by dividing performance by cost. Benefit/cost ratios measure
investment efficiency and therefore prioritize by return on investment. Interestingly, the
Sufficiency Rating approach often used to prioritize road improvements uses the opposite
approach; it uses the need to establish priority and neglects performance. Using the product
of need and performance and dividing by cost, as done in this study, ensures priority is
awarded to cases where need alleviation is achieved most efficiently
The cost of implementing certain countermeasures may be difficult to estimate. In these
cases, if benefit/cost ratios are available, they can be multiplied by need (as defined above) to
estimate a priority index comparable to that established in equation (3).
In this study, a Fuzzy Inference System (FIS) was developed to prioritize countermeasures
based on cost, need, and performance (Akbarzadeh, 2009). The system allows an analyst to
assign different levels of importance to need, performance, and cost to accommodate
situations where the importance of each component is different. For example, in a situation
where safety is observed to be particularly deficient in relation to peer states but the
economic climate in the state is good, a ranking of need as the most important criterion,

18
followed by performance as less important, and cost as the least important criterion would be
appropriate. Conversely, poor economic conditions and moderate safety needs would suggest
the reverse of the previous ranking.
The inference system is capable of being run under all six possible permutations of decision
criteria. In developing the procedure, input on problem severity was gathered from previous
research on safety conditions in Louisiana, and research conducted as part of the
development of the Traffic Safety Manual was used to estimate cost and the crash reduction
potential of individual countermeasures.
19
DISCUSSION OF RESULTS
Louisiana’s General Traffic Safety Status
To objectively estimate Louisiana traffic safety status, commonly used criteria were used.
These criteria included crash rates per 100 million vehicle miles traveled (VMT), per
100,000 population, per 100,000 registered vehicles, and per 100,000 licensed drivers. Data
used were mainly from FARS, GES and the Louisiana Crash Database.
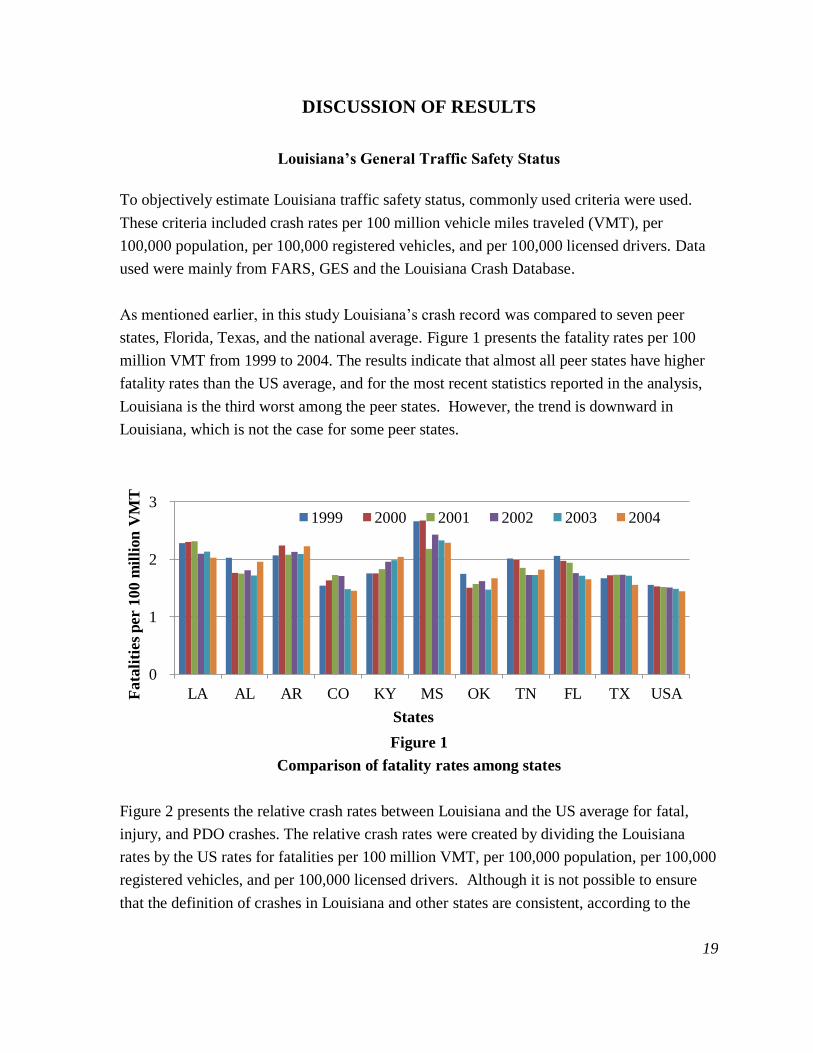
As mentioned earlier, in this study Louisiana’s crash record was compared to seven peer
states, Florida, Texas, and the national average. Figure 1 presents the fatality rates per 100
million VMT from 1999 to 2004. The results indicate that almost all peer states have higher
fatality rates than the US average, and for the most recent statistics reported in the analysis,
Louisiana is the third worst among the peer states. However, the trend is downward in
Louisiana, which is not the case for some peer states.
Figure 1
Comparison of fatality rates among states
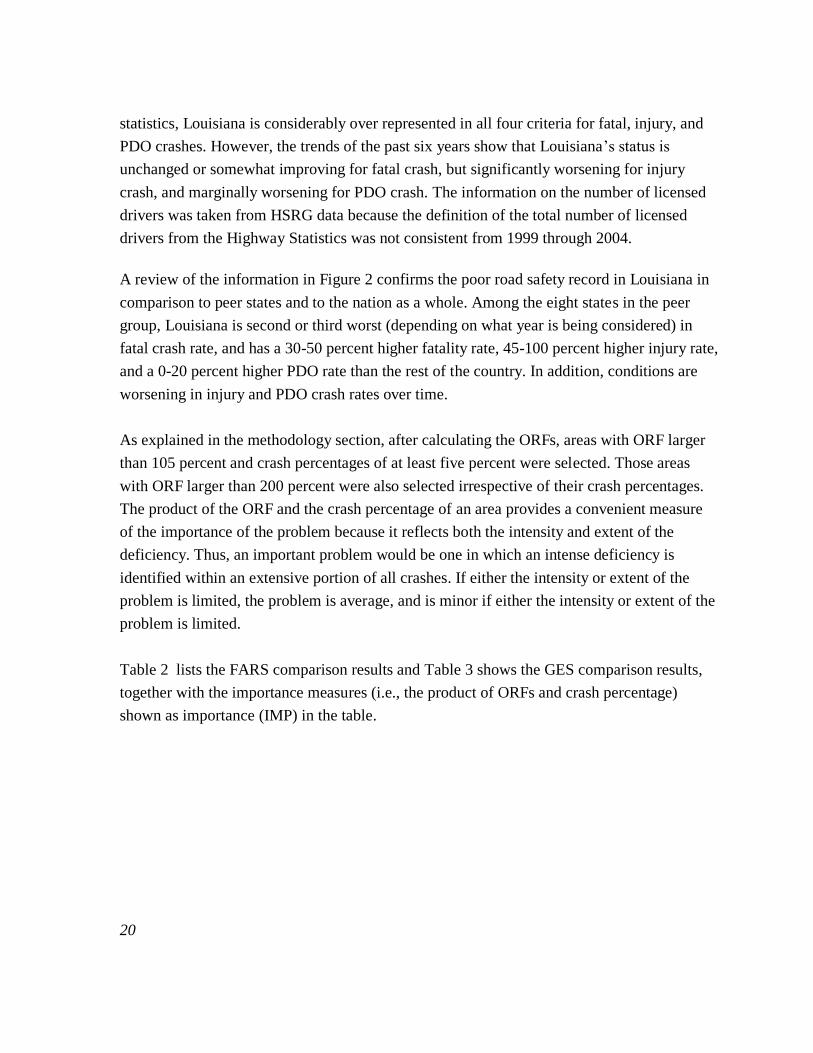
Figure 2 presents the relative crash rates between Louisiana and the US average for fatal,
injury, and PDO crashes. The relative crash rates were created by dividing the Louisiana
rates by the US rates for fatalities per 100 million VMT, per 100,000 population, per 100,000
registered vehicles, and per 100,000 licensed drivers. Although it is not possible to ensure
that the definition of crashes in Louisiana and other states are consistent, according to the
0
1
2
3
LA AL AR CO KY MS OK TN FL TX USA
States
1999 2000 2001 2002 2003 2004
Fata
liti
es
per 1
00 m
illi
on
VM
T
20
statistics, Louisiana is considerably over represented in all four criteria for fatal, injury, and
PDO crashes. However, the trends of the past six years show that Louisiana’s status is
unchanged or somewhat improving for fatal crash, but significantly worsening for injury
crash, and marginally worsening for PDO crash. The information on the number of licensed
drivers was taken from HSRG data because the definition of the total number of licensed
drivers from the Highway Statistics was not consistent from 1999 through 2004.
A review of the information in Figure 2 confirms the poor road safety record in Louisiana in
comparison to peer states and to the nation as a whole. Among the eight states in the peer
group, Louisiana is second or third worst (depending on what year is being considered) in
fatal crash rate, and has a 30-50 percent higher fatality rate, 45-100 percent higher injury rate,
and a 0-20 percent higher PDO rate than the rest of the country. In addition, conditions are
worsening in injury and PDO crash rates over time.
As explained in the methodology section, after calculating the ORFs, areas with ORF larger
than 105 percent and crash percentages of at least five percent were selected. Those areas
with ORF larger than 200 percent were also selected irrespective of their crash percentages.
The product of the ORF and the crash percentage of an area provides a convenient measure
of the importance of the problem because it reflects both the intensity and extent of the
deficiency. Thus, an important problem would be one in which an intense deficiency is
identified within an extensive portion of all crashes. If either the intensity or extent of the
problem is limited, the problem is average, and is minor if either the intensity or extent of the
problem is limited.
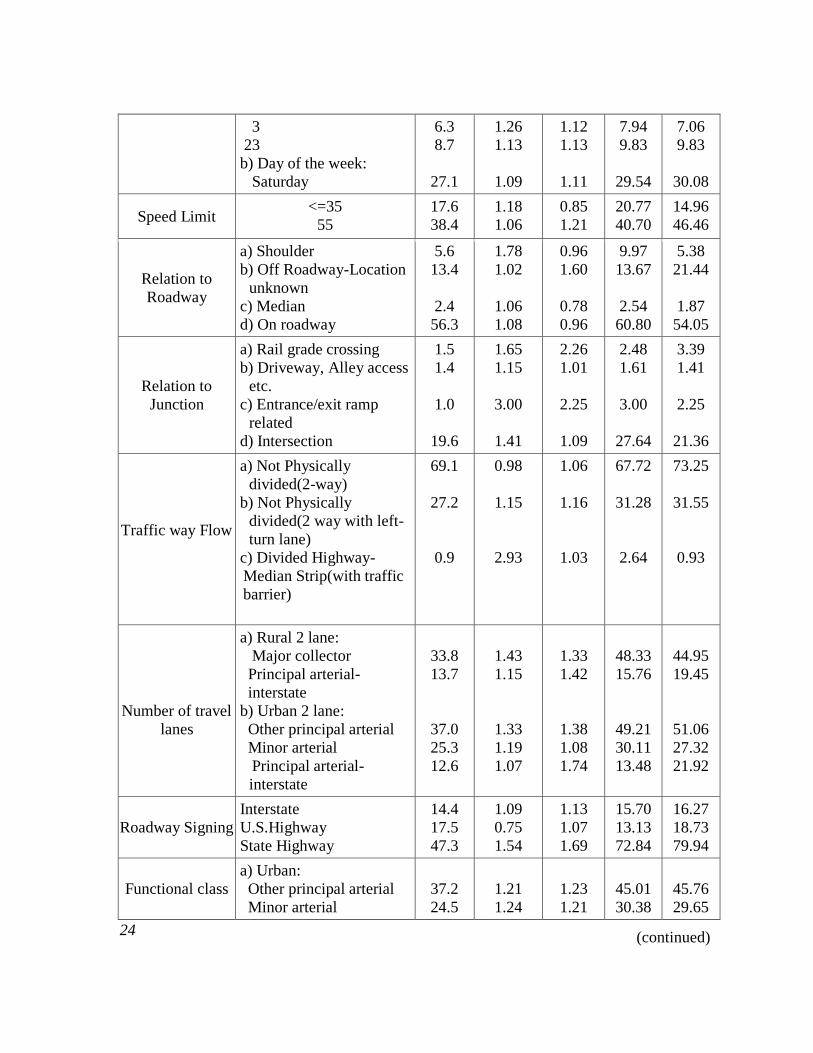
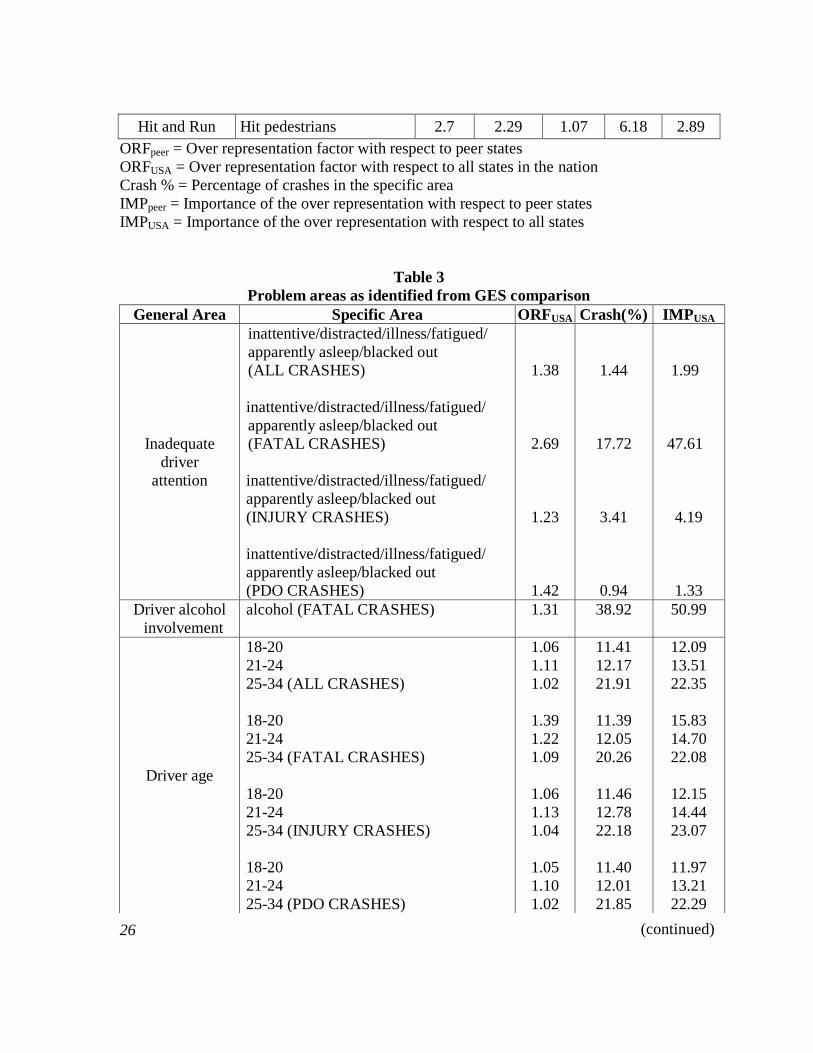
Table 2 lists the FARS comparison results and Table 3 shows the GES comparison results,
together with the importance measures (i.e., the product of ORFs and crash percentage)
shown as importance (IMP) in the table.
21
Figure 2
Relative crash rates by severity
0%
50%
100%
150%
200%
Fatality per 100
Million Miles
Fatality per
100,000 Population
Fatality per
100,000 Registered
Vehicles
Fatality per
100,000 Licensed
Drivers
Fatality 1999 2000 2001 2002 2003 2004
Lou
isia
na's
rela
tive c
rash
rate
0%
50%
100%
150%
200%
250%
Injury per 100
Million Miles
Injury per 100,000
Population
Injury per 100,000
Registered Vehicles
Injury per 100,000
Licensed Drivers
Injury
Lou
isia
na's
rela
tive c
rash
rate
0%
20%
40%
60%
80%
100%
120%
140%
PDO per 100
Million Miles
PDO per 100,000
Population
PDO per 100,000
Registered Vehicles
PDO per 100,000
Licensed Drivers
PDO
1999 2000 2001 2002 2003 2004
Lou
isia
na's
rela
tive c
rash
rate

22
Table 2
Problem areas based on FARS comparison
General Area Specific Area Crash%
(1)
ORFpeer
(2)
ORFUSA
(3)
IMPpeer
(1)*(2)
IMPUSA
(1)*(3)
Human factor Alcohol-related fatalities 45.8 1.22 1.17 55.88 53.59
Posted Speed
Under 25 mph
35 mph
50-60 mph
70 mph
2.1
27.6
38.4
23.7
2.62
1.31
1.06
1.24
3.52
1.09
1.21
1.75
5.50
36.16
40.70
29.39
7.39
30.08
46.46
41.48
Driver age
Age 18-20
21-24
25-34
Male 18-20
Male 21-24
Male 25-34
Female 18-20
Female 21-24
Female 25-34
10.3
11.8
21.7
10.2
12.2
22.0
10.5
10.5
20.7
1.07
1.11
1.06
1.09
1.13
1.08
1.03
1.05
1.03
1.07
1.09
1.07
1.07
1.10
1.06
1.08
1.11
1.09
11.02
13.10
23.00
11.12
13.79
23.76
10.82
11.03
21.32
11.02
12.86
23.22
10.91
13.30
23.32
11.34
11.66
22.56
Driver with
alcohol
Age 25-34
35-44
Male age 21-24
Male age 25-34
28.6
23.6
17.8
29.1
1.04
1.01
1.08
1.08
1.07
1.07
0.97
1.09
29.74
23.84
19.22
31.43
30.60
25.25
17.27
31.72
Highest BAC >0.8
<0.8
15.2
3.5
1.15
1.49
1.02
1.19
17.48
5.22
15.50
4.17
Driver Licensure
a) CDL invalid
b) Non-CDL license
c) Endorsement not
complied with
d) Not licensed or not
valid license
11.7
17.1
0.6
17.2
2.81
1.43
13.75
1.35
2.07
1.52
6.11
1.40
32.88
24.45
8.25
23.22
24.22
25.99
3.67
24.08
Vehicle body
type
a) Light truck & Van
b) Buses
c) Motorcycles
31.6
0.4
5.3
1.09
1.17
1.23
1.21
0.70
0.95
34.44
0.47
6.52
38.24
0.28
5.04
Vehicle Type Hazardous cargo 0.8 2.18 2.11 1.74 1.69
Vehicle
Maneuver
a) slowing/stopping in
traffic lane
1.3
1.30
1.07
1.69
1.39
(continued)

23
b) Starting in traffic lane
c) Stopped in traffic lane
d) changing lanes/merging
2.1
3.7
4.6
1.84
1.59
3.99
2.03
1.19
2.59
3.86
5.88
18.35
4.26
4.40
11.91
Violations
charged
a) reckless/careless/hit-
and-run
b) equipment
c) impaired offenses
d) non-moving license and
registration violations
e) rules of the road-wrong
side, passing & following
f) rules of the road-
Turning, yielding, signaling
5.3
0.6
1.6
1.0
0.6
0.6
3.32
3.08
2.10
1.41
3.93
2.08
2.82
3.03
1.54
1.41
3.00
1.36
17.60
1.85
3.36
1.41
2.36
1.25
14. 95
1.82
2.46
1.41
1.80
0.82
Occupants
Seatbelt use
a) Overall seatbelt use:
Not used
b) By age:
Female <5
Female 25-34
Male 16-20
Male 25-34
Male 35-44
c) Type:
None
Shoulder belt
Child seat used
improperly
Lap & shoulder belt
d) By age:
16-20
21-24
25-34
45.6
5.5
16.2
13.6
19.7
18.1
45.6
1.2
0.4
47.7
13.9
9.6
18.4
0.94
1.03
1.11
1.09
1.12
1.04
0.94
2.89
4.50
1.17
1.07
1.15
1.12
1.13
1.17
1.12
1.00
1.10
1.06
1.13
2.11
3.59
0.98
1.01
1.08
1.11
42.86
3\5.67
17.98
14.82
22.06
18.82
42.86
3.47
1.80
55.81
14.87
11.04
20.61
51.53
6.44
18.14
13.60
21.67
19.19
51.53
2.53
1.44
46.75
14.04
10.37
20.42
Pedestrian by age
1<5
5-15
16-20
21-24
25-34
3.3
9.8
7.1
7.7
14.7
1.26
1.42
1.12
1.39
1.14
1.16
1.25
1.10
1.34
1.13
4.16
13.92
7.95
10.70
16.76
3.83
12.25
7.81
10.32
16.61
Vehicle Body
type
a) Light Truck & Van
b) Large Trucks
c) Motorcycles
31.6
9.3
5.3
1.09
1.00
1.23
1.21
1.08
0.95
34.44
9.30
6.52
38.24
10.04
5.04
Temporal
a) Hour of the Day:
1
2
8.0
10.5
1.08
1.46
0.93
1.16
8.64
15.33
7.44
12.18
(continued)
24
3
23
b) Day of the week:
Saturday
6.3
8.7
27.1
1.26
1.13
1.09
1.12
1.13
1.11
7.94
9.83
29.54
7.06
9.83
30.08
Speed Limit <=35
55
17.6
38.4
1.18
1.06
0.85
1.21
20.77
40.70
14.96
46.46
Relation to
Roadway
a) Shoulder
b) Off Roadway-Location
unknown
c) Median
d) On roadway
5.6
13.4
2.4
56.3
1.78
1.02
1.06
1.08
0.96
1.60
0.78
0.96
9.97
13.67
2.54
60.80
5.38
21.44
1.87
54.05
Relation to
Junction
a) Rail grade crossing
b) Driveway, Alley access
etc.
c) Entrance/exit ramp
related
d) Intersection
1.5
1.4
1.0
19.6
1.65
1.15
3.00
1.41
2.26
1.01
2.25
1.09
2.48
1.61
3.00
27.64
3.39
1.41
2.25
21.36
Traffic way Flow
a) Not Physically
divided(2-way)
b) Not Physically
divided(2 way with left-
turn lane)
c) Divided Highway-
Median Strip(with traffic
barrier)
69.1
27.2
0.9
0.98
1.15
2.93
1.06
1.16
1.03
67.72
31.28
2.64
73.25
31.55
0.93
Number of travel
lanes
a) Rural 2 lane:
Major collector
Principal arterial-
interstate
b) Urban 2 lane:
Other principal arterial
Minor arterial
Principal arterial-
interstate
33.8
13.7
37.0
25.3
12.6
1.43
1.15
1.33
1.19
1.07
1.33
1.42
1.38
1.08
1.74
48.33
15.76
49.21
30.11
13.48
44.95
19.45
51.06
27.32
21.92
Roadway Signing
Interstate
U.S.Highway
State Highway
14.4
17.5
47.3
1.09
0.75
1.54
1.13
1.07
1.69
15.70
13.13
72.84
16.27
18.73
79.94
Functional class
a) Urban:
Other principal arterial
Minor arterial
37.2
24.5
1.21
1.24
1.23
1.21
45.01
30.38
45.76
29.65
(continued)

25
Collector
b) Rural:
Principal arterial-
interstate
Major Collector
8.7
14.3
33.4
1.07
1.21
1.45
1.24
1.17
1.42
9.31
17.30
48.43
10.79
16.73
47.43
Traffic control
device
a) Railroad-passive
devices
b) Highway traffic signal
Flashing
Traffic signal on colors
c) Rail grade crossing
passive devices (aggregate)
d) Highway traffic
signal(aggregate)
e) No control devices:
Major collector
Principal arterial-
interstate
Minor collector
Minor arterial
Other principal arterial
71.1
15.3
16.2
1.1
5.2
24.4
11.7
8.0
7.2
9.0
1.49
3.91
3.46
2.52
1.07
1.45
1.17
0.77
1.54
1.38
1.53
3.73
3.37
3.54
0.67
1.73
1.33
1.71
1.00
0.92
105.94
59.82
56.05
2.77
5.56
35.38
13.69
6.16
11.09
12.42
108.78
57.07
54.59
3.89
3.48
42.21
15.56
13.68
7.20
8.28
Most Harmful
event
a) Collision with fixed
object
b) Collision with object not
fixed
23.2
11.2
0.91
1.62
1.09
1.07
21.11
18.14
25.29
11.98
First harmful
event aggregated
a) Collision with fixed
object
b) Collision with object
not fixed
c) Ditch
d) Tree
e) Culvert
f) Railway train
g) Immersion
h) Pedal cycle
i) Pedestrian
34.4
15.7
7.0
9.7
3.2
1.5
0.4
2.5
11.4
0.92
1.61
1.70
0.79
1.01
1.62
4.60
2.95
1.54
1.12
1.03
2.73
1.12
2.01
2.30
3.26
1.27
0.91
31.65
25.28
11.90
7.66
3.23
2.43
1.84
7.38
17.56
38.53
16.17
19.11
10.86
6.43
3.45
1.30
3.18
10.37
Manner of
collision
a) Front-to-front
b) Front-to-rear
c) Front-to-side/angle
direction not specified
d) Rear-to-side/right angle
7.7
4.7
1.3
0.2
1.49
1.77
3.87
2.03
1.62
1.64
2.37
1.23
11.47
8.32
5.03
0.41
12.47
7.71
3.08
0.25
(continued)
26
Hit and Run Hit pedestrians 2.7 2.29 1.07 6.18 2.89
ORFpeer = Over representation factor with respect to peer states
ORFUSA = Over representation factor with respect to all states in the nation
Crash % = Percentage of crashes in the specific area
IMPpeer = Importance of the over representation with respect to peer states
IMPUSA = Importance of the over representation with respect to all states
Table 3
Problem areas as identified from GES comparison
General Area Specific Area ORFUSA Crash(%) IMPUSA
Inadequate
driver
attention
inattentive/distracted/illness/fatigued/
apparently asleep/blacked out
(ALL CRASHES)
inattentive/distracted/illness/fatigued/
apparently asleep/blacked out
(FATAL CRASHES)
inattentive/distracted/illness/fatigued/
apparently asleep/blacked out
(INJURY CRASHES)
inattentive/distracted/illness/fatigued/
apparently asleep/blacked out
(PDO CRASHES)
1.38
2.69
1.23
1.42
1.44
17.72
3.41
0.94
1.99
47.61
4.19
1.33
Driver alcohol
involvement
alcohol (FATAL CRASHES)
1.31
38.92
50.99
Driver age
18-20
21-24
25-34 (ALL CRASHES)
18-20
21-24
25-34 (FATAL CRASHES)
18-20
21-24
25-34 (INJURY CRASHES)
18-20
21-24
25-34 (PDO CRASHES)
1.06
1.11
1.02
1.39
1.22
1.09
1.06
1.13
1.04
1.05
1.10
1.02
11.41
12.17
21.91
11.39
12.05
20.26
11.46
12.78
22.18
11.40
12.01
21.85
12.09
13.51
22.35
15.83
14.70
22.08
12.15
14.44
23.07
11.97
13.21
22.29
(continued)
27
Driver ejected ejected (FATAL CRASHES) 1.51 34.54 52.16
Occupant age
25-34
45-54 (FATAL CRASHES)
25-34 (INJURY CRASHES)
25-34 (PDO CRASHES)
1.09
1.17
1.20
1.08
12.82
8.69
13.15
11.07
13.97
10.17
15.78
11.96
Occupant seating
position
first row seat-right side
second row seat-right side (FATAL
CRASHES)
1.04
1.07
61.56
12.40
64.02
13.27
Number of
Occupants
2
3
4-14 (ALL CRASHES)
2
3
4-14 (FATAL CRASHES)
2
3
4-14 (INJURY CRASHES)
2
3
4-14 (PDO CRASHES)
0.97
1.20
2.16
1.17
1.77
2.78
1.30
1.75
2.95
0.78
0.86
1.56
18.74
7.07
8.22
26.71
16.90
21.08
32.74
14.36
17.32
13.89
4.54
5.07
18.18
8.48
17.76
31.25
29.91
58.60
42.56
25.13
51.09
10.83
3.90
7.91
Pedestrian age
0-14
21-24
25-34
35-44 (ALL CRASHES)
0-14
21-24
25-34
35-44 (FATAL CRASHES)
0-14
21-24
25-34
35-44 (INJURY CRASHES)
0-14
18-20 (PDO CRASHES)
1.04
1.23
0.84
1.05
1.46
0.75
1.49
2.15
3.82
0.67
1.13
1.26
4.08
7.30
38.80
6.49
11.12
13.00
12.25
6.71
14.26’
21.31
33.69
7.15
12.15
13.62
60.80
3.60
40.35
7.98
9.34
13.65
17.89
5.03
21.25
45.82
128.70
4.79
13.73
17.16
248.06
26.28
Pedestrian gender female (FATAL CRASHES)
female (PDO CRASHES)
1.35
1.13
42.18
39.67
56.94
44.83
(continued)

28
Vehicle cargo
type
van/enclosed box cargo tank (ALL CRASHES)
van/enclosed box
cargo tank (FATAL CRASHES)
van/enclosed box
cargo tank (INJURY CRASHES)
van/enclosed box
cargo tank (PDO CRASHES)
1.24 2.37
1.36
1.16
1.25
1.76
1.26
2.47
42.18 12.80
41.77
27.85
38.55
12.16
43.29
12.87
52.30 30.34
56.81
32.31
48.19
21.41
54.55
31.79
Vehicle type
light truck/pickup/SUV (ALL
CRASHES)
light truck/pickup/SUV(FATAL
CRASHES)
light truck/pickup/SUV (INJURY
CRASHES)
light truck/pickup/SUV (PDO
CRASHES)
1.99
2.82
1.75
2.04
29.40
33.04
25.46
30.38
58.51
93.17
44.56
61.98
Vehicle year
1981-1985 (ALL CRASHES)
1981-1985 (FATAL CRASHES)
1981-1985 (INJURY CRASHES)
1981-1985 (PDO CRASHES)
1.06
1.64
1.00
1.04
4.46
6.76
4.92
4.20
4.73
11.09
4.92
4.37
Temporal effect
day of the week (ALL CRASHES)
Saturday
Sunday
Tuesday
time of the day (ALL CRASHES)
0 hr
1 hr
2 hr
3 hr
4 hr
5 hr
day of the week (FATAL)
Saturday
Sunday
Tuesday
time of the day (FATAL)
1.31
1.28
1.00
0.99
1.00
1.10
1.06
1.16
1.05
0.88
1.08
1.20
17.44
13.34
14.73
1.76
1.52
1.60
1.11
1.04
1.33
15.09
17.22
14.06
22.85
17.08
14.73
1.74
1.52
1.76
1.18
1.21
1.40
13.28
18.60
16.87
(continued)

29
0 hr 1 hr
2 hr
3 hr
4 hr
5 hr
day of the week (INJURY CRASHES)
Saturday
Sunday
Tuesday
time of the day (INJURY CRASHES)
0 hr
1 hr
2 hr
3 hr
4 hr
5 hr
day of the week (PDO CRASHES)
Saturday
Sunday
Tuesday
time of the day (PDO CRASHES)
0 hr
1 hr
2 hr
3 hr
4 hr
5 hr
1.32 1.15
1.28
1.40
1.43
1.17
1.02
0.99
0.97
1.11
1.12
1.18
1.16
1.33
1.28
1.02
0.96
0.99
0.93
0.95
1.06
1.01
1.08
0.95
5.08 4.71
5.38
3.29
3.01
3.09
14.43
11.09
14.11
2.02
1.78
1.84
1.28
1.19
1.44
13.20
9.60
14.68
1.62
1.38
1.47
1.02
0.96
1.27
6.71 5.42
6.89
4.61
4.30
3.62
14.72
10.98
13.69
2.24
1.99
2.17
1.48
1.58
1.84
13.46
9.22
14.53
1.51
1.31
1.56
1.03
1.04
1.21
Relation to
roadway
off roadway-location
shoulder (ALL CRASHES)
off roadway-location
shoulder (FATAL CRASHES)
off roadway-location
shoulder (INJURY CRASHES)
off roadway-location
shoulder (PDO CRASHES)
2.55
2.62
3.38
1.37
2.43
1.75
2.64
3.10
6.90
2.71
20.69
2.80
8.30
1.99
6.19
3.03
17.60
7.1
69.93
3.84
20.17
3.48
16.34
9.39
Work zone
(ALL CRASHES)
(FATAL CRASHES)
(INJURY CRASHES)
1.88
2.95
1.75
3.40
5.66
2.84
6.39
16.70
4.97
(continued)
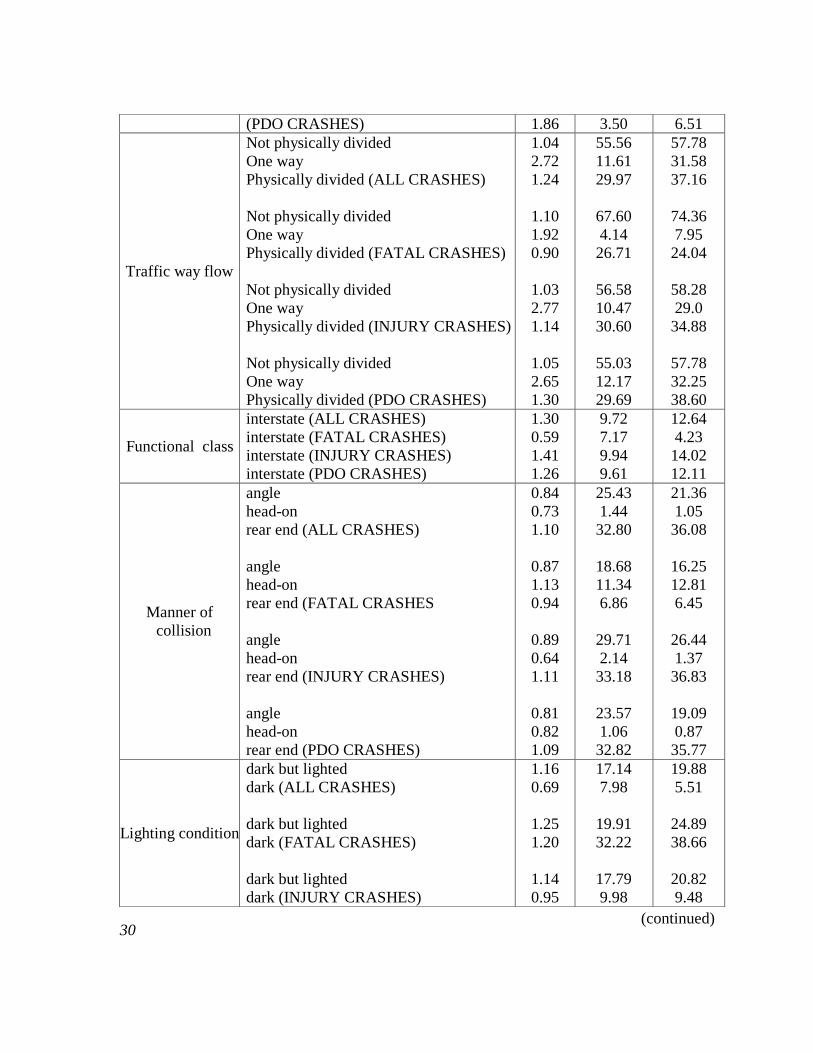
30
(PDO CRASHES) 1.86 3.50 6.51
Traffic way flow
Not physically divided
One way
Physically divided (ALL CRASHES)
Not physically divided
One way
Physically divided (FATAL CRASHES)
Not physically divided
One way
Physically divided (INJURY CRASHES)
Not physically divided
One way
Physically divided (PDO CRASHES)
1.04
2.72
1.24
1.10
1.92
0.90
1.03
2.77
1.14
1.05
2.65
1.30
55.56
11.61
29.97
67.60
4.14
26.71
56.58
10.47
30.60
55.03
12.17
29.69
57.78
31.58
37.16
74.36
7.95
24.04
58.28
29.0
34.88
57.78
32.25
38.60
Functional class
interstate (ALL CRASHES)
interstate (FATAL CRASHES)
interstate (INJURY CRASHES)
interstate (PDO CRASHES)
1.30
0.59
1.41
1.26
9.72
7.17
9.94
9.61
12.64
4.23
14.02
12.11
Manner of
collision
angle
head-on
rear end (ALL CRASHES)
angle
head-on
rear end (FATAL CRASHES
angle
head-on
rear end (INJURY CRASHES)
angle
head-on
rear end (PDO CRASHES)
0.84
0.73
1.10
0.87
1.13
0.94
0.89
0.64
1.11
0.81
0.82
1.09
25.43
1.44
32.80
18.68
11.34
6.86
29.71
2.14
33.18
23.57
1.06
32.82
21.36
1.05
36.08
16.25
12.81
6.45
26.44
1.37
36.83
19.09
0.87
35.77
Lighting condition
dark but lighted
dark (ALL CRASHES)
dark but lighted
dark (FATAL CRASHES)
dark but lighted
dark (INJURY CRASHES)
1.16
0.69
1.25
1.20
1.14
0.95
17.14
7.98
19.91
32.22
17.79
9.98
19.88
5.51
24.89
38.66
20.82
9.48
(continued)

31
dark but lighted
dark (PDO CRASHES)
1.17
0.58
16.81
6.94
19.67
4.03
Driver restraint
System
not used
shoulder belt used only (ALLCRASHES)
not used
shoulder belt used only (FATAL
CRASHES)
not used
shoulder belt used only (INJURY
CRASHES)
not used
shoulder belt used only (PDO
CRASHES)
1.16
5.38
1.10
1.58
0.93
3.57
0.87
6.33
5.92
3.83
60.32
1.36
10.52
2.94
3.02
4.34
6.87
20.60
66.35
2.15
9.78
10.50
2.63
27.47
Occupant restraint
system
not used
child safety seat (ALL CRASHES)
not used
child safety seat (FATAL CRASHES)
not used
child safety seat (INJURY CRASHES)
not used
child safety seat (PDO CRASHES)
0.96
0.81
1.09
2.44
0.77
1.23
0.97
0.80
11.66
6.90
59.96
3.26
14.37
5.47
10.00
7.68
11.19
5.59
65.36
7.95
11.06
6.73
9.7
6.14
Violations
charged
running a traffic signal/stop sign
speed related
failure to yield (ALL CRASHES)
running a traffic signal/stop sign
speed related
failure to yield (INJURY CRASHES)
running a traffic signal/stop sign
speed related
failure to yield (PDO CRASHES)
1.75
8.63
2.13
1.59
7.04
1.79
1.81
9.82
2.21
2.52
0.63
10.12
3.05
1.05
8.88
2.39
0.52
10.43
4.41
5.44
21.56
4.85
7.39
15.90
4.33
5.11
23.05
Vision obscured
trees & bushes (ALL CRASHES)
trees & bushes (PDO CRASHES)
3.56
3.61
0.41
0.41
1.46
1.48
(continued)

32
The investigation of specific features of recorded crashes in Louisiana and their comparison
with the same features from data in peer states or the nation, produced the results shown in
Tables 2 and 3. Based on this information, the following potential problem areas were
identified for further analysis:
Driver Characteristics:
1. Driver age and gender
2. Driver physical and mental condition
3. Driver seatbelt usage
4. Driver violations, including running a traffic signal or stop sign and speeding
5. Driver alcohol
6. Motor cyclist
7. Young drivers
8. Driver licensing
Occupant Characteristics:
9. Number of occupants
10. Restraint system use
Pedestrian Characteristics:
11. Pedestrian age
12. Pedestrian alcohol use
Roadway Characteristics:
13. Highway class
14. Relation to roadway
15. Traffic way flow, including one-way streets and roadways without physical
separation
16. Rail grade crossing and highway traffic control
17. Posted speed limit
Crash Characteristics:
18. First harmful event, including ditch, tree, culvert, railway train, and pedestrian
19. Most harmful event, including collision with fixed object, collision with object not
fixed for fatal
20. Manner of collision, including head-on (fatal), rear end, and side swipe
21. Day of the week and time of the day
22. Emergency medical services
Vehicle Characteristics:
23. Cargo type
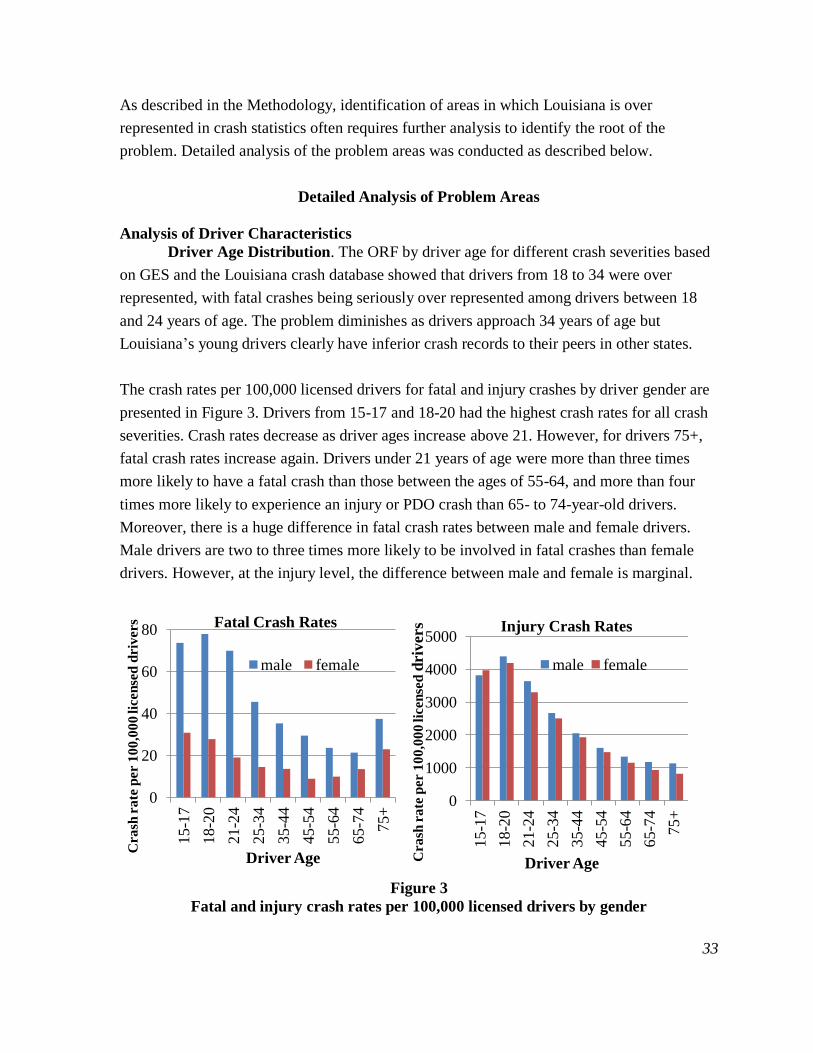
33
As described in the Methodology, identification of areas in which Louisiana is over
represented in crash statistics often requires further analysis to identify the root of the
problem. Detailed analysis of the problem areas was conducted as described below.
Detailed Analysis of Problem Areas
Analysis of Driver Characteristics
Driver Age Distribution. The ORF by driver age for different crash severities based
on GES and the Louisiana crash database showed that drivers from 18 to 34 were over
represented, with fatal crashes being seriously over represented among drivers between 18
and 24 years of age. The problem diminishes as drivers approach 34 years of age but
Louisiana’s young drivers clearly have inferior crash records to their peers in other states.
The crash rates per 100,000 licensed drivers for fatal and injury crashes by driver gender are
presented in Figure 3. Drivers from 15-17 and 18-20 had the highest crash rates for all crash
severities. Crash rates decrease as driver ages increase above 21. However, for drivers 75+,
fatal crash rates increase again. Drivers under 21 years of age were more than three times
more likely to have a fatal crash than those between the ages of 55-64, and more than four
times more likely to experience an injury or PDO crash than 65- to 74-year-old drivers.
Moreover, there is a huge difference in fatal crash rates between male and female drivers.
Male drivers are two to three times more likely to be involved in fatal crashes than female
drivers. However, at the injury level, the difference between male and female is marginal.
Figure 3
Fatal and injury crash rates per 100,000 licensed drivers by gender
0
20
40
60
80
15-1
7
18-2
0
21-2
4
25-3
4
35-4
4
45-5
4
55-6
4
65-7
4
75+
Driver Age
Fatal Crash Rates
male female
Cra
sh r
ate
per 1
00
,00
0 lic
en
sed
driv
ers
0
1000
2000
3000
4000
5000
15
-17
18
-20
21
-24
25
-34
35
-44
45
-54
55
-64
65
-74
75+
Driver Age
Injury Crash Rates
male female
Cra
sh r
ate
per 1
00
,00
0 lic
en
sed
driv
ers
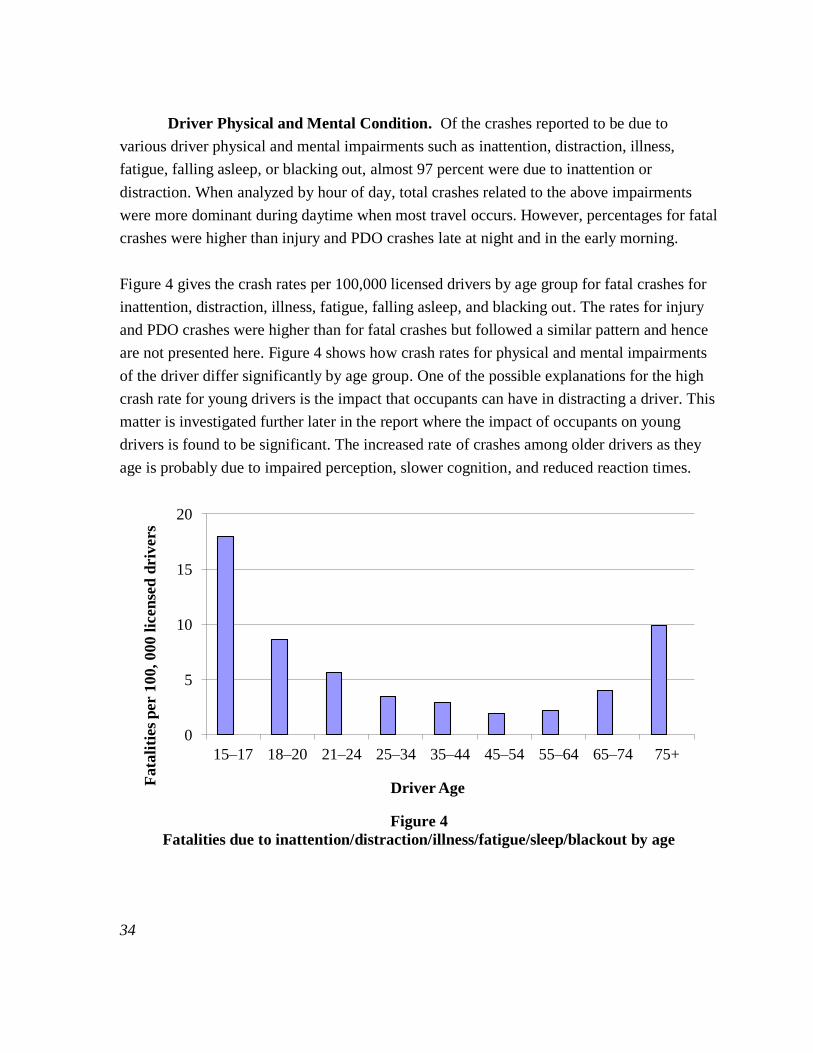
34
Driver Physical and Mental Condition. Of the crashes reported to be due to
various driver physical and mental impairments such as inattention, distraction, illness,
fatigue, falling asleep, or blacking out, almost 97 percent were due to inattention or
distraction. When analyzed by hour of day, total crashes related to the above impairments
were more dominant during daytime when most travel occurs. However, percentages for fatal
crashes were higher than injury and PDO crashes late at night and in the early morning.
Figure 4 gives the crash rates per 100,000 licensed drivers by age group for fatal crashes for
inattention, distraction, illness, fatigue, falling asleep, and blacking out. The rates for injury
and PDO crashes were higher than for fatal crashes but followed a similar pattern and hence
are not presented here. Figure 4 shows how crash rates for physical and mental impairments
of the driver differ significantly by age group. One of the possible explanations for the high
crash rate for young drivers is the impact that occupants can have in distracting a driver. This
matter is investigated further later in the report where the impact of occupants on young
drivers is found to be significant. The increased rate of crashes among older drivers as they
age is probably due to impaired perception, slower cognition, and reduced reaction times.
Figure 4
Fatalities due to inattention/distraction/illness/fatigue/sleep/blackout by age
0
5
10
15
20
15–17 18–20 21–24 25–34 35–44 45–54 55–64 65–74 75+
Driver Age
Fata
liti
es
per 1
00, 000
lic
en
sed
driv
ers
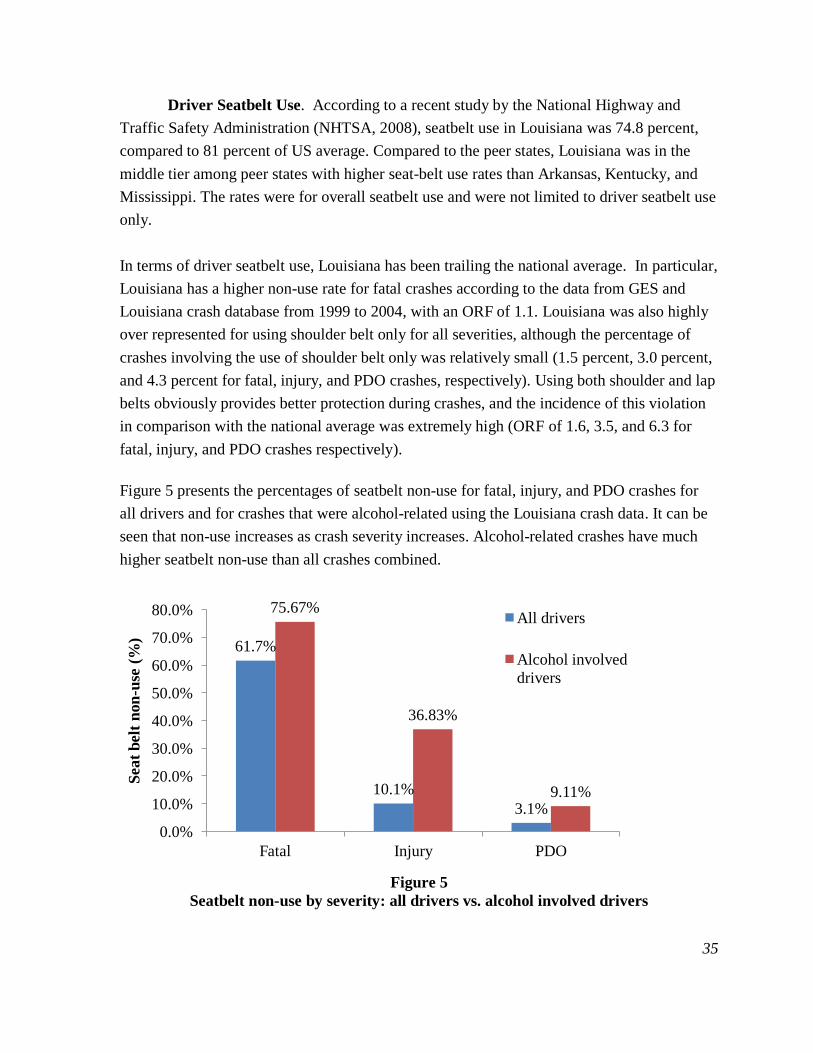
35
Driver Seatbelt Use. According to a recent study by the National Highway and
Traffic Safety Administration (NHTSA, 2008), seatbelt use in Louisiana was 74.8 percent,
compared to 81 percent of US average. Compared to the peer states, Louisiana was in the
middle tier among peer states with higher seat-belt use rates than Arkansas, Kentucky, and
Mississippi. The rates were for overall seatbelt use and were not limited to driver seatbelt use
only.
In terms of driver seatbelt use, Louisiana has been trailing the national average. In particular,
Louisiana has a higher non-use rate for fatal crashes according to the data from GES and
Louisiana crash database from 1999 to 2004, with an ORF of 1.1. Louisiana was also highly
over represented for using shoulder belt only for all severities, although the percentage of
crashes involving the use of shoulder belt only was relatively small (1.5 percent, 3.0 percent,
and 4.3 percent for fatal, injury, and PDO crashes, respectively). Using both shoulder and lap
belts obviously provides better protection during crashes, and the incidence of this violation
in comparison with the national average was extremely high (ORF of 1.6, 3.5, and 6.3 for
fatal, injury, and PDO crashes respectively).
Figure 5 presents the percentages of seatbelt non-use for fatal, injury, and PDO crashes for
all drivers and for crashes that were alcohol-related using the Louisiana crash data. It can be
seen that non-use increases as crash severity increases. Alcohol-related crashes have much
higher seatbelt non-use than all crashes combined.
Figure 5
Seatbelt non-use by severity: all drivers vs. alcohol involved drivers
61.7%
10.1%
3.1%
75.67%
36.83%
9.11%
0.0%
10.0%
20.0%
30.0%
40.0%
50.0%
60.0%
70.0%
80.0%
Fatal Injury PDO
All drivers
Alcohol involved
drivers
Seat
belt
non
-use
(%
)
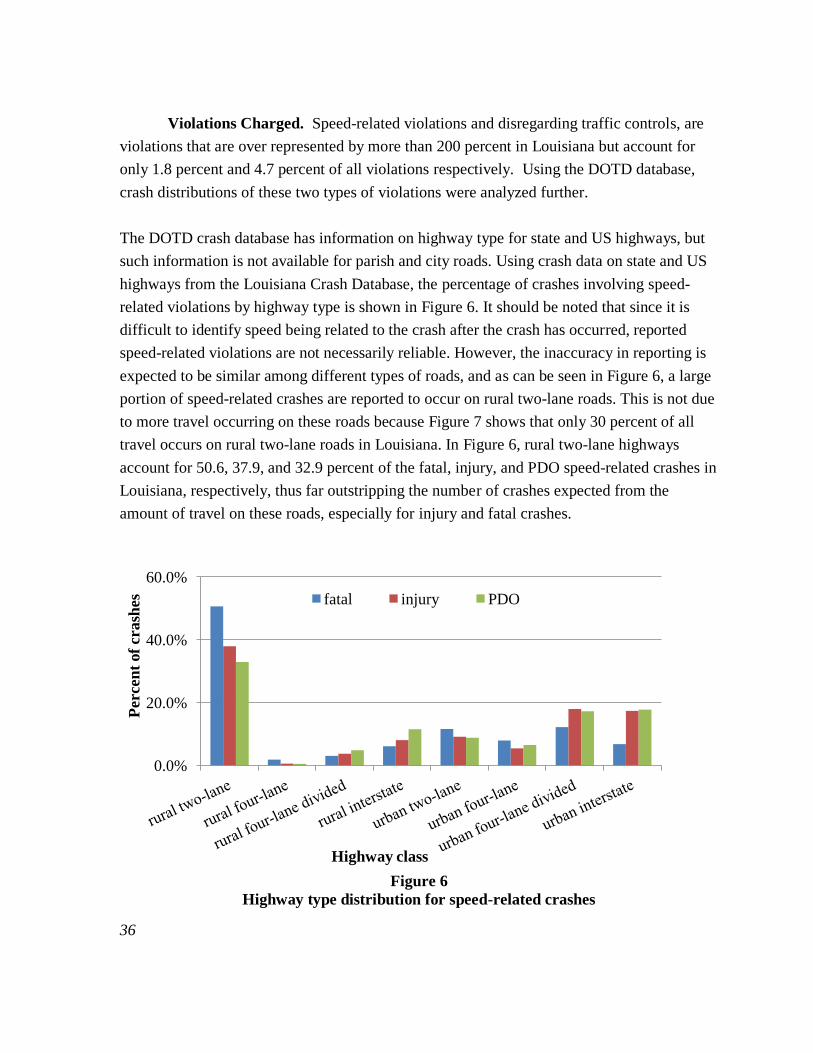
36
Violations Charged. Speed-related violations and disregarding traffic controls, are
violations that are over represented by more than 200 percent in Louisiana but account for
only 1.8 percent and 4.7 percent of all violations respectively. Using the DOTD database,
crash distributions of these two types of violations were analyzed further.
The DOTD crash database has information on highway type for state and US highways, but
such information is not available for parish and city roads. Using crash data on state and US
highways from the Louisiana Crash Database, the percentage of crashes involving speed-
related violations by highway type is shown in Figure 6. It should be noted that since it is
difficult to identify speed being related to the crash after the crash has occurred, reported
speed-related violations are not necessarily reliable. However, the inaccuracy in reporting is
expected to be similar among different types of roads, and as can be seen in Figure 6, a large
portion of speed-related crashes are reported to occur on rural two-lane roads. This is not due
to more travel occurring on these roads because Figure 7 shows that only 30 percent of all
travel occurs on rural two-lane roads in Louisiana. In Figure 6, rural two-lane highways
account for 50.6, 37.9, and 32.9 percent of the fatal, injury, and PDO speed-related crashes in
Louisiana, respectively, thus far outstripping the number of crashes expected from the
amount of travel on these roads, especially for injury and fatal crashes.
Figure 6
Highway type distribution for speed-related crashes
0.0%
20.0%
40.0%
60.0%
fatal injury PDO
Percen
t of
crash
es
Highway class

37
Figure 7
Vehicle miles travelled by highway class
The distribution of crashes resulting from disregarding traffic controls is different to that of
speed-related crashes. Injury and PDO crashes resulting from this violation occur more on
rural two-lane highways with percentages of 49.5 and 53.4, respectively, whereas fatal
crashes are more evenly distributed across highway types with a percentage of 25.6 on rural
two-lane highways. Among disregarding traffic controls violations, 36 percent of violations
involved disregarding stop signs and 48 percent running red lights. A detailed analysis is
provided in the section on Highway Traffic Control.
Drivers aged 18 to 44 constitute the majority of speed-related and disregarding traffic control
violations. However, this is because it is the largest group of drivers. Teenagers (15-17 and
18-20) are only 8.3 percent of all licensed drivers, but they contributed 30.0 percent and 20.0
percent of the violations, respectively. To provide a comparison among different age groups
of drivers, Figure 8 presents the violations per 100,000 licensed drivers by age of driver for
speed-related and disregarding traffic control violations. Crash rates are the lowest for drivers
aged 45-64. The rates for 15- to 17-year-old drivers are the highest, followed by 18- to 20-
year-old drivers. The highest and lowest crash rates differ by an order of four (for
disregarding traffic control) to 14 times (for speed related). Between these two violations,
0
4000
8000
12000
16000
20000
24000
28000 V
eh
icle
mil
es
travell
ed
in
thou
san
ds
Highway class
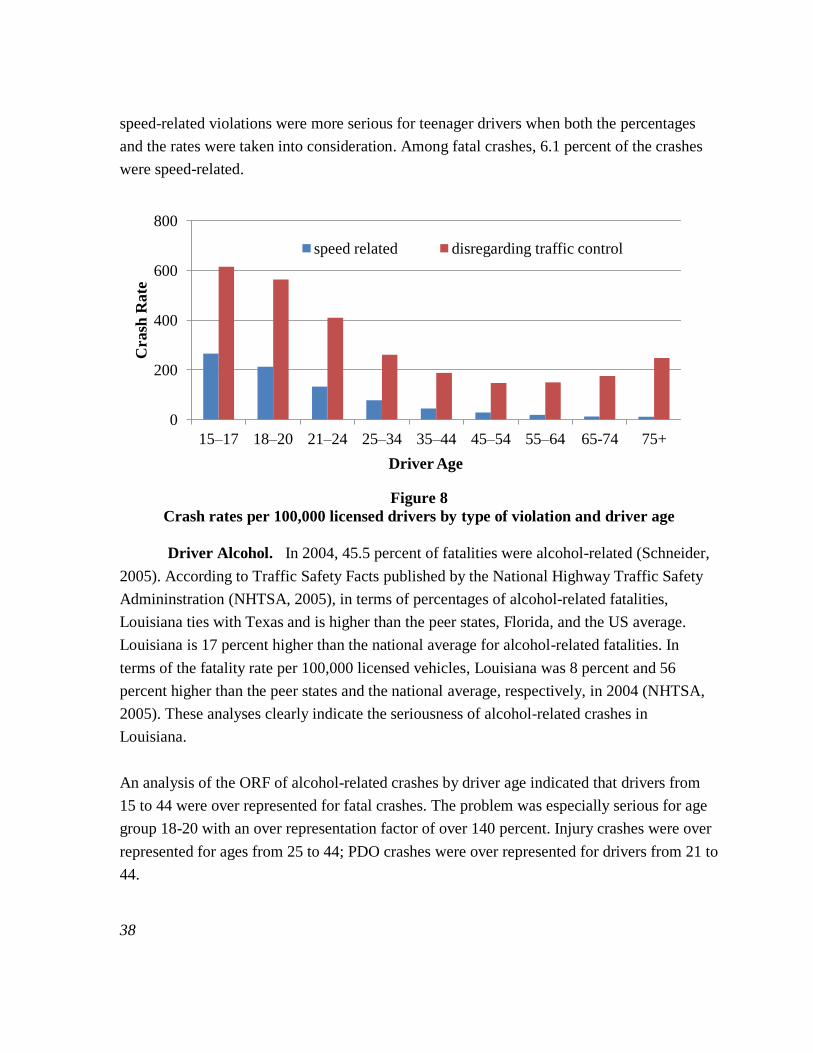
38
speed-related violations were more serious for teenager drivers when both the percentages
and the rates were taken into consideration. Among fatal crashes, 6.1 percent of the crashes
were speed-related.
Figure 8
Crash rates per 100,000 licensed drivers by type of violation and driver age
Driver Alcohol. In 2004, 45.5 percent of fatalities were alcohol-related (Schneider,
2005). According to Traffic Safety Facts published by the National Highway Traffic Safety
Admininstration (NHTSA, 2005), in terms of percentages of alcohol-related fatalities,
Louisiana ties with Texas and is higher than the peer states, Florida, and the US average.
Louisiana is 17 percent higher than the national average for alcohol-related fatalities. In
terms of the fatality rate per 100,000 licensed vehicles, Louisiana was 8 percent and 56
percent higher than the peer states and the national average, respectively, in 2004 (NHTSA,
2005). These analyses clearly indicate the seriousness of alcohol-related crashes in
Louisiana.
An analysis of the ORF of alcohol-related crashes by driver age indicated that drivers from
15 to 44 were over represented for fatal crashes. The problem was especially serious for age
group 18-20 with an over representation factor of over 140 percent. Injury crashes were over
represented for ages from 25 to 44; PDO crashes were over represented for drivers from 21 to
44.
0
200
400
600
800
15–17 18–20 21–24 25–34 35–44 45–54 55–64 65-74 75+
Crash
Rate
Driver Age
speed related disregarding traffic control
39
After subtracting alcohol-related crashes, 15- to 17-year-old drivers were no longer over
represented. This suggests that alcohol is the prime factor causing drivers of this age in
Louisiana to have more crashes than drivers of the same age elsewhere. On the other hand,
when alcohol-related crashes were removed from 18- to 20- and 21- to 24-year-old drivers,
they were still over represented. This suggests that for these drivers, alcohol was only one of
the reasons for over representation and other reasons also existed. Nonetheless, if we further
subtract the crashes for violation-related crashes (including speeding and disregarding traffic
controls) and for driver conditions (including inattention/distraction and drinking impaired),
which 18- to 20-year-old drivers had much higher rates than most other age groups, the over
representation for 18- to 20-year-old drivers almost disappears (the ORF becomes only 104.5
percent). This indicates that alcohol, speeding, disregarding traffic control, and
inattention/distraction are a large part of the causes of over representation for 18- to 20-year-
old drivers in Louisiana, if not all.
Motorcyclists. In 2004, registered motorcycles were under 1.5 percent of all
registered motor vehicles in Louisiana. However, motorcycle related fatalities were 7.2
percent of all traffic fatalities, and 44.8 percent of the motorcycle fatalities were alcohol-
related, according to the Louisiana Crash Database from 1999 to 2004.
Further studies revealed that from 1999 to 2004, motorcycle crashes increased by 88.1
percent, 78.9 percent, and 58.5 percent for fatal, injury, and PDO, respectively. During the
same period, registered motorcycles increased by only 30.2 percent. Thus, crash rates per
registered motorcycle increased by 44.5, 37.5, and 21.7 percent for fatal, injury, and PDO
crashes, respectively. A better measure would be crash rate per vehicle mile traveled if it is
assumed that travel per vehicle varied between 1999 and 2004, but travel by motorcycle in
Louisiana was unknown at the time of the analysis. As shown in Figure 9, motorcycle crash
rates are increasing over time in Louisiana.

40
Figure 9
Motorcycle crash rates by year by severity in Louisiana
Unlike motor vehicle crashes, motorcycle crash percentages were found to peak on Saturday
and Sundays, especially on Saturday, for all crash severities. The crash percentages were
higher for alcohol-related motorcycle crashes compared to alcohol-related motor vehicle
crashes.
An analysis of gender indicated that 94.5 percent of all motorcycle crashes and 98.2 percent
of fatal crashes were male drivers. In terms of age distribution, most motorcycle crashes
(about 70 percent) occurred among drivers aged 25 to 54, a much smaller percentage (less
than 10 percent) among young drivers 15-20, and little (less than 3 percent) among older
drivers (65+). The results were consistent among fatal, injury, and PDO crashes.
Louisiana enacted a universal helmet law in 1982. This was later amended in August 1999 to
require helmet use by motorcycle operators and passengers under the age of 18 and riders 18
and older not holding medical insurance coverage of at least $10,000 (NHTSA, 2003). The
universal helmet law was reinstated in August 2004. Therefore, part of 1999 and 2004 and all
of 2000 to 2003 covered the period when the amended motorcycle law was in effect. Figure
10 gives the percentage helmet use for motor cyclists in crashes from 1999 to 2004 derived
from the Louisiana crash database. It is obvious that helmet use decreased sharply from 1999
to 2003, and the decline was reversed in 2004 when mandatory helmet use was reinstated.
Those who were involved in fatal crashes clearly had lower helmet use rates than those
0
500
1000
1500
2000
2500
3000
Fatal Injury PDO
1999 2000 2001 2002 2003 2004 C
rash
es
per m
illi
on
regis
tered
moto
r
cy
cle
s p
er y
ear
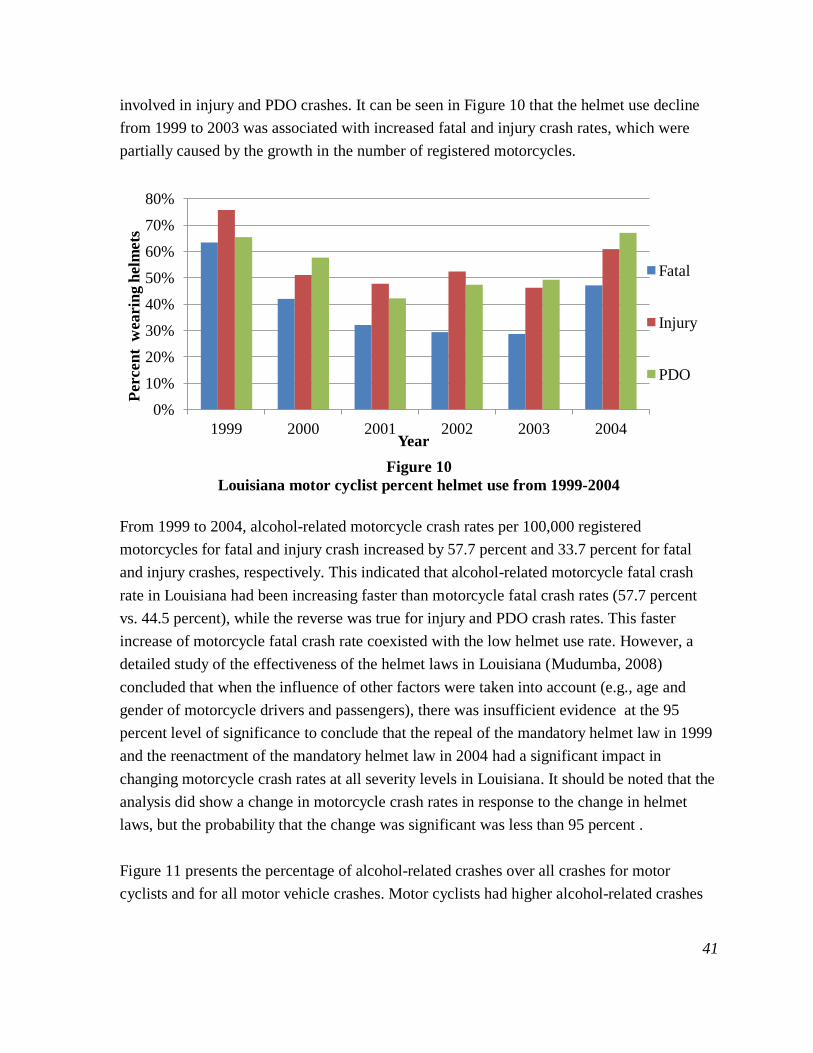
41
involved in injury and PDO crashes. It can be seen in Figure 10 that the helmet use decline
from 1999 to 2003 was associated with increased fatal and injury crash rates, which were
partially caused by the growth in the number of registered motorcycles.
Figure 10
Louisiana motor cyclist percent helmet use from 1999-2004
From 1999 to 2004, alcohol-related motorcycle crash rates per 100,000 registered
motorcycles for fatal and injury crash increased by 57.7 percent and 33.7 percent for fatal
and injury crashes, respectively. This indicated that alcohol-related motorcycle fatal crash
rate in Louisiana had been increasing faster than motorcycle fatal crash rates (57.7 percent
vs. 44.5 percent), while the reverse was true for injury and PDO crash rates. This faster
increase of motorcycle fatal crash rate coexisted with the low helmet use rate. However, a
detailed study of the effectiveness of the helmet laws in Louisiana (Mudumba, 2008)
concluded that when the influence of other factors were taken into account (e.g., age and
gender of motorcycle drivers and passengers), there was insufficient evidence at the 95
percent level of significance to conclude that the repeal of the mandatory helmet law in 1999
and the reenactment of the mandatory helmet law in 2004 had a significant impact in
changing motorcycle crash rates at all severity levels in Louisiana. It should be noted that the
analysis did show a change in motorcycle crash rates in response to the change in helmet
laws, but the probability that the change was significant was less than 95 percent .
Figure 11 presents the percentage of alcohol-related crashes over all crashes for motor
cyclists and for all motor vehicle crashes. Motor cyclists had higher alcohol-related crashes
0%
10%
20%
30%
40%
50%
60%
70%
80%
1999 2000 2001 2002 2003 2004 Year
Fatal
Injury
PDO
Percen
t w
earin
g h
elm
ets

42
than all motor vehicle drivers for all severities; they were 6.1, 45.7, and 88.3 percent higher
for fatal, injury, and PDO crashes than for motor vehicle drivers. Obviously, alcohol is a
more serious problem for motorcycle riders than for motor vehicle drivers.
Figure 11
Percent of alcohol-related crashes for motor cyclists and all drivers
Two major types of motorcycle violations were careless operation and speeding. Careless
operations were 43.0 percent, 55.4 percent, and 36.1 percent of motorcycle crashes for fatal,
injury, and PDO. Speeding (either exceeding the stated speed limit or the safe speed limit)
was the second most dominant violation for motor cyclists. They accounted for almost 20
percent of motor cyclist fatalities.
A query to the Louisiana crash database on motor cyclist license compliance indicated that
22 percent of motor cyclists who had a crash did not have a valid license for motorcycles
they were operating and 3 percent were not licensed at all.
Young Drivers. As discussed earlier, 18- to 20-year-old drivers were over
represented for fatal crashes, and 15- to 20-year-old drivers were over represented for driver
alcohol-related fatal crashes. Fatal crash rates due to inattention/distraction were highest for
15- to 17-year-old drivers. The rates for 18- to 20-year-old drivers were also high, next only
to 15- to 17- and 75+-year-old groups. Finally, 18- to 20-year-old drivers had the highest
alcohol-impaired fatal crash rate.
0%
10%
20%
30%
40%
50%
Fatal Injury PDO
motor
cyclist
all drivers
Percen
tage o
f crash
es

43
Young driver crash characteristics are investigated intensively in this section. Two methods
were used; one employs crash risk, while the other uses the quasi-induced exposure
technique. Crash risk was measured either by crash rate (number of crashes per 100,000
licensed drivers) or relative crash risk (the ratio of the crash rates between the young drivers
and the reference group of drivers 21 years or older). The definitions of young drivers and
peer passengers also differed slightly between the two methods. For the method using crash
risk, young drivers were from 15 to 20 years of age and they were further divided into two
age groups: 15-17 and 18-20; passengers were grouped into 15-17, 18-20, and 21+. When
using the quasi-induced exposure technique, young drivers were defined as 15-21 years of
age and they were further divided into 15, 16-17, and 18-21 age groups; passengers were
grouped into solo (no passenger), peer (from 12 to 24), and adult/child (at least one passenger
older than 24 or younger than 12). Individual aspects of young driver behavior in the
presence of passengers are reported below.
Temporal Distribution. The driving behavior of young drivers during dark and
various traffic conditions may vary depending on the presence or absence of passengers in
the vehicle. The Graduated Driver's Licensing (GDL) law in Louisiana clearly states that
young drivers under the age of 17 are not supposed to drive unsupervised between 11 p.m.
and 5 a.m. This prompted the comparison of crash rates during peak hours, off peak hours,
and after dark hours among young drivers. The after dark hours were further categorized to
find the crash rates during 11 p.m. and 5 a.m. when young drivers were not legally allowed to
drive in Louisiana according to the GDL. Figure 12 presents the single-vehicle relative crash
involvement ratio (RCIR) by the time of the day. The upper and lower 95 percent confidence
limits are presented by black lines.
It can be seen from Figure 12 that the RCIR values for single-vehicle crashes are very high
for young drivers below 18 years of age between 11 p.m. and 5 a.m. even with adult
supervision. This clearly indicates the poor safety record young drivers generate that time of
the night. Young drivers driving alone after dark have higher single-vehicle RCIR values
than two-vehicle values, showing that young drivers are more susceptible to the conditions
promoting single-vehicle crashes after dark than older drivers.
In Figure 12 the value for the single-vehicle and two-vehicle crashes involving a 15-year-old
driver with an adult/child passenger between 11 p.m. and 5 a.m. was not attainable as there
was no two-vehicle crashes reported during that time for the period of study (1999-2004) in
which the 15-year-old driver involved was not-at-fault for the crash. Hence the denominator

44
in the equation was zero and the crash involvement ratio could not be computed.
In terms of the day of the week, there was not much difference in RCIR values for two-
vehicle for all groups of passenger and driver classifications showing that there was not much
influence of the day of the week on multi-vehicle crashes. However, RCIR values of single-
vehicle crashes were higher over the weekend for solo and peer groups, which could be due
to the social activities of young people during the weekends. It should be noted that RCIR
values are high for 15-year-old drivers with peer group passengers throughout the week,
which infers that 15-year-olds are more likely to be involved in a crash at any time when
accompanied by peers.
Seatbelt Use by Gender and by Number of Passengers. In order to investigate the
relationship between the number of crashes and young driver risk-taking behavior, crash
incidence by use of safety restraint systems was considered. The notion adopted was that
drivers who do not use the mandatory safety restraints display greater risk taking behavior,
and subsequently can be identified as risk-takers. Single-vehicle crash RCIR ratios for
drivers who did not use safety restraints are presented in Figure 13. The results show that the
single-vehicle RCIR ratios were very high when no safety restraints were used, suggesting
that risk-taking young drivers had considerably higher crash rates of all crashes than those
who do not display the risk-taking behavior of not wearing safety restraints.

45
single-vehicle two-vehicle
Figure 12
RCIR values by time of day
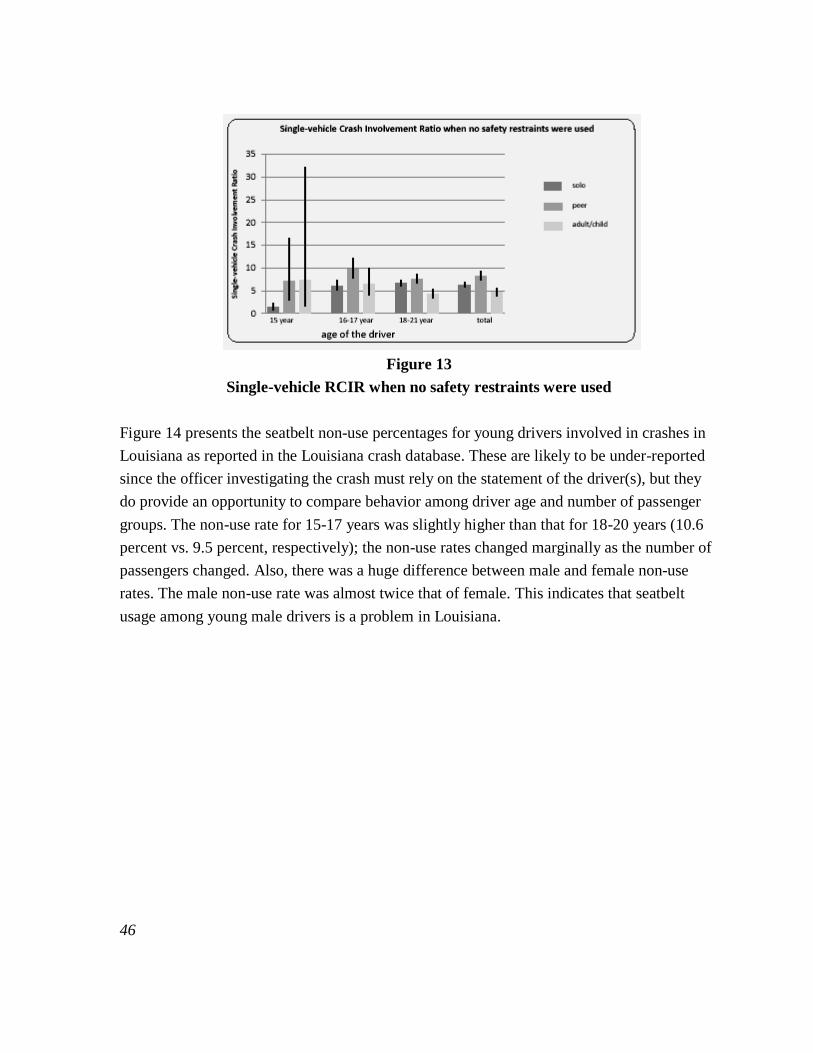
46
Figure 13
Single-vehicle RCIR when no safety restraints were used
Figure 14 presents the seatbelt non-use percentages for young drivers involved in crashes in
Louisiana as reported in the Louisiana crash database. These are likely to be under-reported
since the officer investigating the crash must rely on the statement of the driver(s), but they
do provide an opportunity to compare behavior among driver age and number of passenger
groups. The non-use rate for 15-17 years was slightly higher than that for 18-20 years (10.6
percent vs. 9.5 percent, respectively); the non-use rates changed marginally as the number of
passengers changed. Also, there was a huge difference between male and female non-use
rates. The male non-use rate was almost twice that of female. This indicates that seatbelt
usage among young male drivers is a problem in Louisiana.
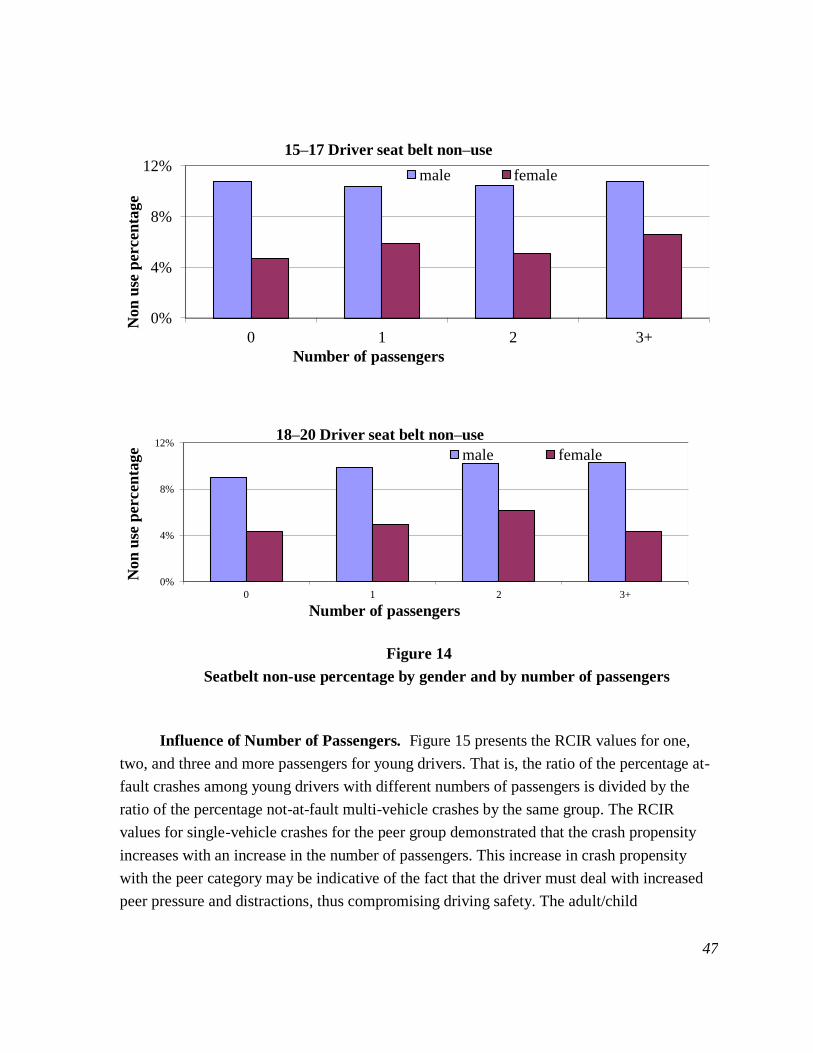
47
Figure 14
Seatbelt non-use percentage by gender and by number of passengers
Influence of Number of Passengers. Figure 15 presents the RCIR values for one,
two, and three and more passengers for young drivers. That is, the ratio of the percentage at-
fault crashes among young drivers with different numbers of passengers is divided by the
ratio of the percentage not-at-fault multi-vehicle crashes by the same group. The RCIR
values for single-vehicle crashes for the peer group demonstrated that the crash propensity
increases with an increase in the number of passengers. This increase in crash propensity
with the peer category may be indicative of the fact that the driver must deal with increased
peer pressure and distractions, thus compromising driving safety. The adult/child
0%
4%
8%
12%
0 1 2 3+
15–17 Driver seat belt non–use
male female
0%
4%
8%
12%
0 1 2 3+
18–20 Driver seat belt non–use
male female
Number of passengers
Non
use
percen
tage
Non
use
percen
tage
Number of passengers

48
single-vehicle two-vehicle
Figure 15
RCIR by passenger occupancy and age
category for both single-vehicle and two-vehicle shows an almost stable trend with the RCIR
values decreasing slightly with an increase in the number of passengers. This may possibly
be attributed to an increased sense of responsibility with multiple passengers while driving

49
under supervision. The RCIR values for two-vehicle crashes for peer group do increase with
increasing occupancy in the same manner as with single-vehicle crashes, but not as rapidly.
Learner drivers (drivers less than 16 years of age) were clearly the most influenced by
passengers.
The relative crash rates for young drivers by number of passengers were also investigated.
Relative crash rate in this analysis was defined as the ratio between crash rates per 100,000
licensed drivers for different crash characteristics. Crash rates per 100,000 licensed drivers
were first calculated for drivers aged 15-17, 18-20, and 21+ with different numbers of
passengers. Then relative crash rates for 15-17 and 18-20 age groups were calculated as the
ratio of the crash rate per 100,000 licensed drivers for the corresponding age groups and the
crash rate per 100,000 licensed drivers for the 21+ aged drivers for the same number of
passengers. A value greater than one indicated higher risk than the 21+ driver while a value
smaller than one indicated lower risk than the 21+ drivers. The larger the value, the greater
the relative risk. The results are presented in Figure 16.
Figure 16
Relative risks for young drivers by number of passengers
The results show that 15- to 17-year-old drivers with passengers had a higher relative crash
rate than 18- to 20-year-old drivers. However, without passengers, the 18- to 20-year-old
0.00
0.50
1.00
1.50
2.00
2.50
3.00
3.50
4.00
4.50
5.00
0 1 2 3+
Rela
tive c
rash
rate
fatal
injury
PDO

50
group had higher crash rates than the 15- to 17-year-old group. For 15- to 17-year-old
drivers, relative crash rates for fatal crashes increased dramatically as the number of
passengers increased; the increase for the 18- to 20-year olds was relatively small and it
reached a plateau with two passengers. For 15- to 17-year-old drivers, the ratio between fatal
crashes with 1, 2 and 3 passengers over that of zero passengers were 2.06, 2.47, and 3.72.
This confirms other research that restrictions on the number of passengers for drivers of this
age group is likely to be effective in saving lives.
An analysis of the trend of the number of passengers accompanying teenage drivers from
1994 to 2004 in Louisiana revealed that teenager drivers were increasingly likely to have
passengers and to have an increasing number of passengers in their vehicles, which according
to the analysis above, would result in more crashes.
The Impact of Passenger Age on Young Drivers. The RCIR values for different
passenger groups by age are presented in Figure 17. It is clear that young drivers with
learner’s licenses (i.e., drivers younger than 16 years) were most likely to be involved in
crashes when traveling with their peer group and they were safest when traveling with an
adult or a child for both single-vehicle and two-vehicle crashes. This suggested that adult
supervision had a strong influence on young drivers to drive safely. When they were
traveling with peers, the chance of being involved in a single-vehicle crash was greater than
the chance of being in a two-vehicle crash, with an RCIR value of 2.93 versus 1.60 for two-
vehicle crashes. It is likely that single-vehicle crashes are mostly caused by distractions
during driving and the risk-taking nature of the driver. The higher single-vehicle RCIR
values here suggest that there were distractions to the young drivers caused by the peer group
or peer pressure contributing to risk taking. Adding to this observation is the fact that the
highest RCIR values in each group in the analysis was for the drivers below the age of 16
(i.e., the drivers with learners’ permits) involved in single-vehicle crashes with peer group
passengers. Moreover, the adult/child category had the lowest RCIR values of the three
passenger groups, suggesting that the driver’s attitude does indeed change when there is adult
supervision or when they have responsibility for a younger child in the vehicle. The RCIR
values for drivers traveling alone for all age groups are approximately 1 for both single-
vehicle and two-vehicle crashes, suggesting that the young drivers were relatively
responsible when alone.
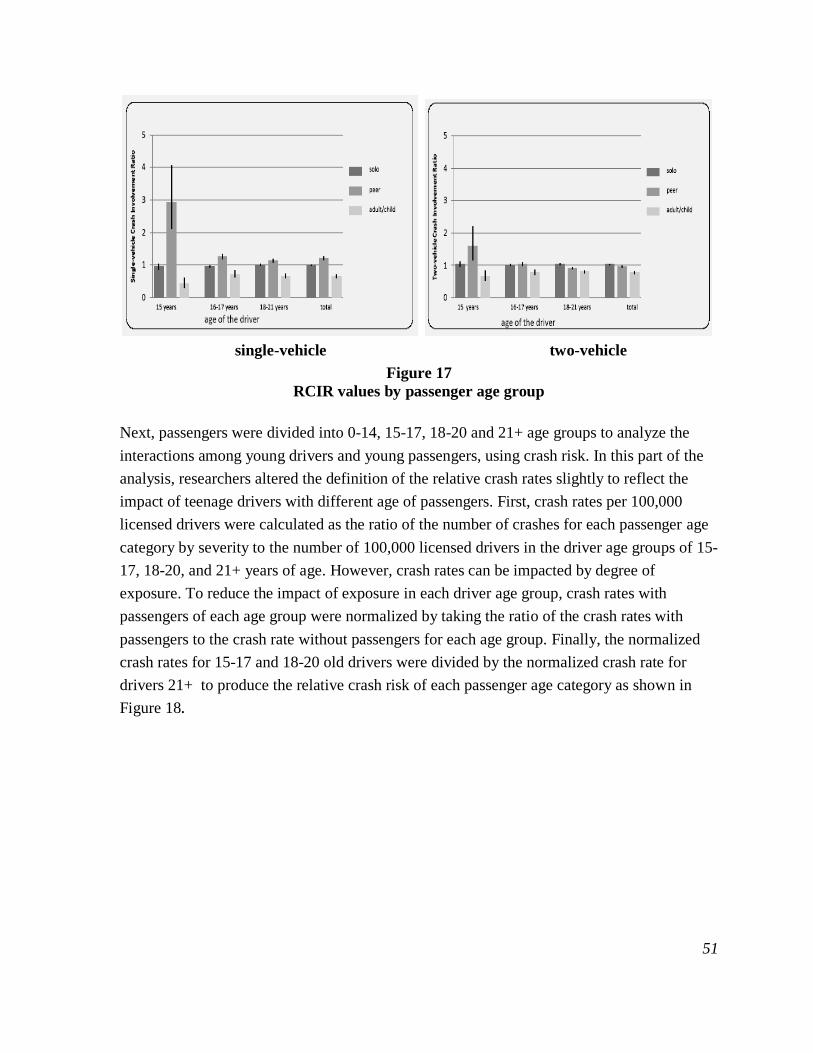
51
single-vehicle two-vehicle
Figure 17
RCIR values by passenger age group
Next, passengers were divided into 0-14, 15-17, 18-20 and 21+ age groups to analyze the
interactions among young drivers and young passengers, using crash risk. In this part of the
analysis, researchers altered the definition of the relative crash rates slightly to reflect the
impact of teenage drivers with different age of passengers. First, crash rates per 100,000
licensed drivers were calculated as the ratio of the number of crashes for each passenger age
category by severity to the number of 100,000 licensed drivers in the driver age groups of 15-
17, 18-20, and 21+ years of age. However, crash rates can be impacted by degree of
exposure. To reduce the impact of exposure in each driver age group, crash rates with
passengers of each age group were normalized by taking the ratio of the crash rates with
passengers to the crash rate without passengers for each age group. Finally, the normalized
crash rates for 15-17 and 18-20 old drivers were divided by the normalized crash rate for
drivers 21+ to produce the relative crash risk of each passenger age category as shown in
Figure 18.
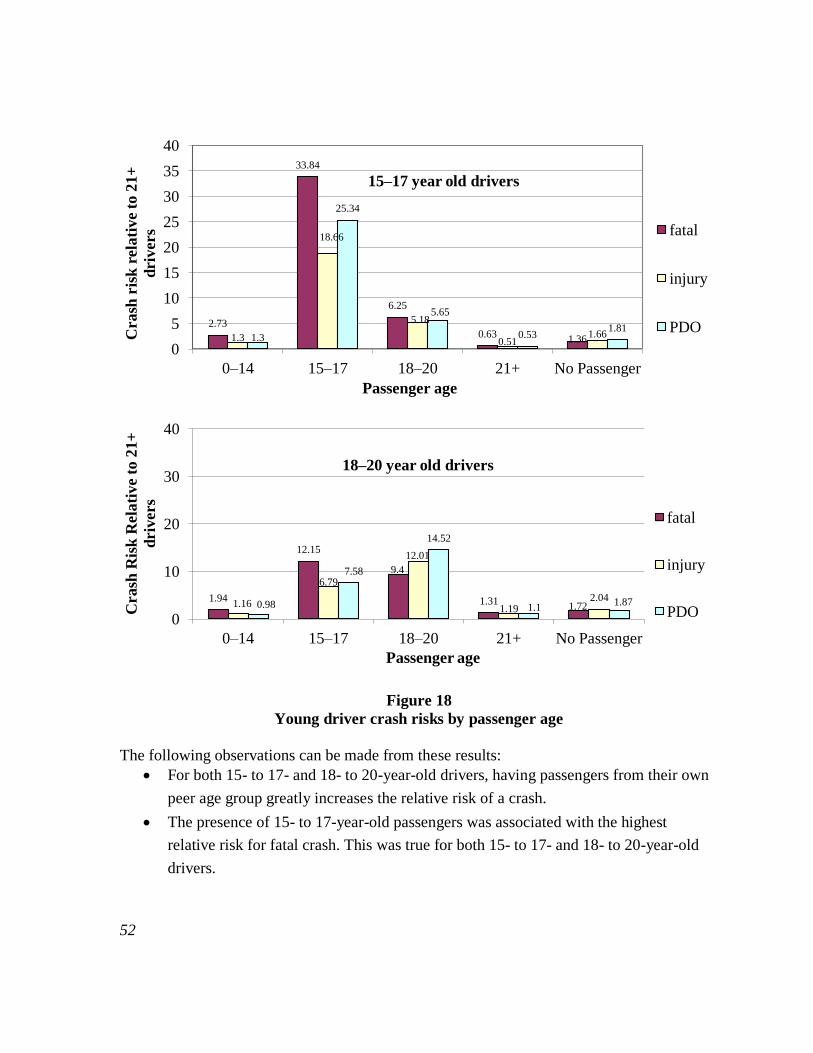
52
Figure 18
Young driver crash risks by passenger age
The following observations can be made from these results:
For both 15- to 17- and 18- to 20-year-old drivers, having passengers from their own
peer age group greatly increases the relative risk of a crash.
The presence of 15- to 17-year-old passengers was associated with the highest
relative risk for fatal crash. This was true for both 15- to 17- and 18- to 20-year-old
drivers.
2.73
33.84
6.25
0.63 1.36 1.3
18.66
5.18
0.51 1.66 1.3
25.34
5.65
0.53 1.81
0
5
10
15
20
25
30
35
40
0–14 15–17 18–20 21+ No Passenger
Crash
ris
k r
ela
tive t
o 2
1+
driv
ers
Passenger age
15–17 year old drivers
fatal
injury
PDO
1.94
12.15
9.4
1.31 1.72 1.16
6.79
12.01
1.19 2.04
0.98
7.58
14.52
1.1 1.87
0
10
20
30
40
0–14 15–17 18–20 21+ No Passenger
Crash
Ris
k R
ela
tive t
o 2
1+
driv
ers
Passenger age
18–20 year old drivers
fatal
injury
PDO
53
The presence of 21+ passengers was associated with the lowest crash rates for both
15-17 and 18-20 age groups. For the 15-17 age group, when passengers 21+ were
present, the relative crash rates for all crash severities were even lower than drivers of
21+.
Without passengers, both 15- to 17- and 18- to 20-year-old drivers had relative crash
rates higher than one, indicating that drivers from these age groups were more likely
to be involved in crashes than drivers 21+ when driving alone. Furthermore, the crash
rates without passengers were higher than for those with 21+ passengers, indicating
the positive effect of adult supervision of teenage driving.
Exposure also had an impact on the relative crash rates. For example, the low relative
crash rates associated with 0- to 14-year-old passengers might have been due to the
fact that teenagers were less likely to have 0- to 14-year olds as passengers.
There was also a differential inter-age group passenger impact on drivers. For
example, 15- to 17-year-old passengers had a stronger negative impact on 18- to 20-
year-old drivers than 18- to 20-year-old passengers had on 15- to 17-year-old drivers.
The Impact of Gender of Young Passenger on Young Drivers. In this part of the
analysis, teenage drivers (15-17 and 18-20) were first divided by gender, and then further
stratified by the age and gender of the passengers. The relative crash rates by different
combinations of teenager driver and passenger characteristics were analyzed. The
denominator of the relative crash rates was still the mixed passenger groups for drivers ages
21+.
Figure 19 gives the relative crash rates for 15- to 17 year-old male and female drivers with
different passenger age and gender mixes.

54
(a)
(b)
Figure 19
Relative crash rates for 15- to 17-year-old drivers
Based on the figures, the following observations were made about 15- to 17-year-old drivers:
For all crash severities and for both male and female drivers, accompaniment of
mixed gender passengers leads to the highest relative crash risk, whereas
accompaniment of passengers of the opposite gender leads to the lowest relative crash
risk.
0
5
10
15
20
25
30
fatal injury PDO fatal injury PDO fatal injury PDO
Male occupant age
groups
Female occupant age
groups
Both male & female
occupant age groups
18–20
15–17
0–14
15- to 17-year-old male drivers R
ela
tive c
rash
rate
0
5
10
15
20
25
30
35
40
fatal injury PDO fatal injury PDO fatal injury PDO
Male occupant age
groups
Female occupant age
groups
Both male & female
occupant age groups
18–20
15–17
0–14
15- to 17-year-old female drivers
Rela
tive c
rash
rate

55
Passengers in the 15- to 17-year-old age group have a higher relative crash risk than
passengers in other age groups.
For crash severity, fatal crashes were found to be the highest, followed by PDO and
then injury crashes except in cases where female drivers were accompanied by male
passengers, where the order for crash severity was PDO followed by injury and fatal
crashes.
Compared to male drivers, female drivers have a higher relative crash risk with
accompanying passengers except when accompanied by male passengers.
Again, the issue of exposure might have played a role in the previous figures. For
example, the relative rates for 15-17 female drivers with younger or older passenger
age groups were much lower than for their own peer age group. This was probably
because children from the 0-14 age group were less likely to be passengers of 15-17
male drivers.
Figure 20 gives the relative crash rates for 18- to 20-year-old male and female drivers with
different passenger age and gender mixes.

56
(a)
(b)
Figure 20
Relative crash rates for 18- to 20-year-old female drivers
0
5
10
15
20
25
fatal injury PDO fatal injury PDO fatal injury PDO
Male occupant age
groups
Female occupant age
groups
Both male & female
occupant age groups
18–20
15–17
0–14
18- to 20-year-old male drivers R
ela
tive c
rash
rate
0
5
10
15
20
25
fatal injury PDO fatal injury PDO fatal injury PDO
Male occupant age
groups
Female occupant age
groups
Both male & female
occupant age groups
18–20
15–17
0–14
18- to 20-year-old female drivers
Rela
tive c
rash
rate
57
Based on the previous figures, the following observations were made about 18- to -20-year-
old drivers:
For both male and female drivers, an accompaniment of passengers of the opposite
gender led to lowest relative crash risk and an accompaniment of mixed gender
passengers led to the highest relative crash risk.
Passengers in the 18- to 20-year-old age group were found to have the highest relative
crash rate. The 15- to 17-year-old group passengers were found to have higher impact
on the 18- to 20-year-old drivers but not vice versa.
Generally, the order of severity of crashes was PDO followed by injury and fatal
crashes except in cases where female drivers were accompanied by mixed gender
passengers or when male drivers were accompanied by male passengers.
Female drivers with mixed gender passengers had high relative crash risk rates except
when they were accompanied by male passengers.
An important observation is that the relative crash risk rate of 18- to 20-year-old
drivers is much smaller than that of 15- to 17-year-old drivers.
Driver Licensing. The analysis of the FARS data revealed that for drivers involved
in fatal crashes, Louisiana had a higher percentage of licensing problems than peer states and
the national average, as shown in Figure 21. Louisiana drivers had the highest rates of not
possessing valid driver’s licenses for both commercial driver license (CDL) and non-CDL
license. In terms of compliance with license endorsement, license type, and license
restrictions, when alcohol-related drivers per 100,000 licensed drivers with previous license
suspensions and revocations were considered, the rates were 1.70, 1.24, and 1.08 for
Louisiana, peer states, and the US, respectively. Louisiana was 63.9 percent higher than the
national average. The analysis of alcohol-related drivers with previous license suspensions
and/or revocations also indicated possible licensing problems for repeat DUI recidivism.
However, failure to have vehicle insurance in Louisiana results in the registered owner’s
drivers license being suspended even though that driver is legally able to drive a vehicle with
adequate insurance. Other states may have different regulations regarding when to suspend a
drivers license resulting in an inequitable comparison. On the other hand, the fact that the
rates are as high as they are in Louisiana suggests that further investigation is warranted.

58
Figure 21
Licensing problems in Louisiana
Analysis of Occupant Characteristics
Restraint System. Louisiana is over represented in seatbelt non-use. According to
FARS from 1999 to 2004, the non-use rate for both drivers and passengers in fatal crashes
for Louisiana was 45.6 percent, which was lower than the average for the peer states (48.5
percent), but higher than Florida (41.7 percent), Texas (36.0 percent), and the national
average (40.4 percent). Note that these seatbelt non-use rates are for fatal crashes only and
are not non-use rates in general. According to NHTSA (NHSTA, 2008), the Louisiana
seatbelt non-use rate was 25.2 percent in general, compared to the US average of 19.0
percent for 2006. Thus, the non-use rates among fatal crashes are almost twice the rate for
non-use in general.
Figure 22 gives the occupant seatbelt non-use rate per 1,000 populations by age and gender
from the Louisiana crash database. It is clear that 18- to 20-year-old occupants had the
highest rate of not using seatbelts. The rate decreases as age increases except for the 7- to 14-
year-old group. In general, males had higher non-use rates than females, although the gap
0%
10%
20%
30%
No
Va
lid
No
n-C
DL
Lic
ense
No
Va
lid
CD
L
Lic
ense
No
n-C
om
pli
an
ce w
ith
Lic
ense
En
do
rsem
ent
Lic
ense
Typ
e
Vio
lati
on
s
Lic
ense
Res
tric
tio
n
Vio
lati
on
s
DU
I w
ith
Pre
vio
us
Su
spen
sio
ns/
Rev
oca
ti
on
s
Louisiana Peer States Florida Texas USA Total N
on
-com
pli
an
ce r
ate
s

59
decreases as age progresses. For occupants 55 and over, female non-use rates were higher
than male. Among those who used a seatbelt, 4.0 percent and 4.9 percent used only shoulder
or lap belts, respectively.
Figure 22
Seatbelt non-use rate per 1,000 population by age and gender
Louisiana law requires the use of proper child safety restraint systems for children under the
age of six. The following results were obtained through further analysis of child safety
restraint systems for Louisiana:
Children 6 years and younger were more likely to sit in the second row of seats than
the first row of seats.
Child restraint systems non-use rate for the second row seats was almost twice that
for first row seats except for one-year-old children.
Children in the second row seats were more likely to use shoulder/lap belt instead of
child safety restraint systems. This tendency increased markedly when children
reached the age of 3 and kept increasing until age 4 and became constant for ages 5
and 6.
The use of child restraint systems decreased markedly as age progressed, almost by
50 percent every year of increase of age.
The rate of improper use of child restraint systems was almost constant at
approximately 10 percent for those involved in crashes.
0
10
20
30
40
7–14 15–17 18–20 21–24 25–34 35–44 45–54 55-64 65+
Age
Male
Female Seat
belt
non
-use
rate

60
Figure 23 presents the seating positions of passengers under 17 years old. Almost 80 percent
of passengers under the age of 6 sat in the second row seats. For 7- to 14-year-old
passengers, about 41 percent and 54 percent sat in the second and first row of seats,
respectively, and fewer than 5 percent in the third row seats. However, 66 percent of 15- to
17-year-old passengers sat in the first row seats and 33 percent in the second row seats. This
indicated a trend that, as age progressed, children were more likely to move from second row
seats to first row seats.
Figure 23
Seating position for occupants 17 years old and under by percentage
For passengers from 7 to 17 years old who sat in the first row, the percentage using both
shoulder and lap belts were about the same for age groups 7-14 and 15-17. However, after
moving to the second row seats, 15- to 17-year olds who used both shoulder and lap belts
decreased markedly to 9 percent, in contrast to the 7-14 age group who retained their level of
seatbelt use. From the analysis, it seems that a requirement for passengers in the second row
seats to use seatbelts will provide better protection for children less than 14 years of age,
especially when considering the fact that child safety restraint systems usage for children
under 6 decreased sharply after reaching 3 years of age.
Number of Occupants. Louisiana was over represented with respect to the national
average in terms of crashes where there was more than one passenger in the vehicle. The
over representation was primarily caused by teenage drivers (15-7 and 18-20), who had much
higher crash rates when there were passengers, especially when there were a higher number
0-6
15-17
0%
50%
100%
1st row 2nd row 3rd row
Occupant Age
Seating Position

61
of passengers. This can be demonstrated by recalculating the ORF after crashes from teenage
drivers (15-17 and 18-20) in Louisiana are subtracted. After that, almost all the over
representations for occupants over two disappear. The majority of the passengers of young
drivers were from their peer age groups (Fu and Wilmot, 2008).
Analysis of Pedestrian Characteristics
Pedestrian fatalities constituted 5.2 percent of all fatalities in Louisiana according to FARS.
The top activities associated with pedestrian crashes included crossing/entering roads not at
an intersection, crossing/entering roads at an intersection, walking in roads with traffic, and
standing in roadways. Crossing/entering road not at an intersection was the most frequent
pedestrian activity associated with crashes.
Pedestrian Age and Action. Figure 24 presents the frequency distribution by age
and by pedestrian actions for pedestrians under 55 years of age. The grouping of age was
based on the similarity of the crash frequencies for each age group. The frequencies were the
total number of crashes divided by the age span each age group covers.
Figure 24
Frequency distribution by pedestrian age and action
0
20
40
60
80
100
120
140
160
1-4 5-8 9-12 13-16 17-20 21-24 25-34 35-44 45-54
Ave. crash
fre
qu
en
cy
per
year
Pedestrian Age
Walking on road with
traffic
Walking on road
against traffic
Playing on roadway
Crossing/entering road
at intersection
Crossing/entering road
not at intersection
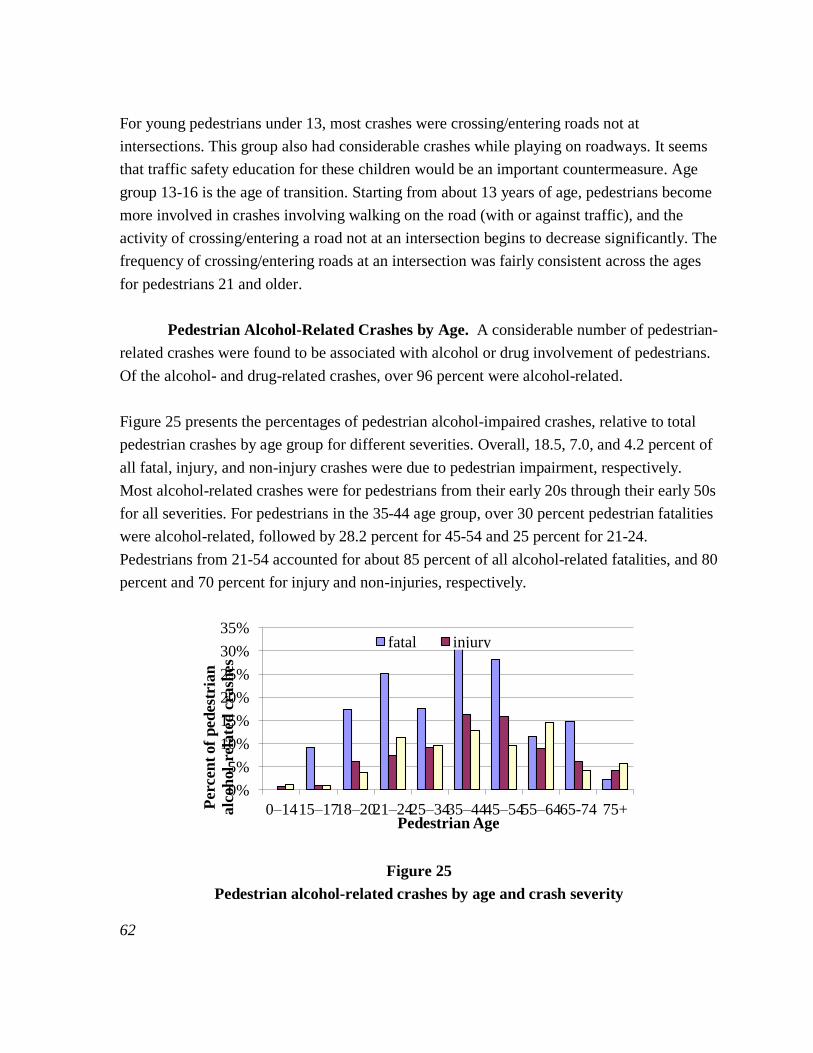
62
For young pedestrians under 13, most crashes were crossing/entering roads not at
intersections. This group also had considerable crashes while playing on roadways. It seems
that traffic safety education for these children would be an important countermeasure. Age
group 13-16 is the age of transition. Starting from about 13 years of age, pedestrians become
more involved in crashes involving walking on the road (with or against traffic), and the
activity of crossing/entering a road not at an intersection begins to decrease significantly. The
frequency of crossing/entering roads at an intersection was fairly consistent across the ages
for pedestrians 21 and older.
Pedestrian Alcohol-Related Crashes by Age. A considerable number of pedestrian-
related crashes were found to be associated with alcohol or drug involvement of pedestrians.
Of the alcohol- and drug-related crashes, over 96 percent were alcohol-related.
Figure 25 presents the percentages of pedestrian alcohol-impaired crashes, relative to total
pedestrian crashes by age group for different severities. Overall, 18.5, 7.0, and 4.2 percent of
all fatal, injury, and non-injury crashes were due to pedestrian impairment, respectively.
Most alcohol-related crashes were for pedestrians from their early 20s through their early 50s
for all severities. For pedestrians in the 35-44 age group, over 30 percent pedestrian fatalities
were alcohol-related, followed by 28.2 percent for 45-54 and 25 percent for 21-24.
Pedestrians from 21-54 accounted for about 85 percent of all alcohol-related fatalities, and 80
percent and 70 percent for injury and non-injuries, respectively.
Figure 25
Pedestrian alcohol-related crashes by age and crash severity
0%
5%
10%
15%
20%
25%
30%
35%
0–14 15–17 18–20 21–24 25–34 35–44 45–54 55–64 65-74 75+ Perc
en
t of
ped
est
ria
n
alc
oh
ol-
rela
ted
crash
es
Pedestrian Age
fatal injury

63
Percentage of Pedestrian Alcohol-related Crashes by Age and Severity.
Pedestrians in the 35-44 and 45-44 year-old groups had the most pedestrian drinking-
impaired crashes and half of them took place when they tried to cross/enter roads not at an
intersection. In terms of gender distribution, 38.4 percent pedestrians involved in crashes
were female compared to 61.6 percent for male, while only 22.7 percent female were
drinking impaired compared to 77.3 percent for male.
Temporal Distribution. In terms of temporal distribution, injury and no injury
pedestrian crashes started to increase from 7 a.m. and reached a peak at about 4 or 5 p.m.
Fatal pedestrian crashes were the lowest from 7-8 a.m. and did not increase significantly until
2 p.m., and then increased sharply and reached a peak at about 8 p.m. However, most
alcohol-related crashes took place at night. For children 17 and younger, most crashes took
place in the afternoon hours. The most frequent was from 3-7 p.m. The number one cause
for pedestrian crashes involving children 5 years and younger was crossing/entering roadway
not at intersections.
Analysis of Roadway Characteristics
Highway Class. The total segment length in miles and VMT for state highways, US
highways, and Interstates in Louisiana can be calculated from the 2004 segment table of the
DOTD 2004 database. Of these highways, state highways comprise of 80.6 percent of their
total center line miles, but carry only 46.3 percent of the VMT. Figure 26 presents the
distribution of center lane miles by highway class. Among state highways, US highways, and
interstate freeways, 75.9 percent are rural two-lane highways.
Figure 26
Center lane mile distribution by highway class
rural 2-lane
rural 4-lane
rural 4-lane divided
rural interstate
urban 2-lane
urban 4-lane
urban 4-lane divided
urban interstate

64
Figure 27 presents the crash rates per 1 million VMT by highway class for fatal crashes, and
Figure 28 shows crash rates for injury and PDO crashes per 100 million VMT. Fatal crash
rates are higher on rural roads than on urban roads; however, injury and PDO crash rates are
higher on urban roads than on rural roads. Alcohol-related crash rates follow similar
patterns.
Figure 27
Fatality rates by highway class
The top five parishes with the highest crash percentages on rural two-lane highways in
Louisiana were identified. These five parishes are Livingston, LaFourche, Ascension, St.
Tammany, and Tangipahoa. They accounted for 22.2 percent of all crashes on rural two-lane
highways in Louisiana but accounted for only 10.3 percent of Louisiana’s population
according to the 2004 census. They are also among the top five parishes for alcohol-related
crashes on rural two-lane highways.
0
10
20
30
40
50
60
70
Fata
liti
es
per
1 m
illi
on
VM
T
Highway Class

65
Figure 28
Crash rates by highway class
Rural Two-Lane Highways by Width. An investigation of crash distribution and
crash rates on rural two-lane highways by lane width revealed the problems associated with
narrow rural two-lane roads. Figure 29 presents the crash rates for both alcohol and non-
alcohol-related crashes on rural two-lane highways by crash severity. Crash rates are higher
on narrower roads, and particularly on 18-ft. wide roads, and this is exacerbated with
alcohol-related crashes where they are more than five times higher than on 24-ft. wide roads.
In terms of crash percentages, only 1.6, 1.6, and 1.7 percent of all fatal, injury, and PDO rural
two-lane highway crashes, respectively, occur on narrow rural two-lane highways. From
1999 to 2004, the mileage of two-lane highways less than 24-ft. wide had decreased from
940 miles to 644 miles. However, based on the high crash rates on narrow rural two-lane
highways, they remain a matter of concern.
0
2000
4000
6000
8000
10000
12000 C
rah
es
per
1 m
illi
on
VM
T
Highway Class
injury PDO

66
Figure 29
Crash rates on rural two-lane highways by width and by alcohol involvement
Relation to Roadway. On-shoulder and off-roadway crashes are over represented in
Louisiana with ORFs of 262 percent and 255 percent, respectively, in reference to the
national average. Fatal off-roadway crashes are over represented by 338 percent. Of all fatal
crashes in Louisiana, 20.7 percent occurred as off-roadway crashes, while only 2.8 percent
are on shoulder crashes. Only 8.3 percent injury and 6.2 percent PDO crashes occurred off-
roadway in Louisiana, so the problem appears to be related to fatal off-roadway crashes.
Subsequently, they were analyzed in greater depth as reported next.
0
20
40
60
80
100
120
18 20 22 24 26
Crah
s R
ate
Pavement Width (ft.)
Non–Alcohol–Related fatal: per
50,000,000 vmts
injury: per
1,000,000 vmts
PDO: per
1,000,000 vmts
0
4
8
12
16
18 20 22 24 26
Crash
rate
Pavement Width (ft.)
Alcohol–related
fatal: per 10,000,000
vmts
injury: per 1,000,000
vmts
PDO: per 1,000,000
vmts
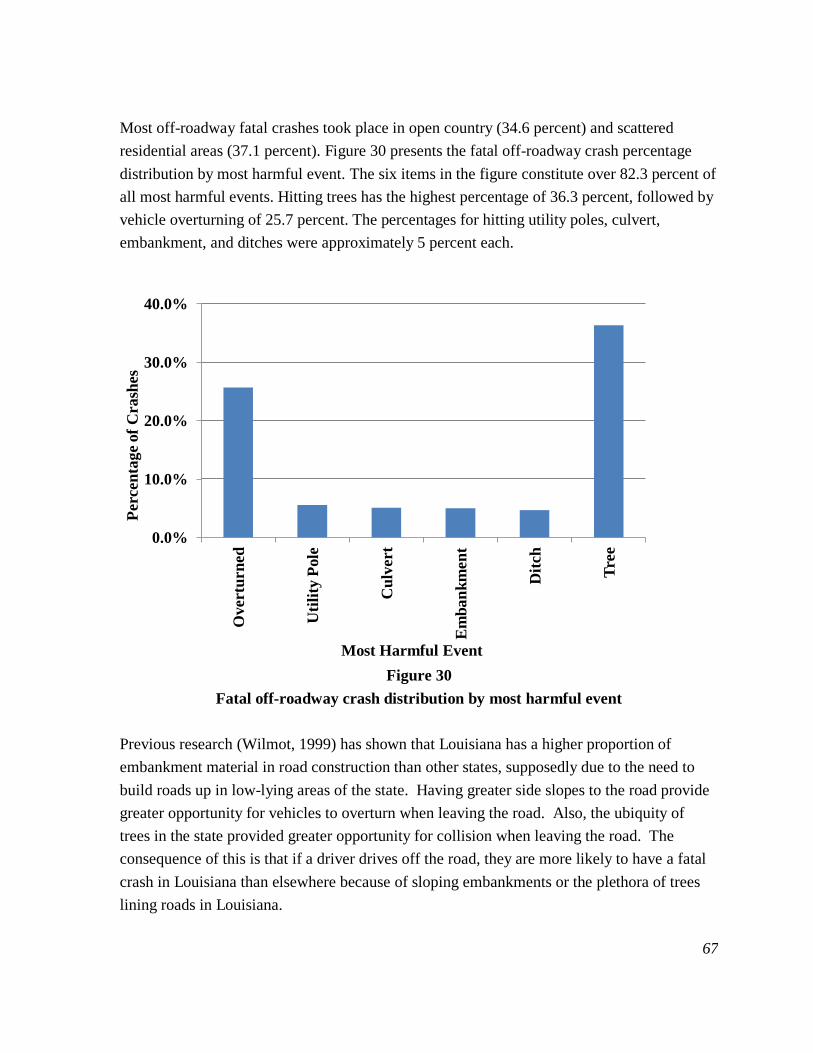
67
Most off-roadway fatal crashes took place in open country (34.6 percent) and scattered
residential areas (37.1 percent). Figure 30 presents the fatal off-roadway crash percentage
distribution by most harmful event. The six items in the figure constitute over 82.3 percent of
all most harmful events. Hitting trees has the highest percentage of 36.3 percent, followed by
vehicle overturning of 25.7 percent. The percentages for hitting utility poles, culvert,
embankment, and ditches were approximately 5 percent each.
Figure 30
Fatal off-roadway crash distribution by most harmful event
Previous research (Wilmot, 1999) has shown that Louisiana has a higher proportion of
embankment material in road construction than other states, supposedly due to the need to
build roads up in low-lying areas of the state. Having greater side slopes to the road provide
greater opportunity for vehicles to overturn when leaving the road. Also, the ubiquity of
trees in the state provided greater opportunity for collision when leaving the road. The
consequence of this is that if a driver drives off the road, they are more likely to have a fatal
crash in Louisiana than elsewhere because of sloping embankments or the plethora of trees
lining roads in Louisiana.
0.0%
10.0%
20.0%
30.0%
40.0%
Overtu
rn
ed
Uti
lity
Pole
Cu
lvert
Em
ban
km
en
t
Dit
ch
Tre
e
Perc
en
tage o
f C
rash
es
Most Harmful Event
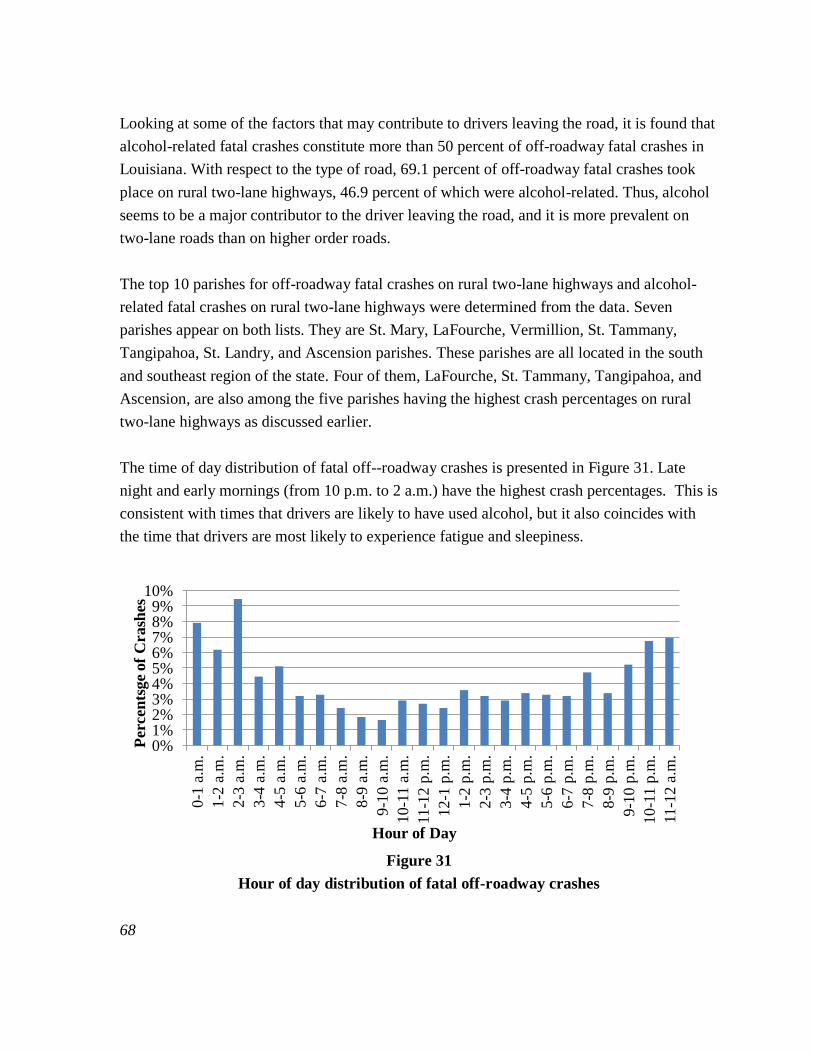
68
Looking at some of the factors that may contribute to drivers leaving the road, it is found that
alcohol-related fatal crashes constitute more than 50 percent of off-roadway fatal crashes in
Louisiana. With respect to the type of road, 69.1 percent of off-roadway fatal crashes took
place on rural two-lane highways, 46.9 percent of which were alcohol-related. Thus, alcohol
seems to be a major contributor to the driver leaving the road, and it is more prevalent on
two-lane roads than on higher order roads.
The top 10 parishes for off-roadway fatal crashes on rural two-lane highways and alcohol-
related fatal crashes on rural two-lane highways were determined from the data. Seven
parishes appear on both lists. They are St. Mary, LaFourche, Vermillion, St. Tammany,
Tangipahoa, St. Landry, and Ascension parishes. These parishes are all located in the south
and southeast region of the state. Four of them, LaFourche, St. Tammany, Tangipahoa, and
Ascension, are also among the five parishes having the highest crash percentages on rural
two-lane highways as discussed earlier.
The time of day distribution of fatal off--roadway crashes is presented in Figure 31. Late
night and early mornings (from 10 p.m. to 2 a.m.) have the highest crash percentages. This is
consistent with times that drivers are likely to have used alcohol, but it also coincides with
the time that drivers are most likely to experience fatigue and sleepiness.
Figure 31
Hour of day distribution of fatal off-roadway crashes
0% 1% 2% 3% 4% 5% 6% 7% 8% 9%
10%
0-1
a.m
.
1-2
a.m
.
2-3
a.m
.
3-4
a.m
.
4-5
a.m
.
5-6
a.m
.
6-7
a.m
.
7-8
a.m
.
8-9
a.m
.
9-1
0 a
.m.
10-1
1 a
.m.
11-1
2 p
.m.
12-1
p.m
.
1-2
p.m
.
2-3
p.m
.
3-4
p.m
.
4-5
p.m
.
5-6
p.m
.
6-7
p.m
.
7-8
p.m
.
8-9
p.m
.
9-1
0 p
.m.
10-1
1 p
.m.
11
-12 a
.m.
Perc
en
tsge o
f C
rash
es
Hour of Day
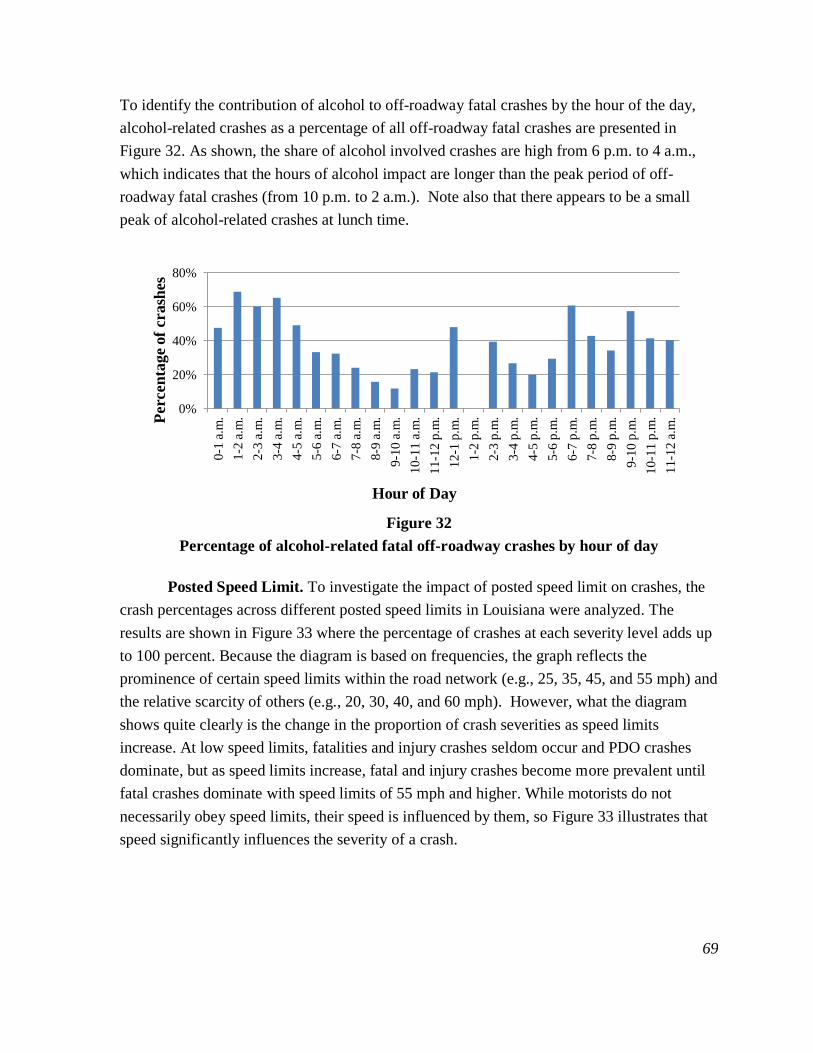
69
To identify the contribution of alcohol to off-roadway fatal crashes by the hour of the day,
alcohol-related crashes as a percentage of all off-roadway fatal crashes are presented in
Figure 32. As shown, the share of alcohol involved crashes are high from 6 p.m. to 4 a.m.,
which indicates that the hours of alcohol impact are longer than the peak period of off-
roadway fatal crashes (from 10 p.m. to 2 a.m.). Note also that there appears to be a small
peak of alcohol-related crashes at lunch time.
Figure 32
Percentage of alcohol-related fatal off-roadway crashes by hour of day
Posted Speed Limit. To investigate the impact of posted speed limit on crashes, the
crash percentages across different posted speed limits in Louisiana were analyzed. The
results are shown in Figure 33 where the percentage of crashes at each severity level adds up
to 100 percent. Because the diagram is based on frequencies, the graph reflects the
prominence of certain speed limits within the road network (e.g., 25, 35, 45, and 55 mph) and
the relative scarcity of others (e.g., 20, 30, 40, and 60 mph). However, what the diagram
shows quite clearly is the change in the proportion of crash severities as speed limits
increase. At low speed limits, fatalities and injury crashes seldom occur and PDO crashes
dominate, but as speed limits increase, fatal and injury crashes become more prevalent until
fatal crashes dominate with speed limits of 55 mph and higher. While motorists do not
necessarily obey speed limits, their speed is influenced by them, so Figure 33 illustrates that
speed significantly influences the severity of a crash.
0%
20%
40%
60%
80%
0-1
a.m
.
1-2
a.m
.
2-3
a.m
.
3-4
a.m
.
4-5
a.m
.
5-6
a.m
.
6-7
a.m
.
7-8
a.m
.
8-9
a.m
.
9-1
0 a
.m.
10-1
1 a
.m.
11-1
2 p
.m.
12-1
p.m
.
1-2
p.m
.
2-3
p.m
.
3-4
p.m
.
4-5
p.m
.
5-6
p.m
.
6-7
p.m
.
7-8
p.m
.
8-9
p.m
.
9-1
0 p
.m.
10-1
1 p
.m.
11-1
2 a
.m. Perc
en
tage o
f crash
es
Hour of Day
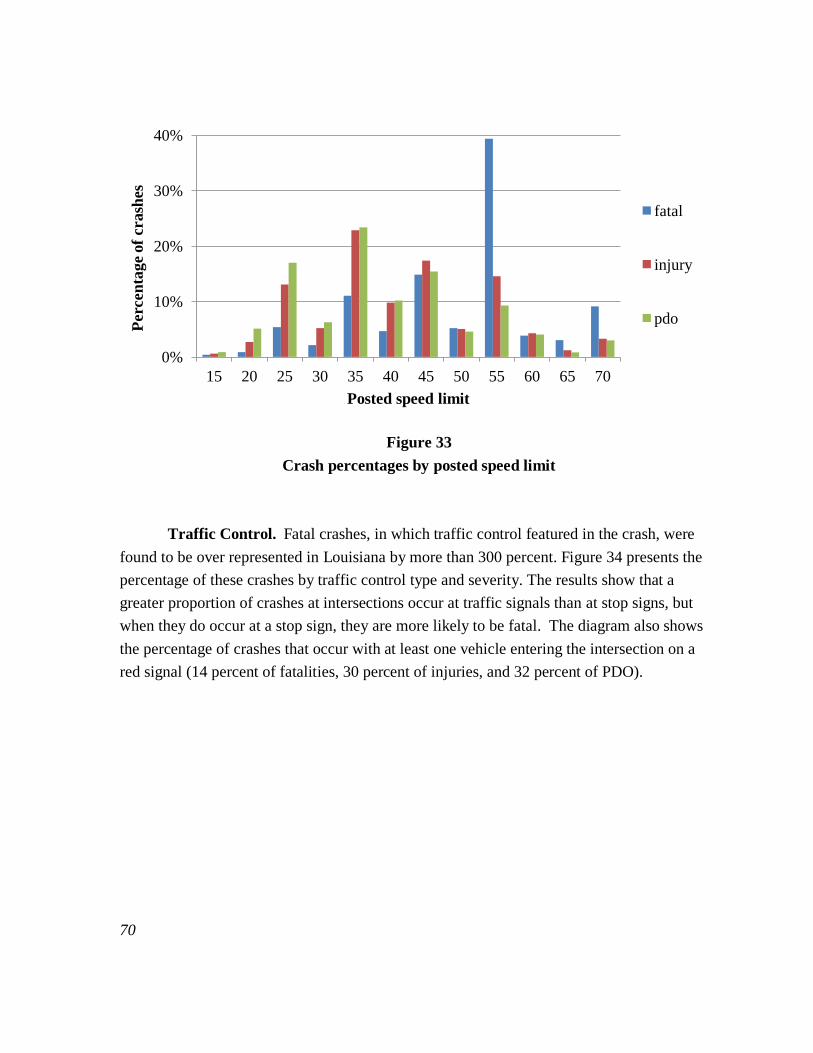
70
Figure 33
Crash percentages by posted speed limit
Traffic Control. Fatal crashes, in which traffic control featured in the crash, were
found to be over represented in Louisiana by more than 300 percent. Figure 34 presents the
percentage of these crashes by traffic control type and severity. The results show that a
greater proportion of crashes at intersections occur at traffic signals than at stop signs, but
when they do occur at a stop sign, they are more likely to be fatal. The diagram also shows
the percentage of crashes that occur with at least one vehicle entering the intersection on a
red signal (14 percent of fatalities, 30 percent of injuries, and 32 percent of PDO).
0%
10%
20%
30%
40%
15 20 25 30 35 40 45 50 55 60 65 70
Perc
en
tage o
f crash
es
Posted speed limit
fatal
injury
pdo
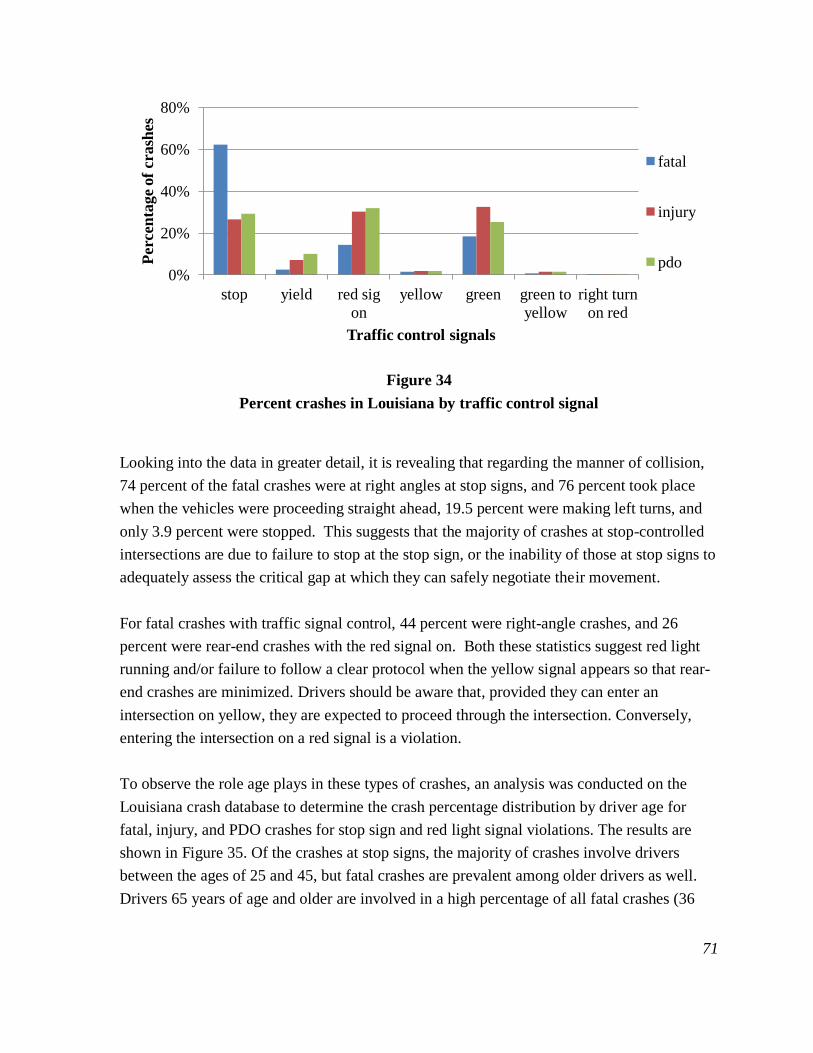
71
Figure 34
Percent crashes in Louisiana by traffic control signal
Looking into the data in greater detail, it is revealing that regarding the manner of collision,
74 percent of the fatal crashes were at right angles at stop signs, and 76 percent took place
when the vehicles were proceeding straight ahead, 19.5 percent were making left turns, and
only 3.9 percent were stopped. This suggests that the majority of crashes at stop-controlled
intersections are due to failure to stop at the stop sign, or the inability of those at stop signs to
adequately assess the critical gap at which they can safely negotiate their movement.
For fatal crashes with traffic signal control, 44 percent were right-angle crashes, and 26
percent were rear-end crashes with the red signal on. Both these statistics suggest red light
running and/or failure to follow a clear protocol when the yellow signal appears so that rear-
end crashes are minimized. Drivers should be aware that, provided they can enter an
intersection on yellow, they are expected to proceed through the intersection. Conversely,
entering the intersection on a red signal is a violation.
To observe the role age plays in these types of crashes, an analysis was conducted on the
Louisiana crash database to determine the crash percentage distribution by driver age for
fatal, injury, and PDO crashes for stop sign and red light signal violations. The results are
shown in Figure 35. Of the crashes at stop signs, the majority of crashes involve drivers
between the ages of 25 and 45, but fatal crashes are prevalent among older drivers as well.
Drivers 65 years of age and older are involved in a high percentage of all fatal crashes (36
0%
20%
40%
60%
80%
stop yield red sig
on
yellow green green to
yellow
right turn
on red
Perc
en
tage
of
crash
es
Traffic control signals
fatal
injury
pdo
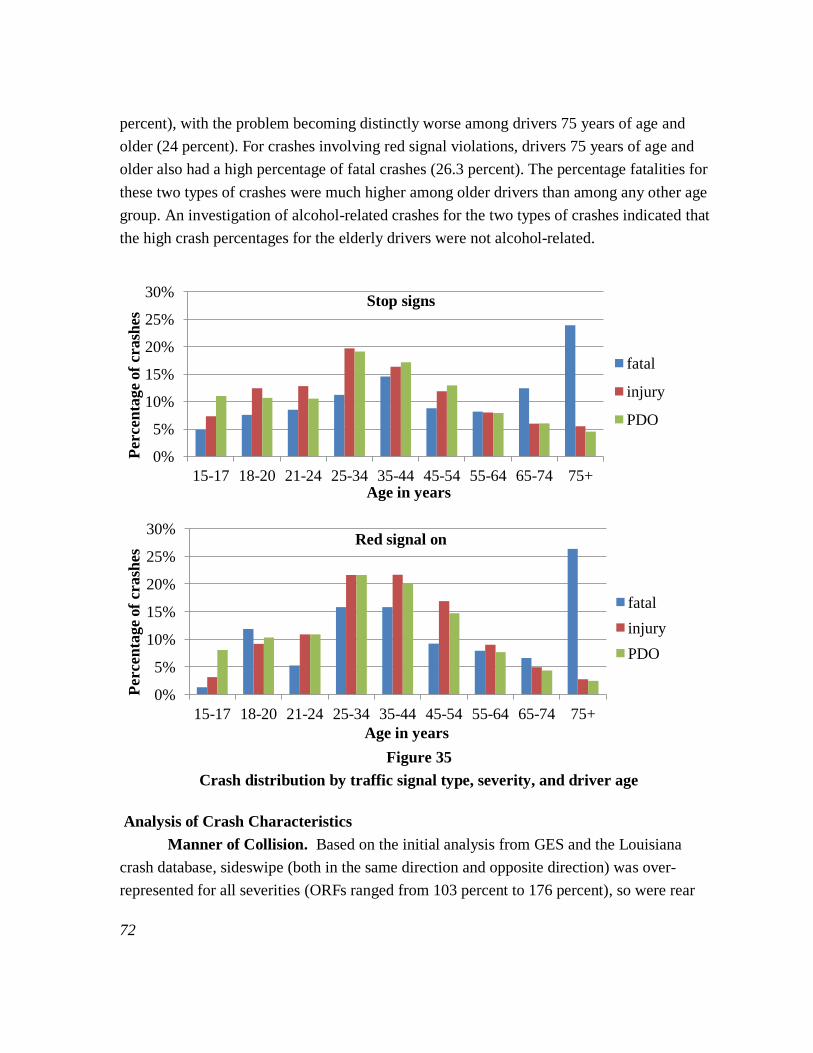
72
percent), with the problem becoming distinctly worse among drivers 75 years of age and
older (24 percent). For crashes involving red signal violations, drivers 75 years of age and
older also had a high percentage of fatal crashes (26.3 percent). The percentage fatalities for
these two types of crashes were much higher among older drivers than among any other age
group. An investigation of alcohol-related crashes for the two types of crashes indicated that
the high crash percentages for the elderly drivers were not alcohol-related.
Figure 35
Crash distribution by traffic signal type, severity, and driver age
Analysis of Crash Characteristics
Manner of Collision. Based on the initial analysis from GES and the Louisiana
crash database, sideswipe (both in the same direction and opposite direction) was over-
represented for all severities (ORFs ranged from 103 percent to 176 percent), so were rear
0%
5%
10%
15%
20%
25%
30%
15-17 18-20 21-24 25-34 35-44 45-54 55-64 65-74 75+
Stop signs
fatal
injury
PDO
Percen
tage o
f crash
es
Age in years
0%
5%
10%
15%
20%
25%
30%
15-17 18-20 21-24 25-34 35-44 45-54 55-64 65-74 75+
Red signal on
fatal
injury
PDO
Percen
tage o
f crash
es
Age in years

73
end for injury and PDO (ORFs were 111 percent and 109 percent), and head-on for fatal
crashes (ORF was 113 percent). These three types of crashes were further analyzed by
highway type and highway class.
Head-On Fatal Crashes. A total of 67.6 percent fatal, 39.3 percent injury, and 20.5
percent PDO head-on crashes took place on rural two-lane highways. Most head-on crashes
on rural two-lane highways took place in daytime, especially in the afternoon. Head-on
collisions resulted in more injury and fatal crashes than PDO on rural two-lane highways.
Further analysis of driver age distribution indicated that the age distribution on rural two-lane
highways was not different from that for all roads.
Figure 36 presents the percentage of the alcohol-related head-on crashes on rural two-lane
highways over all head-on crashes on rural two-lane highways by severity and time of day.
Alcohol-related head-on crashes had similar distributions as all alcohol-related crashes; it
constituted a large share of nighttime crashes, especially for injury and fatal crashes.
Figure 36
Percent alcohol-related head-on crashes by hour of the day
Rear-End Crashes. Because there were few fatal rear-end crashes, only injury and
PDO crashes were analyzed. The majority of rear-end crashes took place on state highways
(33-35 percent) and US highways (21-23 percent). The rear-end crashes on these roads could
be most conveniently analyzed using the DOTD database. Results showed that approximately
0%
20%
40%
60%
80%
0-1
a.m
.
1-2
a.m
.
2-3
a.m
.
3-4
a.m
.
4-5
a.m
.
5-6
a.m
.
6-7
a.m
.
7-8
a.m
.
8-9
a.m
.
9-1
0 a
.m.
10
-11
a.m
.
11
-12
p.m
.
12
-1 p
.m.
1-2
p.m
.
2-3
p.m
.
3-4
p.m
.
4-5
p.m
.
5-6
p.m
.
6-7
p.m
.
7-8
p.m
.
8-9
p.m
.
9-1
0 p
.m.
10
-11
p.m
.
11
-12
a.m
.
Hour of day
fatal
injury
PDO
P
ercen
tage
of
crash
es

74
80 percent of injury crashes and PDO crashes took place on urban roads and about one-third
took place on urban four-lane divided highways. Thus urban roads were targeted for further
investigation.
Figure 37 presents the rear-end crashes on urban roads, which included state and US
highways and interstate freeways. The distribution was almost identical to that of urban four-
lane highways. Most injury and PDO crashes took place on day time hours.
Figure 37
Number of rear-end crashes for urban roads by hour of the day
Sideswipe. Sideswipe crashes were over represented for both the same and opposite
directions for all crash severities. Figure 38 presents the percentage distribution by highway
class for sideswipe crashes. For same direction sideswipe fatal crashes, freeways (both rural
and urban) had the highest crash percentages, followed by rural two-lane highways. Urban
four-lane divided highways and urban freeways had the most injury and PDO crashes.
However, for opposite direction crashes, rural two-lane highways had the most crashes, with
69.0, 53.7, and 41.1 percents of all crashes for fatal, injury, and PDO crashes, respectively.
0
3000
6000
9000
12000
15000
0-1
a.m
. 1-2
a.m
. 2-3
a.m
. 3-4
a.m
. 4-5
a.m
. 5-6
a.m
. 6-7
a.m
. 7-8
a.m
. 8-9
a.m
. 9-1
0 a
.m.
10-1
1 a
.m.
11-1
2 p
.m.
12
-1 p
.m.
1-2
p.m
. 2
-3 p
.m.
3-4
p.m
. 4
-5 p
.m.
5-6
p.m
. 6
-7 p
.m.
7-8
p.m
. 8
-9 p
.m.
9-1
0 p
.m.
10-1
1 p
.m.
11-1
2 a
.m.
Nu
mb
er
of
crash
es
Hour of day
injury
PDO

75
Figure 38
Percentage distribution by highway class for sideswipe crashes
Figure 38’s results were corroborated by the analysis of crash percentages by the number of
lanes in Figure 39. The same direction sideswipe crashes took place most frequently on four-
lane highways, followed by two-lane highways; for opposite direction sideswipe crashes, the
majority took place on two-lane highways.
0%
10%
20%
30%
40%
Two
Lane
Rural
Four
Lane
Rural
4 Lane
Divided
Rural
Freeways
Rural
Two
Lane
Urban
Four
Lane
Urban
4 Lane
Divided
Urban
Freeways
Urban
Same direction fatal
injury
PDO
Percen
tage
of
crash
es
Highway Class
0%
10%
20%
30%
40%
50%
60%
70%
80%
Two
Lane
Rural
Four
Lane
Rural
4 Lane
Divided
Rural
Freeways
Rural
Two
Lane
Urban
Four
Lane
Urban
4 Lane
Divided
Urban
Freeways
Urban
Opposite direction
fatal
injury
PDO
Percen
tage
of
crash
es
Highway Class
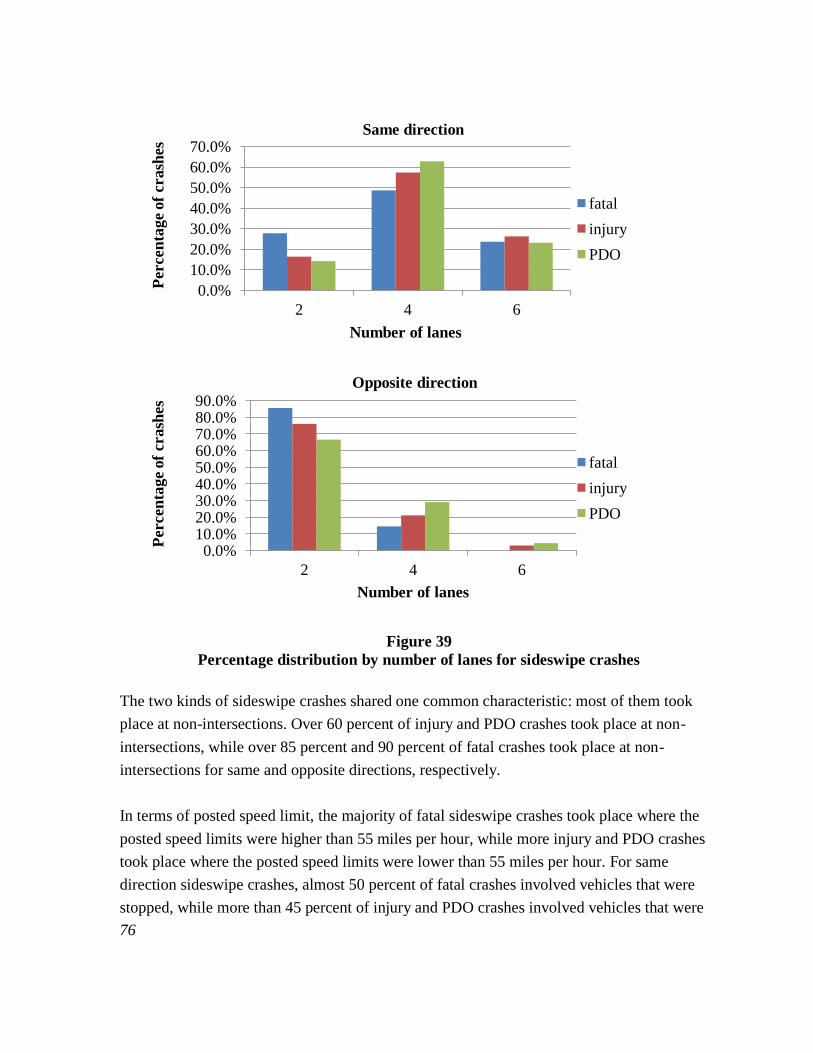
76
Figure 39
Percentage distribution by number of lanes for sideswipe crashes
The two kinds of sideswipe crashes shared one common characteristic: most of them took
place at non-intersections. Over 60 percent of injury and PDO crashes took place at non-
intersections, while over 85 percent and 90 percent of fatal crashes took place at non-
intersections for same and opposite directions, respectively.
In terms of posted speed limit, the majority of fatal sideswipe crashes took place where the
posted speed limits were higher than 55 miles per hour, while more injury and PDO crashes
took place where the posted speed limits were lower than 55 miles per hour. For same
direction sideswipe crashes, almost 50 percent of fatal crashes involved vehicles that were
stopped, while more than 45 percent of injury and PDO crashes involved vehicles that were
0.0%
10.0%
20.0%
30.0%
40.0%
50.0%
60.0%
70.0%
2 4 6
Number of lanes
Same direction
fatal
injury
PDO
Percen
tage
of
crash
es
0.0% 10.0% 20.0% 30.0% 40.0% 50.0% 60.0% 70.0% 80.0% 90.0%
2 4 6
Number of lanes
Opposite direction
fatal
injury
PDO
Percen
tage
of
crash
es
77
proceeding straight ahead. However, for opposite direction sideswipe crashes, few crashes
involved stopped vehicles. Instead, the majority of the crashes involved vehicles that were
proceeding straight ahead and crossed the central line into opposing traffic.
Figure 40 presents the percentage of sideswipe crash distributions by time of day for the
same and opposite directions. As can be seen, the distributions for injury and PDO crashes
are similar, and different to those of fatal crashes. There were higher percentages of fatal
sideswipe for same direction crashes between evening and midnight, while there were more
sideswipe opposite direction fatal crashes in the daytime, especially from noon to late
afternoon.

78
Figure 40
Percentage distribution by time of day for sideswipe crashes
0.0%
1.0%
2.0%
3.0%
4.0%
5.0%
6.0%
7.0%
8.0%
9.0%
10.0%
0-1
a.m
.
2-3
a.m
.
4-5
a.m
.
6-7
a.m
.
8-9
a.m
.
10-1
1 a
.m.
12-1
p.m
.
2-3
p.m
.
4-5
p.m
.
6-7
p.m
.
8-9
p.m
.
10-1
1 p
.m.
Same direction
fatal
injury
PDO
Percen
tage
of
crash
es
Hour of day
0.0%
2.0%
4.0%
6.0%
8.0%
10.0%
0-1
a.m
.
2-3
a.m
.
4-5
a.m
.
6-7
a.m
.
8-9
a.m
.
10-1
1 a
.m.
12-1
p.m
.
2-3
p.m
.
4-5
p.m
.
6-7
p.m
.
8-9
p.m
.
10-1
1 p
.m.
Opposite direction
fatal
injury
PDO
Percen
tage
of
crash
es
Hour of day

79
Temporal Distribution. The distribution of crashes by day of week was investigated.
The over representation factors of crashes by severity level and day of week is presented in
Figure 41. Overall, there is relatively little variation by day of week although fatal crashes
are over represented for Saturday and Sunday.
Figure 41
Over representation factors by day of week
The over representation of fatal crashes on Saturday and Sunday are due to alcohol
involvement. This was determined by recalculating the ORF after eliminating alcohol-related
crashes and establishing that the over representation for Saturday and Sunday completely
disappeared.
In terms of hour of the day crash distribution, Louisiana was over represented for the late
night and early morning hours from the initial analysis for fatal crashes as well as for early
morning hours for injury crashes. PDO crashes were slightly over represented during midday
hours from 10 a.m. to 4 p.m. The over representation factors are presented in Figure 42.
Note that fatal and injury crashes are high in Louisiana at night, and particularly in the early
hours of the morning.
0%
20%
40%
60%
80%
100%
120%
OR
F
fatal
injury
PDO
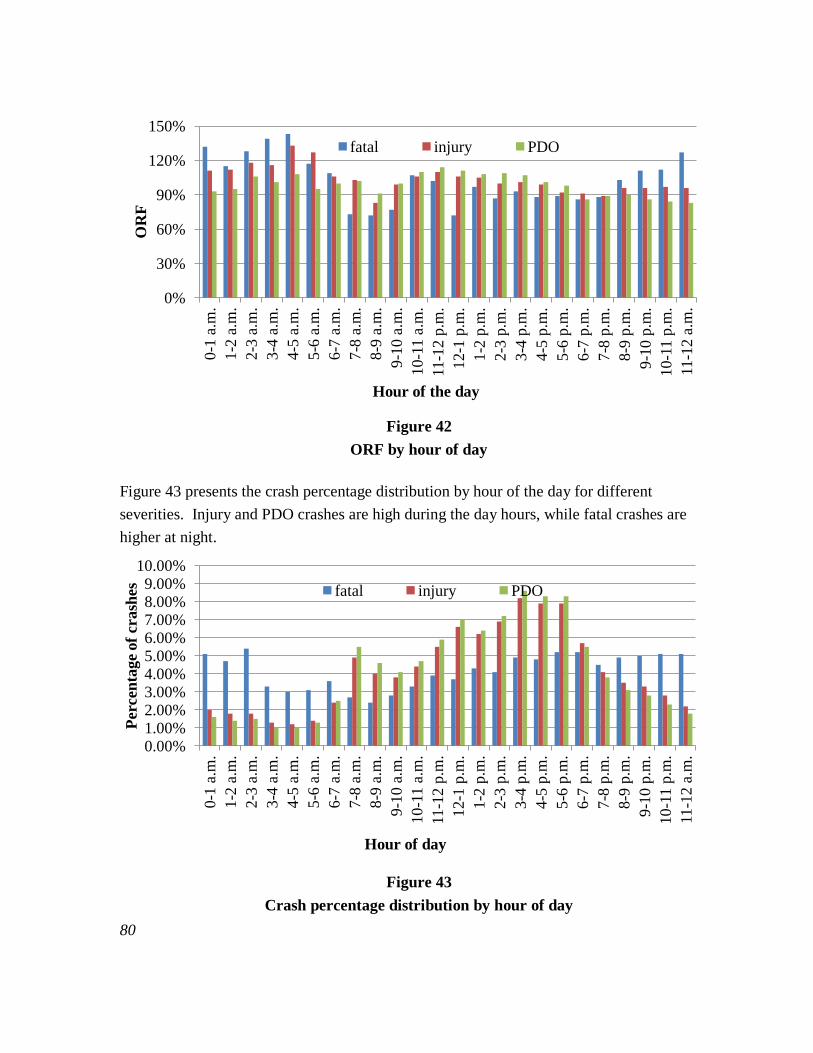
80
Figure 42
ORF by hour of day
Figure 43 presents the crash percentage distribution by hour of the day for different
severities. Injury and PDO crashes are high during the day hours, while fatal crashes are
higher at night.
Figure 43
Crash percentage distribution by hour of day
0%
30%
60%
90%
120%
150%
0-1
a.m
.
1-2
a.m
.
2-3
a.m
.
3-4
a.m
.
4-5
a.m
.
5-6
a.m
.
6-7
a.m
.
7-8
a.m
.
8-9
a.m
.
9-1
0 a
.m.
10-1
1 a
.m.
11-1
2 p
.m.
12-1
p.m
.
1-2
p.m
.
2-3
p.m
.
3-4
p.m
.
4-5
p.m
.
5-6
p.m
.
6-7
p.m
.
7-8
p.m
.
8-9
p.m
.
9-1
0 p
.m.
10-1
1 p
.m.
11-1
2 a
.m.
OR
F
Hour of the day
fatal injury PDO
0.00% 1.00% 2.00% 3.00% 4.00% 5.00% 6.00% 7.00% 8.00% 9.00%
10.00%
0-1
a.m
.
1-2
a.m
.
2-3
a.m
.
3-4
a.m
.
4-5
a.m
.
5-6
a.m
.
6-7
a.m
.
7-8
a.m
.
8-9
a.m
.
9-1
0 a
.m.
10-1
1 a
.m.
11-1
2 p
.m.
12-1
p.m
.
1-2
p.m
.
2-3
p.m
.
3-4
p.m
.
4-5
p.m
.
5-6
p.m
.
6-7
p.m
.
7-8
p.m
.
8-9
p.m
.
9-1
0 p
.m.
10-1
1 p
.m.
11-1
2 a
.m.
Perc
en
tage o
f crash
es
Hour of day
fatal injury PDO

81
Figure 44 presents the alcohol-related crashes by the hour of the day. Unlike all crashes
shown in the previous diagram, the distribution of the three severities by the hour of day
follow the same distribution pattern among alcohol-related crashes. In addition, while most
crashes occur during the day when traffic volumes are higher, alcohol-related crashes are
lower during the daytime and higher at night, peaking in the early hours of the morning.
Figure 44
Alcohol-related crash percentage distribution by hour of day
In order to investigate whether the distribution of alcohol-related crashes by the hour of the
day shown in Figure 44 varies by the day of the week, the number of alcohol-related crashes
that occurred in each hour of the day, each day of the week, in one year in Louisiana was
observed.
Figure 45 presents the results of that analysis. As observed earlier, alcohol-related crashes
generally occur late at night and most frequently in the early hours of the morning. However,
a greater frequency and concentration of crashes occurs in the early hours of the morning
over weekends (Saturday and Sunday). This applies to crashes of all severities although
dominance of the early morning crashes in the distribution is more pronounced for the more
severe type of crashes.
0%
3%
6%
9%
12%
0-1
a.m
.
1-2
a.m
.
2-3
a.m
.
3-4
a.m
.
4-5
a.m
.
5-6
a.m
.
6-7
a.m
.
7-8
a.m
.
8-9
a.m
.
9-1
0 a
.m.
10-1
1 a
.m.
11-1
2 p
.m.
12-1
p.m
.
1-2
p.m
.
2-3
p.m
.
3-4
p.m
.
4-5
p.m
.
5-6
p.m
.
6-7
p.m
.
7-8
p.m
.
8-9
p.m
.
9-1
0 p
.m.
10-1
1 p
.m.
11-1
2 a
.m.
Perc
en
ata
ge o
f crash
es
Hour of day
Alcohol–related
fatal injury PDO

82
Figure 45
Alcohol-related crash percentage distribution by hour of day and day of week
0 10 20 30 40 50 60 70 80 90
0-1
a.m
.
1-2
a.m
.
2-3
a.m
.
3-4
a.m
.
4-5
a.m
.
5-6
a.m
.
6-7
a.m
.
7-8
a.m
. 8-9
a.m
.
9-1
0 a
.m.
10
-11 a
.m.
11
-12 p
.m.
12-1
p.m
.
1-2
p.m
. 2-3
p.m
.
3-4
p.m
.
4-5
p.m
. 5-6
p.m
.
6-7
p.m
.
7-8
p.m
. 8-9
p.m
.
9-1
0 p
.m.
10-1
1 p
.m.
11
-12 a
.m. N
um
ber
of
crash
es
Hour of Day
Fatal
Average
Monday
Tuesday
Wednesday
Thursday
Friday
Saturday
Sunday
0
200
400
600
800
1000
0-1
a.m
.
1-2
a.m
.
2-3
a.m
.
3-4
a.m
.
4-5
a.m
.
5-6
a.m
.
6-7
a.m
.
7-8
a.m
.
8-9
a.m
.
9-1
0 a
.m.
10-1
1 a
.m.
11
-12 p
.m.
12-1
p.m
.
1-2
p.m
.
2-3
p.m
.
3-4
p.m
.
4-5
p.m
.
5-6
p.m
.
6-7
p.m
.
7-8
p.m
.
8-9
p.m
.
9-1
0 p
.m.
10
-11 p
.m.
11-1
2 a
.m.
Nu
mb
er
of
crash
es
Hour of Day
Injury
Average
Monday
Tuesday
Wednesday
Thursday
Friday
Saturday
Sunday
0
200
400
600
800
1000
0-1
a.m
. 1-2
a.m
. 2-3
a.m
. 3-4
a.m
. 4-5
a.m
. 5-6
a.m
. 6-7
a.m
. 7-8
a.m
. 8-9
a.m
. 9-1
0 a
.m.
10-1
1 a
.m.
11
-12 p
.m.
12
-1 p
.m.
1-2
p.m
. 2-3
p.m
. 3-4
p.m
. 4-5
p.m
. 5-6
p.m
. 6-7
p.m
. 7-8
p.m
. 8-9
p.m
. 9-1
0 p
.m.
10-1
1 p
.m.
11
-12 a
.m.
Nu
mb
er
of
Crash
es
Hour of Day
PDO
Average
Monday
Tuesday
Wednesday
Thursday
Friday
Saturday
Sunday

83
Emergency Medical Services. The quality of emergency medical services (EMS)
was measured by the time elapsed between the occurrence of the crash and the arrival of
casualties at the hospital. This time was broken down into the time from the crash to the EMS
notification, the time from EMS notification to arrival at the crash scene, and from EMS
arrival at the crash scene to arrival at the hospital. EMS was also divided into rural and
urban. The EMS time ratios of Louisiana to the peer states and the national average for rural
and urban for 2004 are shown in Figure 46.
Figure 46
Louisiana EMS response time for rural and urban areas
0%
25%
50%
75%
100%
125%
150%
Time of Crash to
EMS Notification
EMS Notification
to EMS Arrival at
Crash Scene
EMS Arrival at
Crash Scene to
Hospital Arrival
Time of Crash to
Hospital Arrival
Tim
e r
ati
os
Rural EMS
LA/Peer Average LA/FL LA/TX LA/USA
0%
25%
50%
75%
100%
125%
150%
Time of Crash to
EMS Notification
EMS Notification
to EMS Arrival at
Crash Scene
EMS Arrival at
Crash Scene to
Hospital Arrival
Time of Crash to
Hospital Arrival
Tim
e r
ati
os
Urban EMS
LA/Peer Average LA/FL LA/TX LA/USA
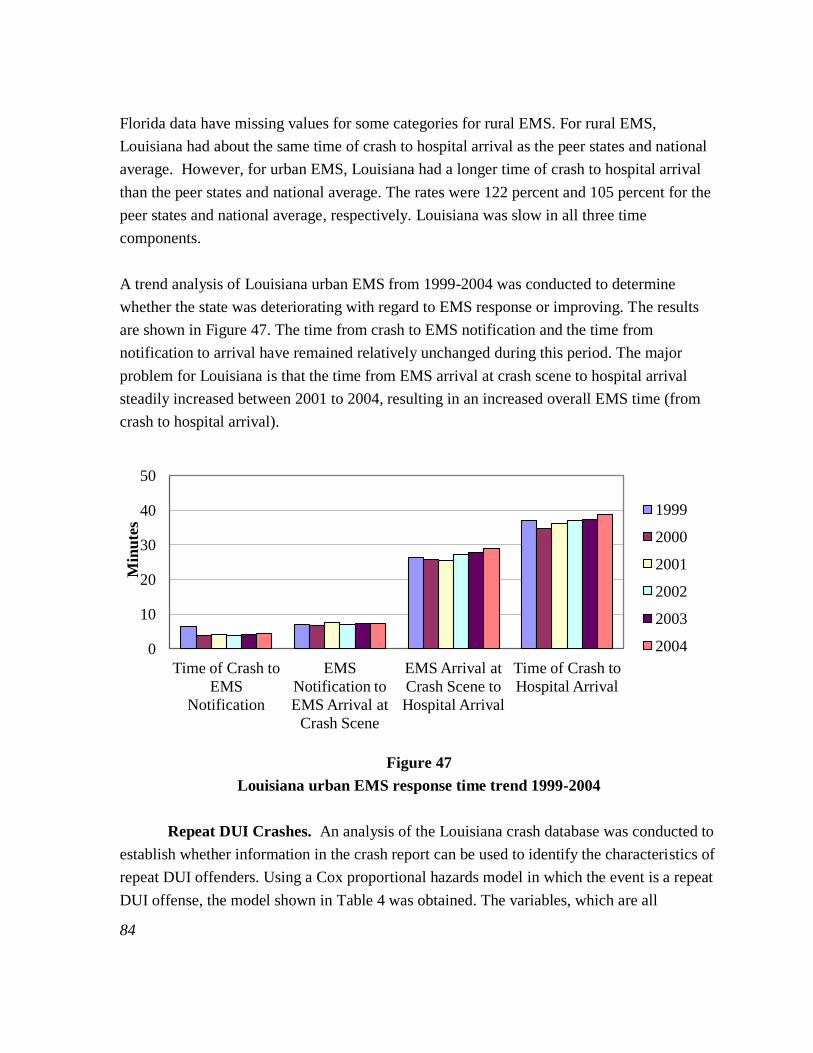
84
Florida data have missing values for some categories for rural EMS. For rural EMS,
Louisiana had about the same time of crash to hospital arrival as the peer states and national
average. However, for urban EMS, Louisiana had a longer time of crash to hospital arrival
than the peer states and national average. The rates were 122 percent and 105 percent for the
peer states and national average, respectively. Louisiana was slow in all three time
components.
A trend analysis of Louisiana urban EMS from 1999-2004 was conducted to determine
whether the state was deteriorating with regard to EMS response or improving. The results
are shown in Figure 47. The time from crash to EMS notification and the time from
notification to arrival have remained relatively unchanged during this period. The major
problem for Louisiana is that the time from EMS arrival at crash scene to hospital arrival
steadily increased between 2001 to 2004, resulting in an increased overall EMS time (from
crash to hospital arrival).
Figure 47
Louisiana urban EMS response time trend 1999-2004
Repeat DUI Crashes. An analysis of the Louisiana crash database was conducted to
establish whether information in the crash report can be used to identify the characteristics of
repeat DUI offenders. Using a Cox proportional hazards model in which the event is a repeat
DUI offense, the model shown in Table 4 was obtained. The variables, which are all
0
10
20
30
40
50
Time of Crash to
EMS
Notification
EMS
Notification to
EMS Arrival at
Crash Scene
EMS Arrival at
Crash Scene to
Hospital Arrival
Time of Crash to
Hospital Arrival
Min
ute
s
1999
2000
2001
2002
2003
2004

85
categorical, are all significant at the one percent level of significance except for category
“other” of variable highway type, which has a p value (probability of falsely rejecting the
hypothesis that the coefficient has a value of zero) of 0.057. The log likelihood ratio test was
508 on 16 degrees of freedom with 48,365 observations, which thoroughly rejects the null
hypothesis that the coefficients of all variables are zero. The value of the exponential of the
coefficient (ecoef.
) in Table 4 gives the hazard of the variable relative to that of the base
variable in the category. For example, in the gender category, the exponential of the
coefficient for males is 2.11, indicating that males are 2.11 times more likely to repeat a DUI
offense than females (the base case in the gender category).
Table 4
Cox model estimation results and sample sizes
feature variables category coef. ecoef. std._error
of coef p
sample
size
driver
gender female (reference)
13023
male 0.747 2.110 0.134 0.000 40594
race non-white (ref.)
16416
white 0.785 2.193 0.137 0.000 37017
gender*race -0.483 0.617 0.145 0.001
age
under 21 (ref.)
6297
21-24 -0.190 0.827 0.064 0.003 9175
25-34 -0.377 0.686 0.060 0.000 14799
35-44 -0.196 0.822 0.058 0.001 14223
45-54 -0.480 0.619 0.076 0.000 6160
55+ -0.742 0.476 0.109 0.000 3056
vehicle vehicle type other (reference)
32813
truck/pick up 0.100 1.105 0.040 0.012 20680
crash
violation no (reference)
6134
yes 0.656 1.927 0.088 0.000 47030
driver
arrested
no (reference)
51038
yes 0.274 1.315 0.075 0.000 2904
hit and run no (reference)
48765
yes 0.512 1.669 0.056 0.000 5178
location land use other (reference)
20860
residential 0.108 1.113 0.041 0.009 31879
roadway
2-way road
no barrier
no (reference)
15480
yes 0.129 1.138 0.046 0.005 35008
highway
type
city road (ref.)
12518
state road 0.189 1.208 0.054 0.000 20479
other 0.105 1.111 0.055 0.057 21208

86
The model in Table 4 shows that a wide variety of factors are associated with repeat DUI
crashes including the characteristics of the drivers (gender, race, and age); the vehicles (light
truck/pick up); crash history (hit-and-run, driver violations, and driver arrest); location
(residential); and road type (highway).
Among the driver characteristics, gender, race, and age are significant in describing the
likelihood of repeat DUI violations. The relative hazard for different combinations of gender
and race are plotted in Figure 48, where a non-white female is used as the reference (with
relative hazard of 1). A non-white male driver is 1.11 times as likely as the non-white female
driver to have a repeat DUI crash, while a white female driver is 1.19 times as likely, and a
white male is 1.85 times as likely to have a repeat DUI crash. Such results are in line with the
findings from Marowitz (1998) who reported that a male had 160 percent higher odds of
recidivating than a female. The association of gender and repeat DUI crashes was also
confirmed by other studies (Yu and Williford, 1995; Marques et al., 2001). In terms of race,
the result was not surprising based on the reported overwhelmingly higher alcohol usage in
whites than in non-whites across all age groups in the US (NIAAA, 2006).
Figure 48
Relative chance of repeat DUI offense by driver gender and race
0.000
0.500
1.000
1.500
2.000
2.500
3.000
non–white
female
non–white
male
white
female
white male
relative
hazard
Gender and race
Rela
ati
ve h
azard

87
Driver age could be treated either as a continuous variable or a categorical variable. Initially,
it was modeled as a continuous variable. The coefficient was significant at the one percent
level of significance with a negative sign, indicating a continuous decreasing hazard as age
increases. However, the results were somewhat different when driver age was modeled as a
categorical variable, as shown below. Driver ages were categorized into six groups: under 21,
from 21 to 24, from 25 to 34, from 35 to 44, from 45 to 54, and 55 and above. Taking the
group of under 21 as a reference, all the other groups were significantly different from the
reference group, with decreasing hazards in general with the exception for age group from 35
to 44. Figure 49 plots the relative hazards of different age groups with the reference group
having a relative hazard of 1.
Figure 49
Relative chance of repeat DUI offense by age group
The negative association between age and repeat DUI crashes has been observed by other
researchers as well (Yu and Williford, 1995; Marowitz et al., 1998; Marques et al., 2001;
Lapham et al., 2000). However, if age was modeled as a continuous variable, as was done by
Marowitz (1998) and by the initial effort in this study, the non-linear relationship shown in
Figure 49 would have been missed. A possible explanation for the repeat DUI offense rate
among 35- to 44-year olds may be due to higher exposure - they typically drink and drive
more often compared to other age groups, as illustrated in roadside surveys and with self-
0.000
0.200
0.400
0.600
0.800
1.000
1.200
und
er 2
1
21
–2
4
25
–3
4
35
–4
4
45
–5
4
55
+
Rela
tive h
azard
Driver age

88
reported data. Moreover, this is partially in agreement with what White and Syrcle (2008)
pointed out, that DUI recidivists are predominantly between the ages of 25 and 45, and is
also supported by the large number of DUI crash drivers for that age group (last column in
Table 4). The combined impact of gender and age makes young males the most vulnerable
group with the highest hazard of repeat DUI crashes. This is consistent with the finding of
Lapham et al. (2000), who studied risk factors for re-arrest of DUI and found that young
males had higher recidivism.
Vehicle Characteristics. The type of vehicle probably reflects, to some degree, the
characteristics of the driver and was found to be a significant predictor of repeat DUI crashes.
Vehicle type was classified into two categories: light trucks and other. The latter was used as
the reference category and 89.4 percent of them were passenger cars. The results indicated a
10.0 percent increase of hazard of repeat DUI crashes for those drivers who drive light trucks
compared to those who drive other vehicles.
Crash Characteristics. Three factors reflecting the characteristics of DUI crashes
were found to be significant in predicting repeat DUI crashes: whether the driver had
violations, whether the driver was arrested, and whether the crash was a hit-and-run. The
model indicated that if a driver had violations in the crash, then he or she had a 92.7 percent
higher hazard of repeat DUI crashes. Violations may be viewed as an indication of excessive
alcohol consumption or dangerous driver behavior. If a driver was arrested at the scene, then
this driver had a 31.5 percent higher hazard of repeat DUI crashes. Being arrested is an
indication of the seriousness of the offense and/or the extent of aggressive unlawful driving.
Having both violations and being arrested increased a driver’s hazard of repeat DUI crashes
by 153.4 percent. The interaction between the two variables was tested and was not found to
be significant.
Whether a driver is involved in a hit-and-run crash has a strong impact on the hazard of
repeat DUI crashes. In the crash database, hit-and-run was a variable associated with the
crash, not with a vehicle or driver, but the alcohol-related driver was most likely to be the hit-
and-run party. When involved in a hit-and-run crash, a DUI driver had a 66.9 percent higher
hazard of repeat DUI crashes. However, the coefficient of hit-and-run failed the
proportionality test, which was a key assumption of the Cox model [equation (3)]. It was not
clear whether the finding was merely an artifact of the data, or whether it may actually have a
more substantial meaning. Further investigation on this matter is needed.
89
Crash Location. One location variable was found to be significant in identifying a
high hazard of repeat DUI crashes. If the crash takes place in a residential area, then the
repeat DUI crash hazard was 11.3 percent higher than in a non-residential area. This was
probably because the offenders are more likely to be going to or from places of residence,
instead of going to or from work or other destinations.
Roadway Characteristics. The highway type and the type of the roadway are two
important factors identified in the model in predicting repeat DUI crashes. Highway type was
classified into three categories. They were city roads, state roads, and other. City roads were
used as the reference category. Only the coefficient for state roads was significant at the one
percent level although category “other” was close to the five percent significance level
threshold. The results indicated that a repeat DUI crash was 20.8 percent more likely to occur
on state roads than on city roads. Ideally, other highway classifications, such as the number
of lanes and rural/urban roads, should be used to better identify the characteristics of the
roads. However, such information was not available from the crash database. An
investigation of the LADOTD roadway database, which includes only state, US, and
interstate highway information, indicated that Louisiana state highways account for 81.4
percent in total mileage among state, US, and interstate highways; rural two-lane highways
were 83.7 percent of all state highways; and 53.2 percent of all alcohol-related crashes on
state roads took place on rural two-lane highways. As a result, it was suspected that the high
hazard on state roads was due to the higher percentage of rural two-lane highways among all
roads. Moreover, if the roadway was two-way without a median, then the hazard of repeat
DUI crashes was 13.8 percent higher than for one-way or two-way with median. This was a
reasonable result because a one-way or a two-way road with median reduces the chance of
crashing with a vehicle from the opposing traffic.
Analysis of Vehicle Characteristics
Several cargo vehicles were over represented in the initial analysis. In terms of cargo body
type, they were van/enclosed box, cargo tank, flatbed, and garbage/refuse. Since the number
of fatal crashes are very small, the over representation are for injury and PDO only, as shown
in Figure 50. Even for injury and PDO crashes, the number involving cargo vehicles is small;
Louisiana crash database has 1,828,325 vehicle crash records and the total numbers of
records for cargo vehicles is only 12,396 for all severities, which is less than 0.6 percent of
all vehicle crashes in the database.
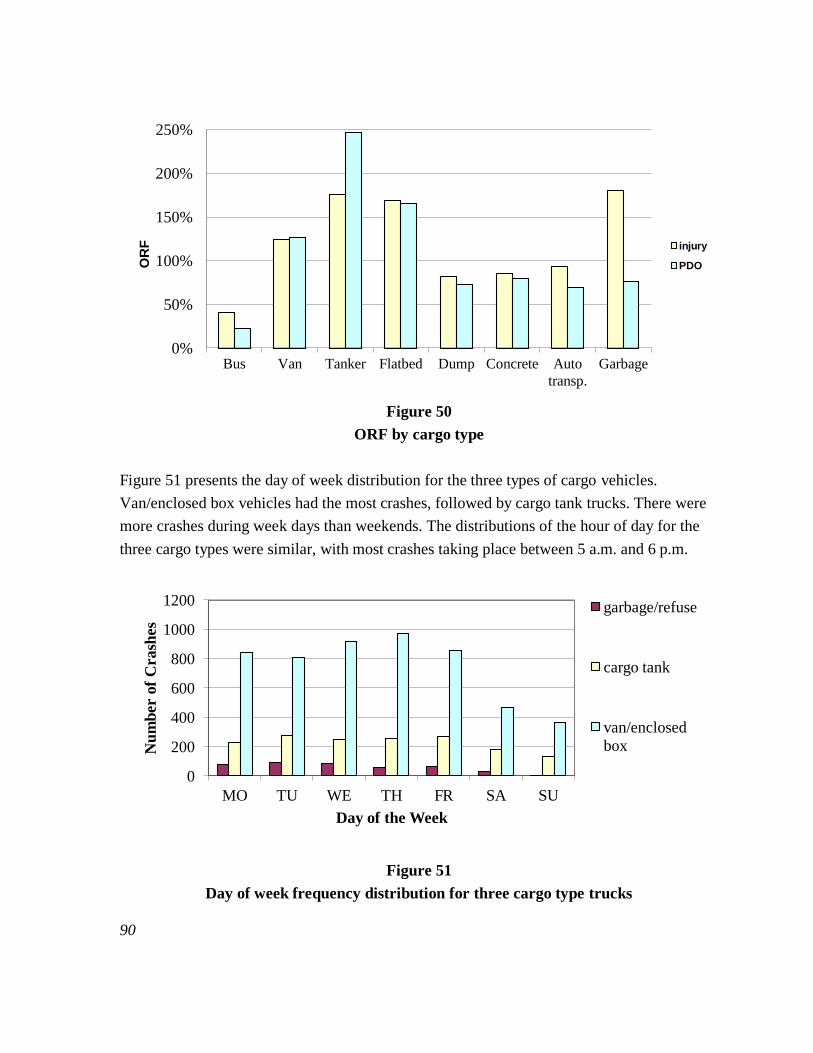
90
Figure 50
ORF by cargo type
Figure 51 presents the day of week distribution for the three types of cargo vehicles.
Van/enclosed box vehicles had the most crashes, followed by cargo tank trucks. There were
more crashes during week days than weekends. The distributions of the hour of day for the
three cargo types were similar, with most crashes taking place between 5 a.m. and 6 p.m.
Figure 51
Day of week frequency distribution for three cargo type trucks
0%
50%
100%
150%
200%
250%
Bus Van Tanker Flatbed Dump Concrete Auto
transp.
Garbage
OR
F
injury
PDO
0
200
400
600
800
1000
1200
MO TU WE TH FR SA SU
Nu
mb
er
of
Crash
es
Day of the Week
garbage/refuse
cargo tank
van/enclosed
box

91
Impact of Legislation on Traffic Safety
Some transportation laws implemented in Louisiana were studied to observe how these laws
have affected the crash rate in Louisiana. Louisiana crash database from 1995 to 2006 were
used in the analysis. During this period, the major traffic laws introduced or amended in
Louisiana were the GDL program in 1998, repealing the mandatory motorcycle helmet law in
1999 and reinstating it in 2004, introducing the open alcohol-container law in 2000, and
lowering the blood alcohol content (BAC) from 0.10 to 0.08 percent in 2003. Results from
the analysis are shown in the following sections. For the detailed analysis of the impact of
legislation on traffic safety in Louisiana, please refer to Mudumba (2008).
An investigation was also conducted into the impact of an increase in the statutory speed
limit of 55 miles per hour on two-lane rural roads in Louisiana was estimated to have on
traffic safety. The study was conducted at the request of a senator in the Louisiana
Legislature. The results are reported following the reporting of the impact of past laws on
state traffic safety in the sections below.
Identifying the Effect of the Graduated Licensing Law on Traffic Safety
The change in motor vehicle crash rates before and after introducing the GDL program in
Louisiana in 1998 is likely due to a number of factors. In order to identify these factors and
account for their influence, an ANOVA was applied. This was accomplished by first testing
all potential factors that could influence the crash rate of 15- and 16-year-old drivers (i.e.,
those affected by the GDL) and identifying those that influenced the crash rate in the
presence of a change in the GDL. Once identified, the factors were included in an ANOVA
with the GDL to detect whether the GDL had a significant impact on crash rates when the
influence of these other factors was removed.
The analysis revealed that driver gender, driver age, occupant age, and occupant gender
influenced crash rates of 15- and 16-year-old drivers before and after introduction of the
GDL. Including them in an ANOVA in which GDL was included as a variable produced the
results shown in Table 5. It shows that GDL had a significant impact in reducing injury,
PDO, and all crashes combined, but there was insufficient evidence to conclude that fatal
crashes were significantly reduced by the GDL program.

92
Table 5
Effectiveness of GDL law on young driver motor vehicle crash rates
Crash
severity
Num. of
observations
F-value P-value Significance
level
Change in crash rates
Fatalities 48 0.40 0.5324 0.05 Insufficient evidence
Injury 96 36.20 <0.0001 0.05 Decreased
PDO 288 19.25 <0.0001 0.05 Decreased
All 288 53.52 <0.0001 0.05 Decreased
Identifying the Effectiveness of Open Container Law
The change in the alcohol-related motor vehicle crash rates due to introduction of the open
container law was also associated with changes in driver gender, driver age, occupant age
and occupant gender. The effect of the open container law in reducing crash rates when the
influence of these factors was removed is shown in Table 6. The open container law was
found to have no significant impact at 5 percent significance level on alcohol-related motor
vehicle crash rates at all severity levels.
Table 6
Effectiveness of open container law on alcohol-related motor vehicle crash rates
Crash
severity
Num. of
observations
F-value P-value Significance
level
Change in crash
rates
Fatalities 57 1.07 0.3057 0.05 Insufficient evidence
Injury 57 0.53 0.4710 0.05 Insufficient evidence
All 342 1.70 0.1929 0.05 Insufficient evidence
Identifying the Effectiveness of the BAC Law
The change in the alcohol-related crash rates due to reduction of the BAC from 0.10 percent
to 0.08 percent was estimated with the influence of driver gender, driver age, occupant age,
and occupant gender removed. Both motor vehicle and motorcycle crashes were studied.
With motorcycle crashes, only driver age was a significant extraneous factor. The results for
motor vehicle crashes are shown in Table 7. The crash rates for injury, PDO, and all crashes
were significantly reduced by introduction of the law, but there was insufficient evidence to
conclude that fatal crashes were similarly reduced.

93
Table 7
Effectiveness of BAC law on alcohol-related motor vehicle crash rates
Crash
severity
Num. of
observations
F-value P-value Significance
level
Change in crash
rates
Fatalities 474 0.52 0.4714 0.05 Insufficient evidence
Injury 474 9.72 0.0019 0.05 Decreased
PDO 1422 5.22 0.0225 0.05 Decreased
All 474 44.71 <0.0001 0.05 Decreased
The impact of reducing BAC from 0.10 to 0.08 percent on motorcycle crash rates is shown in
Table 8. The only significant reduction in crash rates resulting from the BAC reduction
legislation among motor cyclists was a reduction in injury crash rates.
Table 8
Effectiveness of BAC law on alcohol-related motorcycle crash rates
Crash severity Num. of
observations
F-value P-value Significance
level
Change in crash
rates
Fatalities 60 0.59 0.4468 0.05 Insufficient evidence
Injury 60 3.96 0.0500 0.05 Decreased
PDO 60 1.03 0.3143 0.05 Insufficient evidence
All 60 1.48 0.2284 0.05 Insufficient evidence
Investigating Speed Limit Increase on Rural Two-Lane Roads in Louisiana
The Louisiana crash database from 1999-2004 was used in this study. Crashes on two-lane
rural roads were divided into two groups, one where crashes took place on road sections in
which a speed limit increase had been implemented during the 1999-2004 period, and the
other where no speed limit change occurred. The data on sections that underwent a speed
limit increase were subdivided into before and after subgroups. Crashes were distinguished
by severity (fatal, injury, and property damage only) and crash type. Crash rates were
calculated by dividing the average number of crashes on a road section per year by its
Average Annual Daily Traffic (AADT) and length, and expressing the results as crashes per
100 million vehicle miles of travel.

94
To control for extraneous factors that affect crash rates and that could be unequally
represented in the before and after subgroups (e.g., pavement condition, geometric alignment,
lighting, and adjoining land use), a regression tree procedure was employed to establish
subdivisions of the data that were as homogeneous as possible with respect to these factors.
This allowed any difference in crash rates due to an increase in speed limit to be discernible
when comparing between matching subdivisions of data in the before and after data sets,
because the influence of the extraneous factors would be negated by being constant between
matching pairs of subdivisions of data. In addition, it is possible that an underlying change in
crash rates may occur over time due to factors not captured in the data (e.g., improved safety
features in vehicles and better emergency response). To capture any trend, crash data from
sections in which no speed limit change had occurred between 1999 and 2004 were studied
for any distinguishable change in crash rates over time. This was done in each homogeneous
subdivision of the data, and when a significant trend was found, the trend was subtracted
from observed differences between before and after crash rates.
The analysis resulted in 39 homogeneous subdivisions of the data, distinguished by crash
severity, crash type, and other features. After speed limit increase crash rates were adjusted
to limit any natural trends, a single tailed t-test was conducted on each homogeneous group
to test for statistical difference between the before and after speed limit increase groups. Only
6 of the 39 groups demonstrated a significant increase in the crash rate following a speed
limit increase at the 5 percent level of significance. Among injury crashes, the analysis
suggested that run off road, crashing with a stationary object, and rear-end crashes would
increase significantly with an increase in speed limit. PDO crashes, run off road, overturning,
and rear-end crashes were found to increase significantly with an increase in speed limit.
However, among fatal crashes no significant difference in crash rate due to an increase in
speed limit could be found although this may be due to the high variation in fatal crash rates
by road section, rather than an absence of change. It must be noted that the statistical tests
conducted in this analysis were set up to identify any significant increase in crash rates with
an increase in speed limit; if the test failed, it only meant that the increase was not
significant, not that there was no increase at all. Further detail of the study can be found in
Wilmot and Jayadevan (2006).
It was estimated that a speed limit increase on two-lane rural roads in Louisiana could cost
almost $10 million per year in injury and property damage costs. The study recommended
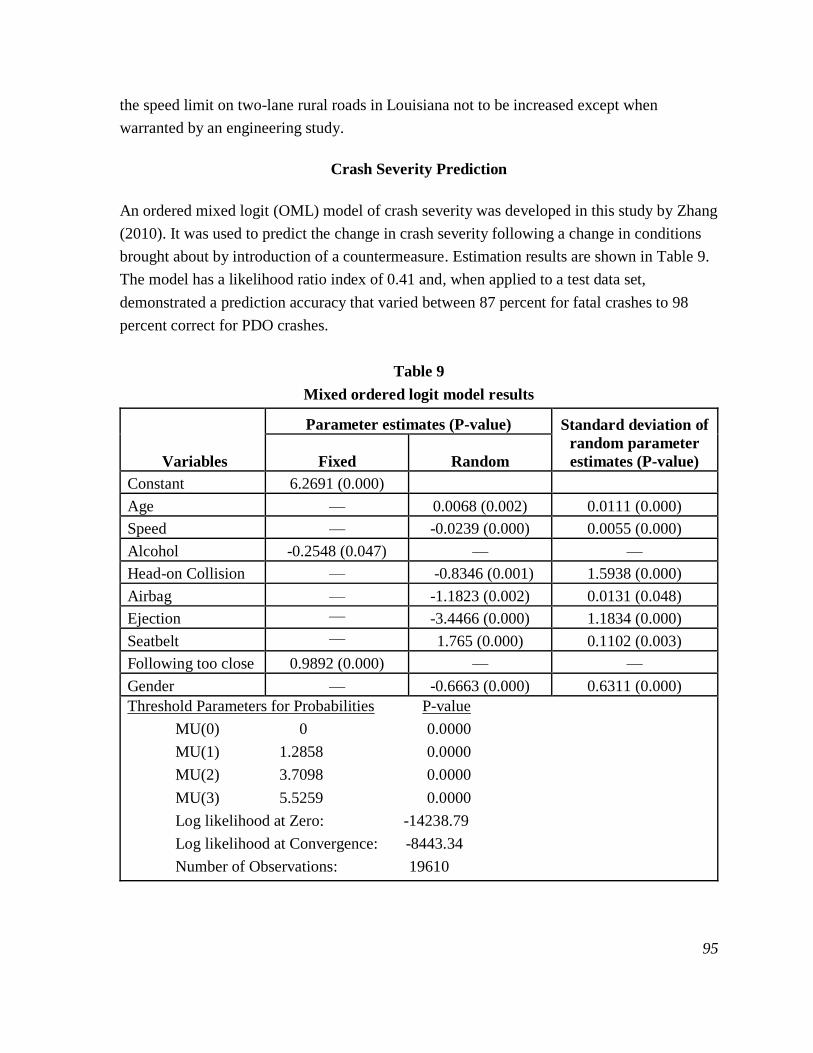
95
the speed limit on two-lane rural roads in Louisiana not to be increased except when
warranted by an engineering study.
Crash Severity Prediction
An ordered mixed logit (OML) model of crash severity was developed in this study by Zhang
(2010). It was used to predict the change in crash severity following a change in conditions
brought about by introduction of a countermeasure. Estimation results are shown in Table 9.
The model has a likelihood ratio index of 0.41 and, when applied to a test data set,
demonstrated a prediction accuracy that varied between 87 percent for fatal crashes to 98
percent correct for PDO crashes.
Table 9
Mixed ordered logit model results
Variables
Parameter estimates (P-value) Standard deviation of
random parameter
estimates (P-value) Fixed Random
Constant 6.2691 (0.000)
Age — 0.0068 (0.002) 0.0111 (0.000)
Speed — -0.0239 (0.000) 0.0055 (0.000)
Alcohol -0.2548 (0.047) — —
Head-on Collision — -0.8346 (0.001) 1.5938 (0.000)
Airbag — -1.1823 (0.002) 0.0131 (0.048)
Ejection — -3.4466 (0.000) 1.1834 (0.000)
Seatbelt — 1.765 (0.000) 0.1102 (0.003)
Following too close 0.9892 (0.000) — —
Gender — -0.6663 (0.000) 0.6311 (0.000)
Threshold Parameters for Probabilities P-value
MU(0) 0 0.0000
MU(1) 1.2858 0.0000
MU(2) 3.7098 0.0000
MU(3) 5.5259 0.0000
Log likelihood at Zero: -14238.79
Log likelihood at Convergence: -8443.34
Number of Observations: 19610
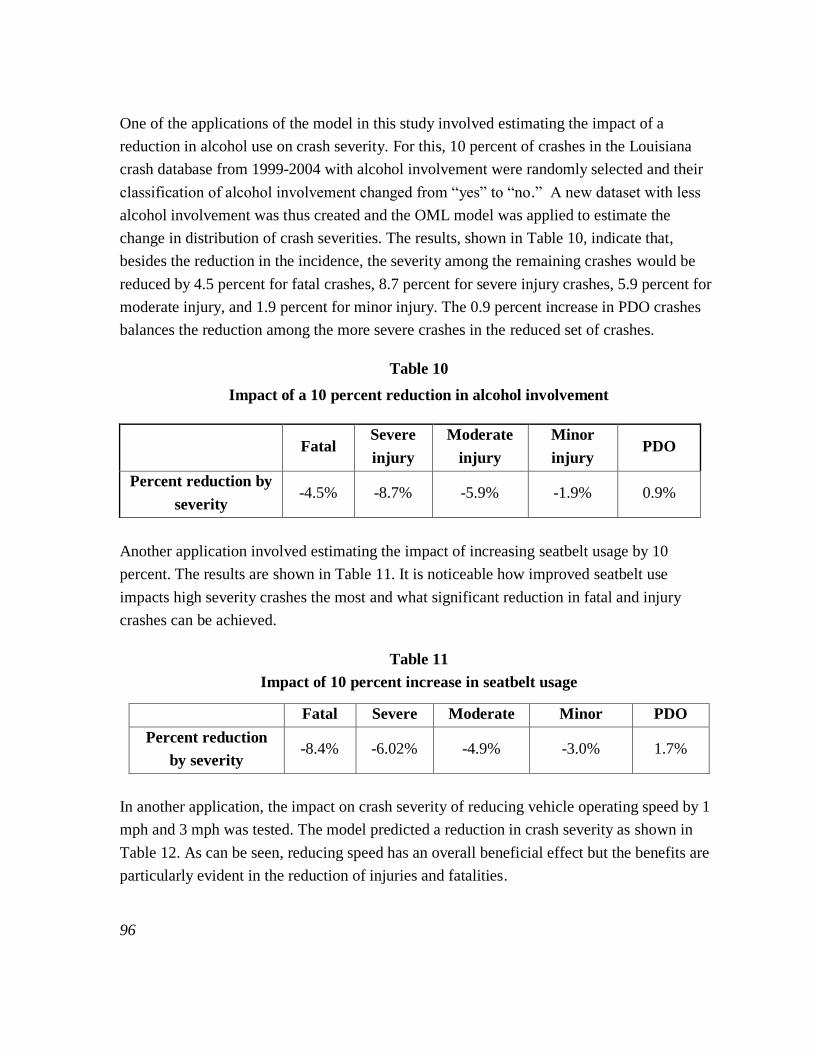
96
One of the applications of the model in this study involved estimating the impact of a
reduction in alcohol use on crash severity. For this, 10 percent of crashes in the Louisiana
crash database from 1999-2004 with alcohol involvement were randomly selected and their
classification of alcohol involvement changed from “yes” to “no.” A new dataset with less
alcohol involvement was thus created and the OML model was applied to estimate the
change in distribution of crash severities. The results, shown in Table 10, indicate that,
besides the reduction in the incidence, the severity among the remaining crashes would be
reduced by 4.5 percent for fatal crashes, 8.7 percent for severe injury crashes, 5.9 percent for
moderate injury, and 1.9 percent for minor injury. The 0.9 percent increase in PDO crashes
balances the reduction among the more severe crashes in the reduced set of crashes.
Table 10
Impact of a 10 percent reduction in alcohol involvement
Another application involved estimating the impact of increasing seatbelt usage by 10
percent. The results are shown in Table 11. It is noticeable how improved seatbelt use
impacts high severity crashes the most and what significant reduction in fatal and injury
crashes can be achieved.
Table 11
Impact of 10 percent increase in seatbelt usage
Fatal Severe Moderate Minor PDO
Percent reduction
by severity -8.4% -6.02% -4.9% -3.0% 1.7%
In another application, the impact on crash severity of reducing vehicle operating speed by 1
mph and 3 mph was tested. The model predicted a reduction in crash severity as shown in
Table 12. As can be seen, reducing speed has an overall beneficial effect but the benefits are
particularly evident in the reduction of injuries and fatalities.
Fatal Severe
injury
Moderate
injury
Minor
injury PDO
Percent reduction by
severity -4.5% -8.7% -5.9% -1.9% 0.9%

97
Table 12
Reduction in crash severity due to speed reduction
Speed reduction Fatal
Severe
Injury
Moderate
Injury
Minor
Injury PDO
1 mph reduction -3.9% -8.3% -9.7% -4.5% 1.9%
3 mph reduction -8.5% -10.6% -11.7% -6.1% 2.4%
Problems Areas for Which Countermeasures Were Developed
Based on the earlier identification of 23 problem areas that are over represented in Louisiana
and the detailed analysis of several of these problem areas in greater detail above, the
following eight areas were identified as prime problem areas in Louisiana:
1. Alcohol
2. Young drivers, especially Teen Drivers
3. Seatbelt use
4. Licensing
5. Speed
6. Traffic control: Stop and Red Signal
7. Rural two-lane highways
8. Motorcycle
Countermeasures for the eight major problem areas were identified and then prioritized as
described in the next section.
Prioritized Countermeasures
A method to prioritize countermeasures was developed in this study. Rather than being based
on cost-effectiveness or cost efficiency as with many other prioritization systems, this
procedure employs the collective impact of cost, performance, and the need in identifying
priority. That is, countermeasures are prioritized based on their cost of implementation, the
extent to which they reduce crashes (performance), and the severity of the problem they
address (need). The analyst is able to alter the relative importance of each of these three
criteria in the prioritization process.

98
Fuzzy inference was employed to develop the prioritization procedure because it
conveniently accommodates the ambiguities in prioritization, and descriptive terms can be
used to describe the input and rule base of the system. Ambiguity exists in the cost and
performance (crash reduction capability) of countermeasures.
Countermeasures are aimed at improving conditions in problem areas. The five problem
areas for which the countermeasures were prioritized in this study are:
Alcohol-related crashes
Young driver crashes
Low seatbelt use
High speed-related crashes
Disregarding stop and red signals
For each problem area, need is measured by the extent that conditions in Louisiana are worse
than those in peer states. This is measured by the difference in the proportion of crashes in a
problem area in Louisiana to that in peer states, multiplied by the number of crashes in that
problem area in Louisiana and the cost of those crashes. Because the cost of crashes vary
considerably by severity, crashes of each severity level are handled separately to produce the
measure of need shown below:
In this formula, index i indicates the severity class and is equal to one for fatality, two for
injury, and three for “property damage only” crashes. The variable is the number of
crashes of severity i due to problem m in Louisiana, and is the total number of crashes
due to problem m in Louisiana. Variable is the number of crashes of severity i due to
problem m in the peer states, is the total number of crashes due to the problem m in the
peer states, and ci indicates the average cost estimated for a typical crash in severity class i.
According to research, one injury crash costs approximately 20 times the average PDO crash,
and one fatal crash costs approximately 20 times the average injury cost (NHTSA, 2002b).
Since only relative measures of need are being established, actual values of ci are not needed
and values of 1 for PDO, 20 for injury, and 400 for fatal crashes were used.

99
The index was applied to each of the five problem areas and then scaled between 0-1. The
resulting relative need calculated for the main problem areas in Louisiana are shown in Table
13.
Table 13
Scaled need for the problematic areas
Problematic Area Scaled Need
Alcohol-related crashes 0.978
Young drivers crashes 0.431
Low seatbelt usage 0.948
High speed-related crashes 0.013
Disregarding stop and red signals 0.408
The “performance” of a countermeasure is considered to be directly related to its crash
reduction factor (CRF) and the value of the crashes it prevents. CRFs are the percentage
reduction in crashes per unit time expected from implementing a countermeasure. CRF
values from NCHRP Report 500 and other sources were used in this study (Agent,
Stamatiadis, and Jones, 1996). The value of a crash is the cost saving effected by preventing
a fatal, injury, or PDO crash, respectively.
The “cost” of a countermeasure is the total resources including money, time and labor needed
to implement a scheme. The estimation of cost was imported from different volumes of
NCHRP report 500. Appendix A lists the cost and crash reduction factors estimated for each
countermeasure.
The estimates of cost, need, and performance were derived using the previously described
procedure for each countermeasure and then submitted to the fuzzy interference system to
estimate the priority of each countermeasure. The procedure was initiated by fuzzifying the
inputs, which means that, based on the dispersion of data, the number of classes into which
the input needed to be classified was determined and inputs were expressed in terms of their
membership in each class. The inputs where classified into “low,” “medium,” and “high”
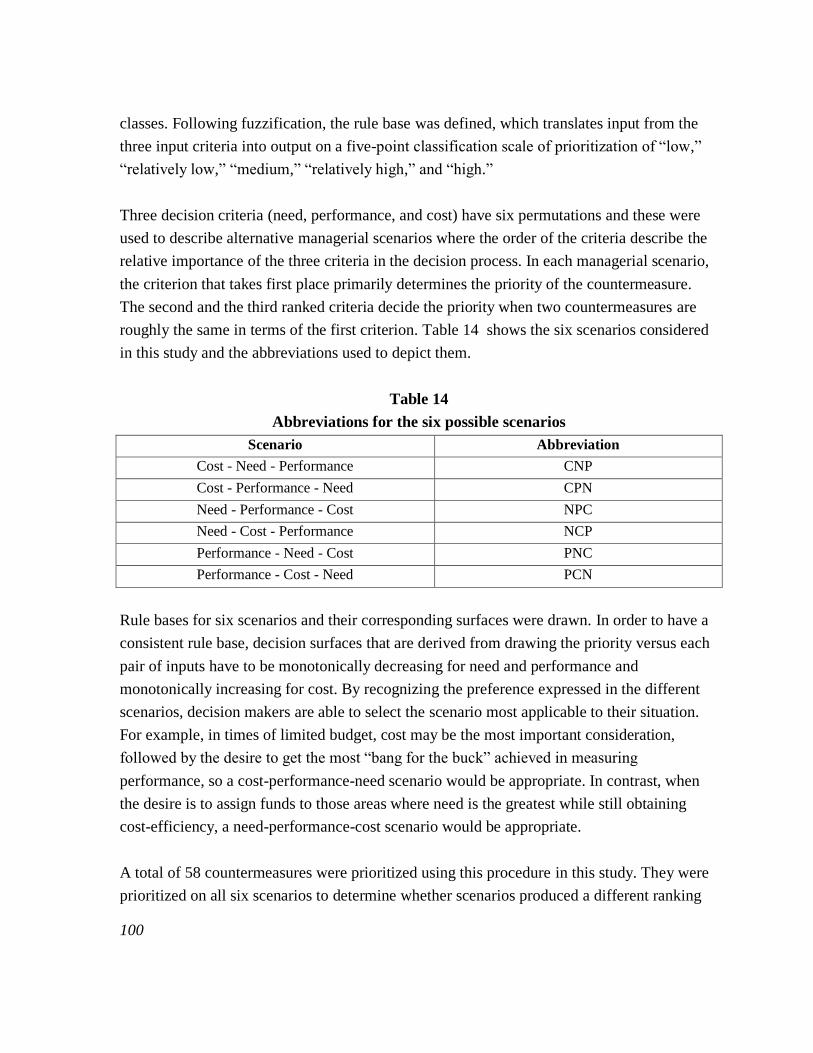
100
classes. Following fuzzification, the rule base was defined, which translates input from the
three input criteria into output on a five-point classification scale of prioritization of “low,”
“relatively low,” “medium,” “relatively high,” and “high.”
Three decision criteria (need, performance, and cost) have six permutations and these were
used to describe alternative managerial scenarios where the order of the criteria describe the
relative importance of the three criteria in the decision process. In each managerial scenario,
the criterion that takes first place primarily determines the priority of the countermeasure.
The second and the third ranked criteria decide the priority when two countermeasures are
roughly the same in terms of the first criterion. Table 14 shows the six scenarios considered
in this study and the abbreviations used to depict them.
Table 14
Abbreviations for the six possible scenarios
Scenario Abbreviation
Cost - Need - Performance CNP
Cost - Performance - Need CPN
Need - Performance - Cost NPC
Need - Cost - Performance NCP
Performance - Need - Cost PNC
Performance - Cost - Need PCN
Rule bases for six scenarios and their corresponding surfaces were drawn. In order to have a
consistent rule base, decision surfaces that are derived from drawing the priority versus each
pair of inputs have to be monotonically decreasing for need and performance and
monotonically increasing for cost. By recognizing the preference expressed in the different
scenarios, decision makers are able to select the scenario most applicable to their situation.
For example, in times of limited budget, cost may be the most important consideration,
followed by the desire to get the most “bang for the buck” achieved in measuring
performance, so a cost-performance-need scenario would be appropriate. In contrast, when
the desire is to assign funds to those areas where need is the greatest while still obtaining
cost-efficiency, a need-performance-cost scenario would be appropriate.
A total of 58 countermeasures were prioritized using this procedure in this study. They were
prioritized on all six scenarios to determine whether scenarios produced a different ranking
101
of the countermeasures and whether some countermeasures would consistently rank high
among all scenarios, thereby identifying a robust set of countermeasures that retain their
priority irrespective of prevailing conditions and managerial preferences. The prioritized list
of countermeasures for all six scenarios is given in Appendix B.
To test the similarity of countermeasures’ ranking among the scenarios, the Spearman Rank
Correlation test was conducted on all pairs of scenarios. Four of the 15 pairs of scenarios
were found to produce similar rankings (PNC and CNP, CNP and NPC, NCP and PCN, and
PNC and NCP), while the remaining 11 pairs produced dissimilar rankings.
Results from the fuzzy inference prioritization system developed in this study were compared
with results from the traditional benefit-cost ratio by comparing the average ranking obtained
from PCN and CPN fuzzy scenarios with the ranking obtained from performance over cost
(P/C). No significant difference was found in the ranking between the two methods (see
Appendix C).
Some priority countermeasures that came out “high” in all six scenarios in Louisiana are
given below. These are suggested for implementation as they retained their priority despite
changes in managerial preferences:
Use alcohol interlocks.
Enforce zero tolerance laws for drivers under age 21.
Increase belt use law penalties: fines and driver’s license points.
Limit license violators from using vehicles.
Provide mid-block pedestrian refuge.
Remove or relocate unnecessary signs.
Supervise driving for beginners at age 16 for six months.
Use protected left turns + left turn phase.


103
CONCLUSIONS
The objective of this study was to identify and quantify the factors leading to the high crash
rate in Louisiana. A secondary objective was to develop countermeasures to address these
factors and prioritize their application.
Among Louisiana’s seven peer states (Alabama, Arkansas, Colorado, Kentucky, Mississippi,
Oklahoma, and Tennessee), Louisiana had the second highest fatal crash rate during the
period of analysis (1999-2004). In comparison to the national average, Louisiana’s fatal,
injury, and PDO crash rates were, respectively, 1.5, 1.7, and 1.1 times higher. Thus, as
suspected, Louisiana’s road safety record is inferior to that of the rest of the nation, and even
within peer states, it is amongst the worst.
To identify the root causes of the road safety condition in Louisiana, safety performance in
Louisiana was measured in individual areas of road safety and then compared to the road
safety record in the same areas in peer states or the nation. Areas in which the proportion of
crashes were higher in Louisiana than elsewhere signified a potential problem area. Other
aspects considered were the proportion of all crashes represented by the area (to establish the
extent of the problem) and the trend in the relationship (to measure whether the problem was
deteriorating or improving). This analysis led to the identification of 23 problem areas. In
keeping with the findings of phase 1 of this study (Wilmot et al., 2005), much of the poor
road safety performance in Louisiana is related to human behavior, so this study concentrated
on human factors. Only limited attention was given to the contribution of roadway and
vehicle characteristics to road safety.
Human behavior most affecting road safety in Louisiana was the physical and mental
condition of drivers (alcohol or drug use, distraction/inattention, fatigue, etc.) and the
behavior they manifest (late night drinking and driving, speeding, low or improper seatbelt
use, invalid driver’s license, repeat offenses, etc.). The behaviors were not uniform across the
population; young drivers (age ≤ 24) are roughly three times as likely to be killed or injured
in road crashes in Louisiana as drivers aged 55-74. Males have twice the fatality and injury
rate of females. The reason for these statistics are varied but at least some of the factors that
have a bearing on these results are inexperience of the driver, peer influence, distraction,
alcohol, and time of day. The GDL law in Louisiana requires that drivers under the age of 17
are not allowed to drive unsupervised between 11 p.m. and 5 a.m., but the crash record of
those that violate the law shows they have a relative crash involvement of at least twice that
104
of 17-21 year-old drivers. Crashes are reduced considerably when drivers under 17 years of
age drive under the supervision of an adult, but increase with the number, similar age, and
gender mix of passengers. GDL schemes that target the number, age, and time of day
passengers can be carried are likely to be effective in improving safety.
Alcohol-related crashes are higher in Louisiana than in peer states or the nation. From FARS
data, the proportion of alcohol-related fatalities among all road fatalities were 22 percent
higher in Louisiana than in peer states and 17 percent higher than in the nation as a whole.
The GES data indicate that the proportion of alcohol-related fatal crashes are 31 percent
higher in Louisiana than in the nation. Most alcohol-related crashes in Louisiana occur in the
early hours of the morning (1-3 a.m.) on weekends, involve young drivers (ages 18-24), and
are two to three times more likely to involve a male driver rather than a female driver.
Alcohol-related fatal crashes are also associated with low seatbelt use (24 percent seatbelt
use in alcohol-related fatal crashes versus 38 percent seatbelt use in all fatal crashes in
Louisiana) and driver error such as elevated incidence of head-on crashes and run off road
single-vehicle crashes. Thus, sobriety checks in the early hours of the morning over
weekends at locations where young males are likely to congregate is likely to result in safer
driving behavior (lower DUI, higher seatbelt use), lower crash incidence due to better driver
judgment, and lower crash severity due to increased seatbelt use and subsequent lower
ejection from the vehicle. Other countermeasures identified as effective in countering driving
under the influence of alcohol are the use of ignition interlock devices for repeat offenders,
and enforcement of the zero tolerance law for offenders under the age of 21.
A detailed investigation was made into repeat offenses of DUIs in Louisiana, and young
white males with a previous crash record were the group with the highest record of repeat
DUIs. Other factors included the type of vehicle (pick-up truck) and two-way roads, but the
incidence of these factors may be due to the fact that young white males are more likely to
use pick-up trucks and drive on two-lane roads. Effective countermeasures are the use of
alcohol interlock devices mentioned above, enforcement of the zero tolerance law, and use of
the driver point system to track and punish repeat offenses, including suspension or
revocation of a driver’s license.
Inadequate driver performance is a widespread problem that includes inattention, distraction,
fatigue, illness, sleep, and loss of consciousness of the driver. Louisiana is over represented
in crashes associated with these conditions with ORFs relative to the nation of 1.38 for all
105
crashes and 2.69 for fatal crashes (see Table 3). Inattention and distraction can vary from
mildly distracting activities such as conversation or listening to music to serious distractions
such as arguing, reading, dialing, or texting. It is important to recognize that it is not the
nature of the activity (i.e., verbal versus manual, hands-on or hand-free) that presents a
problem, but it is the degree of distraction the activity causes. Reducing distractions among
young drivers and increasing perception among older drivers should be the focus of
countermeasures used to address this problem. Some of the countermeasures that could be
used in this regard are restricting the number of young passengers that young drivers may
carry, increasing the period and time of supervised driving for young drivers, and prohibiting
texting and dialing on cell phones while driving,
One of the areas of human behavior in which Louisiana (and the nation) have improved is the
use of seatbelts, although Louisiana does lag behind the rest of the nation (75 percent in
Louisiana versus 81 percent in the nation) and has a higher incidence of drivers using a
shoulder belt only. Alcohol-involved drivers that were in injury and PDO crashes were found
to be three times more likely to not use a seatbelt than all drivers combined, and 76 percent
of alcohol-involved drivers and 62 percent of all drivers involved in fatal crashes did not
wear safety belts. The age group displaying the highest seatbelt non-use is the 15- to 17-year
olds. This is partly due to the fact that approximately 33 percent of 15- to 17-year olds were
recorded as sitting in the second row of seats in the Louisiana crash data, where seatbelt use
is lower than in the first row of seats, but there is a clear trend for younger people in
Louisiana to not use a seatbelt at all. This suggests that education on the benefits of using
seatbelts, enforcement of the law that requires seatbelt use on all rows of seats in a vehicle,
and promotional campaigns aimed at young people could be effective in this area. Other
countermeasures are free checking of the correct installation and use of child restraint
systems by trained professionals at fire stations and vehicle emission testing centers,
commercials on television on the correct use of child restraint systems, and the introduction
of the point system on a driver’s license where the number of points allowed on a drivers
license in a specified period is limited and/or is used by insurance companies to establish car
insurance premiums.
Speeding and disregarding traffic controls are violations that appear twice as often in crash
data in Louisiana as in the rest of the nation. Speeding violations occur on all facility types
but, as would be expected, the severity of crashes associated with speeding are highest on
rural roads where speed is the highest. Thus, concentrating efforts at speed control on rural
roads could have the dual benefit of reducing speed-related crashes and reducing their

106
severity. The most common form of traffic control violation is running a red light (48
percent), followed by disregarding stop signs (36 percent). Drivers most likely involved in
these violations are older drivers (65+), and they are more likely to be killed in crashes of this
nature than younger people. Countermeasures for speeding and violation of traffic control
systems are enforcement of the law and the use of traffic calming measures in residential
neighborhoods. Violators can be identified using automated video cameras but imposing a
penalty remains at the discretion of law enforcement officers. It is in the area of imposing
penalties where law enforcement has the greatest opportunity to get the public on their side
with respect to the widespread use of automated equipment - slight or infrequent violations
can be treated with a warning, while severe and frequent violations can incur greater fines.
Before-and-after statistics must also be provided to document the safety benefit of these
devices.
Driver license violations are up to 64 percent higher in Louisiana than the rest of the nation.
As mentioned earlier, in Louisiana drivers have their license suspended when any vehicle
they own does not have insurance, even though they are legally able to drive another vehicle
that does have insurance. To what extent other states have similar regulations is not known,
so a direct comparison may not be appropriate. However, the high license driver violations in
the state include violations such as having no license, not complying with an endorsed or
restricted license, or having an invalid, revoked, or suspended license. No conclusion can be
drawn on this matter from the analysis conducted in this study and the matter must be
investigated further to get clarity on the magnitude of the problem.
Regarding the impact that road infrastructure has on road safety in Louisiana, crashes on the
shoulder and off the roadway are more than 2.5 times more prevalent than in the rest of the
nation. Fatal off-roadway crashes are 3.4 times more prevalent in Louisiana than in the rest
of the nation and are seven times more prevalent than on-shoulder fatal crashes. Most fatal
off-roadway crashes in Louisiana involved an overturned vehicle or collision with a tree
suggesting more attention be given in road design to recovery areas off the road and the
position of trees within the road reserve. Most fatal off-roadway crashes occur late at night
(10 p.m. to 2.00 a.m.) when drivers are most exposed to alcohol and are also most likely to
be tired and drowsy.
The role of vehicles in explaining the high crash rate in Louisiana revealed that on the
commercial vehicle side, injury and PDO crashes of tanker and flatbed trucks were over

107
represented relative to the rest of the county by between 150 and 250 percent, while fatal
crashes were not over represented. The high injury and PDO crash rate may be due to the
higher use of these types of trucks in a state that has a strong chemical and industrial base,
particularly since other types of trucks in the state (e.g., auto transporter, concrete, and dump)
did not display over representation. Thus, the current statistics suggest that there may be a
problem with respect to some types of vehicles, but a more in-depth study would be required
to determine that. Considering the crashes associated with tanker and flatbed trucks in
Louisiana constitute a very small proportion of total crashes, this is not a high priority issue.
Implementation of countermeasures reduces the number of crashes but also often serves to
reduce the severity of the remaining crashes. For example, based on the analysis conducted in
this study, reducing the proportion of alcohol-related crashes by 10 percent in Louisiana
would change the distribution of crash severity by reducing the proportion of fatal crashes by
4.5 percent, serious injuries by 8.7 percent, moderate injuries by 5.9 percent, and minor
injuries by 1.9 percent from what they were before. The proportion of PDO crashes in new
sets of crashes would increase by 0.9 percent. Because road crashes cost so much, small
reductions like those mentioned above can translate into enormous cost savings to the state.
For example, in Louisiana a 4.5 percent reduction in fatal crashes translates to a saving of
approximately 40 lives each year. If each life is valued at $2.6 million (Judycki, 1994), this
represents more than $100 million saving each year. Severe injuries at $180,000, moderate
injuries at $36,000, and minor injuries at $19,000 (Judycki, 1994), where the number of
injuries in Louisiana of those severities is approximately 1,500, 11,000, and 37,000 per year,
respectively, adds another $60 million per year to the $100 million saved in fatalities.


109
RECOMMENDATIONS
It was concluded from the analysis in this study the major source of the poor road safety
record in Louisiana is due to human behavior, particularly among young male drivers. While
a detailed study of the most appropriate actions necessary to address the factors affecting
road safety in the state is required, the actions below are recommended for implementation as
a start to improving driver and occupant behavior. The recommendations have been derived
by considering the outcome of the analysis in this study as a whole, taking account of the
conclusions drawn, and calling on the author’s assessment of the effectiveness and efficiency
of individual actions as gained from literature and experience:
Introduce a point system on driver’s licenses where points are withdrawn for
violations such as DUI, failure to use a seatbelt, speeding, or repeated
violation of a traffic control device.
Work with insurance companies to use the point history of drivers to set car
insurance premiums, require more frequent driver license renewal for drivers
with low points, and reward drivers with no point withdrawal with a letter
congratulating them on their safe driving and renewing their drivers license
without any testing.
Amend the Graduated Driver Licensing law to include extended supervised
driving, require at least 30 hours of supervised night-time driving, and limit
passenger carrying capacity of persons of similar age (e.g., 15-17).
Conduct sobriety checks that target young male drivers.
Ensure that firemen, state police, and employees of state vehicle inspection
facilities are trained in the correct installation and use of child restraint
systems. Publicize that advice and checking services are available through
these agencies, require state police to check child restraint systems as a
secondary enforcement measure, and include checking the correct installation
of child restraints systems as an item in the annual vehicle inspection.
Publicize the correct use of child restraint systems by age and weight, their
benefits, and the dangers of improper use.
Educate the public, particularly the youth, on the benefits of wearing seatbelts
Investigate the high incidence of drivers operating without a valid driver’s
license in Louisiana.
Investigate the safety impact of texting and dialing while driving.


111
ACRONYMS, ABBREVIATIONS, AND SYMBOLS
AADT Average Annual Daily Traffic
AASHTO American Association of State Highway and Transportation Officials
ALR Administrative License Revocation
ALS Administrative License Suspension
ANOVA Analysis Of Variance
AMF Accident Modification factor
BAC Blood Alcohol Content
B/C Benefit-Cost ratio
CDC Centers for Disease and Control
CDL Commercial Driver License
CNP Cost, Need, Performance
CPN Cost, Performance, Need
CRF Crash Modification Factor
DOTD Department of Transportation and Development
DUI Driving Under Influence
DWI Drinking While Intoxicated
EMS Emergency Medical Services
FARS Fatality Analysis Reporting System
FIS Fuzzy Interference System
GDL Graduated Driver’s Licensing
GES General Estimates System
HSRG Highway Safety Research Group
IID Ignition Interlock Device
ISDS Information Systems and Decision Sciences
LADOTD Louisiana Department of Transportation and Development
LHSC Louisiana Highway Safety Commission
LSU Louisiana State University
MADD Mothers Against Drunk Driving
NCHRP National Cooperative Highway Research Program
NCP Need, Cost, Performance
NHSC National Highway Safety Commission
NHTSA National Highway Traffic Safety Administration
NPC Need, Performance, Cost
OML Ordered Mixed Logit

112
ORF Over Representation Factor
PAS Passive Alcohol Sensor
PBT Preliminary Breath Tester
PCN Performance, Cost, Need
P/C Performance-Cost ratio
PDO Property Damage Only
PNC Performance, Need, Cost
RCIR Relative Crash Involvement Ratio
STEP Selective Traffic Enforcement Programs
VMT Vehicle Miles Travelled

113
BIBLIOGRAPHY
1. Agent, K., Stamatiadis, N., and Jones, S. “Development of Accident Reduction Factors,”
Report KTC-96-13, Kentucky Transportation Center, University of Kentucky, Lexington,
KY, 1996.
2. Akbarzadeh, M. “Prioritization of Safety Countermeasures for the State of Louisiana
Using Fuzzy Inference Systems,” Masters Thesis, Department of Civil and
Environmental Engineering, Louisiana State University, Baton Rouge, LA, 2009.
3. Carr, B. R. “A Statistical Analysis of Rural Ontario Traffic Accidents Using Induced
Exposure Data.” Proceedings of the Symposium on the Use of Statistical Methods in the
Analysis of Road Accidents, OECD, Paris, France, 1970, pp. 86-72.
4. Dewar, R.E., and Olson, P.L. Human Factors in Traffic Safety. Lawyers and Judges
Publishing Company, Inc., Tucson, AZ, 2002.
5. Freund, J.E. Modern Elementary Statistics, 11th
Edition, Pearson Prentice Hall, NJ, 2004.
p. 370.
6. Fu, H. and Wilmot, C.G. “Effect Of Passenger Age And Gender On Young Driver Crash
Risk.” Proceedings of the 87th
Annual Meeting of the Transportation Research Board,
Washington D.C., 2008.
7. Highway Safety Research Group (HSRG). “2002 Louisiana Traffic Records Data
Report,” Department of Information Systems and Decisions Sciences, E.J. Ourso School
of Business, Louisiana State University, Baton Rouge, LA, 2004.
8. Highway Safety Research Group (HSRG). “2004 Louisiana Traffic Records Data
Report,” Department of Information Systems and Decisions Sciences, E.J. Ourso School
of Business,, Louisiana State University, Baton Rouge, LA. 2005.
9. Judycki, D.C., Motor Vehicle Accident Costs. T 7570.2, Federal Highway
Administration, U.S. Department of Transportation, Oct., 1994.
http://safety.fhwa.dot.gov/facts_stat/t75702.cfm Accessed Nov. 2009.

114
10. Lapham, S.C.; Skipper, B.J.; Hunt, W.C.; and Chang. I. “Do Risk Factors for Re-Arrest
Differ for Female and Male Drunk-Driving Offenders? Neurobiological, Behavioral, and
Environmental Relations to Drinking,” Alcoholism: Clinical & Experimental Research 24
(11) 2000, pp. 1647-1655.
11. Lovell, J. and Hauer, E. “Safety Effect of Conversion to All-Way Stop Control.”
Transportation Research Record 1068, Transportation Research Board, Washington,
D.C., 1986, pp. 103-107.
12. Marowitz, L.A. “Predicting Recidivism: Blood Alcohol Concentration And Driver
Record Factors,” Accident Analysis & Prevention, 30 (4), 1998, pp. 545-554.
13. Marques, P.R.; Tippetts, A.S.; Voas, R.B.; and Beirness, D.J. “Predicting Repeat DUI
Offenses With The Alcohol Interlock Recorder,” Accident Analysis & Prevention, 33 (5)
2001, pp. 609-619.
14. McCarthy, M.L.; Sheng, P.; Baker, S.P.; Rebok, G.W.; and Lee, G. “Validity of Police-
Reported Alcohol Involvement in Fatal Motor Carrier Crashes in the United States
Between 1982 and 2005,” Journal of Safety Research 40, Elsevier, 2009, pp. 227-232.
15. Mudumba, V.K. “The Effectiveness of the Introduction and Amendment of Traffic Laws
on Louisiana Road Crashes.” Masters Thesis, Department of Civil and Environmental
Engineering, Louisiana State University, Baton Rouge, LA, 2008.
16. National Highway Traffic Safety Administration, “Transitioning to Multiple Imputation
- A New Method to Impute Missing Blood Alcohol Content (BAC) Values in FARS,”
Technical report DOT 809 403, National Center for Statistics and Analysis, U.S.
Department of Transportation, Washington, D.C., 2002a.
17. National Highway Traffic Safety Administration, “The Economic Impact of Motor
Vehicle Crashes 2000,” Technical report DOT 809 446, National Center for Statistics and
Analysis, U.S. Department of Transportation, Washington, D.C., 2002b.

115
18. National Highway Traffic Safety Administration, “Evaluation of the Repeal of the
Motorcycle Helmet Laws in Kentucky and Louisiana,” Traffic Safety Facts, DOT HS 810
631, U.S. Department of Transportation, Washington, D.C., 2003.
19. National Highway Traffic Safety Administration, “Traffic Safety Facts 2005,” National
Center for Statistics and Analysis, U.S. Department of Transportation, Washington, D.C.,
2005.
http://www-nrd.nhtsa.dot.gov/Pubs/TSF2005.PDF. Accessed Nov. 2009.
20. National Highway Traffic Safety Administration. “Seatbelt Use in 2007 - Use Rates in
the States and Territories,” Traffic Safety Facts, DOT HS 810 949, United States
Department of Transportation, Washington, D.C., 2008.
http://www-nrd.nhtsa.dot.gov/Pubs/810949.PDF. Accessed Nov. 2009.
21. National Institute on Alcohol Abuse and Alcoholism (NIAAA), National Institutes of
Health, Department of Health and Human Services, 2006.
http://alcoholism.about.com/gi/dynamic/offsite.htm?zi=1/XJ&sdn=alcoholism&zu=http
%3A%2F%2Fwww.niaaa.nih.gov%2FResources%2FDatabaseResources%2FQuickFacts
%2FAlcoholConsumption%2Fdkpat3.htm Accessed July, 2006.
22. Pollock, D.A.; Boyle, C.A.; DeStefano, F.; Moyer, L.A.; and Kirk, M.L.,
“Underreporting of Alcohol-Related Mortality on Death Certificates of Young U.S.
Veterans,” JAMA, Vol. 258, No. 3, July, 1987, pp. 345-348.
23. Rubin, D.B.; Schafer, J.L.; and Subramanian, R. “Multiple Imputation of Missing Blood
Alcohol Concentration (BAC) Values in FARS,” Report number DOT HS 808 816, U.S.
Department of Transportation, 1998.
24. Thorpe, J.T., “Calculating Relative Involvement Rates in Accidents Without Determining
Exposure.” Traffic Safety Research Review 11, 1967, pp. 3-8.
25. White, W.L., and Syrcle, J., “Evaluating the “Hard-Core Drinking Driver,”” Addiction
Professional, Texas Behavioral Health Institute, 2008.
http://www.addictionpro.com/ME2/dirmod.asp?sid=&nm=&type=Publishing&mod=Publ
ications%3A%3AArticle&mid=8F3A7027421841978F18BE895F87F791&tier=4&id=A
E4413DA303E434895CC3356E090C7C5. Accessed May 2008.

116
26. Williams, A.F., and Wells, J.K. “Factors Associated with High Blood Alcohol
Concentrations Among Fatally Injured Drivers in the United States.” Alcohol, Drugs and
Driving, 9, 1993. pp. 87-96.
27. Wilmot, C.G., “Trends in Highway Construction Costs in Louisiana,” Technical Report
319, Louisiana Transportation Research Center, Baton Rouge, LA, September 1999.
28. Wilmot, C.G.; Zhang, H.; Fu, H.; Jayadevan, A.; Wolshon, B.; Schneider, H.; and Sun,
X. “Statewide Traffic Safety Study Phase 1: Review of Current Traffic Safety Research,
Practice, Analytical Procedures, and Databases,” Technical Report 399, Louisiana
Transportation Research Center, Baton Rouge, LA, May, 2005.
29. Wilmot, C.G., and Jayadevan, A.S. “Effect of Speed Limit Increase on Crash Rate on
Rural Two-Lane Highways in Louisiana” Technical Assistance Report 07- ITA,
Louisiana Transportation Research Center, Baton Rouge, LA, July 2006.
30. Yu, J. and Williford, W. “Drunk-Driving Recidivism: Predicting Factors from Arrest
Context and Case Disposition,” Journal of Studies on Alcohol, 1995.
31. Zhang, H. “Identifying and Quantifying Factors Affecting Traffic Crash Severity in
Louisiana,” Ph.D. dissertation, Department of Civil and Environmental Engineering,
Louisiana State University, February 2010.
117
APPENDIX A
Table 15
Crash reduction factors and costs of countermeasures
Countermeasure Cost CRF%
Administrative license revocation or suspension (ALR\ALS) High 30
Alcohol interlocks Medium 50
Enforce zero tolerance laws for drivers under age 21 Medium 45
Integrated enforcement Low 22.5
Mass media campaigns High 13
Responsible beverage service Medium 23
Seize vehicles or license plates administratively upon arrest Low 13
Sobriety checkpoints High 20
Combined enforcement; nighttime enforcement Medium 6
Communications and outreach supporting enforcement Medium 5
Increased belt use law penalties: fines and driver’s license points Low 42
Model prediction of crash severity reduction Medium 40
Short-term, high-visibility belt law enforcement Medium 16
State primary enforcement belt use laws Low 8
Identify license regulation violators Medium 10.7
Install ignition interlock device (IID) Medium 65
Limiting license violators from using vehicles Low 32
Night time driving restrictions for drivers aged… Low 45
Restrict young drivers from carrying teenage passengers Low 17
Supervised driving for beginners at age 16 for six months Low 33
Clear sight triangles Low 25
Convert a four-leg intersection to two t intersections High 37
Convert to roundabout High 40
Convert two-way streets to a one-way pair High 30
Delineate turn path Medium 26
Employ emergency vehicle preemption Medium 70
Employ signal coordination Medium 6.7
Grooving existing pavement Medium 14
Implement automated enforcement of approach speeds (cameras) Medium 40
Implement automated enforcement of red-light running (cameras) Medium 42
Improve intersection skew angle High 40
Improve left-turn lane geometry Medium 30
Install back plates Low 20
Install larger (12-in.) signal lenses Low 10
Install left-turn lane Medium 24
Installing queue detection system Low 30 (continued)

118
Installing rumble strips on approaches Low 30
Lengthen Left-Turn Lane Medium 15
Optimize clearance intervals Low 12
Overlaying existing pavement Medium 27
Provide louvers, visors, or special lenses so drivers are able to view
signals only for their approach
Low 15
Provide positive offset for left-turn lanes Medium 10
Provide right-turn lanes Medium 13
Provide targeted conventional enforcement of traffic laws Medium 75
Remove or relocate unnecessary signs Low 50
Remove unwarranted signal Low 50
Restrict or eliminate parking on intersection approaches Low 20
Restrict or eliminate turning maneuvers using channelization or
signing
Low 25
Use protected left turns plus left turn phase Low 35
Use protected left turns without left turn phase Low 15
Use split phases Low 10
Convert to 4-way stop from 2-way stop High 47
Improve super elevation on curves High 11
Install automated enforcement of red light violations Medium 7
Install new guardrail High 44
Install traffic signal Low 20
Lengthen the yellow change interval to ITE guidelines Low 8
Provide mid-block pedestrian refuge Medium 46

119
APPENDIX B
Table 16
Prioritized countermeasures under cost-need-performance scenario
Priority Countermeasure
1 Increased belt use law penalties: fines and driver’s license points
2 Limiting license violators from using vehicles
3 Integrated enforcement
4 Alcohol interlocks
5 Enforce zero tolerance laws for drivers under age 21
6 Night time driving restrictions for drivers aged…
7 Remove or relocate unnecessary signs
8 Remove unwarranted signal
9 Model prediction of crash severity reduction
10 Install back plates indicating a high risk driver
11 Restrict or eliminate parking on intersection approaches
12 Clear sight triangles
13 Restrict or eliminate turning maneuvers using channelization or signing
14 Supervised driving for beginners at age 16 for six months
15 Use protected left turns plus left turn phase
16 Seize vehicles or license plates administratively upon arrest
17 Restrict young drivers from carrying teenage passengers
18 Installing queue detection system
19 Installing rumble strips on approaches
20 Install ignition interlock device (IID)
21 Provide louvers, visors, or special lenses so drivers are able to view
signals only for their approach
22 Use protected left turns without left turn phase
23 Optimize clearance intervals
24 Employ emergency vehicle preemption
25 Provide targeted conventional enforcement of traffic laws
26 Implement automated enforcement of red-light running (cameras)
27 State primary enforcement belt use laws
28 Implement automated enforcement of approach speeds (cameras)
29 Install traffic signal
30 Responsible beverage service
31 Install larger (12-in.) signal lenses
32 Use split phases
33 Short-term, high-visibility belt law enforcement
34 Improve left-turn lane geometry (continued)

120
35 Administrative license revocation or suspension (ALR\ALS)
36 Overlaying existing pavement
37 Delineate turn path
38 Install left-turn lane
39 Convert to roundabout
40 Improve intersection skew angle
41 Convert a four-leg intersection to two t intersections
42 Lengthen left-turn lane
43 Grooving existing pavement
44 Communications and outreach supporting enforcement
45 Combined enforcement; nighttime enforcement
46 Provide right-turn lanes
47 Lengthen the yellow change interval to ITE guidelines
48 Identify license regulation violators
49 Convert two-way streets to a one-way pair
50 Provide positive offset for left-turn lanes
51 Sobriety checkpoints
52 Provide mid-block pedestrian refuge
53 Mass media campaigns
54 Convert to 4-way stop from 2-way stop
55 Install new guardrail
56 Employ signal coordination
57 Install automated enforcement of red light violations
58 Improve super elevation on curves
Table 17
Prioritized countermeasures under cost-performance-need scenario
Priority Countermeasure
1 Increased belt use law penalties: fines and driver’s license points
2 Night time driving restrictions for drivers aged…
3 Remove or relocate unnecessary signs
4 Remove unwarranted signal
5 Use protected left turns + left turn phase
6 Supervised driving for beginners at age 16 for six months
7 Limiting license violators from using vehicles
8 Installing queue detection system
9 Installing rumble strips on approaches
10 Clear sight triangles
(continued)

121
11 Restrict or eliminate turning maneuvers using channelization or signing
12 Integrated enforcement
13 Install back plates
14 Restrict or eliminate parking on intersection approaches
15 Install traffic signal
16 Restrict young drivers from carrying teenage passengers
17 Provide louvers, visors, or special lenses so drivers are able to view signals
only for their approach
18 Use protected left turns w/o left turn phase
19 Alcohol interlocks
20 Enforce zero tolerance laws for drivers under age 21
21 Model prediction of crash severity reduction
22 Seize vehicles or license plates administratively upon arrest
23 Install ignition interlock device (IID)
24 Optimize clearance intervals
25 Responsible beverage service
26 Short-term, high-visibility belt law enforcement
27 Install larger (12-in.) signal lenses
28 Use split phases
29 Employ emergency vehicle preemption
30 Provide targeted conventional enforcement of traffic laws
31 Implement automated enforcement of red-light running (cameras)
32 Install left-turn lane
33 Implement automated enforcement of approach speeds (cameras)
34 Delineate turn path
35 Overlaying existing pavement
36 Improve left-turn lane geometry
37 State primary enforcement belt use laws
38 Lengthen left-turn lane
39 Lengthen the yellow change interval to ITE guidelines
40 Grooving existing pavement
41 Provide right-turn lanes
42 Identify license regulation violators
43 Convert to roundabout
44 Improve intersection skew angle
45 Convert a four-leg intersection to two t intersections
46 Provide positive offset for left-turn lanes
47 Administrative license revocation or suspension (ALR\ALS)
48 Convert two-way streets to a one-way pair
49 Combined enforcement; nighttime enforcement
50 Provide mid-block pedestrian refuge
(continued)

122
51 Employ signal coordination
52 Communications and outreach supporting enforcement
53 Sobriety checkpoints
54 Convert to 4-way stop from 2-way stop
55 Install new guardrail
56 Install automated enforcement of red light violations
57 Mass media campaigns
58 Improve super elevation on curves
Table 18
Prioritized countermeasures under need-performance-cost scenario
Priority Countermeasure
1 Alcohol interlocks
2 Enforce zero tolerance laws for drivers under age 21
3 Increased belt use law penalties: fines and driver’s license points
4 Model prediction of crash severity reduction
5 Install ignition interlock device (IID)
6 Limiting license violators from using vehicles
7 Integrated enforcement
8 Night time driving restrictions for drivers aged…
9 Responsible beverage service
10 Remove or relocate unnecessary signs
11 Remove unwarranted signal
12 Employ emergency vehicle preemption
13 Provide targeted conventional enforcement of traffic laws
14 Clear sight triangles
15 Restrict or eliminate turning maneuvers using channelization or signing
16 Install back plates
17 Restrict or eliminate parking on intersection approaches
18 Supervised driving for beginners at age 16 for six months
19 Use protected left turns + left turn phase
20 Seize vehicles or license plates administratively upon arrest
21 Implement automated enforcement of red-light running (cameras)
22 Restrict young drivers from carrying teenage passengers
23 Installing queue detection system
24 Installing rumble strips on approaches
25 Implement automated enforcement of approach speeds (cameras) (continued)
123
26 Short-term, high-visibility belt law enforcement
27 Provide louvers, visors, or special lenses so drivers are able to view
signals only for their approach
28 Use protected left turns w/o left turn phase
29 Optimize clearance intervals
30 State primary enforcement belt use laws
31 Provide mid-block pedestrian refuge
32 Administrative license revocation or suspension (ALR\ALS)
33 Install traffic signal
34 Improve left-turn lane geometry
35 Install larger (12-in.) signal lenses
36 Use Split Phases
37 Identify license regulation violators
38 Overlaying existing pavement
39 Delineate turn path
40 Install left-turn lane
41 Combined enforcement; nighttime enforcement
42 Sobriety checkpoints
43 Communications and outreach supporting enforcement
44 Lengthen left-turn lane
45 Grooving existing pavement
46 Mass media campaigns
47 Convert to roundabout
48 Improve intersection skew angle
49 Provide right-turn lanes
50 Convert a four-leg intersection to two t intersections
51 Provide positive offset for left-turn lanes
52 Lengthen the yellow change interval to ITE guidelines
53 Convert two-way streets to a one-way pair
54 Employ signal coordination
55 Convert to 4-way stop from 2-way stop
56 Install new guardrail
57 Install automated enforcement of red light violations
58 Improve super elevation on curves

124
Table 19
Prioritized countermeasures under need-cost-performance scenario
Priority Countermeasure
1 Increased belt use law penalties: fines and driver’s license points
2 Limiting license violators from using vehicles
3 Integrated enforcement
4 Night time driving restrictions for drivers aged…
5 Remove or relocate unnecessary signs
6 Remove unwarranted signal
7 Clear sight triangles
8 Restrict or eliminate turning maneuvers using channelization or signing
9 Install back plates
10 Restrict or eliminate parking on intersection approaches
11 Supervised driving for beginners at age 16 for six months
12 Use protected left turns + left turn phase
13 Seize vehicles or license plates administratively upon arrest
14 Restrict young drivers from carrying teenage passengers
15 Installing queue detection system
16 Installing rumble strips on approaches
17 Alcohol interlocks
18 Enforce zero tolerance laws for drivers under age 21
19 Model prediction of crash severity reduction
20 Provide louvers, visors, or special lenses so drivers are able to view signals
only for their approach
21 Use protected left turns w/o left turn phase
22 Install ignition interlock device (IID)
23 Optimize clearance intervals
24 State primary enforcement belt use laws
25 Administrative license revocation or suspension (ALR\ALS)
26 Install traffic signal
27 Responsible beverage service
28 Install larger (12-in.) signal lenses
29 Use split phases
30 Short-term, high-visibility belt law enforcement
31 Sobriety checkpoints
32 Employ emergency vehicle preemption
33 Provide targeted conventional enforcement of traffic laws
34 Implement automated enforcement of red-light running (cameras)
35 Install left-turn lane
36 Implement automated enforcement of approach speeds (cameras)
(continued)

125
37 Convert to roundabout
38 Improve intersection skew angle
39 Delineate turn path
40 Convert a four-leg intersection to two T-intersections
41 Overlaying existing pavement
42 Mass media campaigns
43 Improve left-turn lane geometry
44 Lengthen left-turn lane
45 Grooving existing pavement
46 Communications and outreach supporting enforcement
47 Combined enforcement; nighttime enforcement
48 Provide right-turn lanes
49 Convert two-way streets to a one-way pair
50 Lengthen the yellow change interval to ITE guidelines
51 Identify license regulation violators
52 Provide positive offset for left-turn lanes
53 Provide mid-block pedestrian refuge
54 Install new guardrail
55 Convert to 4-way stop from 2-way stop
56 Employ signal coordination
57 Improve super elevation on curves
58 Install automated enforcement of red light violations
Table 20
Prioritized countermeasures under performance-cost-need scenario
Priority Countermeasure
1 Increased belt use law penalties: fines and driver’s license points
2 Remove or relocate unnecessary signs
3 Remove unwarranted signal
4 Night time driving restrictions for drivers aged…
5 Limiting license violators from using vehicles
6 Use protected left turns plus left turn phase
7 Integrated enforcement
8 Supervised driving for beginners at age 16 for six months
9 Installing queue detection system
10 Installing rumble strips on approaches
11 Clear sight triangles
12 Restrict or eliminate turning maneuvers using channelization or signing
13 Alcohol interlocks (continued)

126
14 Enforce zero tolerance laws for drivers under age 21
15 Install back plates
16 Restrict or eliminate parking on intersection approaches
17 Seize vehicles or license plates administratively upon arrest
18 Restrict young drivers from carrying teenage passengers
19 Model prediction of crash severity reduction
20 Provide louvers, visors, or special lenses so drivers are able to view signals
only for their approach
21 Use protected left turns without left turn phase
22 Install ignition interlock device (IID)
23 Optimize clearance intervals
24 State primary enforcement belt use laws
25 Install traffic signal
26 Administrative license revocation or suspension (ALR\ALS)
27 Responsible beverage service
28 Install larger (12-in.) signal lenses
29 Use split phases
30 Employ emergency vehicle preemption
31 Provide targeted conventional enforcement of traffic laws
32 Implement automated enforcement of red-light running (cameras)
33 Implement automated enforcement of approach speeds (cameras)
34 Provide mid-block pedestrian refuge
35 Short-term, high-visibility belt law enforcement
36 Sobriety checkpoints
37 Install left-turn lane
38 Delineate turn path
39 Overlaying existing pavement
40 Mass media campaigns
41 Convert to roundabout
42 Improve intersection skew angle
43 Improve left-turn lane geometry
44 Convert a four-leg intersection to two T-intersections
45 Lengthen left-turn lane
46 Grooving existing pavement
47 Communications and outreach supporting enforcement
48 Combined enforcement; nighttime enforcement
49 Provide right-turn lanes
50 Identify license regulation violators
51 Lengthen the yellow change interval to ITE guidelines
52 Convert two-way streets to a one-way pair (continued)
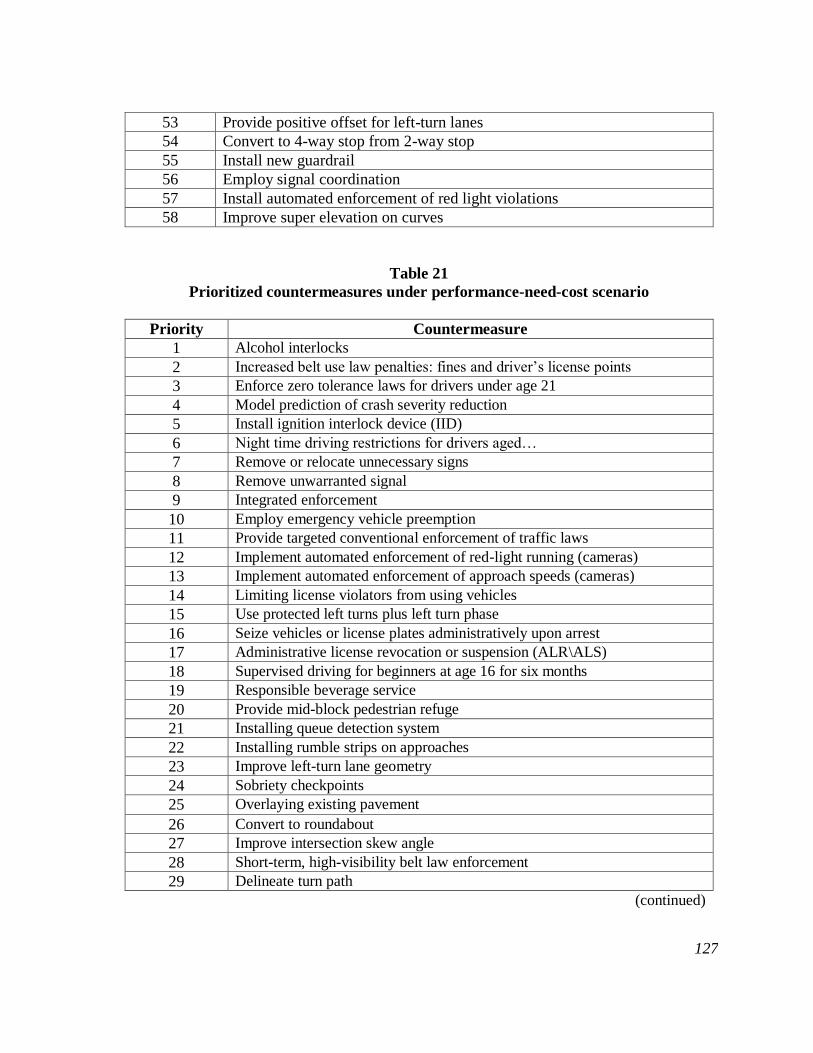
127
53 Provide positive offset for left-turn lanes
54 Convert to 4-way stop from 2-way stop
55 Install new guardrail
56 Employ signal coordination
57 Install automated enforcement of red light violations
58 Improve super elevation on curves
Table 21
Prioritized countermeasures under performance-need-cost scenario
Priority Countermeasure
1 Alcohol interlocks
2 Increased belt use law penalties: fines and driver’s license points
3 Enforce zero tolerance laws for drivers under age 21
4 Model prediction of crash severity reduction
5 Install ignition interlock device (IID)
6 Night time driving restrictions for drivers aged…
7 Remove or relocate unnecessary signs
8 Remove unwarranted signal
9 Integrated enforcement
10 Employ emergency vehicle preemption
11 Provide targeted conventional enforcement of traffic laws
12 Implement automated enforcement of red-light running (cameras)
13 Implement automated enforcement of approach speeds (cameras)
14 Limiting license violators from using vehicles
15 Use protected left turns plus left turn phase
16 Seize vehicles or license plates administratively upon arrest
17 Administrative license revocation or suspension (ALR\ALS)
18 Supervised driving for beginners at age 16 for six months
19 Responsible beverage service
20 Provide mid-block pedestrian refuge
21 Installing queue detection system
22 Installing rumble strips on approaches
23 Improve left-turn lane geometry
24 Sobriety checkpoints
25 Overlaying existing pavement
26 Convert to roundabout
27 Improve intersection skew angle
28 Short-term, high-visibility belt law enforcement
29 Delineate turn path
(continued)

128
30 State primary enforcement belt use laws
31 Clear sight triangles
32 Restrict or eliminate turning maneuvers using channelization or signing
33 Convert to 4-way stop from 2-way stop
34 Install left-turn lane
35 Install new guardrail
36 Convert a four-leg intersection to two T-intersections
37 Install back plates
38 Restrict or eliminate parking on intersection approaches
39 Restrict young drivers from carrying teenage passengers
40 Mass media campaigns
41 Provide louvers, visors, or special lenses so drivers are able to view signals
only for their approach
42 Use protected left turns without left turn phase
43 Lengthen left-turn lane
44 Convert two-way streets to a one-way pair
45 Grooving existing pavement
46 Optimize clearance intervals
47 Provide right-turn lanes
48 Combined enforcement; nighttime enforcement
49 Communications and outreach supporting enforcement
50 Identify license regulation violators
51 Install larger (12-in.) signal lenses
52 Use split phases
53 Provide positive offset for left-turn lanes
54 Install traffic signal
55 Employ signal coordination
56 Improve super elevation on curves
57 Lengthen the yellow change interval to ITE guidelines
58 Install automated enforcement of red light violations

129
Table 22
High priority countermeasures
CNP
Improve super elevation on curves
Install automated enforcement of red light violations
Employ signal coordination
Install new guardrail
Convert to 4 way stop from 2 way stop
Mass media campaigns
Private mid block pedestrian refuge
CPN
Improve super elevation on curves
Mass media campaigns
Install automated enforcement of red light violations
Install new guardrail
Convert to 4-way stop from 2-way stop
Sobriety checkpoints
NPC
Improve super elevation on curves
Install automated enforcement of red light violations
Install new guardrail
Provide mid-block pedestrian refuge
Convert to 4-way stop from 2-way stop
NCP
Install automated enforcement of red light violations
Improve super elevation on curves
Employ signal coordination
Convert to 4-way stop from 2-way stop
Install new guardrail
Provide mid-block pedestrian refuge
PCN
Improve super elevation on curves
Install automated enforcement of red light violations
Employ signal coordination
Install new guardrail
Convert to 4-way stop from 2-way stop PNC
PNC
Install automated enforcement of red light violations
Lengthen the yellow change interval to ITE guidelines
Improve super elevation on curves
Employ signal coordination
Install traffic signal
Provide positive offset for left-turn lanes
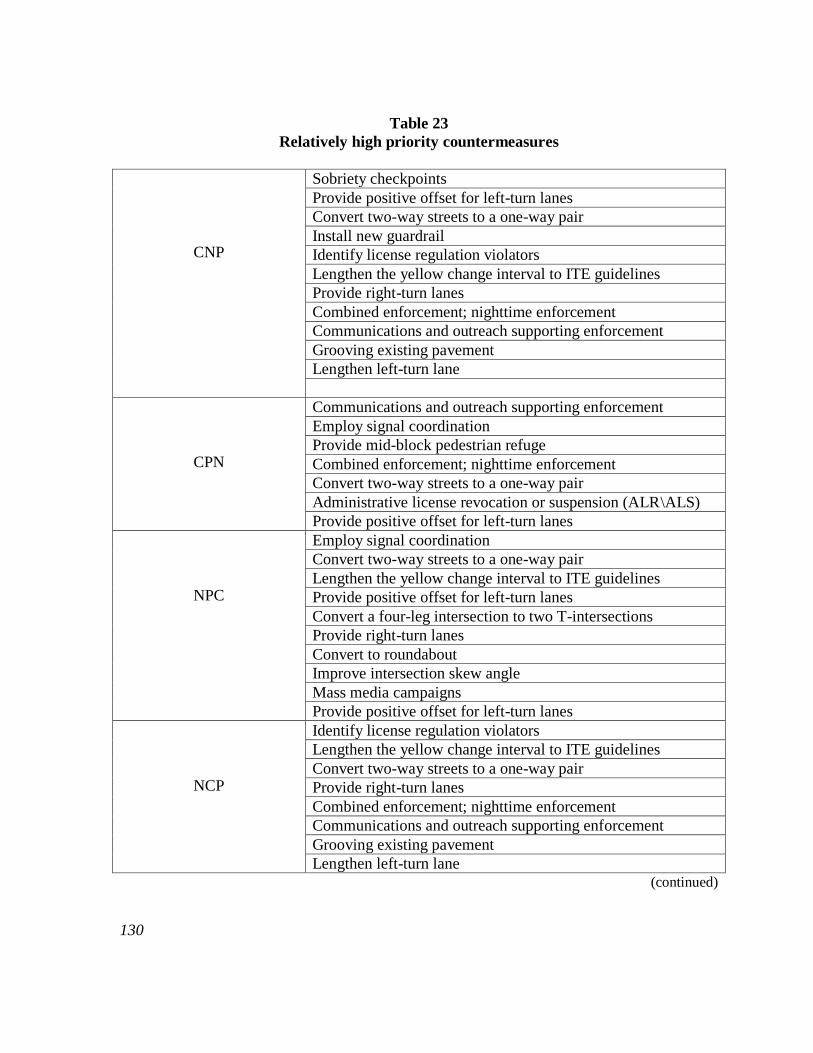
130
Table 23
Relatively high priority countermeasures
CNP
Sobriety checkpoints
Provide positive offset for left-turn lanes
Convert two-way streets to a one-way pair
Install new guardrail
Identify license regulation violators
Lengthen the yellow change interval to ITE guidelines
Provide right-turn lanes
Combined enforcement; nighttime enforcement
Communications and outreach supporting enforcement
Grooving existing pavement
Lengthen left-turn lane
CPN
Communications and outreach supporting enforcement
Employ signal coordination
Provide mid-block pedestrian refuge
Combined enforcement; nighttime enforcement
Convert two-way streets to a one-way pair
Administrative license revocation or suspension (ALR\ALS)
Provide positive offset for left-turn lanes
NPC
Employ signal coordination
Convert two-way streets to a one-way pair
Lengthen the yellow change interval to ITE guidelines
Provide positive offset for left-turn lanes
Convert a four-leg intersection to two T-intersections
Provide right-turn lanes
Convert to roundabout
Improve intersection skew angle
Mass media campaigns
Provide positive offset for left-turn lanes
NCP
Identify license regulation violators
Lengthen the yellow change interval to ITE guidelines
Convert two-way streets to a one-way pair
Provide right-turn lanes
Combined enforcement; nighttime enforcement
Communications and outreach supporting enforcement
Grooving existing pavement
Lengthen left-turn lane (continued)

131
PCN
Provide positive offset for left-turn lanes
Convert two-way streets to a one-way pair
Lengthen the yellow change interval to ITE guidelines
Identify license regulation violators
Provide right-turn lanes
Combined enforcement; nighttime enforcement
Communications and outreach supporting enforcement
Grooving existing pavement
PNC
Install larger (12-in.) signal lenses
Use split phases
Identify license regulation violators
Communications and outreach supporting enforcement
Combined enforcement; nighttime enforcement
Provide right-turn lanes
Optimize clearance intervals
Grooving existing pavement
Convert two-way streets to a one-way pair
Lengthen left-turn lane
Provide louvers, visors, or special lenses so drivers are able to
view signals only for their approach
Use protected left turns without left turn phase
Mass media campaigns
Restrict young drivers from carrying teenage passengers

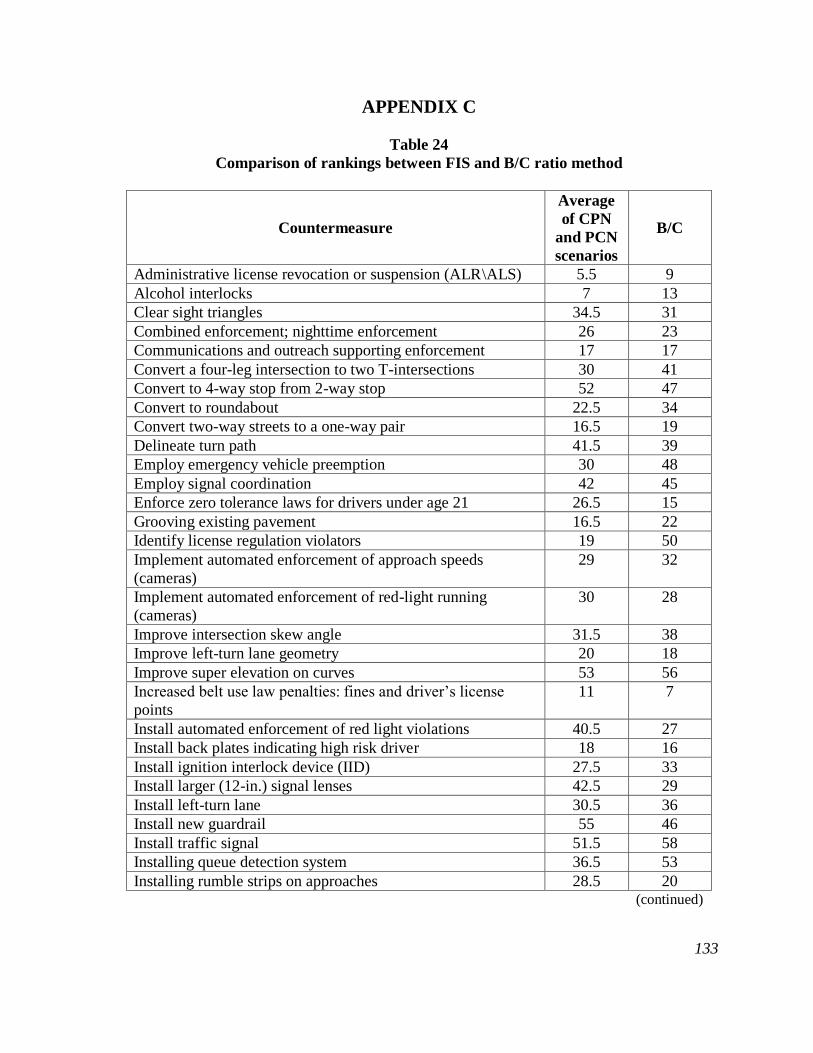
133
APPENDIX C
Table 24
Comparison of rankings between FIS and B/C ratio method
Countermeasure
Average
of CPN
and PCN
scenarios
B/C
Administrative license revocation or suspension (ALR\ALS) 5.5 9
Alcohol interlocks 7 13
Clear sight triangles 34.5 31
Combined enforcement; nighttime enforcement 26 23
Communications and outreach supporting enforcement 17 17
Convert a four-leg intersection to two T-intersections 30 41
Convert to 4-way stop from 2-way stop 52 47
Convert to roundabout 22.5 34
Convert two-way streets to a one-way pair 16.5 19
Delineate turn path 41.5 39
Employ emergency vehicle preemption 30 48
Employ signal coordination 42 45
Enforce zero tolerance laws for drivers under age 21 26.5 15
Grooving existing pavement 16.5 22
Identify license regulation violators 19 50
Implement automated enforcement of approach speeds
(cameras)
29 32
Implement automated enforcement of red-light running
(cameras)
30 28
Improve intersection skew angle 31.5 38
Improve left-turn lane geometry 20 18
Improve super elevation on curves 53 56
Increased belt use law penalties: fines and driver’s license
points
11 7
Install automated enforcement of red light violations 40.5 27
Install back plates indicating high risk driver 18 16
Install ignition interlock device (IID) 27.5 33
Install larger (12-in.) signal lenses 42.5 29
Install left-turn lane 30.5 36
Install new guardrail 55 46
Install traffic signal 51.5 58
Installing queue detection system 36.5 53
Installing rumble strips on approaches 28.5 20 (continued)
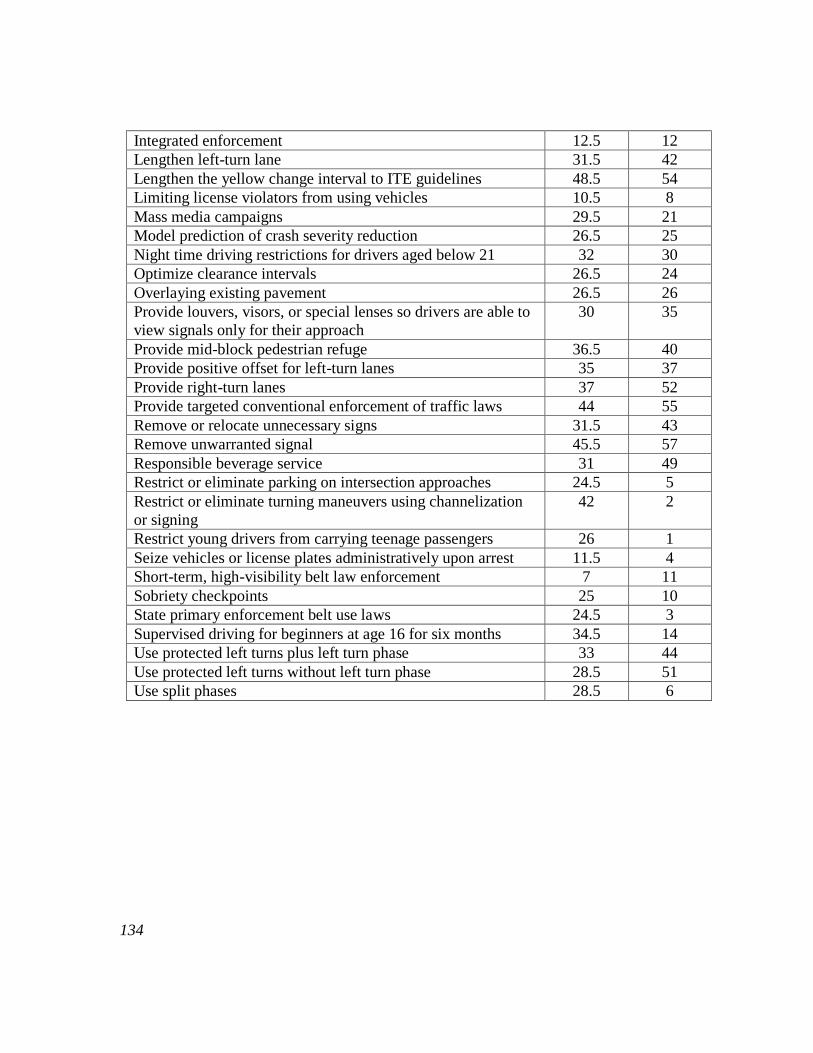
134
Integrated enforcement 12.5 12
Lengthen left-turn lane 31.5 42
Lengthen the yellow change interval to ITE guidelines 48.5 54
Limiting license violators from using vehicles 10.5 8
Mass media campaigns 29.5 21
Model prediction of crash severity reduction 26.5 25
Night time driving restrictions for drivers aged below 21 32 30
Optimize clearance intervals 26.5 24
Overlaying existing pavement 26.5 26
Provide louvers, visors, or special lenses so drivers are able to
view signals only for their approach
30 35
Provide mid-block pedestrian refuge 36.5 40
Provide positive offset for left-turn lanes 35 37
Provide right-turn lanes 37 52
Provide targeted conventional enforcement of traffic laws 44 55
Remove or relocate unnecessary signs 31.5 43
Remove unwarranted signal 45.5 57
Responsible beverage service 31 49
Restrict or eliminate parking on intersection approaches 24.5 5
Restrict or eliminate turning maneuvers using channelization
or signing
42 2
Restrict young drivers from carrying teenage passengers 26 1
Seize vehicles or license plates administratively upon arrest 11.5 4
Short-term, high-visibility belt law enforcement 7 11
Sobriety checkpoints 25 10
State primary enforcement belt use laws 24.5 3
Supervised driving for beginners at age 16 for six months 34.5 14
Use protected left turns plus left turn phase 33 44
Use protected left turns without left turn phase 28.5 51
Use split phases 28.5 6


![Traffic Safety Culture in Australia - QUT ePrintseprints.qut.edu.au/62957/1/CONF_King_TrafficSafetyCultureAustralia.pdf · Traffic Safety Culture in Australia [1] Traffic safety culture](https://img.dokumen.tips/doc/110x75/5cc36a9588c993ab2e8cbf11/traffic-safety-culture-in-australia-qut-traffic-safety-culture-in-australia.jpg)