Embed Size (px)
Citation preview

3-D Numerical simulation of shake-table tests on piles subjected to lateral spreading
M. Cubrinovski1, H. Sugita2, K. Tokimatsu3, M. Sato4, K. Ishihara5, Y. Tsukamoto5, T. Kamata5 1Department of Civil Engineering, University of Canterbury, Christchurch, New Zealand
2Public Works Research Institute, Tsukuba, Japan 3Department of Architecture and Building Engineering, Tokyo Institute of Technology, Tokyo, Japan
4Hyogo Earthquake Engineering Research Center, NIED, Miki, Japan 5Department of Civil Engineering, Tokyo University of Science, Noda, Japan
Abstract A fully-coupled effective stress method of analysis incorporating an elastic-plastic constitutive model specifically designed for modelling sand behaviour was used to numerically simulate shake table experiments on piles in laterally spreading soils. Details of numerical procedures including modelling of stress-strain behaviour of sand, identification of the initial stress state and 3-D dynamic analysis of the soil-pile system are presented in this paper. Primary objective of the simulation was to assess the accuracy of the 3-D analysis in predicting the response of the pile foundation and to identify parameters that are critically important for successful numerical simulation of lateral spreading experiments. The computed response is compared to that measured in the test and key features of the behaviour of the ground, foundation piles and sheet pile wall are discussed.
Keywords—3-D effective stress analysis, lateral spreading, liquefaction, piles, shake-table test
INTRODUCTION The dynamic analysis based on the effective stress
principle has been established as one of the principal tools for analysis of liquefaction problems. Over the past two decades, the application of the effective stress analysis was gradually extended from the 1-D site response analysis to more complex 2-D analyses involving earth structures and soil-structure interaction systems. Recently, attempts have been made to apply this method to a three-dimensional analysis of large-deformation problems. When applying this analysis to large-deformation problems such as those associated with lateral spreading of liquefied soils, questions arise about the accuracy of the prediction as well as about key numerical parameters influencing the analysis. This paper examines some of these issues by using 3-D numerical simulations of medium-scale shake table experiments on piles subjected to spreading of liquefied soils.
This study was conducted within a benchmark research project [1] in relation to the future experiments planned for execution with the recently built large-scale shake table, in Miki, Japan (E-Defense). One of the research objectives in this project was to investigate the behaviour of piles in liquefied soils undergoing lateral spreading, from both experimental and numerical viewpoints. A series of shake-table experiments on piles embedded in liquefiable soils was conducted for this purpose and 3-D numerical simulations were carried out to predict the behaviour of the piles. The principal objective of the numerical simulations was to assess the accuracy and capability of an advanced 3-D effective stress analysis in predicting the response of piles to lateral
spreading. In this paper, results of the 3-D analysis are compared with the behaviour observed in the shake table tests, and key features of the behaviour of the ground and foundation piles are discussed.
DESCRIPTIPON OF THE EXPERIMENT
A series of shake-table experiments on piles subjected
to lateral spreading was conducted at the Public Works Research Institute (PWRI), Tsukuba, Japan [1]. Various factors were varied in these experiments such as the amplitude and direction of shaking, mass of pile cap and number and arrangement of piles. In this paper, the numerical simulation of one of these tests is presented and discussed in detail.
The physical model of the experiment in question is schematically shown in Fig. 1. It consists of a pile foundation embedded in liquefiable sand deposit, located in the vicinity of a sheet pile wall (waterfront). The pile foundation consists of 9 stainless steel piles arranged in a 3x3 group with spacing of 2.5 diameters. Each pile has a length of 1.45 m, diameter of 50.8 mm, thickness of 1.5 mm and flexural rigidity of EI = 12.8 kN-m2. The piles are fixed at the base (GL-165cm) and rigidly connected to a pile cap at the top (GL-20cm). The mass of the pile cap is 21.6kg.
The pile foundation is embedded in 1.8 m thick sand deposit consisting of three-layers: a crust layer of coarse sand above the water table overlying a loose saturated layer of Toyoura sand (Dr=35%) and a dense layer of Toyoura sand (Dr=90%), at the base. The layers have thickness of 40 cm, 90 cm and 50 cm respectively. The

Figure 1: Schematic plot of plan view and side view of the soil-pile model used in the experiment
Figure 2: Horizontal accelerations recorded at the shake table
The submerged sand in front of the sheet pile wall is also loose Toyoura sand with a relative density of about 35 %. A relatively rigid steel plate with a thickness of 6 mm was used for the sheet pile, which was set free to move horizontally and rotate at its base.
The model was built in a rigid container bottom-fixed at the shake table, and was subjected to a horizontal base excitation in the longitudinal direction (perpendicular to the sheet pile wall). The shake table motion consisted of 20 uniform cycles with a frequency of 5 Hz and peak amplitude of about 470 cm/sec2, as shown in Fig. 2. A large number of accelerometers, pore pressure transducers, displacement and pressure gauges were used to measure the response of the piles and ground in the test. Pairs of strain gauges were installed at 12 elevations along the length of the piles for measuring bending strains. Details of the experimental setup, layout of the instrumentation and results of the tests are given in [1].
METHOD OF ANALYSIS AND NUMERICAL PROCEDURES
The shake table experiment was numerically
simulated using a 3-D dynamic analysis based on the effective stress principle [2] incorporating an elastic-plastic constitutive model specifically designed for modelling sand behaviour [3, 4]. Key features of the analysis including material modelling and employed numerical procedures are described in this section.
Material Modelling The employed elastic-plastic model for sand (Stress-
Density Model) is based on the state concept, and therefore it incorporates the combined effects of density and confining stress on sand behaviour. Consequently, the model has a capacity to simulate deformational behaviour of sand at all densities and stress states by using a single set of material parameters. The particular parameters of the constitutive model for Toyoura sand have been established in a previous comprehensive study [3, 4] using results of a series of torsional tests including monotonic drained p'-constant tests, monotonic undrained tests and cyclic undrained (liquefaction) tests. These model parameters are summarized in Table 1.
Table 1: Model parameters for Toyoura sand
Type Parameter Value
Shear constant A 250
Poisson's ratio ν 0.15
Elas
tic
Exponent n 0.60 St
ate Quasi steady state line: (e, p')-values
Peak stress ratio coef. a1 , b1 0.592, Max. shear modulus coef. a2 , b2 291 , 55 Min. shear modulus coef. a3 , b3 98 , 13
Stre
ss-s
train
cu
rve
Degradation constant f 4
Dilatancy coef. (small strains) µο 0.15 Critical state stress ratio M 0.607
Dila
tanc
y
Dilatancy strain Sc 0.0055 Scaled-down 1-g shake table models are characterized
by relatively low stresses in the ground model. Thus, for the model shown in Fig. 1, the effective overburden stress in the loose sand was mostly in the range between 6 kPa and 14 kPa. Since low confining stresses are known to affect both the stress-strain behaviour and liquefaction resistance of sands, in the element test simulations and determination of model parameters particular attention was given to the modelling of sand behaviour at low confining stresses. Thus, using the model parameters listed in Table 1 and different values for the initial void ratio of e = 0.839, 0.802 and 0.653 which correspond to a relative density of Dr = 40 %, 50 % and 90 % respectively, element test simulations were conducted for these three relative densities at low initial confining stresses of 10-20 kPa. Figure 3 shows the liquefaction resistance curves simulated with the model. The experimental data that served as a target in the element test simulations included both results from tests on samples under confining stress of 98 kPa [5] and data from tests with very low confining stress of 9.8 kPa [6]. The latter test data were considered representative of the liquefaction resistance of the ground model prepared in the shake table test and were therefore the principal target in the simulations.
-500
0
500
1 2 3 4 5 6 7Hor
izon
tal a
ccel
erat
ion
(gal
)
Time (sec)
Case 14-1
(cm
/s2 )
FOOTING
PILE
SHEETPILE
a) Model: H14-1, H15-3 & H16-2
Loose T.S. (35%) Loose
Toyoura sand (Dr = 35%)
Coarse sand
Dense T.S. (90%) 50
90cm
40
150 75 175
PILE CAP

Figure 3: Model simulations of liquefaction resistance of
Toyoura sand at different relative densities and low confining stress
Stress-strain parameters of the coarse sand (surface
layer in the ground model) were evaluated using results from a series of drained triaxial compression tests at confining stresses of 20, 40, 60 and 80 kPa [1]. The stress-strain curve observed in the test with the smallest confining stress of 20 kPa was adopted as a target curve in the evaluation of model parameters. As shown in Fig. 4, the adopted model parameters for the coarse sand provide reasonably good simulation of the stress-strain curve observed in the laboratory test.
It was anticipated that the behaviour of the foundation piles and the sheet pile wall will remain in the range of elastic deformations, and therefore, the piles, pile-cap and sheet-pile wall were modelled as linear elastic materials.
Initial Stress Analysis
Considering the preparation of the ground model and employed experimental procedures prior to the application of shaking, two phases in the development of the initial stress state in the soil can be distinguished. In the first phase during the soil deposition and preparation of the ground model, the sheet pile wall was supported with horizontal struts, as shown schematically in Fig. 5a. Hence, the soil deposit underwent consolidation under constrained lateral deformation imposed by the rigid container and the sheet pile wall. Before the application of shaking, the horizontal supports were removed (Fig. 5b) thus subjecting the sheet pile wall to an unbalanced earth pressure from the backfill soil and submerged sand causing lateral movement towards the water and significant change of the stresses in the soil mass. An initial stress analysis was conducted to simulate the lateral loads as above and evaluate the resulting stresses in the soil.
Details about the horizontal support as above were not available to the predictors at the time of execution of the initial stress analysis. Instead, it was assumed in the analysis that the sheet pile was fixed in the horizontal direction during the model preparation and that the sand
Figure 4: Model simulation of stress-strain curve of coarse sand observed in drained triaxial test at confining stress of 20 kPa
deposit practically underwent Ko-consolidation. Based on this reasoning, it was assumed that the vertical and horizontal stresses in the soil attained after consolidation might be approximated as σ'v = γ h and σ'h = Ko σ'v where Ko = 0.5 for the loose sand and Ko = 0.4 for the crust soil and dense base layer were adopted, as illustrated schematically in Fig. 6a. In the initial stress analysis, the post-consolidation stress estimated as above was used as an initial stress state, and then, a distributed lateral load simulating the resultant earth pressure induced upon the removal of the horizontal supports was applied to the sheet pile wall, as depicted in Fig. 6b. Here, the lateral load was defined by the difference between the lateral soil Figure 5: Schematic illustration of the experimental procedures:
(a) horizontally constrained sheet pile wall during soil deposition; (b) unconstrained sheet pile wall prior to shaking
0
0.1
0.2
0.3
0.4
0.5
0.6
0.7
1 10 100Number of cycles, N
c
Cyc
lic s
tress
ratio
, (
) γ = 7.5 %
τ/σ c
' Model simulation
Dense(D
r = 90 %)
(low confining stress:10-20 kPa)
γ=3%
50 %
Loose(D
r = 40 %)
(a)
0
0.2
0.4
0.6
0.8
1
0 0.5 1 1.5 2 2.5 3
20 kPaModelSh
ear s
tress
ratio
, q
/p
Shear strain, (%)ε1−ε
3
(b)
Loose sand
Dense sand
Coarse sand
Loose sand
Strut Wale
Sheet pile
Loose sand
Dense sand
Coarse sand
Loose sand
Sheet pile
(a)
(b)
C

Figure 6: Schematic illustration of initial stress analysis:
(a) assumed Ko values for the post-consolidation stress; (b) applied lateral load simulating the resultant soil pressure induced upon the removal of struts
pressures in the backfill soil and submerged sand throughout the depth of the deposit. In order to simplify the initial stress analysis and avoid problems associated with stress concentration and boundary effects, the presence of the pile foundation was ignored and the calculation was made using 2-D plane strain analysis.
Results of the initial stress analysis are summarized in Fig. 7a and Fig. 7b where computed horizontal displacements and normal stress ratios are depicted respectively. The displacement pattern computed in the analysis was found to be very similar to that observed in the test in which the sheet pile moved laterally and slightly tilted towards the water as a result of the induced lateral soil pressure. In accordance with the deformation mode involving horizontal expansion of the backfills and contraction of the submerged sand, settlement occurred in the backfill soil whereas heaving occurred in the submerged sand in front of the wall. In the analysis, a permanent horizontal displacement of 1.42 cm was computed at the top of the sheet pile (Fig. 7a) whereas the corresponding displacement observed in the experiment was about 3 cm. The maximum settlement computed in the analysis was approximately 1.1 cm.
The lateral movement of the sheet pile wall and surrounding soil resulted in relaxation of the lateral stresses in the backfill soil towards the active state with values of K = σ'h /σ'v mostly around 0.3 in the vicinity of the sheet pile wall and their gradual increase to about 0.5 with the lateral distance from the sheet pile wall. On the other hand, the stress ratio values in the submerged sand approached the passive state in the soil adjacent to the wall showing gradual decrease in K from about 3 to 1 with the distance from the sheet pile wall. The horizontal
Figure 7: Results of initial stress analysis: (a) computed horizontal displacements; (b) computed normal stress ratios (σ'h /σ'v)
shear stress ratios were mostly in the range of τhv / σ'v = 0.02–0.20. By and large, significant shear stresses were generated in the soil deposit upon removing the horizontal supports of the sheet pile wall. The stresses computed in the analysis as above were employed as initial stresses in the subsequent dynamic analysis.
3-D Dynamic Analysis
A fully coupled 3-D finite-element analysis based on the effective stress principle was carried out to simulate the response of the soil-pile model during the shaking. The employed numerical model consisted of eight-node solid elements and beam elements representing the soil and the piles respectively. Solid elements were also used for modelling the pile cap and sheet pile wall. As shown in Fig. 8, half of the model was adopted in the analysis by cutting the physical model along its axis of symmetry in the longitudinal direction. Therefore, only 6 piles were included in the numerical model.
The lateral boundaries of the model were fixed in the horizontal directions thus representing the constraints imposed by the rigid container in the test. Horizontal displacements in the y-direction were also constrained along the symmetry boundary of the model. Along all soil-sheet pile and soil-pile interfaces, a condition was specified that yields the soil and the pile to share identical displacements in the horizontal direction, but that allows different vertical displacements between the soil and the
K = 0.4o
K = 0.4o
K = 0.5o
K = 0.5o
5.7 kPa
Joint elements
Lateralload
(a)
(b)
(a)
(b)
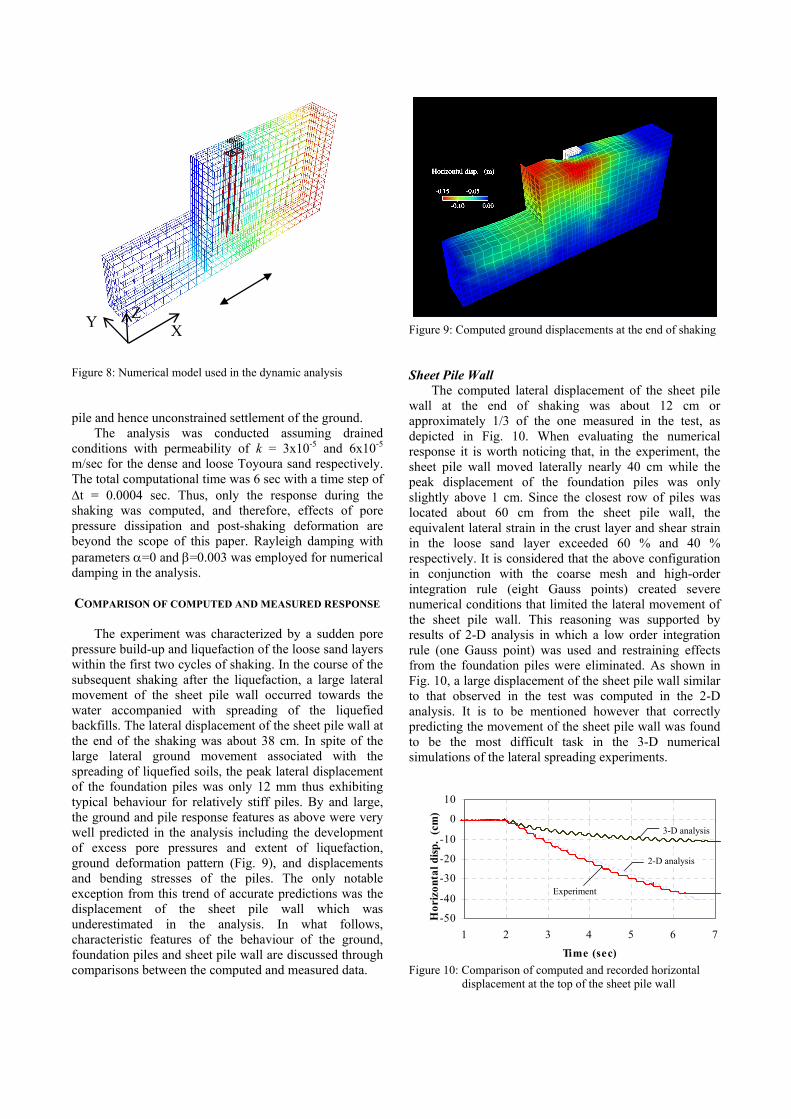
Figure 8: Numerical model used in the dynamic analysis pile and hence unconstrained settlement of the ground.
The analysis was conducted assuming drained conditions with permeability of k = 3x10⁻⁵ and 6x10⁻⁵ m/sec for the dense and loose Toyoura sand respectively. The total computational time was 6 sec with a time step of ∆t = 0.0004 sec. Thus, only the response during the shaking was computed, and therefore, effects of pore pressure dissipation and post-shaking deformation are beyond the scope of this paper. Rayleigh damping with parameters α=0 and β=0.003 was employed for numerical damping in the analysis.
COMPARISON OF COMPUTED AND MEASURED RESPONSE
The experiment was characterized by a sudden pore
pressure build-up and liquefaction of the loose sand layers within the first two cycles of shaking. In the course of the subsequent shaking after the liquefaction, a large lateral movement of the sheet pile wall occurred towards the water accompanied with spreading of the liquefied backfills. The lateral displacement of the sheet pile wall at the end of the shaking was about 38 cm. In spite of the large lateral ground movement associated with the spreading of liquefied soils, the peak lateral displacement of the foundation piles was only 12 mm thus exhibiting typical behaviour for relatively stiff piles. By and large, the ground and pile response features as above were very well predicted in the analysis including the development of excess pore pressures and extent of liquefaction, ground deformation pattern (Fig. 9), and displacements and bending stresses of the piles. The only notable exception from this trend of accurate predictions was the displacement of the sheet pile wall which was underestimated in the analysis. In what follows, characteristic features of the behaviour of the ground, foundation piles and sheet pile wall are discussed through comparisons between the computed and measured data.
Figure 9: Computed ground displacements at the end of shaking
Sheet Pile Wall The computed lateral displacement of the sheet pile
wall at the end of shaking was about 12 cm or approximately 1/3 of the one measured in the test, as depicted in Fig. 10. When evaluating the numerical response it is worth noticing that, in the experiment, the sheet pile wall moved laterally nearly 40 cm while the peak displacement of the foundation piles was only slightly above 1 cm. Since the closest row of piles was located about 60 cm from the sheet pile wall, the equivalent lateral strain in the crust layer and shear strain in the loose sand layer exceeded 60 % and 40 % respectively. It is considered that the above configuration in conjunction with the coarse mesh and high-order integration rule (eight Gauss points) created severe numerical conditions that limited the lateral movement of the sheet pile wall. This reasoning was supported by results of 2-D analysis in which a low order integration rule (one Gauss point) was used and restraining effects from the foundation piles were eliminated. As shown in Fig. 10, a large displacement of the sheet pile wall similar to that observed in the test was computed in the 2-D analysis. It is to be mentioned however that correctly predicting the movement of the sheet pile wall was found to be the most difficult task in the 3-D numerical simulations of the lateral spreading experiments.
Figure 10: Comparison of computed and recorded horizontal
displacement at the top of the sheet pile wall
X
Z Y
-50
-40
-30
-20
-10
0
10
1 2 3 4 5 6 7
Time (sec)
Hor
izon
tal d
isp.
(cm
)
Experiment
2-D analysis
3-D analysis

-500
0
500 A-2
A-16
-500
0
500 A-3
A-18
0 1 2 3 4 5-500
0
500 A-6
0 1 2 3 4 5
A-20
Figure 11: Comparison of computed and recorded horizontal accelerations of the ground
Ground Response The computed ground response was found to be in
good agreement with that observed in the experiment including the deformation pattern, development of excess pore pressures and ground accelerations. To illustrate the accuracy of the numerical prediction, comparisons of computed and measured horizontal accelerations at 6 different locations in the backfill soils are presented in Fig. 11 for two arrays of accelerometers located between the pile foundation and the sheet pile wall (A2-A6) and behind the pile foundation (A16-A20) respectively. In the dense sand layer near the base of the model (A6 and A20), the accelerations preserved the amplitudes of the input motion whereas clear signs of liquefaction are evident in the large reduction of the accelerations in the loose Toyoura sand, at A3 and A18. Slight amplification of the motion is seen in the accelerations of the surface layer. The largest disagreement between the computed and recorded accelerations is seen for the accelerometer A2 where the computed accelerations are larger than the measured ones. As discussed previously, the conditions in the analysis are the most severe for this portion of the ground model where large relative displacements and constraining effects of boundary conditions at the sheet pile and foundation piles concurrently occur.
Horizontal Displacement of Piles
Comparison of computed and measured horizontal displacements of the pile cap (top of the foundation piles) is shown in Fig. 12. Both the computed and recorded displacements sharply increased towards the water (negative amplitude on the ordinate) in the first two cycles and reached the peak displacement at the third cycle of shaking. The measured and computed peak horizontal displacements are 12.3 mm and 11.4 mm respectively. Very good agreement is seen between the computed and measured displacements for the first 10-12 cycles or up to about 4 seconds on the time scale. Over the last two seconds of shaking the displacement recorded in the test tends to gradually decrease both in amplitude and in its residual component. It is conceivable that this reduction in
the displacement was caused by the settlement of the ground and consequent reduction in the lateral loads from the surface layer on the foundation. Namely, the settlement of the ground resulted in a gradual reduction in the contact area between the crust layer and the pile cap until eventually the contact was completely lost as the ground surface subsided below the bottom of the pile cap. The reduction in the lateral displacements as above could not be captured in the analysis since the initial configuration of the model was preserved throughout the entire calculation.
As previously described, very large relative displacement between the pile cap and the adjacent soil was observed in the test, and therefore, attention was given to the modelling of the soil-pile cap interface. In order to investigate the effects of the modelling of this interface on the response of the piles, preliminary analyses were conducted considering two different conditions at the interface: one that allows the soil on the front side and along the side of the pile cap to move independently from the pile cap, and the other in which the surrounding soil was set to move together with the pile cap. It was found that, in general, the former condition provided better simulation of the behaviour observed in the experiment yet the effects on the peak displacements and bending moments of the piles were negligible. Needless to say, the interface modelling allowing large relative displacements between the elements of the pile cap and adjacent soil increased the potential for numerical instability in the analysis.
-15
-10
-5
0
5
1 2 3 4 5 6 7
Experiment Analysis
Time (sec)
Hor
izon
tal d
ispl
acem
ent
(mm
)
Displacement of footing (pile top)
Case 14-1
Figure 12: Comparison of computed and recorded horizontal
displacement at the pile cap
Experiment: Case 14-1Analysis: Case 14-1
Acc
eler
atio
n (c
m/s
2 )

-500
-250
0
2 3 4 5 6
K-12
Pile 1
-500
-250
0
2 3 4 5 6
K-12
Pile 3
0
250
500
2 3 4 5 6
K-2
Ben
ding
mom
ent,
M(N
-m)
0
250
500
2 3 4 5 6
K-2
0
250
500
2 3 4 5 6
K-1
0
250
500
2 3 4 5 6
K-1
Figure 13: Computed and recorded bending moment time histories at three elevations of Pile1 and Pile 3
Bending Moments Time histories of computed and recorded bending
moments are compared in Fig. 13, for two piles of the foundation. As shown in the inset of this figure, Pile 1 and Pile 3 are corner piles in the nearest row to the sheet pile and on the backfill side respectively. The uppermost plots in Fig. 13 are for strain gauges near the pile top (K-12) while the two lower sets of time histories are for strain gauges near the base of the pile (K-1 and K-2). By and large, good agreement is seen between the computed and recorded bending moments with features of agreement or disagreement similar to those discussed for the lateral displacements.
The computed and measured bending moments along the length of Pile 1 are shown in Fig. 14. These are bending moments at the time of the peak response observed in the third cycle of shaking, as described previously. In general, similar accuracy as that shown in Fig. 14 was obtained for all piles irrespective of their particular position within the group. Some differences were evident between the bending moments of the front row piles and those on the backfill side, particularly near the top of the piles. However, these differences were not pronounced, and for all piles the maximum bending response was obtained near the base of the pile.
It is important to recognize that good accuracy has been achieved in predicting the response of the foundation piles in spite of the underestimated displacement of the sheet pile wall thus indicating that the displacements at the waterfront are not critically important for correctly predicting the response of relatively stiff piles.
CONCLUSIONS A fully-coupled effective stress method of analysis
incorporating an elastic-plastic model for sand was used to numerically simulate a shake table experiment on piles subjected to lateral spreading. The objective of this study was to investigate the accuracy of the 3-D effective stress analysis in predicting the behaviour of piles and to identify key modelling features and numerical parameters
-500 0 500
0
0.2
0.4
0.6
0.8
1
1.2
1.4
Pile 1
Dep
th
(m
)
M (N-m)
H14-1
Meas.
Comp.
Figure 14: Computed and recorded bending moments along the
length of Pile 1 at the time of peak lateral displacement
K-1
K-2
K-12Footing
Shee
t pile
Footing
2 31
Experiment: Case 14-1Analysis: Case 14-1

influencing the analytical response. The key findings of this study can be summarized as follows:
1) The computed ground response was found to be in good agreement with that observed in the experiment including the deformation pattern, development of excess pore pressures, extent of liquefaction and ground accelerations. In the experiment, the loose sand layer liquefied within the first two cycles of shaking causing large lateral movement of the sheet pile wall. This lateral movement was associated with spreading of the backfill soils and settlement of the ground in a typical fashion for lateral spreading of liquefied soils. This pattern in the ground movement including 3D effects and flow-like movement of the soil around the foundation was captured in the analysis. The computed ground accelerations were also in very good agreement with those measured in the tests. In the shallow part of the deposit between the sheet pile wall and the foundation, some discrepancies between the computed and recorded responses were seen apparently due to severe numerical conditions imposed by the large lateral displacements and boundary constraints.
2) The computed response of the foundation piles including both lateral displacements and bending moments was in very good agreement with the response measured in the experiment. Particularly good agreement was obtained for the peak response of the piles.
3) The displacement of the sheet pile wall was underestimated in the analysis and was about 1/3 of the measured one. The results of this study indicate however that the displacements at the waterfront are not critically important for correctly predicting the response of relatively stiff piles.
4) The 3-D effective stress analysis involves a number of complex procedures associated with the constitutive and numerical modelling that require due attention. First of all, it is essential that the constitutive model provides reasonably good accuracy in predicting the excess pore pressures and ground deformation, thus allowing proper evaluation of the soil-pile interaction effects. The particular stress conditions and anticipated deformation pattern are equally important for correctly predicting the behaviour of the piles. In this study, for example, particular attention was given to the initial stress state and relatively low stresses associated with the ground model in the shake table test. In addition, boundary conditions and soil-pile interfaces were specified so that large deformation and typical displacement pattern associated with lateral spreading can be simulated. It is to be mentioned that reasonably good accuracy in simulating the behaviour of piles was achieved in the 3-D analysis despite using conventional beam elements for modelling of the piles.
ACKNOWLEDGMENTS
This study was conducted within the “Special project
for earthquake disaster mitigation in urban areas: (II) Significant improvement of seismic performance of structures, (3) Test and analysis of soil-pile-structure
systems,” in preparation of the large-scale shake table experiments of E-Defense, in Miki, Japan. This collaborative project was sponsored by the Ministry of Education, Culture, Sports, Science and Technology of Japan (MEXT) and was conducted under the guidance of the National research Institute for Earth Science and Disaster Prevention (NIED), Japan.
REFERENCES
[1] “Special project for earthquake disaster mitigation in
urban areas: (II) Significant improvement of seismic performance of structures, (3) Test and analysis of soil-pile-structure systems,” Technical Report of NIED, ch. 3.3, 2004.
[2] Diana-J3: Finite-element program for effective stress analysis of two-phase soil medium.
[3] Cubrinovski, M. and Ishihara, K., “Modelling of sand behaviour based on state concept,” Soils and Foundations, 38 (3), pp. 115-127, 1998.
[4] Cubrinovski, M. and Ishihara, K., “State concept and modified elastoplasticity for sand modelling”, Soils and Foundations, 38 (4), pp. 213-225, 1998.
[5] Tatsuoka, F., Ochi, K., Fujii, S. and Okamoto, M., “Cyclic triaxial and torsional strength of sands for different preparation methods,” Soils and Foundations, 26(3), pp. 23-41, 1986.
[6] Kawakami, S., Itakura, D., Sato, T. and Koseki, J., “Liquefaction characteristics of sand from cyclic torsional shear test at low confining pressure,” Proc. 33rd Annual Conf. of Japanese Geotech. Soc., D-7, pp. 725-726, 1998.