Embed Size (px)
Citation preview
2Q20 Earnings Presentation

The following material presents the results for the second quarter of 2020 (2Q20 – Jun/2020 to Aug/2020) of Camil
Alimentos. In this presentation. financial data is presented in accordance to the International Financial Reporting Standards
and represents the Company’s consolidated results in million reais (R$) with comparisons referring to the second quarter
of 2019 (2Q19 – Jun/2019 to Aug/2019; YoY Comparisons) and to the first quarter of 2020 (1Q20 – Mar/2020 to
May/2020; QoQ Comparisons), except when otherwise specified.
This presentation contains non-audited managerial operational numbers and financial data is presented in accordance to
the International Financial Reporting Standards. published in our Financial Statements. The Company´s fiscal year begins
in March and ends in February in the following year. This presentation contains summarized information which should not
be considered as complete. Certain percentages and other quantities included in this document have been rounded to
simplify the presentation. Therefore. numbers presented as the total sum of tables may not represent the arithmetic sum
of preceding numbers and may differentiate from those presented in the financial demonstrations. All information here
contained is subject to adjustments and revisions without prior notice.
Information here disclosed must not be understood as any kind of guidance for investments in the Company. neither
should it guide shareholders. potential investors. analysts or other professionals about the Company´s expectations
regarding information disclosed to the Market.
To obtain additional information about the Company and risk factors. please access the Investor Relations website
(http://ri.camilalimentos.com.br/?lang=en) and the documents archived with the CVM. including the Reference Form.
Disclaimer
2

September-2020• 9th Debentures Issuance of R$350 million approval of the
9th issue of simple unsecured debentures, not convertibleinto shares, in a single series, for public distribution withrestricted efforts in the amount of R$350 million CDI + 2.7%,with a term of 5 years from the date of issuance andamortization in two annual installments, in the 4th year andon the maturity of the debentures.
August-2020• IOE Payment. R$15 million, or approximately R$0.04 per
share, paid on September 14th, 2020.
• New Buyback Program. In August 2020, the Company'sBoard of Directors approved the new share buybackprogram, in order to partially meet the Company's stockoption plan. The program authorizes the repurchase of up to4 million shares in within 12 months.
2Q20 Financial Highlights
YoY Comparisons
Highlights
2.0x Net Debt/EBITDA
Quarter remarks include annual volume growth, with profitability increase.
Consolidated EBITDA of R$208 million (+134% YoY) with EBITDA margin of 10.8% (+3.6pp YoY) in 2Q20
Latest News
and subsequent events
R$1.9 billion Net Revenue ( +56%)
R$1.3 billion Brazil Food Segment ( +51%)R$570 million International Food Segment ( +69%)
R$208 million EBITDA ( +134%)
10.8% EBITDA Margin ( +3.6pp)
R$140 million Net Income ( +250%)
7.3% Net Margin ( +4.1pp)R$0.38 Earnings per Share ( +282%)
3
R$435 million Gross Profit ( +53%)
22.7% Gross Margin ( -0.5pp)

4
Main Indicators
Quarter marked by annual growth in volumes and profitability, with an increase in margins
due to the dilution of costs and expenses
Highlights 2Q19 1Q20 2Q20 2Q20 vs 2Q20 vs
Closing Date 31-ago-19 31-mai-20 31-ago-20 2Q19 1Q20
Net Revenues 1,223.6 1,729.0 1,912.6 56.3% 10.6%
Food Products Brasil 886.4 1,210.2 1,342.5 51.4% 10.9%
Food Products International 337.1 518.7 570.2 69.1% 9.9%
Gross Profit 283.7 413.6 434.5 53.2% 5.0%
Gross Margin (%) 23.2% 23.9% 22.7% -0.5pp -1.2pp
EBITDA 88.7 196.6 207.5 133.8% 5.5%
EBITDA Margin (%) 7.3% 11.4% 10.8% 3.6pp -0.5pp
Net Income 40.1 109.5 138.6 245.6% 26.7%
Net Margin (%) 3.3% 6.3% 7.2% 4.0pp 0.9pp
Capex 38.2 19.2 27.1 -29.1% 40.9%
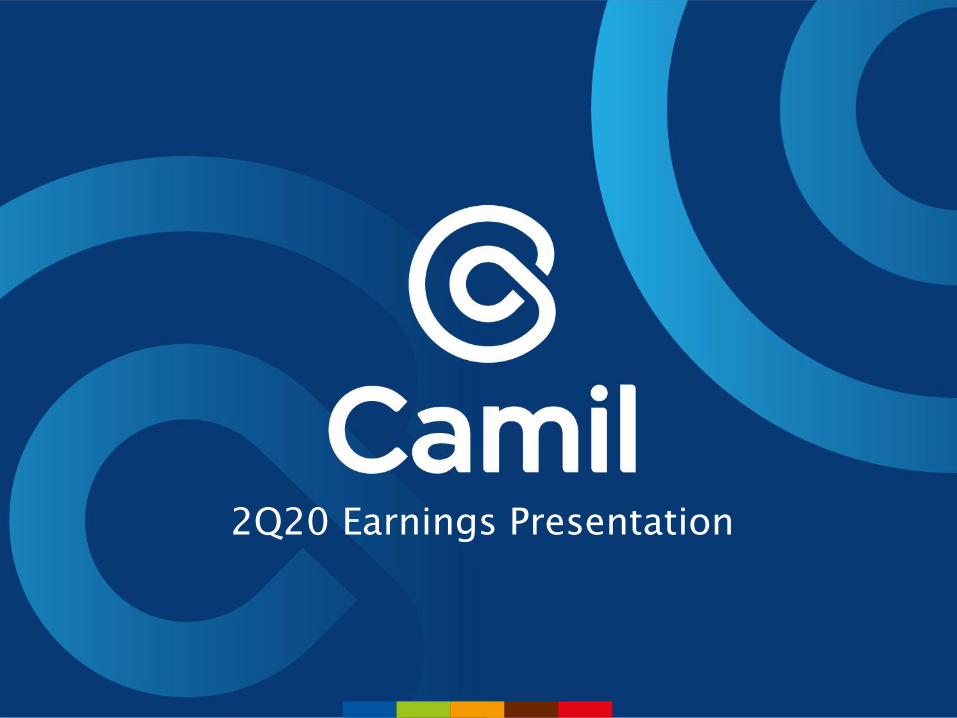
Operational Highlights - Volume (in thousand ton)
Total Volume 487.7 561.8 586.3 20.2% 4.3%
Volume - Brazil 342.5 385.2 397.2 16.0% 3.1%
Grains 216.9 231.8 240.5 10.9% 3.8%
Rice 190.4 208.3 217.2 14.1% 4.3%
Beans 26.5 23.6 23.4 -11.9% -0.8%
Sugar 119.5 145.9 147.1 23.1% 0.9%
Canned Fish 6.1 7.5 9.5 56.5% 26.6%
Volume - International 145.2 176.6 189.1 30.2% 7.0%
Uruguay 101.6 126.3 139.8 37.6% 10.7%
Chile 21.6 23.9 23.4 8.3% -2.0%
Peru 21.9 26.4 25.8 17.8% -2.3%
5
Operational Highlights
2Q20 Breakdown(%)
20% YoY increase in consolidated quarterly volume
+20.2% YoY
Fish 10k+56.5% YoY+26.6% QoQ
Sugar 147k+23.1% YoY+0.9% QoQ
Beans 23k-11.9% YoY-0.8% QoQ
Rice 217k+14.1% YoY+4.3% QoQ
0
100.000
200.000
300.000
400.000
500.000
600.000
1T14 2T14 3T14 4T14 1T15 2T15 3T15 4T15 1T16 2T16 3T16 4T16 1T17 2T17 3T17 4T17 1T18 2T18 3T18Arroz Brasil Feijão Açúcar Pescados Internacional
0
100.000
200.000
300.000
400.000
500.000
600.000
1T14 2T14 3T14 4T14 1T15 2T15 3T15 4T15 1T16 2T16 3T16 4T16 1T17 2T17 3T17 4T17 1T18 2T18 3T18Arroz Brasil Feijão Açúcar Pescados Internacional
0
100.000
200.000
300.000
400.000
500.000
600.000
1T14 2T14 3T14 4T14 1T15 2T15 3T15 4T15 1T16 2T16 3T16 4T16 1T17 2T17 3T17 4T17 1T18 2T18 3T18Arroz Brasil Feijão Açúcar Pescados Internacional
0
100.000
200.000
300.000
400.000
500.000
600.000
1T14 2T14 3T14 4T14 1T15 2T15 3T15 4T15 1T16 2T16 3T16 4T16 1T17 2T17 3T17 4T17 1T18 2T18 3T18Arroz Brasil Feijão Açúcar Pescados Internacional
0
100.000
200.000
300.000
400.000
500.000
600.000
1T14 2T14 3T14 4T14 1T15 2T15 3T15 4T15 1T16 2T16 3T16 4T16 1T17 2T17 3T17 4T17 1T18 2T18 3T18Arroz Brasil Feijão Açúcar Pescados InternacionalInternacional 189k
+30.2% YoY+7.0% QoQ
2Q20
Quarterly Volume Evolution (k ton)
2Q20 Volumes (k ton)
Volume Net Revenues
+4.3% QoQ
0
100.000
200.000
300.000
400.000
500.000
600.000
1Q15 2Q15 3Q15 4Q15 1Q16 2Q16 3Q16 4Q16 1Q17 2Q17 3Q17 4Q17 1Q18 2Q18 3Q18 4Q18 1Q19 2Q19 3Q19 4Q19 1Q20 2Q20
Rice37%
Beans4%
Sugar25%
Fish2%
International32%
Rice34%
Beans7%Sugar
16%
Fish8%
International35%
Highlights 2Q19 1Q20 2Q20 2Q20 vs 2Q20 vs
Closing Date Aug-19 May-20 Aug-20 2Q19 1Q20
Total Volume 487.7 561.8 586.3 20.2% 4.3%
Volume - Brazil 342.5 385.2 397.2 16.0% 3.1%
Grains 216.9 231.8 240.5 10.9% 3.8%
Rice 190.4 208.3 217.2 14.1% 4.3%
Beans 26.5 23.6 23.4 -11.9% -0.8%
Sugar 119.5 145.9 147.1 23.1% 0.9%
Canned Fish 6.1 7.5 9.5 56.5% 26.6%
Volume - International 145.2 176.6 189.1 30.2% 7.0%
Uruguay 101.6 126.3 139.8 37.6% 10.7%
Chile 21.6 23.9 23.4 8.3% -2.0%
Peru 21.9 26.4 25.8 17.8% -2.3%
6
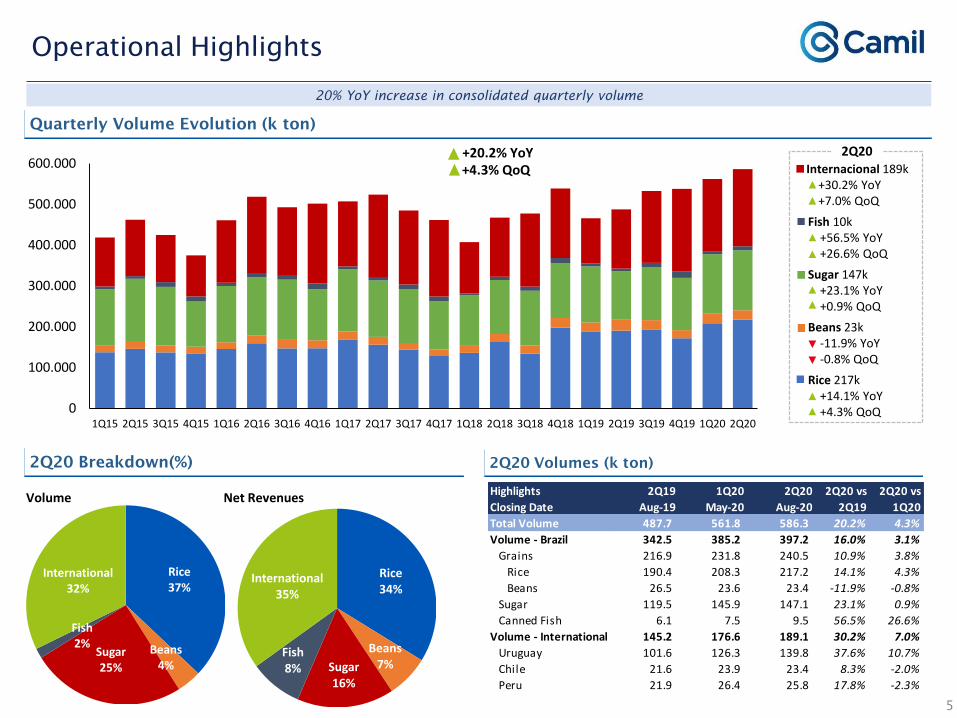
Brazil Food Segment | Rice
Sales volumes : 217.2 thousand tons
+14.1 % YoY
+4.3% QoQ
Average raw material price ¹: R$67.13/bag
+54.0% YoY
+21.9% QoQ
Gross Price Camil: R$3.30/kg
+33.1% YoY
+15.3% QoQ
Source: Company Source: Esalq Senar¹, Company
We highlight this quarter’s volumes increase and gradual improvement in the capacity to transfer prices in Brazil
Rice – Camil’s Volume and Net Prices Rice – Market Prices vs. Camil’s Gross Prices
Rice – Product PortfolioRice – Quarterly Highlights
¹Source: CEPEA; paddy rice indicator Esalq/Senar-RS 50kg.
Source: Company
Mai
nst
ream
Val
ue
Pri
cin
gB
ran
ds
Sales increase for Camil brand and value pricing brands
High demand during Covid-19 pandemic
193,700
171,500
208,260 217,159
155,798 162,717
190,369
217,159
2.26 2.322.56
2.95
2.11 2.20 2.19
2.95
-4.0
-3.0
-2.0
-1.0
0.0
1.0
2.0
3.0
0
50,000
100,000
150,000
200,000
250,000
300,000
350,000
3Q19 4Q19 1Q20 2Q20 2Q17 2Q18 2Q19 2Q20Rice Net Prices (R$/kg)
2.0
2.2
2.4
2.6
2.8
3.0
3.2
3.4
30
35
40
45
50
55
60
65
70
75
80
85
90
95
100
Aug-17 Feb-18 Aug-18 Feb-19 Aug-19 Feb-20 Aug-20
Cam
il (
R$
/kg)
Esal
q S
en
ar (
RS/
50
kg)
Brazil - Rice Price Camil - Gross Price

Mai
nst
ream
Val
ue
Pri
cin
gB
ran
ds
7
Brazil Food Segment | Beans
Source: Company Source: Agrolink¹, Company
We highlight the reduction in Camil volumes and the growth of value pricing brands in the quarter
Beans - Camil’s Volume and Net Prices Beans - Market Prices vs. Camil’s Gross Prices
Beans– Product Portfolio
¹Source: Agrolink; carioca beans indicator Sc 60kg.Source: Company
Sales Volumes: 23.4 thousand tons
-11.9% YoY
-0.8% QoQ
Average raw material price¹: R$240.84/bag
+67.6% YoY
-9.2% QoQ
Camil Gross Price: R$6.00/kg
+55.0% YoY
-1.5% QoQ
Beans – Quarterly Highlights
Decrease in the Camil brand sales
Volumes increase in value pricing brands
(0.50)
0.50
1.50
2.50
3.50
4.50
5.50
6.50
7.50
8.50
0
50
100
150
200
250
300
350
400
Aug-17 Feb-18 Aug-18 Feb-19 Aug-19 Feb-20 Aug-20
Ca
mil
(R
$/k
g)
Agr
oli
nk
(RS/
60
kg)
Brazil - Beans Price Camil - Gross Price
22,388
20,000
23,551 23,364
19,482 19,462
26,533
23,364
3.814.58
5.73 5.62
3.90
2.783.62
5.62
-10.0
-8.0
-6.0
-4.0
-2.0
0.0
2.0
4.0
6.0
8.0
2,000
7,000
12,000
17,000
22,000
27,000
32,000
37,000
3Q19 4Q19 1Q20 2Q20 2Q17 2Q18 2Q19 2Q20
Beans Net Prices (R$/kg)

8
Brazil Food Segment | Sugar
Source: Esalq Senar Source: Esalq Senar, Company
Sugar - Camil’s Volume and Net Prices Sugar - Market Prices vs. Camil’s Gross Prices
Sugar – Product PortfolioSugar – Quarterly Highlights
Source: Company
¹Source: CEPEA; Cristal Sugar Indicator Esalq-SP 50kg.
Mai
nst
ream
Val
ue
pri
cin
gb
ran
ds
Sales volume : 147.2 thousand tons
+23.1% YoY
+0.9% QoQ
Average raw material price ¹: R$77.95/bag
+28.3% YoY
+1.6% QoQ
Gross Price Camil: R$2.33/kg
+18.6% YoY
-1.7% QoQ
União brand and value pricing brands sales increase
High demand during Covid-19 pandemic
We highlight the quarter volume increase
130,548 128,300
145,882 147,139
138,469
132,244
119,540
147,139
2.04 2.04 2.05 2.031.97
1.831.89
2.03
0.0
0.5
1.0
1.5
2.0
70,000
90,000
110,000
130,000
150,000
170,000
190,000
3Q19 4Q19 1Q20 2Q20 2Q17 2Q18 2Q19 2Q20
Sugar Net Prices (R$/kg)
0.6
1.1
1.6
2.1
2.6
40
50
60
70
80
90
100
Aug-17 Feb-18 Aug-18 Feb-19 Aug-19 Feb-20 Aug-20
Ca
mil
(R
$/k
g)
Esa
lq C
EPEA
SP
(R
S/5
0kg
)
Brazil - Sugar Price Camil - Gross Price

9
Brazil Food Segment | Canned Fish
Source: Company Source: Company
Canned Fish - Camil’s Volume and Net Prices Canned Fish - Camil’s Volume and Net Prices
Canned Fish – Product PortfolioCanned Fish – Quarterly Highlights
Source: Company
Mai
nst
ream
Val
ue
Pri
cin
gB
ran
ds
Sales volume: 9.5 thousand tons
+56.5% YoY
+26.6% QoQ
Camil Gross Price: R$21.17/kg
+4.5% YoY
+2.2% QoQ
Improvement in local tuna and sardine fishing in the quarter
We highlight volume growth YoY and sales seasonality of the category
Sales increase for Coqueiro brand and Value Pricing Brands (Pescador)
16
17
18
19
20
21
22
23
Aug-17 Feb-18 Aug-18 Feb-19 Aug-19 Feb-20 Aug-20
Camil - Gross Price (R$/kg)
9,976
15,500
7,539
9,547
6,180
8,125
6,099
9,547
15.95 15.8016.06
17.07
14.7615.59 15.75
17.07
6.0
8.0
10.0
12.0
14.0
16.0
18.0
1,000
6,000
11,000
16,000
21,000
3Q19 4Q19 1Q20 2Q20 2Q17 2Q18 2Q19 2Q20
Fish Net Prices (R$/kg)
10
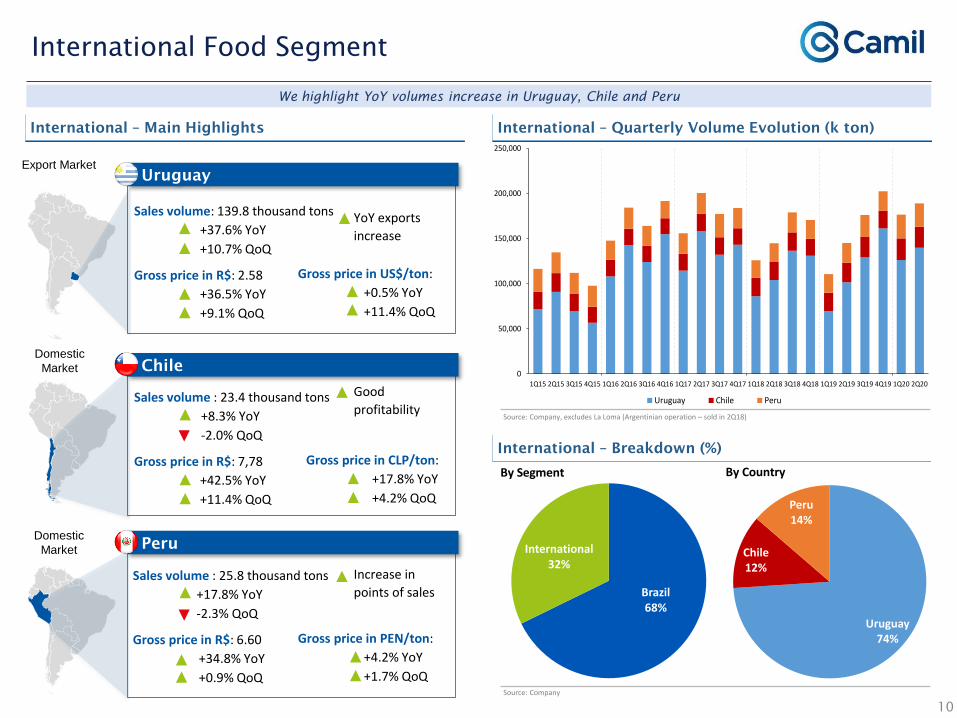
International Food Segment
Chile
Uruguay
Domestic
Market
Domestic
Market
Export Market
Peru
Source: Company, excludes La Loma (Argentinian operation – sold in 2Q18)
Source: Company
International – Quarterly Volume Evolution (k ton)
International – Breakdown (%)
We highlight YoY volumes increase in Uruguay, Chile and Peru
International – Main Highlights
By CountryBy Segment
Sales volume: 139.8 thousand tons
• +37.6% YoY
• +10.7% QoQ
Gross price in R$: 2.58
• +36.5% YoY
• +9.1% QoQ
Sales volume : 23.4 thousand tons
+8.3% YoY
-2.0% QoQ
Gross price in R$: 7,78
• +42.5% YoY
• +11.4% QoQ
Good
profitability
Gross price in CLP/ton:
• +17.8% YoY
• +4.2% QoQ
Sales volume : 25.8 thousand tons
+17.8% YoY
-2.3% QoQ
Gross price in R$: 6.60
• +34.8% YoY
• +0.9% QoQ
Gross price in PEN/ton:
• +4.2% YoY
• +1.7% QoQ
Increase in
points of sales
Gross price in US$/ton:
• +0.5% YoY
• +11.4% QoQ
YoY exports
increase
0
50,000
100,000
150,000
200,000
250,000
1Q15 2Q15 3Q15 4Q15 1Q16 2Q16 3Q16 4Q16 1Q17 2Q17 3Q17 4Q17 1Q18 2Q18 3Q18 4Q18 1Q19 2Q19 3Q19 4Q19 1Q20 2Q20
Uruguay Chile Peru
Uruguay74%
Chile12%
Peru14%
Brazil68%
International32%

11
Financial Highlights
Statements (in R$ millions) 2Q19 1Q20 2Q20 2Q20 vs 2Q20 vs
Closing Date 31-Aug-19 31-May-20 31-Aug-20 2Q19 1Q20
Net Revenues 1,223.6 1,729.0 1,912.6 56.3% 10.6%
(-) Cost of Sales and Services (939.9) (1,315.4) (1,478.1) 57.3% 12.4%
Gross Profit 283.7 413.6 434.5 53.2% 5.0%
(-) SG&A (227.7) (260.4) (278.2) 22.2% 6.8%
(+/-) Equity (Earnings)/Losses in Uncons. Subs. (1.8) (0.1) 0.1 -105.6% -169.1%
Other Operating Income 0.8 2.6 9.9 1136.9% n.a.
EBIT 55.0 155.6 166.3 202.5% 6.8%
(+/-) Finacial Result (18.2) (16.8) (14.4) -21.1% -14.5%
Pre-Tax Income 36.8 138.8 151.9 313.2% 9.4%
(-) Total Income Taxes 3.3 (29.4) (13.3) -496.6% n.a.
Net Income 40.1 109.5 138.6 245.6% 26.7%
EBITDA Reconciliation
Net Income 40.1 109.5 138.6 245.6% 26.7%
(-) Net Finacial Result 18.2 16.8 14.4 -21.1% -14.5%
(-) Income Taxes (3.3) 29.4 13.3 -496.6% n.a.
(-) Depreciation and Amortization 33.8 41.0 41.2 22.0% 0.4%
(=) EBITDA 88.7 196.6 207.5 133.8% 5.5%
MarginsGross Margin 23.2% 23.9% 22.7% -0.5pp -1.2ppEBITDA Margin 7.3% 11.4% 10.8% 3.6pp -0.5ppNet Margin 3.3% 6.3% 7.2% 4.0pp 0.9pp

EBITDA of R$207.5 million (+133.8% YoY) EBITDA Margin of 10.8% (+3.6pp YoY)Improvement of gross profit with reduction of costs and expenses / dilution of SG&A
Financial Highlights
Cost of sales and services
R$1.5 billion (+57.3% YoY) 77,3% of Net Revenue
Volumes increase in Brazil and International;
Raw material cost increase;
Gross Profit of R$434.5 million (+53.2%) Gross Margin of 22.7% (-0.5pp)Sugar margin compression and gradual improvement in the capacity to pass on grain prices in Brazil; growth in fish and international margins
R$278.2 million (+22.7% YoY)
14.5% of Net Revenue (-4.1pp YoY)
Increase in SG&A Brasil (+9.1% YoY)
Increase in International SG&A (+54.2% YoY)
Costs and Expenses reduction initiatives in Brazil and SG&A dilution
FX impact
SG&A Financial Result
Net Financial Result of -R$14.4 million(-21.1% YoY)
Impact of exchange variation and derivatives
Income Tax of -R$13.3 million (8,7% of theresult before taxes)
Exclusions due to ICMS Subventions and IOE
Income Tax and Social Contribution
Net Income
Net Income of R$139 million (+245.6% YoY)Net Margin of 7.2% (+4.0pp YoY)Earnings/share of R$0.37 (+276.6%)Better profitability and reduction in the Company's total shares vs. 2Q19 12
Statements (in R$ millions) 2Q19 2Q20 2Q20 vs 2Q19 2Q20 2Q20 vs 2Q19 2Q20 2Q20 vs
Closing Date 31-ago-19 31-ago-20 2Q19 31-ago-19 31-ago-20 2Q19 31-ago-19 31-ago-20 2Q19
Net Revenues 886.4 1,342.5 51.4% 337.1 570.2 69.1% 1,223.6 1,912.6 56.3%
(-) Costs of Goods Sold (693.0) (1,065.7) 53.8% (246.9) (412.5) 67.1% (939.9) (1,478.1) 57.3%
Gross Profit 193.4 276.8 43.1% 90.2 157.7 74.7% 283.7 434.5 53.2%
(-) SG&A (161.5) (176.2) 9.1% (66.1) (102.0) 54.2% (227.7) (278.2) 22.2%
(+/-) Other operating income (0.1) 10.0 -9092.8% (0.9) 0.1 -107.2% (1.0) 10.0 -1072.7%
EBIT 31.8 110.5 247.7% 23.2 55.7 140.5% 55.0 166.3 202.5%
(+/-) Finacial Result (15.1) (10.6) -29.7% (3.1) (3.8) 21.0% (18.2) (14.4) -21.1%
Pre-Tax Income 16.7 99.9 498.7% 20.1 52.0 158.9% 36.8 151.9 313.2%
Total Income Taxes 8.7 (1.8) -120.6% (5.3) (11.5) 116.5% 3.3 (13.3) -496.9%
Net Income 25.3 98.1 287.2% 14.8 40.5 174.2% 40.1 138.6 245.6%
(=) EBITDA 54.4 137.3 152.4% 34.3 70.2 104.4% 88.7 207.5 133.8%
Margins
Gross Margin 21.8% 20.6% -1.2pp 26.8% 27.7% 0.9pp 23.2% 22.7% -0.5pp
EBITDA Margin 6.1% 10.2% 4.1pp 10.2% 12.3% 2.1pp 7.3% 10.8% 3.6pp
Net Margin 2.9% 7.3% 4.5pp 4.4% 7.1% 2.7pp 3.3% 7.2% 4.0pp
Brazil International Consolidated
Lucro Bruto EBITDA

Debt (in R$mn) 2Q19 1Q20 2Q20 2Q20 vs 2Q20 vs
Closing Date 31-Aug-19 31-May-20 31-Aug-20 2Q19 1Q20
Total Debt 2,141.8 3,042.5 2,581.0 20.5% -15.2%
Loans and financing 555.6 1,682.6 1,460.1 162.8% -13.2%
Debentures 1,586.2 1,359.8 1,120.8 -29.3% -17.6%
Short Term 915.4 1,742.4 1,462.8 59.8% -16.0%Long Term 1,226.4 1,300.1 1,118.2 -8.8% -14.0%
Leverage
Gross Debt 2,141.8 3,042.5 2,581.0 20.5% -15.2%Cash and Cash Equivalents +
financial applications869.0 1,846.3 1,253.9 44.3% -32.1%
Net Debt 1,272.8 1,196.2 1,327.1 4.3% 10.9%
Net Debt/EBITDA LTM 2.9x 2.2x 2.0x -0.9x -0.2x
13
Debt
Debt (R$mn)
Debt Amortization Schedule (R$mn)
Net Debt/EBITDA LTM of 2.0x (-0.9x YoY)
We guarantee the financial need for theyear 2020 in 1Q20, with borrowing in theamount of R$1.2 billion.
The new emission (Sep/20) is the initialwork to meet the Company'scommitments that expire at the beginningof next year.
Total Debt of R$2.6 billion (+20.5% YoY)Net Debt of R$1.3 billion (-1.5% YoY)
Brazil and International R$1.2 billion in 1Q20 lookingat short term maturities ;
Subsequent Event: Approval in Sep/20 of theissuance of R$350 million in debentures, CDI+2,7% aa.,term of 5 years and amortization in two annualinstallments on the 4th year and at its maturity
Total liquidity of R$1.2 billion (-1.5% YoY)
Net Debt/EBITDA LTM of 2.0x (-0.9x YoY)
1,467
241363
71
390
50
1747
426
91
346
59
386
R$0
R$200
R$400
R$600
R$800
R$1,000
R$1,200
R$1,400
R$1,600
R$1,800
R$2,000
2021 2022 2023 2024 2025 After 2025Aug-20 May-20

14
Quarterly Profitability Evolution (in R$mn)
Quarterly Margin Evolution (%)
Source: Company
Source: Company
Quarter marked by annual profitability growth, with increase in margins
And dilution of costs and expenses
Profitability Evolution: Net Income, EBITDA and Margins
10.7% 10.3%9.5% 9.6%
11.1%
13.9%
11.4%
7.8%
10.4% 9.8%11.1% 10.7%
8.2%
11.7% 12.0%
6.5% 6.6%7.3%
9.3% 9.0%
11.2% 11.4%
3.5% 3.2%2.4%
1.6%
4.5% 5.0% 5.3%
1.6%
5.0%
3.5%
6.2%6.9%
3.2%
6.9%
11.9%
5.4%3.9% 3.4%
4.7%5.4%
6.2% 6.7%
R$0
R$50
R$100
R$150
R$200
R$250
1Q15 2Q15 3Q15 4Q15 1Q16 2Q16 3Q16 4Q16 1Q17 2Q17 3Q17 4Q17 1Q18 2Q18 3Q18 4Q18 1Q19 2Q19 3Q19 4Q19 1Q20 2Q20
EBITDA Net Income EBITDA Margin Net Margin
24.3% 24.2% 24.4%25.0%
25.9%
27.7%
23.0%22.2%
24.3% 24.3% 24.7%25.5%
26.2%27.6%
25.3%24.2%
23.2% 23.2% 23.7%22.6%
23.9%22.7%
10.7% 10.3%9.5% 9.6%
11.1%
13.9%
11.4%
7.8%
10.4% 9.8%11.1% 10.7%
8.2%
11.7% 12.0%
6.5% 6.6%7.3%
9.3% 9.0%
11.2% 11.4%
3.5% 3.2%2.4%
1.6%
4.5% 5.0% 5.3%
1.6%
5.0%
3.5%
6.2%6.9%
3.2%
6.9%
11.9%
5.4%3.9%
3.4%4.7%
5.4%6.2% 6.7%
0%
5%
10%
15%
20%
25%
30%
1Q15 2Q15 3Q15 4Q15 1Q16 2Q16 3Q16 4Q16 1Q17 2Q17 3Q17 4Q17 1Q18 2Q18 3Q18 4Q18 1Q19 2Q19 3Q19 4Q19 1Q20 2Q20
Gross Margin EBITDA Margin Net Margin

Luciano Quartiero
Chief Executive Officer
Flavio Vargas
Chief Financial and Investor Relations
Officer
Investor Relations
Phones:
+55 11 3039-9238
+55 11 3039-9237
E-mail: [email protected]