Embed Size (px)
Citation preview
UniCredit Group: 2Q15 results
Milan, August 5th, 2015

UniCredit Group - INTERNAL USE ONLY -
2
Disclaimer
This Presentation may contain written and oral “forward-looking statements”, which includes all statements that do not relate solely tohistorical or current facts and which are therefore inherently uncertain. All forward-looking statements rely on a number of assumptions,expectations, projections and provisional data concerning future events and are subject to a number of uncertainties and other factors,many of which are outside the control of UniCredit S.p.A. (the “Company”). There are a variety of factors that may cause actual resultsand performance to be materially different from the explicit or implicit contents of any forward-looking statements and thus, such forward-looking statements are not a reliable indicator of future performance. The Company undertakes no obligation to publicly update or reviseany forward-looking statements, whether as a result of new information, future events or otherwise, except as may be required byapplicable law. The information and opinions contained in this Presentation are provided as at the date hereof and are subject to changewithout notice. Neither this Presentation nor any part of it nor the fact of its distribution may form the basis of, or be relied on or inconnection with, any contract or investment decision.
The information, statements and opinions contained in this Presentation are for information purposes only and do not constitute a publicoffer under any applicable legislation or an offer to sell or solicitation of an offer to purchase or subscribe for securities or financialinstruments or any advice or recommendation with respect to such securities or other financial instruments. None of the securitiesreferred to herein have been, or will be, registered under the U.S. Securities Act of 1933, as amended, or the securities laws of any stateor other jurisdiction of the United States or in Australia, Canada or Japan or any other jurisdiction where such an offer or solicitationwould be unlawful (the “Other Countries”), and there will be no public offer of any such securities in the United States. This Presentationdoes not constitute or form a part of any offer or solicitation to purchase or subscribe for securities in the United States or the OtherCountries.
Pursuant the consolidated law on financial intermediation of 24 February 1998 (article 154-bis, paragraph 2) Marina Natale, in hercapacity as manager responsible for the preparation of the Company’s financial reports declares that the accounting informationcontained in this Presentation reflects the UniCredit Group’s documented results, financial accounts and accounting records.
Neither the Company nor any member of the UniCredit Group nor any of its or their respective representatives, directors or employeesaccept any liability whatsoever in connection with this Presentation or any of its contents or in relation to any loss arising from its use orfrom any reliance placed upon it.

UniCredit Group - INTERNAL USE ONLY -
Executive summary
Earningsgeneration
Resilientbusiness
performance
Buildingcapital
Assetquality
improvement
Group net profit at 522m in 2Q15 with a RoTE of 5%, and above1bn in 1H15 with a RoTE of 5%
Core Bank net profit at 819m, ROAC at 8.9%, with net interest resilient (+1.8% q/q) to lower ratesand competition
CB Italy the largest contributor to revenues; improving performance of CB Germany; soundrevenue generation in CIB despite market conditions
Non Core de-risking accelerating with gross loans further down by 2.2bn q/q and RWA reduced by1.3bn q/q
CET1 ratio fully loaded at 10.37%. Valuing the AFS reserve as of today and including Pioneerdeal, CET1 ratio fully loaded at 10.84%
CET1 ratio transitional at 10.52% (+66bp q/q), or 10.92% including Pioneer deal
Positive evolution of RWA resulting in a reduction of 15bn
Leverage ratio fully loaded proforma at 4.31%
CoR down to 76bp at Group level, coupled with an increased coverage ratio to 51% on grossimpaired loans
Asset quality further improving with gross impaired loans reduction supported by NPL sales andnet outflows from impaired, supported by back-to-performing up by 20% y/y in Italy
3

UniCredit Group - INTERNAL USE ONLY -
4
Agenda
Non Core
Core Bank
Annex
Financials
Group
UniCredit Group - INTERNAL USE ONLY -
5
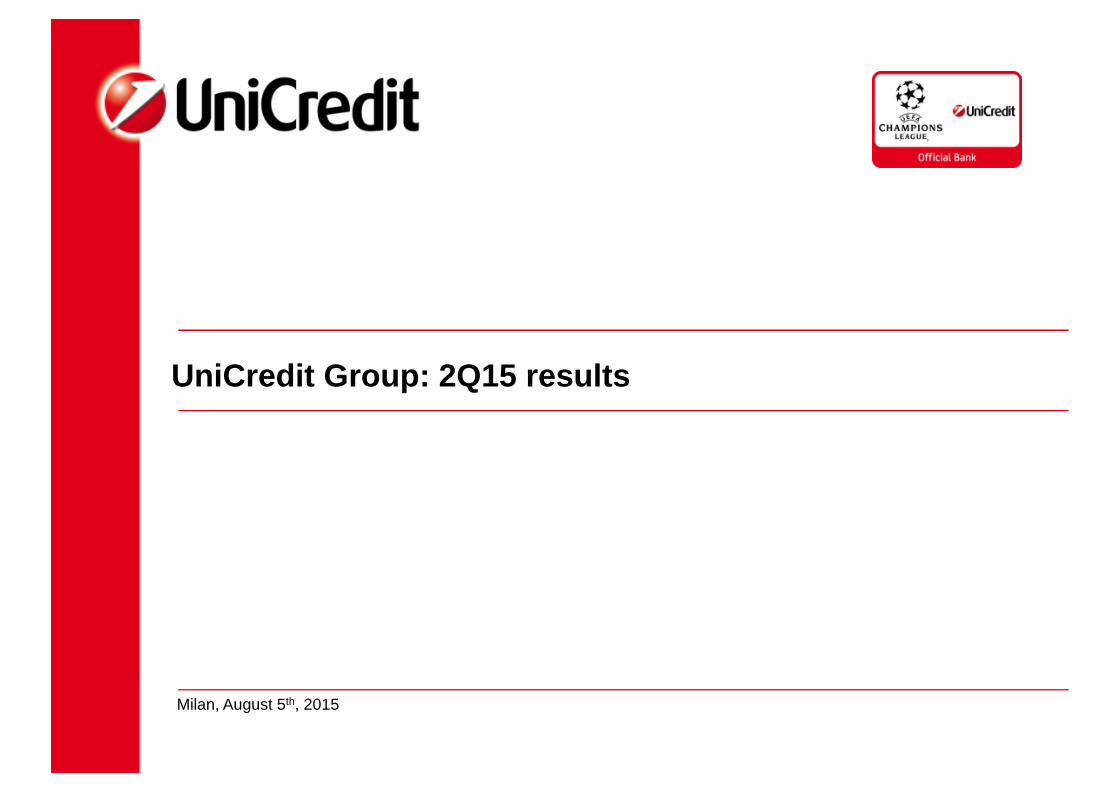
Group – ResultsNet profit over 1bn in 1H15 with 5% RoTE and positive quarterly development
Total assets, bn
Total RWA / Total assets, %
875901
844856837
+4.6%
-2.8%
Jun-15Mar-15Dec-14Sep-14Jun-14
Net profit, m
1,0341,116
522512403
-7.3%
+2.0%
29.5%
1H151H142Q151Q152Q14
Tangible equity, bn
Funding gap(2), bn
44.645.643.845.943.5
-2.4%
+2.3%
Jun-15Mar-15Dec-14Sep-14Jun-14
46.446.748.546.947.7
Sep-14
-0.3pp
-1.3p.p.
Jun-15Mar-15Dec-14Jun-14
RoTE(1)
(1) RoTE: net profit / average tangible equity (excluding AT1).(2) Funding gap: customers loans - (customer deposits + customer securities). Jun-14 net of DAB.
-1.5
15.415.623.3
26.7
Sep-14
-28.2bn
-16.9bn
Jun-15Mar-15Dec-14Jun-14
3.9% 4.8% 4.9% 5.8% 5%

100117
197
304
172 182
45103
-16
1H11 2H11 1H12 2H12 1H13 2H13 1H14 2H14 1H15
6
Gross impaired loans(1), bn
39.7 40.2 41.1 41.1 40.0
-1.4% -3.1%
Jun-15
81.7
Mar-15
83.2
Dec-14
84.4
Jun-14
82.4
Dec-13
83.6
Gross bad loans (sofferenze)(1), bn
Group – Asset qualityGross impaired continued reduction supported by NPL sales and net outflowsfrom impaired loans. Coverage ratio on impaired at 51%
18.1 19.719.719.3 19.7
+1.0% -1.6%
Jun-15
51.3
Mar-15
51.4
Dec-14
52.1
Jun-14
49.6
Dec-13
49.1
30.531.832.232.834.5
-5.5%
Jun-15
-4.9%
Mar-15Dec-14Jun-14Dec-13
Other gross impaired loans(1), bn
Cov.ratio
Net imp.loanratio
(1) The perimeter of impaired exposures as per instructions of BankIT Circular 272 is substantially equivalent to the perimeter of NonPerforming Exposures (NPE) EBA.
(2) Average quarterly net flows to impaired based to 100 as of 1H11. Net inflows defined as inflows (from gross performing loans togross impaired loans) – outflows (collections and flows from gross impaired loans back to performing loans).
Cov.ratio
Netimp.
Netbad
Cov.ratio
Gross impaired loans – net flows(2), base 1H11
52.5% 51.2% 51.3% 50.6% 51.0%
8.2% 8.5% 8.7% 8.5% 8.4%
63.1% 61.1% 62.2% 61.7% 61.7%
37.3% 36.3% 33.6% 32.7% 33.1%

7
Asset quality in ItalyConfirmed better asset quality trend vs. banking system
(1) UCI Spa data based on regulatory flows.(2) Italian banking association - sample composed by approx. 80% of Italian banking system (excluding UCI Spa); including exposures
towards households and non financial corporations.
Gross impaired loansBase 100 at Dec-12
Gross bad loans (sofferenze)Base 100 at Dec-12
Other gross impaired loansBase 100 at Dec-12
Dec-12 Dec-14 Mar-15
Gross impaired loans trend consistently better than the Italian banking system
Bad loans (sofferenze) stabilized in 2Q15 whilst the banking system still increased
Other impaired loans confirmed a downward trend for UCG also supported by lower inflows to impaired, down by11pp y/y
Jun-14Dec-13 Dec-12 Dec-14 Mar-15Jun-14Dec-13 Dec-12 Dec-14 Mar-15Jun-14Dec-13
138138134
123
155150
146
135
122117
100100 89
94
98100
103
126127127
113
118
100100
ABI sample(2)
UCI Spa(1)
115117117
112
141139
137
118
127
110
100100
Jun-15 Jun-15 Jun-15

UniCredit Group - INTERNAL USE ONLY -
8
Group – Regulatory capital (1/3)CET1 ratio fully loaded at 10.37% in Jun-15, up to 10.84% proforma for AFSreserves as of today and Pioneer deal
+27bp
Jun-15fully loaded(1)
10.37%
RWAs
+37bp
Reserves & other
-17bp
Div. accrual & Cashes
-5bp
2Q15 earnings
+13bp
Mar-15fully loaded(1)
10.10%
(1) Pro-forma assuming the full absorption of DTA on goodwill tax redemption and tax losses carried forward and Pekao minority excesscapital calculated with 12% threshold.
10.84% incl.:- AFS res. asof today(+22bp)- Pioneer deal(+25bp)
o/w AFS reserves: -32bp. As of today, AFS reservesimproved by +22bp
o/w DBO +6bp: new discount rate as of end of June
o/w FX -7bp: mainly related to the depreciation ofTurkish Lira and Zloty
UniCredit Group - INTERNAL USE ONLY -
9
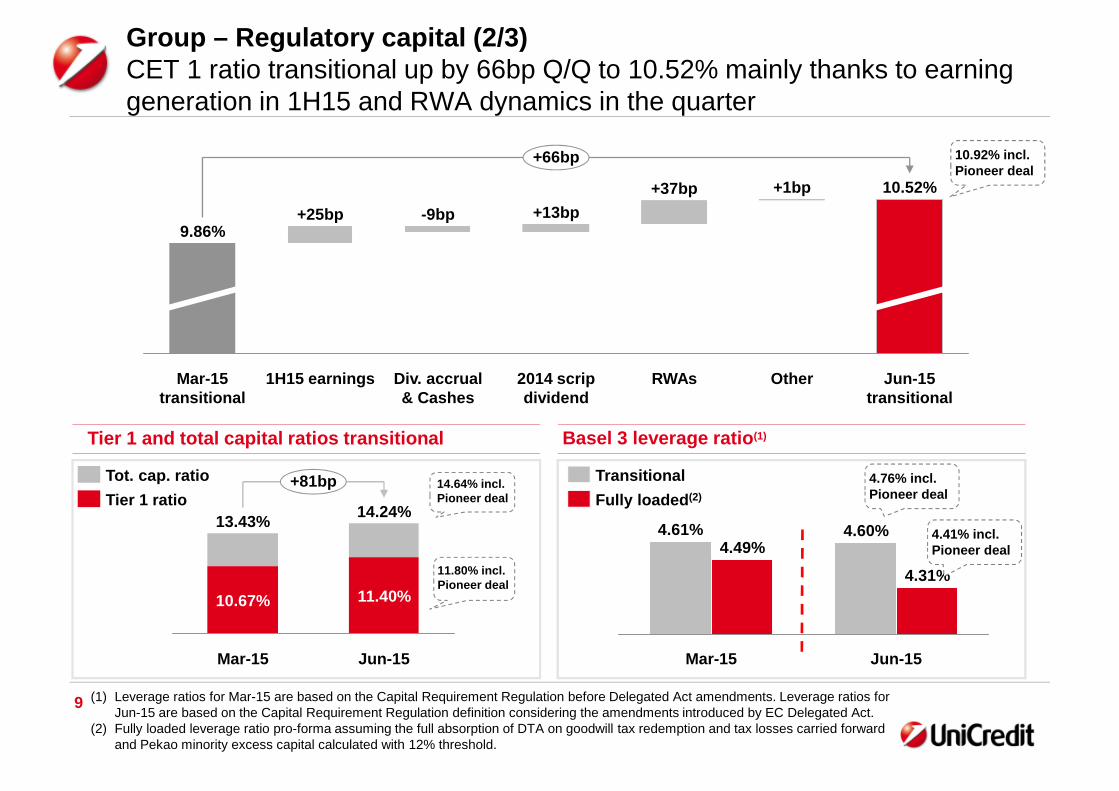
Group – Regulatory capital (2/3)CET 1 ratio transitional up by 66bp Q/Q to 10.52% mainly thanks to earninggeneration in 1H15 and RWA dynamics in the quarter
+66bp
Jun-15transitional
10.52%
Other
+1bp
RWAs
+37bp
2014 scripdividend
+13bp
Div. accrual& Cashes
-9bp
1H15 earnings
+25bp
Mar-15transitional
9.86%
Tier 1 and total capital ratios transitional Basel 3 leverage ratio(1)
Jun-15
4.31%
4.60%
Mar-15
4.49%4.61%
Fully loaded(2)
Transitional
11.80% incl.Pioneer deal
+81bp
Jun-15
14.24%
11.40%
Mar-15
13.43%
10.67%
(1) Leverage ratios for Mar-15 are based on the Capital Requirement Regulation before Delegated Act amendments. Leverage ratios forJun-15 are based on the Capital Requirement Regulation definition considering the amendments introduced by EC Delegated Act.
(2) Fully loaded leverage ratio pro-forma assuming the full absorption of DTA on goodwill tax redemption and tax losses carried forwardand Pekao minority excess capital calculated with 12% threshold.
10.92% incl.Pioneer deal
14.64% incl.Pioneer dealTier 1 ratio
Tot. cap. ratio 4.76% incl.Pioneer deal
4.41% incl.Pioneer deal

Jun-15
405.9
Hedging& other
-2.4
FX effect
-3.0
-2.5-0.5
Regulation &procyclicality
-2.8
Businessactions
-2.0
Businessevolution
-4.6
-0.4
-4.2
Mar-15
420.6
10
RWA eop, bn
Group – Regulatory capital (3/3)RWA decreased by 15bn q/q mainly due to credit and market risk components
RWA main drivers
Credit risk RWA reduction mainly driven by regulatory changes & procyclicality, FX effect, business actions(mainly securitizations) and business evolution (volume effect)
Market risk RWA dynamic mainly due to business evolution, amortization of FX hedging in CEE and FX effect
1925
19
+1.8%
-3.5%
Market
Credit
Mar-15
421
352
44
Jun-14
Operational
Jun-15
406
344
43
399
335
44
Credit
Market
- regulation -1.1bn- procyclicality -1.7bn
Other(1)
(1) Market, credit and operational RWA.

11
Group
Agenda
Non Core
Core Bank
Annex
Financials
Group
UniCredit Group - INTERNAL USE ONLY -
12
Net profit, m
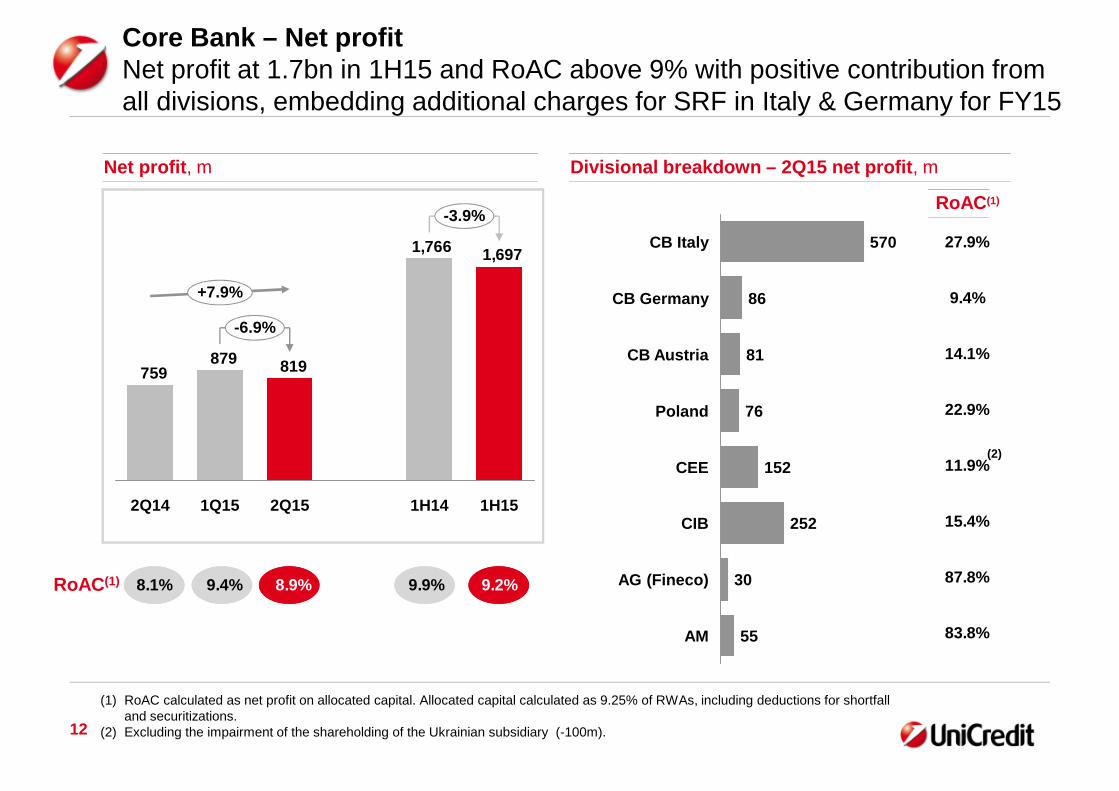
Core Bank – Net profitNet profit at 1.7bn in 1H15 and RoAC above 9% with positive contribution fromall divisions, embedding additional charges for SRF in Italy & Germany for FY15
AM 55
AG (Fineco) 30
CIB 252
CEE 152
Poland 76
CB Austria 81
CB Germany 86
CB Italy 570
Divisional breakdown – 2Q15 net profit, m
RoAC(1)
1,6971,766
819879759
-3.9%
-6.9%
1H151H142Q151Q152Q14
+7.9%
RoAC(1)
(1) RoAC calculated as net profit on allocated capital. Allocated capital calculated as 9.25% of RWAs, including deductions for shortfalland securitizations.
(2) Excluding the impairment of the shareholding of the Ukrainian subsidiary (-100m).
27.9%
9.4%
14.1%
22.9%
11.9%
15.4%
87.8%
83.8%
(2)
8.1% 9.4% 8.9% 9.9% 9.2%

UniCredit Group - INTERNAL USE ONLY -
13
Net operating profit, m
Revenues, m
Loan loss provisions, m
Costs, m
11,37711,167
5,6935,6855,686
+1.9%
+0.1%
1H151H142Q151Q152Q14
6,5506,418
3,3013,2493,185
1H142Q151Q152Q14
+2.0%
+1.6%
1H15
1,1851,123
615569599
+5.5%
+8.1%
1H151H142Q151Q152Q14
Core Bank – Net operating profitNet operating profit slightly up in 1H15 supported by higher revenues
3,6433,626
1,7761,8671,902
+0.5%
-4.9%
1H151H142Q151Q152Q14
UniCredit Group - INTERNAL USE ONLY -
14
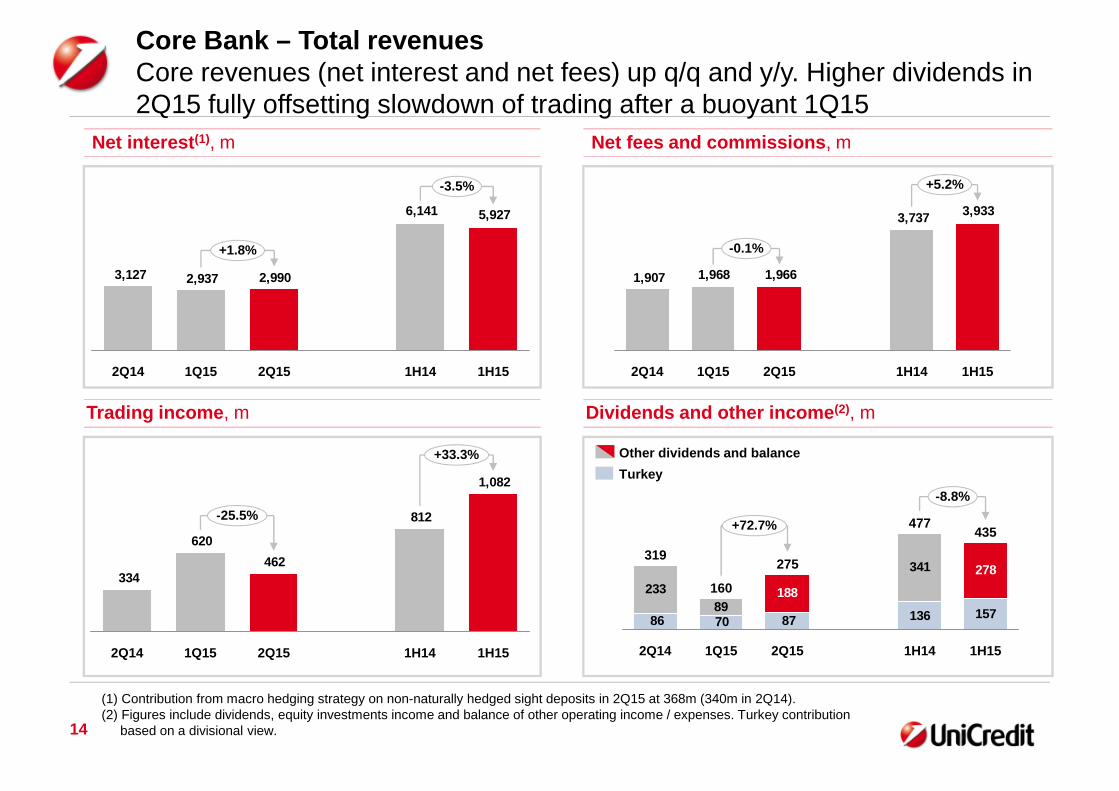
Core Bank – Total revenuesCore revenues (net interest and net fees) up q/q and y/y. Higher dividends in2Q15 fully offsetting slowdown of trading after a buoyant 1Q15
Net fees and commissions, m
Dividends and other income(2), m
136 157
233
89
341
877086
278
188
-8.8%
+72.7%
1H15
435
1H14
477
2Q15
275
1Q15
160
2Q14
319
Net interest(1), m
Trading income, m
5,9276,141
2,9902,9373,127
-3.5%
+1.8%
1H151H142Q151Q152Q14
1,082
812
462
620
334
+33.3%
-25.5%
1H151H142Q151Q152Q14
(1) Contribution from macro hedging strategy on non-naturally hedged sight deposits in 2Q15 at 368m (340m in 2Q14).(2) Figures include dividends, equity investments income and balance of other operating income / expenses. Turkey contribution
based on a divisional view.
Turkey
Other dividends and balance
3,9333,737
1,9661,9681,907
-0.1%
+5.2%
1H151H142Q151Q152Q14

UniCredit Group - INTERNAL USE ONLY -
15
Core Bank – Net interest incomeNet interest up in 2Q15 with deposits re-pricing mitigating the impact of lowcustomer rates on loans dynamics
Net interest bridge q/q , m
Loansvolume
-10
2,937
1Q15
+74
Days andFX effects
3,011
Baseline
+1.8%
2Q15
2,990
Mkt act.& other
+0
Termfunding
+20
Depositsrate
+101
Loansrate
-129
Depositsvolume
-3
Commercial dynamics: -21m
Euribor 3M
-5bpq/q
-5bpq/q
Commercial loans and rates, managerial data Commercial deposits and rates, managerial data
378375
3.35%
1Q15
3.45%
+0.8%(-0.3% cons. FX)
2Q15
364358
1Q15
+1.7%(+0.6% cons. FX)
2Q15
0.50%0.56%Cust. rates
Avg. vol., bn
Cust. rates
Avg. vol., bn

UniCredit Group - INTERNAL USE ONLY -
Core Bank – New origination in commercial banksMLT flows strongly up by over 37.6% in 1H15 at 15.4bn, driven by corporatesin Italy and Germany and households in Germany and Austria
CB Austria, m
CB Germany, m
CB Italy, m
New flows o/w household mortgages
5,2813,994
+32.2%
1H151H14
1,9011,055
+80.3%
1H151H14
1,6031,337
+19.9%
1H151H14
377204
+84.2%
1H151H14
8,488
5,843
+45.3%
1H151H14
1,7311,652
+4.7%
1H151H14
o/w mid corporates
570648
-12.0%
1H151H14
2,4422,185
+11.8%
1H151H14
3,769
1,892
+99.2%
1H151H14
16

UniCredit Group - INTERNAL USE ONLY -
17
Net fees and commissions, m Investment services fees, m
Transactional and banking services fees, m
Financing services fees, m
925947
457468489
-2.3%
-2.4%
1H151H142Q151Q152Q14
1,1111,101
566545566
+0.9%
+3.9%
1H151H142Q151Q152Q14
Core Bank – Fees and commissionsFees at almost 2bn in 2Q15, stable q/q and up y/y thanks to investment fees.Transactional fees up q/q mainly due to credit cards in CEE & Poland
3,9333,737
1,9661,9681,907
+5.2%
-0.1%
1H151H142Q151Q152Q14
2Q15
943
1Q15
954
2Q14
852
+12.3%
-1.2%
1H15
1,897
1H14
1,689
c.60% recurringfees(1)
(1) Non recurring fees from sales: upfront AUM + upfront AUC + Negotiation. Recurring fees from management (excludingperformance fees) + fees from AUC Custody.
AuM, bn
AuC, bn
253
247
295
241
298
259

UniCredit Group - INTERNAL USE ONLY -
18
Costs, m Staff expenses, m
Depreciation & amortization, m
Other administrative expenses(1), m
4,1504,013
2,0932,0571,967
+3.4%
+1.8%
1H151H142Q151Q152Q14
1,9501,971
9829681,000
-1.1%
+1.4%
1H151H142Q151Q152Q14
450434
226224218
+3.8%
+1.2%
1H151H142Q151Q152Q14
Core Bank – Total costsOther administrative expenses down in 1H15 due to lower discretionary costsmitigating the impact of staff expenses driven by variable compensation
6,5506,418
3,3013,2493,185
1Q15
+1.6%
+2.0%
1H151H142Q152Q14
Costincome
(1) Other administrative expenses net of expenses recovery.
FTE, k 126.5128.6 125.8
Branches, k 7.4 7.17.8
56% 57% 58% 57% 58%

UniCredit Group - INTERNAL USE ONLY -
19
1,1851,123
615569599
+5.5%
+8.1%
1H151H142Q151Q152Q14
Loan loss provisions, m
Core Bank – Loan loss provisionsLLP increased q/q due to CIB and CEE resulting in a cost of risk at 56bp in2Q15
Divisional breakdown – 2Q15 cost of risk, bp
q/q y/y
54
40
149
44
-25
21
78
AG (Fineco)
AM n.m.
CIB
CEE
Poland
CB Austria
CB Germany
CB Italy
Cost ofrisk
56bp 53bp 56bp 52bp 55bp
-7bp -12bp
+8bp +18bp
-48bp -29bp
-3bp -9bp
+29bp +30bp
+28bp -2bp
-30bp +6bp
n.m. n.m.

UniCredit Group - INTERNAL USE ONLY -
20
Group
Agenda
Non Core
Core Bank
Annex
Financials
Group
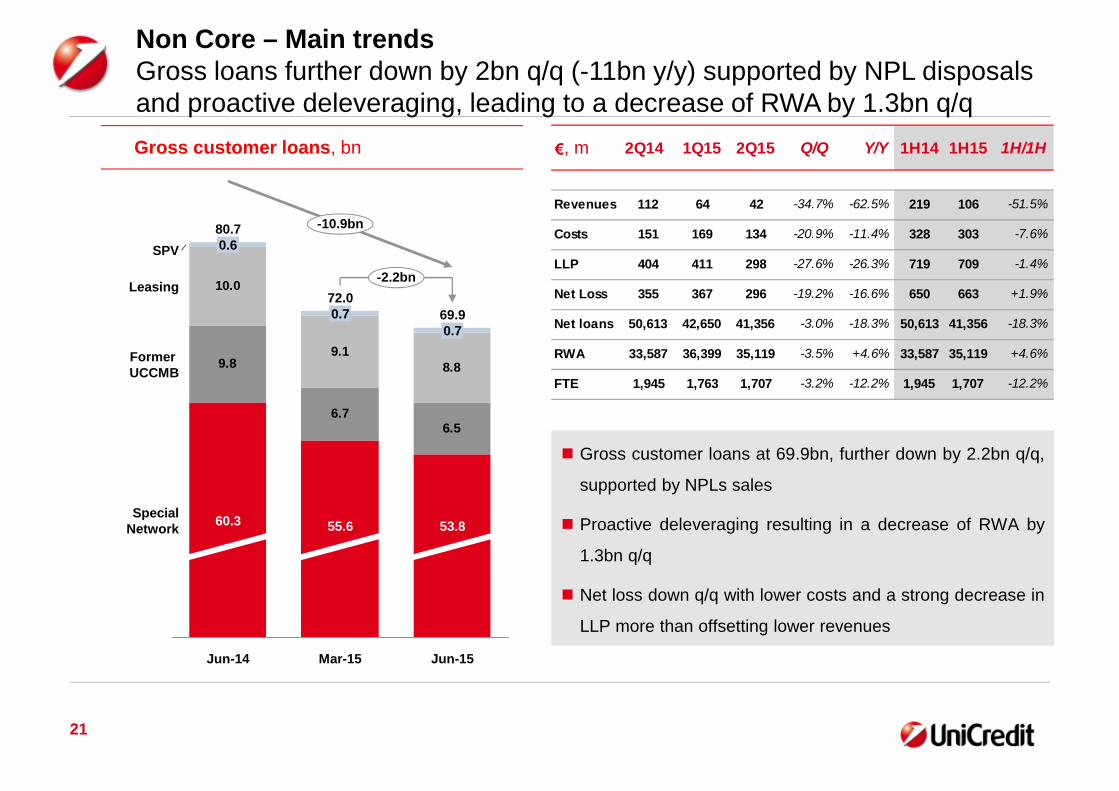
Non Core – Main trendsGross loans further down by 2bn q/q (-11bn y/y) supported by NPL disposalsand proactive deleveraging, leading to a decrease of RWA by 1.3bn q/q
6.76.5
9.18.89.8
10.0
60.3
80.7
Jun-14
0.6
-10.9bn
-2.2bn
0.7
SpecialNetwork
FormerUCCMB
Leasing
SPV
Jun-15
69.9
53.8
0.7
Mar-15
72.0
55.6
Gross customer loans, bn
21
Gross customer loans at 69.9bn, further down by 2.2bn q/q,
supported by NPLs sales
Proactive deleveraging resulting in a decrease of RWA by
1.3bn q/q
Net loss down q/q with lower costs and a strong decrease in
LLP more than offsetting lower revenues
€, m 2Q14 1Q15 2Q15 Q/Q Y/Y 1H14 1H15 1H/1H
Revenues 112 64 42 -34.7% -62.5% 219 106 -51.5%
Costs 151 169 134 -20.9% -11.4% 328 303 -7.6%
LLP 404 411 298 -27.6% -26.3% 719 709 -1.4%
Net Loss 355 367 296 -19.2% -16.6% 650 663 +1.9%
Net loans 50,613 42,650 41,356 -3.0% -18.3% 50,613 41,356 -18.3%
RWA 33,587 36,399 35,119 -3.5% +4.6% 33,587 35,119 +4.6%
FTE 1,945 1,763 1,707 -3.2% -12.2% 1,945 1,707 -12.2%

60,5%
22
Non Core – Asset qualityImpaired loans confirmed downward trend driven by continued other impairedreduction. Bad loans stabilizing with NPL sales balancing internal migrations
Gross impaired loans(1), bn
26.7 26.7 26.8 26.5 26.0
55.7
Dec-13
57.9 56.9
-5.5%-3.8%
Jun-15
53.7
Mar-15
54.9
Dec-14Jun-14
Coverageratio
Gross bad loans (sofferenze)(1), bn
Other gross impaired loans(1), bn
14.014.012.6 13.6 14.4
Dec-13 Dec-14
35.3 37.635.3
-3.1%-0.1%
Jun-15
36.4
Mar-15
36.3
Jun-14
Coverageratio
14.1 13.1 12.7 12.5 11.6
20.4
-9.5%-10.2%
Jun-15
17.3
Mar-15
18.6
Jun-14
19.3
Dec-13 Dec-14
22.6
Coverageratio
Netbad loans
Net otherimpaired
Netimpaired
(1) The perimeter of impaired exposures hereby shown as per instructions of BankIT Circular 272 is substantially equivalent to theperimeter of Non Performing Exposures (NPE) EBA.
51.6%51.8%52.1%
61.5%61.4%
32.8%33.0%36.0%
60.5%
53.8% 52.9%
34.0%
62.7%64.4%
37.3%

UniCredit Group - INTERNAL USE ONLY -
Concluding remarks
Group net profit over 1bn in 1H15 with a RoTE of 5%, already embedding the impact ofsystemic charges
Net operating profit up in 1H15 supported by higher revenues in the Core bankconfirming the strong commercial grip of our franchise
CET1 ratio fully loaded increased to 10.37%. Considering the normalization of financialmarket conditions and the Pioneer deal, CET1 ratio fully loaded at 10.84%. CET1 ratiotransitional at 10.52%, or 10.92% including the Pioneer deal
Group cost of risk down to 76bp in 2Q15 and coverage ratio on impaired loans at 51%
Asset quality further improving with gross impaired loans reduction supported by NPLsales and net outflows from impaired loans
Non Core de-risking progressing well with gross loans further down by 2.2bn q/q andRWA reduced by 1.3bn q/q
23

UniCredit Group - INTERNAL USE ONLY -
24
Group
Agenda
Non Core
Core Bank
Annex Non operating items Net interest items Italy Russia Balance sheet items AQ Group & Italy
Financials
Group

UniCredit Group - INTERNAL USE ONLY -
522
1,386
Profit frominvestments
-238
Net profitTax
-100
Restruct.costs
-121
PPA
-61
-2
Minorities
+18
Discont.operations
Other R&C
-163
Systemiccharges
-196
NetOperating
Profit
25
Non-operating items bridge, m
Group – Non operating itemsSystemic charges 196m, o/w 91m related to SRF for FY15 in Italy. Ukraine-146m due to impairment of shareholding (-100m) and 2Q15 results (-46m)
(1) Ukraine contribution based on a divisional view.
- 98m for SRF, 91mrelated to FY15 in Italy
- 65m for DGS- 33m for other banking
levies
o/w -146m forUkraine(1)
tax rate at22.8%
Non operating items
UniCredit Group - INTERNAL USE ONLY -
26
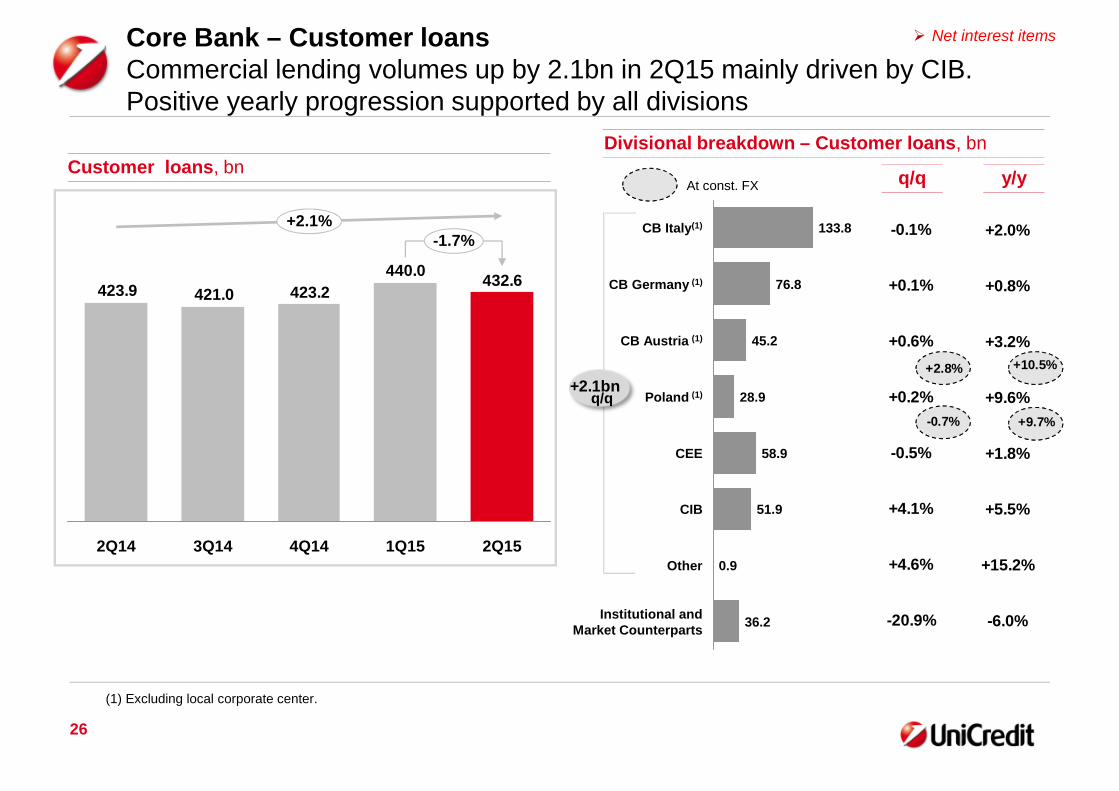
432.6440.0
423.2421.0423.9
4Q14
+2.1%-1.7%
1Q153Q142Q14 2Q15
Customer loans, bn
Core Bank – Customer loansCommercial lending volumes up by 2.1bn in 2Q15 mainly driven by CIB.Positive yearly progression supported by all divisions
Divisional breakdown – Customer loans, bn
q/q y/y
36.2
Other 0.9
Institutional andMarket Counterparts
CIB 51.9
CEE 58.9
Poland (1) 28.9
CB Austria (1) 45.2
CB Germany (1) 76.8
CB Italy(1) 133.8
q/q
At const. FX
(1) Excluding local corporate center.
-0.1%
+0.1%
+0.6%
+0.2%
-0.5%
+4.1%
+4.6%
-20.9%
+2.0%
+0.8%
+3.2%
+9.6%
+1.8%
+5.5%
+15.2%
-6.0%
+2.8% +10.5%
-0.7% +9.7%
+2.1bn
Net interest items

UniCredit Group - INTERNAL USE ONLY -
27
473.6
465.0
452.6
444.7445.4
+6.3%+1.8%
1Q154Q143Q14 2Q152Q14
Customer direct funding(1), bn
Core Bank – Customer direct fundingCommercial direct funding up by 3.9bn. Commercial banks and CEE & Polandare top contributors
Divisional breakdown – Direct funding, bn
q/q y/y
67.6
15.6
CIB 34.7
CEE 56.1
Poland(2) 30.2
CB Austria(2) 52.0
CB Germany(2) 73.2
CB Italy(2) 144.0
AG (Fineco)
Institutional andMarket Counterparts
(1) Customer direct funding: total customer deposits + customer securities in issue.(2) Excluding local corporate center.
q/q
At const. FX
-0.0%
+1.8%
-1.0%
+0.7%
+2.8%
+2.3%
+4.2%
+7.5%
+0.0%
+3.7%
+7.3%
+8.3%
+14.3%
+15.8%
+8.4%
+10.9%
+3.3% +9.1%
+2.2% +24.6%
+3.9bn
Net interest items

UniCredit Group - INTERNAL USE ONLY -
28
Core Bank – Net interestNet interest down on yearly basis mainly due to low customer rates on loans
Net interest bridge y/y (m)
-98
Loansvolume
-39
2Q15
3,127
+166
+119
-35
-382
Loansrate
Depositsvolume
2Q14
+131
-4.4%
Mkt act.& other
Termfunding
Depositsrate
3,091
FX effect
2,990
Baseline
Commercial dynamics: -27m
Euribor 3M
-30bpy/y
-30bpy/y
Net interest items
Commercial loans and rates, managerial data Commercial deposits and rates, managerial data
Cust. rates
Avg. vol., bn
Cust. rates
Avg. vol., bn378367
2Q15
+3.0%(-3.8% cons. FX)
3.35%
2Q14
3.80%
364343
0.50%
0.68%
2Q14
+6.0%(+6.7% cons. FX)
2Q15

UniCredit Group - INTERNAL USE ONLY -
Italian total perimeter(1)
Italian businesses net profit at 309m in 1H15, embedding non-recurring itemsin 2Q15 mainly related to SRF in Italy for FY15
Costs, m Net profit, m
-2.0%
-5.3%
1H15
2,552
1H14
2,694
2Q15
1,263
1Q15
1,289
2Q14
1,372
-8.0%
(1) Italian perimeter includes: Commercial Bank Italy, Non Core portfolio, CIB Italy, Asset Management related to funds distributed throughthe Italian network, Fineco, GBS related to relevant Italian activities, Corporate Center activities related to the Italian business.
Net fees and commissions, m
29
Net interest, m
-2.6%
+5.8%
1H15
2,224
1H14
2,101
2Q15
1,097
1Q15
1,127
2Q14
1,050
+4.4%
-1.3%
+3.0%
1H15
2,807
1H14
2,725
2Q15
1,394
1Q15
1,413
2Q14
1,326
+5.1%
-35.5%
-68.3%
1H15
309
1H14
479
2Q15
74
1Q15
235
2Q14
222
-66.5%
Italy
135m excl.SRF for FY15
370m excl.SRF for FY15

UniCredit Group - INTERNAL USE ONLY -
30
Core Bank – UniCredit Bank RussiaResilient business with positive performance in 2Q15 confirmed that UCG isbetter positioned than peers to weather a harsh environment
Positive progression of operating performance offsetting higher cost of risk aimed at increasing coverage ratio
Solid bank, net lender to Group with a further improved liquidity position
Resilient results with limited impact of EU sanctions on revenues
Proactive management of the lending portfolio with reduced exposures to retail unsecured and new volumesfrom top tier corporates
Ruble
44.5%
55.5%FX
Gross loans
Deposits
35.8%
Ruble
64.2%FX
Russia
€, m 2Q14 1Q15 2Q15Q/Q
curr. FX
Q/Q
const. FX
Y/Y
curr. FX
Y/Y
const. FX
Revenues 235 166 210 +26.1% +6.0% -10.6% +11.2%
o/w net interest 172 144 162 +12.7% -6.2% -5.8% +15.9%
o/w fees 37 12 17 +35.8% +14.8% -55.2% -43.9%
o/w trading profit 24 10 30 n.m. n.m. +27.4% +66.2%
Costs 69 51 60 +17.2% -2.1% -13.4% +7.0%
Gross Operating Profit 166 115 150 +30.1% +9.6% -9.4% +13.0%
Net operating profit 137 81 78 -3.9% -21.3% -43.2% -31.2%
Consolidated profit 110 63 61 -3.4% -20.9% -44.3% -32.5%
FTEs 3,973 3,960 3,911 -1.2% -1.6%
Cost/ Income 29.4% 30.6% 28.4% -2.2pp -0.9pp
Cost of risk 91bp 112bp 223bp +111bp +132bp
Loans to customers 13,374 13,242 12,698 -4.1% -4.2% -5.1% +27.7%
Direct funding 12,470 13,321 13,653 +2.5% +2.4% +9.5% +47.2%
Total RWA 16,677 17,431 16,796 -3.6% -3.8% +0.7% +35.4%

UniCredit Group - INTERNAL USE ONLY -
31
Group – Medium-long term funding plan2015 Group Funding Plan on track.2015 Funding Plan for Italy well ahead
Group Funding Plan 2015 well on track leveraging on diversified sources and geographies and taking advantageof the TLTRO take up for 7.9bn(3) in 2015
As of July 29th, 50% of Group funding plan 2015 realized for 13.3bn (72% for the funding plan for Italy)
(1) Inter-company funding not included.(2) Network bonds comprise only unsecured bonds placed through UCG commercial networks.(3) c.8bn at Group level, o/w 7.4bn in Italy and 0.5bn in Austria.
Funding mix, managerial data % of M/L term run offs by region(1)
% M/L Term Network bonds run offs(2)
Austria
Germany
Italy
2016
32.0bn
18%
24%
59%
2015
28.2bn
20%
28%
52%
2015 (planned)
26.6bn
2014 (realized)
24.6bn
18%
25%
14%
8%
13%
23%
Group retail network
Public sector & mortgages CBs
Supranational funding
Priv. plac. & schuldschein
Bank cap. bonds
Public market and wholesale MLT
2017
29.2bn
15%
17%
68%
10.1bn TLTROnot included
7.9bn TLTROnot included
32% 40% 40%
2015 (realized)
13.3bn
7%
30%
19%
7%
24%
12%
Geographical distribution
Balance Sheet items
Poland
0%Austria
20%
Germany
25%
Italy 55%

UniCredit Group - INTERNAL USE ONLY -
32
Group – Asset qualityAll regions confirm a sound asset quality position, with coverage ratios updespite a decrease of loan loss provisions and NPL disposals
Italy Core Germany
Austria Poland CEE
Coverage
Coverage
Net ratio
Grossimpairedloans (bn)
Grossimpairedloans (bn)
7.1 7.8 8.7 9.08.2
Jun-15Mar-15Dec-14Sep-14Jun-14
32
6.4 6.3 6.2 5.76.0
Jun-15Mar-15Dec-14Sep-14Jun-14
4.6 4.4 4.6 4.8
Jun-15
4.6
Mar-15Dec-14Sep-14Jun-14
2.0 1.9 1.9 2.1
Jun-15
2.0
Mar-15Dec-14Sep-14Jun-14
6.6 6.9 6.5 6.6
Jun-15
6.5
Mar-15Dec-14Sep-14Jun-14
Italy Core
Net ratio
Italy Non Core
55.7 56.5 56.9 54.9 53.7
Jun-15Mar-15Dec-14Sep-14Jun-14
43.4% 42.2% 40.9% 41.3% 43.2%
2.2% 2.6% 2.8% 2.8% 2.9%
52.1% 52.0% 52.9% 51.8% 51.6%
52.7% 54.9% 56.5% 62.0% 62.9%
43.5% 42.7% 38.6% 41.5% 43.8%
3.4% 3.2% 3.5% 3.2% 2.9%
60.0% 62.4% 61.7% 60.4% 60.9%
2.8% 2.6% 2.7% 2.9% 2.8%
61.3% 62.9% 64.2% 63.7% 64.5%
2.9% 2.7% 2.6% 2.6% 2.5%
50.8% 49.5% 51.0% 50.5% 52.2%
6.2% 6.6% 6.2% 6.0% 5.8%
AQ Italy & Group

UniCredit Group - INTERNAL USE ONLY -
33
30.7 31.6 31.630.5 31.1
62.8
-2.5% -1.8%
Jun-15Mar-15
63.6
Dec-14
65.1
Jun-14
62.8
Dec-13
64.5
Italy – Asset quality breakdownGross impaired continued reduction due to net outflows from impaired loans.Coverage ratio above 50% despite NPL sales in the quarter
Netimpaired
Coverageratio
Netimpairedloan ratio
14.1 14.714.613.0 15.2
Dec-14
39.5
Jun-14
36.7
Dec-13
36.5
+0.6% -1.4%
Jun-15
39.0
Mar-15
38.6
17.5 16.6 17.0 16.9 15.9
Mar-15
26.1 25.6
Jun-14
-7.1%
Jun-15
23.8
Dec-13
27.9
Dec-14
25.0
-6.6%
Coverageratio
Netbad loans
Coverageratio
Net otherimpaired
Gross impaired loans, bn(1)
Other gross impaired loans, bn
Gross bad loans (Sofferenze), bn
(1) The perimeter of impaired exposures hereby shown as per instructions of BankIT Circular 272 is substantially equivalent to theperimeter of Non Performing Exposures (NPE) EBA.
(2) Average quarterly net flows to impaired based to 100 as of 1H11. Net inflows defined as inflows (from gross performing loans togross impaired loans) – outflows (collections and flows from gross impaired loans back to performing loans).
AQ Italy & Group
Net inflows to impaired(2), base 1H11
37.3% 36.3% 32.6% 33.1%33.6%
60.9%61.9%61.6%64.5% 63.0%12.7% 13.3% 14.3% 14.0% 14.3%
52.7% 51.1% 51.4% 50.4% 50.4%
100 100
225
369
225259
42126
-281H11 2H11 1H12 2H12 1H13 2H13 1H14 2H14 1H15

UniCredit Group - INTERNAL USE ONLY -
34
Group
Agenda
Non Core
Core Bank
Annex
Financials
Group

UniCredit Group - INTERNAL USE ONLY -
35
Group – P&L and volumesNet profit at 1bn in 1H15 despite c.200m related to SRF, booked in Italy,Germany and Austria for FY15
Euro (m) 1Q14 2Q14 3Q14 4Q14 1Q15 2Q15 ∆ % vs. ∆ % vs. 1H14 1H15 ∆ % vs.
1Q15 2Q14 1H14
Total Revenues 5,588 5,798 5,561 5,604 5,749 5,735 -0.3% ▼ -1.1% ▼ 11,387 11,484 +0.9% ▲
Operating Costs -3,410 -3,336 -3,328 -3,432 -3,418 -3,435 +0.5% ▲ +3.0% ▲ -6,747 -6,853 +1.6% ▲
Gross Operating Profit 2,178 2,462 2,233 2,172 2,331 2,299 -1.4% ▼ -6.6% ▼ 4,640 4,631 -0.2% ▼
LLP -838 -1,003 -754 -1,697 -980 -913 -6.9% ▼ -9.0% ▼ -1,842 -1,893 +2.8% ▲
Profit Before Taxes 1,275 1,171 1,285 360 1,080 1,043 -3.5% ▼ -10.9% ▼ 2,446 2,123 -13.2% ▼
Net Profit 712 403 722 170 512 522 +2.0% ▲ +29.5% ▲ 1,116 1,034 -7.3% ▼
Cost / Income Ratio, % 61% 58% 60% 61% 59% 60% +0.5pp ▲ +2pp ▲ 59% 60% +0.4pp ▲
Cost of Risk, bp 69 84 64 144 82 76 -6bp ▼ -7bp ▼ 76bp 79bp +3bp ▲
RoTE 7.0% 3.9% 6.9% 1.6% 4.8% 4.9% +0.1pp ▲ +1.0pp ▲ 5.8% 5% -0.9pp ▼
Customer Loans 483,782 474,798 470,356 470,569 482,658 473,930 -1.8% -0.2% 474,798 473,930 -0.2%
Direct Funding 560,163 561,005 554,908 560,688 573,787 580,859 +1.2% +3.5% 561,005 580,859 +3.5%
Total RWA 418,871 398,702 401,238 409,223 420,637 405,897 -3.5% +1.8% 398,702 405,897 +1.8%
FTE (#) 131,333 130,577 129,958 129,021 128,263 127,475 -0.6% -2.4% 130,577 127,475 -2.4%

UniCredit Group - INTERNAL USE ONLY -
36
Core Bank – P&L and volumesRevenues up in 1H15 supporting a positive progression of GOP
Euro (m) 1Q14 2Q14 3Q14 4Q14 1Q15 2Q15 ∆ % vs. ∆ % vs. 1H14 1H15 ∆ % vs.
1Q15 2Q14 1H14
Total Revenues 5,481 5,686 5,476 5,531 5,685 5,693 +0.1% ▲ +0.1% ▲ 11,167 11,377 +1.9% ▲
Operating Costs -3,233 -3,185 -3,181 -3,309 -3,249 -3,301 +1.6% ▲ +3.6% ▲ -6,418 -6,550 +2.0% ▲
Gross Operating Profit 2,248 2,501 2,295 2,222 2,436 2,391 -1.8% ▼ -4.4% ▼ 4,749 4,827 +1.7% ▲
LLP -523 -599 -256 -759 -569 -615 +8.1% ▲ +2.6% ▲ -1,123 -1,185 +5.5% ▲
Profit Before Taxes 1,680 1,683 1,849 1,388 1,610 1,480 -8.0% ▼ -12.1% ▼ 3,364 3,090 -8.1% ▼
Net Profit 1,008 759 1,099 856 879 819 -6.9% ▼ +7.9% ▲ 1,766 1,697 -3.9% ▼
Cost / Income Ratio, % 59% 56% 58% 60% 57% 58% +0.8pp ▲ +2.0pp ▲ 57% 58% +0.1pp ▲
Cost of Risk, bp 49 56 24 72 53 56 +4bp ▲ = ▲ 52bp 55bp +2bp ▲
RoAC 11.9% 8.1% 13.6% 9.7% 9.4% 8.9% -0.5pp ▼ +0.8pp ▲ 9.9% 9.2% -0.7pp ▼
Customer Loans 431,745 424,185 420,974 423,167 440,008 432,574 -1.7% +2.0% 424,185 432,574 +2.0%
Direct Funding 557,852 558,655 552,571 558,343 571,557 579,024 +1.3% +3.6% 558,655 579,024 +3.6%
Total RWA 382,938 365,115 367,925 369,677 384,237 370,778 -3.5% +1.6% 365,115 370,778 +1.6%
FTE (#) 129,352 128,632 128,035 127,172 126,500 125,768 -0.6% -2.2% 128,632 125,768 -2.2%

UniCredit Group - INTERNAL USE ONLY -
37
Commercial Bank Italy – P&L and volumesPositive progression in 1H15 thanks to sound earnings generation
Euro (m) 1Q14 2Q14 3Q14 4Q14 1Q15 2Q15 ∆ % vs. ∆ % vs. 1H14 1H15 ∆ % vs.
1Q15 2Q14 1H14
Total Revenues 2,134 2,167 2,049 2,064 2,204 2,226 +1.0% ▲ +2.8% ▲ 4,301 4,430 +3.0% ▲
Operating Costs -1,053 -1,006 -989 -1,053 -1,057 -1,063 +0.6% ▲ +5.6% ▲ -2,059 -2,120 +2.9% ▲
Gross Operating Profit 1,081 1,161 1,060 1,011 1,147 1,163 +1.4% ▲ +0.2% ▲ 2,241 2,310 +3.1% ▲
LLP -280 -294 -132 -329 -280 -260 -6.9% ▼ -11.6% ▼ -574 -540 -5.9% ▼
Profit Before Taxes 785 816 892 664 850 846 -0.5% ▼ +3.8% ▲ 1,600 1,696 +6.0% ▲
Net Profit 497 538 573 420 566 570 +0.6% ▲ +5.9% ▲ 1,035 1,136 +9.8% ▲
Cost / Income Ratio, % 49% 46% 48% 51% 48% 48% -0.2pp ▼ +1.3pp ▲ 48% 48% -0.0pp ▼
Cost of Risk, bp 85 89 40 101 85 78 -7bp ▼ -12bp ▼ 87bp 81bp -6bp ▼
RoAC 26.8% 29.7% 29.5% 21.8% 27.2% 27.9% +0.7pp ▲ -1.8pp ▼ 28.2% 27.5% -0.7pp ▼
Customer Loans 132,303 131,471 130,571 130,190 134,106 134,063 -0.0% +2.0% 131,471 134,063 +2.0%
Direct Funding 147,921 144,132 142,516 145,347 144,209 144,222 +0.0% +0.1% 144,132 144,222 +0.1%
Total RWA 79,108 78,327 80,114 80,591 83,200 80,464 -3.3% +2.7% 78,327 80,464 +2.7%
FTE (#) 37,536 37,579 37,261 37,264 37,133 37,249 +0.3% -0.9% 37,579 37,249 -0.9%

UniCredit Group - INTERNAL USE ONLY -
38
Commercial Bank Germany – P&L and volumesStrong quarterly progression with higher revenues (NII and trading) and costreduction more than offsetting LLP increase
Euro (m) 1Q14 2Q14 3Q14 4Q14 1Q15 2Q15 ∆ % vs. ∆ % vs. 1H14 1H15 ∆ % vs.
1Q15 2Q14 1H14
Total Revenues 691 677 638 636 646 707 +9.6% ▲ +4.5% ▲ 1,368 1,353 -1.1% ▼
Operating Costs -512 -498 -522 -527 -519 -507 -2.3% ▼ +1.7% ▲ -1,010 -1,026 +1.6% ▲
Gross Operating Profit 179 179 116 109 127 201 +58.1% ▲ +12.2% ▲ 358 327 -8.5% ▼
LLP -15 -5 18 -25 -24 -41 +69.7% ▲ +813.4% ▲ -20 -66 +236.0% ▲
Profit Before Taxes 156 169 108 235 66 128 +93.4% ▲ -24.3% ▼ 325 194 -40.4% ▼
Net Profit 104 113 73 214 43 86 +101.6% ▲ -23.6% ▼ 216 129 -40.4% ▼
Cost / Income Ratio, % 74% 74% 82% 83% 80% 72% -8.7pp ▼ -2.0pp ▼ 74% 76% +2.0pp ▲
Cost of Risk, bp 8 2 -9 13 12 21 +8bp ▲ +18bp ▲ 5bp 17bp +12bp ▲
RoAC 9.7% 11.1% 5.9% 25.5% 2.8% 9.4% +6.6pp ▲ -1.6pp ▼ 10.4% 6.1% -4.3pp ▼
Customer Loans 78,537 78,783 78,765 78,416 79,256 79,563 +0.4% +1.0% 78,783 79,563 +1.0%
Direct Funding 105,562 104,709 102,044 102,236 101,088 101,978 +0.9% -2.6% 104,709 101,978 -2.6%
Total RWA 35,388 32,879 33,780 33,608 33,334 31,121 -6.6% -5.3% 32,879 31,121 -5.3%
FTE (#) 13,586 13,505 13,580 13,422 13,051 12,326 -5.6% -8.7% 13,505 12,326 -8.7%

UniCredit Group - INTERNAL USE ONLY -
39
Commercial Bank Austria – P&L and volumesRevenues increase and LLP release underpin recovery in 2Q15.Cost of risk confirmed the high quality of the loan book
Euro (m) 1Q14 2Q14 3Q14 4Q14 1Q15 2Q15 ∆ % vs. ∆ % vs. 1H14 1H15 ∆ % vs.
1Q15 2Q14 1H14
Total Revenues 410 471 402 425 369 405 +9.8% ▲ -14.0% ▼ 881 774 -12.2% ▼
Operating Costs -345 -343 -328 -356 -339 -338 -0.3% ▼ -1.5% ▼ -688 -678 -1.5% ▼
Gross Operating Profit 65 127 74 69 30 67 +125.8% ▲ -47.7% ▼ 193 96 -50.1% ▼
LLP -48 -4 -17 -41 -27 31 n.m. ▼ n.m. ▼ -53 3 n.m. ▼
Profit Before Taxes 36 80 38 -22 -38 63 n.m. ▲ -21.5% ▼ 115 25 -78.6% ▼
Net Profit 33 84 78 -46 -21 81 n.m. ▲ -3.5% ▼ 117 60 -49.0% ▼
Cost / Income Ratio, % 84% 73% 82% 84% 92% 84% -8.5pp ▼ +10.6pp ▲ 78% 88% +9.4pp ▲
Cost of Risk, bp 40 4 14 35 23 -25 -48bp ▼ -29bp ▼ 22bp -1bp -23bp ▼
RoAC 5.8% 14.3% 12.9% -10.4% -3.6% 14.1% +17.7pp ▲ -0.2pp ▼ 10.1% 5.2% -4.9pp ▼
Customer Loans 47,877 48,083 47,442 47,379 48,744 48,785 +0.1% +1.5% 48,083 48,785 +1.5%
Direct Funding 60,225 59,920 62,877 63,442 65,119 63,847 -2.0% +6.6% 59,920 63,847 +6.6%
Total RWA 27,169 23,838 24,080 24,047 28,273 24,582 -13.1% +3.1% 23,838 24,582 +3.1%
FTE (#) 6,803 6,634 6,751 6,701 6,614 6,565 -0.7% -1.0% 6,634 6,565 -1.0%
Starting from 2Q15 some activities that Bank Austria carries out in its capacity of sub-holding for CEE countries, have been shiftedfrom Commercial Bank Austria to CEE division. These activities mainly refer to Corporate Center. Previous quarters have beenrestated accordingly.

UniCredit Group - INTERNAL USE ONLY -
40
Poland – P&L and volumesNet profit slightly up q/q confirming a sound progression of RoAC.Cost of risk confirmed a sound downward trend
N.B. Variations at constant FX.
Euro (m) 1Q14 2Q14 3Q14 4Q14 1Q15 2Q15 ∆ % vs. ∆ % vs. 1H14 1H15 ∆ % vs.
1Q15 2Q14 1H14
Total Revenues 431 448 450 440 433 435 -1.9% ▼ -4.7% ▼ 879 868 -2.1% ▼
Operating Costs -200 -203 -202 -194 -190 -201 +3.2% ▲ -2.7% ▼ -404 -392 -3.8% ▼
Gross Operating Profit 230 245 248 246 242 234 -5.8% ▼ -6.3% ▼ 475 476 -0.6% ▼
LLP -35 -34 -32 -32 -33 -32 -5.2% ▼ -8.9% ▼ -69 -65 -7.9% ▼
Profit Before Taxes 186 202 208 207 185 187 -1.5% ▼ -9.1% ▼ 388 372 -5.0% ▼
Net Profit 76 83 84 84 75 76 -0.7% ▼ -9.9% ▼ 158 151 -5.5% ▼
Cost / Income Ratio, % 47% 45% 45% 44% 44% 46% +2.3pp ▲ +0.9pp ▲ 46% 45% -0.8pp ▼
Cost of Risk, bp 56 53 49 48 47 44 -4bp ▼ -9bp ▼ 54bp 46bp -9bp ▼
RoAC 23.6% 26.3% 27.1% 26.6% 22.4% 22.9% -4.2pp ▼ -3.5pp ▼ 25.0% 22.6% -2.3pp ▼
Customer Loans 25,540 26,384 26,449 26,896 28,798 28,815 +2.6% +10.1% 26,384 28,815 +10.1%
Direct Funding 27,439 28,362 29,685 30,178 30,670 30,784 +3.0% +9.4% 28,362 30,784 +9.4%
Total RWA 25,311 24,760 25,234 25,894 26,862 25,618 -2.2% +4.3% 24,760 25,618 +4.3%
FTE (#) 18,194 18,134 17,983 18,160 18,043 17,916 -0.7% -1.2% 18,134 17,916 -1.2%

UniCredit Group - INTERNAL USE ONLY -
41
CEE – P&L and volumesGeographical diversification delivered continued improvement of operatingprofitability mitigating the impact of higher LLP (mostly related to Russia)
N.B. Variations at constant FX.
Euro (m) 1Q14 2Q14 3Q14 4Q14 1Q15 2Q15 ∆ % vs. ∆ % vs. 1H14 1H15 ∆ % vs.
1Q15 2Q14 1H14
Total Revenues 888 974 1,064 908 909 982 +4.4% ▲ +6.2% ▲ 1,862 1,891 +8.5% ▲
Operating Costs -369 -369 -379 -393 -350 -372 +2.5% ▲ +4.7% ▲ -738 -722 +3.3% ▲
Gross Operating Profit 519 605 686 515 558 610 +5.6% ▲ +7.1% ▲ 1,124 1,168 +11.9% ▲
LLP -148 -168 -156 -204 -174 -220 +26.3% ▲ +44.4% ▲ -317 -394 +37.4% ▲
Profit Before Taxes 311 375 414 277 323 357 +3.5% ▲ -0.7% ▼ 685 681 +6.3% ▲
Net Profit 247 283 294 112 178 152 -8.0% ▼ -57.2% ▼ 530 330 -53.3% ▼
Cost / Income Ratio, % 42% 38% 36% 43% 39% 38% -0.7pp ▲ -0.5pp ▲ 40% 38% -1.9pp ▼
Cost of Risk, bp 105 118 107 142 120 149 +32bp ▲ +35bp ▲ 112bp 135bp +25bp ▲
RoAC 13.5% 15.4% 16.7% 5.5% 8.5% 7.2% -1.3pp ▼ -8.2pp ▼ 14.5% 7.9% -6.6pp ▼
Customer Loans 55,886 57,846 58,449 57,073 59,142 58,870 -0.7% +9.7% 57,846 58,870 +9.7%
Direct Funding 48,011 49,071 50,768 52,213 54,533 56,073 +2.8% +24.2% 49,071 56,073 +24.2%
Total RWA 83,492 81,786 84,635 89,278 93,340 93,461 +1.1% +23.7% 81,786 93,461 +23.7%
FTE (#) 30,623 30,097 29,576 29,040 28,918 28,834 -0.3% -4.2% 30,097 28,834 -4.2%
Starting from 2Q15 some activities that Bank Austria carries out in its capacity of sub-holding for CEE countries, have been shiftedfrom Commercial Bank Austria to CEE division. These activities mainly refer to Corporate Center. Previous quarters have beenrestated accordingly.

UniCredit Group - INTERNAL USE ONLY -
42
Customer Loans and Customer Deposits exclude repos, Market and Institutional counterparts.
CIB – P&L and volumesNet profit strongly up y/y with revenues supporting operating profitability
Euro (m) 1Q14 2Q14 3Q14 4Q14 1Q15 2Q15 ∆ % vs. ∆ % vs. 1H14 1H15 ∆ % vs.
1Q15 2Q14 1H14
Total Revenues 991 900 812 1,036 1,056 993 -5.9% ▼ +10.3% ▲ 1,892 2,049 +8.3% ▲
Operating Costs -436 -410 -414 -391 -443 -457 +3.3% ▲ +11.6% ▲ -845 -900 +6.4% ▲
Gross Operating Profit 556 490 398 645 613 536 -12.6% ▼ +9.3% ▲ 1,046 1,149 +9.8% ▲
LLP 0 -97 68 -100 -28 -92 +232.3% ▲ n.m. ▼ -97 -120 +23.0% ▲
Profit Before Taxes 568 299 457 475 514 381 -25.9% ▼ +27.6% ▲ 867 895 +3.2% ▲
Net Profit 387 197 263 396 355 252 -29.0% ▼ +27.6% ▲ 584 606 +3.8% ▲
Cost / Income Ratio, % 44% 46% 51% 38% 42% 46% +4.1pp ▲ +0.5pp ▲ 45% 44% -0.8pp ▼
Cost of Risk, bp 0 42 -32 46 12 40 +28bp ▲ -2bp ▼ 21bp 26bp +5bp ▲
RoAC 22.3% 11.2% 16.9% 20.9% 20.4% 15.4% -5.0pp ▼ +4.2pp ▲ 16.7% 18.0% +1.3pp ▲
Commercial Loans 49,800 49,226 47,307 50,109 49,905 51,934 +4.1% +5.5% 49,226 51,934 +5.5%
Commercial Deposits 28,084 28,776 29,829 30,686 32,753 33,386 +1.9% +16.0% 28,776 33,386 +16.0%
Total RWA 76,847 70,421 70,269 67,510 71,375 67,494 -5.4% -4.2% 70,421 67,494 -4.2%
FTE (#) 4,050 3,958 3,950 3,955 3,963 3,986 +0.6% +0.7% 3,958 3,986 +0.7%

UniCredit Group - INTERNAL USE ONLY -
43
Asset Gathering (Fineco) – P&L and volumesRevenues strongly up y/y confirming positive trends in all product areas.Strong net sales delivered record high TFA and AuM
Euro (m) 1Q14 2Q14 3Q14 4Q14 1Q15 2Q15 ∆ % vs. ∆ % vs. 1H14 1H15 ∆ % vs.
1Q15 2Q14 1H14
Total Revenues 113 113 107 118 137 131 -4.1% ▼ +16.1% ▲ 226 268 +18.5% ▲
Operating Costs -52 -55 -51 -54 -60 -60 -0.1% ▼ +8.2% ▲ -107 -120 +11.9% ▲
Gross Operating Profit 61 58 56 64 77 71 -7.3% ▼ +23.6% ▲ 119 148 +24.3% ▲
LLP 0 -1 -1 -1 -2 -1 -29.9% ▼ +34.4% ▲ -1 -3 +108.6% ▲
Profit Before Taxes 58 57 55 60 72 69 -3.9% ▼ +21.1% ▲ 115 141 +23.2% ▲
Net Profit 37 37 23 27 31 30 -3.9% ▼ -18.8% ▼ 74 61 -17.0% ▼
Cost / Income Ratio, % 46% 49% 48% 46% 44% 46% +1.8pp ▲ -3.3pp ▼ 47% 45% -2.6pp ▼
Cost of Risk, bp 28 48 39 69 85 54 -30bp ▼ +6bp ▲ 39bp 69bp +30bp ▲
RoAC 85.8% 93.1% 89.8% 107.2% 118.7% 87.8% -30.9pp ▼ -5.3pp ▼ 89.3% 101.3% +11.9pp ▲
TFA 45,607 47,196 48,181 49,341 53,711 53,798 +0.2% +14.0%
o.w. AuM 20,281 21,563 22,563 23,636 26,121 26,169 +0.2% +21.4%
Customer Loans 669 696 700 696 797 836 +4.9% +20.1% 696 836 +20.1%
Direct Funding 13,969 14,344 14,097 14,254 14,922 15,554 +4.2% +8.4% 14,344 15,554 +8.4%
Total RWA 1,905 1,635 1,624 1,742 1,735 1,722 -0.8% +5.3% 1,635 1,722 +5.3%
FTE (#) 935 944 953 974 990 992 +0.2% +5.1% 944 992 +5.1%

UniCredit Group - INTERNAL USE ONLY -
44
Asset Management – P&L and volumesNet profit in 1H15 at 117m, up by 25% y/y thanks to strong fee generationmore than offsetting cost increase
Euro (m) 1Q14 2Q14 3Q14 4Q14 1Q15 2Q15 ∆ % vs. ∆ % vs. 1H14 1H15 ∆ % vs.
1Q15 2Q14 1H14
Total Revenues 185 191 199 217 227 228 +0.2% ▲ +19.3% ▲ 376 455 +20.9% ▲
Operating Costs -120 -123 -125 -129 -138 -150 +8.8% ▲ +22.1% ▲ -242 -288 +18.6% ▲
Gross Operating Profit 66 68 74 87 89 78 -13.1% ▼ +14.5% ▲ 134 167 +25.1% ▲
LLP 0 0 0 0 0 0 n.m. n.m. 0 0 n.m.
Profit Before Taxes 67 66 72 81 88 70 -19.8% ▼ +6.7% ▲ 133 158 +19.3% ▲
Net Profit 47 47 48 36 62 55 -12.5% ▼ +16.7% ▲ 94 117 +25.0% ▲
Cost / Income Ratio, % 65% 64% 63% 60% 61% 66% +5.2pp ▲ +1.5pp ▲ 64% 63% -1.2pp ▼
Cost of Risk, bp n.m. n.m. n.m. n.m. n.m. n.m. n.m. n.m. n.m. n.m. n.m.
RoAC 70.3% 70.3% 71.7% 54.3% 93.8% 83.8% -10.0pp ▼ +13.5pp ▲ 70.3% 88.8% +18.5pp ▲
TFA 187,020 193,230 203,546 208,694 231,810 227,483 -1.9% ▼ +17.7% ▲ 193,230 227,483 +17.7% ▲
o.w. AuM 179,463 185,522 195,713 201,030 224,960 220,875 -1.8% ▼ +19.1% ▲ 185,522 220,875 +19.1% ▲
Total RWA 2,097 1,619 1,520 1,693 1,749 1,875 +7.2% ▲ +15.8% ▲ 1,619 1,875 +15.8% ▼
FTE (#) 2,007 2,021 2,044 2,021 2,035 2,037 +0.1% ▲ +0.8% ▲
UniCredit Group - INTERNAL USE ONLY -
45
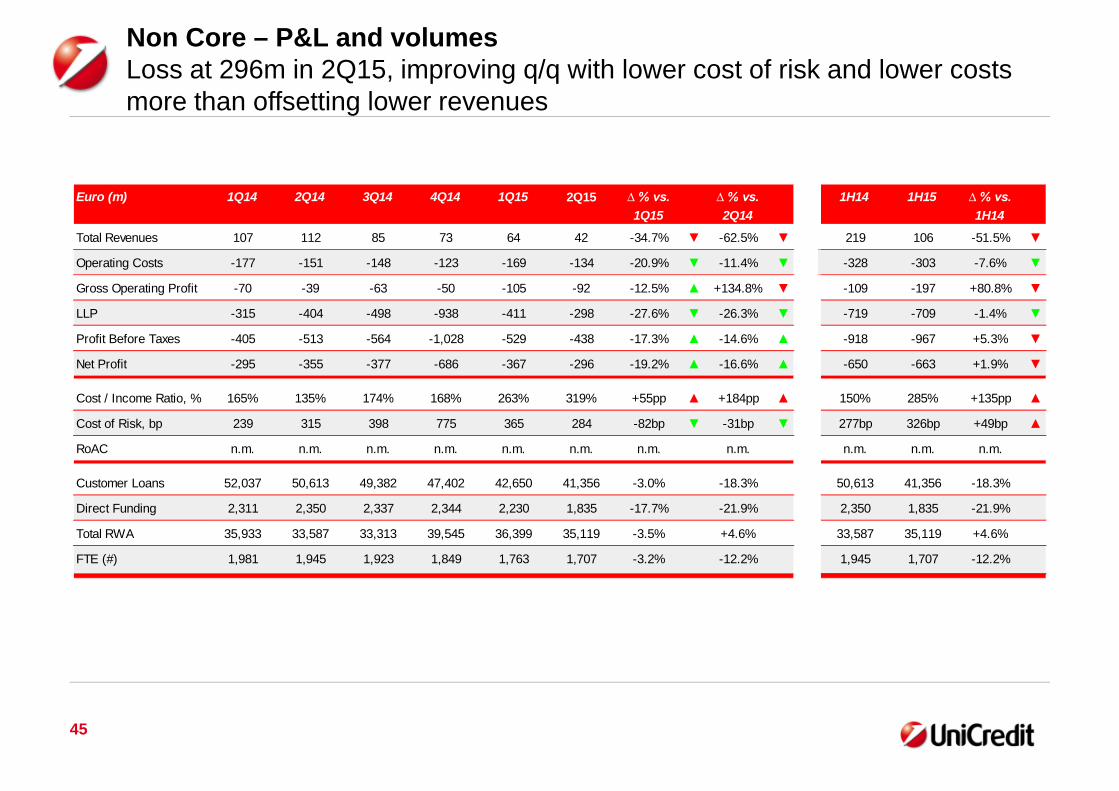
Non Core – P&L and volumesLoss at 296m in 2Q15, improving q/q with lower cost of risk and lower costsmore than offsetting lower revenues
Euro (m) 1Q14 2Q14 3Q14 4Q14 1Q15 2Q15 ∆ % vs. ∆ % vs. 1H14 1H15 ∆ % vs.
1Q15 2Q14 1H14
Total Revenues 107 112 85 73 64 42 -34.7% ▼ -62.5% ▼ 219 106 -51.5% ▼
Operating Costs -177 -151 -148 -123 -169 -134 -20.9% ▼ -11.4% ▼ -328 -303 -7.6% ▼
Gross Operating Profit -70 -39 -63 -50 -105 -92 -12.5% ▲ +134.8% ▼ -109 -197 +80.8% ▼
LLP -315 -404 -498 -938 -411 -298 -27.6% ▼ -26.3% ▼ -719 -709 -1.4% ▼
Profit Before Taxes -405 -513 -564 -1,028 -529 -438 -17.3% ▲ -14.6% ▲ -918 -967 +5.3% ▼
Net Profit -295 -355 -377 -686 -367 -296 -19.2% ▲ -16.6% ▲ -650 -663 +1.9% ▼
Cost / Income Ratio, % 165% 135% 174% 168% 263% 319% +55pp ▲ +184pp ▲ 150% 285% +135pp ▲
Cost of Risk, bp 239 315 398 775 365 284 -82bp ▼ -31bp ▼ 277bp 326bp +49bp ▲
RoAC n.m. n.m. n.m. n.m. n.m. n.m. n.m. n.m. n.m. n.m. n.m.
Customer Loans 52,037 50,613 49,382 47,402 42,650 41,356 -3.0% -18.3% 50,613 41,356 -18.3%
Direct Funding 2,311 2,350 2,337 2,344 2,230 1,835 -17.7% -21.9% 2,350 1,835 -21.9%
Total RWA 35,933 33,587 33,313 39,545 36,399 35,119 -3.5% +4.6% 33,587 35,119 +4.6%
FTE (#) 1,981 1,945 1,923 1,849 1,763 1,707 -3.2% -12.2% 1,945 1,707 -12.2%