Embed Size (px)
Citation preview

August 12, 2015
2Q15 EARNINGS RELEASE

2
Highlights | Corporate
The only Brazil’s mixed market player that features exposure and expansion capacity
in the segments of Retail, Hospital & Specialties and Distribution;
Strategic partnership with AmerisourceBergen, the world’s largest player in the
pharmaceutical specialties, resulting in the creation of the company Profarma
Specialty;
The Company carried out four acquisitions over the last three years, including its
entry into the Retail pharmaceutical segment, and the attainment of a market position
as one of the major players within this segment in the state of Rio de Janeiro;
Proven capacity to integrate acquisitions, combining all group companies in the SAP
plataform.

3
Highlights | 2Q15
CONSOLIDATED (considering 100% of all companies)
• Consolidated EBITDA rose by 54.8% from 2Q14 to R$37.7
million, with EBITDA margin of 3.6%;
• Gross margin increased by 1.6 p.p. or 10.5% year-over-
year;
• Gross revenue climbed by 9.6% from 2Q14.
RETAIL
• Drogasmil’s and Tamoio’s sales rose respectively by 21.0%
and 11.3% fro m 2Q14;
• Drogasmil’s EBITDA margin moved up by 0.2 p.p. and
Tamoio’s by 3.8 p.p. in relation to 2Q14;
• Drogasmil’s same stores sales (SSS) increased by 17.7%
and Tamoio’s by 11.0% in relation to 2Q14.
SPECIALTIES
• Division’s sales grew by 17.0%, with a year-over-year
increase of 28.6% in specialty wholesaling;
• Sales to the private sector climbed by 38.6% against 2Q14;
• Oncological sales increased by 54.4% in relation to 2Q14.
PHARMACEUTICAL DISTRIBUTION
• Sales increased by 8.7% against 2Q14;
• EBITDA rose by 38.4% from 2Q14, with EBITDA margin of
3.6%;
• Generics sales up 18.0% year-over-year.
Specialties
2Q14 2Q15(**)
148.4
17.6
15.7
1.4
173.7
20.3
16.7
2.8
Retail(*)
2Q14 2Q15
161.0
50.1
47.2
2.3
185.3
58.5
49.2
6.6
Consolidado(*)(**)
2Q14 2Q15
1,075.3
148.3
121.7
24.3
1,178.5
178.7
132.3
37.7
Pharmaceutical
Distribution
2Q14 2Q15
828.4
80.6
58.8
20.5
900.8
99.9
66.4
28.4
4
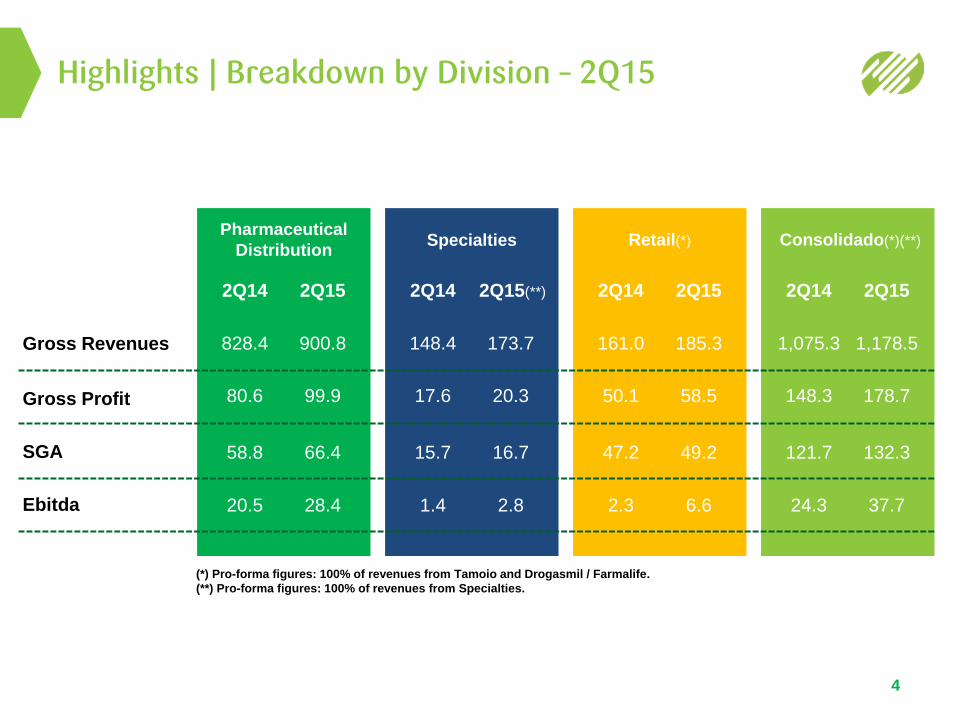
Gross Revenues
Gross Profit
SGA
Ebitda
Highlights | Breakdown by Division – 2Q15
(*) Pro-forma figures: 100% of revenues from Tamoio and Drogasmil / Farmalife.
(**) Pro-forma figures: 100% of revenues from Specialties.

CONSOLIDATED PERFORMANCE

Consolidated Performance
6
Gross Revenues Evolution (R$ million)
2Q14
1,009.2
1Q15
943.5
2Q15
964.1 2.9%
9.6%
66.1
1,075.3 201.3
1,144.8 214.4
1,178.5
Sales increased by 8.7% against
2Q14.
Division’s sales grew by 17.0%, with
a year-over-year increase of 28.6% in
specialty wholesaling.
Drogasmil’s and Tamoio’s sales rose
respectively by 21.0% and 11.3%
from 2Q14.
Pharmaceutical Distribution
Specialties
Retail
Accounting Consolidated Gross Revenues
Pro-forma Consolidated Gross Revenues: 100% of revenues from
Tamoio and Specialties

Performance by Division
7
2Q14 1Q15 2Q15
828.4
873.0
3.2%
8.7%
2Q14 1Q15 2Q15
148.4
166.3
173.7
4.4%
17.0%
2Q14 1Q15 2Q15
62.3 15.1%
72.0 75.4
6.3%
900.8
Pharmaceutical Distribution Specialties(**) Retail(*)
Gross Revenues Evolution (R$ million)
Accounting Gross Revenues
Pro-forma additional Gross
Revenues
(*) Pro-forma figures: 100% of revenues from Tamoio and Drogasmil / Farmalife
(**) Pro-forma figures: 100% of revenues from Specialties
98.7
102.3
109.9 161.0
185.3
174.4

Consolidated Performance
8
2Q15 2Q14
13.4%
117.7
1Q15
12.1%
99.5
14.7%
123.6
14.6%
2Q15 2Q14
148.3
1Q15
147.2
17.2%
178.7
Pro-forma (*)
Gross Profit (R$ million and % Net Revenues)
(*) Pro-forma figures: 100% of revenues from Tamoio and Specialties
15.6%

Consolidated Performance
9
Pro-forma (*)
121.7
12.1 %
121.8
12.8%
132.3
96.5
82.9 91.6
2Q15 2Q14 1Q15 2Q15 2Q14 1Q15
Operating Expenses – SGA (R$ million and % Net Revenues)
(*) Pro-forma figures: 100% of revenues from Tamoio and Specialties
10.1% 10.8% 11.0%
12,8%

Consolidated Performance
10
Pro-forma (*)
2Q15 2Q14 1Q15 2Q15 2Q14 1Q15
2.3%
20.4
1.6%
13.5
3.2%
27.2
102.4%
33.8%
2.6%
24.3
2.0%
19.7
3.6%
37.7
91.2%
54.8%
Adjusted EBITDA and Adjusted EBITDA Margin (R$ million and % Net Revenues)
(*) Pro-forma figures: 100% of revenues from Tamoio and Specialties

Consolidated Performance
11
(7.6)
2Q14
3.6
0.4%
-0.6%
0.3%
1Q15
(6.0)
2Q15
2.7 2.1
2Q15
0.2%
-0.9%
0.0%
0.1
1Q15
(2.8)
3.2
(3.1)
-0.3% -0.4%
0.4%
(1.3) (1.4)
6.3
-0.1% -0.1%
0.6%
2Q14
Net Profit (R$ million and % Net Revenues)
(*) Pro-forma figures: 100% of revenues from Tamoio and Specialties
Pro-forma (*)
Net Profit
Adjusted Net Profit
Pro-Forma Net Profit
Pro-Forma Adjusted Net Profit

Consolidated Performance
12
2Q15
(104.2)
20.7
(124.9)
(5.9)
(6.6)
(116.7)
2Q14
(11.9)
1.4
(13.3)
16.6
145.9
150.6
2Q154 1Q154 2Q14
Cash Cycle - Days * 43.6 34.0 46.9 40.1 39.6 49.6
Accounts Receivable¹ 47.3 45.5 44.5 48.7 57.8 18.0
Inventories² 55.9 62.7 63.2 58.3 40.8 80.1
Accounts Payable³ 59.6 74.2 60.7 66.9 58.9 48.6
2Q15 2Q15 2Q15
Pro-forma
Pharma PFS. Retail
Cash Flow (R$ million)
Cash Cycle (Days)
Cash Flow Generated /
Used) in Operating Activities
Internal Cash Generation
Operating Assets Variation
Cash Flow (Used)
in Investing Activities
Cash Flow Generated /
(Used) by Financing Activities
Net Increase /
(Decrease) in Cash
Consolidated Consolidated
* Average
(1) Average of Gross Revenues in the Quarter
(2) Average of COGS in the Quarter
(3) Average of COGS in the Quarter
(4) The account was based on the average gross sale and CGS, excluding
Specialties division.

5.0
13
0.6
1.1
3.3
2Q14 1Q15 2Q15
167.1
2.2x
205.1
3.3x
331.9
4.5x
Consolidated Performance Capex
(R$ million)
Indebtedness: Net Debt and Net Debt /
EBITDA (R$ million)
Capex
2Q15 Others IT
Machinery and
Equipment

PHARMACEUTICAL DISTRIBUTION

3.6
2Q14 2Q15
2.9
8.5
2Q14 2Q15
8.3
12.8
2Q14 2Q15
11.3
900.8
2Q14 2Q15
828.4
15
Generics sales up 18.0%
year-over-year.
Gross margin increased by
1.5 p.p. or 13.4% year-over-
year;
EBITDA rose by 38.4% from
2Q14, with EBITDA margin of
3.6%;
Financial Data (R$ million and % Net Revenues)
EBITDA Margin
(%)
Op. Exp. SG&A
(%)
Gross Margin
(%)
Gross Revenues
(R$ million)
Pharmaceutical Distribution

SPECIALTIES

17
1.8
2Q14 2Q15
1.1
10.5
2Q14 2Q15
11.6
12.7
2Q14 2Q15
13.1
173.7
2Q14 2Q15
148.4
Division’s sales grew by
17.0%, with a year-over-year
increase of 28.6% in
specialty wholesaling;
Oncological sales increased
by 54.4% in relation to 2Q14.
Specialties
Financial Data (R$ million and % Net Revenues)
EBITDA Margin
(%)
Op. Exp. SG&A
(%)
Gross Margin
(%)
Gross Revenues
(R$ million)
Sales to the private sector
climbed by 38.6% against
2Q14;

RETAIL

19
9.3
2Q14 2Q15
5.5
22.3
2Q14 2Q15
25.6
31.7
2Q14 2Q15
31.1
109.9
2Q14 2Q15
98.7
Tamoio chain’s sales up
11.3% year-over-year;
Average monthly sales per
store up 9.4%, from R$ 548.2
thousand in 2Q14 to R$
600.0 thousand in 2Q15;
Operating expenses down
3.3 p.p. in relation to 2Q14;
Retail | Tamoio
Financial Data (R$ million and % Net Revenues)
EBITDA Margin
(%)
Op. Exp. SG&A
(%)
Gross Margin
(%)
Gross Revenues
(R$ million)
EBITDA was up 87.7%
compared to the 2Q14.

20
2Q14 2Q15 1Q15 2Q14 2Q15 1Q15 2Q14 2Q15 1Q15
600.0
568.4 548.2
9.4%
98.7
109.6
102.3
11.0%
89.0
99.5
92.1
11.9%
5.6% 8.0% 7.1%
Retail | Tamoio
SSS Mature Stores (R$ million)
Monthly Average Store's Sales (R$ thousand)
Same Store Sales (R$ million)

21
2Q14
vs.
2Q15
2Q14 2Q15 1Q15 2Q14 1Q15 2Q15
27.3
30.0
28.8
9.8%
4.1%
60 60
61
1.7%
1.7%
Retail | Tamoio
# of Stores (units)
Average Ticket (in reais)
1 Opening
0 Close-downs
0 Reformulated
50 Mature

22
-4.8
2Q14 2Q15
-5.0
32.7
2Q14 2Q15
35.2
31.3
2Q14 2Q15
31.2
75.4
2Q14 2Q15
62.3
Average monthly sales per
store up 11.6%, from R$
346.2 thousand in 2Q14 to
R$ 386.6 thousand in 2Q15;
A 3.2 p.p. drop in net loss as
a percentage of sales, from
17.8% in 2Q14 to 14.6% in
2Q15.
A 21.8% increase in gross
profit YoY, with 31.3% gross
margin in 2Q15;
Retail | Drogasmil/Farmalife
Financial Data (R$ million and % Net Revenues)
EBITDA Margin
(%)
Op. Exp. SG&A
(%)
Gross Margin
(%)
Gross Revenues
(R$ million)

23
2Q15 1Q15 2Q14 2Q14 2Q15 1Q15 2Q14 2Q15 1Q15
386.6 376.5
11.6%
346.2 56.5
66.5
63.7
17.7%
54.8
64.2 62.6
17.2%
4.3% 2.6% 2.7%
Retail | Drogasmil/Farmalife
SSS Mature Stores (R$ million)
Monthly Average Store's
Sales (R$ thousand)
Same Store Sales (R$ million)

2Q14
vs.
2Q15 49 Mature
2 Reformulated
24
2Q14 2Q15 1Q15 2Q14 1Q15 2Q15
60
64
67
11.7%
4.7%
31.8
36.3 35.9
14.2%
1.2%
Retail | Drogasmil/Farmalife
Average Ticket (in reais)
# of Stores (units)
3 Opening
0 Close-downs

ANALYST COVERAGE

Analyst Coverage
26
Banco Fator Caio Moreira +55 (11) 3049-9487 [email protected]
Brasil Plural Guilherme Assis +55 (11) 3206 8285 [email protected]
BTG Pactual Rodrigo Gastim +55 (11) 3383-2468 [email protected]
HSBC Luciano Campos +55 (11) 3371 8194 [email protected]
BofA Merrill Lynch Roberto Otero +55 (11) 2188-4119 [email protected]
Morgan Stanley Javier Martinez de Olcoz +55 (11) 3048 6088 [email protected]
Votorantim Andre Parize +55 (11) 5171 5870 [email protected]
J.P. Morgan Joseph Giordano +55 (11) 4950-3020 [email protected]
Company Analyst Telephone E-mail

Max Fischer - CFO e IRO & Beatriz Diez - IRM
www.profarma.com.br/ri | Tel.: 55 (21) 4009-0276 | E-mail: [email protected]