Embed Size (px)
Citation preview

1
2Q14 Earning Results

2
2Q14 Earning Results
Mexico City, July 24, 2014
Important Lessons Management’s Discussion & Analysis
We consider that the quarterly results show strength in light of the current conditions of
the insurance industry. Upon these conditions, we have launched a new phase of our
subscription model, implementing a 2.2% tariff increase in May.
We finished the period with 2,435,330 insured vehicles, growing by 12.0% in insured units
and 10.8% in premiums written. This growth was mainly driven by the Financial
Institutions segment. On the other hand, premiums earned performed favorably, growing
by 9.7%. Our service culture and business model have allowed us to continue growing
above the market rate.
With regard to costs, we registered increases in the L&LAE and the operating expenses.
Climatic factors both rain and hail, had a considerable impact in collision frequency. L&LAE
were also affected by an important increase in the average costs of severance in case of
death and by the high costs in certain tow truck services.
Operating expenses increased considerably due to the anticipated payment of the PTU
(Employee Profit Sharing), banking services resulting from the payment method “months
without interests”, and fee payments to service offices. This led to an operating loss of
$55 and a combined ratio of 99.2%.
On the other hand, profitability benefitted from an outstanding investment income, of
$341, which resulted from greater exposure to equities and from the surge in the markets
originated by a lower Central Bank reference rate. Consequently, net profit reached $183.
In our international operations:
During the quarter, we issued our first QUIC (Quálitas Insurance Company) policy in the
state of Arizona. We continue working on regulatory issues to be able to sell in California
and Texas, states in which we identify greater market potential.
3
2Q14 Earning Results
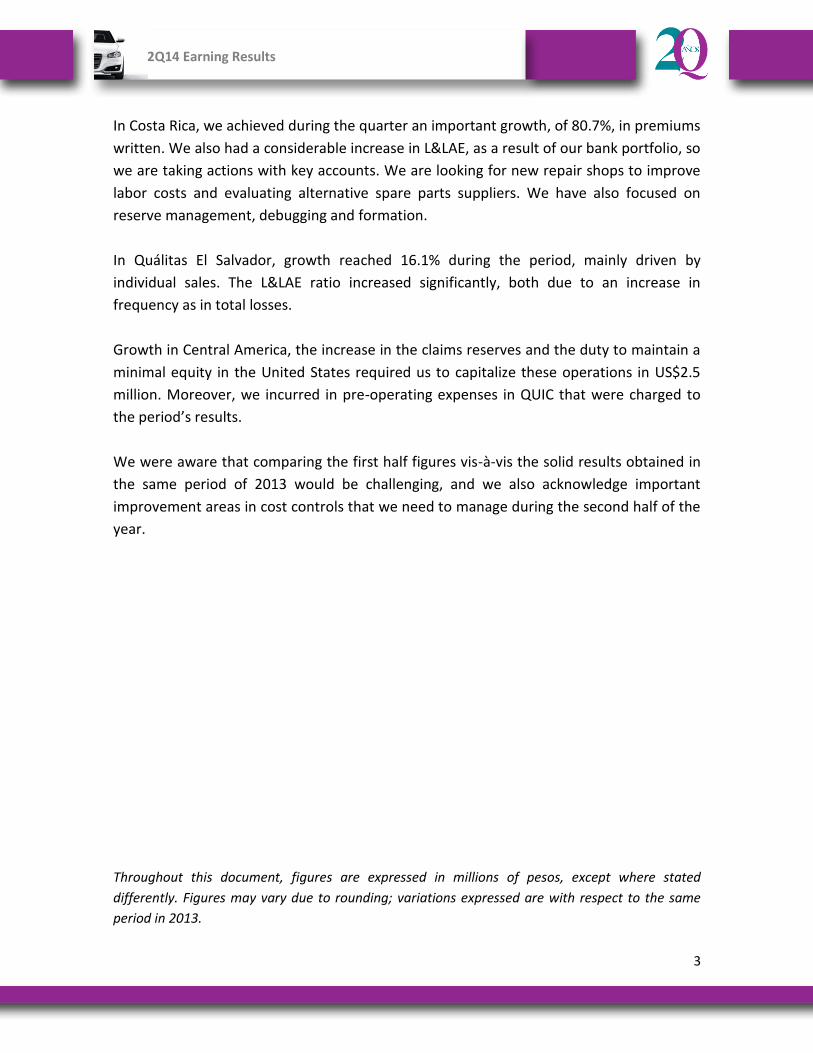
In Costa Rica, we achieved during the quarter an important growth, of 80.7%, in premiums
written. We also had a considerable increase in L&LAE, as a result of our bank portfolio, so
we are taking actions with key accounts. We are looking for new repair shops to improve
labor costs and evaluating alternative spare parts suppliers. We have also focused on
reserve management, debugging and formation.
In Quálitas El Salvador, growth reached 16.1% during the period, mainly driven by
individual sales. The L&LAE ratio increased significantly, both due to an increase in
frequency as in total losses.
Growth in Central America, the increase in the claims reserves and the duty to maintain a
minimal equity in the United States required us to capitalize these operations in US$2.5
million. Moreover, we incurred in pre-operating expenses in QUIC that were charged to
the period’s results.
We were aware that comparing the first half figures vis-à-vis the solid results obtained in
the same period of 2013 would be challenging, and we also acknowledge important
improvement areas in cost controls that we need to manage during the second half of the
year.
Throughout this document, figures are expressed in millions of pesos, except where stated
differently. Figures may vary due to rounding; variations expressed are with respect to the same
period in 2013.
4
2Q14 Earning Results
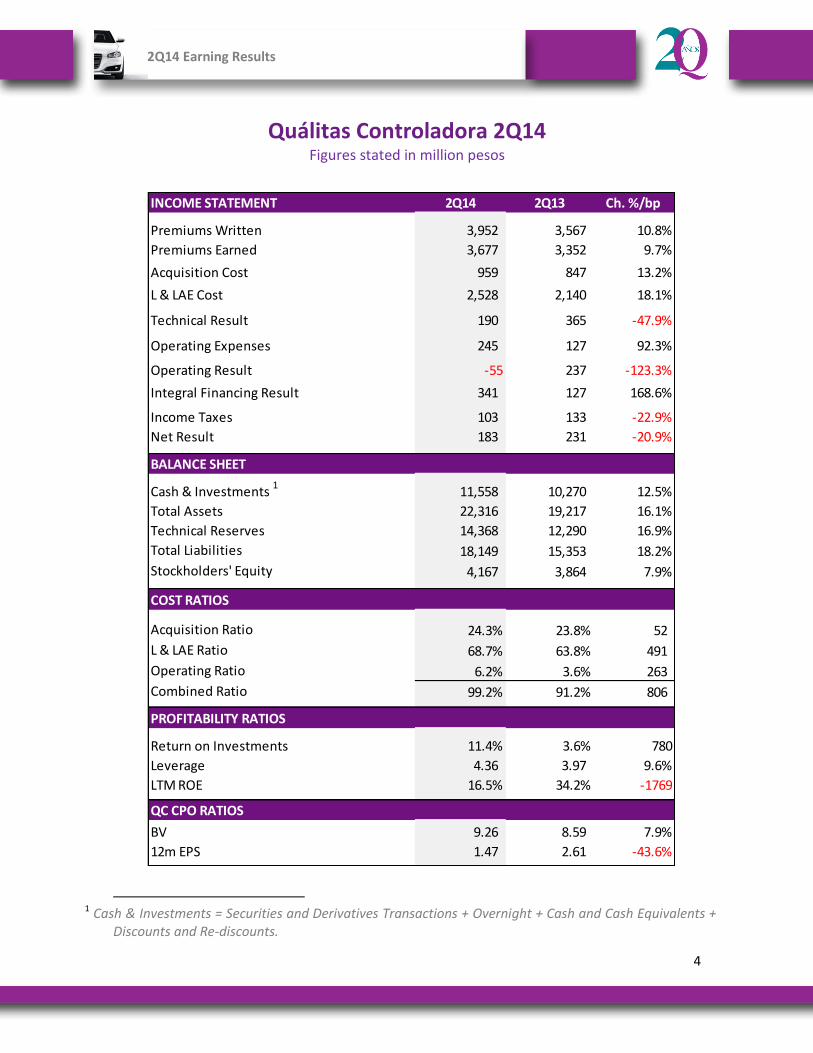
Quálitas Controladora 2Q14 Figures stated in million pesos
1
INCOME STATEMENT 2Q14 2Q13 Ch. %/bp
Premiums Written 3,952 3,567 10.8%
Premiums Earned 3,677 3,352 9.7%0.0%
Acquisition Cost 959 847 13.2%
L & LAE Cost 2,528 2,140 18.1%
Technical Result 190 365 -47.9%
Operating Expenses 245 127 92.3%
Operating Result -55 237 -123.3%
Integral Financing Result 341 127 168.6%0.0%
Income Taxes 103 133 -22.9%
Net Result 183 231 -20.9%
BALANCE SHEET
Cash & Investments 11,558 10,270 12.5%
Total Assets 22,316 19,217 16.1%
Technical Reserves 14,368 12,290 16.9%
Total Liabilities 18,149 15,353 18.2%
Stockholders' Equity 4,167 3,864 7.9%
COST RATIOS
Acquisition Ratio 24.3% 23.8% 52
L & LAE Ratio 68.7% 63.8% 491
Operating Ratio 6.2% 3.6% 263
Combined Ratio 99.2% 91.2% 806
PROFITABILITY RATIOS
Return on Investments 11.4% 3.6% 780
Leverage 4.36 3.97 9.6%
LTM ROE 16.5% 34.2% -1769
QC CPO RATIOS
BV 9.26 8.59 7.9%
12m EPS 1.47 2.61 -43.6%-
1 Cash & Investments = Securities and Derivatives Transactions + Overnight + Cash and Cash Equivalents +
Discounts and Re-discounts.
1
5
2Q14 Earning Results
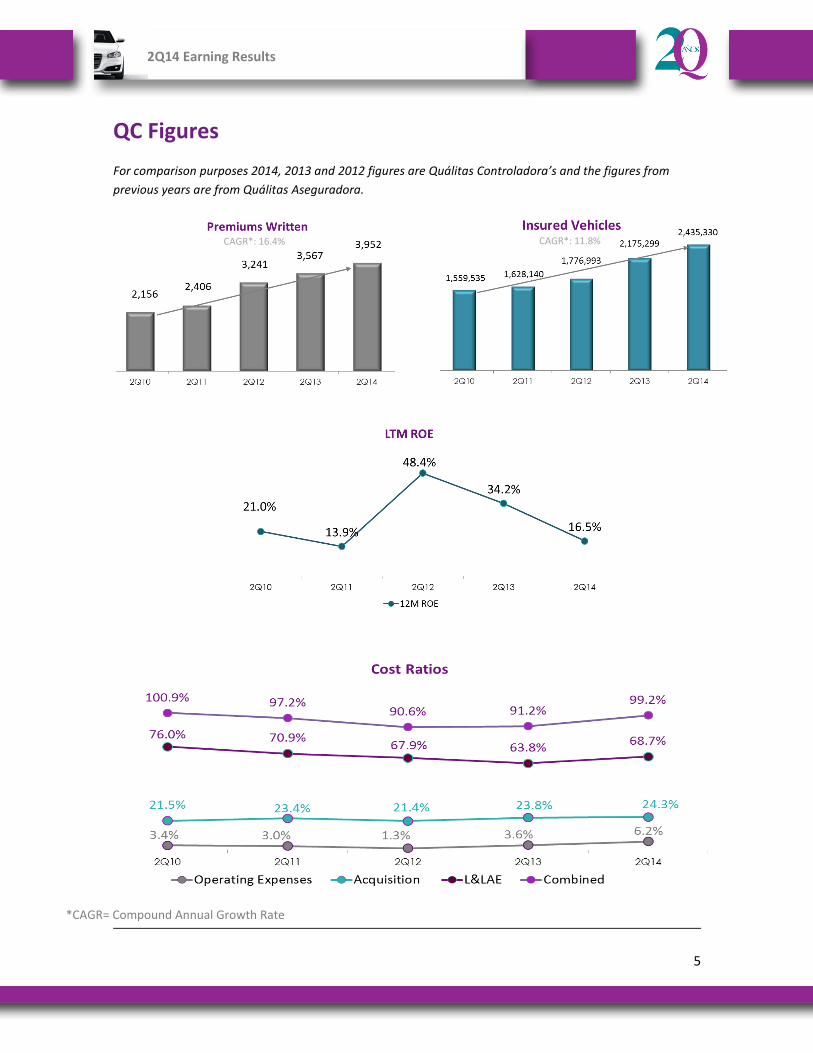
QC Figures
For comparison purposes 2014, 2013 and 2012 figures are Quálitas Controladora’s and the figures from
previous years are from Quálitas Aseguradora.
*CAGR= Compound Annual Growth Rate
CAGR*: 16.4% CAGR*: 11.8%

6
2Q14 Earning Results
QC - Financial Results 2Q14 Discussion & Analysis
Figures stated in million pesos
Premiums Written
Individual 898 882 16 1.8%
Fleets 1,348 1,334 14 1.0%
Sum of Traditional 2,245 2,216 30 1.3%
Toll Roads 82 1 81 NA
Financial Institutions 1,558 1,267 291 22.9%
Subsidiaries 66 83 -16 -19.8%
Total 3,952 3,567 385 10.8%NA: Not applicable
Ch. %Segment 2Q14 2Q13 Ch. $
Quálitas Controladora’s premiums written amounted to $3,952 increasing by 10.8% during
the quarter.
Qmx
Growth in premiums, of 11.5%, was mainly driven by the Financial Institutions segment and the increase in tariffs during the quarter, of 2.2%. Premiums in the Financial Institutions segment increased by 22.9%, benefitting from the recovery in automotive financing. Our premiums grew even though new car sales decreased by 2.2% and were affected by the Easter Week seasonality. The Fleet and Collectivities segment, which includes our value added contracts with companies, as well as groups of employees and their relatives, remained stable, growing by 1.0%. Sales in the Individual segment continued affected by the market competition, registering a slight increase, of 1.8%, during the period. We also reached an $82 premium in the Toll Roads segment, as a result of the roads and
bridges that we obtained at the end of 2013 in the CAPUFE account.

7
2Q14 Earning Results
Qsv
In El Salvador, we attained a solid growth during the period, of 16.1%, driven by individual
sales. Also the Financial Institutions segment registered a solid growth, with annual
policies linked to automotive loans with a 5-7 year term.
The Fleet segment, on the other hand, which comprises approximately 40% of sales, grew
slightly, impacted by economic factors.
During the quarter, tariffs were increased in April to make them more competitive in line
with vehicles’ claims.
Qcr
In Costa Rica, although the World Cup had a negative impact in June sales, we achieved an
important growth in premiums written during the quarter, of 80.7%. Our main market
segment continues to be Fleets. We continue developing new market segments.
Additionally, we improved tariffs for certain key accounts, which will enhance profitability.
8
2Q14 Earning Results
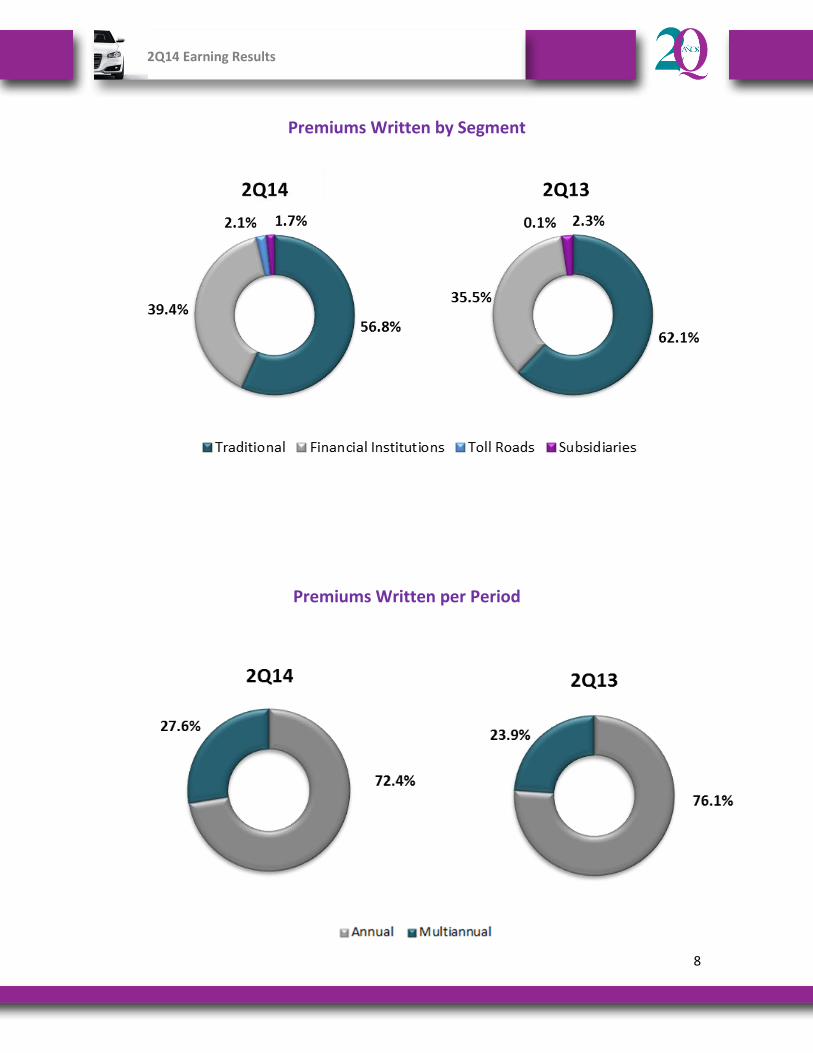
Premiums Written by Segment
Premiums Written per Period

9
2Q14 Earning Results
Insured Vehicles
Quálitas Controladora’s insured vehicles reached 2,435,330, increasing by 12.0%.
Business Line 2Q14 2Q13 Ch. %
Automobiles 1,664,907 1,435,279 16.0%
Trucks 570,037 567,510 0.4%
Subtotal 2,234,944 2,002,789 11.6%
Tourists 97,552 95,089 2.6%
Motorcycles 69,689 56,527 23.3%
Subsidiaries 33,145 20,894 58.6%
Insured Vehicles 2,435,330 2,175,299 12.0%
Qmx
Qmx’s insured vehicles reached 2,402,185, increasing by 11.5%, below the growth in
premiums written as result of the increase in tariff during the quarter.
Qsv
Qsv registered 17,074 insured vehicles, a 40.0% increase.
Qcr
Insured units amounted to 16,071, growing by 84.7%
Premiums Ceded, Net Premiums Written and Reinsurance
We continue with the strategy on not retaining proportional reinsurance, so no premiums
are ceded, and of maintaining a catastrophic reinsurance contract for Qmx, Qsv and Qcr.
Premiums Earned
Premiums earned grew by 9.7%, reaching $3,677.
In the case of Qcr, there was a change in the methodology to form the unearned
premiums reserve which resulted in a higher reserve, decreasing premiums earned.

10
2Q14 Earning Results
Net Acquisition Cost
Quálitas Controladora’s acquisition cost amounted to $959, a 13.2% increase.
Qmx
In Qmx, the acquisition cost increased by 12.0%, in line with the growth in premiums
written. The cost was partially offset by a 19.8% decrease in administrative expenses, as a
result of the volume of premiums in the Financial Institutions segment, which does not
require such a personalized attention as other segments.
Qsv
The acquisition cost ratio amounted to 34.5% and is mainly comprised by the commissions
paid to agents and the UOFs directed to the financial branch of a broker which sells
approximately 30% of our premiums written.
Qcr
The acquisition cost ratio registered 14.3%, since most of our sales costs are still
commissions and bonuses paid to agents, while the UOFs paid to banks do not yet affect
significantly the acquisition costs.
L&LAE
QC’s L&LAE registered $2,528, growing by 18.1% vis-à-vis the 2Q13 figure. We registered a
favorable L&LAE ratio, of 68.7%, although it surpasses the ratios obtained in the same
quarter of 2012 and 2013, years with very positive results.
Qmx
The L&LAE ratio amounted to 68.5%, due to a series of factors which generated a 19.0%
increase in L&LAE, which registered $2,521.
Third party liability costs have increased due to the raise in severance costs in case of
death. This severance average cost increased by 59.8%, impacting by 0.6 percentage
points the quarterly ratio.
The weather phenomena during the quarter had a strong impact in the collisions
frequency, increasing the number of climate-related claims from: 53 in 2Q13 to 1,112 in
2Q14. According to the National Water Commission (CONAGUA), nationwide rain during

11
2Q14 Earning Results
2Q14, expressed in millimeters, increased by 31.9% when compared to 2Q13. During the
quarter there were also two serious hail incidents: 13-15 cm. thick in the México-Toluca
toll road and hail the size of a pool ball in Xalapa, Veracruz.
Tow trucks costs continue being high. We are trying to integrate to our contracts suppliers
who have concessions from the Federal Government and State Governments for tow
trucking services in certain toll roads, and that typically have costs above our average
costs.
During the quarter, there was also a statistical adjustment to the reserve of occurred but
not reported claims which represented more than 1 percentage point of the L&LAE
registered.
On the other hand, we had salvage revenues in line with total losses generated from the
hail events, in which the vehicle’s recovery ratio tends to be high.
Hurricanes, Hail and Rain
Hurricane & Hail
2Q14 2Q13 %Ch.
Number of Claims 1,112 53 1998.1%
Average Repair Cost 24.64$ 13.83$ 78.1%
Figures in '000s pesos
Rain2Q14 2Q13 % Ch.
Rainfall 205.9 156.1 31.9%
Figures in millimeters (mm)
Severance Costs in Case of Dead
2Q14 2Q13 %Ch.
Number of Claims 155 125 24.0%
Amount Paid 47,169$ 23,806$ 98.1%
Average Cost 304.3$ 190.4$ 59.8%
Figures in '000s pesos

12
2Q14 Earning Results
Qsv
The L&LAE ratio amounted to 97.2%. L&LAE were impacted by the high claims frequency
and a considerable number of total losses during the quarter.
Qcr
L&LAE have increased significantly during the last half, both due to the increase in
frequency and in average costs. This trend begun with the growth of our portfolio of bank
policies, which changed the relative weight of costs, from third party liability, to material
damages. This comprises a challenge for claims management, since in the country there
tends to be only one Company representative of each automaker and, consequently, high
prices of spare parts.
We are undertaking actions to offset these costs. We are looking for new repair shops to
improve labor costs and are evaluating alternative spare parts suppliers. We have also
focused on reserve management, debugging and formation.
Operating Expenses
QC´s operating expenses grew considerably during the quarter, reaching $245 and
generating a high operating expenses ratio, of 6.2%.
Qmx
The administrative expenses related to operations remained stable, increasing by 2.9%. Additionally, as part of the 2014 labor strategy, PTU (Employee Profit Sharing) is being
distributed to employees in advance and consequently a $57 charge was registered during
the period, which represented 1.4 percentage points of the quarterly operating expenses
ratio, and we estimate the figure will be 0.75 for the year. In accordance with the Financial
Reporting Standards and the guidelines from the Insurance and Bonding Commission, this
charge is not recorded in the PTU item, but in operating expenses. In the future, this
charge will be recurring and amount to approximately $10 per month.

13
2Q14 Earning Results
On the other hand, non-discretionary expenses increased significantly as a result of three issues:
Banking services resulting from “months without interests” payments – payment
method in Mexico in which the credit institution grants the cardholder the
opportunity to pay products and services in monthly installments without a
financial charge. This financial charge, in turn, is covered by QC.
Fee payments to service offices representatives.
Additionally, during 2013, we had a non-recurring net income resulting from the
cancellation of a tax provision registered in 2012.
Qsv
The operating expenses ratio stood at 5.0%.
Qcr
The operating expenses ratio stood at 24.4%.
Integral Financing Result
During 2Q14, we registered a favorable investment income, of $341, achieving an
annualized yield on investments for the quarter of 11.4%.
Our portfolio benefitted from a greater exposure to equities, especially to small and mid-
caps. The cut in 50 basis points in the Mexican Central Bank reference rate favored prices
in the bond and equity markets, so that the Mexican Stock Exchange rose during the
quarter by 5.6%.
The discipline in our strategy has proven to be effective, allowing us to find a portfolio in
which, while we increase our exposure to equities, diversification has allowed us to lessen
the portfolio risk and maintain attractive yields. Our goal is to maintain profitability for the
rest of the year, achieving our objective of CETES + 200 b.p.

14
2Q14 Earning Results
Portfolio by Type of Risk Portfolio by Type of Issuer
It is important to note that the valuation of investments differs in the countries in which
we operate:
In Qmx debt and equity investments, as well as other securities, are marked to
market.
In Qsv we only hold debt securities. When these have a maturity of less than 1
year, they are valued at acquisition price, registering the accrued interests. When
maturities are over 1 year, securities are marked to market.
In Qcr we also have only investments in debt securities, which are valued with the
effective interest method. This implies that the security is marked to market and
then: variations in price are registered in shareholders’ equity, while interest
income is recorded in the income statement.
Taxes
Taxes for the period reached $103, which represents a 35.9% effective tax rate.
Net Result
We attained a net profit of $183, as a result of a satisfactory growth in premiums and of a
favorable investment income. Net profit was 20.9% less than the 2Q13 figure.
15
2Q14 Earning Results
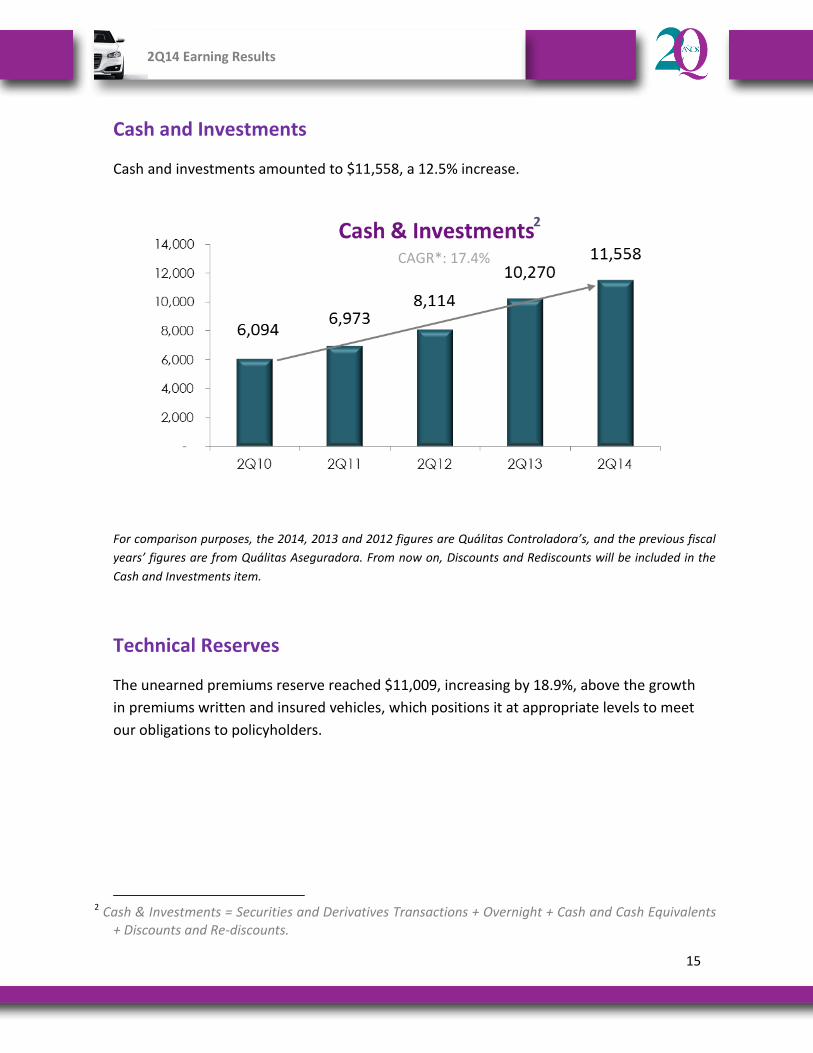
Cash and Investments
Cash and investments amounted to $11,558, a 12.5% increase.
2
For comparison purposes, the 2014, 2013 and 2012 figures are Quálitas Controladora’s, and the previous fiscal
years’ figures are from Quálitas Aseguradora. From now on, Discounts and Rediscounts will be included in the
Cash and Investments item.
Technical Reserves
The unearned premiums reserve reached $11,009, increasing by 18.9%, above the growth
in premiums written and insured vehicles, which positions it at appropriate levels to meet
our obligations to policyholders.
2 Cash & Investments = Securities and Derivatives Transactions + Overnight + Cash and Cash Equivalents
+ Discounts and Re-discounts.
2
CAGR*: 17.4%

16
2Q14 Earning Results
Solvency
QC’s solvency margin registered $1,186, which represents a solvency margin ratio of
41.7%.
Qmx 2,546 886 34.8%
Qsv 32 15 46.6%
Qcr 68 1 0.9%
QUIC 195 9 4.4%
Total 2,841 910
QC Cash 276
QC 2,841 1,186 41.7%
Solvency
Margin
Solvency Margin
Ratio
Minimum Equity
Requirement
- Forex Peso-USD June 2014: 12.9712 - Forex Colon-USD June 2014: 537.58
- Forex UD (Costa Rica) June 2014: 850.482
It is important to note that the calculation of the minimum equity requirement differs in
the countries in which we operate:
Qmx
It is the addition of the equity requirements in each operating segment:
- Automobile segment (16.4% of total premiums written in the last 12 months)
- Investments (requirement according to the credit risk based on the credit rating of
the issuer)
Qsv
It will be equal to the higher value between:
a) The net equity required to maintain a ratio total debt to net equity below 5x.
b) The amount resulting from the sum of the solvency margins calculations according
to regulations: premiums, average claims during 3 years, ceded claims, catastrophic
risk coverages and bonding operations.
For Qsv, the highest value is the sum of the calculation of the solvency margins.

17
2Q14 Earning Results
Qcr
The minimum equity requirement is measured in development units. For insurance
companies of personal or general policies, the requirement is of 3 million development
units.
QUIC
In Quálitas Insurance Company the initial minimum equity requirement amounts to
US$15, sum determined by the Authority to be able to launch operations.

18
2Q14 Earning Results
QC CPO3
Trading Operations during the quarter
2Q14 2Q13 %Ch.
Trading Volume - CPOs 32,327,478 34,770,274 -7.0%
Quarterly Traded Peso Amount - Ps MM 1,212$ 1,035$ 17.0%
Daily Traded Peso Amount - Ps MM 18$ 16$ 17.0%
Number of Transactions 16,760 8,105 106.8%
Share Buyback Fund
CPOs traded in the quarter 2,209,605
Balance of repurchased stocks as of june-14 (CPOs) 713,931
Analysts
Institution Analyst E-mail
414 Capital (Independent Analyst)
Francisco Sánchez Ávalos [email protected]
Actinver Martín Lara [email protected]
BBVA Research Ernesto Gabilondo [email protected]
Grupo Bursátil Mexicano José Juan Carreño [email protected]
Interacciones Enrique Mendoza [email protected]
Signum Research Carlos Ugalde [email protected]
Ve por Más Andrés Audiffred [email protected]
Vector Rafael Escobar [email protected]
3 CPO (Certificado de Participación Ordinaria). Each CPO consists of 3 series A shares and 2 series B shares.
19
2Q14 Earning Results
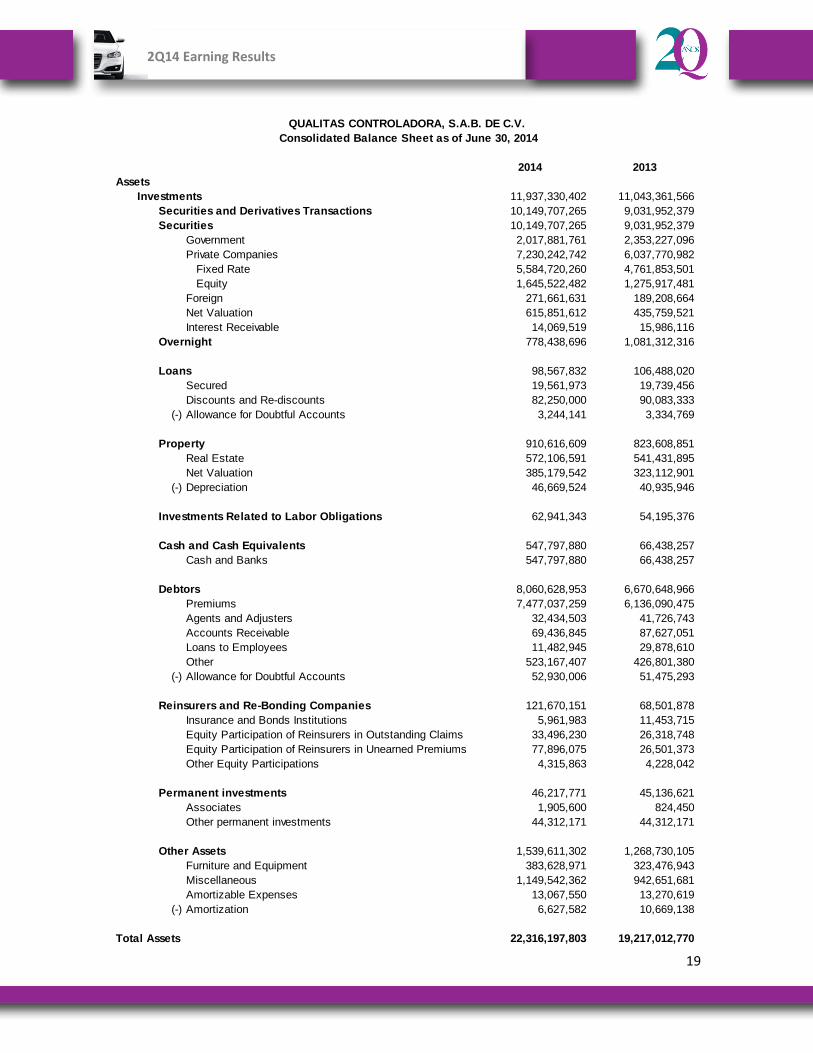
2014 2013
Assets
Investments 11,937,330,402 11,043,361,566
Securities and Derivatives Transactions 10,149,707,265 9,031,952,379
Securities 10,149,707,265 9,031,952,379
Government 2,017,881,761 2,353,227,096
Private Companies 7,230,242,742 6,037,770,982
Fixed Rate 5,584,720,260 4,761,853,501
Equity 1,645,522,482 1,275,917,481
Foreign 271,661,631 189,208,664
Net Valuation 615,851,612 435,759,521
Interest Receivable 14,069,519 15,986,116
Overnight 778,438,696 1,081,312,316
Loans 98,567,832 106,488,020
Secured 19,561,973 19,739,456
Discounts and Re-discounts 82,250,000 90,083,333
(-) Allowance for Doubtful Accounts 3,244,141 3,334,769
Property 910,616,609 823,608,851
Real Estate 572,106,591 541,431,895
Net Valuation 385,179,542 323,112,901
(-) Depreciation 46,669,524 40,935,946
Investments Related to Labor Obligations 62,941,343 54,195,376
Cash and Cash Equivalents 547,797,880 66,438,257
Cash and Banks 547,797,880 66,438,257
Debtors 8,060,628,953 6,670,648,966
Premiums 7,477,037,259 6,136,090,475
Agents and Adjusters 32,434,503 41,726,743
Accounts Receivable 69,436,845 87,627,051
Loans to Employees 11,482,945 29,878,610
Other 523,167,407 426,801,380
(-) Allowance for Doubtful Accounts 52,930,006 51,475,293
Reinsurers and Re-Bonding Companies 121,670,151 68,501,878
Insurance and Bonds Institutions 5,961,983 11,453,715
Equity Participation of Reinsurers in Outstanding Claims 33,496,230 26,318,748
Equity Participation of Reinsurers in Unearned Premiums 77,896,075 26,501,373
Other Equity Participations 4,315,863 4,228,042
Permanent investments 46,217,771 45,136,621
Associates 1,905,600 824,450
Other permanent investments 44,312,171 44,312,171
Other Assets 1,539,611,302 1,268,730,105
Furniture and Equipment 383,628,971 323,476,943
Miscellaneous 1,149,542,362 942,651,681
Amortizable Expenses 13,067,550 13,270,619
(-) Amortization 6,627,582 10,669,138
Total Assets 22,316,197,803 19,217,012,770
QUALITAS CONTROLADORA, S.A.B. DE C.V.
Consolidated Balance Sheet as of June 30, 2014

20
2Q14 Earning Results
2014 2013
Liabilities
Technical Reserves 14,367,760,373 12,289,792,169
Unearned Premiums 11,008,742,089 9,259,851,508
Casualities 11,008,742,089 9,259,851,508
Contractual Obligations 3,358,886,398 3,029,348,012
For Claims and Expirations 3,164,642,531 2,833,426,760
For Claims Incurred But Not Reported 95,735,023 95,917,412
For Policy Dividends 31,924,335 37,858,405
For Premiums on Deposit 66,584,509 62,145,435
Preventive Reserve 131,886 592,649
Catastrophic Risks 131,886 592,649
Reserves Related to Labor Obligations 131,235,692 110,249,531
Creditors 1,935,101,863 1,541,641,381
Agents and Adjusters 695,175,694 535,974,789
Funds for Losses Management 6,743,810 5,169,404
Miscellaneous 1,233,182,358 1,000,497,188
Reinsurers and Re-Bonding Companies 93,986,894 33,650,702
Insurance and Bond Companies 93,986,894 33,650,702
Other Liabilities 1,620,866,250 1,377,972,280
Provisions for employee profit sharing 43,877,188 8,263,546
Income Tax Provisions 197,022,202 319,542,499
Other Obligations 1,224,258,913 936,417,008
Deferred Credits 155,707,947 113,749,228
Total Liabilities 18,148,951,072 15,353,306,063
Stockholders' Equity
Capital Stock 2,665,580,463 2,684,887,926
Capital Stock 2,684,887,926 2,684,887,926
(-) Repurchased Shares 19,307,463 -
Reserves 222,036,746 -
Legal 87,036,746 -
For repurchase of shares 135,000,000 -
Valuation Surplus - -25,188,755
Permanent Investments -9,994,755 -
Retained Earnings 843,507,983 601,239,673
Net Result 429,991,056 587,064,488
Translation effect -1,457,145 6,088,925
Non-Controlling Interest 17,582,382 9,614,449
Total Stockholders' Equity 4,167,246,730 3,863,706,706
Total Liabilities and Stockholders' Equity 22,316,197,802 19,217,012,770
QUALITAS CONTROLADORA, S.A.B. DE C.V.
Consolidated Balance Sheet as of June 30, 2014

21
2Q14 Earning Results
QUÁLITAS CONTROLADORA, S.A.B. DE C.V.
Consolidated Income Statements for the six months ended June 30, 2014
2014 2013
Premiums
Written 8,610,334,074 7,607,702,278
(-) Ceded - -2,224,145
Net Premiums Written 8,610,334,074 7,609,926,423
(-) Net Increase of Unearned Premiums Reserve 1,254,951,505 972,081,931
Earned Retained Premiums 7,355,382,569 6,637,844,491
(-) Net Acquisition Cost 2,011,408,245 1,756,512,987
Agents' Commissions 531,193,667 492,398,972
Agents' Additional Compensation 113,751,257 109,814,655
(-) Comissions on Ceded Reinsurance 702,286 -
Excess of Loss Coverage 12,651,850 -
Other 1,354,513,757 1,154,299,360
(-) Net Losses and Loss Adjustment Expenses and Other
contractual liabilities 4,902,444,433 4,213,153,629
Claims and Other Contractual Obligations 4,849,632,175 4,197,606,737
Other Claims 52,812,258 15,546,893
Underwriting Income (Loss) 441,529,891 668,177,875
(-) Net increase in Other Technical Reserves - -
Gross Income (Loss) 441,529,891 668,177,875
(-) Net Operating Expenses 342,612,319 202,216,519
Administrative and Operating expenses 150,756,360 27,325,316
Employees' compensation and benefits 112,467,036 101,382,082
Depreciation and Amortization 79,388,924 73,509,121
Operating Income (Loss) 98,917,571 465,961,356
Integral Financing Result 523,442,329 391,363,176
Investments 230,334,386 183,429,133
Sale of Investments 115,649,812 155,589,686
Fair Valuation of Investments 122,173,192 -19,096,681
Surcharges on Premiums 58,956,054 58,122,983
Other -326,301 10,957,973
Foreign Exchange Rate Fluctuation -3,344,815 2,360,082
622,359,900 857,324,532
(-) Provision for Income Taxes 205,284,133 279,966,052
Income (Loss) Before Discontinued Operations 417,075,767 577,358,480
Discontinued Operations - -
Net Income (Loss) 417,075,767 577,358,480
Non-Controlling Interest -12,915,290 -9,706,008
Controlling Interest 429,991,056 587,064,488
Net Income (Loss) 417,075,767 577,358,480
Income (Loss) Before Taxes

22
2Q14 Earning Results
QUÁLITAS CONTROLADORA, S.A.B. DE C.V.
Consolidated Income Statement for the Second Quarter.
2Q14 2Q13
Premiums
Written 3,952,068,028 3,567,125,275
(-) Ceded - -
Net Premiums Written 3,952,068,028 3,567,125,275
(-) Net Increase of Unearned Premiums Reserve 274,822,610 215,295,263
Earned Retained Premiums 3,677,245,418 3,351,830,011
(-) Net Acquisition Cost 959,280,544 847,276,815
Agents' Commissions 233,666,814 226,668,907
Agents' Additional Compensation 51,813,167 50,412,289
Excess of Loss Coverage 9,040,588 -
Other 664,759,975 570,195,619
(-) Net Losses and Loss Adjustment Expenses and Other
contractual liabilities 2,528,036,337 2,139,889,694
Claims and Other Contractual Obligations 2,500,813,961 2,129,972,428
Other Claims 27,222,376 9,917,267
Underwriting Income (Loss) 189,928,537 364,663,502
(-) Net increase in Other Technical Reserves - -
Gross Income (Loss) 189,928,537 364,663,502
(-) Net Operating Expenses 245,170,872 127,469,721
Administrative and Operating expenses 147,255,522 49,435,559
Employees' compensation and benefits 58,323,236 39,844,198
Depreciation and Amortization 39,592,114 38,189,964
Operating Income (Loss) -55,242,336 237,193,781
Integral Financing Result 340,615,116 126,803,025
Investments 125,418,107 76,438,261
Sale of Investments 91,253,764 111,268,077
Fair Valuation of Investments 96,572,173 -102,361,041
Surcharges on Premiums 29,849,065 29,649,484
Other 623,135 4,526,087
Foreign Exchange Rate Fluctuation -3,101,128 7,282,157
Participation in Permanent Investments Result - -
285,372,780 363,996,806
(-) Provision for Income Taxes 102,579,430 133,044,714
Income (Loss) Before Discontinued Operations 182,793,350 230,952,092
Discontinued Operations - -
Net Income (Loss) 182,793,350 230,952,092
Non-Controlling Interest -8,951,294 -2,370,210
Controlling Interest 191,744,644 233,322,302
Net Income (Loss) 182,793,350 230,952,092
Income (Loss) Before Taxes

23
2Q14 Earning Results
Glossary of Terms and Definitions
Acquisition Cost: Includes commissions and compensations paid to agents and the fees paid to Financial Institutions for the sale of our policies (UOF).
Acquisition Ratio: Results from dividing the Acquisition Cost by Net Premiums Written.
CAGR: Compound Annual Growth Rate = [(End of Period Figure / Beginning of Period Figure) ^ (1/ Number of periods)]
Cash & Investments: Securities and Derivatives Transactions + Overnight + Cash and Cash Equivalents.
Combined Ratio: In the insurance industry, the combined ratio is used as a general performance measure. It results from the addition of the Acquisition, Operating, and L&LAE Ratios.
CNSF: National Insurance & Bonds Commission, the regulator of the insurance sector in Mexico.
CPO: Ordinary Participation Certificates. Quálitas shares are in deposit in a trust that issues the CPOs. The holders of the CPOs have rights over their shares in deposit. Each CPO consists of 3 series A shares and 2 series B shares.
EBTDA: Earnings before Taxes, Depreciation and Amortization. It differs from EBITDA in that, in EBTDA, the Investment Income is not subtracted, since it is part of the operation of insurance companies.
Financial Institutions: Institutions that belong to both Financial Groups as well as to the major automakers in the industry, responsible for credit sales of new automobiles.
L&LAE: Loss and Loss Adjustment Expenses: Includes the costs incurred in the payment of claims: valuation experts, adjusters, claim’s coordinators, and repair costs.
L&LAE Ratio: Results from dividing the L&LAE by Net Premiums Earned period.

24
2Q14 Earning Results
Minimum Equity Requirement: Is the minimum equity level that an insurance company should maintain, according to the authorities' requirements. In Mexico, in the automobile insurance industry, it is approximately calculated as the 16.4% of the premiums written in the last 12 months or the 25.1% of the net L&LAE for the last 36 months, that which results higher.
Multi-annual Policies: Policies with a term greater than 13 months. They are typically issued for the automobiles sold on credit.
Net Premiums Earned: Portion of premiums written that is registered as income as time goes by.
Net Premiums Written: Equal to premiums written less the part yielded to reinsurance.
Operating Expenses: Includes expenses incurred in by the Company in its regular operations.
Operating Ratio: Results from dividing Operating Expenses by Premiums Written.
Policies’ Fees: Administrative fee charged when the policy is issued and recorded as an income in operating expenses.
Premium Debtor: Records the portion of sold policies which will be paid in installments.
Premiums finance charge: Financial penalty imposed to policyholders that choose to pay their policy’s premium in installments.
Premiums Written: Premiums corresponding to policies underwritten.
Solvency Margin: Results from subtracting the Minimum Equity Requirement and the Underwriting Reserves, from the sum of Securities and Cash and Banks.
Solvency Margin Ratio: Results from dividing the Solvency Margin by the Minimum Equity Requirement.
UOF: Use of Facilities: Fees paid to the Financial Institutions for the sale of our insurance policies.

25
2Q14 Earning Results
Quálitas Controladora (QC), is a holding company whose purpose is to own companies related to auto insurance. The business model focuses on excellence in service and cost controls. Since 2007, it occupies the first place in the Mexican market with a 25.0% share as of March 2014, and has presence in El Salvador and Costa Rica.
Except for the historic information provided in this document, statements regarding the Company’s business outlook and estimated financial and operating results or regarding the Company’s growth potential, constitute forward-looking statements and are based
solely on management’s expectations regarding the economic and business conditions in countries where Quálitas operates.
Contacts at Quálitas:
Mariana Fernández
Investor Relations [email protected] T: +52 (55) 1555-6103
Anahí Escamilla
Investor Relations [email protected] T: +52 (55) 1555-6104
Alejandro Meléndez
Investments & Investor Relations Officer [email protected] T: +52 (55) 1555-6137
www.qualitas.com.mx