Embed Size (px)
Citation preview

Annual Meeting April 14, 2016
Note: All financial disclosure in this presentation is, unless otherwise noted, in US$

Forward-Looking Statements
Certain statements contained herein may constitute forward-looking information (within the meaning of Canadian securities legislation) and forward-looking statements (within the meaning of the United States Private Securities Litigation Reform Act of 1995). These statements can be identified by expressions of belief, expectation or intention, as well as those statements that are not historical fact. Forward-looking statements are based upon assumptions, estimates, opinions and analysis made by management in light of its experience, current conditions and its expectations of future developments that management believe to be reasonable and relevant, and are subject to known and unknown risks, uncertainties and other factors which may cause the actual results, performance or achievements of Fairfax to be materially different from any future results, performance or achievements expressed or implied by such forward-looking statements. Such factors include, but are not limited to: a reduction in net earnings if our loss reserves are insufficient; underwriting losses on the risks we insure that are higher or lower than expected; the occurrence of catastrophic events with a frequency or severity exceeding our estimates; changes in market variables, including interest rates, foreign exchange rates, equity prices and credit spreads, which could negatively affect our investment portfolio; the cycles of the insurance market and general economic conditions, which can substantially influence our and our competitors' premium rates and capacity to write new business; insufficient reserves for asbestos, environmental and other latent claims; exposure to credit risk in the event our reinsurers fail to make payments to us under our reinsurance arrangements; exposure to credit risk in the event our insureds, insurance producers or reinsurance intermediaries fail to remit premiums that are owed to us or failure by our insureds to reimburse us for deductibles that are paid by us on their behalf; the timing of claims payments being sooner or the receipt of reinsurance recoverables being later than anticipated by us; the inability of our subsidiaries to maintain financial or claims paying ability ratings; risks associated with implementing our business strategies; risks associated with our use of derivative instruments; the failure of our hedging methods to achieve their desired risk management objective; a decrease in the level of demand for insurance or reinsurance products, or increased competition in the insurance industry; the impact of emerging claim and coverage issues; the failure of any of the loss limitation methods we employ; our inability to access cash of our subsidiaries; our inability to obtain required levels of capital on favourable terms, if at all; the loss of key employees; technological or other change which adversely impacts demand, or the premiums payable, for the insurance coverages we offer; our inability to obtain reinsurance coverage in sufficient amounts, at reasonable prices or on terms that adequately protect us; the passage of legislation subjecting our businesses to additional supervision or regulation, including additional tax regulation, in the United States, Canada or other jurisdictions in which we operate; risks associated with government investigations of, and litigation and negative publicity related to, insurance industry practice or any other conduct; risks associated with political and other developments in foreign jurisdictions in which we operate; risks associated with legal or regulatory proceedings; failures or security breaches of our computer and data processing systems; the influence exercisable by our significant shareholder; adverse fluctuations in foreign currency exchange rates; our dependence on independent brokers over whom we exercise little control; an impairment in the carrying value of our goodwill and indefinite-lived intangible assets; our failure to realize deferred income tax assets; and assessments and shared market mechanisms which may adversely affect our U.S. insurance subsidiaries. We caution readers not to place undue reliance on these forward-looking statements, which speak only as of their dates. We disclaim any intention or obligation to update or revise any forward-looking statements, whether as a result of new information, change in assumption or opinion or otherwise, except as may be required by applicable securities laws. Additional risks and uncertainties are described in our most recently issued Annual Report which is available at www.fairfax.ca and in our Supplemental and Base Shelf Prospectus (under “Risk Factors”) filed with the securities regulatory authorities in Canada, which is available on SEDAR at www.sedar.com.
Guiding Principles
Objectives
We expect to compound our book value per share over the
long term by 15% annually by running Fairfax and its
subsidiaries for the long term benefit of customers,
employees and shareholders – at the expense of short term
profits if necessary
Our focus is long term growth in book value per share and
not quarterly earnings. We plan to grow through internal
means as well as through friendly acquisitions
We always want to be soundly financed
We provide complete disclosure annually to our
shareholders
3

Guiding Principles
Structure
Our companies are decentralized and run by the presidents
except for performance evaluation, succession planning,
acquisitions and financing, which are done by or with
Fairfax. Cooperation among companies is encouraged to
the benefit of Fairfax in total
Complete and open communication between Fairfax and its
subsidiaries is an essential requirement at Fairfax
Share ownership and large incentives are encouraged
across the Group
Fairfax head office will always be a very small holding
company and not an operating company
4

Guiding Principles
Values
Honesty and integrity are essential in all of our relationships and will never be compromised
We are results-oriented — not political
We are team players — no "egos”. A confrontational style is not appropriate. We value loyalty — to Fairfax and our colleagues
We are hard working but not at the expense of our families
We always look at opportunities but emphasize downside protection and look for ways to minimize loss of capital
We are entrepreneurial. We encourage calculated risk-taking. It is all right to fail but we should learn from our mistakes
We will never bet the company on any project or acquisition
We believe in having fun — at work! 5

Fairfax – 30 Years
Value Creation
6
403
475
22 -
100
200
300
400
500
600
1985 1988 1991 1994 1997 2000 2003 2006 2009 2012 2015
Book Value
Fairfax share price (USD)
S&P 500 index
30 Year Compound Annual Growth Rate
Fairfax book value per share – 20.4%
Fairfax share price (USD) – 19.4%
S&P 500 Index – 7.9%

Fairfax – 30 Years
Then and Now
1985 2015 Growth
Insurance premiums (net) 10 million 7.5 billion 752x
Investment portfolios 24 million 29 billion 1,214x
Common shareholders’ equity 8 million 9 billion 1,178x
Shares outstanding 5 million 22 million 4.4x
Per share
Insurance premiums $ 2.00 $ 339 169x
Investment portfolios 4.80 1,306 272x
Book value 1.52 403 265x
Stock price (Cdn$) 3.25 657 202x
7
1985 2015 Growth
Insurance premiums (net) 10 million 7.5 billion 752x
Investment portfolios 24 million 29 billion 1,214x
Common shareholders’ equity 8 million 9 billion 1,178x
Shares outstanding 5 million 22 million 4.4x
Per share
Insurance premiums $ 2.00 $ 339 169x
Investment portfolios 4.80 1,306 272x
Book value 1.52 403 265x
Stock price (Cdn$) 3.25 657 202x

Fairfax – 30 Years
Financial Results
(1) Includes dividends paid
Growth in Average Average Total
5 Years Book Value Combined Return on
Ended per Share(1) Ratio Investments
1990 58% 107% 10%
1995 21% 104% 10%
2000 31% 114% 9%
2005 (1%) 105% 9%
2010 24% 100% 11%
2015 4% 97% 3%
8

Historic Performance vs. Peer Group
Compound Growth in Book Value per Share (30 Years: since Fairfax’s inception) (1)
(1) Except for S&P 500 and TSX which are compound index returns excluding dividends
9
20.4%
16.4% 15.9%
14.0%
12.5% 12.4%
9.9%8.8%
7.9%
5.1%

10
Historic Performance vs. Peer Group
Compound Growth in Book Value per Share (5 Years ending 2015) (1)
(1) Except for S&P 500 and TSX which are compound index returns excluding dividends
11.5%
10.3% 10.2% 9.9% 9.7% 9.6%
7.3% 7.0%6.5% 6.4%
5.6% 5.5% 5.5%
3.0%
1.4%
-0.7%

23
%
11
%
10
%
8%
7
%
6%
5%
5
%
3%
3
%
3%
3%
2
%
(1%
) (3
%)
(3%
)
(3%
)
(4%
)
(5%
) (5
%)
(6%
)
(7%
)
(7%
) (8
%)
(8%
) (9
%)
(9%
) (1
2%
)
(13
%)
(14
%)
(14
%)
(14
%)
(15
%)
(16
%)
(17
%)
(18
%)
(18
%)
(19
%)
(19
%)
(19
%)
(22
%)
(24
%)
(31
%)
(32
%)
(37
%)
(37
%)
(43
%)
(48
%)
(65
%)
(10
0%
)
SOURCE: Dowling & Partners, IBNR #12
Fairfax and AIG calculated using the same methodology as Dowling & Partners, based on company data (AIG excludes government financing) 11
2008 Change in Book Value per Share

($ millions)
(1) Includes: non-insurance operations, runoff operating income, interest expense and corporate overhead & other
Sources of Net Earnings in 2015
Unrealized investment losses (1,811)
Hedging gains 502
Pre-tax income 625
Net earnings 642
12
Underwriting profit – (combined ratio of 89.9%) 705
Investment income – insurance and reinsurance 477
Operating income 1,182
Other (1) (298)
Realized investment gains 1,050
Pre-tax income including realized investment gains 1,934

Underwriting Results in 2015
13
Combined Underwriting
Ratio Profit
($ millions)
Northbridge 91.8% 72
Crum & Forster 97.7% 35
Zenith 82.5% 134
Brit (1) 94.9% 46
OdysseyRe 84.7% 337
Fairfax Asia 87.9% 35
Other Insurance and Reinsurance 89.6% 46
Consolidated 89.9% 705
(1) For the period since its acquisition on June 5, 2015

Net Gains on Investments 2010-2015
14
Equity and equity related investments
Equity hedges
Net equity
Bonds
CPI-linked derivatives
Other
4.2
(1.2)
3.0
1.7
0.0
0.1
4.8
(Losses)($ billions)
Realized
Gains
(1.4)
(2.0)
(3.4)
0.2
(0.4)
0.0
(3.6)
(Losses)($ billions)
Unrealized
Gains
2.8
(3.2)
(0.4)
1.9
(0.4)
0.1
1.2
(Losses)($ billions)
Net
Gains

Cost of Hedging
15
($ billions) 2010 2011 2012 2013 2014 2015 Total
Equity hedges (0.9) 0.4 (1.0) (2.0) (0.2) 0.5 (3.2)
CPI-linked derivatives 0.0 (0.2) (0.1) (0.1) 0.0 0.0 (0.4)
Total (0.9) 0.2 (1.1) (2.1) (0.2) 0.5 (3.6)

Importance of Float
16
Total Float Total Investments
($ millions) Per Share
1985 13 $ 2½
1990 164 30
1995 653 74
2000 5,877 449
2005 8,757 492
2010 13,110 641
2015 17,072 769
CAGR 21.5%
Total Investments
($ millions) Per Share
24 $ 5
289 53
1,222 138
10,400 794
14,869 835
23,300 1,139
29,016 1,306
20.5%

17
International Operations
(1) Full year 2015 premium
(2) Including Fairfax Eastern Europe
(3) For the 12 months ended September 30, 2015
ICICI Lombard (India)(3) 1,170 26% 299
Alltrust Insurance (China)(3) 1,063 15% 159
Gulf Insurance (Middle East)(3) 608 41% 252
BIC (Vietnam) 70 35% 25
Falcon Insurance (Thailand) 48 41% 20
2,959 755
Gross Fairfax's Share of
Premiums Gross Premiums
Written Ownership Written
($ millions) ($ millions)
Brit(1) 1,999 70% 1,400
First Capital (Singapore) 399 98% 390
Advent 241 100% 241
Fairfax Brasil 123 100% 123
Polish Re(2) 114 100% 114
Pacific Insurance (Malaysia) 108 100% 108
Falcon Insurance (Hong Kong) 69 100% 69
Union Assurance (Sri Lanka) 43 78% 34
Fairfax Indonesia 34 80% 28
3,130 2,507
Total 6,089 3,262
Runoff
18
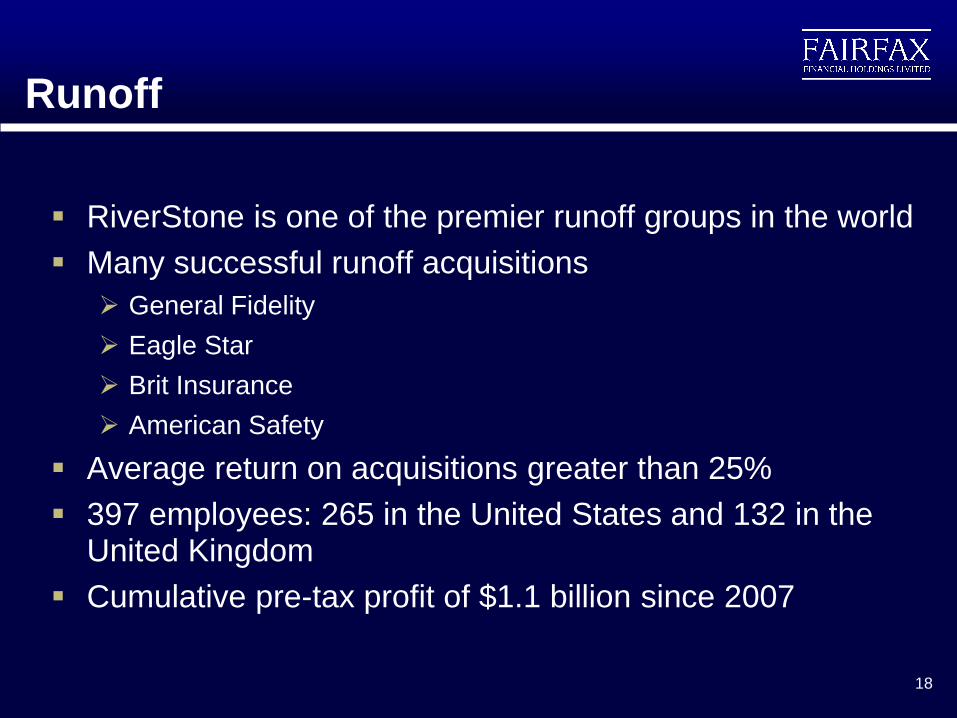
RiverStone is one of the premier runoff groups in the world
Many successful runoff acquisitions
General Fidelity
Eagle Star
Brit Insurance
American Safety
Average return on acquisitions greater than 25%
397 employees: 265 in the United States and 132 in the United Kingdom
Cumulative pre-tax profit of $1.1 billion since 2007

Restaurant Business
19
2012 2013 2014 2015 2016
3rd largest restaurant group in Canada
Exceptional management led by Bill Gregson
Financially strong
Prime Restaurants
Purchase Price: $57
Ownership: 82%
Merger of Cara/Prime
Investment: $100
Prime Contribution: $57
Bill Gregson joined as President
Keg Restaurants
Purchase: $85
Ownership: 51%
Cara IPO
Fairfax MV: $458
Ownership: 41%
Cara Dec. 31, 2015
Fairfax MV: $600
Cara
Purchases
St-Hubert
(Cdn$ millions)
The McEwan Group
Ownership: 45%

Gains (Losses) Per Share
($ millions)
1985 0.5 10¢
2008 2,144 $ 118
2009 1,981 $ 108
2010 (3) -
2011 691 $ 34
2012 643 $ 31
2013 (1,564) $ (77)
2014 1,736 $ 80
2015 (259) $ (12)
Cumulative Gains $11.4 billion
Pre-Tax Realized and Unrealized Gains
20

Investment Performance
21
5 Years 10 Years 15 Years
December 31, 2015
Common stocks (with equity hedging) (4.9%) 4.2% 9.8%
S&P 500 12.6% 7.3% 5.0%
December 31, 2014
Common stocks (with equity hedging) (2.7%) 6.5% 11.6%
S&P 500 15.5% 7.7% 4.2%
December 31, 2013
Common stocks (with equity hedging) 3.2% 7.6% 13.5%
S&P 500 17.9% 7.4% 4.7%
December 31, 2012
Common stocks (with equity hedging) 5.5% 14.5% 13.5%
S&P 500 1.7% 7.1% 4.5%
Compound Annual Returns
Investment Performance
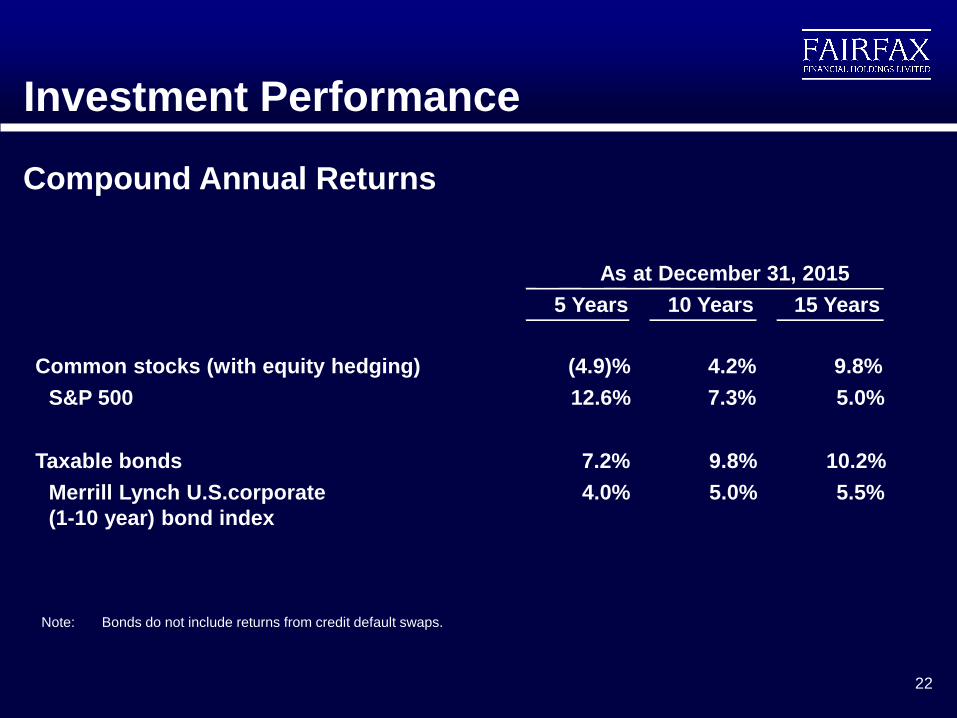
Compound Annual Returns
Note: Bonds do not include returns from credit default swaps.
Common stocks (with equity hedging) (4.9)% 4.2% 9.8%
S&P 500 12.6% 7.3% 5.0%
Taxable bonds 7.2% 9.8% 10.2%
Merrill Lynch U.S.corporate
(1-10 year) bond index
4.0% 5.0% 5.5%
5 Years 10 Years 15 Years
As at December 31, 2015
22
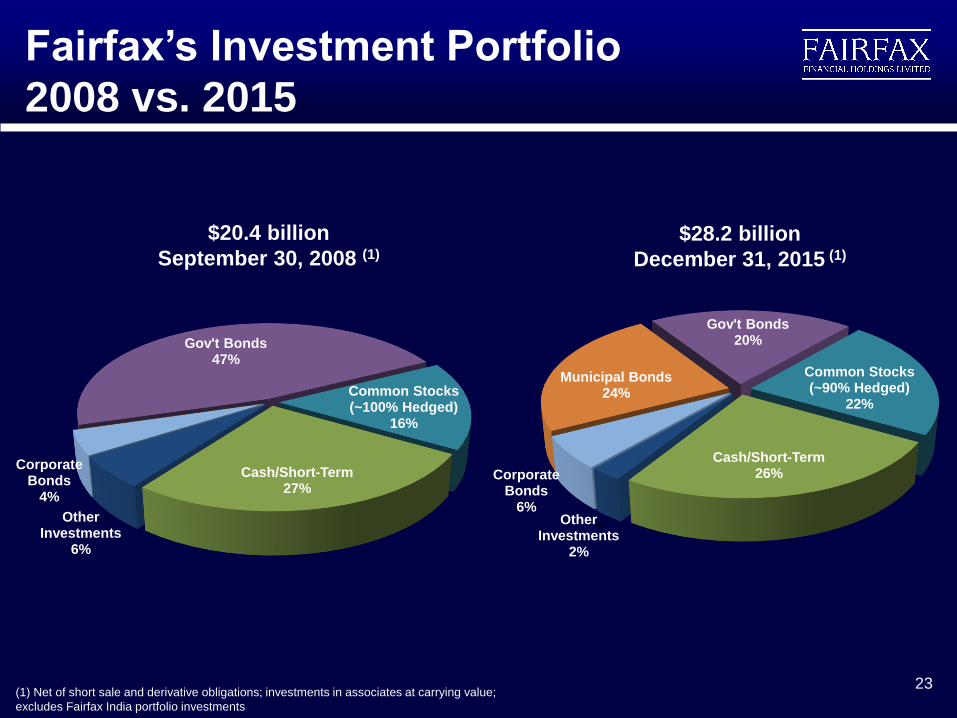
Fairfax’s Investment Portfolio
2008 vs. 2015
23 (1) Net of short sale and derivative obligations; investments in associates at carrying value;
excludes Fairfax India portfolio investments
$28.2 billion
December 31, 2015 (1)
$20.4 billion
September 30, 2008 (1)
Cash/Short-Term26%
Other Investments
2%
Corporate Bonds
6%
Municipal Bonds24%
Gov't Bonds20%
Common Stocks(~90% Hedged)
22%
Cash/Short-Term27%
Other Investments
6%
Corporate Bonds
4%
Gov't Bonds47%
Common Stocks(~100% Hedged)
16%
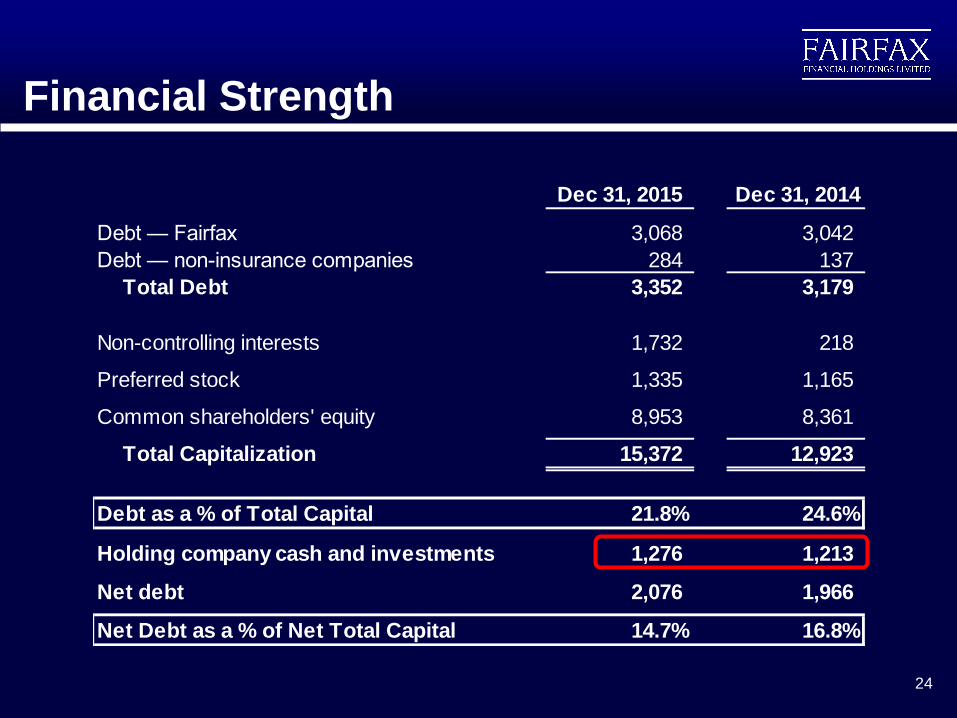
Dec 31, 2015 Dec 31, 2014
Debt — Fairfax 3,068 3,042
Debt — non-insurance companies 284 137
Total Debt 3,352 3,179
Non-controlling interests 1,732 218
Preferred stock 1,335 1,165
Common shareholders' equity 8,953 8,361
Total Capitalization 15,372 12,923
Debt as a % of Total Capital 21.8% 24.6%
Holding company cash and investments 1,276 1,213
Net debt 2,076 1,966
Net Debt as a % of Net Total Capital 14.7% 16.8%
24
Financial Strength
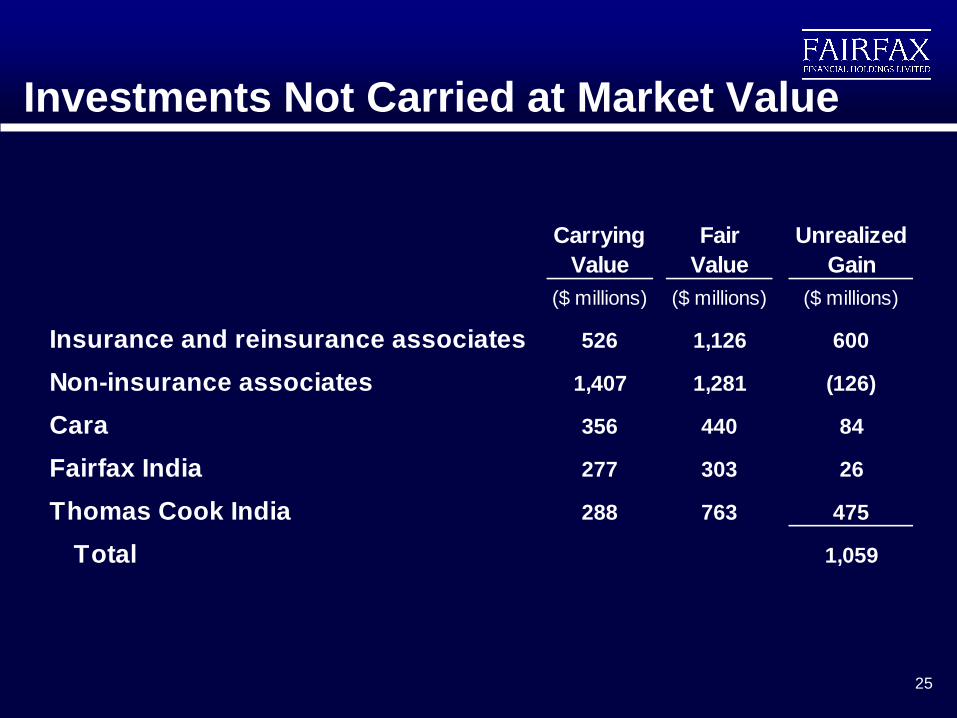
Investments Not Carried at Market Value
25
Carrying
Value
Fair
Value
Unrealized
Gain
($ millions) ($ millions) ($ millions)
Insurance and reinsurance associates 526 1,126 600
Non-insurance associates 1,407 1,281 (126)
Cara 356 440 84
Fairfax India 277 303 26
Thomas Cook India 288 763 475
Total 1,059
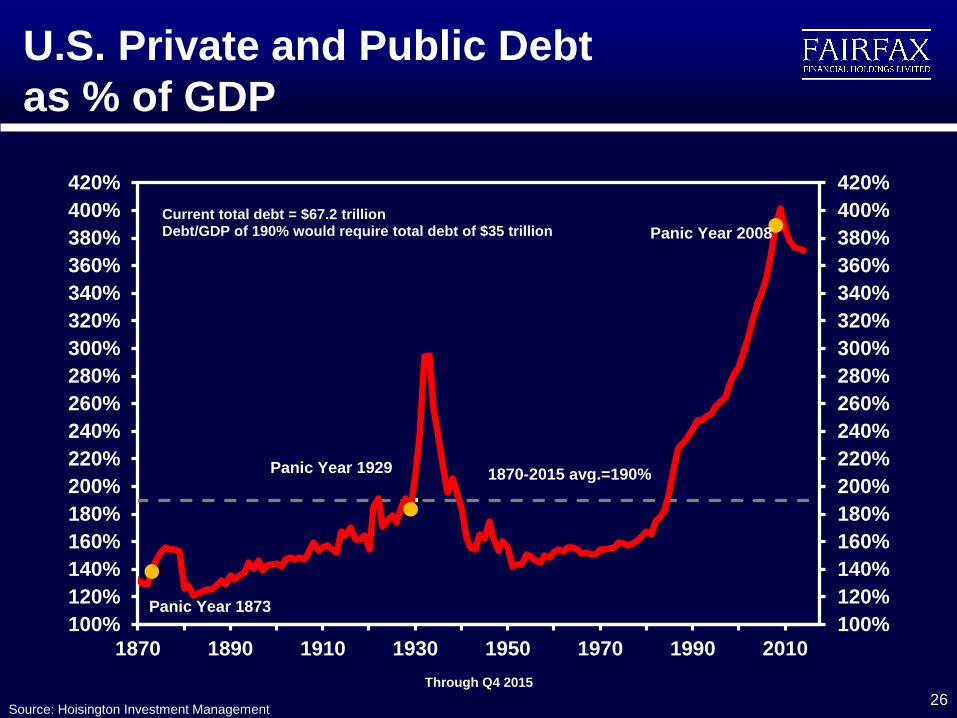
U.S. Private and Public Debt
as % of GDP
26 Source: Hoisington Investment Management
Through Q4 2015
100%
120%
140%
160%
180%
200%
220%
240%
260%
280%
300%
320%
340%
360%
380%
400%
420%
100%
120%
140%
160%
180%
200%
220%
240%
260%
280%
300%
320%
340%
360%
380%
400%
420%
1870 1890 1910 1930 1950 1970 1990 2010
Panic Year 2008
Panic Year 1929
Panic Year 1873
1870-2015 avg.=190%
Current total debt = $67.2 trillionDebt/GDP of 190% would require total debt of $35 trillion
27
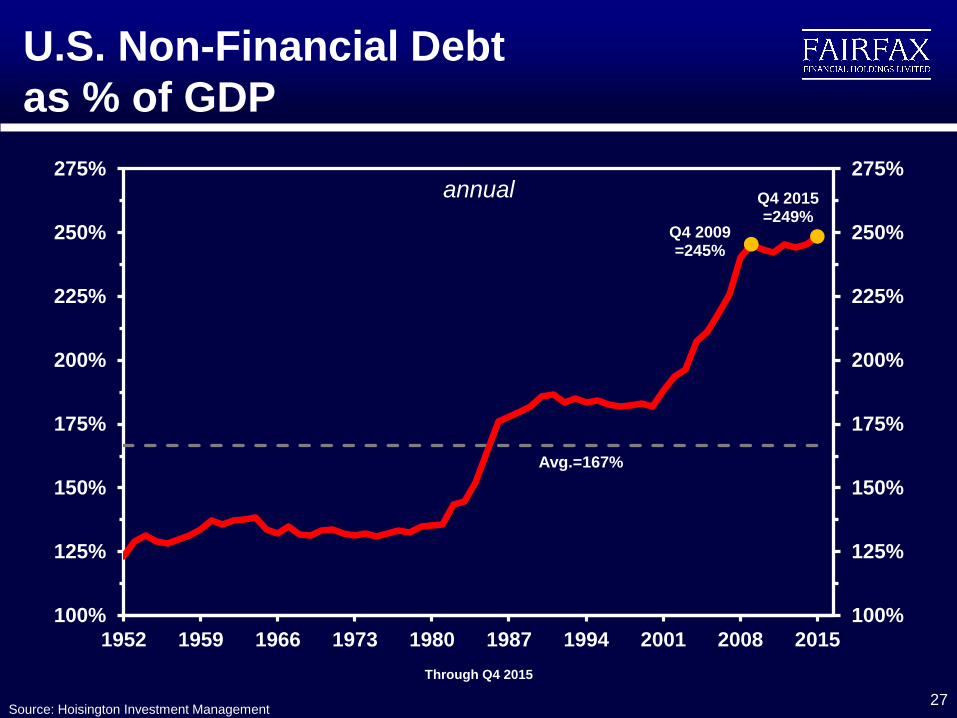
U.S. Non-Financial Debt
as % of GDP
Source: Hoisington Investment Management
annual
Through Q4 2015
100%
125%
150%
175%
200%
225%
250%
275%
100%
125%
150%
175%
200%
225%
250%
275%
1952 1959 1966 1973 1980 1987 1994 2001 2008 2015
Avg.=167%
Q4 2009=245%
Q4 2015=249%

0%
100%
200%
300%
400%
500%
600%
700%
1979 1983 1987 1991 1995 1999 2003 2007 2011 2015
0%
100%
200%
300%
400%
500%
600%
700%
Canada
U.S.
Eurozone
U.K
Japan
Australia
China
250%-275%
28
Total Public and Private Debt
as a % of GDP – Major Countries
Source: Hoisington Investment Management
annual
Through Q3 2015, except U.S. which is through Q4 2015.

29
Velocity of Money 1900-2015
Equation of Exchange: GDP (nominal) = M*V
Source: Hoisington Investment Management
annual
1.00
1.25
1.50
1.75
2.00
2.25
1.00
1.25
1.50
1.75
2.00
2.25
1900 1910 1920 1930 1940 1950 1960 1970 1980 1990 2000 2010
1918 = 2.0
1946 = 1.2
1997 = 2.2
1.49
Avg. 1900 to present = 1.73
Avg. 1953 to 1983 = 1.75
30
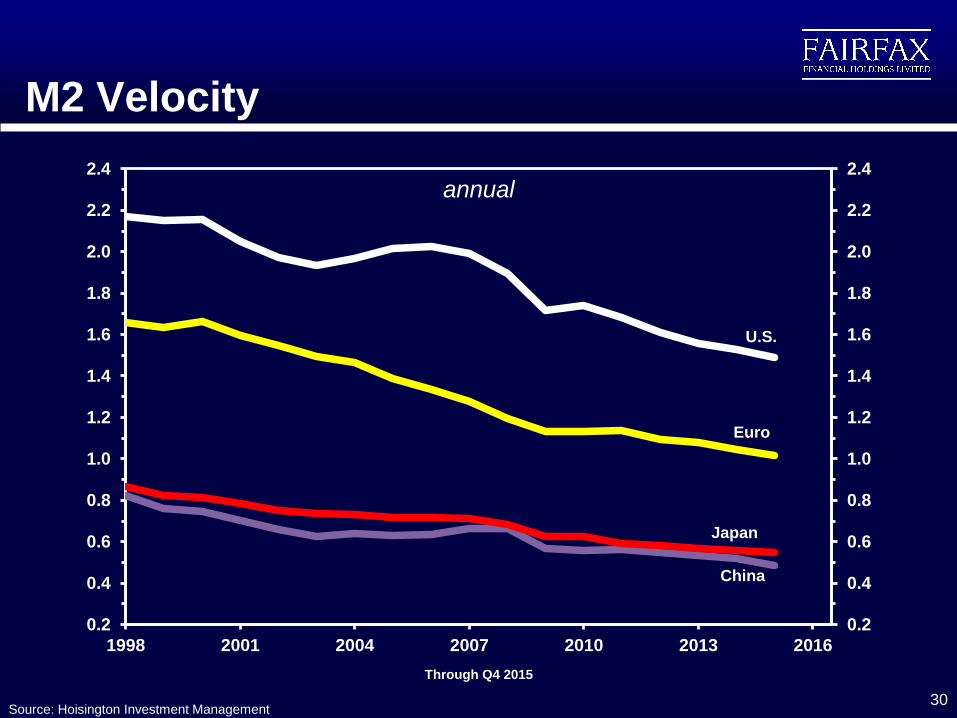
M2 Velocity
Source: Hoisington Investment Management
annual
Through Q4 2015
0.2
0.4
0.6
0.8
1.0
1.2
1.4
1.6
1.8
2.0
2.2
2.4
1998 2001 2004 2007 2010 2013 2016
0.2
0.4
0.6
0.8
1.0
1.2
1.4
1.6
1.8
2.0
2.2
2.4
China
U.S.
Euro
Japan

0%
1%
2%
3%
4%
5%
6%
7%
0%
1%
2%
3%
4%
5%
6%
7%
1 2 3 4 5 6 7 8 9 10 11 12 13 14 15 16 17 18 19 20 21 22 23 24 25 26
Long Term Government Bond Yields
Following Historic Panic Years
U.S. 2008
U.S. 1929
Japan 1989
31 Source: Hoisington Investment Management
annual average

32
U.S., Germany and Japan
Long Term Government Yields
Source: Bloomberg
Quarterly through Q1 2016
0%
1%
2%
3%
4%
5%
6%
7%
8%
9%
0%
1%
2%
3%
4%
5%
6%
7%
8%
9%
1994 1997 2000 2003 2006 2009 2012 2015
GER 30 YR UST 30 YR JAP 20 YR
Source: Bloomberg
Current RatesU.S. 2.6%
Germany 0.8%Japan 0.4%
33
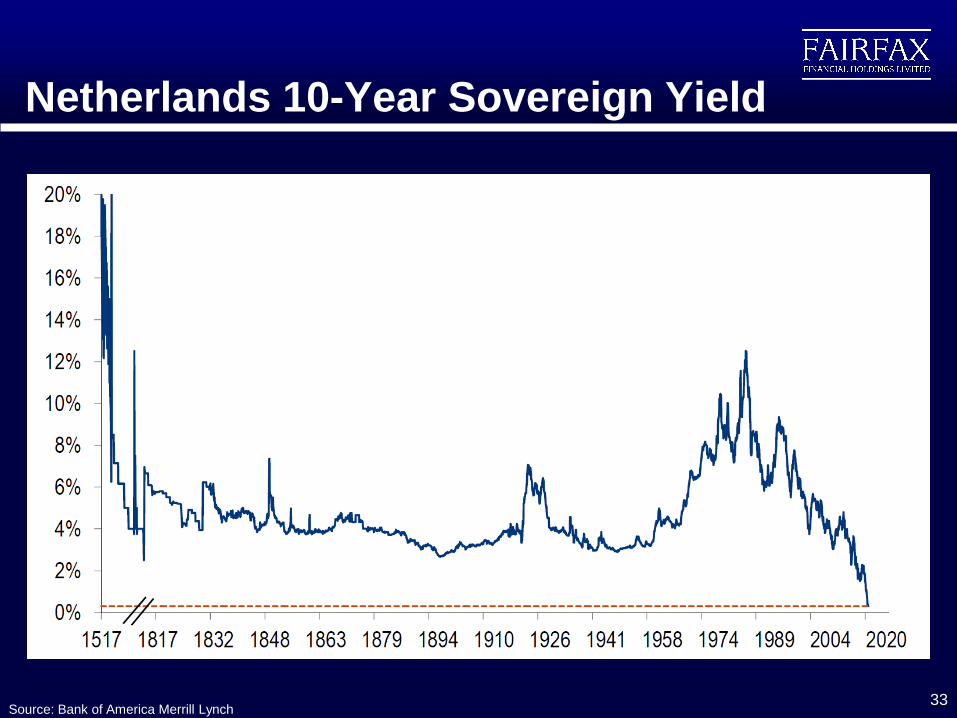
Netherlands 10-Year Sovereign Yield
Source: Bank of America Merrill Lynch
34
0
5
10
15
20
25
30
35
40
45
50
0
5
10
15
20
25
30
35
40
45
50
1881 1894 1907 1921 1934 1947 1961 1974 1987 2001 2014
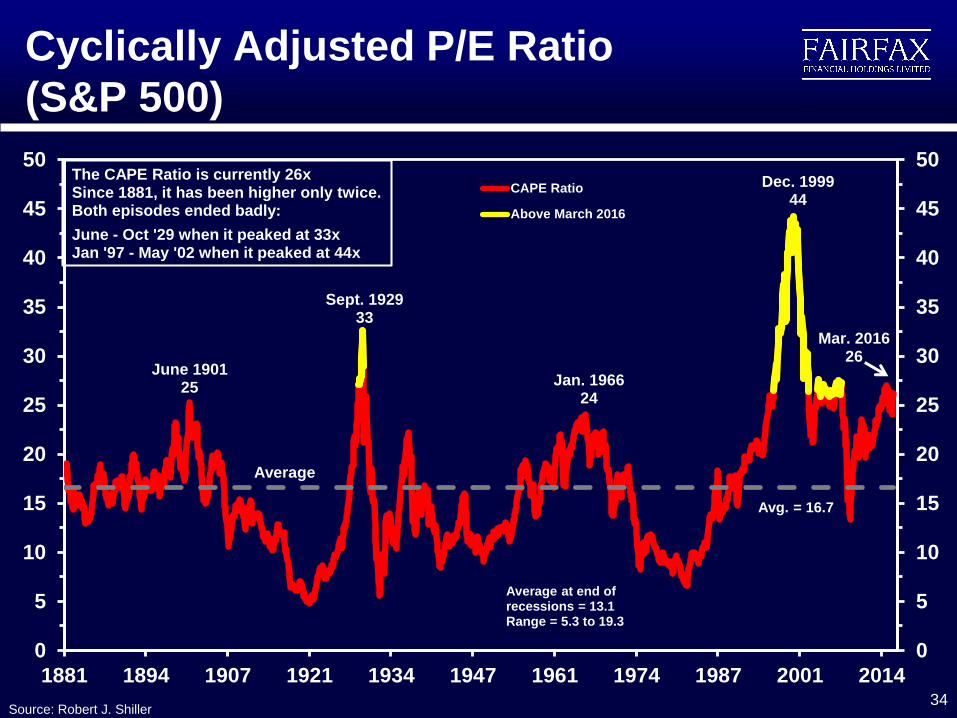
CAPE Ratio
Above March 2016
June 190125
Sept. 192933
Jan. 196624
Dec. 199944
Average at end of recessions = 13.1Range = 5.3 to 19.3
Average
Avg. = 16.7
The CAPE Ratio is currently 26xSince 1881, it has been higher only twice. Both episodes ended badly:
June - Oct '29 when it peaked at 33xJan '97 - May '02 when it peaked at 44x
Mar. 201626
Cyclically Adjusted P/E Ratio
(S&P 500)
Source: Robert J. Shiller
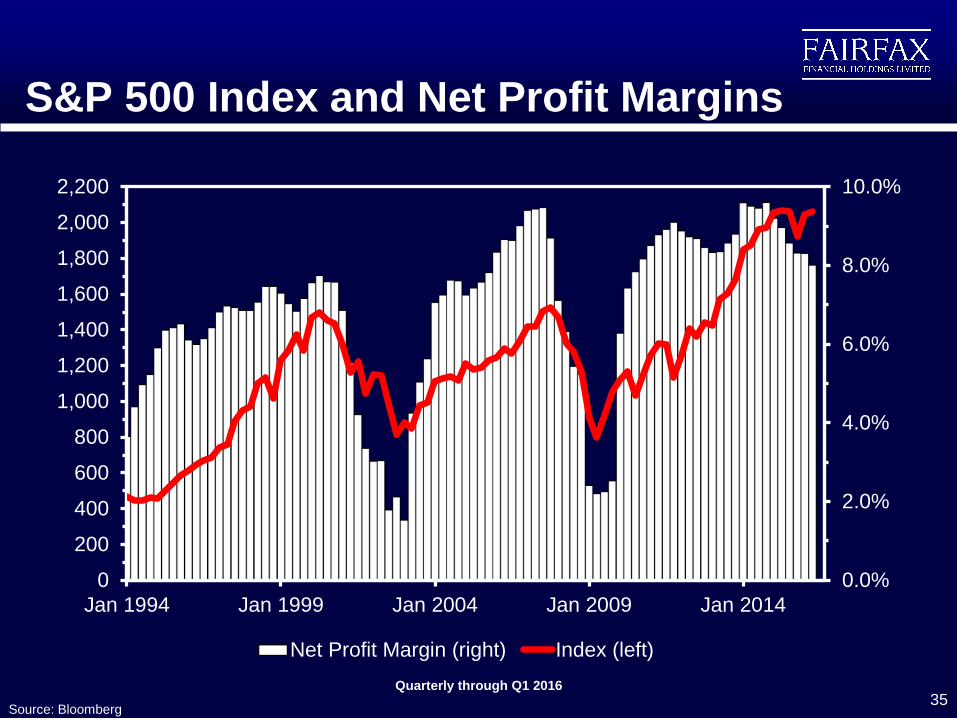
S&P 500 Index and Net Profit Margins
35 Source: Bloomberg
Quarterly through Q1 2016
0.0%
2.0%
4.0%
6.0%
8.0%
10.0%
0
200
400
600
800
1,000
1,200
1,400
1,600
1,800
2,000
2,200
Jan 1994 Jan 1999 Jan 2004 Jan 2009 Jan 2014
Net Profit Margin (right) Index (left)Source: Bloomberg

U.S. Corporate After-Tax Profits
36
Quarterly through Q4 2015
Source: Hoisington Investment Management
$1,200
$1,300
$1,400
$1,500
$1,600
$1,700
$1,200
$1,300
$1,400
$1,500
$1,600
$1,700
'10 '11 '12 '13 '14 '15 '16
Lowest since Q1 2011
(billions) (billions)

Commodity Price Declines
37
S&P GSCI Commodity Index, monthly
Source: Hoisington Investment Management, Bloomberg
Through March 2016
0
100
200
300
400
500
600
700
800
900
1000
0
100
200
300
400
500
600
700
800
900
1000
'85 90 '95 '00 '05 '10 '15
Source: Hoisington Investment Management

Inflation Expectations
38
10 year breakeven inflation rate
Source: Bloomberg
Through March 2016
-0.5%
0.0%
0.5%
1.0%
1.5%
2.0%
2.5%
3.0%
3.5%
-0.5%
0.0%
0.5%
1.0%
1.5%
2.0%
2.5%
3.0%
3.5%
2005 2006 2007 2008 2009 2010 2011 2012 2013 2014 2015 2016
U.S.
Eurozone

-15%
-10%
-5%
0%
5%
10%
-15%
-10%
-5%
0%
5%
10%
199
0
199
1
199
2
199
3
199
4
199
5
199
6
199
7
199
8
199
9
2000
200
1
200
2
200
3
200
4
200
5
200
6
200
7
200
8
200
9
201
0
201
1
201
2
201
3
201
4
201
5
Annual Inflation Annual Deflation Cumulative
(1) In April 2014 Japan raised its consumption tax from 5% to 8% (2) Estimate - Japan Cabinet Office
39
Deflation in Japan
Source: The World Bank
(1) (2)

40
Deflation in U.S.
-25%
-20%
-15%
-10%
-5%
0%
5%
10%
-25%
-20%
-15%
-10%
-5%
0%
5%
10%
193
0
193
1
193
2
193
3
193
4
193
5
193
6
193
7
193
8
193
9
194
0
Annual Inflation Annual Deflation Cumulative
Source: Hoisington Investment Management

41
CPI-Linked Derivative Contracts
December 31, 2015
Weighted average remaining term to maturity is 6.6 years
Notional
Amount Cost
Underlying CPI Index ($ bn) ($ mm) Dec 31,14 Dec 31,15
United States 46 285 79 99
United States - 0.5% floor 13 39 72 84
European Union 42 287 70 74
United Kingdom 5 24 5 3
France 3 21 12 13
109 656 238 273
Market Value ($ millions)
42
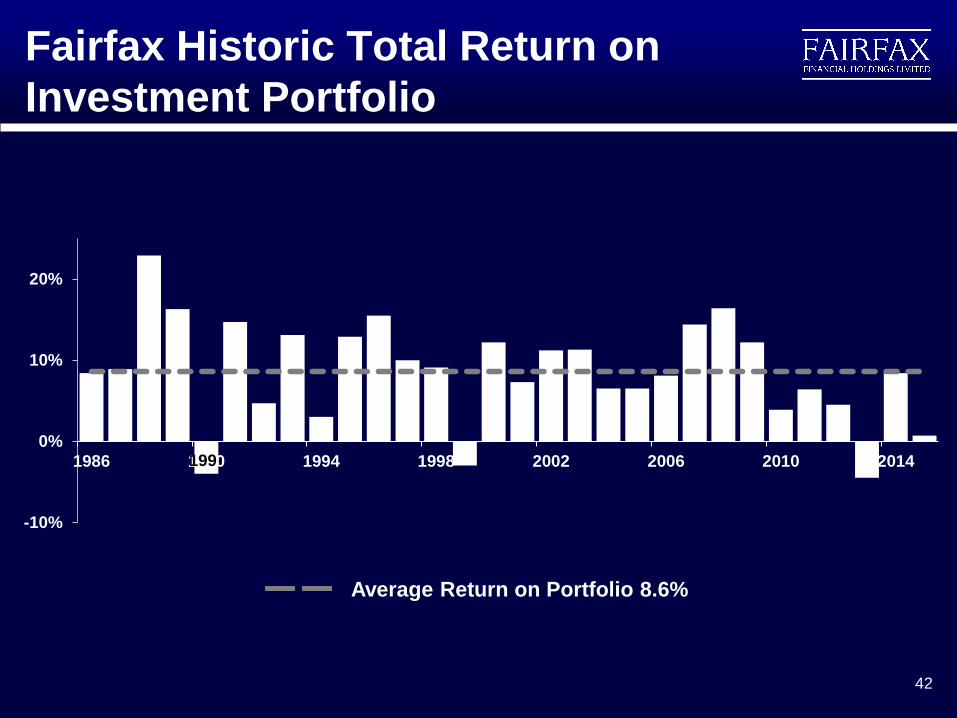
Fairfax Historic Total Return on
Investment Portfolio
-10%
0%
10%
20%
1986 1990 1994 1998 2002 2006 2010 2014
Average Return on Portfolio 8.6%
199

Ready for the Next Decade -
Building on Fairfax’s Strengths
Our guiding principles have remained intact
Excellent long term performance
Demonstrated strengths
Strong operating subsidiaries focused on underwriting profitability
and prudent reserving
Conservative investment management providing excellent long
term returns
Well positioned for the future
Fair and friendly Fairfax culture
43