Embed Size (px)
Citation preview
Thiede, J., Myhre, A.M., Firth, J.V., Johnson, G.L., and Ruddiman, W.F. (Eds.), 1996Proceedings of the Ocean Drilling Program, Scientific Results, Vol. 151
28. QUATERNARY PALEOCEANOGRAPHY AND PALEOCLIMATOLOGY OF THE FRAM STRAIT/YERMAK PLATEAU REGION: EVIDENCE FROM SITES 909 AND 9121
Kjersti Hevr0y,2 Gaute Lavik,2 and Eystein Jansen2-3
ABSTRACT
The drilling on Leg 151 provided the first sections that allow studies beyond isotope Stage 6 in the Fram Strait/Yermak Pla-teau area, thereby enabling insight into paleoenvironmental evolution prior to the last glacial cycle. The upper parts of Holes909B and 912A were analyzed for their ice-rafted detritus (IRD) and foraminiferal contents and stable isotope compositions toobtain a relatively high-resolution record of the paleoenvironmental evolution during the last 400 k.y. in the region. The mainfeatures are similar to the records from the Fram Strait and the Yermak Plateau. Earlier glaciations (isotope Stages 6-12) weremore severe than the last one. The content of foraminifers through time indicates a trend toward more open water, with a higherproduction through the two last glacial/interglacial cycles. Seasonal open-water conditions with a high foraminifer productionoccurred through all the glacial periods, indicating that the surface circulation of the Nordic Seas in glacial stages plays animportant role in the growth and decay of high-latitude ice sheets, bringing moisture and heat northward during the glacials.Deep-water formation seems to be continuous in the Nordic Seas through most of the time period presented in this study. Therewas an apparent change in the style of glaciation in the earlier parts of the Brunhes Chron with the emergence of more stronglydeveloped IRD peaks than before. Glacial activity also is an important element in the Matuyama Chron in the European Arctic.
INTRODUCTION
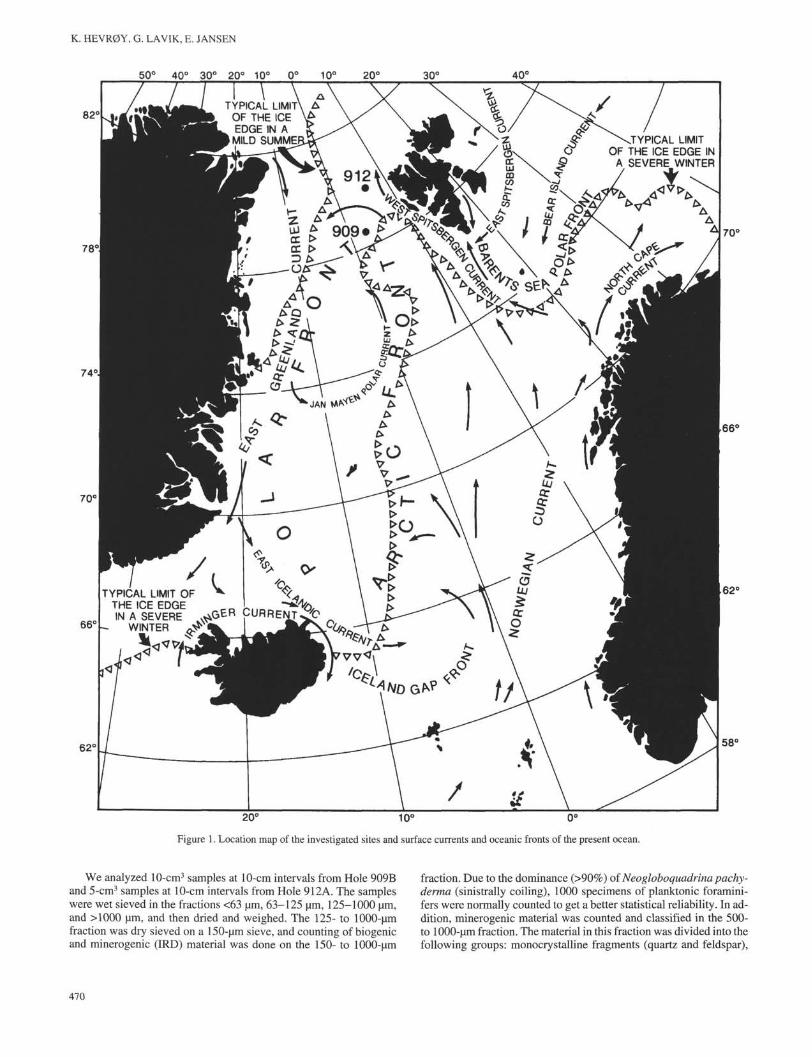
The Fram Strait and Yermak Plateau region is an important areafor the exchange of water and energy between the Arctic Ocean andthe Nordic Seas. We studied Hole 909B (78°35.07'N, 3°4.38'E; 2519m water depth) in the Fram Strait and Hole 912A (79°57.557'N,5°27.360'E; 1036 m water depth) on the Yermak Plateau (Fig. 1) toprovide a paleoclimatic and paleoceanographic record from this areafor the last few glacial/interglacial cycles, focusing on the surface anddeep-water communication between the Arctic Ocean and the NordicSeas, the influx of North Atlantic surface water to the Arctic, andvariations in continental ice sheets. The study is based on planktonicand benthic isotope stratigraphy (618O and δ13C), foraminifers, andthe amount and composition of ice-rafted material. The Fram Strait isinfluenced by water masses from all the surrounding oceans—theArctic Ocean, the Barents Sea and the Nordic Seas (Fig. 1). The sur-face circulation of the Fram Strait is dominated by two currents: TheWest Spitsbergen Current (WSC), which transports warm, saline At-lantic water northward, and the East Greenland Current (EGC),which brings cold, low-salinity polar water southward. Betweenthese water masses is the Arctic water, which is a mixture of Atlanticand polar waters. The flow of deep water, formed in the Arctic Oceanand the Barents Sea by brine formation and by strong cooling of in-flowing Atlantic water, is southward beneath the EGC. Some of thedeep water formed by convection in the Greenland Sea is transportednorthward along the eastern Fram Strait together with some of thedeep water formed in the Barents Sea.
Ocean basins at high latitudes are important for an understandingof global climate and climate changes because they directly influenceglobal climate through the formation of permanent and seasonal sea-ice cover, the transfer of heat to the atmosphere, and the renewal andventilation of deep water. The climate in the Arctic is strongly influ-
'Thiede, J., Myhre, A.M., Firth, J.V., Johnson, G.L., and Ruddiman, W.F. (Eds.),1996. Proc. ODP, Sci. Results, 151: College Station, TX (Ocean Drilling Program).
2 Department of Geology, University of Bergen, Allégaten 41, N-5007 Bergen, Nor-way.
3Correspondence author: [email protected]
enced by sea-ice cover, which increases the regional albedo and re-duces the heat and gas exchange between the ocean and atmosphere.There also is a close relationship between sea-ice cover and sedimen-tation (Hebbeln and Wefer, 1991). The location of these cores iswithin the marginal zone of the sea-ice cover and close to the north-ernmost extension of the WSC (Fig. 1). The sea-ice cover varies sea-sonally and interanually, and, because of these variations, this area iswell suited for studies of the relation between ice cover, sedimenta-tion, and circulation.
Previous studies have shown that the ocean circulation of this re-gion has changed through the last glacial cycles. A much more exten-sive sea-ice cover has been proposed for the last glacial, with a dom-inating current of cold, polar water moving southward through theFram Strait (Kellogg, 1980). CLIMAP reconstructions of the last gla-cial maximum suggest that there was a perennial sea-ice cover in theNordic Seas with only an isolated circulation cell in the GreenlandSea (CLIMAP Project Members, 1976; Kellogg, 1980). Terrestrialdata from northern Norway indicate seasonal open waters (Vorren etal., 1988), and an influx of Atlantic waters as far north as the FramStrait has been indicated recently (Dokken, 1995; Hebbeln et al.,1994). This may imply that a northward heat flux from open watersand its effects on atmospheric circulation may have been importantfactors for the rapid growth of high-latitude ice sheets. Previous workin these northern regions mostly concentrated on the last glacial/in-terglacial cycle; little is known on glacial variability beyond the lasttwo glacial/interglacial cycles. The drilling on Leg 151 provided thefirst sections that allow studies of paleoenvironments predating iso-tope Stage 6 in this region, thereby enabling insight into paleoenvi-ronmental evolution prior to the last glacial cycle.
MATERIALS AND METHODS
Hole 909B was cored to 135.1 mbsf, and Hole 912A was cored to145.4 mbsf. The work presented here covers the upper 20 m and 15m of these cores, respectively. The sediments are mainly dark gray,nonlithified, slightly to moderately bioturbated silty clay and clayeysilt. There are small visual variations through the sections. At thebreak between Cores 2H and 3H, in both Holes 909B and 912A, thereare overlapping core-log depths due to more than 100% recovery.These have been adjusted slightly to avoid the overlaps.
K. HEVR0Y, G. LAVIK, E. JANSEN
50° 40° 30° 20° 10c 10° 20
IN
58°
20° 10° 0°
Figure 1. Location map of the investigated sites and surface currents and oceanic fronts of the present ocean.
We analyzed 10-cm3 samples at 10-cm intervals from Hole 909Band 5-cm3 samples at 10-cm intervals from Hole 912A. The sampleswere wet sieved in the fractions <63 µm, 63-125 µm, 125-1000 µm,and >IOOO µm, and then dried and weighed. The 125- to 1000-µmfraction was dry sieved on a 150-µm sieve, and counting of biogenicand minerogenic (IRD) material was done on the 150- to 1000-µm
fraction. Due to the dominance (>90%) of Neogloboquadrina pachy-derma (sinistrally coiling), 1000 specimens of planktonic foramini-fers were normally counted to get a better statistical reliability. In ad-dition, minerogenic material was counted and classified in the 500-to 1000-µm fraction. The material in this fraction was divided into thefollowing groups: monocrystalline fragments (quartz and feldspar),
470
QUATERNARY PALEOCEANOGRAPHY AND PALEOCLIMATOLOGY
sedimentary rocks (sand-, silt-, and mudstones/shales), metamorphicand crystalline rocks, coal and detrital carbonate. Samples with morethan 20 grains were included in the results.
Stable isotope analyses were performed on a Finnigan MAT 251mass spectrometer on the GMS-laboratory at the University of Ber-gen. Foraminiferal samples were crushed, cleaned with methanol inan ultrasonic bath, and reacted with orthophosphoric acid at 70°C onan automated carbonate preparation line using individual acid bath("Kiel Device"). The reproducibility of the system based on replicatecarbonate powder standards is 0.06%o and 0.07%o for δ13C and δ 1 8 θ,respectively. The planktonic isotopes are measured on N. pachyder-ma (sinistrally coiling). In Hole 909B, benthic isotopes were mea-sured on Cibicides wuellerstorfi and Oridorsalis umbonatus. Theδ 1 8 θ values were corrected by +0.64%o for C. wuellerstorfi and+0.4%o for O. umbonatus (Graham et al, 1981). In Hole 912A, thebenthic species Cassidulina teretis, Islandiella nocrossa, and Nonionbarleeanum were measured. C. teretis is believed to secrete its shellclose to oxygen isotopic equilibrium (Jansen and Sejrup, 1987) andis not corrected. /. nocrossa values were corrected by -0.25%o, andN. barleeanum values were corrected by +0.16%e (Poole et al., inpress). Some samples were measured twice to check the robustnessof spikes in the record.
CHRONOLOGY
The chronology of the cores is primarily based on isotope stratig-raphy. In Hole 909B, the chronology is based both on oxygen andcarbon isotopes, whereas in Hole 912A it is primarily based on oxy-gen isotopes because the carbon isotopic record deviates substantial-ly from the normal records of the Nordic Seas and is difficult to in-terpret. At these high latitudes, meltwater and water mass variabilitysignificantly influence the oxygen isotopic composition of surfaceand deep waters, influencing both benthic and planktonic records.Thus, the isotope stratigraphy from this region is difficult to correlatein detail to the standard oxygen isotope stratigraphy. It is, however,possible to correlate the records to other deep-sea cores further southin the Nordic Seas (e.g., Vogelsang, 1990) that provide a bridge to theglobal oxygen isotope record. Another problem is the variable occur-rence of foraminifers. Several intervals of the isotope record havelow resolution due to samples barren of foraminifers, especially inthe lower parts of the section. Therefore, it is necessary to use otherparameters, such as the amount of ice-rafted material and the occur-rence of coal (Bischof et al., 1990), to support the interpretations andto make a more accurate chronology. These problems make the iso-tope stage determinations somewhat inaccurate, below Stage 5 inparticular.
Hole 909B
The isotope records shown in Figure 2 document many local over-prints on the oxygen isotope record, whereas the carbon isotoperecord conforms more with records from cores further south in theNordic Seas. In the planktonic isotope record, isotope Stage 1 is onlyrepresented by one sample with light δ 1 8 θ values (Fig. 2A) and heavyδ13C values (Fig. 2B). Isotope Stage 2 is clearly marked by the heavyδ 1 8 θ and light δ13C values from 0.2 to about 1 mbsf. Figure 2 docu-ments that Stage 2 is represented by a relatively high foraminifer con-tent, which has previously been described from the Fram Strait forthis stage (Hebbeln et al., 1994). Isotope Stage 3 is characterized bythree light δ 1 8 θ peaks. The first one, right after the Stage 3/4 bound-ary, is known from several isotope records from the Norwegian Seaas isotope Event 3.3.1 (Dokken, 1995; Fronval et al., 1995; Vogel-sang, 1990) and dated to around 55 ka (Martinson et al., 1987). Iso-tope Stage 4 shows light δ13C and heavy δ 1 8 θ values except for a lightisotope peak at about 2.5 mbsf. The marked occurrence of C. wuel-
lerstorfi (Fig. 2F) in the first half of Stage 4 was documented previ-ously in core M23398 from the southern Fram Strait by Dokken(1995). The single peak occurrence of Pullenia bulloides (Fig. 2F) isa marker for isotope Stage 5a in the Norwegian Sea (Haake andPflaumann, 1989) and in the Fram Strait (Hebbeln, 1992; Dokken,1995). Stage 5a also is marked by low δ 1 8 θ values and high δ13C val-ues. Stage 5c is characterized by the appearance of C. wuellerstorficombined with light δ 1 8 θ values. The maximum negative peak ofδ 1 8 θ in isotope Stage 5e might be lost in the core break between thelast sample in Stage 6 and the first in Stage 5e. There is only one sam-ple with a relatively light δ 1 8 θ value at this level, and it is not simul-taneous with the occurrence of C. wuellerstorfi as shown in othercores from the Fram Strait. Isotope Stage 6 is well defined by overalllight δ13C values, relatively heavy δ 1 8 θ values, and high amounts ofIRD. The high amount of coal in the 500-µm fraction (Fig. 3D) hasbeen described as a marker for Stage 6 in the Fram Strait by Bischofet al. (1990). In isotope Stage 7, there are very few samples withenough foraminifers for isotope measurements. There is a clear dis-tinction between heavy δ13C values in Stage 7 and light values inStages 6 and 8, which is common in Nordic Sea records. The lowerlimit of isotope Stage 8 is defined by the increase in IRD depositionand the appearance of coal. Early in this stage, there is a large lightisotope peak shown both in δ 1 8 θ and δ13C values that also was foundby R. Spielhagen (pers. comm., 1994) in cores from this area. IsotopeStage 9 includes two peaks of light δ 1 8 θ values, which might be in-terpreted as Substage 9.1 and 9.3, interrupted by a cold period withhigh amounts of IRD (Substage 9.2). Below isotope Stage 9 (9.5mbsf), the identification of isotope stages becomes unclear. Howev-er, two intervals from 11 to 13.5 mbsf and from 14 to 17.5 mbsf areenriched in coal and IRD and may be correlated to glacial isotopeStages 10 and 12. Based on this interpretation, Stage 12 has severalmeltwater pulses shown in the isotope records, or light δ 1 8 θ com-bined with light δ13C values, followed by a high input of IRD. IsotopeStage 11 is difficult to recognize in any of the records presented inthis work. There is a core break at 14 mbsf (Fig. 2) that is just abovethe last sample containing coal in Stage 12. Thus, most of the materialfrom Stage 11 could have been lost in the core break.
The average sedimentation rate is 3.88 cm/k.y. for the intervalstudied (isotope Stages 1-12), which is a bit lower than the averagerate of 4.75 cm/k.y. for the Brunhes (Fig. 4). The glacial periods havehigher sedimentation rates than the interglacials, except for Stage 9.The lower parts of the record, particularly Stages 10 and 12, havehigher sedimentation rates than the upper parts. The average sedi-mentation rate of the Brunhes lies between the sedimentation rates forStages 1-6 and 10 and 12. This constrains the isotope stratigraphy,which is hard to reconcile differently without imposing quite drasticchanges in sedimentation rates.
Hole 912A
Isotope Stage 1 is represented by low planktonic and benthic δ 1 8 θvalues (Fig. 5A, C). Two peaks with light δ 1 8 θ show Stepwise melt-ing after the last glaciation. These meltwater pulses are also shown bytwo small peaks in IRD. The upper part of this stage is missing. Iso-tope Stage 2 is well documented by high δ 1 8 θ values. There are abun-dant foraminifers in Stage 2 (Fig. 5E, F), in accordance with the re-sults of Hebbeln et al. (1994) from the Fram Strait and the resultsfrom Hole 909B. Isotope Stage 3 has generally lower δ 1 8 θ values,and it is marked by three light peaks, similar to those of Hole 909B.The placement of the Stage 3/4 boundary is based on the amount ofIRD (Fig. 6C) because there are no foraminifers in this interval.There is a relatively high input of IRD at the beginning of Stage 3, ashas been shown by Dokken (1995) and Fronval et al. (1995), that de-fines the beginning of Stage 3 in cores to the south of ODP Sites 909and 912. Oxygen isotope values are high in isotope Stage 4, clearlyshown by both planktonic and benthic records.
471

K. HEVR0Y, G. LAVIK, E. JANSEN
Figure 2. Isotope records in per thousand (%c) vs. PDB,
and biogenic data from Hole 909B. The numbers of the
isotope stages are on the top, and the glacial stages are
shaded. A. Planktonic δ 1 8 θ record in per thousand (%0)
vs. PDB, measured on N. pachyderma (sinistrally coil-
ing). B. Planktonic δ 1 3 C record measured on N. pachy-
derma (sinistrally coiling). Double measurements are
shown by both open and solid circles in (A) and (B). C.
Benthic δ 1 3 C record from O. umbonatus (solid circles =
left y-axis) and C. wuellerstorfi (open circles = right y-
axis). D. Benthic δ 1 8 θ record measured on O. umbon-
atus (solid circles) and C. wuellerstorfi (open circles),
corrected -0.4%o and +0.63%c, respectively. E. Content
of N. pachyderma (sinistrally coiling) per gram of dry
sediment in the >150-µm fraction. F. Content of C.
wuellerstorfi and P. bulloides per gram of dry sediment,
based on counts in the >150-µm fraction. G. Content of
O. umbonatus per gram of dry sediment, based on
counts in the >150-µm fraction. Black bars on depth
scale indicate core breaks.
B 9
~< H i : 111 I '
f i r s t •-,-.•" üi l i l l l " if
r2.o
1.5
1.0
0.5
0
V-»i
D
6000
4000
2000
U -S?
60 -j
40-
20-
0
150
100-
50
1 r
0 1
j i llilill
L***«βlSls
6 7 8 9 10Depth (mbsf)
Gl"T" T ' I ' g••'T""| r"• ] ""I (""I I I I
11 12 13 14 15 16 17 18 19
The Stage 4/5 boundary is well developed in the δ 1 8 θ record,showing a clear transition from high to low values. The planktonicisotope values from isotope Stage 5 show a light early peak and rela-tively uniform, heavier values in the upper part. This makes it diffi-cult to define substages in Stage 5. Ice rafting continues into Stage 5e,which is also shown by Dokken (1995) and Fronval (pers. comm.,1995) in cores to the south. The very low δ 1 8 θ value and high inputof IRD at ~8 mbsf could, therefore, reflect a melting event at the be-ginning of Substage 5e.
Isotope Stage 6 is defined by high δ 1 8 θ values around 11 mbsf thatgradually decline through the stage and culminating in a light melt-water peak. A lack of resolution may have prevented observation ofthe heavy upper substage of Stage 6; alternatively, there is a very longdeglacial sequence at Termination II in this core. IRD is present inhigh amounts throughout the stage, supporting its glacial designation.The appearance of coal is a marker for Stage 6 (Bischof et al., 1990),and the coal record from Site 909 (Fig. 3D) shows that this corre-sponds with our definition of Stage 6. Accordingly, we have used the
472
QUATERNARY PALEOCEANOGRAPHY AND PALEOCLIMATOLOGY
9 !t> II 12 13
m » m m m m i •' i ' i
0 1 7 8 9 10 11Depth (mbsf)
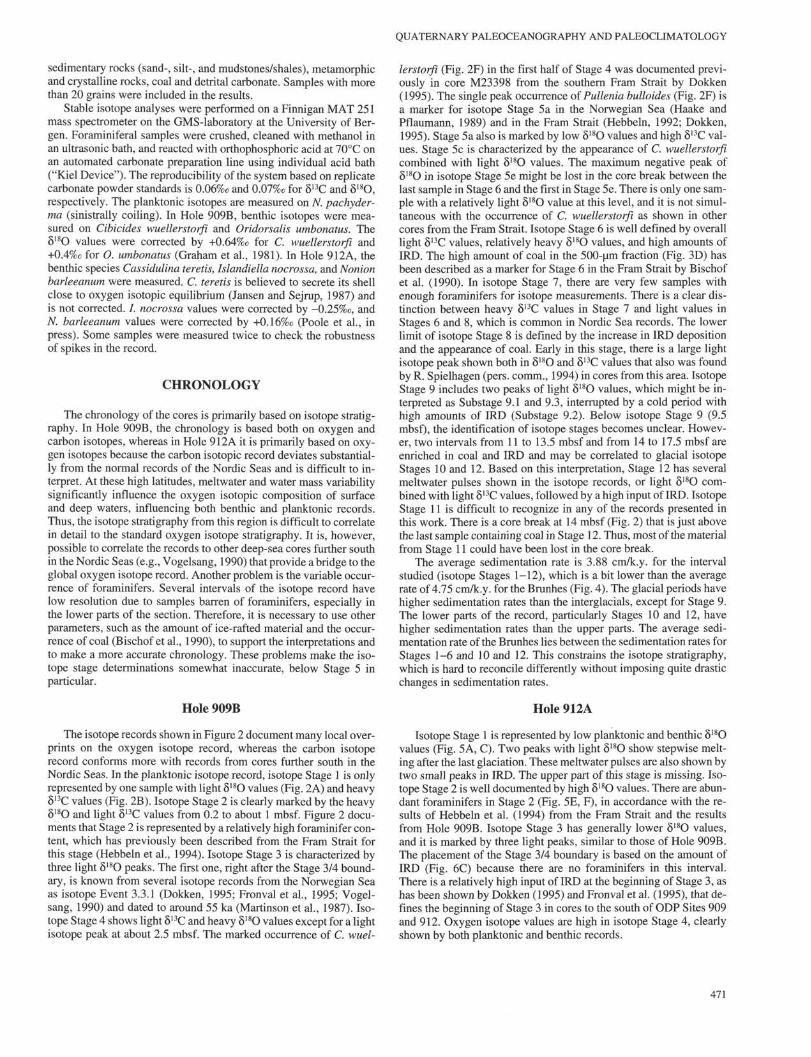
Figure 3. Planktonic isotopes in per thousand (‰) vs.PDB, and sedimentological data from Hole 909B. Thenumbers of the isotope stages are on top, and the coldstages are shaded. A. Planktonic δ 1 8 θ record measuredon N. pachy derma (sinistrally coiling). B. Planktonicδ1 3C record measured on N. pachyderma (sinistrallycoiling). Double measurements are shown by bothopen and solid circles in (A) and (B). C. IRD contentper gram of dry sediment, based on counts in the>150-µm fraction. D. Coal content in the >500-µmfraction in relative percentages, based on counts. E.Content of sedimentary rock fragments in relative per-centages, based on counts in the >500-mm fraction. F.Grain size (wt% >63 µm). G. The content of mono-crystalline rock fragments in relative percentages isbased on counts in the >500-µm fraction. The blackbars on depth scale indicate core breaks.
coal occurrence as additional information in defining the exact limitsof the stage. Isotope Stage 7 is defined from the light 518O values.
Average sedimentation rates have been calculated for each iso-tope stage (Fig. 7) using the SPECMAP time scale (Martinson et al.,1987). The sedimentation rate is quite linear during the last 200 k.y.,on average 6 cm/k.y. The lower part of the record has a much lowersedimentation rate of about 2.15 cm/k.y., but the chronology here is
not well resolved. If we extrapolate sedimentation rates to the Brun-hes/Matuyama boundary at 24.6 m, we obtain an average sedimenta-tion rate of 2.2 cm/k.y. It seems a bit unlikely that sedimentation rateswere that much lower in earlier glaciations compared to the two lastones, considering the size of the glaciations and the location of thissite. The apparent lower sedimentation rates might be explained by ahiatus, possibly at about 15 mbsf, where magnetic susceptibility data
473
K. HEVR0Y, G. LAVIK, E. JANSEN
1
20
15-
10
6.8 cm/k.y.
1.7 cm/k.y.
7 cm/k.y.
3.34 cm/k.y
200 300
Age (k.y.)
400
800
500
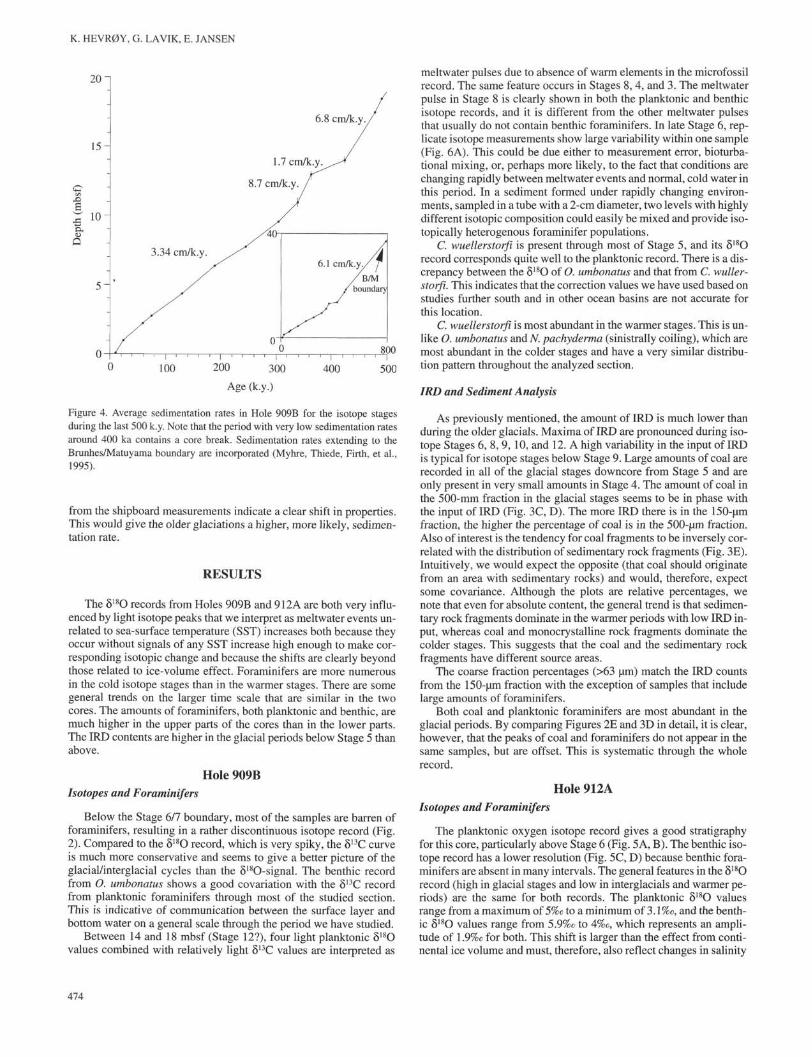
Figure 4. Average sedimentation rates in Hole 909B for the isotope stagesduring the last 500 k.y. Note that the period with very low sedimentation ratesaround 400 ka contains a core break. Sedimentation rates extending to theBrunhes/Matuyama boundary are incorporated (Myhre, Thiede, Firth, et al.,1995).
from the shipboard measurements indicate a clear shift in properties.This would give the older glaciations a higher, more likely, sedimen-tation rate.
RESULTS
The δ 1 8 θ records from Holes 909B and 912A are both very influ-enced by light isotope peaks that we interpret as meltwater events un-related to sea-surface temperature (SST) increases both because theyoccur without signals of any SST increase high enough to make cor-responding isotopic change and because the shifts are clearly beyondthose related to ice-volume effect. Foraminifers are more numerousin the cold isotope stages than in the warmer stages. There are somegeneral trends on the larger time scale that are similar in the twocores. The amounts of foraminifers, both planktonic and benthic, aremuch higher in the upper parts of the cores than in the lower parts.The IRD contents are higher in the glacial periods below Stage 5 thanabove.
Hole 909B
Isotopes and Foraminifers
Below the Stage 6/7 boundary, most of the samples are barren offoraminifers, resulting in a rather discontinuous isotope record (Fig.2). Compared to the δ 1 8 θ record, which is very spiky, the δ13C curveis much more conservative and seems to give a better picture of theglacial/interglacial cycles than the δ18O-signal. The benthic recordfrom O. umbonatus shows a good covariation with the δ13C recordfrom planktonic foraminifers through most of the studied section.This is indicative of communication between the surface layer andbottom water on a general scale through the period we have studied.
Between 14 and 18 mbsf (Stage 12?), four light planktonic δ 1 8 θvalues combined with relatively light δ13C values are interpreted as
meltwater pulses due to absence of warm elements in the microfossilrecord. The same feature occurs in Stages 8, 4, and 3. The meltwaterpulse in Stage 8 is clearly shown in both the planktonic and benthicisotope records, and it is different from the other meltwater pulsesthat usually do not contain benthic foraminifers. In late Stage 6, rep-licate isotope measurements show large variability within one sample(Fig. 6A). This could be due either to measurement error, bioturba-tional mixing, or, perhaps more likely, to the fact that conditions arechanging rapidly between meltwater events and normal, cold water inthis period. In a sediment formed under rapidly changing environ-ments, sampled in a tube with a 2-cm diameter, two levels with highlydifferent isotopic composition could easily be mixed and provide iso-topically heterogenous foraminifer populations.
C. wuellerstorfi is present through most of Stage 5, and its δ 1 8 θrecord corresponds quite well to the planktonic record. There is a dis-crepancy between the δ 1 8 θ of O. umbonatus and that from C. wuller-storfi• This indicates that the correction values we have used based onstudies further south and in other ocean basins are not accurate forthis location.
C. wuellerstorfi is most abundant in the warmer stages. This is un-like O. umbonatus and N. pachyderma (sinistrally coiling), which aremost abundant in the colder stages and have a very similar distribu-tion pattern throughout the analyzed section.
IRD and Sediment Analysis
As previously mentioned, the amount of IRD is much lower thanduring the older glacials. Maxima of IRD are pronounced during iso-tope Stages 6, 8, 9, 10, and 12. A high variability in the input of IRDis typical for isotope stages below Stage 9. Large amounts of coal arerecorded in all of the glacial stages downcore from Stage 5 and areonly present in very small amounts in Stage 4. The amount of coal inthe 500-mm fraction in the glacial stages seems to be in phase withthe input of IRD (Fig. 3C, D). The more IRD there is in the 150-µmfraction, the higher the percentage of coal is in the 500-µm fraction.Also of interest is the tendency for coal fragments to be inversely cor-related with the distribution of sedimentary rock fragments (Fig. 3E).Intuitively, we would expect the opposite (that coal should originatefrom an area with sedimentary rocks) and would, therefore, expectsome covariance. Although the plots are relative percentages, wenote that even for absolute content, the general trend is that sedimen-tary rock fragments dominate in the warmer periods with low IRD in-put, whereas coal and monocrystalline rock fragments dominate thecolder stages. This suggests that the coal and the sedimentary rockfragments have different source areas.
The coarse fraction percentages (>63 µm) match the IRD countsfrom the 150-µm fraction with the exception of samples that includelarge amounts of foraminifers.
Both coal and planktonic foraminifers are most abundant in theglacial periods. By comparing Figures 2E and 3D in detail, it is clear,however, that the peaks of coal and foraminifers do not appear in thesame samples, but are offset. This is systematic through the wholerecord.
Hole 912A
Isotopes and Foraminifers
The planktonic oxygen isotope record gives a good stratigraphyfor this core, particularly above Stage 6 (Fig. 5A, B). The benthic iso-tope record has a lower resolution (Fig. 5C, D) because benthic fora-minifers are absent in many intervals. The general features in the δ 1 8 θrecord (high in glacial stages and low in interglacials and warmer pe-riods) are the same for both records. The planktonic δ 1 8 θ valuesrange from a maximum of 5%c to a minimum of 3. l%e, and the benth-ic δ 1 8 θ values range from 5.9%e to 4%o, which represents an ampli-tude of 1.9%e for both. This shift is larger than the effect from conti-nental ice volume and must, therefore, also reflect changes in salinity
474

QUATERNARY PALEOCEANOGRAPHY AND PALEOCLIMATOLOGY
9?
300-
200-
100-
0 Aio 4 5 10 11 15
Depth (mbsf)
Figure 5. Isotope records in per thousand (%o) vs. PDB,and biogenous data from Hole 912A. The numbers ofthe isotope stages are on top, and the glacial stages areshaded. A. Planktonic δ 1 8 θ record measured on N.pachyderma (sinistrally coiling). B. Planktonic δ1 3Crecord measured on N. pachyderma (sinistrally coiling).Double measurements are shown by both open andsolid circles in (A) and (B). C. Benthic δ 1 8 θ recordmeasured on C. teretis, and on /. nocrossa and N. bar-leeanum, which were corrected -0.25%c and +0.16%o,respectively. D. Benthic δ1 3C record measured on C.teretis (open circles), /. nocrossa (solid circles), and N.barleanum (triangles). E. Content of planktonic fora-minifers per gram of dry sediment, based on counts inthe >150-µm fraction. F. Content of benthic foramini-fers per gram of dry sediment, based on counts in the>150-µm fraction. Black bars on depth scale indicatecore breaks.
and temperature. The absolute δ 1 8 θ values are about \%c higher in thebenthic record than in the planktonic. This may be caused by differ-ences in the isotope composition of surface and deep water and/or bydifferences in temperature. If we employ the 0.4%o deviation fromequilibrium for N. pachyderma (sinistrally coiling) proposed by Jo-hannessen (1992) and subtract the planktonic/benthic oxygen isotopegradient by this amount, the surface/deep-water temperature gradientwas in general only a few degrees during the growth season of N.pachyderma. Carbon isotopes exhibit frequent variability throughoutthe record and within each isotope stage, and there is little covariancebetween the carbon and oxygen isotopes. Peaks of light planktonicδ 1 8 θ values are a common feature through the record, both in "cold"and "warm" isotope stages, with the most prominent peak occurringin Stage 8. This probably reflects periods of low salinity in the sur-
face water, mainly caused by the melting of icebergs or meltwaterrunoff from the adjacent continent. Stage 6 has relatively light δ 1 8 θvalues through most of the period, which may be an indication ofhigh deglacial sedimentation rates or that the upper heavy substage ofStage 6 is missing due to sample spacing/resolution. These featuresare not clearly shown in the benthic record and may be explained bylow resolution or by the fact that some low salinity/meltwater eventswere not transmitted from surface to deep water. The interglacialsand the warmer periods mainly have δ 1 8 θ values below 4.5%o. Stage9 is an exception, having variabilities in δ 1 8 θ from interglacial to gla-cial values, but there are some uncertainties concerning the bound-aries of this stage.
Foraminifers are most common in the upper parts of the core; be-low 6 m they are sporadic and are present in very small amounts in
475
K. HEVR0Y, G. LAVIK, E. JANSEN
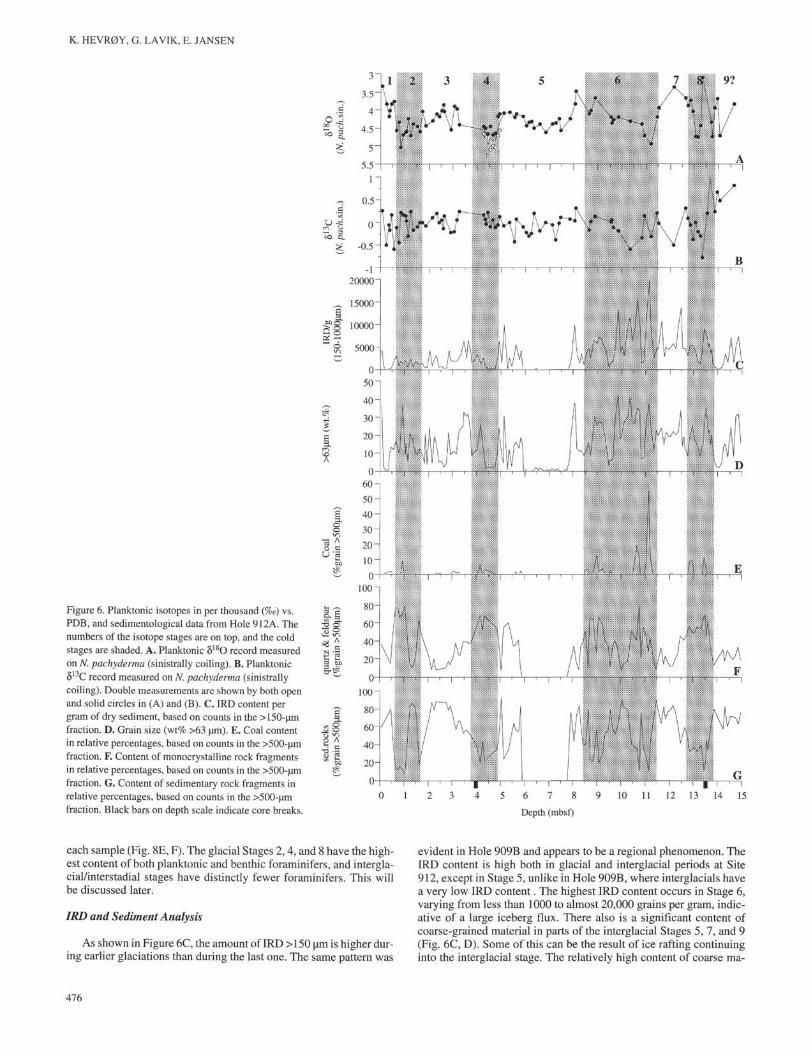
Figure 6. Planktonic isotopes in per thousand (%o) vs.PDB, and sedimentological data from Hole 912A. Thenumbers of the isotope stages are on top, and the coldstages are shaded. A. Planktonic δ 1 8 θ record measuredon TV. pachyderma (sinistrally coiling). B. Planktonicδ1 3C record measured on TV. pachyderma (sinistrallycoiling). Double measurements are shown by both openand solid circles in (A) and (B). C. IRD content pergram of dry sediment, based on counts in the >150-µmfraction. D. Grain size (wt% >63 µm). E. Coal contentin relative percentages, based on counts in the >500-µmfraction. F. Content of monocrystalline rock fragmentsin relative percentages, based on counts in the >500-µmfraction. G. Content of sedimentary rock fragments inrelative percentages, based on counts in the >500-µmfraction. Black bars on depth scale indicate core breaks.
To
Ur< .
sin
.(T
V. p
ack
in.)
V. p
ack
s
3
3.5
4
4.5
5
5.5
1
0.5
0
-0.5
20000"
15000-
10000"
5000-
' ". • • i :•
6 7
Depth (mbsf)
each sample (Fig. 8E, F). The glacial Stages 2,4, and 8 have the high-est content of both planktonic and benthic foraminifers, and intergla-cial/interstadial stages have distinctly fewer foraminifers. This willbe discussed later.
IRD and Sediment Analysis
As shown in Figure 6C, the amount of IRD >150 µm is higher dur-ing earlier glaciations than during the last one. The same pattern was
evident in Hole 909B and appears to be a regional phenomenon. TheIRD content is high both in glacial and interglacial periods at Site912, except in Stage 5, unlike in Hole 909B, where interglacials havea very low IRD content. The highest IRD content occurs in Stage 6,varying from less than 1000 to almost 20,000 grains per gram, indic-ative of a large iceberg flux. There also is a significant content ofcoarse-grained material in parts of the interglacial Stages 5, 7, and 9(Fig. 6C, D). Some of this can be the result of ice rafting continuinginto the interglacial stage. The relatively high content of coarse ma-
476
QUATERNARY PALEOCEANOGRAPHY AND PALEOCLIMATOLOGY
15
10 -
5 -
2.15cm/k.y.
5.97cm/k.y
800
50 100 150 200
Age (k.y.)
~π 1 —250 300 350
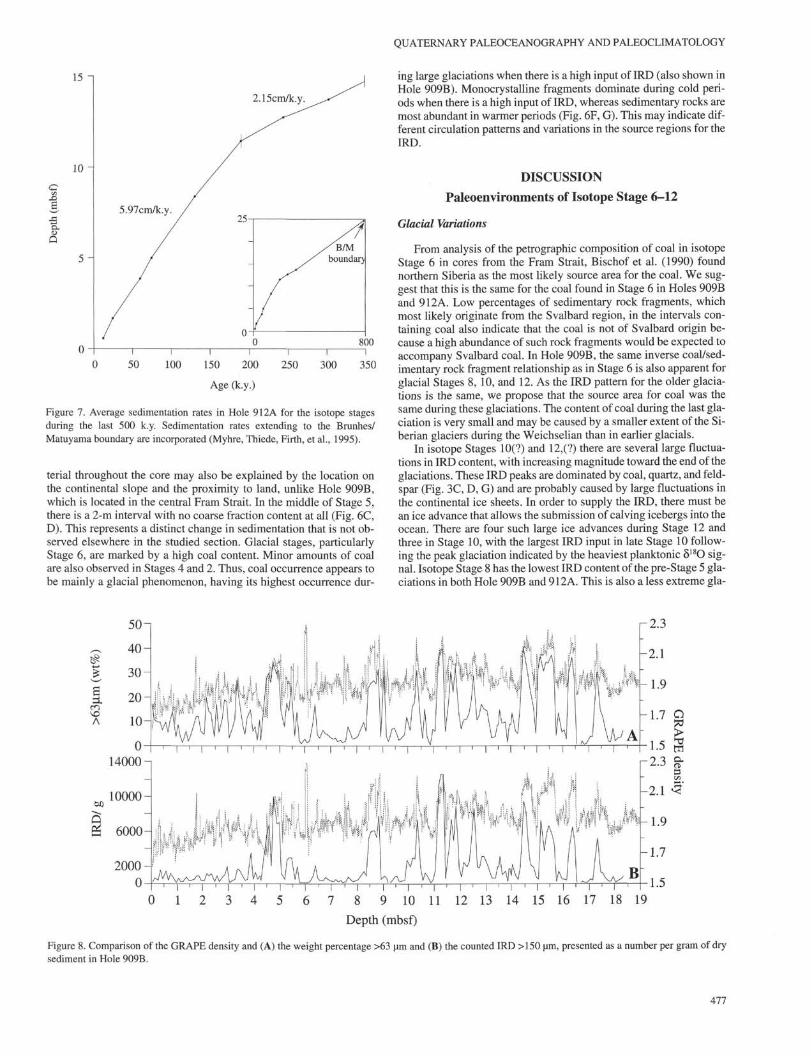
Figure 7. Average sedimentation rates in Hole 912A for the isotope stagesduring the last 500 k.y. Sedimentation rates extending to the Brunhes/Matuyama boundary are incorporated (Myhre, Thiede, Firth, et al., 1995).
terial throughout the core may also be explained by the location onthe continental slope and the proximity to land, unlike Hole 909B,which is located in the central Fram Strait. In the middle of Stage 5,there is a 2-m interval with no coarse fraction content at all (Fig. 6C,D). This represents a distinct change in sedimentation that is not ob-served elsewhere in the studied section. Glacial stages, particularlyStage 6, are marked by a high coal content. Minor amounts of coalare also observed in Stages 4 and 2. Thus, coal occurrence appears tobe mainly a glacial phenomenon, having its highest occurrence dur-
ing large glaciations when there is a high input of IRD (also shown inHole 909B). Monocrystalline fragments dominate during cold peri-ods when there is a high input of IRD, whereas sedimentary rocks aremost abundant in warmer periods (Fig. 6F, G). This may indicate dif-ferent circulation patterns and variations in the source regions for theIRD.
DISCUSSION
Paleoenvironments of Isotope Stage 6-12
Glacial Variations
From analysis of the petrographic composition of coal in isotopeStage 6 in cores from the Fram Strait, Bischof et al. (1990) foundnorthern Siberia as the most likely source area for the coal. We sug-gest that this is the same for the coal found in Stage 6 in Holes 909Band 912A. Low percentages of sedimentary rock fragments, whichmost likely originate from the Svalbard region, in the intervals con-taining coal also indicate that the coal is not of Svalbard origin be-cause a high abundance of such rock fragments would be expected toaccompany Svalbard coal. In Hole 909B, the same inverse coal/sed-imentary rock fragment relationship as in Stage 6 is also apparent forglacial Stages 8, 10, and 12. As the IRD pattern for the older glacia-tions is the same, we propose that the source area for coal was thesame during these glaciations. The content of coal during the last gla-ciation is very small and may be caused by a smaller extent of the Si-berian glaciers during the Weichselian than in earlier glacials.
In isotope Stages 10(?) and 12,(?) there are several large fluctua-tions in IRD content, with increasing magnitude toward the end of theglaciations. These IRD peaks are dominated by coal, quartz, and feld-spar (Fig. 3C, D, G) and are probably caused by large fluctuations inthe continental ice sheets. In order to supply the IRD, there must bean ice advance that allows the submission of calving icebergs into theocean. There are four such large ice advances during Stage 12 andthree in Stage 10, with the largest IRD input in late Stage 10 follow-ing the peak glaciation indicated by the heaviest planktonic δ 1 8 θ sig-nal. Isotope Stage 8 has the lowest IRD content of the pre-Stage 5 gla-ciations in both Hole 909B and 912A. This is also a less extreme gla-
9 10 11 12 13 14 15 16 17 18 19
Figure 8. Comparison of the GRAPE density and (A) the weight percentage >63 µm and (B) the counted IRD >150 µm, presented as a number per gram of drysediment in Hole 909B.
477

K. HEVR0Y, G. LAVIK, E. JANSEN
cial in the global isotope record (Shackleton and Opdyke, 1973). InHole 912A, Stage 6 shows an opposite trend compared to Hole 909B,with the heaviest planktonic δ 1 8 θ values and highest content of IRDand coal observed in early Stage 6. Also, the peaks in IRD and coaldecrease in size toward the end.
In both cores, the interglacial Stage 9 has an internal IRD peak ofabout the same magnitude as in glacial Stage 8. The peak has, how-ever, a very different composition of the 500-µm fraction than in theglacial stages. The sedimentary rock fragments are dominating inStage 9, indicating Svalbard as the most likely source area for theIRD, whereas Stage 8 is more dominated by the coal, quartz/feldspartype of IRD, with possible origins in Siberia. This appears to be ageneral phenomenon, where IRD from interglacial/interstadial stagesin general are different from the glacial stages and contain a largerproportion of fragments with probable origin in the Svalbard area, asdocumented in a detailed study of Spielhagen (1990). This indicatesthat glaciations of more local scope are the case in warmer stages orduring initiation of glaciation.
Surface Circulation
Glacial stages contain more foraminifers than interglacials, withmaximum foraminifer abundance occurring between the IRD/coalpeaks. This puzzling observation is consistent with more detailedstudies of IRD/foraminifer relationships for the last glacial (Stages 2and 4) by Dokken (1995) and Fronval et al. (1995), which show a se-ries of foraminifer abundance maxima interbedded with IRD peaks inthe Nordic Seas, in a fashion similar to Heinrich layer cycles in theNorth Atlantic. The most apparent conclusion from our study is thatthis style is a common feature, especially of the younger glacials dat-ing back to Stage 12. It appears to reflect a close coupling of icebergdischarges from the Eurasian ice sheets immediately followed byopen-water conditions that support foraminifer productivity. It is ap-parent from studies of the modern foraminifer distribution that per-manent sea-ice cover results in low foraminifer content in the sedi-ments (Johannessen et al., 1994). Hence, the high foraminifer contentindicates open waters either in the form of persistent polynias or,more likely, a result of advances of Atlantic waters as far north as theFram Strait/Yermak region after deglaciation events of the glacials.This indicates a very dynamic role for the surface circulation of theNordic Seas during ice buildup and decay, probably closely coupledwith large instabilities of the high-latitude ice sheets. The heat releasefrom the seasonally open ocean and the latent heat from the resultingprecipitation could potentially provide negative feedback to icegrowth. Apparently, this is not enough to counteract the positive ef-fect of increased moisture on ice growth. Because the foraminiferrich zones come after the IRD peaks, it does not appear as if the heatincrease led to the deglaciations, which rather appear to take placewithin cold intervals (Fronval et al., 1995; Dokken, 1995).
The lower foraminiferal content in interglacials, as particularlyseen in Hole 912A (Fig. 5) is most likely a result of dissolution andlow carbonate production. Carbonate dissolution is widespread onthe shelf and slopes around the Barents Sea (Steinsund and Hald,1994), resulting from the production of corrosive brines on the shelfthat may cascade down the slope as density-driven currents and alsoproduce dissolution at greater depths on the margin. Because theshelf areas were smaller due to eustatic lowering and with periodicice-sheet cover, this process was probably less important during gla-cials.
The lower foraminifer content in interglacials in Hole 909B can-not be explained by this mechanism. The site is located away fromthe margins in the deep Fram Strait, which is connected without re-strictions to deep waters of the Nordic Seas. If corrosive interglacialdeep waters were important in the Fram Strait, they should be impor-tant elsewhere as well. Carbonate and foraminifer abundance recordsfurther south do not support this, however, and we conclude that the
low foraminiferal content in Hole 909B is a reflection of lower fora-minifer productivity (i.e., a more persistent sea-ice cover).
In general, the foraminifer content appears to increase upcore, in-dicating that the system of open waters within glaciations is develop-ing and is most pronounced during the last two glacial cycles.
Deep Water
The quite close correspondence between the planktonic andbenthic δ13C records in Hole 909B indicates that there is communica-tion between the surface and deep water through most of the record.Below Stage 9, there are very few benthic isotope measurements, butwhere they exist they show the same pattern. In Hole 912A, there islittle coherency between the planktonic and benthic δ13C records,probably because bottom waters on the Svalbard margin are formedat times by shelf processes and are influenced by carbon cycling onthe shelf.
Paleoenvironments of Isotope Stage 5
Glaciation Record
The onset of isotope Stage 5 is marked by a light δ 1 8 θ peak occur-ring simultaneously with an IRD peak. This is most clearly shown inHole 912A and indicates an overprint of meltwater at Termination II,culminating in early Stage 5e. This is also found at the V0ring Plateauand the Iceland Plateau (T. Fronval, pers. comm., 1995). The firstpart of Stage 5e might be lost in the core break in Hole 909B, and,therefore, the meltwater signal is not clearly shown in this record. AtHole 912A, Substage 5d is followed by an increased amount of IRDoccurring simultaneously with lighter δ 1 8 θ values, probably as a re-sult of a deglacial phase on Svalbard at the 5d/5c transition. Terres-trial data also indicate considerable ice-sheet growth on Svalbardduring 5d (Mangerud and Svendsen, 1992). Hebbeln (1992) did notfind evidence for any increased ice rafting in the central Fram Straitduring Stage 5, but the Hole 909B data and the data presented byDokken (1995) indicate a glacial advance probably reaching the innershelf area with a transport of icebergs westward to the central FramStrait.
The IRD data from Hole 912A give a totally different picture. Inmid-Stage 5, there is an interval with no coarse fraction at all (i.e., noIRD), indicating the rapid sedimentation of fines. This can also beseen in the data of Hebbeln (1992) from the same area, showing thelowest input of coarse-grained material in the cores close to the shelfor at the continental slope. A possible explanation is that the north-ernmost parts of the Fram Strait and/or the shelf area around northernSvalbard were covered by sea ice during this period and that fine sed-iments were deposited under the ice. If so, melting of icebergs during/after Stage 5d did not occur this far north, and ice rafting can, there-fore, only be observed further south on the shelf and in the centralFram Strait.
Stage 5 a is marked by a shift toward lighter planktonic δ 1 8 θ val-ues in both holes, also recognized by Köhler and Spielhagen (1990).In Hole 912A, this shift corresponds with an increased input of IRD,contrary to Hole 909B, where the IRD content slightly decreases. Thedifference in IRD deposition between the two sites may be the resultof a northward surface current transporting icebergs in a narrow"belt" along the coast or because most of the melting occurred at theshelf and slope instead of reaching the central parts of the Fram Strait.
Surface- and Deep-Water Paleoceanography
The δ 1 8 θ values in Stage 5e are close to modern values. Due topossible influence of low salinities in this kind of environment, it isdifficult to extract temperature information from the δ 1 8 θ values. It isalso difficult to assess the SSTs of Stage 5e due to the low resolutionand low foraminifer content in Hole 912A and the possible missing
478
QUATERNARY PALEOCEANOGRAPHY AND PALEOCLIMATOLOGY
interval at the core break in Hole 909B. There is a tendency for plank-tonic δ13C values in 909B to be lighter in the "warm" substages ofisotope Stage 5 than in 5d and 5b. Using the present distribution ofplanktonic δ13C in the Nordic Seas (Johannessen et al., 1994), whereAtlantic waters are more negative than Arctic water, this can beviewed as a higher influx of Atlantic water in Substages 5e, 5c, and5a and more Arctic water in 5d and 5b.
The different IRD records in Stage 5 at the two sites may be dueto the current pattern and/or sea-ice cover, which prevented icebergsfrom drifting to the Yermak Plateau during Substage 5d to 5b. InHole 909B, planktonic and benthic foraminifers are present in the"warmer" periods of Stage 5, thus, as there is a very low foraminifercontent during this period in Hole 912A, favoring this assumption.The low foraminifer content in Hole 912A in Stage 5 may also be dueto dilution by high nonbiogenic sedimentation and dissolution fromcorrosive brines. Stage 5a exhibits much lighter 518O values than therest of Stage 5. In Hole 909B, it almost reaches present values, andforaminifers are present in high amounts, indicating a strong influx ofwarm Atlantic water, also shown in data from Gard and Backman(1990) and Köhler and Spielhagen (1990). The low amount of IRD inHole 909B in Substage 5a can be explained by a northward currenttransporting icebergs along western Svalbard, not reaching the posi-tion of Site 909 further west in the Fram Strait. The dominance ofsedimentary rock fragments in the warmer periods supports these in-terpretations, assuming that most of these originate from Svalbardand the Barents Sea. During open-water conditions, there is a north-ward surface circulation along the coast of Spitsbergen that transportsicebergs with sedimentary rocks from the (eastern) Svalbard/BarentsSea area. This is most clearly shown in Hole 909B, where sedimen-tary rocks are dominant in most parts of Stage 5 and, therefore, mostlikely reflect open-water conditions in the central Fram Strait throughmost of this period. During Stage 5a, monocrystalline rock fragmentsdominate, possibly indicating a source area other than Svalbard (pos-sibly Scandinavia), with IRD transported northward with Atlanticwater masses.
Based on the good coherency between planktonic and benthicδ13C values in Hole 909B (Fig. 2B, C), we assume that deep waterwas formed in the Nordic Seas throughout isotope Stage 5.
Paleoenvironments of Isotope Stages 1-4
Glaciation Record
The transition from Stage 4 to 5 is clearly shown by the increasein δ 1 8 θ values. The low δ 1 8 θ values through most of the period prob-ably reflect the growing continental ice sheets, but some meltwater/low-salinity influence is apparent in Hole 909B. The IRD content islow in the middle part of Stage 4, possibly because this is an ice-growth phase with less calving than in a deglaciation phase after anice-sheet culmination. The increased IRD content at the end of thestage indicates increased calving as the glaciers reach the coast andcan be correlated to other cores in the Fram Strait (Hebbeln, 1992)and to terrestrial data (Mangerud and Svendsen, 1992).
The disintegration of the ice sheet culminates in a distinct meltwa-ter pulse in early Stage 3 as shown by the very low δ 1 8 θ and δ13C val-ues (Fig. 3A, B) and an IRD peak (Fig. 6C). This strong componentof meltwater is suggested by Dokken (1995) to represent the meltingof an ice sheet that covered major parts of the shelf areas, includingthe Barents Sea, during Stage 4. Influence from meltwater, indicatedin the spiky δ 1 8 θ (and δ13C) records, is a pronounced feature throughStage 3 and is also documented in cores further south (Fronval et al.,1995; Vogelsang, 1990). This can probably be related to smaller iceadvances that at least reach the fjords. The meltwater pulses are notassociated with a marked increase in IRD content in Hole 909B (Fig.3), unlike the situation in Hole 912A (Fig. 6), where ice rafting seemsto be relatively high through most of the stage. This can again reflectthe transport of ice northward in a relatively narrow zone along the
west coast of Svalbard. Stage 2 is clearly recognized by the high δ 1 8 θvalues reflecting the glaciation maximum. The IRD content is rela-tively low during this period, which may be the result of a growingice sheet with little meltwater and iceberg production. Some lightδ 1 8 θ peaks probably indicate some melting, just before and after themaximum glaciation, but they are not paralleled by a significant in-crease in IRD input. Melting of the Weichselian ice sheet is shown bya light δ 1 8 θ signal at the transition to Stage 1. Only the initial meltingis present in Hole 909B. In Hole 912A, two meltwater pulses are rec-ognized. A significant increase in IRD parallels this meltwater signal.
Surface- and Deep-Water Paleoceanography
High foraminifer content during Stages 2 and 4 indicates periodswith seasonal open-water conditions with an influx of Atlantic waterall the way north to the Yermak Plateau. These periods also have adominance of monocrystalline rock fragments, probably pointing tosource area other than Svalbard. Most likely, these fragments origi-nate from Scandinavia (and/or Great Britain) and were transportednorthward with the Atlantic water masses. The intervals that containno foraminifers show a dominance of sedimentary rocks, probablywith the Svalbard/Barents Sea region as the source area. DuringStage 3, there is a dominance of sedimentary rock fragments through-out the period. This can be connected to the breakup of glaciations onSvalbard and the Barents Sea shelf with little input of ice-rafted ma-terial from other sources. The same is shown in Stage 1 with a dom-inance of sedimentary rocks during the initial melting, and then aslight increase in the amount of crystalline rocks that occurs simulta-neously with a decrease in δ 1 8 θ values in the uppermost sample, in-dicating a stronger influx of water masses from the south.
Formation of deep water in the Nordic Seas seems to be continu-ous from Stage 1 to 4, inferred from the parallel planktonic andbenthic δ13C records. Bottom water formed in the Arctic Ocean and/or the Barents Sea may flow over the Yermak Plateau, especially dur-ing "warmer" periods when brine formation occurs at the shelf areas.
Long-Term Evolution of Glaciations
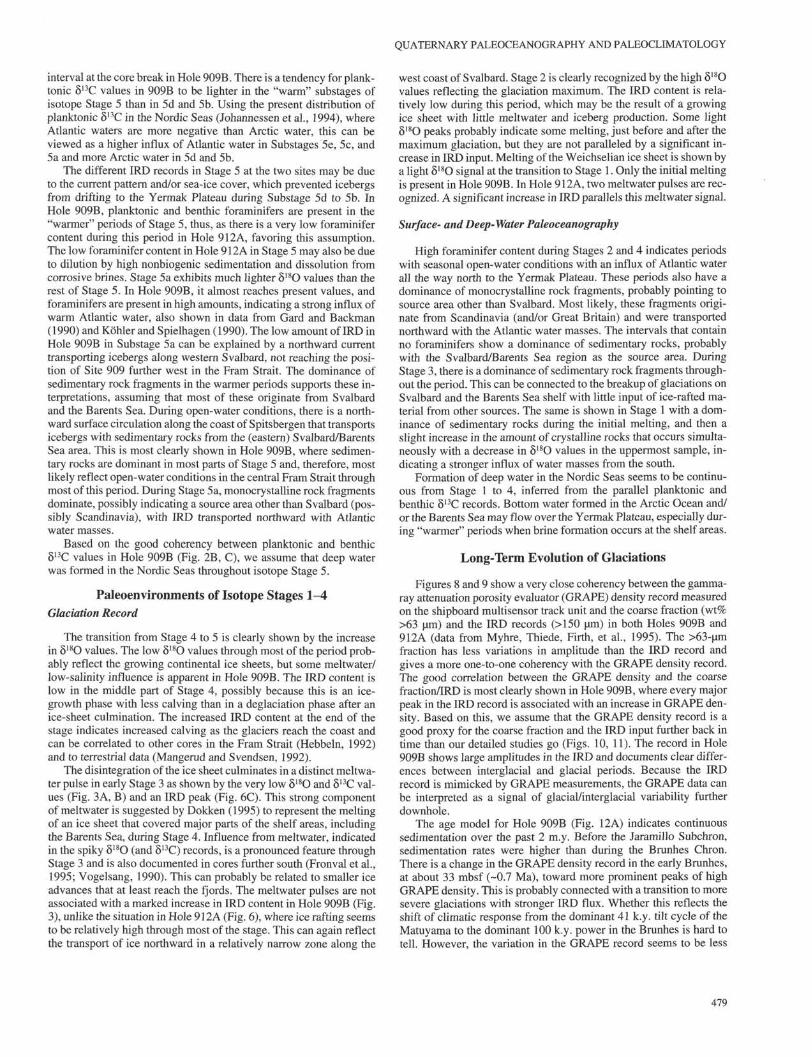
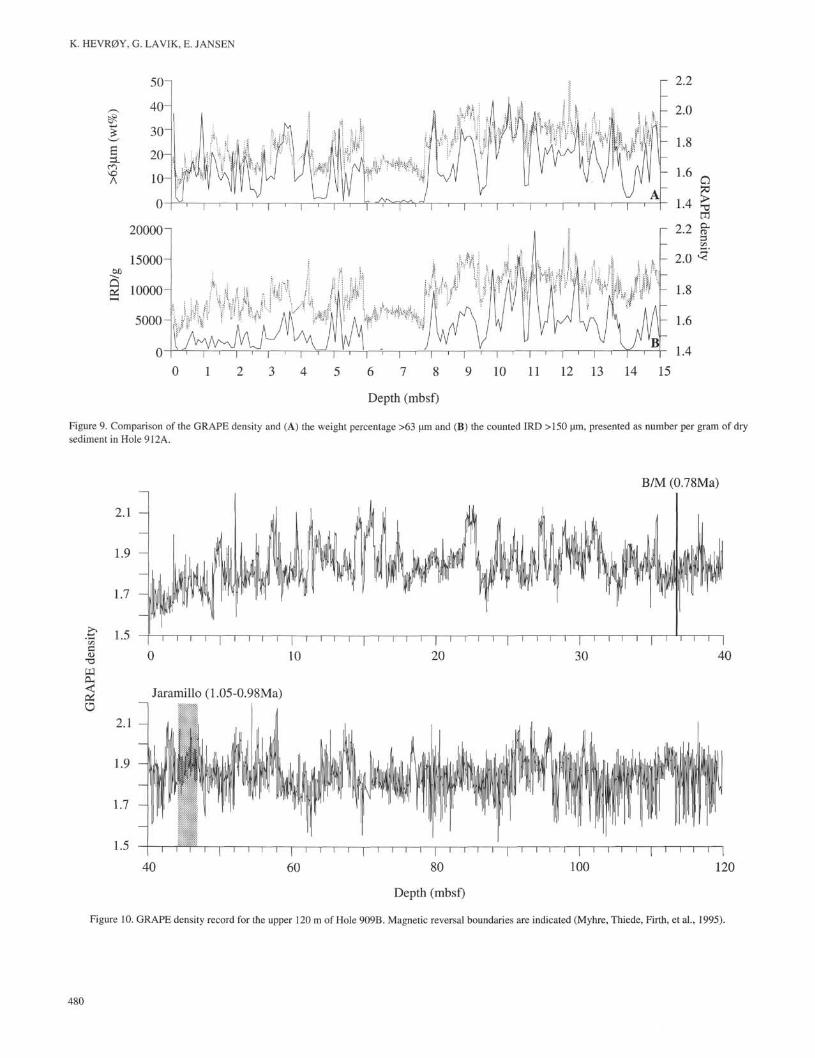
Figures 8 and 9 show a very close coherency between the gamma-ray attenuation porosity evaluator (GRAPE) density record measuredon the shipboard multisensor track unit and the coarse fraction (wt%>63 µm) and the IRD records (>150 µm) in both Holes 909B and912A (data from Myhre, Thiede, Firth, et al., 1995). The >63-µmfraction has less variations in amplitude than the IRD record andgives a more one-to-one coherency with the GRAPE density record.The good correlation between the GRAPE density and the coarsefraction/IRD is most clearly shown in Hole 909B, where every majorpeak in the IRD record is associated with an increase in GRAPE den-sity. Based on this, we assume that the GRAPE density record is agood proxy for the coarse fraction and the IRD input further back intime than our detailed studies go (Figs. 10, 11). The record in Hole909B shows large amplitudes in the IRD and documents clear differ-ences between interglacial and glacial periods. Because the IRDrecord is mimicked by GRAPE measurements, the GRAPE data canbe interpreted as a signal of glacial/interglacial variability furtherdownhole.
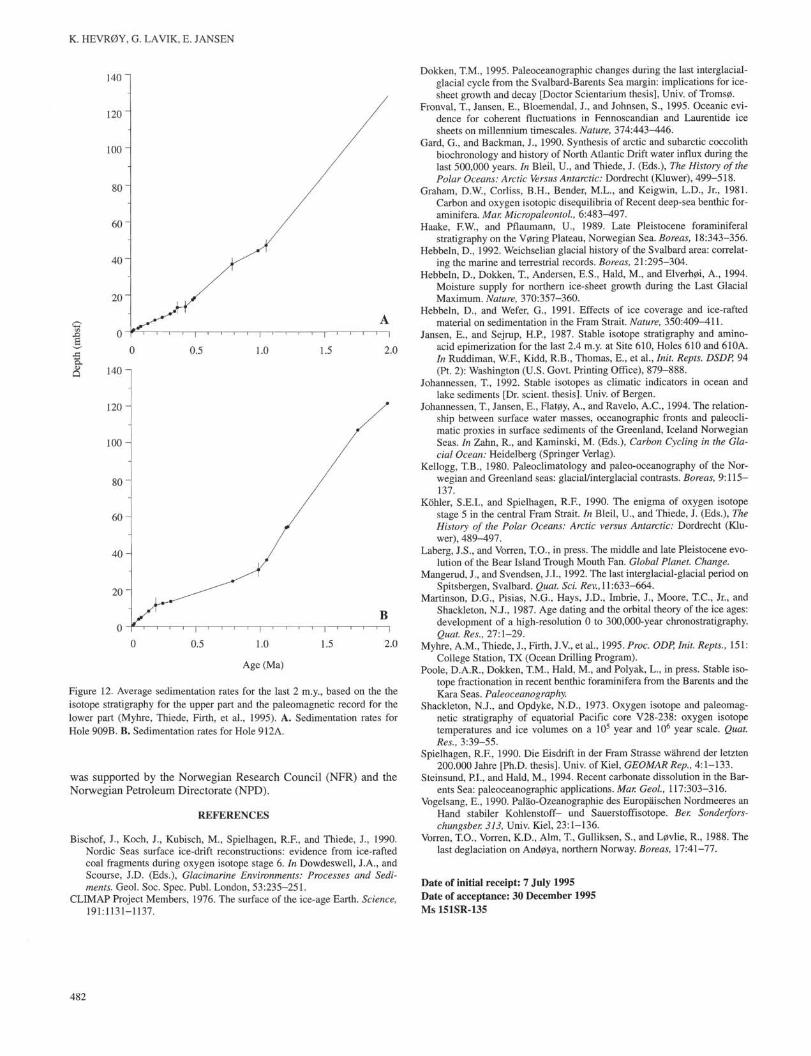
The age model for Hole 909B (Fig. 12A) indicates continuoussedimentation over the past 2 m.y. Before the Jaramillo Subchron,sedimentation rates were higher than during the Brunhes Chron.There is a change in the GRAPE density record in the early Brunhes,at about 33 mbsf (-0.7 Ma), toward more prominent peaks of highGRAPE density. This is probably connected with a transition to moresevere glaciations with stronger IRD flux. Whether this reflects theshift of climatic response from the dominant 41 k.y. tilt cycle of theMatuyama to the dominant 100 k.y. power in the Brunhes is hard totell. However, the variation in the GRAPE record seems to be less
479
K. HEVR0Y, G. LAVIK, E. JANSEN
10 11 12 13 14 150 1 2 3 4 5 6 7
Depth (mbsf)
Figure 9. Comparison of the GRAPE density and (A) the weight percentage >63 µm and (B) the counted IRD >150 µm, presented as number per gram of drysediment in Hole 912A.
B/M (0.78Ma)
2.1
Jaramillo (1.05-0.98Ma)
i i i i i i i i i i i i i—i—i—i—i—i—i—i—i—i—i—i—i—i—i—i—i—i—i—i1.5
Depth (mbsf)
Figure 10. GRAPE density record for the upper 120 m of Hole 909B. Magnetic reversal boundaries are indicated (Myhre, Thiede, Firth, et al., 1995).
480

QUATERNARY PALEOCEANOGRAPHY AND PALEOCLIMATOLOGY
B/M (0.78Ma)
1.4
30 40 50 60 70 80
Depth (mbsf)
Figure 11. GRAPE density record for the upper 80 m of Hole 912A. Magnetic reversal boundaries are indicated (Myhre, Thiede, Firth, et al., 1995).
dramatic in the pre-Brunhes period than after the shift in the earlyBrunhes.
In Hole 912A, there is probably a hiatus or condensed sectionwithin the Brunhes Chron as evidenced by the low sedimentationrates from the Brunhes/Matuyama boundary up to 15 mbsf, but thesedimentation rates are also low during the period from the Jaramilloto the Brunhes/Matuyama boundary (Fig. 12B). Similar to that inHole 909B, there is a change in the GRAPE record in the early Brun-hes Chron, but unlike that in Hole 909B, there are some large fluctu-ations just after the Jaramillo Subchron. The pre-Jaramillo period hassedimentation rates twice as high as the post-Jaramillo in Hole 912A(Fig. 12B), and there are equally large fluctuations in the GRAPEdensity record here as above 20 mbsf. This can be due to more pro-nounced erosion and deposition that affects the margin site more thanthe one in the central Fram Strait, and both GRAPE density and sed-imentation rates thus indicate large-scale erosion in the EuropeanArctic during the Matuyama with 41-k.y. cyclicity dominating theglobal ice-volume record. The higher sedimentation rates prior to theBrunhes agree with evidence from the Bear Island Fan that sedimen-tation rates were two to four times higher during this period than dur-ing the late Pleistocene (Laberg and Vorren, in press). The total dom-inance of 41-k.y. cycles in global ice-volume records in the Matuya-ma may indicate ice-sheet fluctuations more confined to the highlatitudes than in the late Quaternary because the 41-k.y. influence oninsolation is strongest at high latitudes. Although time series studieshave to document the frequency pattern of IRD/glacial activity dur-ing the Matuyama, the evidence from Hole 912A indicates that high-latitude glaciation indeed was important during the Matuyama.
CONCLUSIONS
The main features in the paleoenvironmental evolution during thelast 300 k.y. are similar in the records from the Fram Strait and theYermak Plateau. Earlier glaciations (isotope Stages 6-12) were moresevere than the last one, as shown by a higher IRD flux and the ap-pearance of Siberian coal in IRD peaks. The content of foraminifersthrough time indicates a trend toward more open water, with a higherproduction during the two last glacial/interglacial cycles. Seasonalopen-water conditions with a high foraminifer production occurredthrough all the glacial periods, indicating that the surface circulationof the Nordic Seas in glacial stages plays an important role in thegrowth and decay of high-latitude ice sheets, bringing moisture andheat northward also in the glacials. Deep-water formation seems to becontinuous in the Nordic Seas through most of the period presentedin this study, as shown by the parallel planktonic and benthic δ13Crecord in Hole 909B. There was an apparent change in the style ofglaciation in the earlier parts of the Brunhes Chron with the emer-gence of more strongly developed IRD peaks than before. Strong gla-cial activity is an important element also in the Matuyama Chron inthe European Arctic.
ACKNOWLEDGMENTS
We thank Odd Hansen and Rune S0raas for mass spectrometeroperation and Else Loodtz for help with the manuscript. Reviews byRalph Thiedemann and Tore Vorren were very helpful. This study
481
K. HEVR0Y, G. LAVIK, E. JANSEN
0.5 1.0 1.5 2.0
140
120
100-
6 0 -
4 0 -
20
B
0.5 1.0
Age (Ma)
1.5 2.0
Figure 12. Average sedimentation rates for the last 2 m.y., based on the theisotope stratigraphy for the upper part and the paleomagnetic record for thelower part (Myhre, Thiede, Firth, et al., 1995). A. Sedimentation rates forHole 909B. B. Sedimentation rates for Hole 912A.
was supported by the Norwegian Research Council (NFR) and theNorwegian Petroleum Directorate (NPD).
REFERENCES
Bischof, J., Koch, J., Kubisch, M., Spielhagen, R.F., and Thiede, J., 1990.Nordic Seas surface ice-drift reconstructions: evidence from ice-raftedcoal fragments during oxygen isotope stage 6. In Dowdeswell, J.A., andScourse, J.D. (Eds.), Glacimarine Environments: Processes and Sedi-ments. Geol. Soc. Spec. Publ. London, 53:235-251.
CLIMAP Project Members, 1976. The surface of the ice-age Earth. Science,191:1131-1137.
Dokken, T.M., 1995. Paleoceanographic changes during the last interglacial-glacial cycle from the Svalbard-Barents Sea margin: implications for ice-sheet growth and decay [Doctor Scientarium thesis], Univ. of Troms0.
Fronval, T., Jansen, E., Bloemendal, J., and Johnsen, S., 1995. Oceanic evi-dence for coherent fluctuations in Fennoscandian and Laurentide icesheets on millennium timescales. Nature, 374:443-446.
Gard, G., and Backman, J., 1990. Synthesis of arctic and subarctic Coccolithbiochronology and history of North Atlantic Drift water influx during thelast 500,000 years. In Bleil, U., and Thiede, J. (Eds.), The History of thePolar Oceans: Arctic Versus Antarctic: Dordrecht (Kluwer), 499-518.
Graham, D.W., Corliss, B.H., Bender, M.L., and Keigwin, L.D., Jr., 1981.Carbon and oxygen isotopic disequilibria of Recent deep-sea benthic for-aminifera. Mar. Micropaleontol, 6:483-497.
Haake, F.W., and Pflaumann, U., 1989. Late Pleistocene foraminiferalstratigraphy on the V0ring Plateau, Norwegian Sea. Boreas, 18:343-356.
Hebbeln, D., 1992. Weichselian glacial history of the Svalbard area: correlat-ing the marine and terrestrial records. Boreas, 21:295-304.
Hebbeln, D., Dokken, T., Andersen, E.S., Hald, M., and Elverh0i, A., 1994.Moisture supply for northern ice-sheet growth during the Last GlacialMaximum. Nature, 370:357-360.
Hebbeln, D., and Wefer, G., 1991. Effects of ice coverage and ice-raftedmaterial on sedimentation in the Fram Strait. Nature, 350:409-411.
Jansen, E., and Sejrup, H.P., 1987. Stable isotope stratigraphy and amino-acid epimerization for the last 2.4 m.y. at Site 610, Holes 610 and 610A.In Ruddiman, W.F., Kidd, R.B., Thomas, E., et al., Init. Repts. DSDP, 94(Pt. 2): Washington (U.S. Govt. Printing Office), 879-888.
Johannessen, T., 1992. Stable isotopes as climatic indicators in ocean andlake sediments [Dr. scient. thesis]. Univ. of Bergen.
Johannessen, T., Jansen, E., Flat0y, A., and Ravelo, A.C., 1994. The relation-ship between surface water masses, oceanographic fronts and paleocli-matic proxies in surface sediments of the Greenland, Iceland NorwegianSeas. In Zahn, R., and Kaminski, M. (Eds.), Carbon Cycling in the Gla-cial Ocean: Heidelberg (Springer Verlag).
Kellogg, T.B., 1980. Paleoclimatology and paleo-oceanography of the Nor-wegian and Greenland seas: glacial/interglacial contrasts. Boreas, 9:115—137.
Köhler, S.E.I., and Spielhagen, R.F., 1990. The enigma of oxygen isotopestage 5 in the central Fram Strait. In Bleil, U., and Thiede, J. (Eds.), TheHistory of the Polar Oceans: Arctic versus Antarctic: Dordrecht (Klu-wer), 489-497.
Laberg, J.S., and Vorren, T.O., in press. The middle and late Pleistocene evo-lution of the Bear Island Trough Mouth Fan. Global Planet. Change.
Mangerud, J., and Svendsen, J.I., 1992. The last interglacial-glacial period onSpitsbergen, Svalbard. Quat. Sci. Rev., 11:633-664.
Martinson, D.G., Pisias, N.G., Hays, J.D., Imbrie, J., Moore, T.C., Jr., andShackleton, N.J., 1987. Age dating and the orbital theory of the ice ages:development of a high-resolution 0 to 300,000-year chronostratigraphy.Quat. Res., 27:1-29.
Myhre, A.M., Thiede, J., Firth, J.V., et al., 1995. Proc. ODP, Init. Repts., 151:College Station, TX (Ocean Drilling Program).
Poole, D.A.R., Dokken, T.M., Hald, M., and Polyak, L., in press. Stable iso-tope fractionation in recent benthic foraminifera from the Barents and theKara Seas. Paleoceanography.
Shackleton, N.J., and Opdyke, N.D., 1973. Oxygen isotope and paleomag-netic stratigraphy of equatorial Pacific core V28-238: oxygen isotopetemperatures and ice volumes on a 105 year and 106 year scale. Quat.Res., 3:39-55.
Spielhagen, R.F., 1990. Die Eisdrift in der Fram Strasse wahrend der letzten200.000 Jahre [Ph.D. thesis]. Univ. of Kiel, GEOMAR Rep., 4:1-133.
Steinsund, P.I., and Hald, M., 1994. Recent carbonate dissolution in the Bar-ents Sea: paleoceanographic applications. Mar. Geol, 117:303-316.
Vogelsang, E., 1990. Palao-Ozeanographie des Europaischen Nordmeeres anHand stabiler Kohlenstoff- und Sauerstoffisotope. Ber. Sonderfors-chungsber. 313, Univ. Kiel, 23:1-136.
Vorren, T.O., Vorren, K.D., Aim, T., Gulliksen, S., and L0vlie, R., 1988. Thelast deglaciation on And0ya, northern Norway. Boreas, 17:41-77.
Date of initial receipt: 7 July 1995Date of acceptance: 30 December 1995Ms 151SR-135