Embed Size (px)
Citation preview
Aus dem Max-Planck-Institut für Psychiatrie München Direktor der Klinik und Chefarzt: Prof. Dr. Dr. Martin E. Keck
24 drugs as potential SKP2
Inhibitors: a novel approach to finding new antidepressants
Dissertation zum Erwerb des Doktorgrades der Medizin
an der medizinischen Fakultät der Ludwig-Maximilians-Universität München
vorgelegt von Marie Louise Frevert
aus Bielefeld
2017
Mit Genehmigung der Medizinischen Fakultät der Universität München
Berichterstatter: Prof. Dr. med. Günter Karl Stalla Mitberichterstatter: PD Dr. med. Cornelius Schüle Prof. Dr. Peter Zwanzger Mitbetreuung durch den promovierten Mitarbeiter: Dr. rer. nat. Nils Gassen PD Dr. Theo Rein Dekan: Prof. Dr. med. dent. Reinhard Hickel Tag der mündlichen Prüfung: 30.03.2017
Table of Contents
1 Zusammenfassung ........................................................................................................................ 1
2 Abstract ............................................................................................................................................ 2
3 Introduction .................................................................................................................................... 3 3.1 Epidemiology and Definition of Major Depression .................................................................. 3 3.2 Pharmacological treatment options of MDD .............................................................................. 5 3.3 The Pathophysiology of MDD ........................................................................................................... 6 3.4 Autophagy ............................................................................................................................................... 7 3.5 Autophagy in Depression .................................................................................................................. 8 3.6 FKBP51 .................................................................................................................................................... 8 3.7 My research ............................................................................................................................................ 9
4 Material and Methods ............................................................................................................... 13 4.1 Materials .............................................................................................................................................. 13
4.1.1 Technical Equipment ............................................................................................................................... 13 4.1.2 Chemicals, Reagents and Buffers ........................................................................................................ 13 4.1.3 Antibodies..................................................................................................................................................... 15 4.1.4 Sofware .......................................................................................................................................................... 16
4.2 Methods ................................................................................................................................................ 16 4.2.1 Primary cultures of rat astrocytes (already provided) .............................................................. 16 4.2.2 MTT Assay .................................................................................................................................................... 16 4.2.3 Cell culture ................................................................................................................................................... 17 4.2.4 Bafilomycin Assays ................................................................................................................................... 17 4.2.5 BCA Assay, SDS gel, Western Blotting ............................................................................................... 17 4.2.7 Animal treatment and behavioural experiments (conducted by Georgia Balsevich) ... 19
5 Results ............................................................................................................................................ 20 5.1 Identification of appropriate drug concentrations .............................................................. 20 5.2 Western Blot Analyses .................................................................................................................... 22
5.2.1 Etoposide, Xanthohumol, ABT-737 and Topotecan .................................................................... 22 5.2.2 17-AAG, Gossypol, Securinine and Tamoxifen .............................................................................. 22 5.2.3 Valinomycin, Minocycline, Salinomycin and Parthenolide ...................................................... 23 5.2.4 Pimozide, Haloperidol, Perphenazide and Clomipramine ....................................................... 23 5.2.5 Rasagiline, Bromocriptin mesylate, Pyrvinium Pamoate and Niclosamide ...................... 23 5.2.6 Perhexilene maleate, Luteolin, Celecoxibe and Amiloride ....................................................... 24 5.2.7 SMIP004, a SKP2 E3 ligase Inhibitor ................................................................................................. 24
5.3 Autophagic Flux Assays ................................................................................................................... 24 5.3.1 Chemotherapeutic drugs on autophagic flux ................................................................................. 24 5.3.2 Antibiotics on autophagic flux ............................................................................................................. 25 5.3.3 Psychoactive Drugs on autophagic flux ............................................................................................ 25 5.3.4 Antibiotic and Antineoplastic drugs on autophagic flux ........................................................... 25 5.3.5 NSAID and Diuretic on autophagic flux ............................................................................................ 25 5.3.6 Anthelminthics on autophagic flux .................................................................................................... 25
5.4 Forced Swim Test (carried out by Georgia Balsevich) ........................................................ 26
6 Discussion ..................................................................................................................................... 26 6.1 The need for new antidepressants ............................................................................................. 26 6.2 MTT Assays .......................................................................................................................................... 27 6.3 Levels of p27 ....................................................................................................................................... 28 6.4 Levels of p27 in accordance with Beclin1 ................................................................................ 28 6.5 Beclin1 and Vps34 ............................................................................................................................ 29 6.6 Bafilomycin Assays and assay of p62 degradation ............................................................... 30 6.7 Forced Swim Test .............................................................................................................................. 32 6.8 Potential novel antidepressants .................................................................................................. 33

7 Conclusion and Outlook ........................................................................................................... 35
8 Bibliography ................................................................................................................................ 47
9 Danksagung .................................................................................................................................. 55
1
1 Zusammenfassung Major Depression ist eine belastende, weit verbreitete Krankheit. Derzeit wird sie meist
mit Antidepressiva behandelt, welche die Verfügbarkeit von Serotonin und/oder Norad-
renalin im synaptischen Spalt erhöhen. Eine hohe Anzahl von depressiven Patienten re-
agiert jedoch entweder gar nicht oder in insuffizientem Maße auf diese Erstlinienthera-
pie: Niedrige Remissions- und hohe Chronifizierungsraten sowie der verzögerte Wirk-
eintritt von bis zu 6 Wochen deuten darauf hin, dass die Monoaminmangelhypothese
unzulänglich ist. Daher bedarf es der Entwicklung neuer – mehr spezifischer, potenterer
und schneller wirkender - Antidepressiva . In der Pathogenese von verschiedenen
Krankheiten wie zum Beispiel diverser Krebsarten und neurodegenerativen Erkrankun-
gen wie Parkinson, Alzheimer und Huntington scheint die Autophagie, ein intrazellulä-
rer Prozess eine große Rolle zu spielen, bei dem Zellen Makromoleküle und Zellbestand-
teile abbauen und wiederverwerten. Neue Studien konnten zeigen, dass Marker der
Autophagie sowie in den Prozess eingebundene Moleküle wie z.B. Beclin1 auch nach
einer antidepressiven Therapie mit Serotonin Wiederaufnahmehemmern erhöhte Werte
aufweisen. Darüber hinaus scheint eine Stabilisierung von Beclin1 (und somit eine Au-
tophagieinduktion) einen antidepressiven Effekt auszulösen. In der hier vorliegenden
Arbeit wurden 24 Medikamente, die in einem Hochdurchsatz-Screen als SKP2 E3 ligase
Hemmer identifiziert worden sind, als potentielle neue Antidepressiva in primären Rat-
tenastrozyten in nichttoxischer Dosis gestestet. Marker/Moleküle wie Beclin1, LC3 und
Vps34 sowie der Zellzyklus Inhibitor p27 dienten der Western Blot Analyse. Die Appli-
kation von Bafilomycin A1 und die Quantifizierung des p62 Abbaus ermöglichten die
Beobachtung des autophagischen Flusses. Im Ergebnis hat sich gezeigt, dass Medika-
mente wie Salinomycin, Celecoxibe, Etoposide, Xanthohumol und Perphenazine einen
2
positiven Effekt auf die Autophagie hatten und somit für eine antidepressive Therapie
erfolgsversprechend sein könnten. Salinomycin wurde ferner im Forced Swim Test in
Mäusen untersucht. Mäuse, die damit injiziert worden waren, strampelten signifikant
mehr und ließen sich weniger treiben als die Kontrollgruppe der Tiere, die mit Sodium-
chlorid behandelt worden waren. Dies deutet auf einen antidepressiven Effekt von Sali-
nomycin hin. Die Erhöhung der Autophagie scheint ein großes Potential für die Behand-
lung von Depressionen zu besitzen. In weiteren Studien muss jedoch exploriert werden,
ob wirklich die Autophagie, der Umsatz von Proteinen an sich, oder die durch die Ini-
tatorkomplexe angestoßenen Membranprozesse der antidepressiven Wirkung zugrunde
liegen. Bevor entsprechende Medikamente in klinischen Studien getestet werden kön-
nen, bedarf es außerdem weiterer Experimente mit einer größeren Palette von auto-
phagischen Markern und einer Erforschung ihrer Bluthirnschrankengängigkeit.
2 Abstract
Major depression is a debilitating and highly prevalent disease that up to now has been
treated predominantly with antidepressants that increase the availability of serotonin
and/or noradrenaline in the synaptic cleft. High rates of non-responders to first line
therapy and high levels of chronicity within patients, however, demonstrate the limits of
the monoamine hypothesis of depression. Thus the search for novel, more-rapidly acting
and more effective antidepressants has become the focus of much research during the
past years. Autophagy, a process whereby cells salvage and recycle cellular macromole-
cules or organelles involving dynamic reorganization and fusion of membranous struc-
tures in response to stress, has been implicated as playing a role in several diseases,
namedly different cancers and neurodegenerative diseases such as Parkinson’s, Hun-
tington’s and Alzheimer’s. It has recently been observed that autophagic markers such
3
as Beclin1 were increased following treatment with serotonin reuptake inhibitors and
conversely, a stabilisation of Beclin1 (and therefore autophagic pathways) might lead to
an antidepressant-like effect. 24 substances that were found to be inhibitors of the SKP2
E3 ligase via a high throughput screen were tested as potential autophagy inducers and
thus novel antidepressants and primary rat astrocytes were treated with them in non-
toxic concentrations. Effects on autophagic markers or molecules involved in autophagy
such as Beclin1, LC3, and Vps34, as well as the cyclin dependent kinase p27, were inves-
tigated via Western Blot. In addition, effects on autophagic flux were determined with
Bafilomycin A1 and p62 degradation assays. As a result, I could show that drugs such as
Salinomycin, Celecoxibe, Etoposide, Xanthohumol and Perphenazine increased au-
tophagic markers, making them promising candidates for the treatment of major de-
pression. The effects of Salinomycin were further tested on mice subjected to a forced
swim test. Here, Salinomycin was found to increase struggling and to decrease the time
spent floating, thus exhibiting an antidepressant-like effect. An increase in autophagy
seems to harbor a large psychopharmacological potential. Yet it still needs to be seen
whether autophagy, the recycling of proteins per se, or the membrane processes kicked
off by the initiator complexes underly the antidepressant action. Hence, before proceed-
ing to test the respective substances in clinical trials, further research is needed to ex-
pand the range of autophagic markers examined, check the drugs’ blood-brain-barrier
crossing potentials, and test the substances in further animal experiments.
3 Introduction
3.1 Epidemiology and Definition of Major Depression Major Depressive Disorder (MDD) is a medical condition that affects about 350 million
people worldwide.1 Unipolar depressive disorders are the third leading cause of the
4
total global burden of disease2, taking into account premature mortality, disability and
loss of health. The life-time prevalence of MDD is 20% in men and 30% in women3. MDD
is an “affective” disorder, predominantly concerning mood, but also affecting sleep
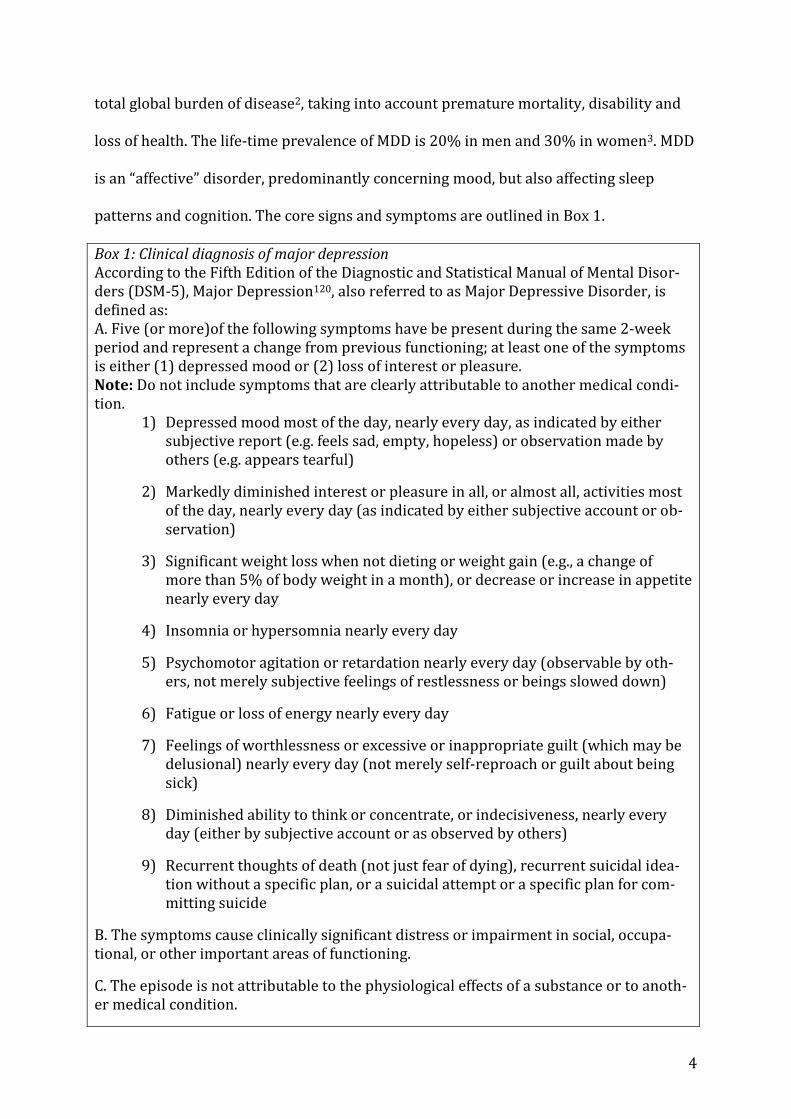
patterns and cognition. The core signs and symptoms are outlined in Box 1.
Box 1: Clinical diagnosis of major depression According to the Fifth Edition of the Diagnostic and Statistical Manual of Mental Disor-ders (DSM-5), Major Depression120, also referred to as Major Depressive Disorder, is defined as: A. Five (or more)of the following symptoms have be present during the same 2-week period and represent a change from previous functioning; at least one of the symptoms is either (1) depressed mood or (2) loss of interest or pleasure. Note: Do not include symptoms that are clearly attributable to another medical condi-tion.
1) Depressed mood most of the day, nearly every day, as indicated by either subjective report (e.g. feels sad, empty, hopeless) or observation made by others (e.g. appears tearful)
2) Markedly diminished interest or pleasure in all, or almost all, activities most of the day, nearly every day (as indicated by either subjective account or ob-servation)
3) Significant weight loss when not dieting or weight gain (e.g., a change of more than 5% of body weight in a month), or decrease or increase in appetite nearly every day
4) Insomnia or hypersomnia nearly every day
5) Psychomotor agitation or retardation nearly every day (observable by oth-ers, not merely subjective feelings of restlessness or beings slowed down)
6) Fatigue or loss of energy nearly every day
7) Feelings of worthlessness or excessive or inappropriate guilt (which may be delusional) nearly every day (not merely self-reproach or guilt about being sick)
8) Diminished ability to think or concentrate, or indecisiveness, nearly every day (either by subjective account or as observed by others)
9) Recurrent thoughts of death (not just fear of dying), recurrent suicidal idea-tion without a specific plan, or a suicidal attempt or a specific plan for com-mitting suicide
B. The symptoms cause clinically significant distress or impairment in social, occupa-tional, or other important areas of functioning.
C. The episode is not attributable to the physiological effects of a substance or to anoth-er medical condition.
5
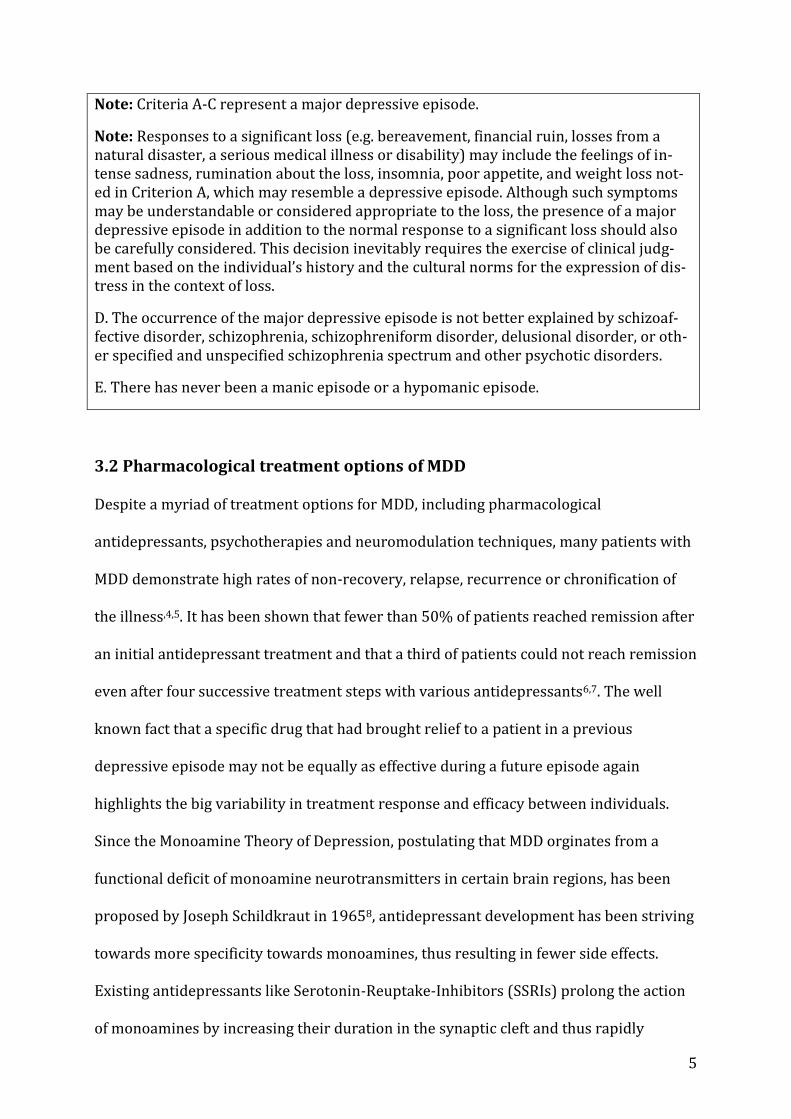
Note: Criteria A-C represent a major depressive episode.
Note: Responses to a significant loss (e.g. bereavement, financial ruin, losses from a natural disaster, a serious medical illness or disability) may include the feelings of in-tense sadness, rumination about the loss, insomnia, poor appetite, and weight loss not-ed in Criterion A, which may resemble a depressive episode. Although such symptoms may be understandable or considered appropriate to the loss, the presence of a major depressive episode in addition to the normal response to a significant loss should also be carefully considered. This decision inevitably requires the exercise of clinical judg-ment based on the individual’s history and the cultural norms for the expression of dis-tress in the context of loss.
D. The occurrence of the major depressive episode is not better explained by schizoaf-fective disorder, schizophrenia, schizophreniform disorder, delusional disorder, or oth-er specified and unspecified schizophrenia spectrum and other psychotic disorders.
E. There has never been a manic episode or a hypomanic episode.
3.2 Pharmacological treatment options of MDD Despite a myriad of treatment options for MDD, including pharmacological
antidepressants, psychotherapies and neuromodulation techniques, many patients with
MDD demonstrate high rates of non-recovery, relapse, recurrence or chronification of
the illness,4,5. It has been shown that fewer than 50% of patients reached remission after
an initial antidepressant treatment and that a third of patients could not reach remission
even after four successive treatment steps with various antidepressants6,7. The well
known fact that a specific drug that had brought relief to a patient in a previous
depressive episode may not be equally as effective during a future episode again
highlights the big variability in treatment response and efficacy between individuals.
Since the Monoamine Theory of Depression, postulating that MDD orginates from a
functional deficit of monoamine neurotransmitters in certain brain regions, has been
proposed by Joseph Schildkraut in 19658, antidepressant development has been striving
towards more specificity towards monoamines, thus resulting in fewer side effects.
Existing antidepressants like Serotonin-Reuptake-Inhibitors (SSRIs) prolong the action
of monoamines by increasing their duration in the synaptic cleft and thus rapidly
6
ameliorate the proposed imbalance of neurotransmitters in the brain. Their delayed
onset of action with regard to behavioural changes as well as their poor effectiveness
accentuate the need to understand their underlying mechanism of action.
Since the discovery of tricyclic antidepressants in the 1950s by serendipity, no radically
new antidepressant drug therapies have been developed based on an a prori approach
to the pathophysiology of depression9.
3.3 The Pathophysiology of MDD
As to this date, many different studies trying to elucidate the pathogenesis of MDD have
been carried out and several different theories have been formulated10. Abnormalities in
the Hypothalamic-Pituitary- Axis (HPA) involved in the acute stress response as well as
its several subsidiary parts have been implicated as a potential target for antidepressant
action- such as the adrenocorticotropic hormone (ACTH), corticotropin releasing
hormone (CRH) and cortisol itself, as well as various receptors such as the
Glucocorticoid Receptor (GR)11, the CRH Receptors, or the vasopressin receptor12. Other
studies have presented inflammatory cytokines as contributors to the development of
depression13–16 thus hinting at cytokine antagonists or anti-inflammatory drugs as po-
tential therapeutic strategies. Postmortem studies that have shown that the cell densi-
ties-of neurons and glia cells- as well as neuronal size, synaptic proteins and synapses in
MDD patients were decreased in frontal and subcortical brain regions17–19, taken togeth-
er with MRI studies that document smaller hippocampal volumes in depressed pa-
tients20, lead to the hypothesis that antidepressants might have a possible role in neuro-
genesis21, mainly through the expression of Brain Derived Neurotrophic Factor
(BDNF)22. As can be seen from the list above, there are many different approaches that
are being tested for their efficacy in treating MDD. Recently, it has also been shown that
7
classic tricyclic antidepressants induce autophagy. The exact role of autophagy in this
scenario, however, still has to be further investigated.
3.4 Autophagy Autophagy, coming from the Greek “auto”-onself and “phagy”-to eat, is a conserved cel-
lular degradation process that ensures the quality of the cytoplasm, the intactness of
cells and therefore tissues, by controlling the elimination of waste- damaged macromol-
ecules such as protein aggregates and organelles - out of the cell. Different forms of au-
tophagy exist: chaperone-mediated, micro- and macroautophagy. In this research, the
focus was placed on macroautophagy as that seems to be the most important one in en-
suring cell homeostasis. Through the stepwise formation of an autophagosome, double-
membrane vesicles, cytoplasmic to-be-degraded cargo are engulfed and shuttled along
microtubules towards the lysosome, with which the autophagosome fuses to yield an
autolysosome. Through the acidic components of the autolysosome, the captured mate-
rial together with the inner membrane is then broken down and nutrients and mem-
branes are recycled. The whole process is governed and regulated by more than 15 au-
tophagy-related genes (ATG) as well as the mammalian target of rapamycine (mTOR),
which integrates many upstream signals such as energy status, growth factors and ami-
no acids, just to name a few. Other proteins important in the pathways of autophagy in-
clude class III phosphoinositide 3-kinases (PI3Ks or Vps34) and Beclin 1, which initiate
the process, microtubule-associated protein 1 light chain 3 II (LC3-II results from the
lipidation of LC3-I) and Atg13, involved in formation and expansion of the phagosome
membrane, p62 which is an autophagy receptor that recognises cellular waste, and p27
that positively regulates autophagy, preventing the induction of apoptosis23,24.
Autophagy is vital in regulating cell homeostasis, development, differentiation and sur-
vival. It has been found that alterations in autophagy are associated with a wide variety
8
of pathological conditions and diseases, including neurodegeneration, liver disease, can-
cers, infectious and metabolic diseases, like diabetes. Thus, recent research has focused
on agents that might induce autophagy for therapeutic use25.
3.5 Autophagy in Depression A potential role of autophagy in depression has been discussed. Clomipramine, a tricy-
clic antidepressant, was shown to increase autophagosomal markers and obstruct au-
tophagic flux26, whereas Lithium and Sertraline, a SSRI, triggered autophagy27–30. The
induction of autophagy thus seemed to contribute to the increased resilience of cells.
Approaching the problem from a different angle, it was found that the mTOR inhibitor
rapamycin, an inducer of autophagy, had a mild antidepressant effect in mice and rats
that underwent testing with the Forced Swim Test and the Tail Suspension test31.
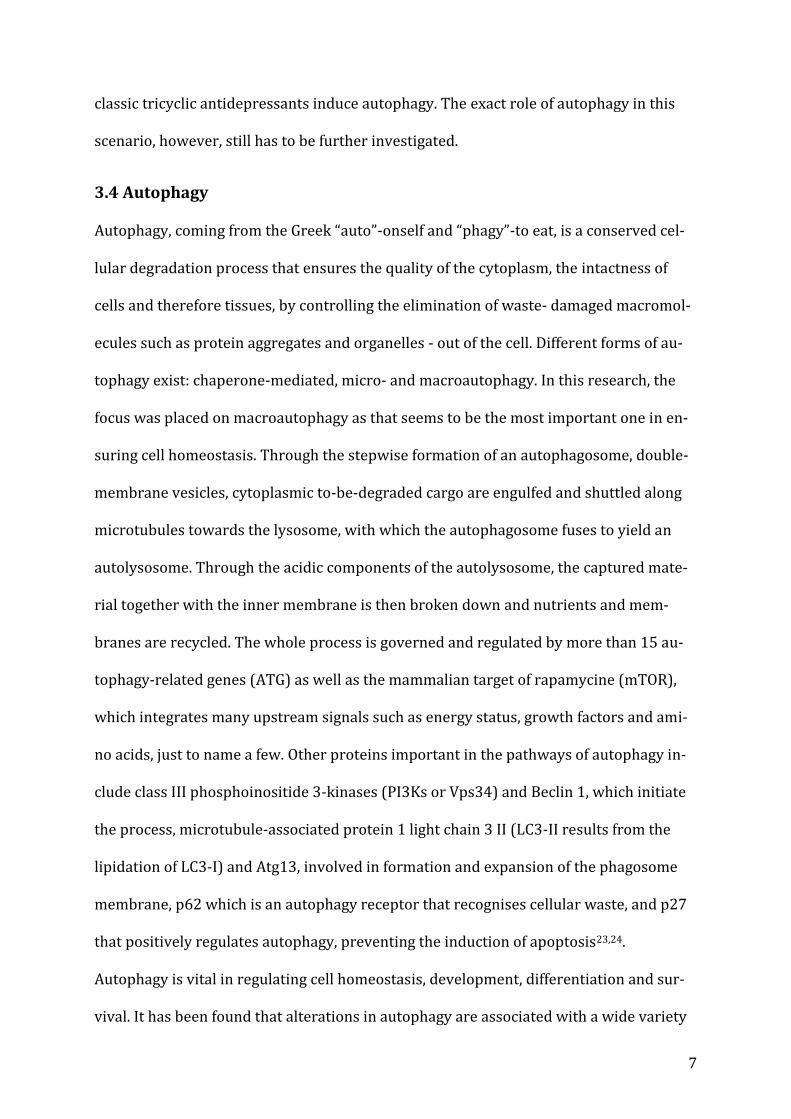
3.6 FKBP51 The Hsp90 cochaperone FKBP5 seems to correspond with the treatment response to
antidepressant. It has recently been postulated that this is not only due to its regulation
of the glucocorticoid receptor and therefore the physiological stress response within the
Hypothalamic-Pituitary-Adrenal (HPA) Axis32,33, but also due to its association with Be-
clin 1, a regulator of autophagy, and other factors involved in autophagy, such as AKT 1.
FKBP5 not only induces autophagy and enhances autophagic flux; its presence in cells
also seems to be crucial for the effects of antidepressants to take place29,34,35. FKBP51
also seems to scaffold the binding of the E3 ligase SKP2, which binds to Beclin1, AKT and
PHLPP. Inhibition of SKP2 in turn was shown to stabilize Beclin1, thus inducing autoph-
agy.
9
Figure 1: Model of FKBP51’s effect on the Akt-Beclin1 heterocomplex and its pharmacolog-ical modulation. (A, B) FKBP51 interacts with PHLPP, Beclin1, and Akt, thus recruiting in-active Akt to Beclin1. Beclin1 becomes dephosphorylated and is therefore more active, in-ducing autophagy. (C) The inhibition of Akt by PHLPP results in the inactivation of the SKP2 E3 ligase, which in turn suppresses the ubiquination and hence the degradation of Beclin1.
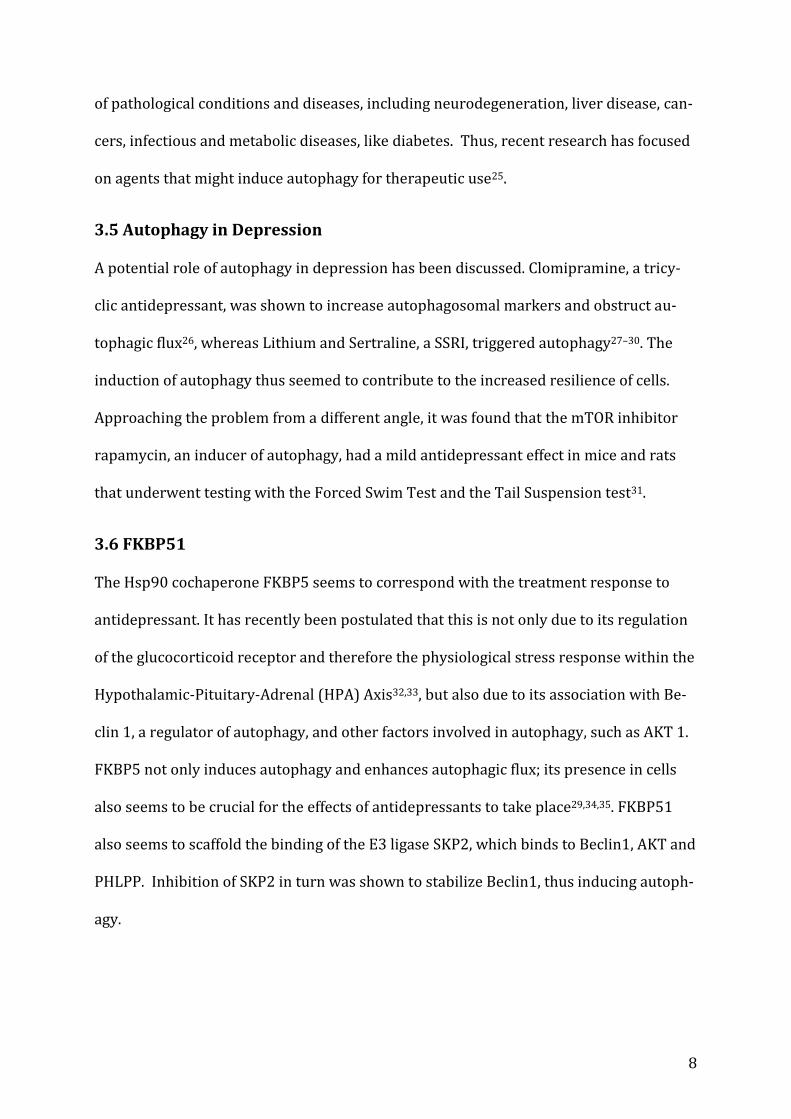
3.7 My research Here is the point where my own research comes in. Rico-Bautista et al. conducted a
high-throughput screen of 7368 chemical compounds to measure their effects on the
levels of p27, a cyclin-dependent kinase inhibitor and tumor suppressor that was found
to be downregulated in different human carcinomas36. 176 small molecule inhibitors of
p27 depletion (SMIPs) were identified, with SMIP004, a SKP2 downregulator having the
most cancer selective antiproliferative activity. SMIP004 had already been established
as a potent stabilising agent of Beclin 1 and seemed to elicit antidepressant like effects
similar to paroxetine in mice undergoing the tail suspension test. In my research, I hence
10
looked at the list of 176 molecules and searched the literature to see whether any of
them had been described as having an effect on autophagy, with an eye on a potential
antidepressant effect of these molecules. Ultimately, I focused on 24 substances, some of
which are already used in clinical medicine today, some of which are currently undergo-
ing clinical trials, to test their effects on autophagy in primary cortical rat astrocytes. My
strategy has been elucidated in Box 2 below.
Box 2: Step-by-step course of action 1) Literature research to determine at which concentrations the 24 substances had
been used previously 2) Cytotoxicity assays: MTT Assays were run to establish at which concentration of
the drug administered 80% of cells were still viable 3) Primary cortical rat astrocytes were then treated with the ascertained concen-
trations and harvested 4) BCA Assays were carried out to determine the total protein concentration within
each sample 5) Western Blots: Gel electrophoresis, followed by detection of markers of autoph-
agy such as Beclin1, Vps34, LC3, and cell cycle inhibitor p27 via antibodies 6) Bafilomycin A1 Assays and p62 degradation assays were run for substances, in
which LC3 levels increased following stimulation, to determine autophagic flux 7) Behavioural Model in Mice: The Forced Swim Test was carried out with sub-
stances bearing the most promise of having an antidepressant effect
11
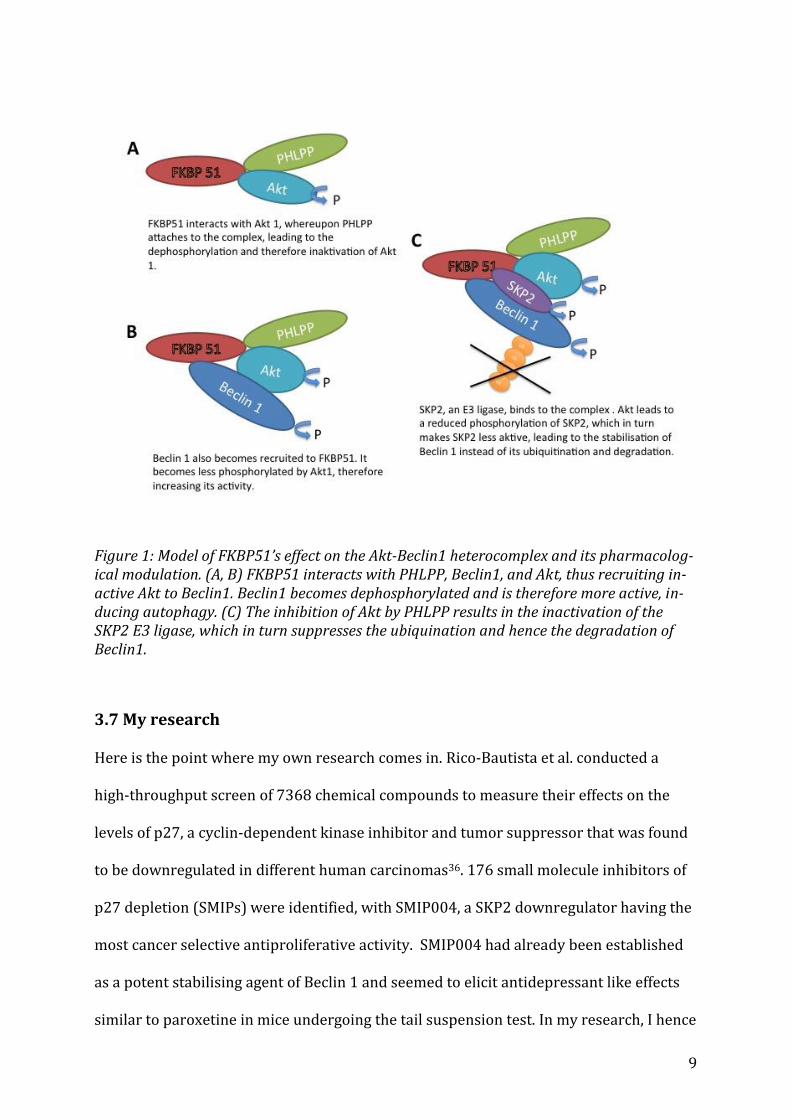
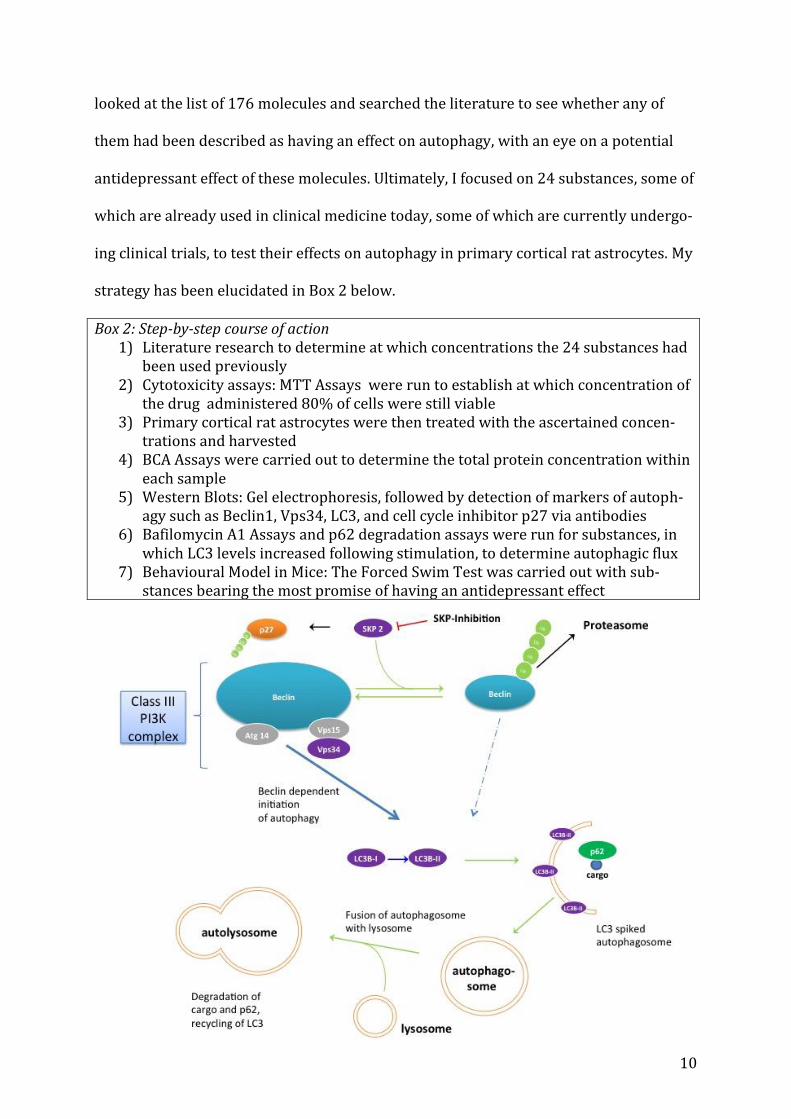
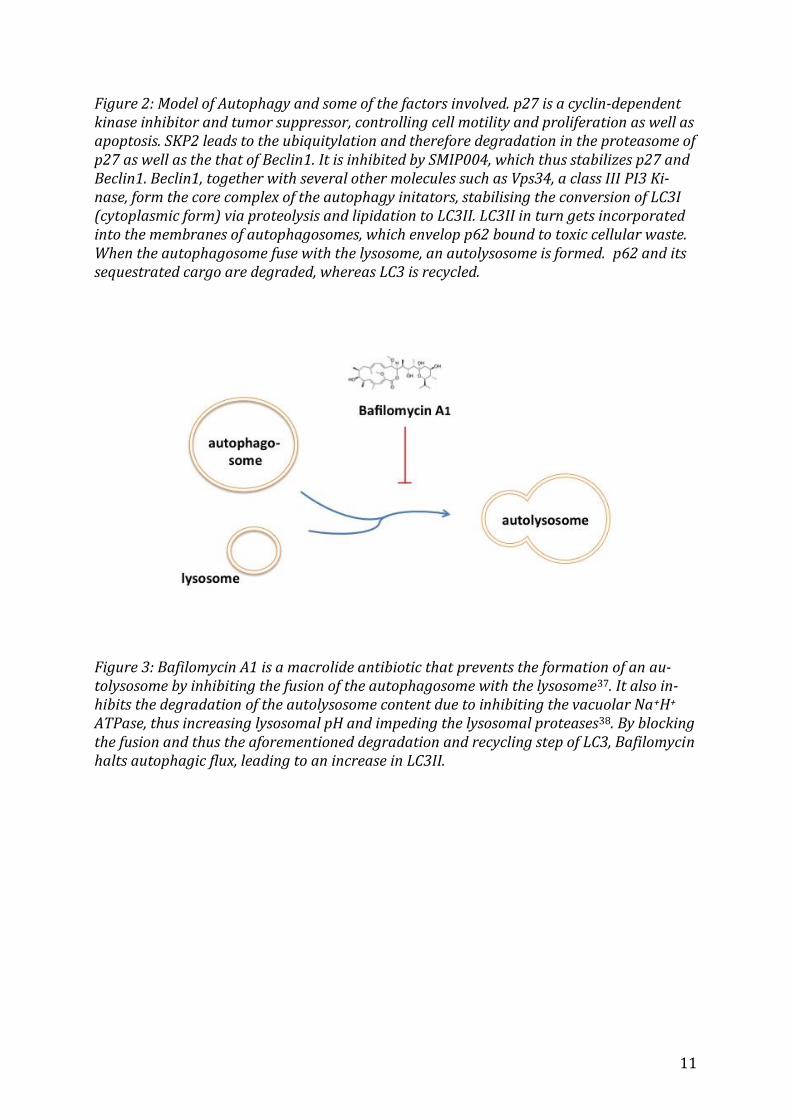
Figure 2: Model of Autophagy and some of the factors involved. p27 is a cyclin-dependent kinase inhibitor and tumor suppressor, controlling cell motility and proliferation as well as apoptosis. SKP2 leads to the ubiquitylation and therefore degradation in the proteasome of p27 as well as the that of Beclin1. It is inhibited by SMIP004, which thus stabilizes p27 and Beclin1. Beclin1, together with several other molecules such as Vps34, a class III PI3 Ki-nase, form the core complex of the autophagy initators, stabilising the conversion of LC3I (cytoplasmic form) via proteolysis and lipidation to LC3II. LC3II in turn gets incorporated into the membranes of autophagosomes, which envelop p62 bound to toxic cellular waste. When the autophagosome fuse with the lysosome, an autolysosome is formed. p62 and its sequestrated cargo are degraded, whereas LC3 is recycled.
Figure 3: Bafilomycin A1 is a macrolide antibiotic that prevents the formation of an au-tolysosome by inhibiting the fusion of the autophagosome with the lysosome37. It also in-hibits the degradation of the autolysosome content due to inhibiting the vacuolar Na+H+
ATPase, thus increasing lysosomal pH and impeding the lysosomal proteases38. By blocking the fusion and thus the aforementioned degradation and recycling step of LC3, Bafilomycin halts autophagic flux, leading to an increase in LC3II.
12
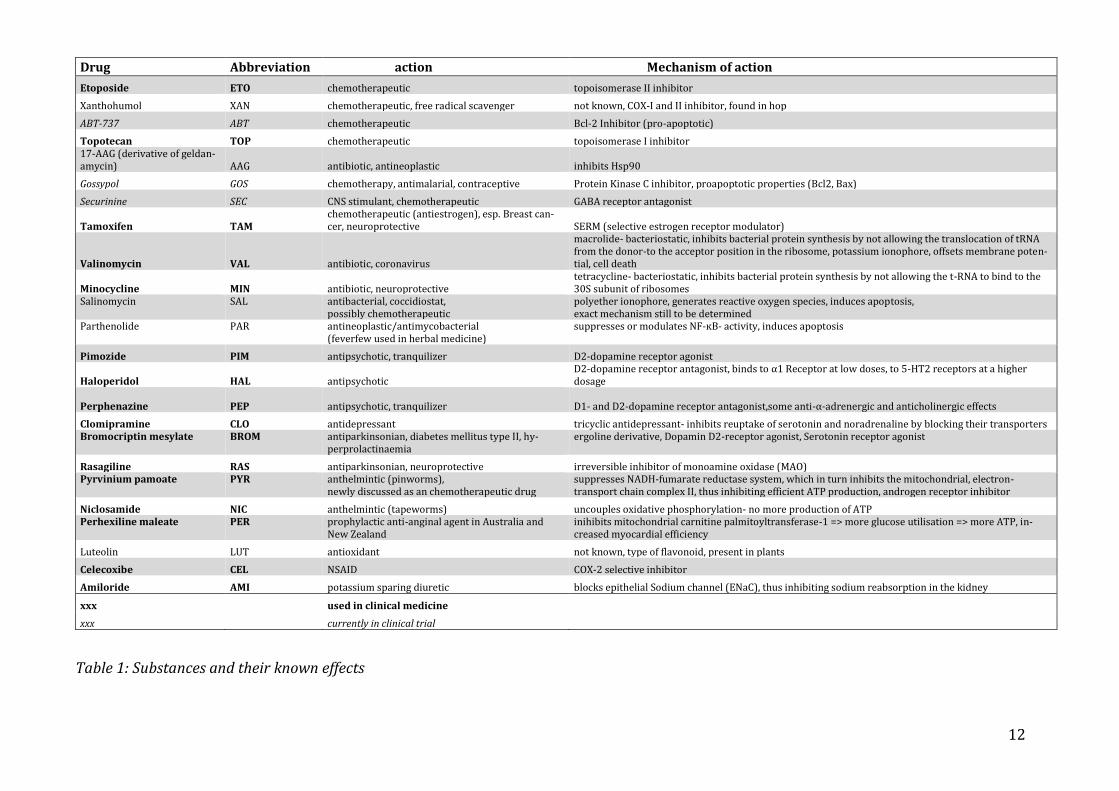
Table 1: Substances and their known effects
Drug Abbreviation action Mechanism of action
Etoposide ETO chemotherapeutic topoisomerase II inhibitor
Xanthohumol XAN chemotherapeutic, free radical scavenger not known, COX-I and II inhibitor, found in hop
ABT-737 ABT chemotherapeutic Bcl-2 Inhibitor (pro-apoptotic)
Topotecan TOP chemotherapeutic topoisomerase I inhibitor 17-AAG (derivative of geldan-amycin) AAG antibiotic, antineoplastic inhibits Hsp90
Gossypol GOS chemotherapy, antimalarial, contraceptive Protein Kinase C inhibitor, proapoptotic properties (Bcl2, Bax)
Securinine SEC CNS stimulant, chemotherapeutic GABA receptor antagonist
Tamoxifen TAM chemotherapeutic (antiestrogen), esp. Breast can-cer, neuroprotective SERM (selective estrogen receptor modulator)
Valinomycin VAL antibiotic, coronavirus
macrolide- bacteriostatic, inhibits bacterial protein synthesis by not allowing the translocation of tRNA from the donor-to the acceptor position in the ribosome, potassium ionophore, offsets membrane poten-tial, cell death
Minocycline MIN antibiotic, neuroprotective tetracycline- bacteriostatic, inhibits bacterial protein synthesis by not allowing the t-RNA to bind to the 30S subunit of ribosomes
Salinomycin SAL antibacterial, coccidiostat, possibly chemotherapeutic
polyether ionophore, generates reactive oxygen species, induces apoptosis, exact mechanism still to be determined
Parthenolide PAR antineoplastic/antimycobacterial (feverfew used in herbal medicine)
suppresses or modulates NF-ĸB- activity, induces apoptosis
Pimozide PIM antipsychotic, tranquilizer D2-dopamine receptor agonist
Haloperidol HAL antipsychotic D2-dopamine receptor antagonist, binds to α1 Receptor at low doses, to 5-HT2 receptors at a higher dosage
Perphenazine
PEP
antipsychotic, tranquilizer D1- and D2-dopamine receptor antagonist,some anti-α-adrenergic and anticholinergic effects
Clomipramine CLO antidepressant tricyclic antidepressant- inhibits reuptake of serotonin and noradrenaline by blocking their transporters Bromocriptin mesylate BROM antiparkinsonian, diabetes mellitus type II, hy-
perprolactinaemia ergoline derivative, Dopamin D2-receptor agonist, Serotonin receptor agonist
Rasagiline RAS antiparkinsonian, neuroprotective irreversible inhibitor of monoamine oxidase (MAO) Pyrvinium pamoate PYR anthelmintic (pinworms),
newly discussed as an chemotherapeutic drug suppresses NADH-fumarate reductase system, which in turn inhibits the mitochondrial, electron-transport chain complex II, thus inhibiting efficient ATP production, androgen receptor inhibitor
Niclosamide NIC anthelmintic (tapeworms) uncouples oxidative phosphorylation- no more production of ATP Perhexiline maleate PER prophylactic anti-anginal agent in Australia and
New Zealand inihibits mitochondrial carnitine palmitoyltransferase-1 => more glucose utilisation => more ATP, in-creased myocardial efficiency
Luteolin LUT antioxidant not known, type of flavonoid, present in plants
Celecoxibe CEL NSAID COX-2 selective inhibitor
Amiloride AMI potassium sparing diuretic blocks epithelial Sodium channel (ENaC), thus inhibiting sodium reabsorption in the kidney
xxx
used in clinical medicine xxx
currently in clinical trial
13
4 Material and Methods
4.1 Materials
4.1.1 Technical Equipment Light Microscope Olympus CK30
Cell Culture Incubator (Binder)
Biofuge pico Heraeus Sigma 2-6 Centrifuge
Vortex peqlab peqtwist
Water Bath GFL
Herasafe, Heraeus Instruments Germany laminar flow hood
Biorda iMark Microplate Reader
Eppendorf Thermomixer comfort 1.5mL heat block
Heidolph Duomax 1030 shaker
BioRad Power Pac 200 Western Blot
Deckworks Low Binding Barrier Pipet Tips (Corning)
4.1.2 Chemicals, Reagents and Buffers Skim Milk powder, Sigma Aldrich # 70166-500G
Thermo Scientific Pierce BCA Protein Assay Kit # 23228
ECL Detection Reagent (Millipore, Billerica, MA, USA, WBKL 0500)
Whatman® Gel Blotting Paper, Sigma Aldrich # WHA10427810
Nitrocellulose Membrane AmershamTM ProtranTM 0.2μM NC GE Healthcare Life Sciences
#10600001
Ponceau Solution for electrophoresis (0,2%) Serva #33427.01
Roti® Stock 20% SDS Roth # 1057.1
Acrylamide/bis solution 37.5:1 (30% w/V), 2.6% C Serva # 10688.01
Tris PUFFERAN® >99,9%, Tris-(hydroxymethyl-)aminomethan p.a. Carl Roth # 4855.2
14
TEMED <99,9%, N,N,N',N'-Tetramethylethylendiamin, 1,2-Bis(dimethylamino)-ethan
p.a. für die Elektrophorese Carl Roth # 2367.1
Glycin ≥99 % zur Synthese, α-Aminoessigsäure, Glykokoll Carl Roth # 3790.2
Natriumchlorid >99,8 % Carl Roth # 9265.1
Ammonium persulfate (APS), Sigma Aldrich # A3678-25G
Tween® 20 Polyoxyethylen-20-sorbitanmonolaurat, Polysorbat 20 Carl Roth #9127.2
Methanol ROTIPURAN® ≥99,9 %, p.a., ACS, ISO Carl Roth #4627.6
Bafilomycin A1 ≥90%, Sigma Aldrich, #B1793-2UG
Etoposide ≥98%, Sigma Aldrich, # E1383-25MG
Xanthohumol, ROTICHROM®, Carl Roth #NC35.1
ABT-737, Bcl-2 Inhibitor, APExBIO #A8193
Topotecan hydrochloride hydrate ≥98%, Sigma Aldrich #T2705-10MG
Valinomycin ≥98%, Sigma Aldrich #94675-10MG
Minocycline hydrochlorine, Sigma Aldrich # M9511-25MG
Salinomycin ≥98%, Sigma Aldrich # S4526-5MG
Parthenolide ≥98%, Sigma Aldrich # P0667-5MG
Pyrvinium Pamoate salt hydrate ≥98%, Sigma Aldrich # P0027-10MG
Niclosamide, Sigma Aldrich # N3510-50G
Pimozide, Sigma Aldrich # P1793-500MG
Gossypol, Santa Cruz Biotechnology # sc-200501
Clomipramine hydrochloride, Sigma Aldrich # C7291-1G
Securinine ≥98%, Sigma Aldrich # SML0055-5MG
Tamoxifen ≥99%, Sigma Aldrich # T5648-1G
Amiloride hydrochorate hydrate ≥98%, Sigma Aldrich # A7410-1G
Rasagiline mesylate ≥98%, Sigma Aldrich # SML0124-10MG
Haloperidol, Sigma Aldrich # H1512-5G
15
Perphenazine, Sigma Aldrich # P6402-1G
Bromocriptin mesylate, Sigma Aldrich # 1076501-150MG
Perhexilene maleate ≥98%, Sigma Aldrich # SML0120-10MG
Luteolin ≥98%, Sigma Aldrich # L9283-10MG
Celecoxib ≥98%, Sigma Aldrich #PZ0008-5MG
17-AAG, 17-(Allyamino)-17-demethoxygeldanamycin, Sigma Aldrich #A8476-500UG
SKP2 E3 Ligase Inhibitor II, SMIP004, Merck Millipore #500517
4.1.3 Antibodies
4.1.3.1 Primary Antibodies PI3K Kinase Class III (D9AS) Rabbit mAB Cell Signalling Technology # 4263S
P27 Kip1 (D69 C12) XP(R) Rabbit mAB Cell Signalling Technology # 3686S
Beclin-1 Rabbit Ab Cell Signalling # 3738S
SQSTM1/p62 Rabbit Ab Cell Signalling # 5114S
Akt(pan) (C67E7) Rabbit mAB Cell Signalling # 46912L
P-Akt (S473) (193H12) Rabbit mAb Cell Signalling # 4058L
Hsc70 (B-6) mouse monoclonal IgG Santa Cruz Biotechnology # sc-7298
Aktin (I-19) goat polyclonal IgG Santa Cruz Biotechnology # sc-1616
4.1.3.2 Secondary Antibodies Anti-rabbit IgG, HRP-linked AB Cell Signalling Technology # 7074S
Alexa Fluor 488 donkey anti-goat IgG (H+L) Life Technologies # A11055
Alexa Fluor 488 donkey anti-mouse IgG (H+L) Invitrogen molecular probes # 898250
1xMEM Minimal Essential Medium gibco # 31095029
Gentamycin (10mg/mL) gibco by Life Technologies # 15710-049
Sodium pyruvate 100mM (100X) gibco # 11360-039
Horse Serum, Sigma Aldrich # H0146-5ML
Antibiotic Antimycotic Solution (100x), Stabilized, Sigma Aldrich # A5955-100ML
16
Phosphatase Inhibitor Cocktail Tablets, Phospho Stop EASYpack, Roche # 04906837001
Protease Inhibitor Sigma Aldrich #P2714
peqGOLD Protein Marker IV 10-170kDa, 10 bands # 27-2110, 27-2111
DMSO Santa Cruz Biotechnology # sc 202581
4.1.4 Sofware BioRad Chemi Doc MP Imaging System
Sigma Plot 12.5
Image Lab 5.0
Adobe Illustrator CC
Audymaze 4.20
4.2 Methods
4.2.1 Primary cultures of rat astrocytes (already provided) Enriched astroglial cell cultures were derived from postnatal day 1 Sprague-Dawley rat
pups (Charles River, Suzfeld, Germany) and handled as described previously39,40. The
dissected cortical hemispheres as well as the hippocampuses were trypsinized. To stop
the trypsinization, Hank’s balanced salt solution and 10% fetal calf serum were added.
The mixture containing the tissue was then passed through a serological pipette, centri-
fuged and after the supernatant had been poured off, resuspended in Minimal Essential
Medium (MEM) complemented with 10% horse serum.
4.2.2 MTT Assay Cell viability of rat astrocytes was measured by the 3-(4,5-dimethylthylthiazol-2-yl)-2,5-
diphenyltetrazolium bromide (MTT) method. MTT Assays were performed with stag-
gered concentrations of the different substances that had previously been solubilised in
DMSO. Cells were seeded in 96- well plates and grown in 1xMEM supplemented with
Horse Serum, Gentamycin, and Sodium Pyruvate. Cells were stimulated for 48h at 37°C,
17
after which MTT solution (5mg/ml) was added and left for 4h, followed by solubilizing
solution (100 μM), which was left overnight in the dark. The absorption was measured
at 570nm and 655nm wavelength on the next day. Triplicates were performed.
4.2.3 Cell culture Primary astrocytes were grown in MEM supplemented with Horse Serum, Gentamycin
and Sodium Pyruvate. After stimulation and incubation overnight, cells were tryp-
sinized, spun down, washed with 1xPBS, centrifuged again, and resuspended in 1x Lysis
Buffer (62,5mM Tris, 2% SDS, 10% sucrose) containining Phosphatase Inhibitor and
Protease Inhibitor. All manipulations were carried out with sterile reagents under a lam-
inar flow hood. Samples were then incubated in a heating block at 95° C for 5 minutes
and further analyzed. Stimulation was carried out with Xanthohumol, Topotecan, Secur-
inine, Bromocriptin mesylate, Perhexilene maleate, Pyrvinium pamoate, Valinomycin,
Rasagiline, Parthenolide, Minocyclin, Pimozide, Luteolin, ABT-737, Salinomycin, Etopo-
side, Gossypol, Niclosamide, Clomipramine, Tamoxifen, Perphenazine, Haloperidol,
Celecoxibe, 17-AAG, Amiloride, and SKP-Inhibitor. DMSO, which served as the solvent
for the different drugs, was used as a vehicle control, being set at 100% as a reference in
further analyses.
4.2.4 Bafilomycin Assays Cells were stimulated as described above. Two hours before harvesting the cells, the
medium was exchanged and Bafilomycin A1 at a concentration of 100nM35 was added.
Two hours later cells were harvested as usual.
4.2.5 BCA Assay, SDS gel, Western Blotting Protein concentration of the lysed cell probes was determined by BCA Assay using the
Thermo Scientific Pierce BCA Protein Assay Kit. Samples were mixed with 1x Lysis Buff-
er with Phospho Stop and Protease inhibitor and LAP and incubated at 95°C for 5
18
minutes. 20 μl of each sample were loaded onto a 15% SDS-PAGE gel. The assays were
performed in triplicates. 5 μl Protein Marker IV (peqGOLD) were loaded as a reference
band marker. The gel was run at 100V for 10 minutes and then at 170V for 60 minutes.
Proteins were then electrotransferred onto a nitrocellulose membrane using the Biorad
in 1x Wetblot Buffer. The transfer was performed at 4°C using 100V for 90 minutes.
Blots were then blocked by means of 5% low-fat milk in Tris-buffered saline and Tween
20 for 1 hour at room temperature and incubated with respective primary antibody di-
luted in TBS/ 0,05% Tween overnight at 4°C whilst gently shaking. The following prima-
ry antibodies were used: LC3B-I/II (1:1000), PI3K Kinase Class III (Vps34, 1:1000), Be-
clin-1 (1:1000), SQSTM1/p62 (1:1000), p27 Kip 1 (1:1000), Akt (pan) (1:1000), UVRAG
(1:1000), P-Akt (1:1000), Atg3 (1:1000), Hsc-70 (1:4000), Aktin (1:4000). Subsequently,
the blots were washed thrice for 10 minutes with TBS-T and probed with the appropiate
secondary antibody- Horseradish-Peroxidase- linked (HRP- linked anti-rabbit IgG anti-
body) or fluorophore-conjugated- for 2 hours at RT. After washing the blots four times
for 10 minutes with TBS-T, the immunoreactive bands were visualised using either ECL
detection reagent according to the manufacturer’s instructions or directly by the excita-
tion of the respective fluorophore. Determination of the relative optical density and
quantification of bands was performed using a BioRad ChemiDoc MP and Imagelab 5.0.
Actin or Hsc70 were used as a loading controls as they exhibits constitutive high-level
expression patterns, ensuring that samples have been loaded equally across all wells.
4.2.6 Animals and animal housing
24 male mice, 10-16 weeks old and weighing 280-320 g were used for the experiments.
The animals were housed individullay and held under standard conditions in a tempera-
ture-controlled room (23±2°C) on a 12h/12h light/dark cylce (lights on at 8:00 am) with
access to food (Altromin 1314) and water ad libitum. All of the animals were housed in
polyprolene cages (41x32x16.5cm) with wood shavings as bedding.
19
All experiments took place at the animal facility of the Max-Planck-Institute of Psychia-
try, Munich, Germany. The experiments were carried out in accordance with the Euro-
pean Communities’ Council Directive 86/609/EEC and utmost care was applied to min-
imize animal suffering during the experiments. The protocols were approved by the
committee for the Care and Use of Laboratory animals of the Government of Upper Ba-
varia, Germany.
4.2.7 Animal treatment and behavioural experiments (conducted by Georgia Balsevich)
All mice were injected either with a single dose of saline (vehicle) solution or Salinomy-
cin. The drug was administered intraperitoneally by syringe in a constant volume of
5.0ml/kg body weight. 45 minutes after the injection, each mouse was subjected to the
Forced Swim Test (FST) for 6 minutes. The FST was carried out between 9:00 and 10:30
am in the same room that the mice were housed in. During the FST, each mouse was
lowered into a 2L glass beaker (diameter: 13cm, height: 24cm) that was filled with tap
water (21±1°C) up to a height of 15cm. The mouse could thus not reach the bottom with
either hind paws or tail. The mice were videotaped by an automated video-tracking sys-
tem (Audymaze 4.20) for the subsequent quantification of the following parameters:
immobility (absence of motion of the entire body and only small movements necessary
to keep the animal’s head above water), climbing (lively movements of the forepaws in
and out of the water, often directed towards the walls of the tank), and swimming (con-
siderable forepaw motions that displaced water and moved the mouse’s body around
the cylinder, more than necessary to keep the head above water). After six minutes, the
mouse was taken out of the water, dried off, and sacrificed. Quantification of the FST was
carried out by an experienced observer, blind to the treatment of the animals.
4.2.8 Statistical Analysis
All statistical analyses were performed with the help of Sigma Plot. Drugs were placed
20
into groups of four depending on their medical use, and compared via one- or two-way
analysis of variance (ANOVA). Otherwise, variables in groups were compared to con-
trols pairwise via the Tukey Test, Dunn’s Method or the Bonferroni t-test. Significant
results of the comparison test are emphasized by asterisks in the graphs and will be dis-
cussed in the results section. P values of less than 0.05 were considered significant.
5 Results
5.1 Identification of appropriate drug concentrations To determine the maximal concentrations of the drug at which 80% of cells would still
survive (LD20), 3-(4,5-dimethylthiazol-2-yl)2,5-diphenyl tetrazolium bromide (MTT)
assays were carried out41. MTT Assays have been found to be suitable for the
initial stage of in vitro drug screening42 as the MTT (yellow) is reduced by metabolically
active cells, resulting in a colour change (purple formazan) that can be quantified by
spectrometric means. Hence, cell proliferation rate and activation or conversely, a
reduction in cell viability (through apoptosis or necrosis), can be measured with a high
degree of precision41,43,44. The amount of signal generated generally depends on the
concentration of MTT used, the number of viable cells and their respective metabolic
activity, as well as the length of incubation with MTT. Below, in Table 2, is the list of
substances tested with their respective concentrations. Whereas the addition of several
substances such as Bromocriptin mesylate, Clomipramine or Perphenazine reduced cell
viability in a dose-dependent manner, other substances such as Luteolin or Salinomycin
seemed to activate cell proliferation or metabolism, with the percentage of cell viability
increasing, sometimes well beyond 100%. Due to unexplained results in the MTT assays,
the concentrations for Luteolin45,46 (Fig.9B), Celecoxibe47 (Fig.9C), Niclosamide48,49 (Fig.
8D),Haloperidol50,51 (Fig. 7A), Salimomycin52 (Fig. 6C) and ABT-73753,54 (Fig. 4C) were
derived from the literature as their cell viability percentage never passed below the 80%
21
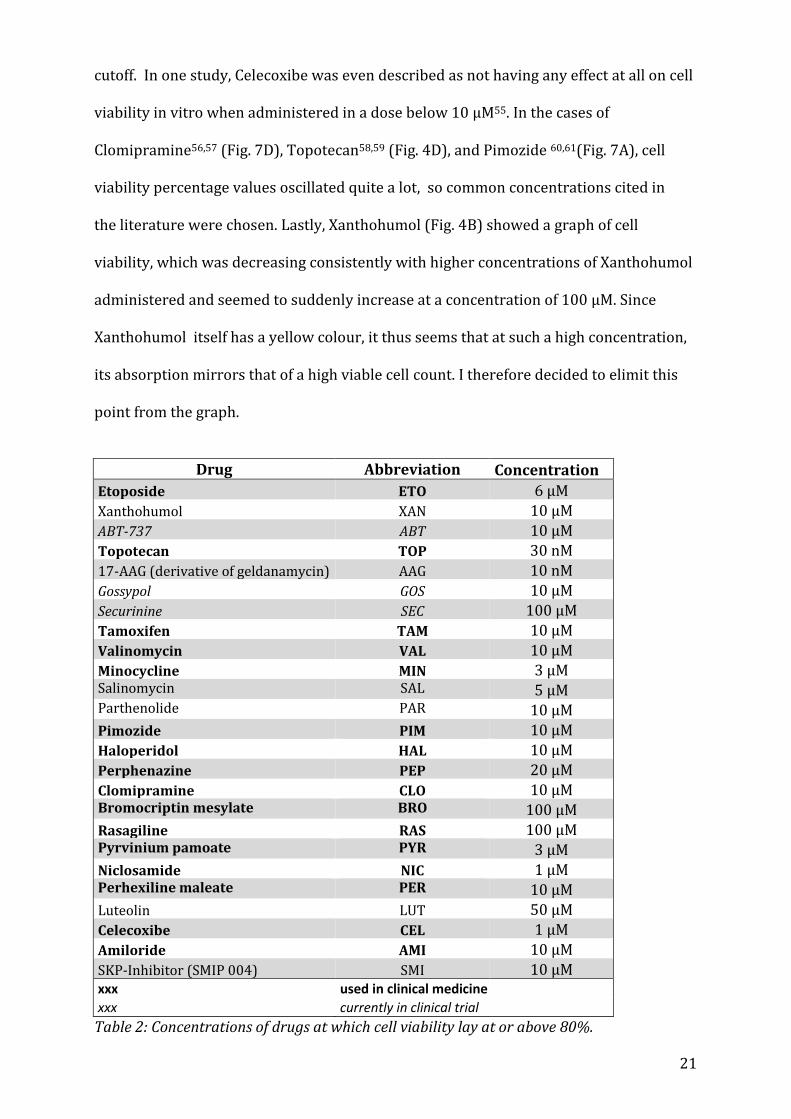
cutoff. In one study, Celecoxibe was even described as not having any effect at all on cell
viability in vitro when administered in a dose below 10 μM55. In the cases of
Clomipramine56,57 (Fig. 7D), Topotecan58,59 (Fig. 4D), and Pimozide 60,61(Fig. 7A), cell
viability percentage values oscillated quite a lot, so common concentrations cited in
the literature were chosen. Lastly, Xanthohumol (Fig. 4B) showed a graph of cell
viability, which was decreasing consistently with higher concentrations of Xanthohumol
administered and seemed to suddenly increase at a concentration of 100 μM. Since
Xanthohumol itself has a yellow colour, it thus seems that at such a high concentration,
its absorption mirrors that of a high viable cell count. I therefore decided to elimit this
point from the graph.
Drug Abbreviation Concentration
Etoposide ETO 6 μM
Xanthohumol XAN 10 μM
ABT-737 ABT 10 μM
Topotecan TOP 30 nM
17-AAG (derivative of geldanamycin) AAG 10 nM
Gossypol GOS 10 μM
Securinine SEC 100 μM
Tamoxifen TAM 10 μM
Valinomycin VAL 10 μM
Minocycline MIN 3 μM Salinomycin SAL 5 μM Parthenolide PAR 10 μM
Pimozide PIM 10 μM
Haloperidol HAL 10 μM
Perphenazine PEP 20 μM
Clomipramine CLO 10 μM Bromocriptin mesylate BRO 100 μM
Rasagiline RAS 100 μM Pyrvinium pamoate PYR 3 μM
Niclosamide NIC 1 μM Perhexiline maleate PER 10 μM
Luteolin LUT 50 μM
Celecoxibe CEL 1 μM
Amiloride AMI 10 μM
SKP-Inhibitor (SMIP 004) SMI 10 μM xxx used in clinical medicine
xxx currently in clinical trial
Table 2: Concentrations of drugs at which cell viability lay at or above 80%.
22
To evaluate the molecular effects that the different drugs had on autophagy, I analysed
autophagic markers, such as Beclin1 and Vps34 (both part of the initiation complex), as
well as LC3I and II and p27, a cell cycle inhibitor, in protein extracts from primary rat
astrocytes that had been treated with the drugs for a period of 24 hours. As a control,
DMSO was used to treat the cells. Groups of four substances were formed in order to
ease statistical analysis.
5.2 Western Blot Analyses
5.2.1 Etoposide, Xanthohumol, ABT-737 and Topotecan The chemotherapeutic drugs Etoposide, Xanthohumol, ABT-737 and Topotecan all in-
creased the LC3II/I ratio of cells (Fig. 4E), with Etoposide, Xanthohumol and ABT-737 all
showing a significant increase (p<0.05). The difference in Beclin1 expression was not
nearly as stark (Fig. 4F), with only Topotecan leading to an increase of 100%. Since Be-
clin1 and p27 are both substrates of the E3 ligase SKP2, which had been shown to be
inhibited by the drugs selected by Rico-Bautista et al., one would expect p27, which is
autophagy independent, to have a similar expression pattern as Beclin 1. However, this
is not always the case, as in response to treatment with all four drugs, expression levels
of p27 decrease (Fig. 4G), in the case of Topotecan significantly so (p=0.023). Levels of
Vps34 (Fig. 4H), which forms a complex with Beclin162,63, increased only upon treatment
with Topotecan (p<0.05).
5.2.2 17-AAG, Gossypol, Securinine and Tamoxifen Out of the next group of antineoplastic and antibiotic drugs consisting of 17-AAG, Gossy-
pol, Securinine and Tamoxifen, only 17-AAG, Gossypol and Tamoxifen seemed to boost
the lipidation of LC3 (Fig. 5E). Tamoxifen, a known activator of autophagy 64, also en-
hances expression of Beclin1 (Fig. 5F) and p27 (Fig. 5G), whereas 17-AAG elevates all
four markers (Fig. 5 E-H), p27 significantly so (p<0.05). Securinine does not seem to
23
influence protein expression much, except in the case of Beclin1 (Fig. 5F), where it rises
to about 400%, and in the case of Vps34 (Fig. 5H), which decreases significantly
(p<0.05).
5.2.3 Valinomycin, Minocycline, Salinomycin and Parthenolide The antibiotic group of drugs showed a big variation in expression levels. Salinomycin
significantly (p<0.05) increased the expression of LC3II/I (Fig. 6E) and of Beclin1 (Fig.
6F), whereas Parthenolide enhanced the expression of Vps34 (Fig. 6H) significantly
(p=0.002) and Valinomycin downregulated it (p=0.011).
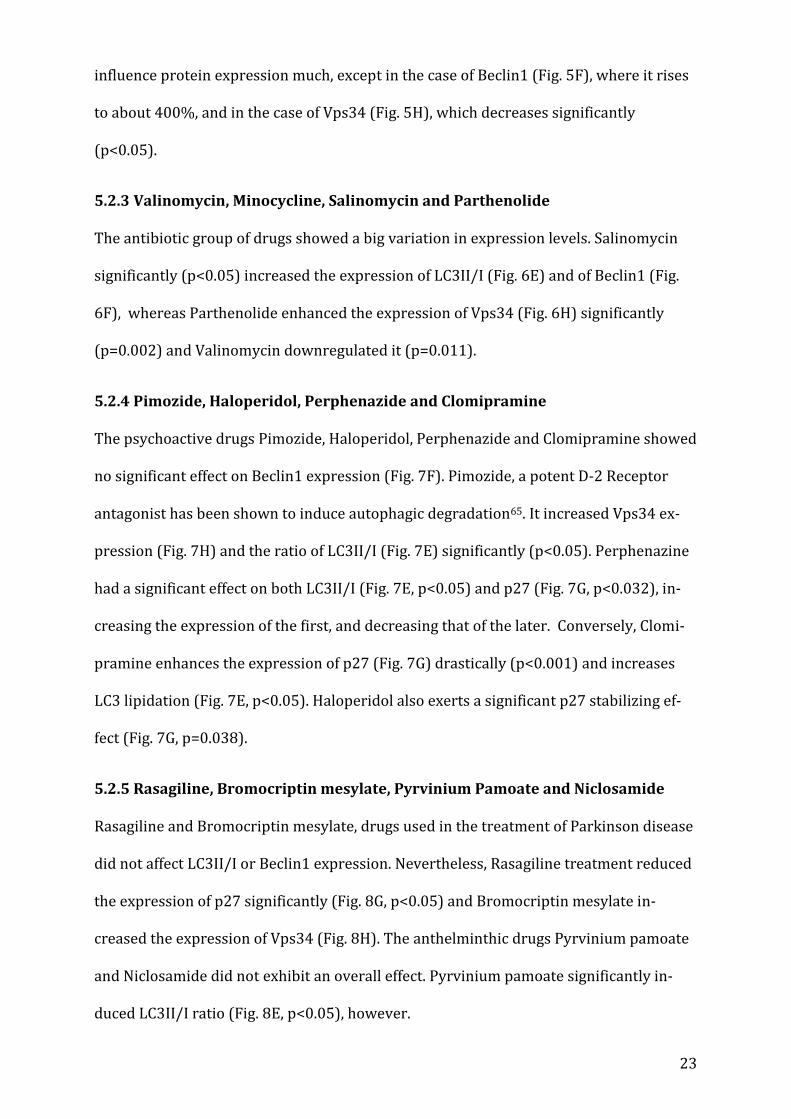
5.2.4 Pimozide, Haloperidol, Perphenazide and Clomipramine The psychoactive drugs Pimozide, Haloperidol, Perphenazide and Clomipramine showed
no significant effect on Beclin1 expression (Fig. 7F). Pimozide, a potent D-2 Receptor
antagonist has been shown to induce autophagic degradation65. It increased Vps34 ex-
pression (Fig. 7H) and the ratio of LC3II/I (Fig. 7E) significantly (p<0.05). Perphenazine
had a significant effect on both LC3II/I (Fig. 7E, p<0.05) and p27 (Fig. 7G, p<0.032), in-
creasing the expression of the first, and decreasing that of the later. Conversely, Clomi-
pramine enhances the expression of p27 (Fig. 7G) drastically (p<0.001) and increases
LC3 lipidation (Fig. 7E, p<0.05). Haloperidol also exerts a significant p27 stabilizing ef-
fect (Fig. 7G, p=0.038).
5.2.5 Rasagiline, Bromocriptin mesylate, Pyrvinium Pamoate and Niclosamide Rasagiline and Bromocriptin mesylate, drugs used in the treatment of Parkinson disease
did not affect LC3II/I or Beclin1 expression. Nevertheless, Rasagiline treatment reduced
the expression of p27 significantly (Fig. 8G, p<0.05) and Bromocriptin mesylate in-
creased the expression of Vps34 (Fig. 8H). The anthelminthic drugs Pyrvinium pamoate
and Niclosamide did not exhibit an overall effect. Pyrvinium pamoate significantly in-
duced LC3II/I ratio (Fig. 8E, p<0.05), however.
24
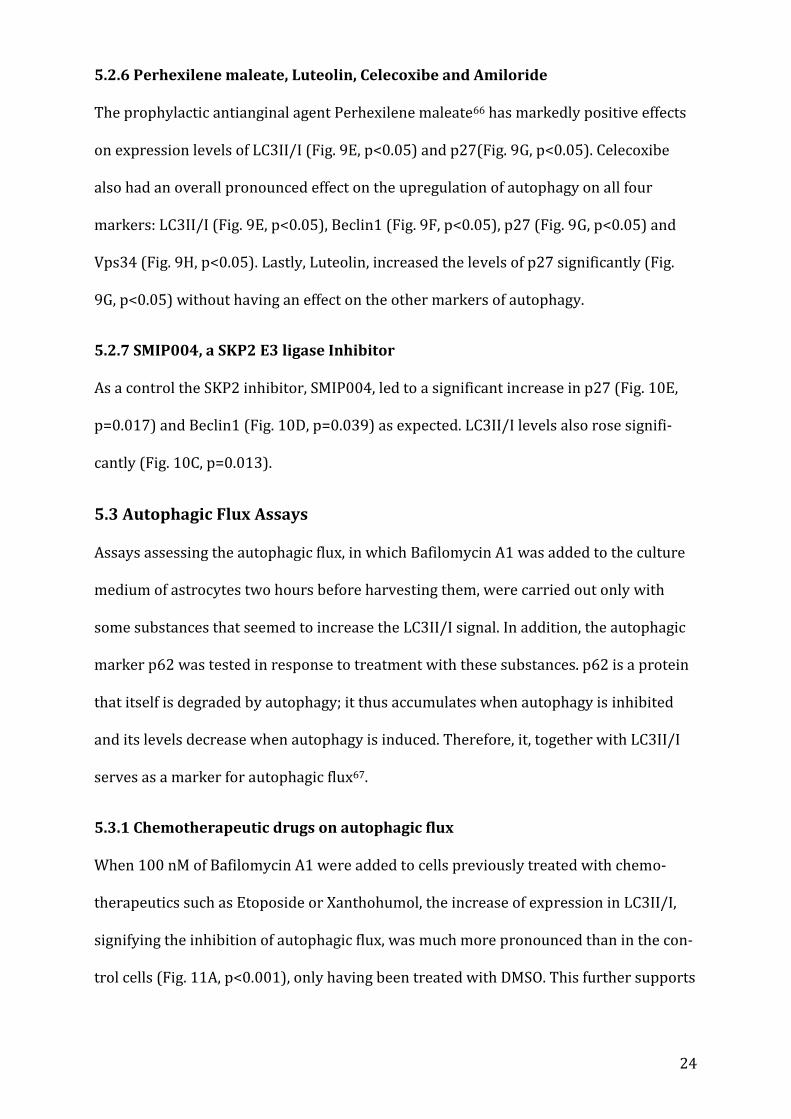
5.2.6 Perhexilene maleate, Luteolin, Celecoxibe and Amiloride The prophylactic antianginal agent Perhexilene maleate66 has markedly positive effects
on expression levels of LC3II/I (Fig. 9E, p<0.05) and p27(Fig. 9G, p<0.05). Celecoxibe
also had an overall pronounced effect on the upregulation of autophagy on all four
markers: LC3II/I (Fig. 9E, p<0.05), Beclin1 (Fig. 9F, p<0.05), p27 (Fig. 9G, p<0.05) and
Vps34 (Fig. 9H, p<0.05). Lastly, Luteolin, increased the levels of p27 significantly (Fig.
9G, p<0.05) without having an effect on the other markers of autophagy.
5.2.7 SMIP004, a SKP2 E3 ligase Inhibitor As a control the SKP2 inhibitor, SMIP004, led to a significant increase in p27 (Fig. 10E,
p=0.017) and Beclin1 (Fig. 10D, p=0.039) as expected. LC3II/I levels also rose signifi-
cantly (Fig. 10C, p=0.013).
5.3 Autophagic Flux Assays Assays assessing the autophagic flux, in which Bafilomycin A1 was added to the culture
medium of astrocytes two hours before harvesting them, were carried out only with
some substances that seemed to increase the LC3II/I signal. In addition, the autophagic
marker p62 was tested in response to treatment with these substances. p62 is a protein
that itself is degraded by autophagy; it thus accumulates when autophagy is inhibited
and its levels decrease when autophagy is induced. Therefore, it, together with LC3II/I
serves as a marker for autophagic flux67.
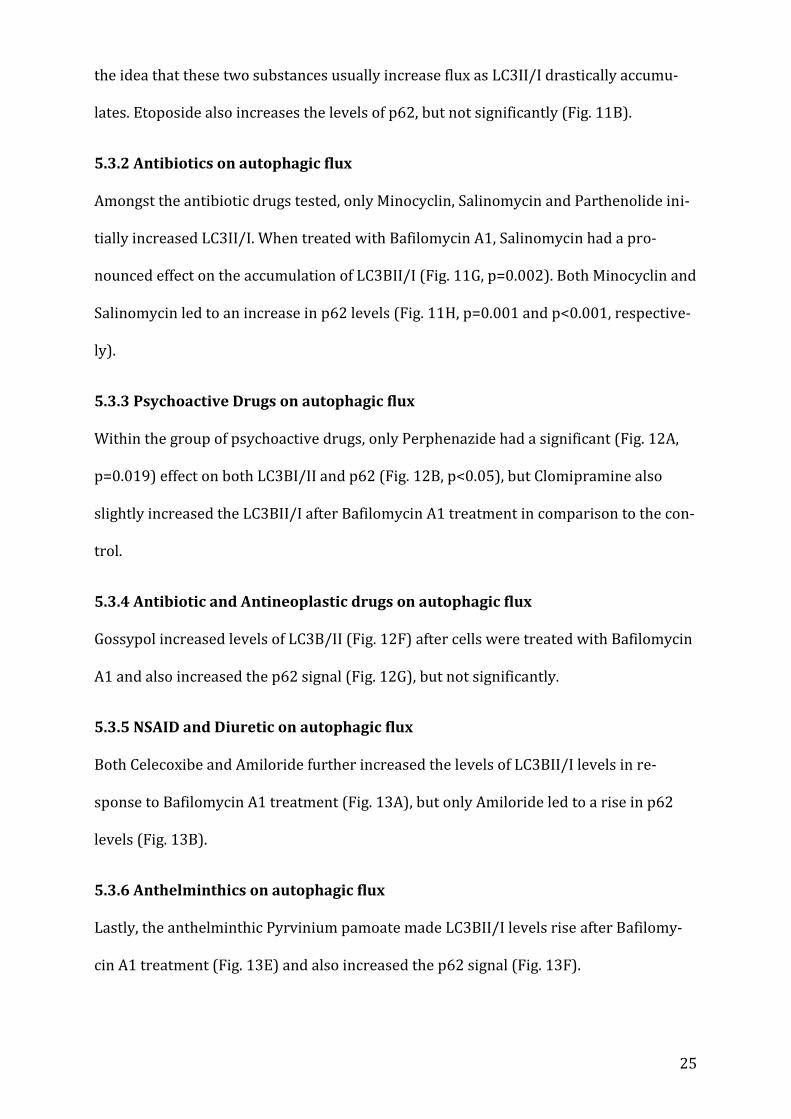
5.3.1 Chemotherapeutic drugs on autophagic flux When 100 nM of Bafilomycin A1 were added to cells previously treated with chemo-
therapeutics such as Etoposide or Xanthohumol, the increase of expression in LC3II/I,
signifying the inhibition of autophagic flux, was much more pronounced than in the con-
trol cells (Fig. 11A, p<0.001), only having been treated with DMSO. This further supports
25
the idea that these two substances usually increase flux as LC3II/I drastically accumu-
lates. Etoposide also increases the levels of p62, but not significantly (Fig. 11B).
5.3.2 Antibiotics on autophagic flux Amongst the antibiotic drugs tested, only Minocyclin, Salinomycin and Parthenolide ini-
tially increased LC3II/I. When treated with Bafilomycin A1, Salinomycin had a pro-
nounced effect on the accumulation of LC3BII/I (Fig. 11G, p=0.002). Both Minocyclin and
Salinomycin led to an increase in p62 levels (Fig. 11H, p=0.001 and p<0.001, respective-
ly).
5.3.3 Psychoactive Drugs on autophagic flux Within the group of psychoactive drugs, only Perphenazide had a significant (Fig. 12A,
p=0.019) effect on both LC3BI/II and p62 (Fig. 12B, p<0.05), but Clomipramine also
slightly increased the LC3BII/I after Bafilomycin A1 treatment in comparison to the con-
trol.
5.3.4 Antibiotic and Antineoplastic drugs on autophagic flux Gossypol increased levels of LC3B/II (Fig. 12F) after cells were treated with Bafilomycin
A1 and also increased the p62 signal (Fig. 12G), but not significantly.
5.3.5 NSAID and Diuretic on autophagic flux Both Celecoxibe and Amiloride further increased the levels of LC3BII/I levels in re-
sponse to Bafilomycin A1 treatment (Fig. 13A), but only Amiloride led to a rise in p62
levels (Fig. 13B).
5.3.6 Anthelminthics on autophagic flux Lastly, the anthelminthic Pyrvinium pamoate made LC3BII/I levels rise after Bafilomy-
cin A1 treatment (Fig. 13E) and also increased the p62 signal (Fig. 13F).
26
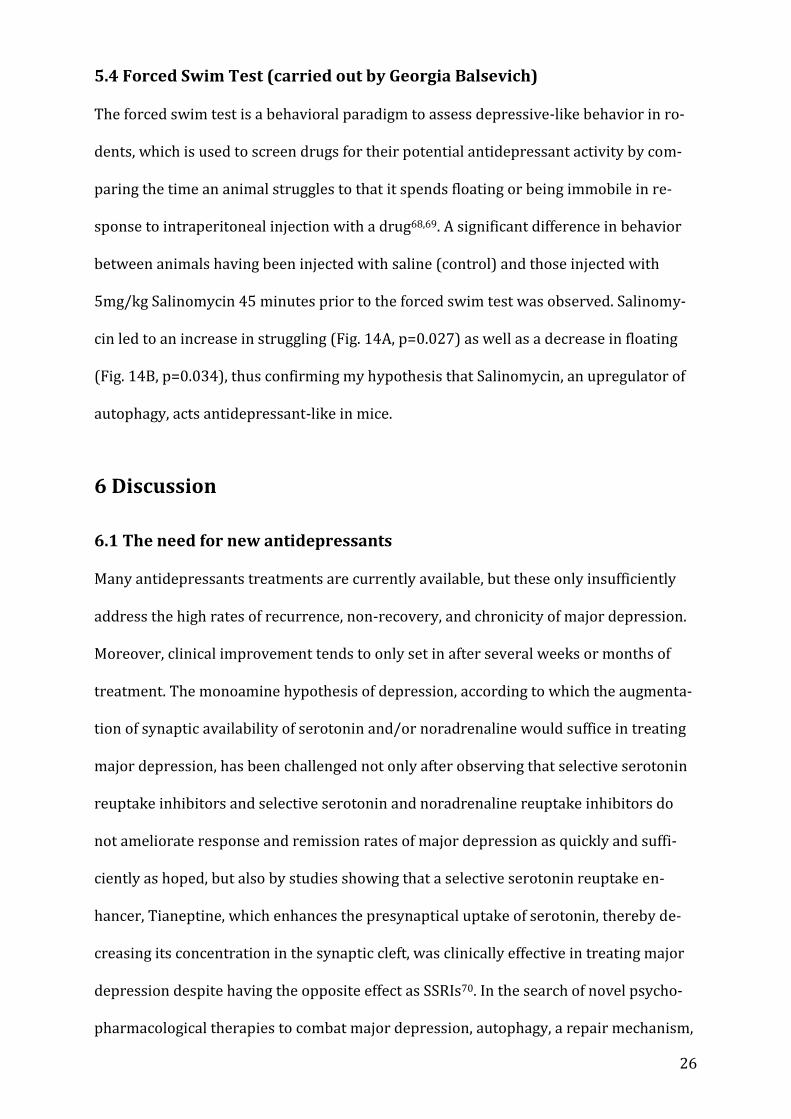
5.4 Forced Swim Test (carried out by Georgia Balsevich) The forced swim test is a behavioral paradigm to assess depressive-like behavior in ro-
dents, which is used to screen drugs for their potential antidepressant activity by com-
paring the time an animal struggles to that it spends floating or being immobile in re-
sponse to intraperitoneal injection with a drug68,69. A significant difference in behavior
between animals having been injected with saline (control) and those injected with
5mg/kg Salinomycin 45 minutes prior to the forced swim test was observed. Salinomy-
cin led to an increase in struggling (Fig. 14A, p=0.027) as well as a decrease in floating
(Fig. 14B, p=0.034), thus confirming my hypothesis that Salinomycin, an upregulator of
autophagy, acts antidepressant-like in mice.
6 Discussion
6.1 The need for new antidepressants Many antidepressants treatments are currently available, but these only insufficiently
address the high rates of recurrence, non-recovery, and chronicity of major depression.
Moreover, clinical improvement tends to only set in after several weeks or months of
treatment. The monoamine hypothesis of depression, according to which the augmenta-
tion of synaptic availability of serotonin and/or noradrenaline would suffice in treating
major depression, has been challenged not only after observing that selective serotonin
reuptake inhibitors and selective serotonin and noradrenaline reuptake inhibitors do
not ameliorate response and remission rates of major depression as quickly and suffi-
ciently as hoped, but also by studies showing that a selective serotonin reuptake en-
hancer, Tianeptine, which enhances the presynaptical uptake of serotonin, thereby de-
creasing its concentration in the synaptic cleft, was clinically effective in treating major
depression despite having the opposite effect as SSRIs70. In the search of novel psycho-
pharmacological therapies to combat major depression, autophagy, a repair mechanism,
27
that has been implicated in many different diseases, including neurodegenerative ones
like Huntington, Parkinson’s and Alzheimer’s71–74, has recently come into the focus of
antidepressant research. As current antidepressants seem to act not only on neurons as
primary targets, but also directly on astrocytes by affecting intracellular signalling
pathways and gene expression39,75,76, because major depression is associated with com-
promised glial function77 and because astrocytes are vitally important for recycling of
substances, especially glutamate, at the synapse78, I tested the 24 chosen substances on
primary rat astrocytes.
6.2 MTT Assays As mentioned in the Results section and as presented in Figure 1-6, many substances did
not elicit a decreased cell viability at high concentrations, but instead led to a higher rate
of reduction of MTT than the vehicle control did. In the case of Luteolin, this could be
due to the finding that Luteolin even seems to reduce MTT even in the absence of
cells79,80, feigning higher rates of viability, thus showing no correlation to mitochondrial
activity and rendering my MTT assay void. Ultimately, Luteolin was used at a
concentration of 50 μM as described in the literature46. Other substances might have
similar effects. However, a viability of above that of the vehicle control (above 100% in
the graphs) could also signify that a substance, instead of having a toxic effect, leads to
cell proliferation and therefore a higher total mitochondrial activity (and thus a higher
reduction rate, measured as higher absorbance rates). A drug could also lead to higher
mitochondrial activity per se in individual cells, hence also increasing absorbance
values44. In order to better assess drug toxicity on cell viability, it might be advisable to
also run other cytotoxicity assays like LDH release assays to evaluate necrosis, Trypan
blue staining assays to assess membrane damage, caspase activity to assess apoptosis or
several others.
28
6.3 Levels of p27 All of the 24 drugs were selected from the high throughput screen carried out by Rico-
Bautista et al. that tested different substances with their regard to SKP2 inhibition. As a
readout of this inhibition, the stabilization of p27, well-characterized as a SKP2 sub-
strate, was used. Theoretically, all 24 drugs thus should have increased the levels of p27
due to a decreased ubiquitination and degradation of p27 upon SKP2 inhibition. With
the vehicle set to be at 100% as reference, however, p27 did not seem to increase in re-
sponse to many drugs. This might be explained by the fact that the screen done by Rico-
Bautista et al. was carried out by using higher concentrations of the drugs, whereas I
titrated them down to low-toxic concentrations by means of LD20. By basically eliminat-
ing toxic effects of the substances on cells, autophagic processes, like the stabilization of
Beclin 1, that were elicited in response to an SKP2 inhibition could be focused upon.
Since p27 is a cell cycle inhibitor that regulates cell differentiation and proliferation, it
only makes sense that its level increased in response to toxic stimuli, however, thus try-
ing to induce cell cycle arrest and enhancing expression of DNA repair proteins.
6.4 Levels of p27 in accordance with Beclin1 The E3 ligase SKP2 catalyses the ubiquitination of both Beclin1 and p27 as can be seen
in Figure 1, thus targeting the two proteins for degradation by the proteasome. When
this E3 ligase is inhibited by the small molecule inhibitor SMIP004 or other substances,
it would only be logical that both, levels of p27 and Beclin1, would increase as seen in
Fig. 7D and E. For certain substances like 17-AAG, Clomipramine and Celecoxibe this
holds true (Fig. 2F and G, Fig. 4F and G, Fig. 6F and G, respectively). However, this does
not seem to be the case in all instances as other drugs, like Topotecan, Salinomycin or
Securinine increase Beclin1 levels whilst decreasing p27 levels (Fig. 1F and G, Fig. 3F
and G, and Fig. 2F and G, respectively), whereas some drugs like Perphenazine and Lute-
olin decrease the p27 signal significantly whilst the Beclin1 signal stays nearly the same
29
(Fig. 4F and G). Despite both Beclin1 and p27 being substrates of SKP2, this phenome-
non could be explained by a difference in affinity for the E3 ligase. Since the substances
used were administered at different concentrations, depending on the results of the
MTT assays performed, this is a possible explanation. Binding affinities are affected by
many different parameters, including allosteric regulation which might very well play a
role in the differing response of p27 and Beclin1 levels in response to SKP2 inhibition,
but it would go beyond the scope of this study to test them all.
6.5 Beclin1 and Vps34 Out of the four molecules that I looked at in my study, Beclin1 and Vps34 are part of a
class III PI3 kinase-containing complex that is also termed the autophagy initiation
complex, acting as a binding platform for other proteins such as Atg 14 (that leads to
autophagy induction)81, UVRAG (which promotes autophagosome maturation by
fostering the fusion of autophagosome and late endosomes)82–84, Rubicon (negative
regulator of autophagy that inhibits the autophagosome maturation)85,86,87 or others.
As Beclin1 plays a crucial role in the coordination of the cytoprotective role of
autophagy88 and Vps34, vacuolar protein sorting 34, a phosphoinositide
3-kinase, also seems important in regulating autophagy (as inhibition of
it led to a blockade of autophagic degradation)89, it makes sense to analyze the protein
levels of Beclin1 and Vps34 in order to understand whether the applied drugs induce
autophagy (as could be seen by increased levels of Beclin1 and Vps34) or
downregulated it (in which case levels of Beclin1 and Vps34 would decrease).
In the case of levels of Beclin1 in comparison to those of Vps34, a similar issue as that of
the relationship of levels of p27 and Beclin1 can be observed. Since Beclin1 and Vps34
form the above mentioned complex, it would only seem plausible that these two
parameters would change in a related manner, i.e. to either both increase or both
decrease in a perhaps even proportional fashion as could be observed in response to
30
treatment with Celecoxibe (Fig. 6F and H). Nevertheless, several drugs had opposite
effects on the ratio of Beclin1 to Vps34 levels. Whereas Valinomycin decreased the levels
of Vps34, the levels of Beclin1 stayed almost constant (Fig.3 F and H). Parthenolide, on
the other hand, increased Vps34 significantly, but Beclin1 levels lingered at 100% (Fig.
3F and H). In the opposite direction, this could also be observed: Beclin1 levels
increased in response to Clomipramine or Niclosamide, but Vps34 levels stagnated (Fig.
4F and H, Fig 5 F and H, respectively). These results could be explained by the finding
that not the entire amount of Vps34 is bound to Beclin162,63 as part of the initiation
complex, but that part of it is free. Which part is affected by the administration of the
drug remains to be seen and would be subject to further research, like
coimmunoprecipitation using crosslinks to identify physiological protein-protein
interactions. Similarly, the experiments carried out for this thesis do not differentiate
between expression vs. activity of a protein marker. Beclin1, for example, becomes
phosphorylated by the ULK1/2 kinase, which leads to the activation of Vps3490,
whereas Rubicon, on the other hand, decreases the activation of Vps34 and therefore
leads to a downregulation of autophagy85. It therefore would be important to make the
distinction between activated vs. inactive Vps34, which cannot be deduced from my
data, as that would provide more information about the effect of up- or downregulation
of a marker on autophagy.
6.6 Bafilomycin Assays and assay of p62 degradation The level of lipidated LC3, a downstream marker of autophagy that was tested, was af-
fected by the addition of Bafilomycin A1 upon treatment with some of the different sub-
stances as well. Autophagic flux, defined as the dynamic process of autophagy, includes
autophagy formation and maturation, lysosomal fusion and the following degradation
and recycling of macromolecules. It is useful to look at autophagic flux instead of only
31
conducting experiments measuring the protein abundance of „static“ markers, because
autophagic flux is a measure of autophagic degradation activity91 and is therefore crucial
in understanding the dynamics of autophagy in cells. Since an accumulation of autopha-
gosomes, represented by an increased lipidated LC3, could be due to an increased rate
auf autophagic induction or a block somewhere downstream, inhibiting autosomal mat-
uration and degradation, it is important to distinguish between these two scenarios by
means of visualizing autophagic flux. Bafilomycin A1, a macrolide antibiotic that as a
vacuolar H(+) ATP-ase inhibitor92 increases the pH of lysosomes93 and inhibits the fu-
sion of lysosomes and autophagosomes37, thereby acting as a lysosomal degradation
inhibitor. Bafilomycin A1 increases the level of LC3II when autophagic flux occurs, be-
cause the transit of autophagosomes (to whose membranes LC3II is linked) through the
autophagic pathway is blocked94. Thus, the difference in the amount of LC3II/I in the
samples without Bafilomycin A1 to the ones treated with Bafilomycin A1 account for the
amount of LC3II/I that is degraded by lysosomes95. The fact that the effect of Bafilomy-
cin A1, a marked increase in the signal of LC3II/I, was amplified even more upon the
addition of the substance shows that more marker accumulates due to increase in au-
tophagic flux in response to administration of the drug. This was the case for Etoposide,
Xanthohumol, Perphenazine and Salinomycin as they increased the lipidated LC3 signifi-
cantly (Fig. 11A and B, Fig. 12 A and B, Fig. 11 G and H, respectively). However, although
LC3II usually correlates with the number of autophagosomes96, not all LC3II is linked to
autophagic membranes as some seems to be ectopically generated97. These LC3II popu-
lations being independent of autophagy makes it difficult to account changes in the ex-
pression of LC3II solely to autophagic flux. Therefore, it is important to also use other
means of monitoring autophagic flux in combination with methods looking at LC3II
turnover. As p62 is degraded by autophagy, p62 levels can also be implemented to serve
this purpose. Thus, an activation of autophagy leads to decreased levels of p62, whereas
32
a suppression of it leads to an accumulation of the marker. Clomipramine and Celecox-
ibe increased the lipidated LC3 in response to Bafilomycin administration and also de-
creased the level of p62 (Fig. 12 A and B), but not significantly and therefore seem to
increase autophagic flux. Salinomycin, which has been shown to induce autophagic flux
at low concentrations98,99, however, increases both the LC3II/I ratio and p62 significant-
ly (Fig. 11 G and H). Similar effects can be seen in the case of Perphenazine (Fig. 12 A
and B), Etoposide (where only LC3II/I, however, increases significantly) and Pyrvinium
pamoate (where both LC3II/I and p62 increase, but neither does so significantly). These
effects could be explained by pitfalls in this system of monitoring autophagic flux as p62
is degraded not only through autophagy, but also through a ubiquitin-proteasome sys-
tem, leading to increased levels of p62 also when the proteasome is inhibited. Addition-
ally, p62 seems to be linked to other molecular signalling pathways that affect autopha-
gy100, thus making the monitoring of autophagic flux based on p62 more difficult. Con-
versely, levels of p62 could have also increased due to a stimulatory effect of the applied
substances as p62 by means of transcriptional upregulation, for example101. Despite the
drawbacks of both Bafilomycin A1 and p62 degradation assays, taken in combination
with each other, they should yield reliable results. However, because Bafilomycin A1
assays seem to have fewer flaws than p62 degradation assays, I decided to impart more
importance to their results when p62 and LC3II/I values did not correlate as in several
instances mentioned above. Nevertheless, it might be advisable to look at other ways of
measuring autophagic flux through tandem-fluorescence tagged LC3102 or lysomome-
dependent long-lived protein degradation97 or to even try to measure the rate of au-
tophagic flux in further studies.
6.7 Forced Swim Test
33
The forced swim test is a behavioural test in rodents, used to test the efficacy of poten-
tial new antidepressant compounds by creating a situation in which “behavioural des-
pair” is induced. Salinomycin, chosen to be tested by these means, exhibited a significant
antidepressant-like effect by increasing the time of struggling and decreasing the time
that the mouse spent floating (Fig. 14). The forced swim test was developed in the late
1970s as a animal behavioural paradigm for the evaluation of antidepressant drugs. The
assumption is that animals will try to escape stressful stimuli (in this case, being placed
into a cylinder of water), but if that is impossible, they would give up. Antidepressant-
acting substances should increase the time an animal spends in escape attempts (meas-
ured by struggling), instead of giving up (floating, being immobile)103. Since minimal
equipment is needed in order to carry out the test in mice, because high-throughput
screening of drugs is possible via this method, yielding a wealth of data which can be
used to compare different studies, the FST is an important tool in drug discovery and
research68. Of course, there are drawbacks to this test as it does not necessarily repre-
sent the human condition104. To verify results, it would therefore be advisable to also
carry out other models for depression-like behaviour, such as the open field test, the
elevated plus maze or the tail suspension test. Since only 12 animals were tested in the
drug and the control group of our study, more behavioural assessments should be car-
ried out to verify the results.
6.8 Potential novel antidepressants Taking into account all the things discussed above, the substances most promising of
being potential novel antidepressants are Celecoxibe (in response to treatment with
which all markers tested increased significantly and which increased autophagic flux, if
not significantly), Salinomycin (which increased both Beclin1 and LC3II/I significantly
and seems to increase autophagic flux), Etoposide, Xanthohumol and Perphenazine (all
three increasing LC3II/I significantly and increasing autophagic flux). Pimozide, a potent
34
D-2 receptor antagonist which is often coprescribed with serotonin reuptake inhibitors
to better treat depression in patients with Tourette Syndrom60 , and Perhexilene male-
ate (which has been shown to rapidly induce autophagy105) should also be further eval-
uated in the future. Lastly, Clomipramine, a substance that has been used as tricyclic
antidepressant for years has previously been shown to interfere with autophagic flux26,
in our study increased Beclin1, p27 and LC3II/I, LC3II/I and p27 even significantly so,
and also increased autophagic flux, if not significantly. Of course, our study only used a
sample size of three, hence further experiments should be carried out to validate these
results. Salinomycin, which has been shown to induce autophagy especially in cancer
cells99,106, still looked promising after being tested in mice during the forced swim test,
whereas Celecoxibe, a cyclooxygenase-2 inhibitor used as a non steroidal antiinflamma-
tory drug in clinical medicine, has already been tested in rats107 as well as in several pla-
cebo-controlled clinical trials108,109, catering to the hypothesis that an inflammation un-
derlies the pathophysiology of depression. It was found to have antidepressive effects.
Interestingly enough, Luteolin, which was shown to have antidepressant-like effects, in
part because of a suppression of endoplasmic reticulum stress45, did not have an over-
whelming effect on autophagic markers. Similarly, Gossypol and ABT-737, which as a
Bcl-2 inhibitors seemed promising, did not convince either as they did increase LC3II/I
(ABT-737 significantly so), but did not significantly affect flux at all. This was suprising,
as through Bcl-2 inhibition, Bcl-2’s interaction with the BH3 domain of Beclin1 was elim-
inated, thus reducing its inhibitive effect on autophagy110,111, rendering Gossypol112 and
ABT-73753,113 autophagic inducers. Lastly, Minocycline, which has been tested as a po-
tential novel antidepressant in several instances and has had positive effects, did not
affect expression patterns of autophagic markers very much at all and even seems to
suppress autophagic flux (decreasing lipidated LC3 and increasing p62), again showing
that there might be different cellular processes involved in the pathophysiology of major
35
depression. Since the drugs tested here were only administered for a period of 24 hours,
after which the cells were harvested and protein effects were determined, it is impossi-
ble to say what the drugs’ effects would be when used over an extended period of time,
in chronic treatment. Different experiments, including those measuring the concentra-
tion of drugs in the brain to see what kind of gradients could be built up, as well as elec-
trophysiological test, examining the reaction of hippocampal neurons in response to
drug administration114, would be useful in creating a more complete picture of the
drugs’ actions.
7 Conclusion and Outlook In conclusion, out of the 24 drugs that were tested with respect to their effect on au-
tophagy, a few showed positive effects on the induction of autophagy and thus should be
further investigated in light of potentially being novel antidepressants.
There is still much to be researched in the field of major depression as very little is yet
known about the pathophysiology of this disease. Many more experiments will have to
be carried out, and just in the field of autophagy, many processes will have to be more
completely understood in order to properly evaluate the results. Until these mechanisms
have been understoood, it would be important to look at even more different markers of
autophagy, such as UVRAG, Rubicon or Atg14, that are also involved in the initiation
complex, as well as sites of phosphorylation or the oligomerization behaviour of differ-
ent molecules, in order to get a broader picture of a drug’s action. In addition, the exper-
iments should also be repeated in neurons, as both astrocytes and neurons are critical
for the antidepressant response. Furthermore, a greater number of in vivo experiments
still have to be carried out, including potentially ones of the drugs that I found out to be
promising targets. In order to be able to undertake those, however, it would be wise to
also look at the drug’s ability to cross the blood brain barrier, as otherwise, it would
36
have to be discussed whether a peripheral effect of the drug would be great enough to
show a strong antidepressant effect. Similarly, it would be important to consider the side
effects of potential new antidepressants, especially in the view of taking them over an
extended period of time as the antidepressant effect would have to warrant the side ef-
fects. Side effects were especially pronounced in some of the first antidepressant drugs,
tricyclic antidepressants, which since then have almost been replaced in the treatment
of depression by the more selective (and thus fewer side effect-inducing) SSRIs. It would
be hoped that new antidepressants would also induce faster antidepressant responses
in patient behaviour. Ketamine, an NMDA-Receptor antagonist used in clinical anesthe-
sia, has recently been discovered to elicit a rapid and potent antidepressant effect, after
having been administered intravenously only once115,116. Since then, the effect of the glu-
tamatergic system on major depression has been the focus of much research. In re-
sponse to NMDA stimulation, autophagy in neurons seems to be upregulated117,118. Since
autophagy also seems to a play role in NMDA-Receptor modulated synaptic neuro-
transmission and synaptic plasticity119, substances acting on autophagic pathways might
have a faster onset of action than many of the antidepressant drugs used currently in
clinical medicine, hence making the further study of autophagy in the context of the
pharmacological therapy of major depression worthwhile.
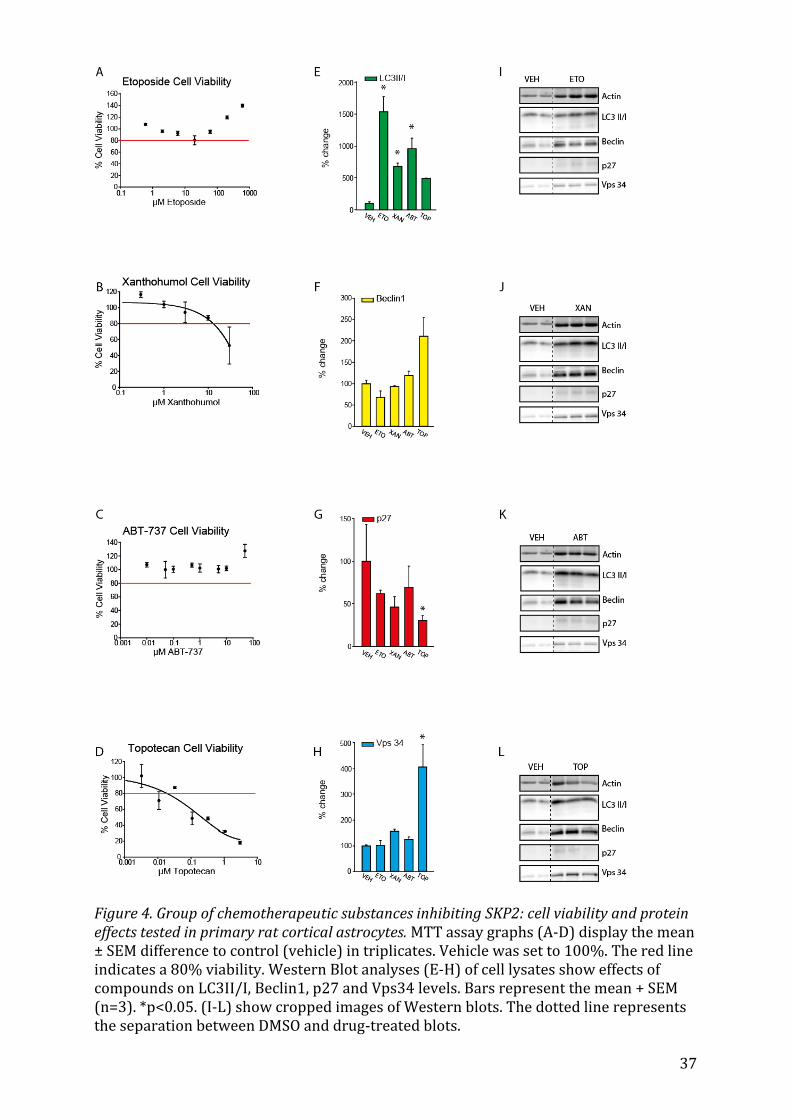
37
Figure 4. Group of chemotherapeutic substances inhibiting SKP2: cell viability and protein effects tested in primary rat cortical astrocytes. MTT assay graphs (A-D) display the mean ± SEM difference to control (vehicle) in triplicates. Vehicle was set to 100%. The red line indicates a 80% viability. Western Blot analyses (E-H) of cell lysates show effects of compounds on LC3II/I, Beclin1, p27 and Vps34 levels. Bars represent the mean + SEM (n=3). *p<0.05. (I-L) show cropped images of Western blots. The dotted line represents the separation between DMSO and drug-treated blots.
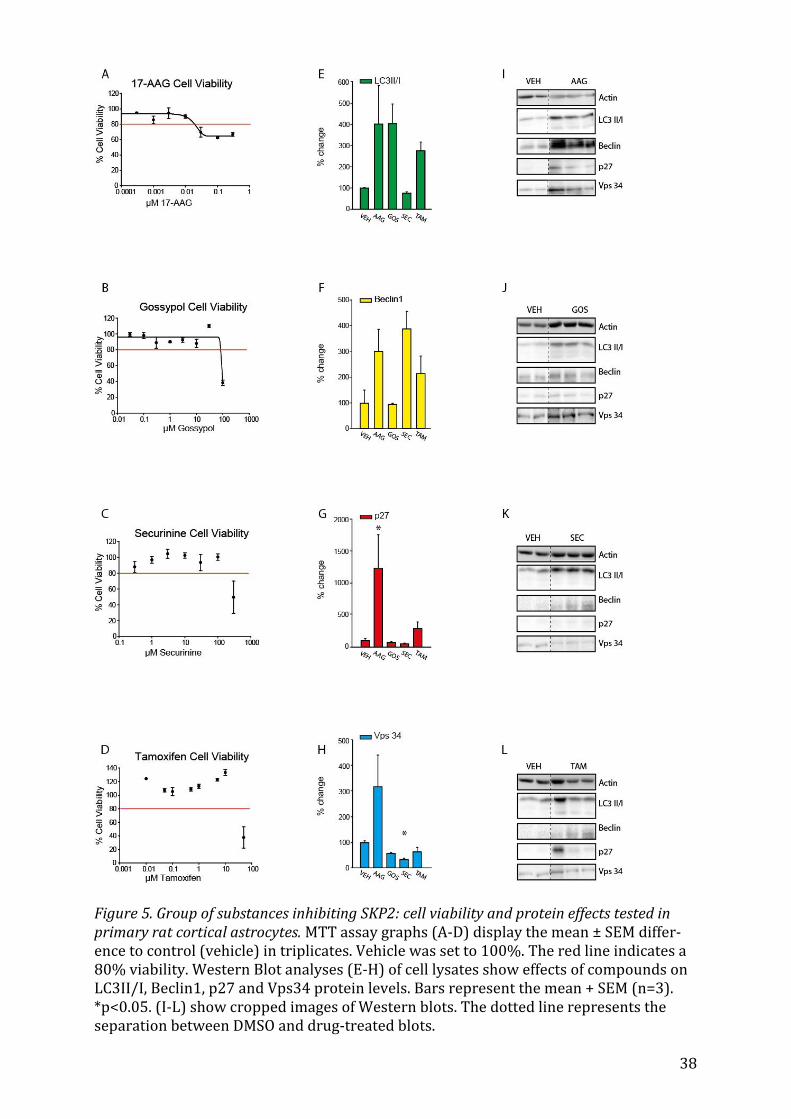
38
Figure 5. Group of substances inhibiting SKP2: cell viability and protein effects tested in primary rat cortical astrocytes. MTT assay graphs (A-D) display the mean ± SEM differ-ence to control (vehicle) in triplicates. Vehicle was set to 100%. The red line indicates a 80% viability. Western Blot analyses (E-H) of cell lysates show effects of compounds on LC3II/I, Beclin1, p27 and Vps34 protein levels. Bars represent the mean + SEM (n=3). *p<0.05. (I-L) show cropped images of Western blots. The dotted line represents the separation between DMSO and drug-treated blots.
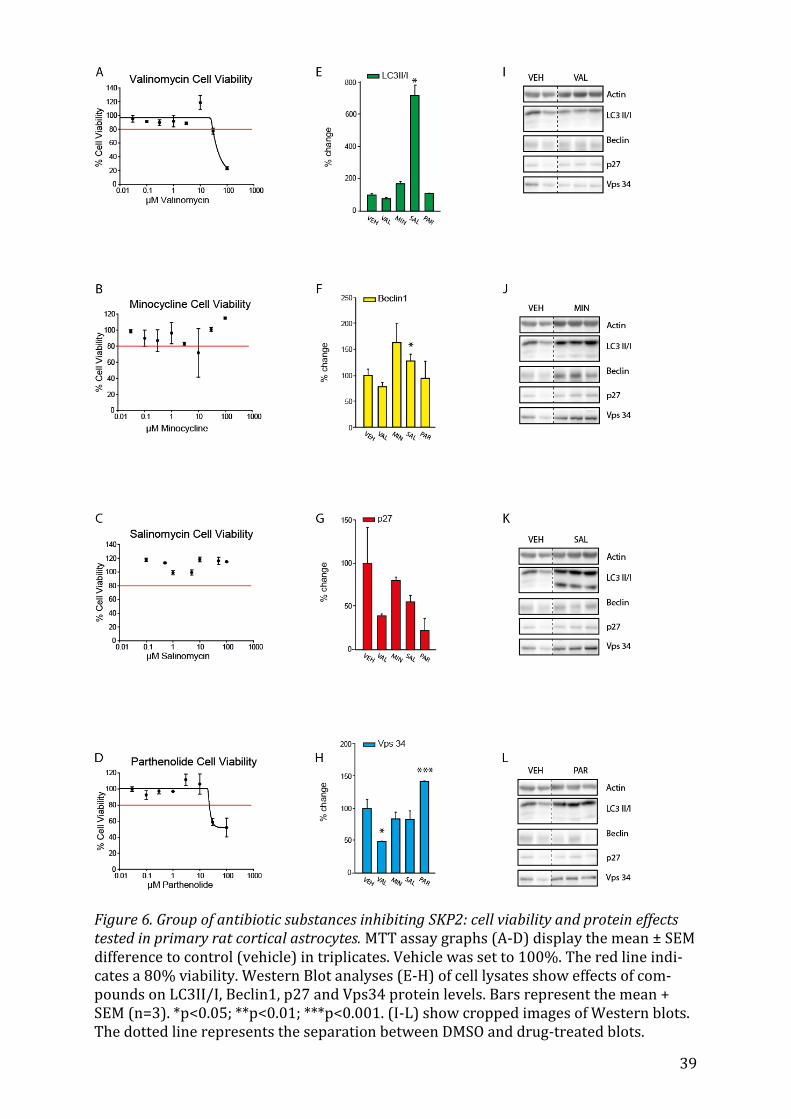
39
Figure 6. Group of antibiotic substances inhibiting SKP2: cell viability and protein effects tested in primary rat cortical astrocytes. MTT assay graphs (A-D) display the mean ± SEM difference to control (vehicle) in triplicates. Vehicle was set to 100%. The red line indi-cates a 80% viability. Western Blot analyses (E-H) of cell lysates show effects of com-pounds on LC3II/I, Beclin1, p27 and Vps34 protein levels. Bars represent the mean + SEM (n=3). *p<0.05; **p<0.01; ***p<0.001. (I-L) show cropped images of Western blots. The dotted line represents the separation between DMSO and drug-treated blots.
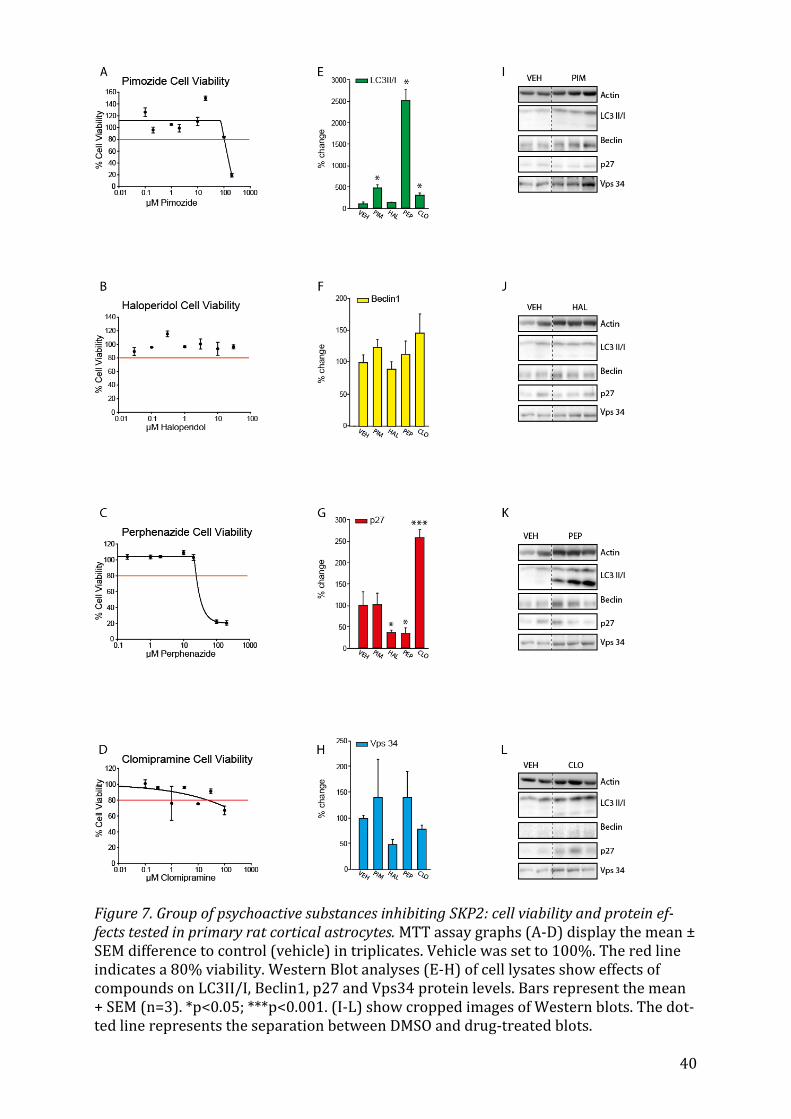
40
Figure 7. Group of psychoactive substances inhibiting SKP2: cell viability and protein ef-fects tested in primary rat cortical astrocytes. MTT assay graphs (A-D) display the mean ± SEM difference to control (vehicle) in triplicates. Vehicle was set to 100%. The red line indicates a 80% viability. Western Blot analyses (E-H) of cell lysates show effects of compounds on LC3II/I, Beclin1, p27 and Vps34 protein levels. Bars represent the mean + SEM (n=3). *p<0.05; ***p<0.001. (I-L) show cropped images of Western blots. The dot-ted line represents the separation between DMSO and drug-treated blots.
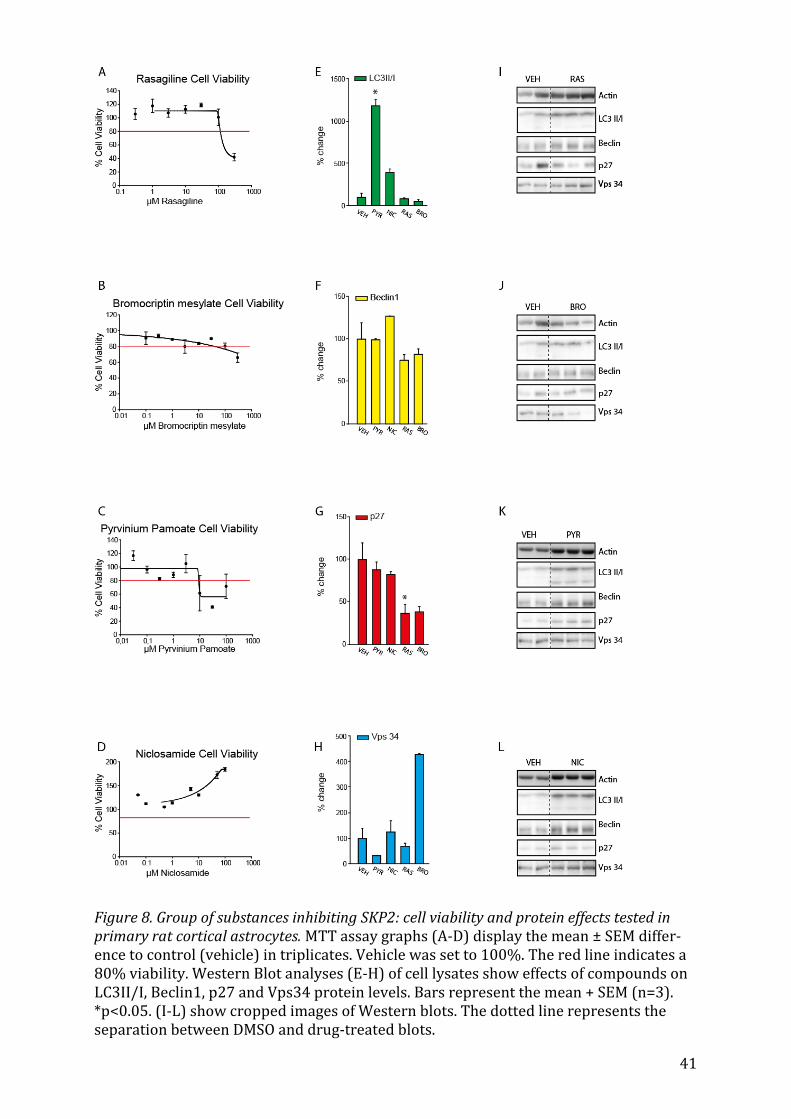
41
Figure 8. Group of substances inhibiting SKP2: cell viability and protein effects tested in primary rat cortical astrocytes. MTT assay graphs (A-D) display the mean ± SEM differ-ence to control (vehicle) in triplicates. Vehicle was set to 100%. The red line indicates a 80% viability. Western Blot analyses (E-H) of cell lysates show effects of compounds on LC3II/I, Beclin1, p27 and Vps34 protein levels. Bars represent the mean + SEM (n=3). *p<0.05. (I-L) show cropped images of Western blots. The dotted line represents the separation between DMSO and drug-treated blots.
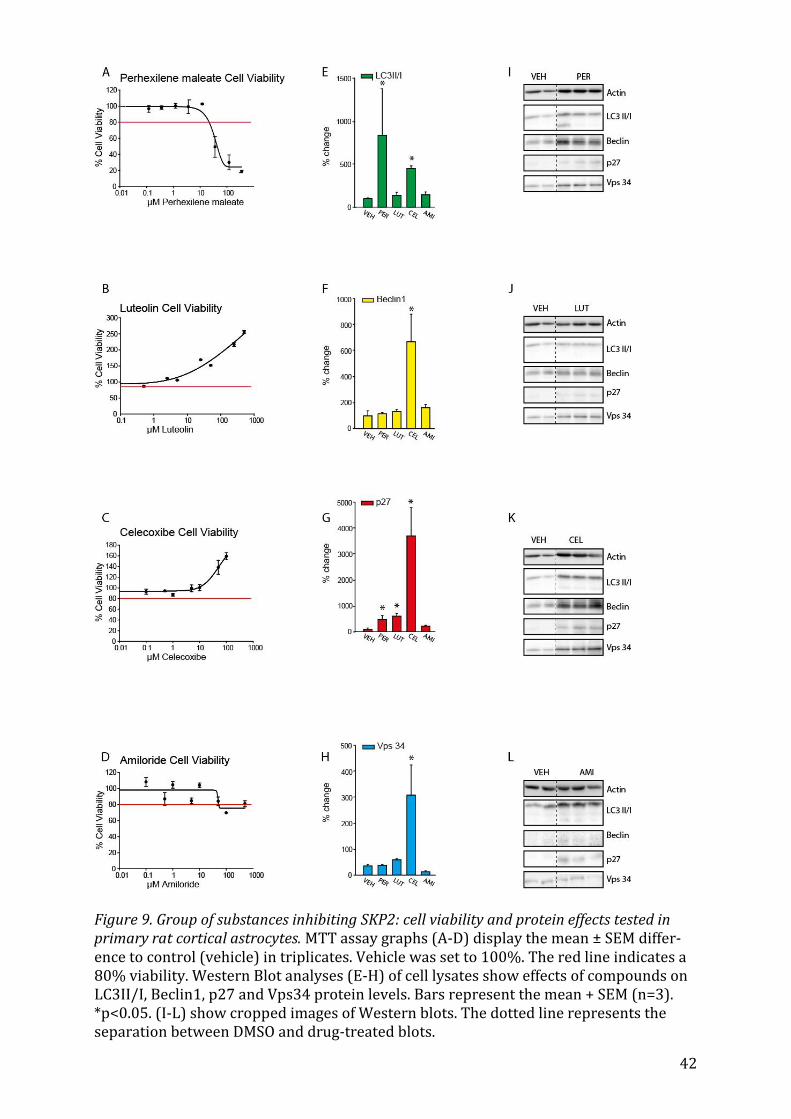
42
Figure 9. Group of substances inhibiting SKP2: cell viability and protein effects tested in primary rat cortical astrocytes. MTT assay graphs (A-D) display the mean ± SEM differ-ence to control (vehicle) in triplicates. Vehicle was set to 100%. The red line indicates a 80% viability. Western Blot analyses (E-H) of cell lysates show effects of compounds on LC3II/I, Beclin1, p27 and Vps34 protein levels. Bars represent the mean + SEM (n=3). *p<0.05. (I-L) show cropped images of Western blots. The dotted line represents the separation between DMSO and drug-treated blots.
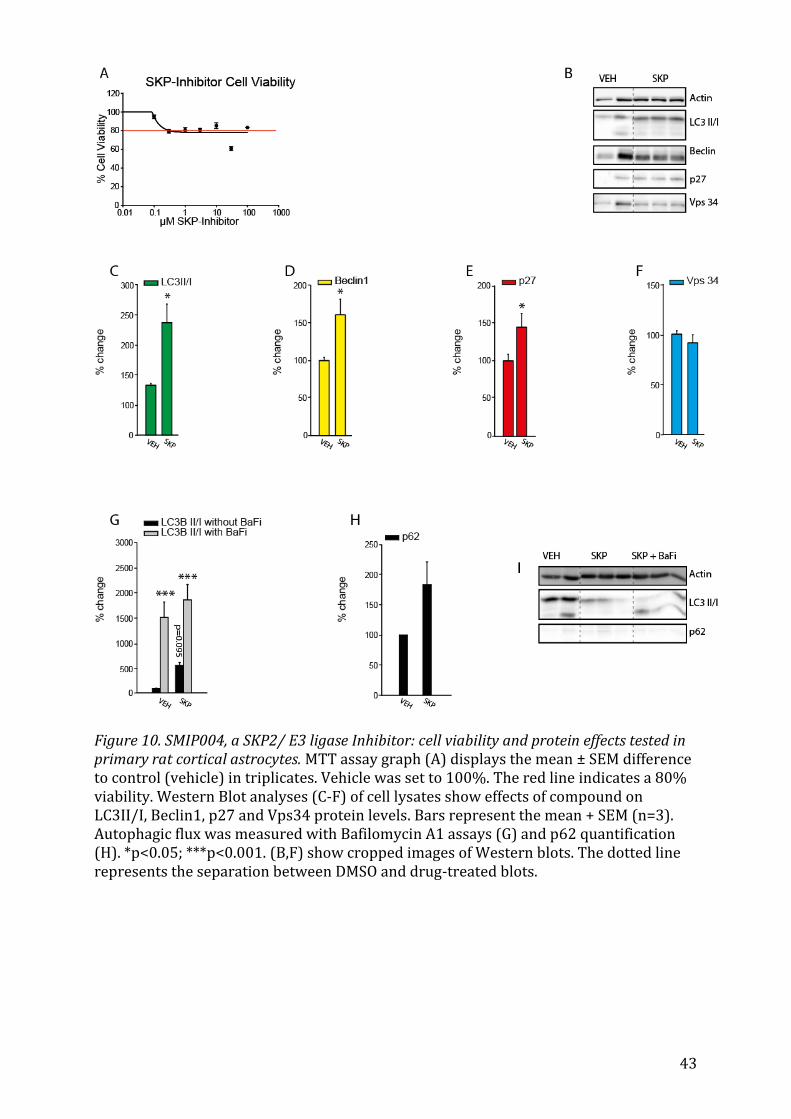
43
Figure 10. SMIP004, a SKP2/ E3 ligase Inhibitor: cell viability and protein effects tested in primary rat cortical astrocytes. MTT assay graph (A) displays the mean ± SEM difference to control (vehicle) in triplicates. Vehicle was set to 100%. The red line indicates a 80% viability. Western Blot analyses (C-F) of cell lysates show effects of compound on LC3II/I, Beclin1, p27 and Vps34 protein levels. Bars represent the mean + SEM (n=3). Autophagic flux was measured with Bafilomycin A1 assays (G) and p62 quantification (H). *p<0.05; ***p<0.001. (B,F) show cropped images of Western blots. The dotted line represents the separation between DMSO and drug-treated blots.
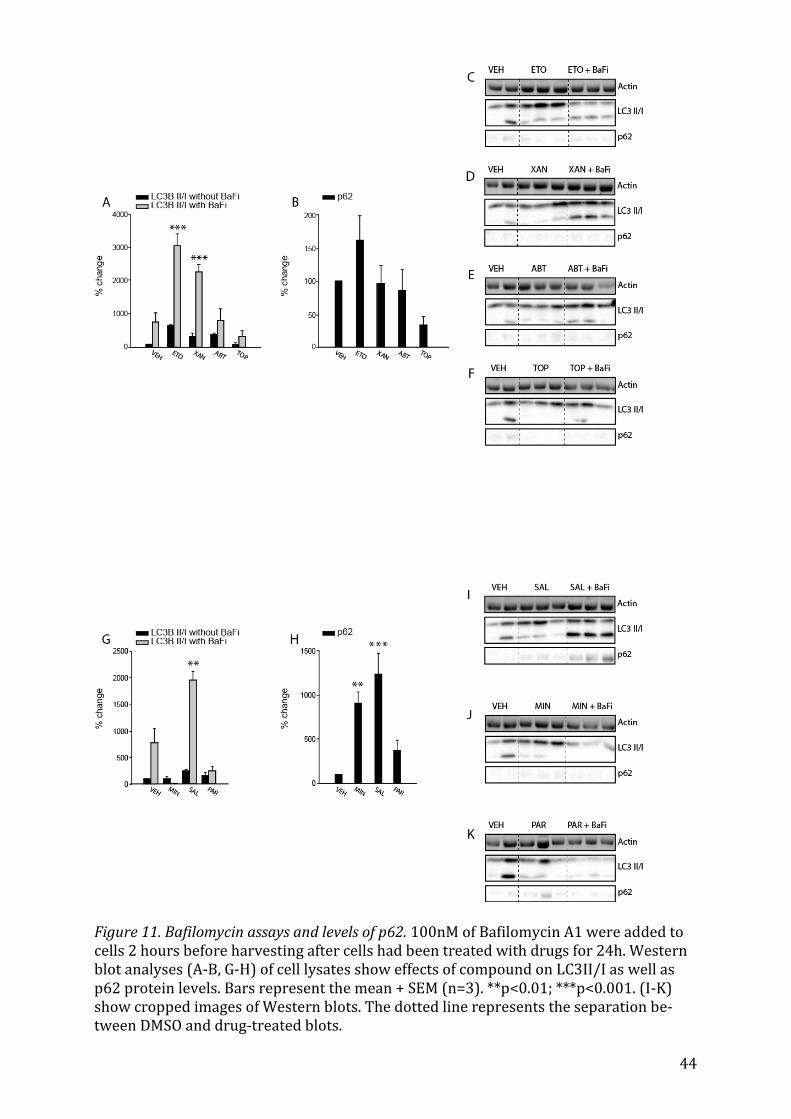
44
Figure 11. Bafilomycin assays and levels of p62. 100nM of Bafilomycin A1 were added to cells 2 hours before harvesting after cells had been treated with drugs for 24h. Western blot analyses (A-B, G-H) of cell lysates show effects of compound on LC3II/I as well as p62 protein levels. Bars represent the mean + SEM (n=3). **p<0.01; ***p<0.001. (I-K) show cropped images of Western blots. The dotted line represents the separation be-tween DMSO and drug-treated blots.
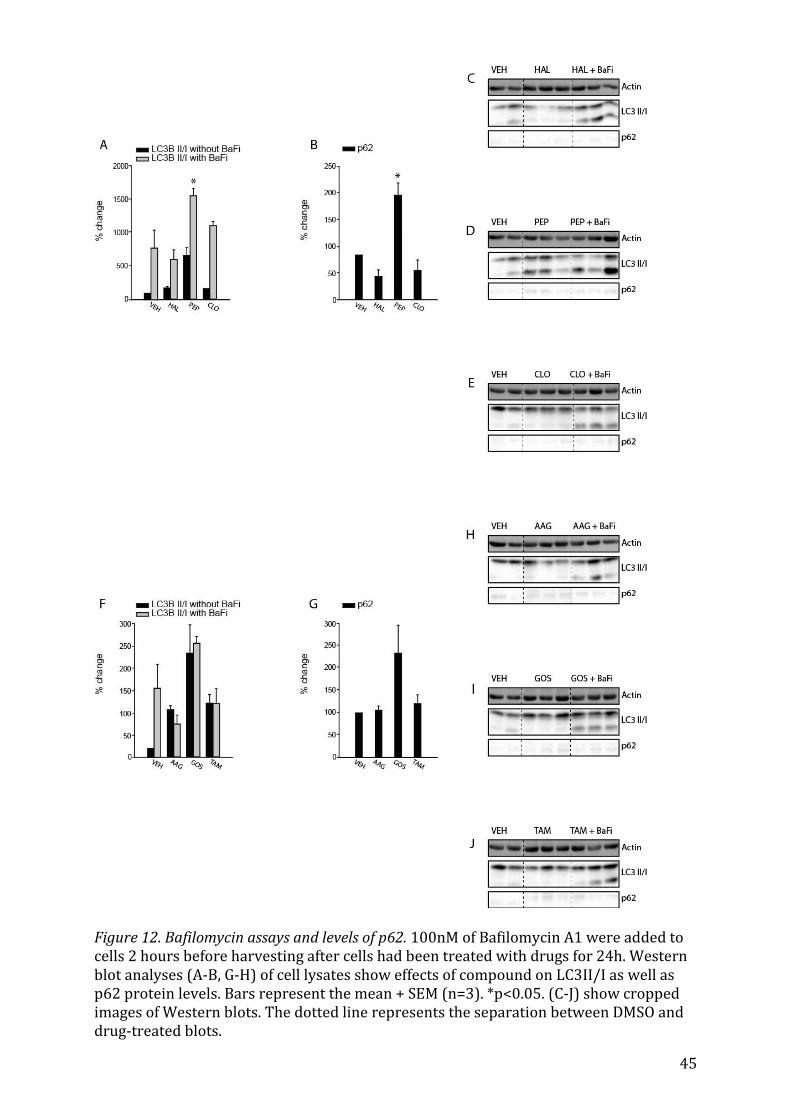
45
Figure 12. Bafilomycin assays and levels of p62. 100nM of Bafilomycin A1 were added to cells 2 hours before harvesting after cells had been treated with drugs for 24h. Western blot analyses (A-B, G-H) of cell lysates show effects of compound on LC3II/I as well as p62 protein levels. Bars represent the mean + SEM (n=3). *p<0.05. (C-J) show cropped images of Western blots. The dotted line represents the separation between DMSO and drug-treated blots.
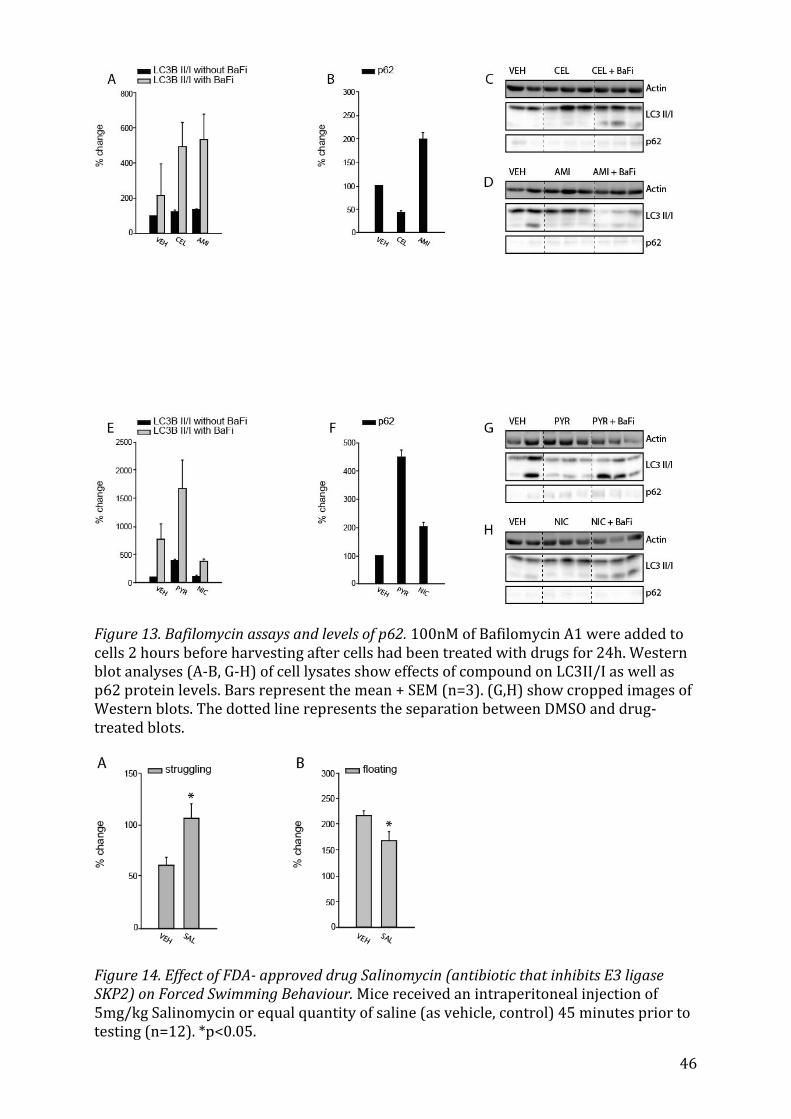
46
Figure 13. Bafilomycin assays and levels of p62. 100nM of Bafilomycin A1 were added to cells 2 hours before harvesting after cells had been treated with drugs for 24h. Western blot analyses (A-B, G-H) of cell lysates show effects of compound on LC3II/I as well as p62 protein levels. Bars represent the mean + SEM (n=3). (G,H) show cropped images of Western blots. The dotted line represents the separation between DMSO and drug-treated blots.
Figure 14. Effect of FDA- approved drug Salinomycin (antibiotic that inhibits E3 ligase SKP2) on Forced Swimming Behaviour. Mice received an intraperitoneal injection of 5mg/kg Salinomycin or equal quantity of saline (as vehicle, control) 45 minutes prior to testing (n=12). *p<0.05.
47
8 Bibliography 1. WHO | Depression. WHO Available at: http://www.who.int/mediacentre/factsheets/fs369/en/. (Accessed: 6th April 2016) 2. WHO | The global burden of disease: 2004 update. WHO Available at: http://www.who.int/healthinfo/global_burden_disease/2004_report_update/en/. (Ac-cessed: 6th April 2016) 3. Kruijshaar, M. E. et al. Lifetime prevalence estimates of major depression: an indi-rect estimation method and a quantification of recall bias. Eur. J. Epidemiol. 20, 103–111 (2005). 4. Yiend, J. et al. Long term outcome of primary care depression. J. Affect. Disord. 118, 79–86 (2009). 5. Paykel, E. S. Partial remission, residual symptoms, and relapse in depression. Dia-logues Clin. Neurosci. 10, 431–437 (2008). 6. Rush, A. J. et al. Acute and longer-term outcomes in depressed outpatients requir-ing one or several treatment steps: a STAR*D report. Am. J. Psychiatry 163, 1905–1917 (2006). 7. Warden, D., Rush, A. J., Trivedi, M. H., Fava, M. & Wisniewski, S. R. The STAR*D Project results: a comprehensive review of findings. Curr. Psychiatry Rep. 9, 449–459 (2007). 8. The catecholamine hypothesis of affective disorders: a review of supporting evi-dence. 1965 [classical article]. J. Neuropsychiatry Clin. Neurosci. 7, 524–533 (1995). 9. Nestler, E. J. Antidepressant treatments in the 21st century. Biol. Psychiatry 44, 526–533 (1998). 10. O’Leary, O. F., Dinan, T. G. & Cryan, J. F. Faster, better, stronger: towards new an-tidepressant therapeutic strategies. Eur. J. Pharmacol. 753, 32–50 (2015). 11. Holsboer, F. Stress, hypercortisolism and corticosteroid receptors in depression: implications for therapy. J. Affect. Disord. 62, 77–91 (2001). 12. Purba, J. S., Hoogendijk, W. J., Hofman, M. A. & Swaab, D. F. Increased number of vasopressin- and oxytocin-expressing neurons in the paraventricular nucleus of the hy-pothalamus in depression. Arch. Gen. Psychiatry 53, 137–143 (1996). 13. Noto, C. et al. Targeting the inflammatory pathway as a therapeutic tool for major depression. Neuroimmunomodulation 21, 131–139 (2014). 14. Miller, A. H., Maletic, V. & Raison, C. L. Inflammation and its discontents: the role of cytokines in the pathophysiology of major depression. Biol. Psychiatry 65, 732–741 (2009). 15. Felger, J. C. & Lotrich, F. E. Inflammatory cytokines in depression: neurobiological mechanisms and therapeutic implications. Neuroscience 246, 199–229 (2013).
48
16. Han, Q.-Q. & Yu, J. Inflammation: a mechanism of depression? Neurosci. Bull. 30, 515–523 (2014). 17. Hercher, C., Turecki, G. & Mechawar, N. Through the looking glass: examining neuroanatomical evidence for cellular alterations in major depression. J. Psychiatr. Res. 43, 947–961 (2009). 18. Duman, R. S. Depression: a case of neuronal life and death? Biol. Psychiatry 56, 140–145 (2004). 19. Drevets, W. C. Neuroplasticity in mood disorders. Dialogues Clin. Neurosci. 6, 199–216 (2004). 20. Videbech, P. & Ravnkilde, B. Hippocampal volume and depression: a meta-analysis of MRI studies. Am. J. Psychiatry 161, 1957–1966 (2004). 21. Nestler, E. J. et al. Neurobiology of depression. Neuron 34, 13–25 (2002). 22. Shirayama, Y., Chen, A. C.-H., Nakagawa, S., Russell, D. S. & Duman, R. S. Brain-Derived Neurotrophic Factor Produces Antidepressant Effects in Behavioral Models of Depression. J. Neurosci. 22, 3251–3261 (2002). 23. Nickeleit, I., Zender, S., Kossatz, U. & Malek, N. P. p27kip1: a target for tumor the-rapies? Cell Div. 2, 13 (2007). 24. Hiromura, K., Pippin, J. W., Fero, M. L., Roberts, J. M. & Shankland, S. J. Modulation of apoptosis by the cyclin-dependent kinase inhibitor p27Kip1. J. Clin. Invest. 103, 597–604 (1999). 25. Shoji-Kawata, S. et al. Identification of a candidate therapeutic autophagy-inducing peptide. Nature 494, 201–206 (2013). 26. Rossi, M. et al. Desmethylclomipramine induces the accumulation of autophagy markers by blocking autophagic flux. J. Cell Sci. 122, 3330–3339 (2009). 27. Chen, J., Korostyshevsky, D., Lee, S. & Perlstein, E. O. Accumulation of an Antide-pressant in Vesiculogenic Membranes of Yeast Cells Triggers Autophagy. PLOS ONE 7, e34024 (2012). 28. Sarkar, S. et al. Lithium induces autophagy by inhibiting inositol monophospha-tase. J. Cell Biol. 170, 1101–1111 (2005). 29. Gassen, N. C., Hartmann, J., Schmidt, M. V. & Rein, T. FKBP5/FKBP51 enhances autophagy to synergize with antidepressant action. Autophagy 11, 578–580 (2015). 30. Zschocke, J. et al. Antidepressant Drugs Diversely Affect Autophagy Pathways in Astrocytes and Neurons—Dissociation from Cholesterol Homeostasis. Neuropsycho-pharmacology 36, 1754–1768 (2011). 31. Cleary, C. et al. Antidepressive-like effects of rapamycin in animal models: Impli-cations for mTOR inhibition as a new target for treatment of affective disorders. Brain Res. Bull. 76, 469–473 (2008).

49
32. Touma, C. et al. FK506 binding protein 5 shapes stress responsiveness: modula-tion of neuroendocrine reactivity and coping behavior. Biol. Psychiatry 70, 928–936 (2011). 33. Albu, S. et al. Deficiency of FK506-binding protein (FKBP) 51 alters sleep archi-tecture and recovery sleep responses to stress in mice. J. Sleep Res. 23, 176–185 (2014). 34. Gassen, N. C. et al. Chaperoning epigenetics: FKBP51 decreases the activity of DNMT1 and mediates epigenetic effects of the antidepressant paroxetine. Sci Signal 8, ra119-ra119 (2015). 35. Gassen, N. C. et al. Association of FKBP51 with priming of autophagy pathways and mediation of antidepressant treatment response: evidence in cells, mice, and hu-mans. PLoS Med. 11, e1001755 (2014). 36. Rico-Bautista, E., Yang, C.-C., Lu, L., Roth, G. P. & Wolf, D. A. Chemical genetics ap-proach to restoring p27Kip1 reveals novel compounds with antiproliferative activity in prostate cancer cells. BMC Biol. 8, 153 (2010). 37. Yamamoto, A. et al. Bafilomycin A1 prevents maturation of autophagic vacuoles by inhibiting fusion between autophagosomes and lysosomes in rat hepatoma cell line, H-4-II-E cells. Cell Struct. Funct. 23, 33–42 (1998). 38. Barth, S., Glick, D. & Macleod, K. F. Autophagy: assays and artifacts. J. Pathol. 221, 117–124 (2010). 39. Perisic, T. et al. Valproate and amitriptyline exert common and divergent influ-ences on global and gene promoter-specific chromatin modifications in rat primary as-trocytes. Neuropsychopharmacol. Off. Publ. Am. Coll. Neuropsychopharmacol. 35, 792–805 (2010). 40. Franke, B., Figiel, M. & Engele, J. CNS glia are targets for GDNF and neurturin. His-tochem. Cell Biol. 110, 595–601 (1998). 41. Mosmann, T. Rapid colorimetric assay for cellular growth and survival: applica-tion to proliferation and cytotoxicity assays. J. Immunol. Methods 65, 55–63 (1983). 42. Alley, M. C. et al. Feasibility of drug screening with panels of human tumor cell lines using a microculture tetrazolium assay. Cancer Res. 48, 589–601 (1988). 43. Gerlier, D. & Thomasset, N. Use of MTT colorimetric assay to measure cell activa-tion. J. Immunol. Methods 94, 57–63 (1986). 44. Rexen, P. & Emborg, C. Investigation of different modifications to the tetrazolium based colorimetric viability assay. Biotechnol. Tech. 6, 255–260 (1992). 45. Ishisaka, M. et al. Luteolin shows an antidepressant-like effect via suppressing endoplasmic reticulum stress. Biol. Pharm. Bull. 34, 1481–1486 (2011). 46. Seelinger, G., Merfort, I., Wölfle, U. & Schempp, C. M. Anti-carcinogenic effects of the flavonoid luteolin. Mol. Basel Switz. 13, 2628–2651 (2008).
50
47. Sakane, K. K. et al. Cellular and molecular studies of the effects of a selective COX-2 inhibitor celecoxib in the cardiac cell line H9c2 and their correlation with death mech-anisms. Braz. J. Med. Biol. Res. 47, 50–59 (2013). 48. Circu, M. L. et al. Correction: A Novel High Content Imaging-Based Screen Identi-fies the Anti-Helminthic Niclosamide as an Inhibitor of Lysosome Anterograde Traffick-ing and Prostate Cancer Cell Invasion. PLoS ONE 11, (2016). 49. Sack, U. et al. Novel Effect of Antihelminthic Niclosamide on S100A4-Mediated Metastatic Progression in Colon Cancer. J. Natl. Cancer Inst. 103, 1018–1036 (2011). 50. Masri, B. et al. Antagonism of dopamine D2 receptor/β-arrestin 2 interaction is a common property of clinically effective antipsychotics. Proc. Natl. Acad. Sci. 105, 13656–13661 (2008). 51. Canfrán-Duque, A. et al. Curcumin Mitigates the Intracellular Lipid Deposit In-duced by Antipsychotics In Vitro. PLOS ONE 10, e0141829 (2015). 52. Qin, L., Jia, P., Zhang, Z. & Zhang, S. ROS-p53-cyclophilin-D signaling mediates sal-inomycin-induced glioma cell necrosis. J. Exp. Clin. Cancer Res. 34, 57 (2015). 53. van Delft, M. F. et al. The BH3 mimetic ABT-737 targets selective Bcl-2 proteins and efficiently induces apoptosis via Bak/Bax if Mcl-1 is neutralized. Cancer Cell 10, 389–399 (2006). 54. Konopleva, M. et al. Mechanisms of apoptosis sensitivity and resistance to the BH3 mimetic ABT-737 in acute myeloid leukemia. Cancer Cell 10, 375–388 (2006). 55. Williams, C. S. et al. Celecoxib prevents tumor growth in vivo without toxicity to normal gut: lack of correlation between in vitro and in vivo models. Cancer Res. 60, 6045–6051 (2000). 56. Trzeciak, H. I. et al. Effect of antidepressants on ATP content, 3H-valine incorpo-ration and cell morphometry of astrocytes cultured from rat brain. Dev. Neurosci. 17, 292–299 (1995). 57. Tardy, M., Costa, M. F., Fages, C., Bardakdjian, J. & Gonnard, P. Uptake and binding of serotonin by primary cultures of mouse astrocytes. Dev. Neurosci. 5, 19–26 (1982). 58. Cruz-Muñoz, W. et al. Analysis of acquired resistance to metronomic oral topo-tecan chemotherapy plus pazopanib after prolonged preclinical potent responsiveness in advanced ovarian cancer. Angiogenesis 17, 661–673 (2014). 59. King, I. F. et al. Topoisomerases facilitate transcription of long genes linked to autism. Nature 501, 58–62 (2013). 60. Desta, Z., Soukhova, N. & Flockhart, D. A. In vitro inhibition of pimozide N-dealkylation by selective serotonin reuptake inhibitors and azithromycin. J. Clin. Psycho-pharmacol. 22, 162–168 (2002). 61. Desta, Z. et al. Identification and Characterization of Human Cytochrome P450 Isoforms Interacting with Pimozide. J. Pharmacol. Exp. Ther. 285, 428–437 (1998).
51
62. Funderburk., S. F., Wang, Q. J. & Yue, Z. Beclin 1-VPS34 complex – At the Cross-roads of Autophagy and Beyond. Trends Cell Biol. 20, 355–362 (2010). 63. Morris, D. H., Yip, C. K., Shi, Y., Chait, B. T. & Wang, Q. J. BECLIN 1-VPS34 COMPLEX ARCHITECTURE: UNDERSTANDING THE NUTS AND BOLTS OF THERAPEUTIC TAR-GETS. Front. Biol. 10, 398–426 (2015). 64. Bursch, W. et al. Active cell death induced by the anti-estrogens tamoxifen and ICI 164 384 in human mammary carcinoma cells (MCF-7) in culture: the role of autophagy. Carcinogenesis 17, 1595–1607 (1996). 65. Zhang, L. et al. Small molecule regulators of autophagy identified by an image-based high-throughput screen. Proc. Natl. Acad. Sci. U. S. A. 104, 19023–19028 (2007). 66. Horowitz, J. D., Sia, S. T., Macdonald, P. S., Goble, A. J. & Louis, W. J. Perhexiline ma-leate treatment for severe angina pectoris--correlations with pharmacokinetics. Int. J. Cardiol. 13, 219–229 (1986). 67. Bjørkøy, G. et al. Monitoring autophagic degradation of p62/SQSTM1. Methods Enzymol. 452, 181–197 (2009). 68. Can, A. et al. The Mouse Forced Swim Test. J. Vis. Exp. JoVE (2012). doi:10.3791/3638 69. Porsolt, R. D., Le Pichon, M. & Jalfre, M. Depression: a new animal model sensitive to antidepressant treatments. Nature 266, 730–732 (1977). 70. Nickel, T. et al. Clinical and neurobiological effects of tianeptine and paroxetine in major depression. J. Clin. Psychopharmacol. 23, 155–168 (2003). 71. Nixon, R. A. The role of autophagy in neurodegenerative disease. Nat. Med. 19, 983–997 (2013). 72. Kesidou, E., Lagoudaki, R., Touloumi, O., Poulatsidou, K.-N. & Simeonidou, C. Au-tophagy and neurodegenerative disorders. Neural Regen. Res. 8, 2275–2283 (2013). 73. Menzies, F. M., Fleming, A. & Rubinsztein, D. C. Compromised autophagy and neu-rodegenerative diseases. Nat. Rev. Neurosci. 16, 345–357 (2015). 74. Ghavami, S. et al. Autophagy and apoptosis dysfunction in neurodegenerative disorders. Prog. Neurobiol. 112, 24–49 (2014). 75. Czéh, B. & Benedetto, B. D. Antidepressants act directly on astrocytes: Evidences and functional consequences. Eur. Neuropsychopharmacol. 23, 171–185 (2013). 76. Manev, H., Uz, T. & Manev, R. Glia as a putative target for antidepressant treat-ments. J. Affect. Disord. 75, 59–64 (2003). 77. Cotter, D., Mackay, D., Landau, S., Kerwin, R. & Everall, I. Reduced glial cell density and neuronal size in the anterior cingulate cortex in major depressive disorder. Arch. Gen. Psychiatry 58, 545–553 (2001). 78. Rajkowska, G. & Miguel-Hidalgo, J. J. Gliogenesis and Glial Pathology in Depres-
52
sion. CNS Neurol. Disord. Drug Targets 6, 219–233 (2007). 79. Peng, L., Wang, B. & Ren, P. Reduction of MTT by flavonoids in the absence of cells. Colloids Surf. B Biointerfaces 45, 108–111 (2005). 80. Talorete, T. P. N., Bouaziz, M., Sayadi, S. & Isoda, H. Influence of medium type and serum on MTT reduction by flavonoids in the absence of cells. Cytotechnology 52, 189–198 (2006). 81. He, C. & Levine, B. The Beclin 1 interactome. Curr. Opin. Cell Biol. 22, 140–149 (2010). 82. Itakura, E., Kishi, C., Inoue, K. & Mizushima, N. Beclin 1 forms two distinct phos-phatidylinositol 3-kinase complexes with mammalian Atg14 and UVRAG. Mol. Biol. Cell 19, 5360–5372 (2008). 83. Liang, C. et al. Beclin1-binding UVRAG targets the class C Vps complex to coordi-nate autophagosome maturation and endocytic trafficking. Nat. Cell Biol. 10, 776–787 (2008). 84. Kim, Y.-M. et al. mTORC1 phosphorylates UVRAG to negatively regulate autopha-gosome and endosome maturation. Mol. Cell 57, 207–218 (2015). 85. Zhong, Y. et al. Distinct regulation of autophagic activity by Atg14L and Rubicon associated with Beclin 1-phosphatidylinositol-3-kinase complex. Nat. Cell Biol. 11, 468–476 (2009). 86. Matsunaga, K. et al. Two Beclin 1-binding proteins, Atg14L and Rubicon, recipro-cally regulate autophagy at different stages. Nat. Cell Biol. 11, 385–396 (2009). 87. Lin, M. G. & Zhong, Q. Interaction between small GTPase Rab7 and PI3KC3 links autophagy and endocytosis. Small GTPases 2, 85–88 (2011). 88. Moreau, K., Luo, S. & Rubinsztein, D. C. Cytoprotective roles for autophagy. Curr. Opin. Cell Biol. 22, 206–211 (2010). 89. Jaber, N. et al. Class III PI3K Vps34 plays an essential role in autophagy and in heart and liver function. Proc. Natl. Acad. Sci. U. S. A. 109, 2003–2008 (2012). 90. Russell, R. C. et al. ULK1 induces autophagy by phosphorylating Beclin-1 and acti-vating VPS34 lipid kinase. Nat. Cell Biol. 15, 741–750 (2013). 91. Loos, B., du Toit, A. & Hofmeyr, J.-H. S. Defining and measuring autophagosome flux—concept and reality. Autophagy 10, 2087–2096 (2014). 92. Crider, B. P., Xie, X. S. & Stone, D. K. Bafilomycin inhibits proton flow through the H+ channel of vacuolar proton pumps. J. Biol. Chem. 269, 17379–17381 (1994). 93. Mauvezin, C., Nagy, P., Juhász, G. & Neufeld, T. P. Autophagosome-lysosome fusion is independent of V-ATPase-mediated acidification. Nat. Commun. 6, 7007 (2015). 94. Zhang, X., Chen, S., Huang, K. & Le, W. Why should autophagic flux be assessed?
53
Acta Pharmacol. Sin. 34, 595–599 (2013). 95. Mizushima, N. & Yoshimori, T. How to interpret LC3 immunoblotting. Autophagy 3, 542–545 (2007). 96. Kabeya, Y. et al. LC3, a mammalian homologue of yeast Apg8p, is localized in au-tophagosome membranes after processing. EMBO J. 19, 5720–5728 (2000). 97. Mizushima, N., Yoshimorim, T. & Levine, B. Methods in Mammalian Autophagy Research. Cell 140, 313–326 (2010). 98. Jangamreddy, J. R., Panigrahi, S. & Łos, M. J. Monitoring of autophagy is complicat-ed—salinomycin as an example. Biochim. Biophys. Acta BBA - Mol. Cell Res. 1853, 604–610 (2015). 99. Jangamreddy, J. R. et al. Salinomycin induces activation of autophagy, mitophagy and affects mitochondrial polarity: differences between primary and cancer cells. Bio-chim. Biophys. Acta 1833, 2057–2069 (2013). 100. Moscat, J. & Diaz-Meco, M. T. p62 at the crossroads of autophagy, apoptosis, and cancer. Cell 137, 1001–1004 (2009). 101. Sahani, M. H., Itakura, E. & Mizushima, N. Expression of the autophagy substrate SQSTM1/p62 is restored during prolonged starvation depending on transcriptional up-regulation and autophagy-derived amino acids. Autophagy 10, 431–441 (2014). 102. Zhou, C. et al. Monitoring autophagic flux by an improved tandem fluorescent-tagged LC3 (mTagRFP-mWasabi-LC3) reveals that high-dose rapamycin impairs au-tophagic flux in cancer cells. Autophagy 8, 1215–1226 (2012). 103. Porsolt, R. D., Anton, G., Blavet, N. & Jalfre, M. Behavioural despair in rats: A new model sensitive to antidepressant treatments. Eur. J. Pharmacol. 47, 379–391 (1978). 104. Yankelevitch-Yahav, R., Franko, M., Huly, A. & Doron, R. The forced swim test as a model of depressive-like behavior. J. Vis. Exp. JoVE (2015). doi:10.3791/52587 105. Balgi, A. D. et al. Screen for chemical modulators of autophagy reveals novel ther-apeutic inhibitors of mTORC1 signaling. PloS One 4, e7124 (2009). 106. Li, T. et al. Salinomycin induces cell death with autophagy through activation of endoplasmic reticulum stress in human cancer cells. Autophagy 9, 1057–1068 (2013). 107. Santiago, R. M. et al. Antidepressant-like effect of celecoxib piroxicam in rat mod-els of depression. J. Neural Transm. Vienna Austria 1996 121, 671–682 (2014). 108. Akhondzadeh, S. et al. Clinical trial of adjunctive celecoxib treatment in patients with major depression: a double blind and placebo controlled trial. Depress. Anxiety 26, 607–611 (2009). 109. Müller, N. et al. The cyclooxygenase-2 inhibitor celecoxib has therapeutic effects in major depression: results of a double-blind, randomized, placebo controlled, add-on pilot study to reboxetine. Mol. Psychiatry 11, 680–684 (2006).
54
110. Levine, B., Liu, R., Dong, X. & Zhong, Q. Beclin orthologs: integrative hubs of cell signaling, membrane trafficking, and physiology. Trends Cell Biol. 25, 533–544 (2015). 111. Levine, B., Sinha, S. & Kroemer, G. Bcl-2 family members: dual regulators of apop-tosis and autophagy. Autophagy 4, 600–606 (2008). 112. Gao, P. et al. The Bcl-2 Homology Domain 3 Mimetic Gossypol Induces Both Beclin 1-dependent and Beclin 1-independent Cytoprotective Autophagy in Cancer Cells. J. Biol. Chem. 285, 25570–25581 (2010). 113. Rooswinkel, R. W., van de Kooij, B., Verheij, M. & Borst, J. Bcl-2 is a better ABT-737 target than Bcl-xL or Bcl-w and only Noxa overcomes resistance mediated by Mcl-1, Bfl-1, or Bcl-B. Cell Death Dis. 3, e366 (2012). 114. Gobbi, G. & Blier, P. Effect of neurokinin-1 receptor antagonists on serotoninergic, noradrenergic and hippocampal neurons: Comparison with antidepressant drugs. Pep-tides 26, 1383–1393 (2005). 115. Berman, R. M. et al. Antidepressant effects of ketamine in depressed patients. Biol. Psychiatry 47, 351–354 (2000). 116. Iadarola, N. D. et al. Ketamine and other N-methyl-D-aspartate receptor antago-nists in the treatment of depression: a perspective review. Ther. Adv. Chronic Dis. 6, 97–114 (2015). 117. Shehata, M., Matsumura, H., Okubo-Suzuki, R., Ohkawa, N. & Inokuchi, K. Neuronal stimulation induces autophagy in hippocampal neurons that is involved in AMPA recep-tor degradation after chemical long-term depression. J. Neurosci. Off. J. Soc. Neurosci. 32, 10413–10422 (2012). 118. Wang, Y. et al. IGF-1 alleviates NMDA-induced excitotoxicity in cultured hippo-campal neurons against autophagy via the NR2B/PI3K-AKT-mTOR pathway. J. Cell. Phys-iol. 229, 1618–1629 (2014). 119. Shehata, M. & Inokuchi, K. Does autophagy work in synaptic plasticity and memory? Rev. Neurosci. 25, 543–557 (2014). 120. American Psychiatric Association. (2013). Diagnostic and statistical manual of mental disorders(5th ed.). Arlington, VA: American Psychiatric Publishing.
55
9 Danksagung Ohne meine Tätigkeit als studentische Hilfskraft in der Abteilung Translationale For-
schung des Max-Planck-Instituts für Psychiatrie unter Leitung von Dr. Elisabeth Binder
wäre diese Arbeit nicht möglich geworden. Für seine freundliche Aufnahme in die Pro-
jektgruppe „Molekulare Signalwege der Depression“, seine Ermunterung und Geduld
danke ich PD Dr. Theo Rein sehr herzlich. Er und Nils Gassen waren es, die mich auf das
interessante Thema gebracht haben.
Mein besonderer Dank gilt meinem Betreuer Dr. Nils Gassen, der mir bei meinen Expe-
rimenten und bei der Anfertigung der Studie stets mit Rat und Tat beiseite stand. Seine
unermüdliche Unterstützung und vielen Anregungen, vor allem aber die konstruktive
und kreative Diskussion meiner Ergebnisse waren eine überaus wertvolle und von mir
hoch geschätzte Hilfe.
Kathrin Hafner habe ich für ihre exzellente technische Assistenz und wunderbare Hilfe
beim Erlernen von Western blotting zu danken.
Für meine Arbeit durfte ich auch Daten aus den Tierexperimenten von Georgia Balsevich
nutzen. Das hat sie deutlich abrunden und eine wichtige Verbindung zur Klinik schaffen
können, wofür ich sehr dankbar bin.
Last, but not least, danke ich Professor Dr. Günter Stalla, dass er mich und diese Arbeit
als Doktorvater unter seine Fittiche genommen hat.
56
Eidesstattliche Versicherung
Frevert, Marie Louise Name, Vorname
Ich erkläre hiermit an Eides statt, dass ich die vorliegende Dissertation mit dem Thema
„24 drugs as potential SKP2 Inhibitors: a novel approach to finding new an-tidepressants“ selbständig verfasst, mich außer der angegebenen keiner weiteren Hilfsmittel bedient und alle Erkenntnisse, die aus dem Schrifttum ganz oder annahernd ubernommen sind, als solche kenntlich gemacht und nach ihrer Herkunft unter Bezeichnung der Fundstelle einzeln nachgewiesen habe. Ich erkläre des Weiteren, dass die hier vorgelegte Dissertation nicht in gleicher oder in ähnlicher Form bei einer anderen Stelle zur Erlangung eines akademischen Grades eingereicht wurde.
Berlin, den 13.07.2016 Ort, Datum Unterschrift Doktorandin/Doktorand Eidesstattliche Versicherung Stand: 31.01.2013