Embed Size (px)
Citation preview

AlbuquerqueWEATHER FORECAST OFFICE
2021-22 Winter Outlook
How Will A “Double-Dip” Moderate La Niña and a negative Pacific Decadal Oscillation (PDO) Impact 2021-22
Winter Precipitation and Temperature in Central and Northern New Mexico?
For Central & Northern New Mexico
Courtesy: Roachetzky Photography/Shutterstock
Courtesy: Ed Williams KUNM
Courtesy: Istock/Getty Images
Courtesy: Istock/Getty Images Courtesy: Santa Fe New Mexican
Courtesy: Ken Gutierrez Pinterest

AlbuquerqueWEATHER FORECAST OFFICE
2021-22 Winter OutlookWhat is a “Double-Dip” La Niña?
Figures 1-2. After a first-year La Niña event (winter 2020-21), a return to ENSO neutral after the late fall peak is gradual, and a
transition to El Niño after the first winter of La Niña rarely occurs. ENSO-neutral or a transition back into La Niña conditions occur the
following fall, as shown by a second dip in average Niño3.4 temperatures in the plot above. Of the 12 first-year La Niña events on record,
8 were followed by La Niña the next winter, 2 by neutral, and 2 by El Niño. Why? Essentially, Bjerknes feedbacks suggest reinforcing
interactions (positive feedbacks) between the ocean and atmosphere that cause El Niño and La Niña to strengthen: changes in the
tropical Pacific ocean temperatures cause changes in the overlying trade winds, which then cause additional, reinforcing changes in the
ocean temperature (Michelle L’Heureux). What’s intriguing about this year’s event is that the “double-dip” is stronger than the first-year.

AlbuquerqueWEATHER FORECAST OFFICE
2021-22 Winter Outlook
Figure 3. Global Sea Surface Temperatures (SSTs) from early November 2021. Instead of showing the typical temperature differences from
average (next slide), these are the observed temperatures. What does it show? La Niña is underway as well as a negative Pacific Decadal
Oscillation (PDO). What does a negative or cool phase of the PDO mean generally? Negative or cool phases of the PDO are associated with
below average precipitation in the Southwestern U.S. Combine that with a double-dip La Niña and the winter outlook for central and northern
NM doesn’t look good. But as is typical of a changing climate system, there’s a catch. Climate models are forecasting an area of anomalous
thunderstorm activity in the far Eastern Pacific (slide 16), thanks in large part to stronger than average SST differences due to a moderate La Niña
and a negative PDO. It’s a longshot, but it does offer some hope that this winter may not be quite as direly dry as DJF 2017-18.
Sea Surface Temperatures (SSTs)
La Niña
Negative PDO

AlbuquerqueWEATHER FORECAST OFFICE
2021-22 Winter OutlookSea Surface Temperature Anomalies (SSTAs) & Oscillation Index Values
Figure 4. Latest weekly global SST anomalies showing La Niña and a negative PDO. Cooler than average temperatures have been
expanding in the eastern equatorial Pacific Ocean during fall.
➢ Multivariate ENSO Index (MEI)
for AUG_SEP 2021: -1.4
➢ Pacific Decadal Oscillation
(PDO) for SEP 2021: -1.53
➢Atlantic Multidecadal
Oscillation (AMO) for SEP 2021:
+0.41
➢Oceanic Niño Index (ONI)
(uses Niño 3.4 region - inner
rectangle) for JAS 2021: -0.5

AlbuquerqueWEATHER FORECAST OFFICE
2021-22 Winter OutlookSub-Surface Temperature Departures in the Equatorial Pacific 2020 vs. 2021
Figures 5-6. Subsurface temperature anomalies starting in mid September 2021 and ending in early November. Negative
anomalies have continued to intensify in the central and eastern equatorial Pacific Ocean while positive subsurface temperature
anomalies have strengthened in the western Pacific.

AlbuquerqueWEATHER FORECAST OFFICE
2021-22 Winter OutlookMadden-Julian Oscillation (MJO)
Figures 7-8. The MJO is an area of enhanced thunderstorms that travels around the world every 30 to 60 days from west to east along/near
the equator. Ahead and behind the active stormy area are areas of suppressed convection and drier conditions. The MJO affects near-surface wind
patterns, because the rising air in the stormy area causes surface winds to blow toward the active area. During a developing La Niña, the trade
winds are stronger than average, helping to bring cooler waters up to the surface. If the MJO is active/strong, it typically changes the wind
patterns temporarily and helps La Niña develop.

AlbuquerqueWEATHER FORECAST OFFICE
2021-22 Winter OutlookMJO Cont’d
Figures 9-10 – The timing of the MJO is vital to whether or not La Niña constructively (amplifies) or destructively interferes
(cancels) with MJO related thunderstorms. In other words, if the MJO moves into the EPAC while La Niña is at its peak strength,
the MJO is rendered weak or having little influence on the storm track. Conversely, if the MJO translates eastward into the EPAC
while La Niña is relatively weak, the influence on bringing the storm track farther south is greater.

AlbuquerqueWEATHER FORECAST OFFICE
2021-22 Winter OutlookMJO Combined with La Niña – Destructive & Constructive Interference
Figure 11. Graphic showing the influence of the timing and strength of the MJO during La Niña with both constructive anddestructive influences on rainfall in the southeast U.S. The strength of the MJO convection, how fast it moves eastward, and howfar it travels all change based on ENSO conditions. These ENSO-modified MJO events then lead to varied impacts on U.S. rainfall.(Arcodia et al., 2020).

AlbuquerqueWEATHER FORECAST OFFICE
2021-22 Winter OutlookThe Pacific Decadal Oscillation (PDO)
Figures 12-13. Typical Sea Surface Temperature Anomaly (SSTA) patterns in the North Pacific Ocean during each phase of the
Pacific Decadal Oscillation phase (PDO). As with ENSO, a positive PDO correlates well with above average winter precipitation
in the southwest United States.The opposite is true for the negative phases of the PDO and ENSO.
PDO Jul, Aug, Sep t 2021
PDO Jul, Aug, Sept2017 (Analog
Year)
-1.87, -1.12, -1.53 -0.68, -0.18, -0.68

AlbuquerqueWEATHER FORECAST OFFICE
2021-22 Winter OutlookWhy SSTs in the Eastern Pacific Ocean Are So Important WRT to Climate
Figures 14-15. Warmer SSTs support deep tropical and subtropical convection farther east than average. This deep convection draws the jet
stream farther south into the far eastern Pacific Ocean and southwestern United States during El Niño. The opposite is true during moderate to
strong La Niñas and the polar jet stream generally remains north of New Mexico.Weak La Niñas are sometimes wetter and cooler than average.
Typical Jet
Stream Pattern
during La Niña
Typical Jet
Stream Pattern
during El Niño
Typical Tropical
circulations
during La Niña
Typical Tropical
circulations
during El Niño

AlbuquerqueWEATHER FORECAST OFFICE
2021-22 Winter OutlookPositive Pacific-North American Teleconnection Pattern (PNA)
Figures 16-17. December-February 500-hPa geopotential height anomalies regressed onto the monthly PNA index. Data shown for 1979-80 to
2018-19. Purple shading indicates below-average pressure and winds that flow counter-clockwise following the contours. Orange shading denotes
above-average pressure and winds that flow clockwise. In the positive state of the PNA, above-average pressure is found over the subtropical
Pacific (close to Hawaii) and centered over western Canada. Below-average pressure occurs over the North Pacific Ocean and along the
southeastern United States. If tropical convection sets up in right locations, this prolonged “preferred” atmospheric pattern is capable of resulting
in cold, clipper type- troughs from the north and northwest.
Polar Jet Stream
Sub-tropical Jet Stream

AlbuquerqueWEATHER FORECAST OFFICE
2021-22 Winter OutlookComparing Late Oct 2017 Global SSTAs to Late Oct 2021
Figures 18-19. SSTAs from the most recent “analog” year, 2017 and current conditions. Note the many similarities.
2020
20212017
AlbuquerqueWEATHER FORECAST OFFICE
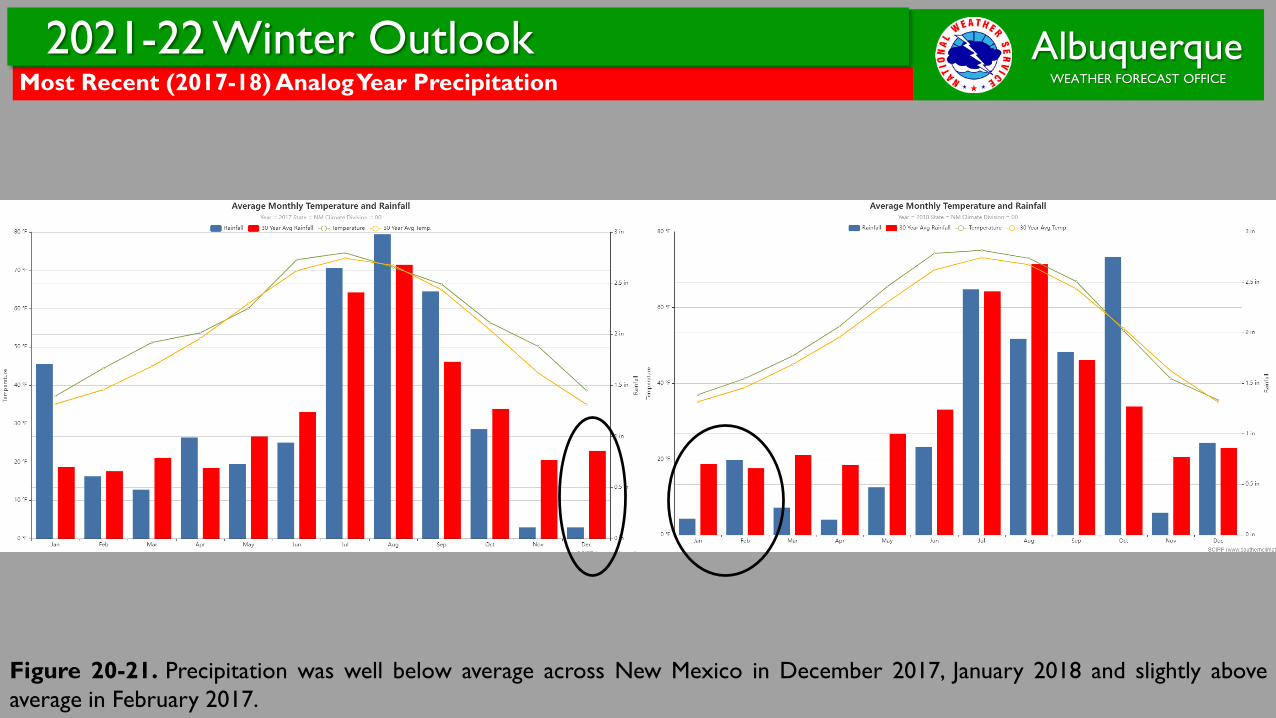
2021-22 Winter OutlookMost Recent (2017-18) Analog Year Precipitation
Figure 20-21. Precipitation was well below average across New Mexico in December 2017, January 2018 and slightly above
average in February 2017.

AlbuquerqueWEATHER FORECAST OFFICE
2021-22 Winter OutlookLatest SST Model Forecast
Figure 22. The following graph show forecasts made by dynamical and statistical models for SST in the Nino 3.4 region for nine
overlapping 3-month periods. Note that the expected skills of the models, based on historical performance, are not equal to one
another.The skills also generally decrease as the lead time increases.

AlbuquerqueWEATHER FORECAST OFFICE
2021-22 Winter OutlookClimate Prediction Center’s Official 2017-18 Winter Outlook
Figures 23-24. CPC’s DJF 2021-22 precipitation and temperature forecasts favoring below average precipitation and above
average temperatures for all of New Mexico.

AlbuquerqueWEATHER FORECAST OFFICE
2021-22 Winter OutlookNumerical Climate Prediction Model Precipitation – December 2021
Figures 25-30. Model precipitation rate anomaly plots from the three climate models which have the highest skill percentages for December 2021 (top),
the North American Multi-Model Ensemble (NMME), Global Environmental Multiscale (GEM_NEMO), and the Geophysical Fluid Dynamics Laboratory
(GFDL_SPEAR). Interestingly, forecasts range from average to slightly below average precipitation for January 2022 across New Mexico. Why is it
interesting? Generally speaking, a negative PDO in concert with a moderate La Niña in past winter seasons are the driest on record for NM.
Highest forecast skill
or “batting average” in
Dec is across
southern/southeast
NM.
White equates to average
precipitation, orange is
below and green is above.

AlbuquerqueWEATHER FORECAST OFFICE
2021-22 Winter OutlookNumerical Climate Prediction Model Precipitation – January 2022
Figures 31-36. Model precipitation rate anomaly plots from the three climate models which have the highest skill percentages in January 2022
(top), the North American Multi-Model Ensemble (NMME), Geophysical Fluid Dynamics Laboratory (GFDL_SPEAR). Interestingly once again,
forecasts range from average to slightly below average precipitation for January 2022 across New Mexico.
Highest forecast skill
or “batting average” in
Jan is across
southern/southeast
NM.
White equates to
average precipitation,
orange is below and
green is above.

AlbuquerqueWEATHER FORECAST OFFICE
2021-22 Winter OutlookNumerical Climate Prediction Model Precipitation – February 2022
Figures 37-42. Model precipitation rate anomaly plots from the three climate models which have the highest skill percentages in February 2022
(top), the North American Multi-Model Ensemble (NMME), Geophysical Fluid Dynamics Laboratory (GFDL_SPEAR) and Global Environmental
Multiscale (GEM_NEMO). Forecasts range from slightly below to well below average precipitation in February 2022 across New Mexico.
Highest forecast skill or
“batting average” in Feb is
across southern/southeast
NM.
White equates to average
precipitation, orange is below
and green is above.

AlbuquerqueWEATHER FORECAST OFFICE
2021-22 Winter OutlookNumerical Climate Prediction Model Temperatures for DJF
Figures 43-48. Two meter (6.5 feet above ground level) temperature anomaly forecasts from the three climate models which have the highest
forecast skill percentages for DJF, the North American Multi-Model Ensemble (NMME) and the Geophysical Fluid Dynamics Laboratory
(GFDL_SPEAR) and Global Environmental Multiscale (GEM_NEMO). All three models forecast slightly above to above average temperatures
during DJF 2021-22 for much of New Mexico.

AlbuquerqueWEATHER FORECAST OFFICE
2021-22 Winter OutlookWhat Did Climate Models Predict During the Last Double-Dip La Niña?
Figure 49. Climate model forecasts for DJF 2017-18 showing that the highest forecast skill models had a wet bias. While it’s
tough to compare apples to apples here due to several major climate model upgrades since 2017, it’s worth noting that the
climate models were simply too wet when it came to precipitation during the last double-dip La Niña.

AlbuquerqueWEATHER FORECAST OFFICE
2021-22 Winter Outlook
➢ Forecasts from the most highly skilled climate forecast models along with data from winter 2017-18 indicate that
precipitation in central and northern New Mexico during December, January and February (DJF) 2021-2022 will
most likely range from slightly below to well below 1991-2020 climatological averages. Greatest chances for near
average precipitation will be in December and January across the northern third of the state with the least
chances central and south.
➢ Forecasts from the most highly skilled climate models suggest that snowfall will range from slightly below to
below average for the northern third of NM to below to well below average central and south.
➢ Temperatures trends from the past 20 years combined with forecasts from the most highly skilled climate models
suggest temperatures will range from slightly above to above 1991-2020 climatological averages in DJF 2021-22.
Summary

AlbuquerqueWEATHER FORECAST OFFICE
2021-22 Winter Outlook
➢Outlook provided by National Weather Service Forecast Office
Albuquerque, NM.
➢ For further information contact Andrew Church:
[email protected] (505) 244-9150
Outlook Information