Embed Size (px)
Citation preview

1
2020 Report of the Auditor General of New Brunswick
Volume II & III
1

2
2020 Report of the Auditor GeneralVolume II
• NB Power Debt Challenges
• Update on Nursing Home Planning and Aging
Strategy
• Electronic Medical Records
• Auditor General’s Access to Vestcor Significantly
Limited
• Follow-up on Recommendations from Prior Years’
Performance Audit Chapters
Volume III
• Update on 31 March 2020 Financial Audit of the
Province

3
NB Power Debt Challenges
Volume II Chapter 3

4
Why Is This Important?
NB Power’s:
• debt is $4.9 billion as of 2020
– increased $2 billion since 2002;
• debt to equity is high compared to peers;
• planned major capital projects estimated to cost
$3 to $4 billion;
• debt is issued by the Province of New
Brunswick.
Volume II – Chapter 33.5, 3.12, 3.15, 3.18, 3.20

5
Key Findings:
NB Power:
• does not make debt reduction a top priority;
• is not achieving debt reduction as outlined in its 10 Year Plan;
• has reduced debt, on average, $20 million annually since the Point Lepreau refurbishment project was completed in 2013; and
• would need to reduce debt on average, $65 million per year to achieve 2027 target.
Volume II – Chapter 33.10, 3.54, Exhibit 3.17

6
Debt driven by large capital projects
$0.0
$1.0
$2.0
$3.0
$4.0
$5.0
$6.0
Deb
t L
evel
(in
bil
lio
ns)
Fiscal Year End
NB Power's Debt History 1970-2020
Debt
Point Lepreau$1.3 billion*
Belledune$1.0 billion*
Point Lepreau refurbishment$2.3 billion*
*Major drivers of NB Power’s debt history
Volume II – Chapter 33.11, 3.12, 3.14, Exhibit 3.1

7
Debt has reduced by $142M since 2013
2010 2011 2012 2013 2014 2015 2016 2017 2018 2019 2020
NB Power Debt $4.3 $4.5 $4.5 $5.1 $5.0 $4.9 $4.9 $4.9 $4.8 $4.9 $4.9
$4.0
$4.1
$4.2
$4.3
$4.4
$4.5
$4.6
$4.7
$4.8
$4.9
$5.0
$5.1
$5.2
To
tal
Deb
t (i
n b
illi
on
s)
Fiscal Year End
NB Power's Debt 2010-2020
Volume II – Chapter 33.14, 3.18, Exhibit 3.3

8
Future Capital Projects: at Least $4 Billion
Belledune$84 million*
Mactaquac$2.7 - $3.7 billion*
Coleson Cove$93 million*
*Estimated Future Capital Project CostVolume II – Chapter 3Exhibit 3.2
Advanced Metering Infrastructure (Smart Meters)$73 million*

9
Impact to all New Brunswickers
• Rating agencies signal:
– “NB Power is the Province’s largest contingent risk” –
S&P; and
– “leverage [debt to equity] remains very high in
relation to other provincial utilities” – DBRS.
• Significant concerns of sustainability exist, given:
– NB Power net income totaled $195 million less than
Provincial expectation over the last four years; and
– planned major capital projects.
Volume II – Chapter 33.20, 3.22, 3.23, 3.78

10
Regulatory Environment
• Challenging element exists in the regulatory
environment as the Electricity Act states NB
Power must:
– achieve a capital structure of at least 20% equity;
and
– maintain low, stable and predictable rates.
• All peer utilities reviewed have corporate debt
to equity targets; however, only NB has a
legislated debt to equity target.
Volume II – Chapter 33.29, 3.35, 3.89

11
Debt to Equity Ratio – Peer Utility Comparison
Volume II – Chapter 33.42, 3.43, 3.47, 3.49, 3.51, Exhibit 3.5 [Modified]
12
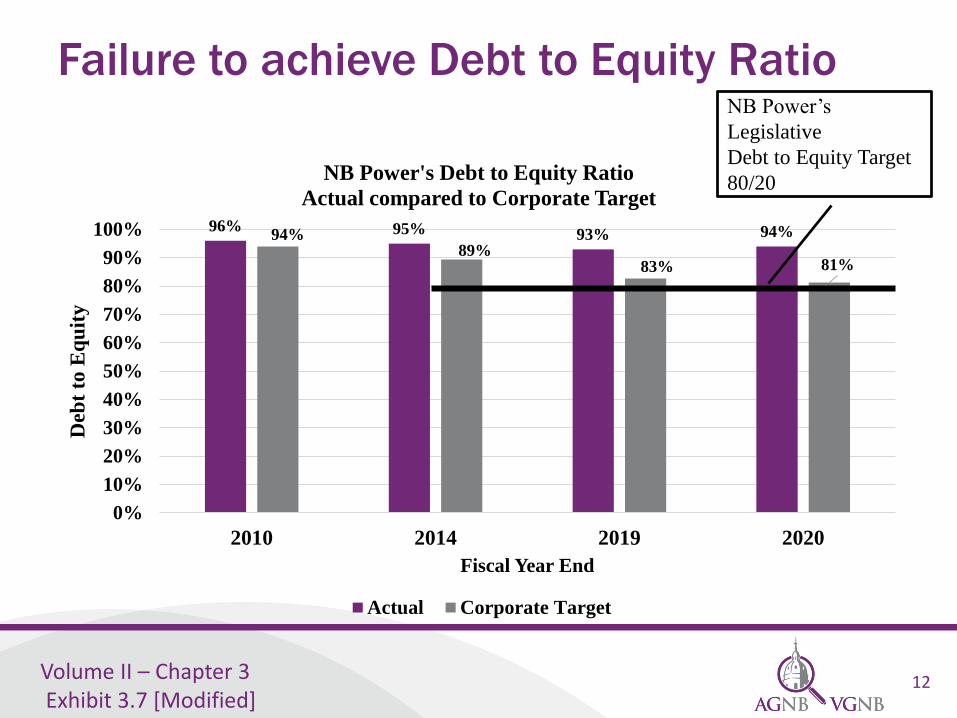
Failure to achieve Debt to Equity Ratio
Volume II – Chapter 3Exhibit 3.7 [Modified]
96% 95% 93% 94%94%89%
83% 81%
0%
10%
20%
30%
40%
50%
60%
70%
80%
90%
100%
2010 2014 2019 2020
Deb
t to
Eq
uit
y
Fiscal Year End
NB Power's Debt to Equity Ratio
Actual compared to Corporate Target
Actual Corporate Target
NB Power’s
Legislative
Debt to Equity Target
80/20

13
Interest Coverage Ratio (10 year average) –
Worst compared to peers in Canada
Volume II – Chapter 33.60, 3.61, Exhibit 3.10 [Modified]
• Inability to cover interest
showcases Crown
Corporation’s increasing
financial struggles.
• NB Power has the worst
interest coverage ratio
compared to other peer
utilities in Canada – based
on 10-year averages0
.74
1.8
4
1.3
8
1.0
2
1.4
3
2.5
6 2.8
1
Inte
rest
Cover
ag
e R
ati
o
Canadian Peer Utilities
Interest Coverage Ratio
Operating Earnings/Interest
Paid
10 Year Average

14
Province is ultimately responsible for NB
Power Debt
Volume II – Chapter 3Exhibit 3.11
• Province issues all NB Power debt
• NB Power is benefiting from the Province’s
better credit ratings
• Debt to equity and interest coverage ratios could
be worse if NB Power were to issue debt
independently

15
NB Power’s 10 Year Plan
• Intended to allow New Brunswick Energy and Utilities Board to assess NB Power’s ability to achieve long term legislated goals;
• Key assumptions vary significantly year to year and are largely outside the control of NB Power
• We found the financial forecasts are not accurate, based on comparison between forecast and actuals
Volume II – Chapter 33.72, 3.73, 3.74, 3.76, 3.83

16
Inability to accurately forecast net earnings
94
151 162
142
27 23 20
-16
(40)
(20)
-
20
40
60
80
100
120
140
160
180
2017
Base Year
2018
Year 2
2019
Year 3
2020
Year 4
Net
In
com
e (i
n m
illi
on
s)
Fiscal Year End
10 Year Plan 2017-26
Net Income Forecasted vs Actuals
Forecasted Actuals
$67m$128m $142m $158m
Volume II – Chapter 33.76, 3.77, Exhibit 3.15
• NB Power’s inability to accurately forecast its net earnings impacts the Province’s financial position and all New Brunswickers.
• In the last 4 years, NB Power underperformed compared to expectations by $195 million

17
Inaccurate Forecasting Leads to Lack of
Debt Reduction
• In general, they have been able to forecast revenues with reasonable
accuracy; however:
• NB Power’s largest expenditure and most significant variance from
forecast to actual is fuel and purchased power (avg. $87m)
• Actuals reported in 2020 were 154% higher than the forecast in 10
Year plan 2017-2026.
Ultimate impact: inability to achieve the legislated capital
structure of at least 20% equity
Volume II – Chapter 33.79, 3.85

18
Debt Reduction Not a Top Priority
2021
2024
2025
2029
2027
2016
2018
2020
2022
2024
2026
2028
2030
2017 - 2026 2018 - 2027 2019 - 2028 2020 - 2029 2021 - 2030Deb
t to
Eq
uit
y R
ati
o T
arg
et D
ate
10 Year Plans
NB Power's 10 Year Plans Moving Target Date
of when 80% Debt to Equity Ratio will be met
Target Date
Volume II – Chapter 33.87, Exhibit 3.19

19
AGNB Recommendations
3.59 We recommend NB Power prioritize debt reduction by developing a firm and well-defined debt management plan to achieve the mandated debt to equity target by 2027. The plan should comprise:
– achievable annual key performance indicators (KPI) including a debt reduction amount and debt to equity ratio; and
– a requirement to report annually within NB Power’s annual report:• any deviation from the annual KPIs;
• reasons if KPIs are not met; and
• an adjusted action plan to reach 2027 target date.
3.84 We recommend NB Power, to improve its forecasting process, quantify the impact of uncertainties in the 10 Year Plan, such as fuel prices, hydro flow, Point Lepreau capacity factor, weather events, etc.
Volume II – Chapter 33.59, 3.84, Recommendations and Responses Table

20
Update on Nursing Home Planning and Aging Strategy Department of Social Development
Volume II Chapter 4

21
Why This Update?
• Our 2016 report noted the proportion of NB seniors aged 75 and older will double by 2036
• Failing to implement nursing home plans and obtain needed services for seniors will result in a crisis
– severe shortage of available placements
– growing pressure on hospitals and related costs
– inadequate care for growing number of vulnerable seniors
• This update is to inform New Brunswickers on progress on our 2016 recommendations and the status of nursing home capacity in the Province
Volume II – Chapter 4One page summary, 4.2, 4.3

22
Scope of Work
• Our work focused on the assessment of:
– the Department of Social Development’s plans and actions under the 2011-2016 Nursing Home Renovation and Replacement Plan and the 2018-2023 Nursing Home Plan
– the Department of Social Development’s development and implementation of the aging strategy in collaboration with other stakeholders
– the Department of Finance and Treasury Board’s financial analysis of nursing home delivery models
Volume II – Chapter 44.5, 4.6

23
Conclusions
• Significant delays in the implementation of two 5 year Nursing Home Plans with limited progress on the 2018-2023 plan
– Province is failing to address nursing home capacity demand
• Although a 10-year Aging Strategy has been developed it lacks an implementation plan
• Comparison of actual costs and quality of service needs to be done
• Insufficient public reporting on progress against the Aging Strategy and the Nursing Home Plans
Volume II – Chapter 44.8

24
Status of 2016 AGNB Recommendations
2016 Recommendations Department’s
2020 Status
AGNB 2020
StatusEvaluate whether there is an economic
benefit to providing nursing home beds
under the public-private model versus the
traditional model.
ImplementedNot
Implemented
Develop a comprehensive long term plan
to ensure the Province can continue to
provide sustainable services to New
Brunswick seniors.
ImplementedPartially
Implemented
Report publicly on the measures and
outcomes of current and future initiatives
as part of the comprehensive long term
plan.
ImplementedNot
Implemented
Volume II – Chapter 4Exhibit 4.1

25
4,778 Nursing Home Beds By Region-March 31,
2020
Volume II – Chapter 44.11, Exhibit 4.2 [Modified]

26
Nursing Home Waitlist Continues to Grow
540
773
371 365
0
100
200
300
400
500
600
700
800
900
Apr-12 Apr-13 Apr-14 Apr-15 Apr-16 Apr-17 Apr-18 Apr-19 Apr-20
Nu
mb
er
of
Ind
ivid
ual
s o
n W
aitl
ist
Month
Total Waiting List
Waiting inHospitalWaiting at Home
Waiting in SpecialCare HomeOther
July 2020
Numbers reported in 2016 chapter
Volume II – Chapter 44.14, Exhibit 4.6 [Modified]

27
Improvement in Nursing Home Facility
Condition Ratings between 2009 and 2016
0%
25%
50%
75%
100%
Faci
lity
Co
nd
itio
n R
atin
g
Nursing Homes
Rating
Facilities Assessed in 2009 Facilities Assessed in 2016
0%
25%
50%
75%
100%
Faci
lity
Co
nd
itio
n R
atin
g
Nursing Homes
Rating
Volume II – Chapter 44.19, 4.20, Exhibit 4.8, Exhibit 4.9

28
System failing to address nursing home
capacity demand – 2011 to 2016
Volume II – Chapter 44.24, 4.25, 4.26, Exhibit 4.10 [Modified]
Actual Progress Compared to 2011-2016 Nursing Home Renovation and Replacement Plan (as of November 2020)
Type of Bed Planned Actual
New nursing home beds
410 beds to be added 410 beds completed by 2020
Replacement nursing home beds
925 beds to be replaced
925 beds completed
New specialized/ memory care beds
704 beds to be added 428 beds completed276 beds not completed

29
System failing to address nursing home
capacity demand – 2018 to 2023
• 2018-2023 Nursing Home Plan behind in
adding new beds by at least 2 years
• According to Department, tendering delays
due to staff turnover and competing priorities
• It remains unclear how the Province plans to
address nursing home capacity demand
Volume II – Chapter 44.30, 4.31, 4.33

30
Miramichi Nursing Homes
• Significant delays and additional costs in relation to Miramichi nursing homes
• 10 years and $11 million spent on repairs and financial assistance
• Two homes replaced in Miramichi, with 28 additional beds
Source: Catholic Health Association of New Brunswick website
Source: Shannex website
Mount St Joseph
Losier Hall
Volume II – Chapter 44.27, 4.28, 4.29

31
2016 Recommendation to Evaluate
Economic Benefit of Nursing Home Models
• We recommended in our 2016 Report:
– the Department of Social Development evaluate whether
there is an economic benefit to providing nursing home
beds under the public-private model versus the traditional
model
• Department indicated this was implemented, referring
to a detailed review performed by Finance and
Treasury Board’s Alternative Service Delivery (ASD)
unit
Volume II – Chapter 44.36, 4.37

32
Finance Treasury Board (FTB) Analysis for
Miramichi Nursing Homes
• Financial analysis performed in support of
government’s decision to replace two
Miramichi nursing homes
• Analysis projected nursing home model
selected would be less costly
• Methodology and key assumptions and inputs
appeared reasonable, however, we found
inadequate documentation
Volume II – Chapter 44.39, 4.40, 4.41, 4.43

33
2016 Recommendation Not Implemented
• FTB financial analysis was an improvement in the
decision-making process for selecting a nursing
home service delivery model for the Miramichi
scenario
• However, the Department of Social Development
needs to compare actual costs and quality of service
to determine if the for-profit operated model
achieves more economic benefit than the traditional
model
Volume II – Chapter 44.39

34
2016 Recommendation to Develop Long-
Term Plan
• We recommended in our 2016 Report:
– the Department of Social Development, in consultation
with the Department of Health, develop a comprehensive
long-term plan to ensure the Province can continue to
provide sustainable services to New Brunswick seniors
• Department indicated this was
implemented, referring to the 10-
year Aging Strategy, released in
January 2017
Volume II – Chapter 44.47, 4.49, 4.51

35
Aging Strategy Framework
Source: We are all in this together: An
Aging Strategy for New Brunswick, January
2017, Department of Social Development
Volume II – Chapter 4Exhibit 4.14

36
Aging Strategy Findings
• Strategy is multi-faceted and has valuable ideas – Initiatives beyond simply increasing the number of beds in
nursing homes
• However, we also found:
– Lack of implementation plan
– Lack of measures to assess progress
• Example of action item: Improve the process for inspecting long-term care facilities
– Inadequate monitoring
– Inaccurate public reporting on strategy implementation
Volume II – Chapter 44.56, 4.58, 4.59, 4.62, 4.63

37
2016 Recommendation Partially
Implemented
• Without an implementation plan, specific objectives,
and performance targets, Department will not be able
to properly evaluate the Aging Strategy’s
implementation
• Department began establishing targets in August 2020
for projects under “Aging in Place” vision
– Projects link directly to or partially address Aging Strategy
action items
Volume II – Chapter 44.62, 4.72
38
2016 Recommendation on Public Reporting
• We recommended in our 2016 Report:
– the Department of Social Development report publicly on
the measures and outcomes of current and future initiatives
as part of the comprehensive long term plan
• We made this recommendation because we found the
Department did not publicly report on the outcomes
and overall implementation status of the three-year
Home First strategy
Volume II – Chapter 44.63, 4.64, 4.85

39
Inadequate Reporting on Aging Strategy and
Nursing Home Plan
• Department’s annual report contains only a
percentage of Aging Strategy action items
completed and fails to list the specific items
completed
– Information reported is insufficient for readers to
assess performance
• Lack of reporting on progress of 2018-2023
Nursing Home Plan
• Recommendation not implemented
Volume II – Chapter 44.80, 4.82, 4.85, 4.86

40
AGNB 2020 Recommendations
Areas of the recommendations include:
- 2018-2023 Nursing Home Plan needs to have well defined realistic targets and be properly resourced
- Aging Strategy needs performance indicators, specific targets, monitoring process and improved public reporting
- Restating 2016 recommendation to evaluate economic benefit of different nursing home models (for-profit operated versus not-for-profit)
- Should assess actual costs and quality of service
Volume II – Chapter 44.35, 4.45, 4.46, 4.73, 4.74, 4.88

41
Electronic Medical Records (EMR) ProgramDepartment of Health
Volume II Chapter 2

42
Why we did this audit
• Electronic Medical Records (EMR) provide strategic information to assist in the planning and design of an efficient and effective health system
• Failure of the EMR could negatively impact healthcare delivery for New Brunswickers
• The Province invested over $26 million to implement and operate the EMR program
Volume II – Chapter 22.4, 2.11, 2.12

43Volume II – Chapter 2Exhibit 2.1

44
New Brunswick has one of the lowest EMR
adoption rates as at 2017
Volume II – Chapter 22.100, Appendix III [Modified]
BC AB SK MB ON QC NB NS NL PEI
EMR Prog
Start
2006 2003 2009 2010 2009 2012 2012 2005 2014 -
Adoption Rate 91% 78% 70% 70% 75% 42% 34% 55% 9% -
# Approved
Vendors
10 2 2 3 13 10 1 3 4 -
EMR Program
Governance
Joint
(Gov/
Med
Assoc)
N/A Joint
(Gov/
Med
Assoc)
Gov Joint
(Gov/
Med
Assoc)
Gov Med
Assoc
Gov Joint
(Gov/
Med
Assoc)
-

45
Complex Delivery Structure
Volume II – Chapter 2Exhibit 2.3

46
Where Did the Money Go?Funding from Department of Health - $26.4 Million
.
Volume II – Chapter 2Exhibit 2.4 [Modified]; Exhibit 2.5 [Modified]
Accreon$8.9
Intrahealth$10.8
Other vendors$2.8
Other expenses$2.8
Direct Payment to Velante$1.1
Accreon IntrahealthOther vendors Other expensesDirect Payment to Velante
($ Millions)

47
Audit objective
• Determine if EMR program was
implemented as intented and achieved its
planned outcomes
• Determine if the Department monitored
EMR funding to mitigate risk to the
taxpayer and ensure compliance with
funding agreements
Volume II – Chapter 22.5

48
Conclusions:
• EMR program was not implemented as
intended and failed to achieve its planned
outcomes
• The Department did not effectively monitor
the EMR funding to mitigate risk to the
taxpayer and ensure compliance with funding
agreements
Volume II – Chapter 22.9

49
Conclusions (2):
• The Department, not the Medical Society,
appeared to bear all the risk
• The complex delivery structure weakened the
Department’s governance and oversight of the
program
• The Department proceeded with the selected
single-vendor EMR model knowing the
business model was flawed from the outset
Volume II – Chapter 22.9, 2.10

50
Single-Vendor Provincial EMR
Model Failed

51
After 8 years and over $26 million, less than half of
800 eligible physicians implemented the Provincial
EMR
149
372416 415 415
366
15
123
219257
294
366
0
100
200
300
400
500
600
700
800
2013 2014 2015 2016 2017 2018
Cumulative Enroled vs Implemented vs eligible physicians
Enroled Implemented Eligible
Volume II – Chapter 22.88, Exhibit 2.11

52
Provincial EMR business model was
unsustainable from the outset
• Known deficit in funding from the beginning
• Unfavourable pricing model for monthly user
fees
• Non-transferable licenses
• No stipulation for length of contract with
physicians
Volume II – Chapter 22.63, 2.101, 2.102

53
Lab integration a desired essential
component, was significantly delayed
• Integration work was neglected as efforts were
focused on meeting enrolment targets;
• It is not clear who was responsible for building
the technology needed for the information to
flow between the EMR and the systems it was
meant to integrate with.
Volume II – Chapter 22.83, 2.84

54
High initial cost of EMR was a deterrent to
Fee-for-Service (FFS) physician enrolment
• High upfront price of $16,000
• Department provided additional subsidy to
encourage uptake, reducing cost to $4,000 or
less for FFS physicians
• We found some FFS physicians were paid to
implement the EMR
Volume II – Chapter 22.95, 2.97, 2.102, Exhibit 2.13

55
Oversight failure by Department
and Weak Accountability

56
Department had a hands-off approach to
program funding
• No formal business case
• Department chose not to review financial
records of NBMS/Velante, or ensure
compliance with funding agreements
• No performance measures or progress report to
monitor program implementation required by
Department
• No EMR audit was conducted
Volume II – Chapter 22.37, 2.38

57
In 2015 the Department failed to intervene even
though there were clear signs of program failure
• Numerous implementation targets and funding
deadlines missed
• Private sector business partner (Accreon)
abandoned the partnership
• Velante solvency issues required NBMS to
give it a cash injection in excess of $980k
• Infoway expressed concerns about lack of
progress
• Lab integration was significantly delayed
Volume II – Chapter 22.45

58
Weak enforcement of the funding
agreements by the Department
• Agreement required the Department to be reimbursed by NBMS for implementations that did not meet deadline
• We found no reimbursement occurred as Department kept extending deadlines
• Department paid $2.8M of financial assistance without receiving a reconciliation of how it wasspent.
Volume II – Chapter 22.69, 2.71, 2.72, 2.73

59
AGNB Recommendations:
We made 7 recommendations to the Department of Health to:
• Maintain program oversight and hold funding recipients accountable
• Take timely corrective action when there are signs of program failure
• Develop measurable criteria to monitor program outcome
• Conduct regular audits on future programs
• Ensure responsibilities for data integration are clearly defined
• Ensure future funding agreements require withholding of final payment until all funding terms and timelines are met
Volume II – Chapter 22.41, 2.44, 2.46, Recommendations Table

60
Auditor General’s Access to Vestcor Significantly Limited
Volume II Chapter 5
60

61
Why Report on Access to Vestcor?
• Section 15 of the Auditor General Act requires
the Auditor General to report on whether or not
my office received all the information and
explanations required in the course of our
work.
Volume II – Chapter 55.1

62
Why Report on Access to Vestcor?
• Vestcor would not provide unrestricted access
to information needed for our financial audit of
the Province’s financial statements
• Vestcor would not participate in our work
which was performance audit in nature
Volume II – Chapter 55.1, 5.2, 5.3

63
Who Is Vestcor?
Vestcor:
• manages pension plan
assets; and
• administers pension
benefits for active and
retired members
for most NB government
employee pension plans.
Volume II – Chapter 5Exhibit 5.1, Appendix III
Manages VIEsPension plan assets
held here

64
$18 Billion in NB Public Sector Assets
Managed by Vestcor
Volume II – Chapter 5Exhibit 5.2
96%
PNB
65
Vestcor is Essentially a Public Entity
• Vestcor is, in substance, a public entity regardless of its legal form
• Unlike private investment firms:
– Was created by NB legislation
– Works only with public sector funds
– Essentially receives all its operating and capital funding from NB public sector funds
– 100% owned by two largest government employee pension plans and not likely to have to compete with other private firms
Volume II – Chapter 55.7

66
AG Act Grants Unrestricted Access to
Information Needed for Financial Audit
Authority Provided by Auditor General Act
Vestcor’s Response
Despite any other Act, the Auditor General Act grants authority to all information required for our audit of the Province’s financial statements.
Vestcor believes it is obligated to maintain confidentiality to clients whose assets are not included in the Province’s financial statements.
Volume II – Chapter 55.38, 5.42

67
AG Act Grants Authority to Conduct
Performance Audits at Vestcor
• Auditor General Act grants my office a “follow
the dollar” mandate
• Therefore, the mandate grants my office
authority to conduct performance audits at
Vestcor
• Vestcor and its owners disagree
Volume II – Chapter 55.22, 5.32

68
Vestcor Act May Have
Had Unintended Consequences
Volume II – Chapter 5Exhibit 5.4

69
2016 Vestcor Bill - Summary of AG’s Review
of Standing Committee Transcript
What Legislators were told: AGNB 2020 assessment:
Legislators provided inconsistent information
regarding AG access.AG access significantly limited.
Legislators told would have indirect oversight
of Vestcor.
Oversight may not be possible
through trustee members.
Legislators told Vestcor would grow to include
clients outside of New Brunswick.
Vestcor added two NB based clients
only.
Volume II – Chapter 5Exhibit 5.5 [Modified]

70
Potential Performance Audits of Vestcor
• How Vestcor evaluates its performance in its
annual reports
– Benchmarks, cost savings, value added and other
targets
• Reasonableness of operating and capital
expenses and employee incentives (bonuses)
Volume II – Chapter 55.72, 5.88, 5.80, 5.82

71
Example of a Potential Audit Area:
Employee Incentives (Bonus)
Volume II – Chapter 5Exhibit 5.9

72
AGNB Recommendations
Minister of Finance and Treasury Board
• Request a Section 12 performance audit of
Vestcor
• Propose Auditor General Act be amended to
list Vestcor (and all related entities) as
auditable entities
• Propose Vestcor Act be amended to require
Vestcor to file an annual report with the
Legislative Assembly and appear before PAC
Volume II – Chapter 55.10, 5.9, 5.12

73
AGNB Recommendations
Public Account Committee
• PAC include Vestcor as one of the entities who
regularly appear before PAC
• Review what NBIMC and DHR told
Legislators when Vestcor was created
Volume II – Chapter 55.13, 5.11

74
Follow-up on Recommendations from Prior Years’ Performance Audit Chapters
Volume II Chapter 6
74

75
Implementation of Recommendations
Volume II – Chapter 66.7, 6.15, 6.16
• Entities self-report they have implemented 81%
of our recommendations from performance
audits in 2015, 2016, 2017, & 2018.
• AGNB has the goal of 100% implementation
• It is important for PAC to continue meeting with
entities to encourage implementation and hold
them accountable

76
Heat Map –
Online ReportingHeat Map found at the following link:
https://www.agnb-vgnb.ca/content/agnb-
vgnb/en/publications/follow-up.html
Department and Project Name Report Release Date
2020 Status
Department Self-Reporting
Auditor General Follow-up
Agriculture, Aquaculture and Fisheries
- Agricultural Fair Associations2016
Natural Resources and Energy
Development - Private Wood Supply2015
Natural Resources and Energy
Development - Silviculture2015
Legend
100% of Recommendations Implemented
75% - 99% of Recommendations Implemented
50% - 74% of Recommendations Implemented
< 50% of Recommendations Implemented
Volume II – Chapter 6Exhibit 6.2

77
Silviculture (2015)
67% of recommendations were implemented from the 2015
chapter.
The Department has not implemented AGNB
recommendations to:
- Reduce clear-cut harvest area on Crown forest;
- Calculate and record the value of the Crown timber asset in the
annual report; or
- Adopt a more equitable sharing arrangement for silviculture
work
Volume II – Chapter 66.25, 6.28, 6.30, 6.33, 6.34, 6.38, 6.41, 6.45

78
Private Wood Supply (2015)
Volume II – Chapter 66.53, 6.60
74% of recommendations were implemented from
the 2015 chapter.
The Department has not yet implemented AGNB
recommendations to:
- Fulfil their responsibilities under the Crown Lands and
Forests Act related to the principles of proportionate
supply and sustained yield

79
Agricultural Fair Association (2016)
88% of recommendations were implemented from the
2016 chapter
Service New Brunswick has not implemented an
AGNB recommendation to:
- Develop and implement a standardized process and
procedures to evaluate eligibility of tax class 50
exemption requests (property tax exemption under
section 4 and 7 of the Assessment Act)
Volume II – Chapter 66.76, 6.79, 6.81, 6.82

80
2020 Report of the Auditor General of New Brunswick
Volume III – Financial Audit

81
Province’s Third Consecutive Surplus
Volume III - Chapter 2
2.1, Exhibit 2.1 (Modified)
(750)
(650)
(550)
(450)
(350)
(250)
(150)
(50)
50
150
250
2011 2012 2013 2014 2015 2016 2017 2018 2019 2020
($ m
illi
on
s)
Fiscal Year
49

82
Net Debt has Increased $4.3B over 10 Years
Volume III - Chapter 3
Exhibit 3.2 (Modified)
• 2020 was the first time Net Debt has decreased
year-over-year since 2007.

83
Short-term Net Debt-to-GDP ratio trending
favourably
31.7 32.034.6
36.7
40.3 40.9 40.238.8
37.836.6
20
30
40
50
2011 2012 2013 2014 2015 2016 2017 2018 2019 2020
Perc
en
t
Fiscal Year
Volume III – Chapter 3Exhibit 3.4

84
However, Net Debt-to-GDP ratio higher than
most other provinces with similar population
size
-
5
10
15
20
25
30
35
40
45
50
2011 2015 2020
Perc
en
tag
e
Fiscal Year
New Brunswick
Manitoba*
Newfoundland &Labrador**
Nova Scotia
Saskatchewan
Volume III – Chapter 3Exhibit 3.5
85
Net Debt Reduction Targets Set
We were pleased to see government set multi-year Net
Debt and Net Debt-to-GDP reduction targets for the
next four years.
– Targets were set prior to COVID-19 pandemic and have not
been updated to include any related impacts.
Volume III – Chapter 33.20, 3.21

86
Covid-19 Global Pandemic Financial Relief
Program SummaryMarch 11, 2020 – September 30, 2020
• Government spent:
– $63.8 million on financial relief programs, of
which $21.2 million were in loans
– $128.7 million on incremental government
spending in Departments and Crown Corporations
and Agencies
• Government received:
– $10.3 million from the Federal Government
Volume III – Chapter 7Exhibit 7.2

87
Volume III - Chapter 8
Exhibit 8.1 [Modified]
Possible Health Risk of Radon Contamination in Public Housing Units
Remediated Units
94
Contaminated Units Identified
190
No Contamination Found
587
Untested Units3,645
Status of Radon Testing in Public Housing Units (at November 28, 2019)
Total units:4,516
80%
Total Units Tested:
871

88
Property Assessments: Weaknesses Still Exist
• SNB assesses approximately 470,000
properties each year.
• Generates over $530 million in revenue and $1
billion in receivable for the Province
• 6 recommendations were made as part of 2020
work performed.
Volume III - Chapter 9

89
Questions?