Embed Size (px)
Citation preview

Printed by Authority of the Legislature Fredericton, N.B.
Public Accountsfor the fiscal year ended31 March 2010
Financial Statements
Volume 1


Printed by Authority of the Legislature Fredericton, N.B.
Public Accountsfor the fiscal year ended31 March 2010
Financial Statements
Volume 1


2010 PROVINCE OF NEW BRUNSWICK iii
TABLE OF CONTENTS
Audited Financial Statements
Introduction to Volume I 1
Statement of Responsibility 2
Results for the Year 3
Major Variance Analysis 7
Indicators of Financial Health 13
Auditor's Report 20
Statement of Financial Position 21
Statement of Operations 22
Statement of Cash Flow 23
Statement of Change in Net Debt 24
Statement of Change in Accumulated Deficit 24
Notes to the Financial Statements 25
Schedules to the Financial Statements 58


2010 PROVINCE OF NEW BRUNSWICK 1
INTRODUCTION VOLUME I
The Public Accounts of the Province of New Brunswick are presented in two volumes. This volume contains the audited financial statements of the Provincial Reporting Entity as described in note 1 to the financial statements. They include a Statement of Financial Position, a Statement of Operations, a Statement of Cash Flow, a Statement of Change in Net Debt and a Statement of Change in Accumulated Deficit. This volume also contains the Auditor’s Report, Statement of Responsibility, management’s comments on the results of the year, major variance analysis and a discussion of the Indicators of Financial Health of the Province. Volume II contains unaudited supplementary information to the Financial Statements presented in Volume I. It presents summary statements for revenue and expenditure as well as five-year comparative statements. This volume also contains detailed information on Supplementary Appropriations, Funded Debt, statements of the General Sinking Fund, Securities Held, and revenue and expenditure by government department. In addition, the Government includes the following lists on the Office of the Comptroller web site at http://www.gnb.ca/0087 :
• Salary information of government employees and employees of certain government organizations in excess of $60,000. Salary information is for the calendar year and is reported under the department where the employee worked at 31 December;
• Travel and other employee expenses in excess of $12,000 paid during the year to government employees, separated by department;
• Payments made to suppliers during the year in excess of $25,000 separated by department as well as a global listing including payments made by all departments;
• Loans disbursed to recipients during the year in excess of $25,000 separated by department.


2010 PROVINCE OF NEW BRUNSWICK 3
RESULTS FOR THE YEAR General Comments The Province's summary financial statements, contained in this volume of Public Accounts, report a deficit for the fiscal year ended 31 March 2010 of $737.9 million. This represents a decrease of $3.0 million from the budgeted deficit of $740.9 million. The difference is the result of lower than budgeted revenues of $107.4 million, offset by lower than budgeted expenses of $110.4 million. Revenues were lower than budget primarily as a result of a net loss of $212.2 million for the New Brunswick Electric Finance Corporation (NBEFC) which was $151.2 million larger than budgeted. This was primarily due to a write-down of the Dalhousie Generating Station as a result of NB Power’s decision to shut down and decommission the generating station. Expenses were lower than budget largely as a result of pension expense which improved because of higher than budgeted investment returns in 2009-2010. This improvement was partially offset by higher than budgeted costs in delivering health and senior care programs. There are several other variances discussed in more detail in the major variance section that follows. Summary Financial Information
Financial Assets $ 1,821.2 $ 1,926.8 Liabilities (10,174.2) (9,314.6) Net Debt (8,353.0) (7,387.8) Tangible Capital Assets net of Deferred Contributions 5,745.1 5,541.8
Other Non Financial Assets 166.0 137.1 Total Non Financial Assets 5,911.1 5,678.9 Accumulated Deficit $ (2,441.9) $ (1,708.9)
Revenue – Provincial Own Sources $ 4,089.3 $ 4,386.3 Revenue – Federal Sources 2,900.6 2,726.5 Total Revenue 6,989.9 7,112.8 Expenses 7,727.8 7,305.1 Surplus / (Deficit) $ (737.9) $ (192.3)
Opening Net Debt $ (7,387.8) $ (6,942.9)(Increase) Decrease in Net Debt From Operations (965.2) (438.6)
Accounting change --- (6.3) Total Change in Net Debt (965.2) (444.9) Ending Net Debt $ (8,353.0) $ (7,387.8)
(millions)Statement of Financial Position
2010 2009
2010 2009
Statement of Operations
Statement of Change in Net Debt
2010 2009

4 PROVINCE OF NEW BRUNSWICK 2010
Revenue Revenues of the Province for the past seven years, as restated, are shown in the table below.
Provincial Sources $ 3,527.9 $ 3,623.9 $ 3,925.1 $ 4,156.3 $ 4,387.3 $ 4,386.3 $ 4,089.3 Federal Sources $ 1,917.9 $ 2,354.8 $ 2,392.9 $ 2,487.4 $ 2,577.6 $ 2,726.5 $ 2,900.6 Total Revenue $ 5,445.8 $ 5,978.7 $ 6,318.0 $ 6,643.7 $ 6,964.9 $ 7,112.8 $ 6,989.9
(millions)20102004 20092008200720062005
Average annual revenue growth over the seven-year period is 4.3%. This exceeds the historical average revenue growth rate of 3.3% over the past 20 years. In contrast, the average annual revenue growth was 6.4% for the 2004 to 2008 period. Among the contributing factors to revenue growth during this period were a relatively strong domestic economy and increased federal transfer payments. However, revenue growth has been constrained for 2009-2010 due to the slowdown of the world economy, the government’s plan for lower taxes and the net loss for NBEFC. In 2009-2010, revenue decreased by $122.9 million year-over-year, a 1.7% decrease. The major factor was the net loss of $212.2 million for NBEFC. This resulted in a $246.6 million decline for NBEFC from the previous fiscal year, mainly due to a write-down of the Dalhousie Generating Station as a result of NB Power’s decision to shut down and decommission the generating station. NBEFC is a Crown Corporation formed to assume New Brunswick Power's existing debt, to capitalize the new companies with debt and equity to enable them to become financially independent of Government, and to receive interest, dividend and special payments (in lieu of taxes) to enable it to service and repay the debt it has assumed. Expense Expenses of the Province for the past seven years, as restated, are shown in the table below.
Total Expense $ 5,627.7 $ 5,742.8 $ 6,082.9 $ 6,407.3 $ 6,868.2 $ 7,305.1 $ 7,727.8
(millions)20102005 2006 2007 2008 20092004
Average annual expense growth over the seven-year period is 5.4%. Among the factors contributing to expense growth during the period were increases in the demand for services and the provision of new services to the public. The Province also experienced cost increases for various goods and services, including wages, fuel, prescription drugs, energy, materials and supplies. During this period additional federal funding, including a number of one-time funds and trusts, enabled the Province to make additional investments in healthcare, municipal infrastructure and various other initiatives. In 2009-2010, expenses increased by $422.7 million year-over-year, a 5.8% increase. The increase in expenses over 2008-2009 reflects additional investments made in health and senior care, post-secondary education and economic development programs.

2010 PROVINCE OF NEW BRUNSWICK 5
Surplus / (Deficit) Surpluses (or Deficits) of the Province for the past seven years, as restated, are shown in the table below.
Surplus/(Deficit) $ (181.9) $ 235.9 $ 235.1 $ 236.4 $ 96.7 $ (192.3) $ (737.9)
(millions)201020092004 2005 20072006 2008
The deficit for the year ended 31 March 2010 was $737.9 million. Until the previous year, the Province had achieved surpluses annually since 2004-2005. The deficit in 2010 was slightly lower than the budgeted deficit of $740.9 million. The economic slowdown, the net loss for NBEFC, continued cost pressures on social programs and the government strategy to provide economic stimulus and lower taxes contributed to the deficit. Net Debt Net debt increased by $965.2 million during the year ended 31 March 2010. The economic slowdown, results for NBEFC, continued cost pressures on social programs and the government strategy to provide economic stimulus and lower taxes contributed to the increase in net debt. The following graph illustrates the net debt position as restated at the end of each of the past seven years.
Net Debt
$6,000.0
$6,400.0
$6,800.0
$7,200.0
$7,600.0
$8,000.0
$8,400.0
2004 2005 2006 2007 2008 2009 2010
Year
Mill
ion
s
Net Debt $ 6,963.0 $ 6,824.3 $ 6,709.8 $ 6,575.9 $ 6,949.2 $ 7,387.8 $ 8,353.0
(millions)20102004 2005 2006 2007 2008 2009
The increase in net debt over this seven year period has been $1,390.0 million.

6 PROVINCE OF NEW BRUNSWICK 2010
Cost of Servicing the Public Debt The Province’s cost of servicing the Public Debt totaled $616.6 million for the year ended 31 March 2010. This marks an increase of $14.1 million from the 2008-2009 cost. Costs have risen due in part to increased borrowing incurred as a result of the economic downturn, which was partially offset by the appreciation of the Canadian dollar.
Cost of Servicing the Public Debt
$530.0
$550.0
$570.0
$590.0
$610.0
$630.0
$650.0
2004 2005 2006 2007 2008 2009 2010
Year
Mill
ion
s
Cost of Servicing the Public Debt
$ 582.9 $ 580.9 $ 591.4 $ 559.4 $ 576.9 $ 602.5 $ 616.6
2010(millions)
2008 20092004 2005 2006 2007
Results According to the Fiscal Responsibility and Balanced Budget Act The Act’s stated objective is for balanced budgets over designated fiscal periods. The current fiscal period commenced 1 April 2007 and will end on 31 March 2011. During the year, the government incurred a $817.2 million deficit for Balanced Budget purposes. In its 2009-2010 Budget, the government indicated that given the global economic and financial climate, objectives of the Act for the current four-year period would not be met. This was reiterated in the 2010-2011 Budget.
Surplus / (Deficit) According to Fiscal Responsibility and Balanced Budget Act
(millions) 2008 2009 2010 Cumulative Surplus / (Deficit) - FRBBA $ 86.7 $ (192.3) $ (817.2) $ (922.8)

2010 PROVINCE OF NEW BRUNSWICK 7
MAJOR VARIANCE ANALYSIS Explanations of major variances are described below, first for revenue, followed by expenses. In this analysis, comparisons are made between the actual results for 2009-2010 and either the 2009-2010 budget or actual results for 2008-2009. REVENUE Budget 2010 to Actual 2010 Comparison
2010 Budget to Actual ($ millions)
Item Budget Actual Change % Change Provincial Sources Taxes 3,162.0 3,243.9 81.9 2.6 Licenses and Permits 123.3 129.0 5.7 4.6 Royalties 73.1 39.6 (33.5) (45.8) Investment Income 265.5 106.6 (158.9) (59.8) Other Provincial Revenue 352.0 353.8 1.8 0.5 Sinking Fund Earnings 234.1 216.4 (17.7) (7.6) Federal Sources Fiscal Equalization 1,689.0 1,689.4 0.4 0.0 Unconditional Grants 806.6 803.4 (3.2) (0.4) Conditional Grants 391.7 407.8 16.1 4.1
Taxes Taxes are up $81.9 million over budget, primarily due to:
• Personal Income Tax is up $71.5 million due to an underpayment for the 2008 taxation year that also contributed to higher revenue for 2009 and 2010;
• Corporate Income Tax is up $28.7 million primarily due to an underpayment for the 2008 taxation year and a change to the province’s payment schedule from the federal government;
• Metallic Minerals Tax is up $13.5 million due to an increase in world zinc prices and audit of prior years;
• The Tobacco Tax increased by $12.6 million mainly due to higher volumes and a previous year tax settlement;
• Large Corporation Capital Tax is up $9.2 million due to revenue received for prior-year adjustments;
• Provincial Real Property Tax is up $7.9 million due to growth in assessment base; • Harmonized Sales Tax is down $66.5 million mainly due to lower in-year payments due to the
weakened national economy.
Royalties Revenue for royalties is down $33.5 million from budget. Royalties from mines are down $28.2 million due to low commodity prices for potash and natural gas. Forest royalties are down $5.3 million due to low harvest levels. Investment Income Investment Income is down $158.9 million from budget mainly due to NBEFC. NBEFC’s net loss was $151.2 million larger than budgeted primarily due to a write-down of the Dalhousie Generating Station as a result of NB Power’s decision to shut down and decommission the generating station.

8 PROVINCE OF NEW BRUNSWICK 2010
Sinking Fund Earnings Sinking Fund Earnings are down $17.7 million from budget due to the significant appreciation of the Canadian dollar as well as a decrease in interest rates. Conditional Grants Conditional Grants are up $16.1 million from budget mainly due to federal stimulus funding. Actual 2009 to Actual 2010 Comparison
2009 Actual to 2010 Actual ($ millions)
Item 2009 Actual
2010 Actual
Change
% Change
Provincial Sources Taxes 3,252.8 3,243.9 (8.9) (0.3) Licenses and Permits 116.6 129.0 12.4 10.6 Royalties 79.5 39.6 (39.9) (50.2) Investment Income 357.3 106.6 (250.7) (70.2) Other Provincial Revenue 346.7 353.8 7.1 2.0 Sinking Fund Earnings 233.4 216.4 (17.0) (7.3) Federal Sources Fiscal Equalization Payments 1,583.8 1,689.4 105.6 6.7 Unconditional Grants 766.3 803.4 37.1 4.8 Conditional Grants 376.4 407.8 31.4 8.3
Taxes Taxes are down $8.9 million over the previous year, mainly due to:
• Harmonized Sales Tax is down $128.3 million mainly due to an extraordinary positive prior-year adjustment in 2008-2009 and lower in-year payments due to the weakened national economy;
• Corporate Income Tax is up $88.9 million due to an extraordinary negative prior-year adjustment that adversely affected revenues in 2008-2009;
• Provincial Real Property Tax is up $26.6 million due to an increase in the assessment base; • Metallic Minerals Tax is up $27.8 million due to an increase in world zinc prices compared to the
previous year and audit of prior years; • Personal Income Tax is down $27.5 million mainly due to the measures introduced in The Plan for
Lower Taxes in NB. Licenses and Permits Licenses and Permits are up $12.4 million from the previous fiscal year mainly due to Motor Vehicle fees up $9.2 million due to fee and volume increases and increased revenue of $2.5 million due to the issuance of exploration rights for oil and natural gas. Royalties Revenue for royalties is down $39.9 million from the previous fiscal year. Royalties from mines are down $28.3 million mainly due to low commodity prices for potash and natural gas. Forest royalties are down $11.6 million due to low harvest levels and reduced royalty rates.
Investment Income Investment Income is down $250.7 million from the previous fiscal year which is mainly attributable to NBEFC. NBEFC recorded a significant net loss in 2009-2010 rather than the positive net income it reported in 2008-2009. A write-down of the Dalhousie Generating Station as a result of NB Power’s decision to shut

2010 PROVINCE OF NEW BRUNSWICK 9
down and decommission the generating station had a significant negative impact on fiscal results in 2009-2010. Sinking Fund Earnings Sinking Fund Earnings are down $17.0 million from the previous fiscal year due to the significant appreciation of the Canadian dollar as well as a decrease in interest rates.
Fiscal Equalization Payments Fiscal Equalization Payments are up $105.6 million due to widening fiscal disparities in the new federal model. Unconditional Grants Unconditional grants are up $37.1 million mainly due legislated funding increases for both the Canada Health Transfer and Canada Social Transfer. Conditional Grants Conditional Grants are up $31.4 million from the previous year due to federal stimulus funding. EXPENSES Budget 2010 to Actual 2010 Comparison
2010 Budget to Actual ($ millions)
Item Budget Actual Change % Change Education and Training 1,728.5 1,621.7 (106.8) (6.2) Health 2,524.0 2,585.0 61.0 2.4 Social Development 951.4 973.4 22.0 2.3 Protection Services 201.7 209.4 7.7 3.8 Economic Development 328.9 344.6 15.7 4.8 Labour and Employment 126.5 141.5 15.0 11.8 Resources 183.2 183.6 0.4 0.2 Transportation 398.3 400.5 2.2 0.6 Central Government 765.3 651.5 (113.8) (14.9) Service of the Public Debt 630.4 616.6 (13.8) (2.2)
Items in the table are reported by functional area. See the related schedule for additional details.
Education and Training Education and Training expenses were $106.8 million lower than budget mainly due to the following:
• A decrease in pension expense of $76.5 million primarily as a result of higher than budgeted investment returns; and
• A decrease in expenses under the Student Financial Assistance Program primarily due to lower than budgeted interest costs and lower take-up in student debt reduction programs.
Health Health expenses were $61.0 million higher than budget mainly due to additional costs under the Medicare Program and costs associated with the H1N1 vaccine and immunization program. Social Development Social Development expenses were $22.0 million higher than budget mainly due to the following:

10 PROVINCE OF NEW BRUNSWICK 2010
• Increased expenses in the Long Term Care Program as a result of an increase in the demand for services and additional nursing home operating costs;
• Increased expenses in the Income Security Program as a result of an increase in the Social Assistance caseload; and
• Increased expenses in the Housing Program as a result of additional federal funding. Protection Services Protection Services expenses were $7.7 million higher than budget mainly due to the following:
• Increased expenses under Public Safety’s Disaster Financial Assistance program as a result of costs associated with the spring flood of 2009 and increased expenses under the Correctional Services Program as a result of increased inmate populations in adult correctional facilities; and
• Increased expenses under Justice’s Court Services Program as a result of additional salary payments to Provincial Court judges following a Court of Appeal decision.
Economic Development Economic Development expenses were $15.7 million higher than budget mainly due to an increase in Business New Brunswick’s provision for loss expense partially offset by lower than budgeted expenses under the Strategic Assistance Program and under a number of the Regional Development Corporation’s federal-provincial programs. Labour and Employment Labour and Employment expenses were $15.0 million higher than budget mainly due to additional federal funding under labour market agreements. Transportation Transportation expenses were $2.2 million higher than budget mainly due to an increase in amortization expense. Central Government Central Government expenses were $113.8 million lower than budget mainly due a decrease in pension expense of $98.5 million primarily as a result of higher than budgeted investment returns and a decrease in expense under the Benefit Accruals, Subsidies and Supplementary Allowances Program. The decrease was partially offset by higher than budgeted provision for loss expense. Service of the Public Debt Service of the Public Debt expenses were $13.8 million lower than budget mainly due to the strengthening of the Canadian dollar. Actual 2009 to Actual 2010 Comparison
2009 Actual to 2010 Actual ($ millions)
Item 2009 Actual 2010 Actual Change % Change Education and Training 1,452.0 1,621.7 169.7 11.7 Health 2,445.7 2,585.0 139.3 5.7 Social Development 941.6 973.4 31.8 3.4 Protection Services 223.8 209.4 (14.4) (6.4) Economic Development 287.9 344.6 56.7 19.7 Labour and Employment 124.4 141.5 17.1 13.7 Resources 177.4 183.6 6.2 3.5 Transportation 399.8 400.5 0.7 0.2

2010 PROVINCE OF NEW BRUNSWICK 11
2009 Actual to 2010 Actual ($ millions)
Item 2009 Actual 2010 Actual Change % Change Central Government 650.0 651.5 1.5 0.2 Service of the Public Debt 602.5 616.6 14.1 2.3
Items in the table are reported by functional area. See the related schedule for additional details.
Education and Training Education and Training expenses were $169.7 million higher than the previous fiscal year mainly due to the following:
• An additional grant of $110.0 million was made to universities in 2007-2008 which resulted in an offsetting decrease in the 2008-2009 grant to universities;
• Additional investments in universities under the University Infrastructure Trust Fund and the Deferred Maintenance Program; and
• Additional investments in K-12 education. Health Health expenses were $139.3 million higher than the previous fiscal year mainly due to increased expenses in the Medicare and Prescription Drug programs, costs associated with the H1N1 vaccine and immunization program and increased expenses in the Regional Health Authorities for wages, energy costs, medical supplies and drugs. Social Development Social Development expenses were $31.8 million higher than the previous fiscal year mainly due to the following:
• Increased expenses in the Long Term Care Program as a result of an increase in the demand for services and additional nursing home operating costs;
• Increased expenses in the Income Security Program as a result of an increase in the Social Assistance caseload; and
• Increased expenses in the Housing Program as a result of additional federal funding. Protection Services Protection Services expenses were $14.4 million lower than the previous fiscal year mainly due to a reduction in expenses under Public Safety’s Disaster Financial Assistance Program as a result of costs associated with 2008 flooding partially offset by increased expenses under Justice’s Court Services Program due to additional salary payments to Provincial Court judges following a Court of Appeal decision. Economic Development Economic Development expenses were $56.7 million higher than the previous fiscal year mainly due to increased spending under the Regional Development Corporation’s Northern New Brunswick Infrastructure and Special Initiatives programs and increased investments under a number of federal-provincial programs. This was partially offset by a decrease in Business New Brunswick’s provision for loss expense. Labour and Employment Labour and Employment expenses were $17.1 million higher than the previous fiscal year mainly due to additional federal funding under labour market agreements. Resources Resources expenses were $6.2 million higher than the previous fiscal year mainly due to increased investments under Natural Resource’s Silviculture Program.

12 PROVINCE OF NEW BRUNSWICK 2010
Central Government Central Government expenses were $1.5 million higher than the previous fiscal year mainly due an increase in provision for loss expense and an increase in expenses under a number of Supply and Services programs. This was partially offset by a decrease in pension expense along with a decrease in expense under the Benefit Accruals, Subsidies and Supplementary Allowances Program. Service of the Public Debt Service of the Public Debt expenses were $14.1 million higher than the previous fiscal year primarily due to increased borrowings, which were partially offset by the strengthening Canadian dollar.

2010 PROVINCE OF NEW BRUNSWICK 13
INDICATORS OF FINANCIAL HEALTH This section provides indicators of progress in the province’s financial condition and follows Canadian Institute of Chartered Accountants (CICA) guidelines, using information provided in the province’s financial statements as well as other standard socio-economic indicators such as nominal Gross Domestic Product (GDP) data from Statistics Canada. The analysis provides results in a manner that improves transparency and provides a clearer understanding of recent trends in the province’s financial health. Trends over the last seven years (2003-2004 to 2009-2010) are evaluated using sustainability, flexibility and vulnerability criteria established by the CICA and used by the Auditor General of New Brunswick. Though many potential indicators are available, those found to be the most relevant, measurable and transparent to users of government financial information are included. Similar data series are also widely used by banks and other financial institutions, investors and credit-rating agencies. The Fiscal Responsibility and Balanced Budget Act also contains measures to enhance fiscal transparency and accountability. The Act’s stated objective is for balanced budgets over designated fiscal periods and a decrease in the net debt-to-GDP ratio over successive fiscal periods. In its 2009-2010 and 2010-2011 Budgets, the government indicated that given the global economic and financial climate, objectives of the Act for the current four-year period (2007-2008 to 2010-2011) would not be met. A number of provinces have suspended or amended their balanced budget and debt reduction legislation as a result of the global economic slowdown. In evaluating a government’s financial health, it should be acknowledged that governments have exposure to a number of variables that are beyond their direct scope of control, but still can exert major influences on financial results and indicators. These include but are not limited to:
• Changing global economic conditions such as energy prices, commodity prices, investment valuation and inflation;
• Changes to international financial conditions that impact interest rates, currency fluctuations or availability of credit;
• Changes to federal transfers or programs; • Emergencies such as floods, forest fires and pandemics; • Developments affecting agencies such as NB Power that are reflected on the province’s books and; • Changes in generally accepted accounting principles.
Sustainability Sustainability is defined by CICA as the degree to which a government can maintain and meet existing creditor requirements without increasing the debt burden on the economy. It is measured in this analysis by:
• Net debt as a proportion of GDP; • Net debt per capita.
Net Debt as a Proportion of GDP: Net debt is an indication of the extent to which provincial government liabilities exceed financial assets. The net debt-to-GDP ratio shows the relationship between net debt and the economy. If the ratio is declining, growth in the economy is exceeding growth in net debt, resulting in improved sustainability. Conversely, an increasing net debt-to-GDP ratio indicates net debt is increasing faster than growth in the economy and serving to reduce the provincial government’s financial sustainability.

14 PROVINCE OF NEW BRUNSWICK 2010
Over the last seven years the province’s ratio of net debt-to-GDP decreased from 31.1% to 30.2%. The following graph reports a steady improvement (reduction) in the net debt-to-GDP ratio from 2004 to 2007, with modest increases in the ratio in 2008 and 2009 related to the costs for the completion of the Trans-Canada Highway and the onset of the economic slowdown. In 2009-2010, this ratio increased as a result of the impacts of the world-wide economic slowdown and increased demand for essential public services. The government addressed the slowdown through stimulus measures and through its lower tax plan. For purposes of the Fiscal Responsibility and Balanced Budget Act, an improvement in the net debt-to-GDP ratio over successive fiscal periods is targeted. This means the net debt-to-GDP ratio for the year ended 31 March 2011 must be lower than the year ended 31 March 2007. In its 2009-2010 and 2010-2011 Budgets, the government indicated that given the global economic and financial climate, objectives of the Act for the current four-year period would not be met.
Net Debt-to-GDP Ratio
22.0%
23.0%
24.0%
25.0%
26.0%
27.0%
28.0%
29.0%
30.0%
31.0%
32.0%
2004 2005 2006 2007 2008 2009 2010
Year
Per
cen
t
Fiscal Year Ending Net Debt GDP Net Debt/GDP($ millions) ($ millions) (%)
2004 6,963.0 22,366 31.1%2005 6,824.3 23,672 28.8%2006 6,709.8 24,716 27.1%2007 6,575.9 25,884 25.4%2008 6,949.2 26,993 25.7%2009 7,387.8 27,372 27.0%2010 8,353.0 27,646 30.2%
Net Debt-to-GDP Ratio
Net Debt per Capita:
Net debt per capita is a statement of the net debt attributable to each New Brunswick resident. The level of net debt per capita had been trending upwards in recent years due to the completion of the Trans-Canada Highway and the onset of the economic slowdown. For 2009-2010, the ratio increased as the global

2010 PROVINCE OF NEW BRUNSWICK 15
economic slowdown affected both revenues and spending. The government addressed the slowdown through stimulus measures and its lower tax plan.
Net Debt per Capita
$8,200.0
$8,600.0
$9,000.0
$9,400.0
$9,800.0
$10,200.0
$10,600.0
$11,000.0
$11,400.0
2004 2005 2006 2007 2008 2009 2010
Year
Mill
ion
s
Fiscal Year Ending Net Debt Population Net Debt per Capita($ millions) ($)
2004 6,963.0 749,369 9,291.82005 6,824.3 747,960 9,123.92006 6,709.8 745,674 8,998.32007 6,575.9 745,561 8,820.02008 6,949.2 747,147 9,300.92009 7,387.8 749,468 9,857.42010 8,353.0 751,273 11,118.5
Net Debt per Capita
Flexibility Flexibility is defined by CICA as the degree to which a government can increase its financial resources to respond to its commitments by either extracting more revenue or increasing its debt burden, and is measured in this analysis by:
• Own-source revenue as a proportion of GDP; • Cost of servicing the public debt as a proportion of total revenue.

16 PROVINCE OF NEW BRUNSWICK 2010
Own-source Revenue as a Proportion of GDP: This ratio measures own-source revenues of the provincial government as a percentage of the economy, as measured by nominal GDP. An increase in this ratio indicates that government own-source revenues are growing faster than the economy as a whole, reducing government’s flexibility to increase revenues without slowing growth in the economy. A decrease in the ratio is indicative of the government taking less revenue out of the economy on a relative basis, which increases its flexibility. Own-source revenue includes revenues from taxation, natural resources, fees, return on investment, lotteries, fines and penalties, etc., and is essentially all revenue minus federal transfers. While more controllable than federal transfers, as the province can influence revenues through its own tax rates and fiscal policy, own-source revenue is vulnerable to, among other factors:
• Net income or revenue of outside agencies that affect the province’s books (e.g. NB Power); • Variability in provincial revenues that are collected or estimated by the federal government such as
personal and corporate income taxes and the Harmonized Sales Tax; • Commodity tax revenues such as Metallic Minerals Tax that are vulnerable to world prices.
Own-source revenue as a proportion of GDP was relatively stable over the six year period 2004 to 2009 but decreased in 2010 to 14.8%. The world-wide economic slowdown, the government’s plan for lower taxes and the net loss for the New Brunswick Electric Finance Corporation (NBEFC) affected own-source revenues and contributed to the decrease.
Own-source Revenue as a Proportion of GDP
13.0%
14.0%
15.0%
16.0%
17.0%
18.0%
2004 2005 2006 2007 2008 2009 2010
Year
Per
cen
t

2010 PROVINCE OF NEW BRUNSWICK 17
Fiscal Year Ending Own-source Revenue GDP Own-source Revenue as a Proportion of GDP
($ millions) ($ millions) (%)2004 3,527.9 22,366 15.8%2005 3,623.9 23,672 15.3%2006 3,925.1 24,716 15.9%2007 4,156.3 25,884 16.1%2008 4,387.3 26,993 16.3%2009 4,386.3 27,372 16.0%2010 4,089.3 27,646 14.8%
Own-source Revenue as a Proportion of GDP
Cost of Servicing the Public Debt as a Proportion of Total Revenue: Debt service costs as a proportion of total revenue is an indicator of the province’s ability to satisfy existing credit requirements in the context of the government’s overall revenue. Debt service costs can be impacted by variables outside the direct control of government, such as credit ratings, interest rates, financial markets and currency fluctuations. Investment in public infrastructure resulting in a change in the stock of debt can also influence borrowing requirements. The province’s proportion of debt service costs to revenue declined steadily over the 2004 to 2008 period, lowering the overall financial burden on the provincial economy. A decrease in this ratio indicates that debt service costs are a smaller proportion of provincial revenues overall, allowing the province more financial resources to provide essential programs and services. In the last two years the ratio has increased modestly to 8.8%, reflecting in part, increased borrowing related to the economic downturn. This is still well below the 10.7% ratio for 2004.
Cost of Servicing the Public Debt as a Proportion of Total Revenue
7.0%
7.5%
8.0%
8.5%
9.0%
9.5%
10.0%
10.5%
11.0%
2004 2005 2006 2007 2008 2009 2010
Year
Per
cen
t

18 PROVINCE OF NEW BRUNSWICK 2010
Fiscal Year Ending Cost of Servicing the Public Debt
Total Revenue Cost of Servicing the Public Debt as a
Proportion of Total Revenue
($ millions) ($ millions) (%)2004 582.9 5,445.8 10.7%2005 580.9 5,978.7 9.7%2006 591.4 6,318.0 9.4%2007 559.4 6,643.7 8.4%2008 576.9 6,964.9 8.3%2009 602.5 7,112.8 8.5%2010 616.6 6,989.9 8.8%
Cost of Servicing the Public Debt as a Proportion of Total Revenue
Vulnerability Vulnerability as defined by CICA is the degree to which a government becomes dependent on, and therefore vulnerable to, sources of funding outside its control or influence, both domestic and international. A common measurement of vulnerability is federal government transfers as a proportion of revenue. Federal Government Transfers as a Proportion of Total Revenue: Revenue from federal sources is comprised of conditional and unconditional grants from the federal government, including:
• Fiscal Equalization Program payments; • The Canada Health Transfer and the Canada Social Transfer; • And conditional grants or capital revenue in support of economic development, infrastructure,
education and labour training and other areas.
Federal transfer payments can be affected by both federal fiscal policy decisions, as well as the normal annual estimate process that guides federal payments under the Equalization Program and Canada Health and Social Transfers. Both of these factors can contribute to year-to-year changes in the level of transfers. In the past, adjustments related to prior-year estimates of Equalization and social program transfers have had a pronounced impact on this measurement year-to-year. Comparing the level of federal transfers to total revenue provides an indication of the vulnerability of the province. Generally, if the ratio is increasing, the province is increasingly reliant on federal transfers, resulting in increased vulnerability. If the ratio is declining, vulnerability is diminished. The dependence of the provincial government on federal transfers has declined considerably from levels of the early 1980s, and federal government transfers as a proportion of total revenue declined annually over the period 2005 to 2008 and then increased in 2009 and 2010. The increase in 2010 reflects a reduction in own-source revenues due to the global economic recession, the government strategy to reduce taxes and the net loss for NBEFC while at the same time reflecting federal stimulus funding.

2010 PROVINCE OF NEW BRUNSWICK 19
Federal Government Transfers as a Proportion of Total Revenue
32.0%
33.0%
34.0%
35.0%
36.0%
37.0%
38.0%
39.0%
40.0%
41.0%
42.0%
2004 2005 2006 2007 2008 2009 2010
Year
Per
cen
t
Fiscal Year Ending Federal Government Transfers
Total Revenue Federal Government Transfers as a
Proportion of Total Revenue
($ millions) ($ millions) (%)2004 1,917.9 5,445.8 35.2%2005 2,354.8 5,978.7 39.4%2006 2,392.9 6,318.0 37.9%2007 2,487.4 6,643.7 37.4%2008 2,577.6 6,964.9 37.0%2009 2,726.5 7,112.8 38.3%2010 2,900.6 6,989.9 41.5%
Federal Government Transfers as a Proportion of Total Revenue


22 PROVINCE OF NEW BRUNSWICK 2010
STATEMENT OF OPERATIONSfor the fiscal year ended 31 March 2010
(millions)Schedule 2010 2010 2009
Budget Actual Actual
REVENUE
Provincial Sources14 Taxes 3,162.0$ 3,243.9$ 3,252.8$ 15 Licenses and Permits 123.3 129.0 116.6 16 Royalties 73.1 39.6 79.5 17 Investment Income 265.5 106.6 357.3 18 Other Provincial Revenue 352.0 353.8 346.7
Sinking Fund Earnings 234.1 216.4 233.4 4,210.0 4,089.3 4,386.3
Federal Sources Fiscal Equalization Payments 1,689.0 1,689.4 1,583.8
19 Unconditional Grants 806.6 803.4 766.3 20 Conditional Grants 391.7 407.8 376.4
2,887.3 2,900.6 2,726.5 7,097.3 6,989.9 7,112.8
EXPENSE
21 Education and Training 1,728.5 1,621.7 1,452.0 22 Health 2,524.0 2,585.0 2,445.7 23 Social Development 951.4 973.4 941.6 24 Protection Services 201.7 209.4 223.8 25 Economic Development 328.9 344.6 287.9 26 Labour and Employment 126.5 141.5 124.4 27 Resources 183.2 183.6 177.4 28 Transportation 398.3 400.5 399.8 29 Central Government 765.3 651.5 650.0
Service of the Public Debt (Note 12) 630.4 616.6 602.5 7,838.2 7,727.8 7,305.1
ANNUAL SURPLUS (DEFICIT) (740.9)$ (737.9)$ (192.3)$
The accompanying notes are an integral part of these Financial Statements.

2010 PROVINCE OF NEW BRUNSWICK 23
STATEMENT OF CASH FLOWfor the fiscal year ended 31 March 2010
(millions)2010 2009
OPERATING ACTIVITIES
Surplus (Deficit) (737.9)$ (192.3)$ Non Cash Items Amortization of Premiums, Discounts and Issue Expenses 5.7 8.1 Foreign Exchange Expense (20.0) (6.6) Increase in Allowance for Doubtful Accounts 92.7 118.9 Amortization of Tangible Capital Assets 291.1 279.9 Loss on Disposal of Tangible Capital Assets 0.4 1.0 Amortization of Deferred Contributions (34.6) (31.0) Sinking Fund Earnings (216.4) (233.4) Losses on Foreign Exchange Settlements 4.9 3.5 Decrease in Pension Surplus (Note 13) 13.6 34.5 Increase in Deferred Revenue 31.1 17.0 (Increase) Decrease in Working Capital (90.0) (105.7) Net Cash From Operating Activities (659.4) (106.1)
INVESTING ACTIVITIES
(Increase) Decrease in Investments, Loans and Advances 117.8 (20.6) Non-Cash Adjustment - Other Comprehensive Income of Government Enterprises 4.9 (128.1) Net Cash Used in Investing Activities 122.7 (148.7)
CAPITAL TRANSACTIONS
Acquisition of Capital Assets (559.3) (440.8) Revenue Received to Acquire Tangible Capital Assets 99.1 64.9 Net Cash Used in Capital Transactions (460.2) (375.9)
FINANCING ACTIVITIES
Proceeds from Issuance of Funded Debt 1,841.7 2,091.7 Purchase of NBEFC Debentures (548.8) (604.8) Received from Sinking Fund for Redemption of Debentures and Payment of Exchange 343.7 375.0 Decrease in Obligations under Capital Leases (20.4) (19.5) Sinking Fund Instalments (160.3) (139.6) Funded Debt Matured (922.7) (861.3) Net Cash From Financing Activities 533.2 841.5
INCREASE (DECREASE) IN CASH DURING YEAR (463.7) 210.8 CASH POSITION - BEGINNING OF YEAR (69.2) (280.0) CASH POSITION - END OF YEAR (532.9)$ (69.2)$
CASH REPRESENTED BY
Short Term Borrowing Net of Cash (532.9)$ (69.2)$
The accompanying notes are an integral part of these Financial Statements.

24 PROVINCE OF NEW BRUNSWICK 2010
STATEMENT OF CHANGE IN NET DEBTfor the fiscal year ended 31 March 2010
2010 2010 2009Budget Actual Actual
OPENING NET DEBT
As Previously Published (7,387.8)$ (7,387.8)$ (6,949.2)$
CHANGES IN YEAR
Annual Surplus (Deficit) (740.9) (737.9) (192.3) Other Comprehensive Income of Government Enterprises --- 4.9 (128.1) Acquisition of Tangible Capital Assets (537.4) (559.3) (440.8) Amortization of Tangible Capital Assets 283.0 291.1 279.9 Amortization of Deferred Contributions (30.6) (34.6) (31.0) Loss on Disposal of Tangible Capital Assets --- 0.4 1.0 Revenue Received to Acquire Tangible Capital Assets 57.2 99.1 64.9 Net Change in Supplies Inventories --- (11.1) (6.4) Net Change in Prepaid Expenses --- (17.8) 14.2
(INCREASE) DECREASE IN NET DEBT (968.7) (965.2) (438.6) NET DEBT - END OF YEAR (8,356.5)$ (8,353.0)$ (7,387.8)$
STATEMENT OF CHANGE IN ACCUMULATED DEFICITfor the fiscal year ended 31 March 2010
2010 2010 2009Budget Actual Actual
OPENING ACCUMULATED DEFICIT
As Previously Published (1,708.9)$ (1,708.9)$ (1,388.5)$
Annual Surplus (Deficit) (740.9) (737.9) (192.3) Other Comprehensive Income --- 4.9 (128.1)
ACCUMULATED DEFICIT - END OF YEAR (2,449.8)$ (2,441.9)$ (1,708.9)$
The accompanying notes are an integral part of these Financial Statements.
(millions)
(millions)

2010 PROVINCE OF NEW BRUNSWICK 25
NOTES TO THE FINANCIAL STATEMENTS 31 March 2010
NOTE 1 SUMMARY OF SIGNIFICANT ACCOUNTING POLICIES a) Accounting Policies These financial statements are prepared using the Government’s accounting policies stated below, which are based on Canadian generally accepted accounting principles for the public sector. The presentation and results using the stated accounting policies do not result in any significant differences from Canadian generally accepted accounting principles. Accrual Accounting Expenses are recorded for all goods and services received or consumed during the fiscal year. Revenues and recoveries are recorded on an accrual basis with the exception of revenue from Canada under the Federal-Provincial Fiscal Arrangements and Federal Post-Secondary Education and Health Contributions Act, 1977, and the Canada-New Brunswick Tax Collection Agreement which is accrued based on information provided by Canada and is adjusted in subsequent years. Interest revenue is recorded on outstanding loan amounts due to the Province as the interest is earned. The major categories of loans receivable are Student Assistance, Economic Development, Agriculture Development and Fisheries. Amounts received or recorded as receivable but not earned by the end of the fiscal year are recorded as deferred revenue. Debt Charges Interest and other debt service charges are reported in the Statement of Operations as Service of the Public Debt except as described below:
Because government enterprises are included in the Provincial Reporting Entity through modified equity accounting, the cost of servicing their debt is not included in the Service of the Public Debt expense. The cost of servicing the debt of government enterprises is an expense included in the calculation of their net profit or loss for the year.
Interest costs imputed on the Province’s Accrued Pension Liability are recorded as part of pension expense, which is included in various expense functions. Interest on debt to finance the Student Loan Portfolio is recorded as part of the Education and Training expense function.
Interest earned on the assets of the General Sinking Fund and on other provincial assets is reported as revenue. Note 12 to these financial statements reports the components of the Service of the Public Debt Expense function and total debt charges. Government Transfers Government transfers are transfers of money, such as grants, from a government to an individual, an organization or another government for which the government making the transfer does not receive any goods or services directly in return. Government transfers are recognized in the Province's financial statements as expenses or revenues in the period that the events underlying the transfer occurred as long as the transfer is authorized and eligibility criteria have

26 PROVINCE OF NEW BRUNSWICK 2010 NOTES TO THE FINANCIAL STATEMENTS 31 March 2010
been met. Liabilities have been established for any transfers due at 31 March 2010 for which the intended recipients have met the eligibility criteria. Receivables have been established for transfers to which the Province is entitled under governing legislation, regulation or agreement. Federal Trust Funds Available but not Recognized On occasion, the federal government has established time-limited trust funds for each province to hold funds designated for each province to be spent on shared national priorities. The funding was intended to be used over multiple periods as each jurisdiction determined best fit their strategic plans. In New Brunswick, the following trust funds exist at 31 March with the balances available and the schedule for funding draw down as approved by the Board of Management. Some Trusts may be used to fund the acquisition of tangible capital assets. In these cases, the funding draw down will occur on the schedule below but revenue will be deferred and amortized over the life of the assets purchased.
Amount (millions) Available Amount to be Recognized as Revenue Each Year
Trust Fund at 31 March
2010 2011 2012 2013 Community Development Trust $ 10.0 $ 10.0 $ --- $ --- Police Officer Recruitment Fund 6.8 2.2 2.3 2.3
$ 16.8 $ 12.2 $ 2.3 $ 2.3 Asset Classification Assets are classified as either financial or non-financial. Financial assets are assets that could be used to discharge existing liabilities or finance future operations and are not to be consumed in the normal course of operations. Non-financial assets are acquired, constructed or developed assets that do not provide resources to discharge existing liabilities but are employed to deliver government services, may be consumed in normal operations and are not for resale. Non-financial assets include tangible capital assets, prepaid expenses and inventories of supplies. Short Term Investments Short term investments are recorded at cost with supplemental information related to market values of short term investments reported in Note 5 to these financial statements. Concessionary Loans There are two situations where the Province charges loan disbursements entirely as expenses. These are:
• Loan agreements which commit the Province to provide future grants to the debtor to be used to repay the
loan. • Loan agreements which include forgiveness provisions if the forgiveness is considered likely.
In both these situations, the loan is charged to expense when it is disbursed. Loans that are significantly concessionary because they earn a low rate of return are originally recorded as assets at the net present value of the expected future cash flows. The net present value is calculated using the Province’s borrowing rate at the time the loan was issued. The difference between the nominal value of the loan and its net present value is recorded as an expense.

2010 PROVINCE OF NEW BRUNSWICK 27
NOTES TO THE FINANCIAL STATEMENTS 31 March 2010
Inventories Inventories are recorded at the lower of cost or net realizable value. Inventories include supplies for use, and goods and properties held for resale. Properties held for resale are reported as a financial asset and include land and fixtures acquired or constructed for the purpose of sale. Properties held for resale also include properties acquired through foreclosure. Inventories of supplies for use are reported as a non-financial asset.
Allowances Allowances have been established for loans and accounts receivable, loan guarantees and other possible losses. These allowances are disclosed in the schedules to the financial statements. Obligations resulting from guaranteed loans are recorded as liabilities when a loss is probable with changes in this allowance recorded annually. As with all provisions for loss, this is an estimate and reflects management’s best estimate of probable losses. Each outstanding loan guarantee under the Economic Development Act is reviewed on a quarterly basis. An allowance for loss on loan guarantees is established when it is determined that a loss is probable. A loss is considered probable when one or more of the following factors is present:
• a decline in the financial position of the borrower; • economic conditions in which the borrower operates indicate the borrower’s inability to repay the loan; • collection experience for the loan.
Losses on guaranteed loans under the Agriculture Development Act and the Fisheries Development Act for classes that have similar standards are calculated using an average rate based on past experience and trends. Amounts due to the province but deemed uncollectible are written off from the accounts of the Province once the write-off has been approved by either the Board of Management or Secretary to the Board of Management depending on the dollar value involved. Tangible Capital Assets Tangible capital assets are assets owned by the Province which have useful lives greater than one year. Certain dollar thresholds have been established for practical purposes. Computer hardware and software have not been capitalized in the Province’s financial statements. Tangible capital assets are reported at gross cost. Contributions received to assist in the acquisition of tangible capital assets are reported as Deferred Capital Contributions and amortized to income at the same rate as the related asset. Tangible capital asset policies of government entities which are consolidated in these financial statements are not adjusted to conform to Provincial policies. The types of items which could differ include amortization rates, estimates of useful lives and dollar thresholds for capitalization.

28 PROVINCE OF NEW BRUNSWICK 2010 NOTES TO THE FINANCIAL STATEMENTS 31 March 2010
Injured Worker Liability The Province provides workers’ compensation benefits on a self-insured basis. WorkSafe New Brunswick administers the claims on the Province’s behalf and charges a fee for this service. The liability for workers’ compensation of $133.9 million as at 31 March 2010 ($135.6 million at 31 March 2009) is determined by an actuary and is included in the Employee Benefits Liability. Annual claim payments are expensed by each department and are included in the functional expense area related to the program the employee worked in. The net change in the liability excluding the actual claims costs is a reduction of $1.7 million in the 2010 fiscal year ($8.8 million increase in 2009) and is credited in General Government. Trusts Under Provincial Administration Legally established trust funds which the Province administers but does not control are not included as Provincial assets or liabilities. These financial statements disclose the equity balances of the trust funds administered by the Province in Note 17. Borrowing on Behalf of New Brunswick Electric Finance Corporation The Province, as represented by the Consolidated Fund, has issued long term debt securities on behalf of New Brunswick Electric Finance Corporation in exchange for debentures with like terms and conditions. The New Brunswick Electric Finance Corporation debentures received by the Province are reported in Note 11 of these financial statements as a reduction of Funded Debt. This financing arrangement was used to obtain more favourable debt servicing costs. The transactions involving these securities, including the debt servicing costs, are not part of the budget plan of the Province’s Consolidated Fund. Foreign Currency Translation and Risk Management The Province's assets, liabilities and contingent liabilities denominated in foreign currencies are translated to Canadian dollars at the year end rates of exchange, except where such items have been hedged or are subject to interest rate and currency swap agreements. In such cases, the rates established by the hedge or the agreements are used in the translation. Exchange gains and losses are included in the Statement of Operations except for the unrealized exchange gains and losses arising on the translation of long term items, which are deferred and amortized on a straight line basis over the remaining life of the related assets or liabilities. Revenue and expense items are translated at the rates of exchange in effect at the respective transaction dates. The Province borrows funds in both domestic and foreign capital markets and manages its existing debt portfolio to achieve the lowest debt costs within specified risk parameters. As a result, the Province may be exposed to foreign exchange risk. Foreign exchange or currency risk is the risk that the principal and interest payments on foreign debt will fluctuate in Canadian dollar terms due to fluctuations in foreign exchange rates. In accordance with risk management policy guidelines, the Province uses various financial instruments and techniques to manage exposure to foreign currency risk. These financial instruments include currency forwards, cross-currency swaps and purchases of foreign denominated assets into the Province’s sinking fund. As at March 31, 2010, the Province had outstanding $764.5 million US$ and 300.0 million Swiss Francs denominated debt. Of this total, $564.5 million US$ and 300.0 million Swiss Francs were hedged by entering into cross-currency swaps, which convert the interest and principal payable from the original currency to Canadian dollars. The Province’s currency exposure was 1.8% of the total debt portfolio prior to netting out the US dollar denominated assets in the sinking fund. A one-cent change in the US/CDN$ foreign exchange rate as of March 31, 2010 would result in a $2.1 million change in the principal amount of Provincial-purpose long term debt. The hypothetical change, a gain or loss, would be amortized over the remaining life of the related debt issue. A one-cent change would also result in a change of $0.2 million on interest payments in Service of the Public Debt.

2010 PROVINCE OF NEW BRUNSWICK 29
NOTES TO THE FINANCIAL STATEMENTS 31 March 2010
The net currency exposure is 0.1% when the US dollar denominated assets held in the sinking fund are netted from the total Provincial-purpose debt portfolio. Sinking Funds The General Sinking Fund is maintained by the Minister of Finance under the authority of section 12 of the Provincial Loans Act (“Act”). This Act provides that the Minister shall maintain one or more sinking funds for the payment of funded debt either at maturity or upon redemption in advance of maturity. Typically, redemptions are only made after the related Provincial purpose portion of the debt has been outstanding a minimum of twenty years. Sinking fund investments in bonds and debentures are reported at par value less unamortized discounts less premiums and the unamortized balance of unrealized foreign exchange gains or losses. Short-term deposits are reported at cost. The Province’s sinking fund may be invested in eligible securities as defined in the Act. Sinking fund installments are paid into the General Sinking Fund on or before the anniversary date of each issue of funded debt, at the prescribed rate of a minimum of 1% of the outstanding principal. New Brunswick Electric Finance Corporation (NBEFC) is contractually obligated to pay to the Province the amount of the sinking fund installment required each year in respect of the debentures issued by the Province on behalf of New Brunswick Power Corporation prior to 1 October 2004 and on behalf of NBEFC after 30 September 2004. The following table shows the allocation of various components of the Sinking Fund between the Consolidated Fund of the Province and NBEFC.
Consolidated Fund NBEFC Total
Fund Equity, beginning of year $ 4,159.9 $ 415.3 $ 4,575.2 Sinking Fund Earnings 216.4 (39.2) 177.2 Installments 160.3 41.1 201.4 Paid for Debt Retirement (343.7) (53.1) (396.8)
Fund Equity, end of year $ 4,192.9 $ 364.1 $ 4,557.0
Leases Long term leases, under which the Province, as lessee, assumes substantially all the benefits and risks of ownership of leased property, are classified as capital leases although certain minimum dollar thresholds are in place for practical reasons. The present value of a capital lease is accounted for as a tangible capital asset and an obligation at the inception of the lease. All leases under which the Province does not assume substantially all the benefits and risks of ownership related to the leased property are classified as operating leases. Each rental payment required by an operating lease is recorded as an expense when it is due.

30 PROVINCE OF NEW BRUNSWICK 2010 NOTES TO THE FINANCIAL STATEMENTS 31 March 2010
Measurement Uncertainty Measurement uncertainty is uncertainty in the determination of the amount at which an item is recognized in financial statements. This uncertainty exists when there is a variance between the recognized amount and another reasonably possible amount. Many items in these financial statements have been measured using estimates. Those estimates have been based on assumptions that reflect economic conditions. Some examples of where measurement uncertainty exists are the establishment of allowances for doubtful accounts, the determination of pension expense, determination of injured worker liability and related expense and the calculation of transition balances for Tangible Capital Assets. b) Provincial Reporting Entity These financial statements include those entities which make up the Provincial Reporting Entity. The Provincial Reporting Entity is comprised of certain organizations that are controlled by the government. These organizations are the Consolidated Fund, the General Sinking Fund and the agencies, commissions and corporations listed below. c) Basis of Consolidation Transactions and balances of organizations are included in these financial statements through one of the following accounting methods:
Consolidation Method This method combines the accounts of distinct organizations. It requires uniform accounting policies for the organizations except that tangible capital asset policies of these organizations are not conformed to provincial policies. Inter-organizational balances and transactions are eliminated under this method. This method reports the organizations as if they were one organization. The organizations included through the consolidation method are:
Algonquin Golf Limited; New Brunswick Distance Education Algonquin Properties Limited; Network Inc.; Ambulance New Brunswick Inc.; New Brunswick Health Council; Arts Development Trust Fund; New Brunswick Highway Corporation; Atlantic Education International Inc.; New Brunswick Housing Corporation; Energy Efficiency and Conservation Agency New Brunswick Investment Management of New Brunswick; Corporation; Environmental Trust Fund; New Brunswick Legal Aid Services Commission; FacilicorpNB Ltd.; Recycle New Brunswick; Forest Protection Limited; Regional Development Corporation; Kings Landing Corporation; Regional Health Authorities; New Brunswick Credit Union Deposit Service New Brunswick; Insurance Corporation; Sport Development Trust Fund.
Modified Equity Method This method is used for government enterprises. Government enterprises are defined in Note 7 to these financial statements. The modified equity method reports a government enterprise’s net assets as an investment on the Province’s Statement of Financial Position. The net income of the government enterprise is reported as investment income on the Province’s Statement of Operations. Inter-organizational transactions and balances are not eliminated. All gains or losses arising from inter-organizational transactions between government enterprises and other government organizations are eliminated. The accounting policies of government enterprises are not adjusted to conform with those of other government organizations. The organizations that have been included through modified equity accounting are:

2010 PROVINCE OF NEW BRUNSWICK 31
NOTES TO THE FINANCIAL STATEMENTS 31 March 2010
New Brunswick Lotteries and Gaming Corporation;
New Brunswick Municipal Finance Corporation; New Brunswick Power Group;
New Brunswick Electric Finance Corporation; New Brunswick Securities Commission. New Brunswick Liquor Corporation;
Transaction Method This method records only transactions between the Province and the other organizations. The transaction method was used because the appropriate methods would not produce a materially different result. The organizations included through the transaction method are:
Advisory Council on the Status of Women; New Brunswick Museum; New Brunswick Agricultural Insurance New Brunswick Public Libraries Foundation; Commission; Premier's Council on the Status of Disabled Persons; New Brunswick Arts Board; Provincial Holdings Ltd.; New Brunswick Energy and Utilities Board; Strait Crossing Finance Inc. New Brunswick Insurance Board;
NOTE 2 BUDGET The budget amounts included in these financial statements are the amounts published in the Main Estimates, adjusted for transfers from the Supplementary Funding Provision Program and elimination of inter-account transactions. The Supplementary Funding Provision Program is an appropriation which provides funding to other programs for costs associated with contract settlements and other requirements not budgeted in a specific program. Budget figures for the year ending 31 March 2010 reflect the acquisition of tangible capital assets and amortization expense. These amounts are disclosed in the Main Estimates as a separate schedule.

32 PROVINCE OF NEW BRUNSWICK 2010 NOTES TO THE FINANCIAL STATEMENTS 31 March 2010
NOTE 3 FISCAL RESPONSIBILITY AND BALANCED BUDGET ACT The Fiscal Responsibility and Balanced Budget Act requires that total expenses not exceed total revenues for the period commencing 1 April 2007 and ending 31 March 2011. The Act stipulates that any change made within the last fifteen months of the period from 1 April 2007 to 31 March 2011, or after completion of that period, in relation to the official estimates by the Government of Canada for provincial entitlements under the Federal-Provincial Fiscal Arrangements Act (Canada), the Canada-New Brunswick Tax Collection Agreement or the Comprehensive Integrated Tax Coordination Agreement, shall not be taken into account. The surplus (deficit) according to the Fiscal Responsibility and Balanced Budget Act for each of the years in the three year period ending 31 March 2010 is as follows:
2008 2009 2010Actual Actual Actual
Revenue $ 6,962.3 $ 7,112.8 $ 6,989.9 Adjustments as per section 4(1) of the Act --- --- (79.3)Revenue as per Fiscal Responsibility and Balanced Budget Act 6,962.3 7,112.8 6,910.6 Expense 6,875.6 7,305.1 7,727.8
Surplus (Deficit) for the year 86.7 (192.3) (817.2)Cumulative Surplus (Deficit) at beginning of year --- 86.7 (105.6)
Cumulative Surplus (Deficit) at end of year $ 86.7 $ (105.6) $ (922.8)
(millions)
The Province is required under the Act to report annually on the ratio of Net Debt to Gross Domestic Product (GDP). The following table presents the ratio for the years ended 31 March 2008 to 31 March 2010.
2010 2009 2008
Net Debt $ 8,353.0 $ 7,387.8 $ 6,949.2
GDP (31 December) $ 27,646.0 $ 27,372.0 $ 26,993.0
Ratio of Net Debt to GDP 30.2% 27.0% 25.7%
(millions)

2010 PROVINCE OF NEW BRUNSWICK 33
NOTES TO THE FINANCIAL STATEMENTS 31 March 2010
NOTE 4 SPECIAL PURPOSE ACCOUNTS Special Purpose Account revenue earned but not spent accumulates as a surplus in that account and may be spent in future years for the purposes specified. At 31 March 2010, the accumulated surplus in all Special Purpose Accounts totaled $115.9 million ($110.4 million in 2009). This total is a component of net debt and accumulated deficit. Descriptions of Major Special Purpose Accounts CMHC Funding CMHC funding is used to provide funding for the operation of the programs that fall under the administration of the Social Housing Agreement. Fund revenues include interest earned on the fund, interest earned from second mortgages, and the cumulative excess of funding for social housing not spent to date. Expenditures from the fund are for approved CMHC program funding, any annual excess of which may be carried over for future program expenditures until the agreement expiration date in 2034. School District Self Sustaining Accounts Self Sustaining Accounts record school district revenue and expenses for non-educational services such as the rental of school facilities, cafeteria operations and foreign student tuition fees. These special purpose accounts also record partnership activities with third parties to provide resources, services or grants to students. The table below summarizes the change in the accumulated Special Purpose Account surplus.

34 PROVINCE OF NEW BRUNSWICK 2010 NOTES TO THE FINANCIAL STATEMENTS 31 March 2010
2009
Accumulated Surplus Revenue Expense
Accumulated Surplus
Active Community School Sport Project $ 0.1 $ 0.6 $ 0.6 $ 0.1Archives Trust Account 0.1 --- --- 0.1Arts Development Trust Fund --- 0.7 0.7 ---Child Centered Family Justice Fund 0.1 0.4 0.5 ---CMHC Funding 54.7 11.7 12.7 53.7Environmental Trust Fund 9.1 7.5 8.2 8.4Fish Stocking Fund 0.8 0.4 0.3 0.9Fred Magee Account 0.4 --- --- 0.4Grand Lake Meadows 0.1 --- --- 0.1Historic Places 0.1 0.3 0.3 0.1Hospital Liability Protection Account --- 1.0 0.5 0.5International Projects 0.2 0.6 0.7 0.1Johann Wordel Account 0.1 --- --- 0.1Land Management Account 10.3 2.8 2.1 11.0Library Account 0.5 0.4 0.6 0.3Medical Research Assistance Account 3.1 --- 0.1 3.0Municipal Police Assistance 3.5 0.1 0.8 2.8National Safety Code Agreement --- 0.2 0.2 ---Natural Resources Recoverable Projects --- 0.1 0.1 ---NB 911 Service Fund 3.7 7.6 2.8 8.5NB Community College Scholarship Account 0.9 0.2 --- 1.1Provincial Parks --- 0.1 0.1 ---Provincial Proceeds of Crime --- 1.3 0.2 1.1Public/Private Partnership Projects 0.2 --- --- 0.2Renovation of Old Government House 0.3 --- 0.1 0.2School District Scholarship and Trusts --- 0.3 0.3 ---School District Self Sustaining Accounts 14.2 19.3 17.2 16.3Sport Development Trust Fund --- 0.5 0.5 ---Strait Crossing Finance Inc. --- 0.1 0.1 ---Suspended Driver - Alcohol Re-Education --- 0.4 0.4 ---Trail Management Trust Fund 1.8 1.2 1.8 1.2Training Recoverable Projects 2.7 1.6 1.9 2.4Victim Services Account 2.4 2.0 2.3 2.1Wildlife Trust Fund 1.0 1.2 1.0 1.2
$ 110.4 $ 62.6 $ 57.1 $ 115.9
(millions)2010
NOTE 5 SHORT TERM INVESTMENTS The fair value of short-term investments at March 31, 2010 is not materially different from the carrying value. Short-term investments primarily consist of investments in banker’s acceptances and term deposits. NOTE 6 OBLIGATIONS UNDER CAPITAL LEASES The total future principal and interest payments for capital leases amount to $1,394.2 million ($1,470.6 million 2009). That amount includes $765.5 million ($785.9 million 2009) in principal and $628.7 million ($684.7 million 2009) in interest.

2010 PROVINCE OF NEW BRUNSWICK 35
NOTES TO THE FINANCIAL STATEMENTS 31 March 2010
Minimum annual principal and interest payments in each of the next five years are as follows:
Fiscal Year
2010-2011 $ 86.12011-2012 85.62012-2013 84.72013-2014 83.22014-2015 83.9
(millions)
NOTE 7 GOVERNMENT ENTERPRISES
A Government Enterprise is an organization accountable to the Legislative Assembly that has the power to contract in its own name, has the financial and operating authority to carry on a business, sells goods and services to customers outside the Provincial Reporting Entity as its principal activity, and that can, in the normal course of its operations, maintain its operations and meet its liabilities from revenues received from sources outside the Provincial Reporting Entity.
The following is a list of Government Enterprises, and their fiscal year ends, which are included in the Provincial Reporting Entity as described in Note 1 to these financial statements. In addition we have included summary information for the NB Power Group in the narrative section following the table below. The financial results of the NB Power Group are included in New Brunswick Electric Finance Corporation’s financial statements using the modified equity method.
New Brunswick Lotteries and Gaming Corporation (Lotteries) 31-03-10 New Brunswick Liquor Corporation (Liquor) 31-03-10 New Brunswick Municipal Finance Corporation (Municipal Finance) 31-12-09 New Brunswick Electric Finance Corporation (NB Electric Finance) 31-03-10 New Brunswick Power Group (NB Power Group) 31-03-10 New Brunswick Securities Commission (Securities) 31-03-10
The following table presents condensed financial information of these Government Enterprises.

36 PROVINCE OF NEW BRUNSWICK 2010 NOTES TO THE FINANCIAL STATEMENTS 31 March 2010
Municipal NB ElectricLotteries Liquor Finance Finance Securities Total
AssetsCash and Equivalents $ --- $ 1.0 $ 1.0 $ 0.2 $ 1.7 $ 3.9 Receivables 0.1 5.4 4.1 714.2 0.1 723.9 Prepaids --- 0.5 --- --- 0.1 0.6 Inventories --- 22.1 --- --- --- 22.1 Investments --- --- 0.9 112.5 1.5 114.9 Deferred Charges --- 0.4 --- --- --- 0.4 Fixed Assets --- 9.6 --- --- 0.3 9.9 Long Term Notes Receivable --- --- 682.9 3,629.2 --- 4,312.1 Total Assets $ 0.1 $ 39.0 $ 688.9 $ 4,456.1 $ 3.7 $ 5,187.8
LiabilitiesPayables $ 0.1 $ 16.9 $ 4.1 $ 724.9 $ 0.8 $ 746.8 Other Long Term Liabilities --- --- --- 129.5 --- 129.5 Long Term Debt --- --- 683.8 4,192.3 --- 4,876.1 Sinking Funds --- --- --- (364.1) --- (364.1)Total Liabilities 0.1 16.9 687.9 4,682.6 0.8 5,388.3
EquityRetained Earnings --- 22.1 1.0 (128.6) 2.9 (102.6)Accumulated Other Comprehensive Income --- --- --- (97.9) --- (97.9)Total Equity --- 22.1 1.0 (226.5) 2.9 (200.5)Total Liabilities and Equity $ 0.1 $ 39.0 $ 688.9 $ 4,456.1 $ 3.7 $ 5,187.8
Net IncomeRevenue $ 130.8 $ 409.7 $ 30.7 $ 138.4 $ 11.5 $ 721.1 Expenses (14.9) (251.8) (0.8) (350.6) (5.2) (623.3)Interest and Related Expense --- --- (29.8) --- --- (29.8)Net Income $ 115.9 $ 157.9 $ 0.1 $ (212.2) $ 6.3 $ 68.0
(millions)
The financial information of Government Enterprises is prepared according to Generally Accepted Accounting Principles, using accounting policies that are appropriate for the industry segment in which they operate. These accounting policies may not be consistent with accounting policies used by other member organizations of the Provincial Reporting Entity. Because minor adjustments are required for timing differences, the net income amounts reported in the financial statements of government enterprises may vary slightly from the investment income reported in the Province’s Statement of Operations.

2010 PROVINCE OF NEW BRUNSWICK 37
NOTES TO THE FINANCIAL STATEMENTS 31 March 2010
New Brunswick Lotteries and Gaming Corporation The New Brunswick Lotteries and Gaming Corporation is a shareholder in Atlantic Lottery Corporation Inc. and in the Interprovincial Lottery Corporation. Atlantic Lottery Corporation Inc. is jointly owned by the four Atlantic Provinces and is responsible to develop, organize, undertake, conduct and manage lotteries in Atlantic Canada. Atlantic Lottery Corporation Inc. also markets and handles the products of the Interprovincial Lottery Corporation. The Interprovincial Lottery Corporation is a corporation jointly owned by the ten Canadian provinces. New Brunswick Liquor Corporation The New Brunswick Liquor Corporation was established under the New Brunswick Liquor Corporation Act. Its business activity is the purchase, distribution and sale of alcoholic beverages throughout the Province of New Brunswick. New Brunswick Municipal Finance Corporation The Municipal Finance Corporation was established under the New Brunswick Municipal Finance Corporation Act. Its purpose is to provide financing for municipalities and municipal enterprises through a central borrowing authority. The Province is guarantor of all debt issued by the Corporation. New Brunswick Electric Finance Corporation New Brunswick Electric Finance Corporation (NBEFC) is a Crown Corporation formed to assume New Brunswick Power's existing debt, to capitalize the new companies with debt and equity to enable them to become financially independent of Government, and to receive interest, dividend and special payments (in lieu of taxes) to enable it to service and repay the debt it has assumed. NBEFC records the financial results of the NB Power Group using the equity method. The $112.5 million shown by NBEFC as an investment on its balance sheet is equal to the amount of capital stock of the NB Power Group plus all earnings of the NB Power Group subsequent to 30 September 2004. The NB Power Group’s net income is reported as income on NBEFC’s “Statement of Income and Surplus (Deficit)”. Unrealized intercompany gains or losses are eliminated. NBEFC’s net income was reduced by $19.4 million of unrealized intercompany gains related to expenses deferred under the rate regulatory accounting used by the NB Power Group. In addition, NBEFC’s “Other Comprehensive Income” was increased by $1.5 million to adjust for the change in unrealized gain resulting from NB Power Group’s recognition of a “Future special payments in lieu of income taxes – other comprehensive income” asset. The specific treatment of costs by the NB Power Group is outlined in the Electricity Act. The amount of $3,629.2 million reported by NBEFC as Long Term Notes Receivable is included by the NB Power Group as Long Term Debt. In addition, $4,217.0 million of the amount shown as Long Term Debt of NBEFC has been borrowed by the Province and is shown on the Statement of Financial Position as a reduction of Funded Debt. New Brunswick Power Group The New Brunswick Power Corporation was established as a Crown Corporation of the Province of New Brunswick in 1920 by enactment of the New Brunswick Electric Power Act. On October 1, 2004 the Province of New Brunswick proclaimed the Electricity Act which resulted in the reorganization of NB Power and the restructuring of the electricity industry in New Brunswick. NB Power was continued as New Brunswick Power

38 PROVINCE OF NEW BRUNSWICK 2010 NOTES TO THE FINANCIAL STATEMENTS 31 March 2010
Holding Corporation with four new subsidiary operating companies (NB Power Group) which commenced operations on that date.
The NB Power Group provides for the continuous supply of energy adequate for the needs and future development of the Province, and promotes economy and efficiency in the distribution, supply, sale and use of power. The 31 March 2010 combined statements of the NB Power Group report net loss of $117 million on total revenue of $1,635 million. Total assets reported were $5,379 million. Of this amount, $3,702 million related to the net book value of tangible capital assets. The statements also report total liabilities of $5,205 million of which $3,580 million is long term debt and $99 million matures in the 2010-2011 fiscal year. New Brunswick Securities Commission The New Brunswick Securities Commission is a Provincial Corporation under the Securities Act (New Brunswick) established on July 1, 2004. The business of the Commission is the regulation of the New Brunswick capital market, including administration of the Act, the Securities Regulation and the New Brunswick Securities Commission rules. NOTE 8 TANGIBLE CAPITAL ASSETS Tangible capital assets include acquired, built, developed and improved tangible assets, whose useful life extends beyond the fiscal year and which are intended to be used on an ongoing basis for producing goods or delivering services. The Province does not capitalize computer hardware and software. Certain assets which have historical or cultural value, including works of art, historical documents and historical and cultural artifacts are not recognized as tangible capital assets. Assets under construction are not amortized until the asset is available to be put into service. Calculation of opening balances included, where available, acquisition totals reported in Public Accounts from 1973 to 2004. Surfacing costs have been segregated starting in 2005. Prior to 2005, these costs were included in roads and highways and bridges. Tangible capital assets are amortized on a straight-line basis over their estimated useful lives as noted in the table that follows. One-half of the annual amortization is charged in the year of acquisition and in the year of disposal. Included in the closing costs of the various classes as of March 31, 2010 are costs for assets under construction, which are not amortized. These costs are for buildings ($159.9 million); bridges, roads and highways ($136.2 million); ferries ($20.6 million); and water management systems ($17.1 million).

2009 PROVINCE OF NEW BRUNSWICK 39
NOTES TO THE FINANCIAL STATEMENTS 31 March 2010
2009
Land
Buildings and Land
Improvements
Machinery and
Equipment Ferries
Vehicles and Mobile Heavy
Equipment
Roads, Bridges and Highways
Dams and Water
Management Systems Total Total
Estimated Useful Life (Years) Indefinite 20-40 5-15 40-50 5-20 20-50 20-50
CostOpening Costs $ 324.6 $ 2,653.5 $ 635.9 $ 35.8 $ 288.2 $ 6,379.3 $ 24.2 $ 10,341.5 $ 9,911.3 Additions 5.2 185.2 29.4 15.4 13.6 300.4 10.1 559.3 440.8 Disposals --- 0.1 3.4 0.1 13.0 --- --- 16.6 10.6
Closing Costs 329.8 2,838.6 661.9 51.1 288.8 6,679.7 34.3 10,884.2 10,341.5
Accumulated AmortizationOpening Accumulated Amortization --- 1,237.0 461.0 5.9 191.2 2,051.1 1.3 3,947.5 3,677.3 Amortization Expense --- 72.3 39.3 0.7 18.0 160.4 0.4 291.1 279.9 Disposals --- 0.1 3.3 0.1 12.7 --- --- 16.2 9.7 Closing Accumulated Amortization --- 1,309.2 497.0 6.5 196.5 2,211.5 1.7 4,222.4 3,947.5
Net Book Value $ 329.8 $ 1,529.4 $ 164.9 $ 44.6 $ 92.3 $ 4,468.2 $ 32.6 $ 6,661.8 $ 6,394.0
Opening Balance $ 324.6 $ 1,416.5 $ 174.9 $ 29.9 $ 97.0 $ 4,328.2 $ 22.9 $ 6,394.0 $ 6,234.0 Closing Balance 329.8 1,529.4 164.9 44.6 92.3 4,468.2 32.6 6,661.8 6,394.0
Increase (Decrease) in Net Book Value $ 5.2 $ 112.9 $ (10.0) $ 14.7 $ (4.7) $ 140.0 $ 9.7 $ 267.8 $ 160.0
2010(millions)

40 PROVINCE OF NEW BRUNSWICK 2010
NOTES TO THE FINANCIAL STATEMENTS 31 March 2010
NOTE 9 DEFERRED CAPITAL CONTRIBUTIONS Capital contributions related to the acquisition of tangible capital assets are deferred and amortized over the useful life of the related asset. The amortization of capital contributions is reported as revenue in the Statement of Operations. Deferred capital contributions represent the unamortized portion of these contributed amounts. The changes in the balance of deferred capital contributions during the year are as follows:
Balance, beginning of year $ 852.2 $ 818.3 Contributions received 99.1 64.9 Amortized to revenue during the year (34.6) (31.0)
Balance, end of year $ 916.7 $ 852.2
(millions)2010 2009
NOTE 10 BORROWING AUTHORITY a) Balance of Borrowing Authority under the Provincial Loans Act The balance of borrowing authority granted under the Provincial Loans Act is as follows:
Loan Act 2008 $ 563.9 $ --- $ 563.9 $ --- Loan Act 2009 --- 1,050.0 171.4 878.6
$ 563.9 $ 1,050.0 $ 735.3 $ 878.6
(millions)Authority Granted
During the Year
Borrowing During the
YearBalance
2009Balance
2010
Under the authority of section 2 of the Provincial Loans Act, the maximum temporary indebtedness of the Province is $2,200.0 million. At 31 March 2010, the short term borrowing of the Province net of cash was $532.9 million. Under the authority of subsection 3(1) of the Provincial Loans Act, the Province may borrow sums required for the repayment, refinancing or renewal of securities issued or for the payment of any loan or liability, repayment of which is guaranteed by the Province. This authority is in addition to the authorities listed above. b) Borrowing by the Municipal Finance Corporation The New Brunswick Municipal Finance Corporation has authority under the New Brunswick Municipal Finance Corporation Act to provide financing for municipalities and municipal enterprises. As at 31 December 2009, long term debt owed by the corporation was $687.1 million. The Province guarantees this debt.
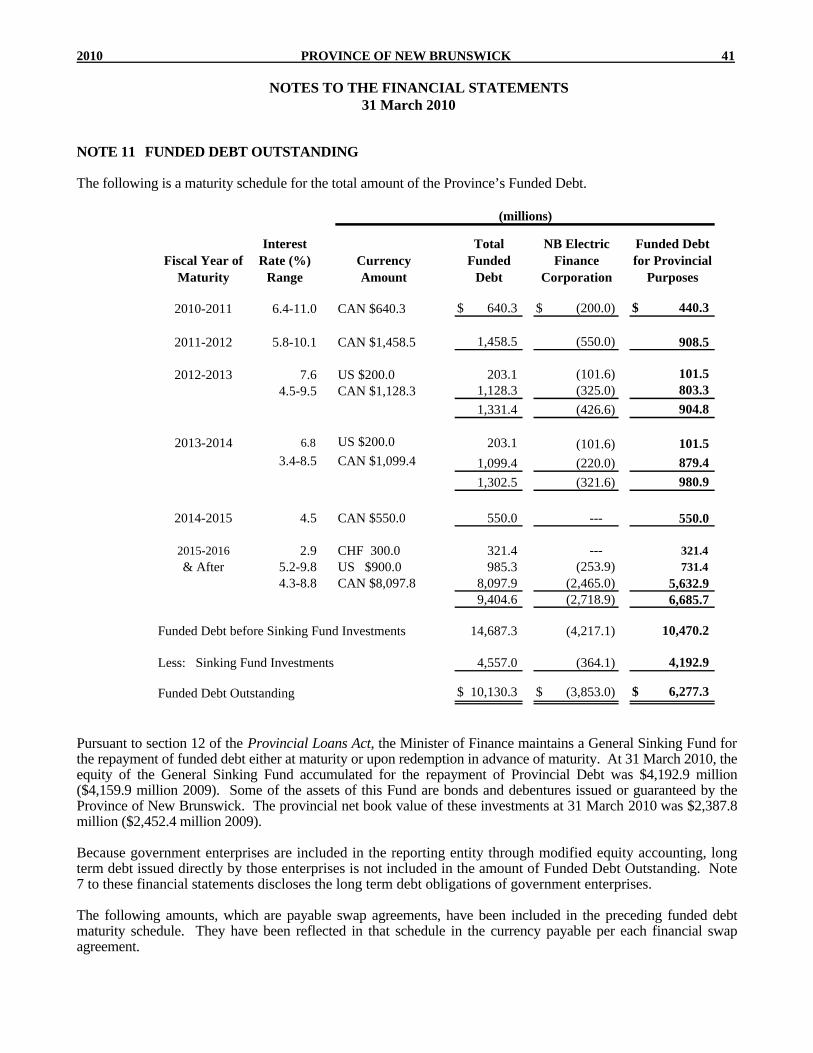
2010 PROVINCE OF NEW BRUNSWICK 41
NOTES TO THE FINANCIAL STATEMENTS 31 March 2010
NOTE 11 FUNDED DEBT OUTSTANDING The following is a maturity schedule for the total amount of the Province’s Funded Debt.
Fiscal Year of Maturity
Interest Rate (%)
RangeCurrency Amount
Total Funded
Debt
NB Electric Finance
Corporation
Funded Debt for Provincial
Purposes
2010-2011 6.4-11.0 CAN $640.3 $ 640.3 $ (200.0) $ 440.3
2011-2012 5.8-10.1 CAN $1,458.5 1,458.5 (550.0) 908.5
2012-2013 7.6 US $200.0 203.1 (101.6) 101.5 4.5-9.5 CAN $1,128.3 1,128.3 (325.0) 803.3
1,331.4 (426.6) 904.8
2013-2014 6.8 US $200.0 203.1 (101.6) 101.5 3.4-8.5 CAN $1,099.4 1,099.4 (220.0) 879.4
1,302.5 (321.6) 980.9
2014-2015 4.5 CAN $550.0 550.0 --- 550.0
2015-2016 2.9 CHF 300.0 321.4 --- 321.4 & After 5.2-9.8 US $900.0 985.3 (253.9) 731.4
4.3-8.8 CAN $8,097.8 8,097.9 (2,465.0) 5,632.9 9,404.6 (2,718.9) 6,685.7
14,687.3 (4,217.1) 10,470.2
4,557.0 (364.1) 4,192.9
$ 10,130.3 $ (3,853.0) $ 6,277.3 Funded Debt Outstanding
Less: Sinking Fund Investments
Funded Debt before Sinking Fund Investments
(millions)
Pursuant to section 12 of the Provincial Loans Act, the Minister of Finance maintains a General Sinking Fund for the repayment of funded debt either at maturity or upon redemption in advance of maturity. At 31 March 2010, the equity of the General Sinking Fund accumulated for the repayment of Provincial Debt was $4,192.9 million ($4,159.9 million 2009). Some of the assets of this Fund are bonds and debentures issued or guaranteed by the Province of New Brunswick. The provincial net book value of these investments at 31 March 2010 was $2,387.8 million ($2,452.4 million 2009). Because government enterprises are included in the reporting entity through modified equity accounting, long term debt issued directly by those enterprises is not included in the amount of Funded Debt Outstanding. Note 7 to these financial statements discloses the long term debt obligations of government enterprises. The following amounts, which are payable swap agreements, have been included in the preceding funded debt maturity schedule. They have been reflected in that schedule in the currency payable per each financial swap agreement.

42 PROVINCE OF NEW BRUNSWICK 2010
NOTES TO THE FINANCIAL STATEMENTS 31 March 2010
Fiscal Year of Maturity
Amount Payable in Original Currency
Amount Payable Per Financial Swap
Agreement
Canadian Dollar
Equivalent
2015-2016 CHF 300.0 CAN $ 321.4 321.4 2016-2017 US $ 500.0 CAN $ 584.7 584.7 2020-2021 US $ 50.0 CAN $ 48.9 48.9 2022-2023 US $ 100.0 CAN $ 97.8 97.8
$ 1,052.8
(millions)2010
The swap agreements are interest rate and currency swap agreements. The following estimated payments are required in each of the next five years to meet the sinking fund provisions of existing debt.
Fiscal Year
2010-2011 $ 156.8 2011-2012 144.3 2012-2013 134.3 2013-2014 114.2 2014-2015 108.5
(millions)
NOTE 12 DEBT CHARGES
The total cost of interest, exchange, amortization and related expenses is $520.7 million ($398.8 million 2009), which consists of:
2010 2009
Interest $ 813.3 $ 778.5 Interest on Fredericton – Moncton Highway Capital Lease 51.7 53.0 Interest on Other Capital Leases 2.0 2.0 Foreign Exchange Expense (20.0) (6.6)Amortization of Discounts and Premiums 5.7 8.1 Other Expenses 9.4 1.8
862.1 836.8 Interest Recovery for Debt Incurred for the New Brunswick Electric Finance Corporation (245.5) (234.3)Service of the Public Debt 616.6 602.5 Sinking Fund Earnings (216.4) (233.4)
400.2 369.1 Pension Interest Charged 118.2 20.6 Interest on Debt to finance Student Loan Portfolio 2.3 9.1
$ 520.7 $ 398.8
(millions)

2010 PROVINCE OF NEW BRUNSWICK 43
NOTES TO THE FINANCIAL STATEMENTS 31 March 2010
NOTE 13 PENSION PLANS a) Description Employees of the Province and certain other entities, as well as members of the Legislative Assembly, are entitled to receive pension benefits. The Pension plans under which these benefits are received are as follows:
Plan Name
Date of Latest Actuarial Valuation
for Accounting Purposes
Public Service Superannuation Act (PSSA) 01 April 2009 Teachers’ Pension Act (TPA) 01 April 2009 Provincial Court Act and Provincial Court Judges’ Pension Act (Judge)
01 April 2007
Members’ Superannuation Act and Members’ Pension Act (Member)
01 April 2008
Pension Plan for Canadian Union of Public Employees of New Brunswick Hospitals (H-CUPE)
---
Pension Plan for Management Employees of New Brunswick School Districts (Sch-Mgt)
01 January 2008
Pension Plan for General Labour, Trades and Services Employees of New Brunswick School Districts (GLTS)
01 January 2006
Pension Plan for Full-Time CUPE 2745 Employees of New Brunswick School Districts (CUPE 2745)
01 January 2006
Ombudsman Act (Ombud) --- Pension Plan for Certain Bargaining Employees of New Brunswick Hospitals (H – CBE)
---
Pension Plan for Part-time and Seasonal Employees (Part-time)
---
Early Retirement Programs (Early Ret) 01 April 2006 Pension trust funds distinct from the Consolidated Fund exist for each of these pension plans, except the Members’ Superannuation Act, Members’ Pension Act and the Ombudsman Act. The pension expense and liability relating to NB Power employees belonging to the Public Service Superannuation Act are fully accounted for in the financial statements of NB Power. The schedules in this note have been adjusted to reflect this.

44 PROVINCE OF NEW BRUNSWICK 2010
NOTES TO THE FINANCIAL STATEMENTS 31 March 2010
The following is a summary of the contribution levels and basic member benefits for each pension plan. Complete plan descriptions are contained in the specific plan documentation. Contributions Employee Benefits
Plan
Earnings Up to
YMPE
Earnings Above YMPE
Employer
Unreduced
Benefits
Reduced Benefits
Basic Benefit
Annual Benefit
Indexing PSSA 5.80% 7.50% Determined
by an actuary required to fund current service costs, plus special payments determined by an actuary.
Age 60 with 5 years service.
Age 55 with 5 years service.
2.0% of salary times years service. Integrated with CPP.
Up to 5.00%
TPA 7.30% 9.00% Equal to Employee contributions, plus special payments as determined by an actuary.
Sum of age and years of service 87; 35 years service; or age 65 with 5 years service; or age 60 with 20 years service.
Sum of age and service total 80 or age 60 with 5 years service.
2.0% of salary times years service. Integrated with CPP.
Up to 4.75%
Sch –Mgt This plan is being curtailed. There are no current contributors to the plan.
N/A Age 60 with 5 continuous years service.
At age 55 with 5 continuous years service.
2.0% of salary times years service. Integrated with CPP.
Up to 3.00%
CUPE 2745 5.00% 6.50% 148.2% of employee contributions.
Age 60 with 5 years continuous employment.
Age 55 with 5 years continuous employment.
1.3% of salary times years service.
Up to 2.00%
GLTS 5.50% 7.00% Not less than 95% of employee contributions, plus special payments as determined by an actuary.
Age 60 with 5 years continuous service.
Age 55 with 5 years continuous employment.
1.4% to 2.0% of salary times years service.
Up to 2.00%
Judge a)Provincial Court Act b)Provincial Court Judges’ Pension Act
7.00%
7.00%
N/A
N/A
Determined by an actuary. Determined by an actuary.
Age 60 with 25 years service or at age 65 with 10 years service. Age 60 with 2 years service.
N/A 2 years service.
60% of salary Integrated with CPP. 2.75% per year of service up to 65% of salary. Not integrated with CPP.
Up to 6.00% Up to 5.00%

2010 PROVINCE OF NEW BRUNSWICK 45
NOTES TO THE FINANCIAL STATEMENTS 31 March 2010
Contributions Employee Benefits
Plan
Earnings Up to
YMPE
Earnings Above YMPE
Employer
Unreduced
Benefits
Reduced Benefits
Basic Benefit
Annual Benefit
Indexing H - CUPE
6.17% 6.17% Equal to employee contributions.
Age 60 with 5 years continuous service.
Age 55 with 5 years continuous employment.
1.4% to 1.75% of salary times years service.
2.00%.
H – CBE 6.035% 7.46% Equal to employee contributions.
Age 60 with 5 years continuous service. Normal retirement at age 65.
Age 55 with 5 years continuous employment.
1.3% of salary up to YMPE and 2% of excess of YMPE times years of service.
Up to 4.00%.
Part-Time 2.00%, 3.25% or 4.50%
N/A Equal to employee contributions.
Normal retirement age 65.
N/A Defined contribution plan.
N/A
Ombud This plan has no active members and exists solely to pay benefits to past Ombudsmen or their beneficiaries. The current and future Ombudsmen are members of either the Judges’ or PSSA Plan.
Early Ret The Province has obligations under various early retirement initiatives.
Member a) Members’ Superannuation Plan Applies to Members of the Legislative Assembly who were MLA’s prior to enactment of the Members’ Pension Act. Members contribute 9% of MLA’s indemnity plus 6% of Minister’s salary. Province contributes amount equal to excess of pension payments over member contributions plus interest. Eligible for benefits upon ceasing to be an MLA with at least 10 sessions service. Basic MLA benefits equal 4.5% of average indemnity times number sessions up to final year’s indemnity. Basic Minister’s benefits equal 3% of Ministers’ average salary times years service as a Minister.
b) Members’ Pension Plan Members contribute lesser of amount under MSP and maximum deductible RPP contributions per Income Tax Act. Province contributes amount equal to excess of pension payments over member contributions plus interest. Eligible for benefits at age 60 upon ceasing to be an MLA with minimum 8 sessions service. Supplementary allowance at age 55 with minimum 8 sessions service. Basic MLA benefits equal 2% of average indemnity times sessions served. Additional supplementary allowance of 125% of basic MLA’s pension. Basic Ministers’ benefits equal 2% of Ministers’ average salary times years service as Minister. Additional supplementary allowance of 50% of basic Ministers’ pension amount.
YMPE Year’s Maximum Pensionable Earnings

46 PROVINCE OF NEW BRUNSWICK 2010
NOTES TO THE FINANCIAL STATEMENTS 31 March 2010
b) Pension Liability With the exception of the H - CBE plan and the H - CUPE plan and the Part-Time plan, the Province is liable for any excess of accrued pension benefits over pension fund assets. The H – CBE and H – CUPE plans are defined benefit plans with fixed employer contributions and the Part-Time plan is a defined contribution plan. The Province’s liability related to these plans is limited to its annual contributions to the plans. The Provincial share of the estimated pension surplus for all pension plans is $196.6 million ($210.2 million 2009). This estimate is based on actuarial valuations for accounting purposes using the projected unit credit method, calculated as at the dates listed above. This method estimates the present value of retirement benefits associated with the period of employee service to the valuation date. These actuarial valuations were based on a number of assumptions about future events, such as rates of return on assets, wage and salary increases and employee turnover and mortality. Section d) of this note lists some of the actuarial assumptions used. Section e) lists selected information about plan members.
The value of accrued benefits in all plans exceeds the value of assets resulting in an actuarial pension liability of $867.1 million. However, the calculation of this liability includes estimates of future events and market values of assets which can be volatile. The effects of experience gains and losses on market values and the actuarial liability, as well as effects of assumption changes are amortized over future years. Unamortized experience gains and losses of $1,063.7 million reduce the actuarial liability. c) Summary Pension Information Details of the pension liability, unamortized adjustments, pension expense and change in pension liability are outlined in the following table. The estimated accrued benefits and the value of plan assets reported have been updated to the most recent year end of the applicable pension plan. This was based on a projection of the actuarial assumptions and on actual contribution levels. The plans for hospital and school district employees have 31 December year ends. All other plans have 31 March year ends.
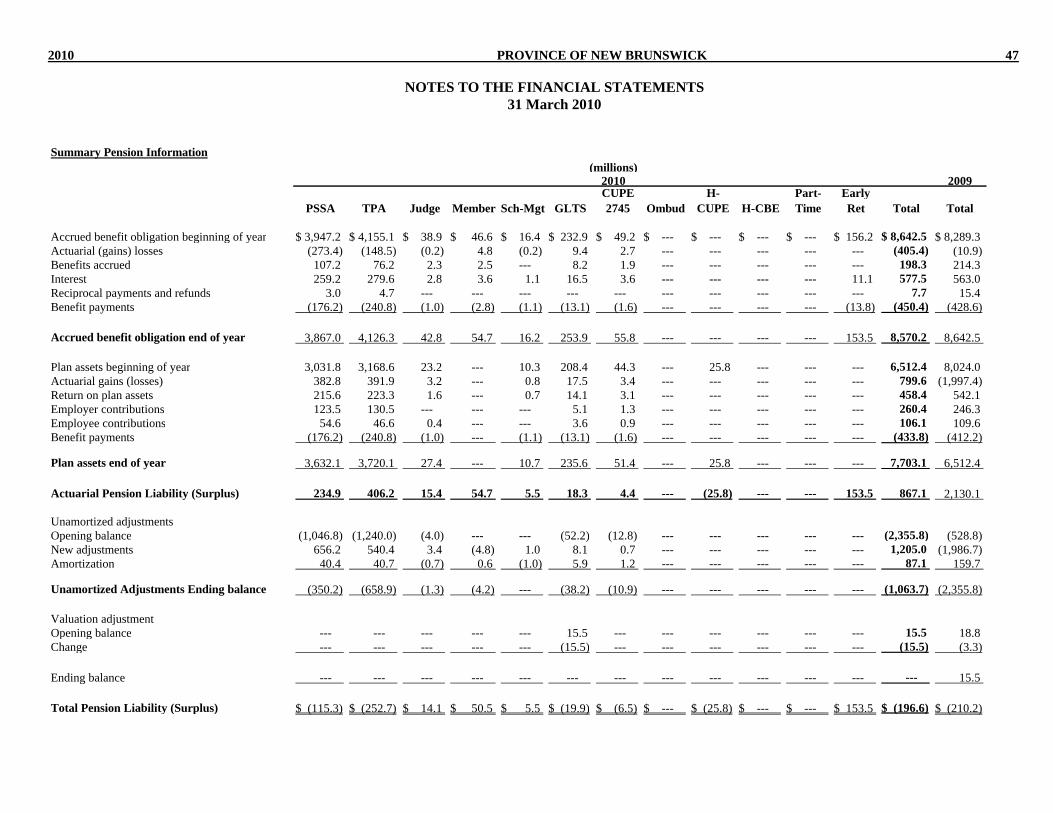
2010 PROVINCE OF NEW BRUNSWICK 47
NOTES TO THE FINANCIAL STATEMENTS 31 March 2010
Summary Pension Information
2009
PSSA TPA Judge Member Sch-Mgt GLTSCUPE 2745 Ombud
H-CUPE H-CBE
Part-Time
Early Ret Total Total
Accrued benefit obligation beginning of year $ 3,947.2 $ 4,155.1 $ 38.9 $ 46.6 $ 16.4 $ 232.9 $ 49.2 $ --- $ --- $ --- $ --- $ 156.2 $ 8,642.5 $ 8,289.3 Actuarial (gains) losses (273.4) (148.5) (0.2) 4.8 (0.2) 9.4 2.7 --- --- --- --- --- (405.4) (10.9)Benefits accrued 107.2 76.2 2.3 2.5 --- 8.2 1.9 --- --- --- --- --- 198.3 214.3 Interest 259.2 279.6 2.8 3.6 1.1 16.5 3.6 --- --- --- --- 11.1 577.5 563.0 Reciprocal payments and refunds 3.0 4.7 --- --- --- --- --- --- --- --- --- --- 7.7 15.4 Benefit payments (176.2) (240.8) (1.0) (2.8) (1.1) (13.1) (1.6) --- --- --- --- (13.8) (450.4) (428.6)
Accrued benefit obligation end of year 3,867.0 4,126.3 42.8 54.7 16.2 253.9 55.8 --- --- --- --- 153.5 8,570.2 8,642.5
Plan assets beginning of year 3,031.8 3,168.6 23.2 --- 10.3 208.4 44.3 --- 25.8 --- --- --- 6,512.4 8,024.0 Actuarial gains (losses) 382.8 391.9 3.2 --- 0.8 17.5 3.4 --- --- --- --- --- 799.6 (1,997.4)Return on plan assets 215.6 223.3 1.6 --- 0.7 14.1 3.1 --- --- --- --- --- 458.4 542.1 Employer contributions 123.5 130.5 --- --- --- 5.1 1.3 --- --- --- --- --- 260.4 246.3 Employee contributions 54.6 46.6 0.4 --- --- 3.6 0.9 --- --- --- --- --- 106.1 109.6 Benefit payments (176.2) (240.8) (1.0) --- (1.1) (13.1) (1.6) --- --- --- --- --- (433.8) (412.2)
Plan assets end of year 3,632.1 3,720.1 27.4 --- 10.7 235.6 51.4 --- 25.8 --- --- --- 7,703.1 6,512.4
Actuarial Pension Liability (Surplus) 234.9 406.2 15.4 54.7 5.5 18.3 4.4 --- (25.8) --- --- 153.5 867.1 2,130.1
Unamortized adjustmentsOpening balance (1,046.8) (1,240.0) (4.0) --- --- (52.2) (12.8) --- --- --- --- --- (2,355.8) (528.8)New adjustments 656.2 540.4 3.4 (4.8) 1.0 8.1 0.7 --- --- --- --- --- 1,205.0 (1,986.7)Amortization 40.4 40.7 (0.7) 0.6 (1.0) 5.9 1.2 --- --- --- --- --- 87.1 159.7
Unamortized Adjustments Ending balance (350.2) (658.9) (1.3) (4.2) --- (38.2) (10.9) --- --- --- --- --- (1,063.7) (2,355.8)
Valuation adjustmentOpening balance --- --- --- --- --- 15.5 --- --- --- --- --- --- 15.5 18.8 Change --- --- --- --- --- (15.5) --- --- --- --- --- --- (15.5) (3.3)
Ending balance --- --- --- --- --- --- --- --- --- --- --- --- --- 15.5
Total Pension Liability (Surplus) $ (115.3) $ (252.7) $ 14.1 $ 50.5 $ 5.5 $ (19.9) $ (6.5) $ --- $ (25.8) $ --- $ --- $ 153.5 $ (196.6) $ (210.2)
2010(millions)
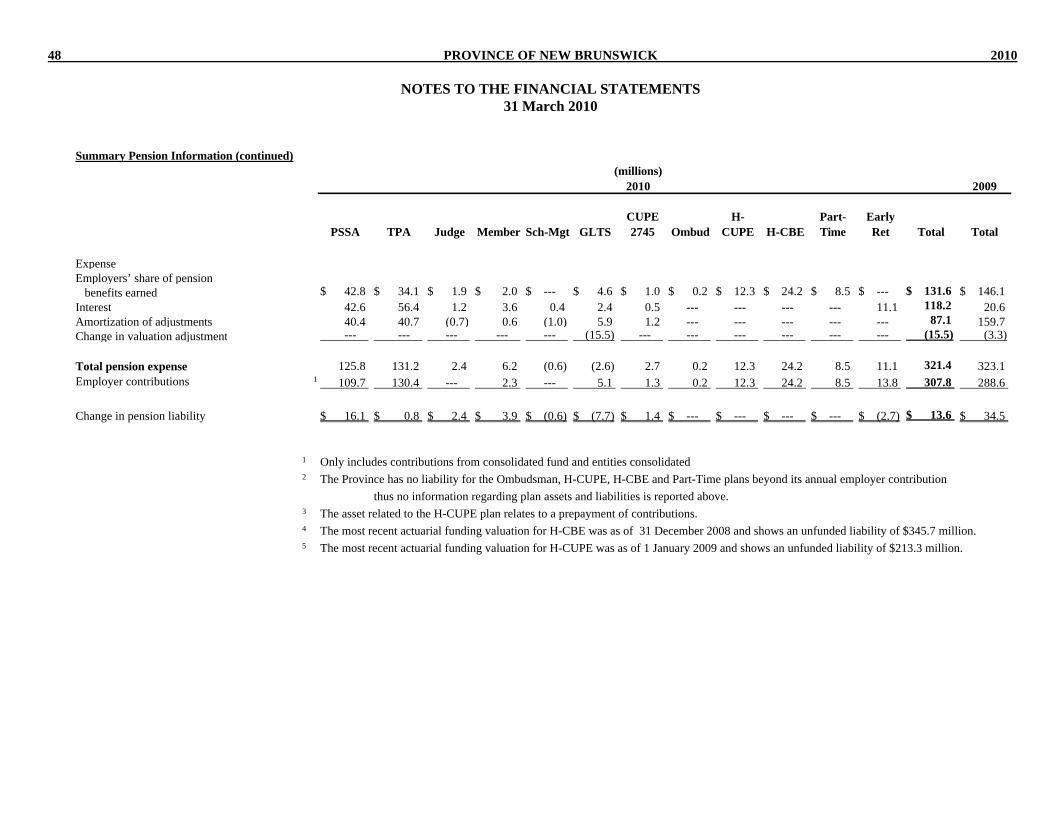
48 PROVINCE OF NEW BRUNSWICK 2010 NOTES TO THE FINANCIAL STATEMENTS 31 March 2010
Summary Pension Information (continued)
2009
PSSA TPA Judge Member Sch-Mgt GLTSCUPE 2745 Ombud
H-CUPE H-CBE
Part-Time
Early Ret Total Total
ExpenseEmployers’ share of pension benefits earned $ 42.8 $ 34.1 $ 1.9 $ 2.0 $ --- $ 4.6 $ 1.0 $ 0.2 $ 12.3 $ 24.2 $ 8.5 $ --- $ 131.6 $ 146.1 Interest 42.6 56.4 1.2 3.6 0.4 2.4 0.5 --- --- --- --- 11.1 118.2 20.6 Amortization of adjustments 40.4 40.7 (0.7) 0.6 (1.0) 5.9 1.2 --- --- --- --- --- 87.1 159.7 Change in valuation adjustment --- --- --- --- --- (15.5) --- --- --- --- --- --- (15.5) (3.3)
Total pension expense 125.8 131.2 2.4 6.2 (0.6) (2.6) 2.7 0.2 12.3 24.2 8.5 11.1 321.4 323.1 Employer contributions 1 109.7 130.4 --- 2.3 --- 5.1 1.3 0.2 12.3 24.2 8.5 13.8 307.8 288.6
Change in pension liability $ 16.1 $ 0.8 $ 2.4 $ 3.9 $ (0.6) $ (7.7) $ 1.4 $ --- $ --- $ --- $ --- $ (2.7) $ 13.6 $ 34.5
1
2
3
4
5
(millions)2010
The most recent actuarial funding valuation for H-CUPE was as of 1 January 2009 and shows an unfunded liability of $213.3 million.
Only includes contributions from consolidated fund and entities consolidatedThe Province has no liability for the Ombudsman, H-CUPE, H-CBE and Part-Time plans beyond its annual employer contribution
thus no information regarding plan assets and liabilities is reported above.The asset related to the H-CUPE plan relates to a prepayment of contributions.The most recent actuarial funding valuation for H-CBE was as of 31 December 2008 and shows an unfunded liability of $345.7 million.

2010 PROVINCE OF NEW BRUNSWICK 49
NOTES TO THE FINANCIAL STATEMENTS 31 March 2010
d) Actuarial Assumptions Calculation of the Province’s employee pension obligations and related pension expenditure is based on long term actuarial assumptions except the Members’ Plan where both short and long term assumptions are used. The table below discloses the assumptions used in the actuarial valuations.
Plan
Rate of Return on Assets (%)
Annual Wage and Salary
Increase (%)
Inflation (%)
Rate of Pension Escalation after Retirement (%)
PSSA 7.12 3.00 plus
promotional increase1
2.50 2.30 to 2.40
TPA 7.12 3.00 plus promotional
increase2
2.50 2.20 to 2.40
Judge 7.12 4.00 2.75 2.55 to 2.65 Sch – Mgt 6.86 3.25 2.50 2.10 GLTS 6.86 2.75 2.50 2.00 CUPE 2745 6.86 2.75 2.50 2.00 Member 6.86 3.00 2.50 2.40
1 Two year wage freeze in 2010-11 and 2011-12. 2 Two year wage freeze in 2012-13 and 2013-14.
These assumptions have been used to determine the amount of the Province’s obligation for pension benefits outstanding and the value of benefits earned by employees during the fiscal year and are based on management’s best estimates. Different assumptions have been used to determine the appropriate level of employee and employer contributions needed to fund the estimated cost of the pension plans. e) Member Data The following table lists data about the members of each plan.
Plan
Estimated Average Remaining Service
Life (Years)
Number of
Active Contributors
Number of Pensioners
Average Annual
Salary of Contributors
Average Annual Pension
PSSA 14 19,692 12,288 $ 58,167 $ 18,997 TPA 16 10,116 8,145 65,982 29,826 Judge 7 32 26 187,954 53,936 Sch – Mgt --- N/A 93 N/A 12,103 GLTS 11 2,178 1,327 32,172 9,147 CUPE 2745 12 828 271 28,774 6,106 Member 8 Member 53 84 85,000 29,081 Minister 26 28 51,460 7,531
The Members’ Pension Plan provides for a benefit based on years of service and salary as a Member and a benefit based on years of service and salary as a Minister. All Ministers are also included as a Member.

50 PROVINCE OF NEW BRUNSWICK 2010 NOTES TO THE FINANCIAL STATEMENTS 31 March 2010
NOTE 14 CONTINGENT LIABILITIES a) Guaranteed Loans The Province has guaranteed certain debt of entities external to the Provincial Reporting Entity under the authority of various statutes. At 31 March 2010, the total contingent liability in respect of these guarantees was $130.0 million ($128.8 million 2009), of which the Province has recognized $39.9 million as a liability in the Statement of Financial Position ($40.6 million 2009).
AuthorizedLimit
ContingentLiability
Agricultural Development Act $ 6.3 $ 6.3 Economic Development Act 147.2 102.5 Employment Development Act 2.0 2.0 Fisheries Development Act 8.8 8.8 Livestock Incentives Act 0.8 0.6 Nursing Homes Act 7.0 7.0 Regional Development Corporation Act 3.8 2.8
130.0 Less: Included in Allowance for Losses (Schedule 8) 39.9
$ 90.1
(millions)
b) New Brunswick Municipal Finance Corporation The New Brunswick Municipal Finance Corporation (NBMFC) is included in the Province’s reporting entity under Note 1. The Province guarantees the payment of principal and interest of any borrowing by NBMFC. In the event of a defaulted payment, the Province shall recover such amounts from the defaulting municipality or from the defaulting municipality that has guaranteed the payment due to the Corporation from the defaulting municipal enterprise. As of December 31, 2009, total debenture debt outstanding was $687.1 million ($612.9 million in 2008). c) New Brunswick Credit Union Deposit Insurance Corporation The New Brunswick Credit Union Deposit Insurance Corporation (NBCUDIC) guarantees the repayment of deposits with the New Brunswick credit unions and caisse populaires. NBCUDIC is included in the Province’s reporting entity as described in Note 1. As of December 31, 2009, deposits of the credit unions and caisse populaires totalled $3,148.0 million ($3,050.7 million in 2008). In addition, NBCUDIC has guaranteed specific losses up to $18.5 million until 2012. A provision has been established for this guarantee and is included in Allowance for Losses in these financial statements. d) Provincial Holdings Ltd. Provincial Holdings Ltd. (PHL) is wholly owned by the Province and is responsible for administering industrial development project investments. Any resulting losses on loans guaranteed by PHL will be borne by the Province. At 31 March 2010, the total loan guarantees authorized totalled $15.0 million with a contingent liability of $12.6 million. A provision related to these guarantees has been included in the Allowance for Losses schedule in these financial statements.

2010 PROVINCE OF NEW BRUNSWICK 51
NOTES TO THE FINANCIAL STATEMENTS 31 March 2010
e) Environmental Responsibility The Province of New Brunswick has an agreement with a mining company to limit the liability of the company to $3.0 million for environmental damages that occurred prior to the company commencing mining at a specified date. The cost to complete this historical reclamation at this site has been estimated at $3.0 million. The Province currently holds a cash security for $3.0 million from this company relating to the clean up. Additional historical reclamation work will be required; however, cost can not be reasonably estimated at this time. f) Insurance The Province does not carry general liability insurance or property insurance on its assets except in a few limited instances. Any successful liability claims against the Province and any replacement of lost or damaged property are charged to expense in the year of settlement or replacement. g) Legal Actions The Province of New Brunswick is involved in various legal proceedings arising from government activities. Amounts totalling $33.1 million have been accrued in these financial statements which represents management’s best estimate of the likely losses due to legal actions. NOTE 15 COMMITMENTS a) Operating Leases The total future minimum payments under various operating lease agreements, including those of government enterprises, for the rental of space and equipment amounts to $485.8 million ($479.4 million 2009). Minimum annual lease payments in each of the next five years are as follows:
Fiscal Year (millions)
2010-2011 $ 83.4 2011-2012 73.6 2012-2013 61.6 2013-2014 47.3 2014-2015 38.6
b) Nursing Homes The Department of Social Development includes in its annual operating budget funding for the repayment of approved long term debt of certain nursing homes. The Department funds the nursing homes through grants which pay the difference between operating expenses and revenue from other sources. Total long term debt of these nursing homes at 31 March 2010 amounted to approximately $171.6 million ($180.4 million 2009). Of the $171.6 million nursing home debt, the Province has issued guarantees totalling approximately $7.0 million ($7.6 million 2009) which is included as a contingent liability.

52 PROVINCE OF NEW BRUNSWICK 2010 NOTES TO THE FINANCIAL STATEMENTS 31 March 2010
c) Contractual Obligations The nature of the government’s activities results in significant multi-year contracts and obligations. The Province currently has outstanding contractual commitments of $1,559.5 million.
(millions) Consolidated Fund Entities $ 1,193.2 Other Government Entities 154.3 Government Enterprises 212.0
Significant commitments and agreements include: Consolidated Fund The Province has committed to the construction and repair of permanent bridges and highways across the Province. These commitments have completion dates throughout the 2010-11 fiscal year. Outstanding contractual commitments as at 31 March 2010 of $114.2 million are included in Contractual Obligations (part c above). The Province has committed to the construction and repair of Route 11. Outstanding contractual commitments as at 31 March 2010 of $5.4 million under this project are included in Contractual Obligations (part c above). The Province signed the National Highways System Agreement (NHSA) with Transport Canada in 2007-08 for a joint contribution, as subsequently amended, of $228.0 million ($114 million of federal and provincial funding respectively) and is scheduled to be completed in 2015. Total costs may exceed $228 million. Expenditures under the agreement up to 31 March 2010 were $83.5 million of which $41.7 million was claimed from Transport Canada. Outstanding contractual commitments as at 31 March 2010 of $61.7 million under this project are included in Contractual Obligations (part c above). The Province has committed to the replacement of Grand Manan, White Head and Deer Island Ferries. Expenditures under the agreement up to 31 March 2010 were $11.7 million. Outstanding contractual commitments as at 31 March 2010 of $55.2 million subject to US exchange rate fluctuations are included in Contractual Obligations (part c above). The Department of Supply and Services is responsible for acquiring, building and maintaining Provincial buildings. Total estimated costs to complete approved projects is $549.5 million, of which $222.1 million has been spent to date. Outstanding contractual commitments as at 31 March 2010 of $116.3 million are included in Contractual Obligations (part c above). The Department of Environment provides funding through the Building Canada Fund – Communities Component. Outstanding contractual commitments as at 31 March 2010 of $22.1 million are included in Contractual Obligations (part c above). $22.1 million in funding is being matched by both the Federal and Municipal levels of government. Communications New Brunswick has committed funds for Advertising, Marketing, Web Content Development and Public Relation Services. Total funds committed include $9.8 million. Expenditures under the contracts incurred up to 31 March 2010 were $2.2 million. Outstanding contractual commitments as at 31 March 2010 of $7.6 million are included in Contractual Obligations (part c above). The Department of Public Safety has committed funds to their Motor Vehicle Modernization project. Outstanding contractual commitments as at 31 March 2010 of $6.8 million are included in Contractual Obligations (part c above). The Department of Finance has committed funds for services related to the management of assets for various pension and trust funds and for tax issues. Outstanding contractual commitments as at 31 March 2010 of $5.2 million are included in Contractual Obligations (part c above).
2010 PROVINCE OF NEW BRUNSWICK 53
NOTES TO THE FINANCIAL STATEMENTS 31 March 2010
The Department of Supply and Services has committed funds to lease the Fredericton Downtown Office Building. The office building is scheduled to open April, 2011. The lease term is for 20 years and the total contractual obligation is $62.0 million and is included in Contractual Obligations (part c above). The Department of Social Development has committed funds for the construction and repair of Social Housing units. Outstanding contractual commitments as at 31 March 2010 of $7.5 million are included in contractual obligations (part c above). Of the $7.5 million, $4.7 million relates to new construction contracts and $2.8 million relates to renovations of existing housing units. The Province has committed funds for the construction and repair of universities in New Brunswick. Outstanding contractual commitments as at 31 March 2010 of $31.6 million are included in Contractual Obligations (part c above). Other Government Entities The Province through Ambulance New Brunswick Inc has entered into a ten year contract with New Brunswick EMS Inc. (NB EMS) for management of ambulance services in New Brunswick. The contract terminates on 31 March 2017. The total amount over the next year is estimated to be $26.3 million. The total annual payments for the remaining contract term have not yet been finalized. The payments will be based on the annual baseline budget of $26.3 million with adjustments for inflation and other items. Regional Health Authority B has an agreement with GE Healthcare for service support requirements of diagnostic imaging equipment in the amount of $7.8 million. As at 31 March 2010, the outstanding commitment is $3.3 million and is included in Contractual Obligations (part c above). The Province through the New Brunswick Highway Corporation has entered into an agreement for the operations, maintenance and rehabilitation (OMR) of the Fredericton to Moncton Highway with Maritime Road Development Corporation. The agreement terminates in 2027. The annual payments are fixed for the first 20 years with adjustments for inflation and other items as per provisions of the agreement. The OMR payment is negotiable for the final ten years. The total amount for next year is $10.5 million and is included in Contractual Obligations (part c above). The Province through the New Brunswick Highway Corporation has entered into an agreement for the operations, maintenance and rehabilitation of the Trans Canada Highway from the Quebec Border to Longs Creek with Brun-way Highways Operations Inc. The agreement terminates in 2033. The annual payments are based on an annual fixed price of $18.8 million (in 2005 dollars) with adjustments for inflation and other items as per provisions of the agreement. The total amount for the next year is $20.5 million and is included in Contractual Obligations (part c above). The Province through the New Brunswick Highway Corporation entered into an agreement with Transfield Dexter Gateway Services Limited to operate, maintain and rehabilitate (OMR) Route 1 between St. Stephen and River Glade. The annual OMR price is $19.8 million (in 2010 dollars) to be adjusted annually for inflation and other items as per provisions of the agreement. Payments are expected to commence in June 2011 with fully annualized OMR payments to begin in fiscal 2013-14. The agreement terminates in June 2040. Regional Development Corporation has funds committed to various development initiatives. Outstanding contractual commitments as at 31 March 2010 of $93.7 million are included in Contractual Obligations (part c above).

54 PROVINCE OF NEW BRUNSWICK 2010 NOTES TO THE FINANCIAL STATEMENTS 31 March 2010
Government Enterprises The New Brunswick Power Holding Corporation will refurbish the Point Lepreau Generating Station. Total construction cost, excluding fuel and purchased power costs, are budgeted at approximately $1.2 billion. Expenditures to 31 March 2010 were $1.0 billion. As at 31 March 2010, the outstanding commitment is $212 million. Public Private Partnerships (PPP) The Province has formed PPPs for the construction and operation of the new Moncton Courthouse and for two schools (Eleanor Graham and Moncton North). The two schools are scheduled to open in 2010, while the Moncton Courthouse is scheduled to be completed November 2010. At March 31, 2010 the Department of Supply and Services had outstanding contractual obligations for the two school projects totalling $44.1 million and for the Moncton Courthouse of $56.0 million and are included in Contractual Obligations (part c above). The Province through the New Brunswick Highway Corporation has entered into a design-build (DB) agreement for a guaranteed maximum construction price of $580.3 million (GMP) (included in Contractual Obligations, part c above), subject to adjustments per the agreement with Dexter Developer General Partnership to design, build and finance approximately 55 kilometres of new four-lane divided highway between Murray Road and Lepreau on Route 1 and to design, complete and finance certain upgrades to the existing four-lane sections of Route 1 between St. Stephen and River Glade along the 235 kilometres of Route 1 corridor. The total GMP will be paid out over three years, commencing 2011-12 dependent on completion of various sections of the corridor. The estimated amount for 2011-12 is $11.6 million which will be cost shared 50/50 with the Federal Government. The Province signed agreements with the Federal Government for an overall joint contribution of $420.0 million for the Route 1 Gateway Project.

2010 PROVINCE OF NEW BRUNSWICK 55
NOTES TO THE FINANCIAL STATEMENTS 31 March 2010
NOTE 16 SEGMENT REPORTING
2010 2009 2010 2009 2010 2009 2010 2009 2010 2009Revenue
Tax Revenue 3,243.9$ 3,252.8$ ---$ ---$ ---$ ---$ ---$ ---$ 3,243.9$ 3,252.8$ Non Tax Revenue 614.9 666.1 97.0 92.0 65.5 61.3 --- --- 777.4 819.4 Government Enterprises --- --- --- --- 68.0 314.0 --- --- 68.0 314.0 Transfers Between Entities --- --- 1,662.0 1,607.5 188.4 131.4 (1,850.4) (1,738.9) --- --- Conditional Federal Grants 379.0 349.4 28.8 27.1 --- --- --- --- 407.8 376.5 Unconditional Federal Grants 2,492.8 2,350.1 --- --- --- --- --- --- 2,492.8 2,350.1
6,730.6 6,618.4 1,787.8 1,726.6 321.9 506.7 (1,850.4) (1,738.9) 6,989.9 7,112.8
ExpensesEmployee Benefits 1,782.8 1,786.2 1,289.3 1,222.7 151.0 110.6 (0.5) (0.2) 3,222.6 3,119.3 Other Services 604.7 581.8 42.1 104.9 58.5 53.7 (20.0) (20.0) 685.3 720.4 Materials and Supplies 166.5 186.5 346.7 284.1 9.7 11.8 --- (0.1) 522.9 482.3 Property and Equipment 84.3 26.9 45.3 52.0 21.1 1.0 (49.7) (22.7) 101.0 57.2 Grants and Subsidies 3,957.7 3,553.1 --- --- --- --- (1,795.2) (1,682.5) 2,162.5 1,870.6 Debt and Other Charges 741.2 771.7 --- --- 1.2 3.6 --- --- 742.4 775.3 Amortization 219.2 204.7 60.3 63.2 11.6 12.1 --- --- 291.1 280.0
7,556.4 7,110.9 1,783.7 1,726.9 253.1 192.8 (1,865.4) (1,725.5) 7,727.8 7,305.1
Surplus (Deficit) (825.8)$ (492.5)$ 4.1$ (0.3)$ 68.8$ 313.9$ 15.0$ (13.4)$ (737.9)$ (192.3)$
EliminationsDepartments
TotalRegional Health
Authorities Agenciesand Some Agencies
(millions)Government
ConsolidatedInteraccountOther Crowns and

56 PROVINCE OF NEW BRUNSWICK 2010
NOTES TO THE FINANCIAL STATEMENTS 31 March 2010
Note 16 is intended to provide supplementary information on the province’s revenue and expenses by segment. The segments have been defined based on the accountability and control relationships between the Government and the various organizations within the reporting entity. Although the government controls all the entities included, there are varying levels of accountability. The segments are defined as: Government Departments and Some Agencies; Regional Health Authorities; and Other Crowns and Agencies. An Interaccount Eliminations column is added to eliminate double counting between columns and to reconcile to the Statement of Operations. Eliminations between the Province and entities impact asset and liability accounts with respect to tangible capital assets and deferred contributions from the Province. The extent of these items was $15.0 million in the 2010 fiscal year ($13.4 million in 2009). The Government Departments and Some Agencies segment represents the group most directly accountable to the Board of Management and Cabinet. The segment includes all line departments such as Health, Education and Transportation as well as the following agencies: Energy Efficiency and Conservation Agency of New Brunswick, Regional Development Corporation, New Brunswick Distance Education Network Inc., New Brunswick Highway Corporation, New Brunswick Housing Corporation, Sport Development Trust Fund and Arts Development Trust Fund. The Regional Health Authorities (RHA’s) are disclosed separately due to the magnitude of their operations and the fact they are somewhat removed from day to day control of the Board of Management and Cabinet. Other Crowns and Agencies are also somewhat removed and independent with respect to day to day operations yet still controlled by government under the Public Sector Accounting Board’s criteria for control. The organizations included in this segment include: New Brunswick Lotteries and Gaming Corporation, New Brunswick Electric Finance Corporation, New Brunswick Liquor Corporation, New Brunswick Municipal Finance Corporation, New Brunswick Power Group and New Brunswick Securities Commission. Also included with other agencies are the following entities which are consolidated in the Province’s financial statements: Algonquin Golf Limited, Algonquin Properties Limited, Ambulance New Brunswick Inc., FacilicorpNB Ltd., Forest Protection Limited, New Brunswick Health Council, Kings Landing Corporation, New Brunswick Legal Aid Services Commission, New Brunswick Investment Management Corporation, New Brunswick Credit Union Deposit Insurance Corporation, Recycle New Brunswick and Service New Brunswick.

2010 PROVINCE OF NEW BRUNSWICK 57
NOTES TO THE FINANCIAL STATEMENTS 31 March 2010
NOTE 17 TRUST FUNDS The Province is trustee for various trust funds outside the Provincial Reporting Entity. The following is a summary of the trust fund equities calculated using the method indicated below to value investment assets:
2010 2009Cost Method:
Margaret R. Lynds Bequest $ 0.1 $ 0.1 Mental Health Trust Fund 1.1 1.1 Viscount Bennett Bequest 0.2 0.2
$ 1.4 $ 1.4
Market Value Method:
Judges' Superannuation Fund $ 27.3 $ 23.3 Office of the Public Trustee Trust Fund 4.5 2.6 Pension Plan for the Management Employees of New Brunswick School Districts 10.8 10.5 Pension Plan for General Labour, Trades and Services Employees of New Brunswick School Districts 235.6 208.4 Pension Plan for Full-Time CUPE 2745 Employees of New Brunswick School DistrictsPublic Service Superannuation Fund 4,604.6 3,854.5 Teachers' Pension Trust Fund 3,713.8 3,156.9
$ 8,648.1 $ 7,300.6
(millions)
51.5 44.4
The Margaret R. Lynds Bequest awards three annual scholarships of equal value to students pursuing the study of communications at specified universities. The Mental Health Trust Fund is used to pay for psychoanalysis treatment of deserving New Brunswick residents. The income from the Viscount Bennett Bequest is used to develop the Province's historic resources. The Public Trustee of New Brunswick protects the financial and personal interests of the elderly, the mentally challenged, children, missing or deceased persons, when there is no one else able and willing to do so. NOTE 18 COMPARATIVE FIGURES Certain 2009 figures have been restated to conform to 2010 presentation.

58 PROVINCE OF NEW BRUNSWICK 2010
SCHEDULES TO THE FINANCIAL STATEMENTS31 March 2010
(millions)2010 2009
SCHEDULE 1SHORT TERM BORROWING NET OF CASH
Short Term Investments 744.7$ 943.3$ Cash 35.5 13.3
780.2 956.6 Less:
Treasury Bills 0.15% - 0.59% Maturing 1 April 2010 - 18 November 2010 1,313.1 1,025.8
(532.9)$ (69.2)$
SCHEDULE 2RECEIVABLES AND ADVANCES
Accounts Receivable General Receivables 258.7$ 270.4$
Due from Federal Government Central Government Services 50.4 69.1 Transportation 46.0 6.6 Economic Development 45.1 32.8 Education 28.7 49.5 Health 0.7 1.3 Harmonized Sales Tax Rebate 24.4 12.6 Unconditional Grants --- 0.2 Other 9.2 9.9
204.5 182.0
Guarantee Payouts 149.0 94.7
Advances Advances of Grants 37.6 13.0 Working Capital Advances 6.1 7.4 Other 16.1 3.1
59.8 23.5 Interest Receivable Economic Development Act 12.2 8.0 Student Loans 10.8 10.0 Fisheries Development Act 7.9 8.7 Agricultural Development Act 0.1 0.1 Other 30.0 25.3
61.0 52.1
733.0 622.7 Less: Allowance for Doubtful Accounts (306.0) (244.0)
427.0$ 378.7$

2010 PROVINCE OF NEW BRUNSWICK 59
SCHEDULES TO THE FINANCIAL STATEMENTS31 March 2010
(millions)2010 2009
SCHEDULE 3TAXES RECEIVABLE
Real Property Tax 961.0$ 911.0$ Sales Tax 97.4 154.5 Tobacco Tax 23.8 21.7 Gasoline and Motive Fuels Tax 17.2 17.7 Royalties and Stumpage on Timber 8.5 10.8 Other 4.1 7.2
1,112.0 1,122.9 Less: Allowance for Doubtful Accounts 61.8 56.5
1,050.2$ 1,066.4$
SCHEDULE 4INVENTORIES FOR RESALE
Inventories for Resale Properties Held for Sale 9.3$ 8.6$

60 PROVINCE OF NEW BRUNSWICK 2010
SCHEDULES TO THE FINANCIAL STATEMENTS31 March 2010
2010 2009Allowance Allowance
for Doubtful for DoubtfulAmount Accounts Net Amount Accounts Net
SCHEDULE 5LOANS
Loans to Students 391.0$ 80.7$ 310.3$ 369.2$ 74.1$ 295.1$ Economic Development Act 303.6 175.3 128.3 246.3 164.6 81.7 New Brunswick Housing Act 35.9 3.8 32.1 35.5 4.7 30.8 Energy Efficiency Upgrade Loans 11.1 0.5 10.6 7.3 0.5 6.8 Fisheries Development Act 35.2 26.1 9.1 36.4 27.6 8.8 Agricultural Development Act 11.2 3.3 7.9 5.4 2.5 2.9 L'Office de Stabilisation 4.1 --- 4.1 4.1 --- 4.1 Loans to Municipalities 3.4 --- 3.4 5.4 --- 5.4 Fundy Trail Endowment Fund 3.3 --- 3.3 3.1 --- 3.1 Beaverbrook Art Gallery 6.6 6.6 --- 6.6 6.6 --- La Fondation du quotidien francophone 4.0 4.0 --- 4.0 4.0 --- Provincial Holdings Ltd. 2.6 2.6 --- 2.9 2.9 --- Unsatisfied Judgements 9.5 9.5 --- 9.5 9.5 --- Other Loans 0.9 0.9 --- 1.1 0.9 0.2
822.4$ 313.3$ 509.1$ 736.8$ 297.9$ 438.9$
(millions)

2010 PROVINCE OF NEW BRUNSWICK 61
SCHEDULES TO THE FINANCIAL STATEMENTS31 March 2010
(millions)2010 2009
SCHEDULE 6INVESTMENTS
Investment in Government Enterprises New Brunswick Liquor Corporation 22.1$ 23.7$ New Brunswick Securities Commission 4.2 3.3 New Brunswick Municipal Finance Corporation 1.0 0.9 New Brunswick Lotteries and Gaming Corporation 0.2 1.4 New Brunswick Electric Finance Corporation (226.5) (19.1)
(199.0) 10.2 Other Long Term Investments 24.6 24.0
(174.4)$ 34.2$
SCHEDULE 7ACCOUNTS PAYABLE AND ACCRUED EXPENSES
Accounts Payable 465.2$ 448.2$ Due to Canada Equalization and Canada Health and Social Transfer 125.0 145.8 Canada Mortgage and Housing Corporation 36.5 37.9 Other Agreements 1.5 0.9
163.0 184.6
Accrued Interest Funded Debt 112.0 118.6 Other 79.0 87.0
191.0 205.6
Employee Benefits Retirement Allowances 315.0 311.6 Accrued Salaries Payable 257.5 270.8 Liability for Injured Workers 133.9 135.6
706.4 718.0
Municipal Property Taxes Due to Municipalities 385.8 364.3 Medicare and Out of Province Payments 28.9 42.2 Strategic Assistance 21.4 22.3 Holdbacks on Contracts 17.7 14.0 Hospital Liability Protection Plan 14.0 14.8 Other 106.9 72.3
574.7 529.9 2,100.3$ 2,086.3$

62 PROVINCE OF NEW BRUNSWICK 2010
SCHEDULES TO THE FINANCIAL STATEMENTS31 March 2010
(millions)2010 2009
SCHEDULE 8ALLOWANCE FOR LOSSES
Business New Brunswick 30.3$ 46.4$ Property Tax Appeals 20.8 23.4 Post-Secondary Education, Training and Labour 0.1 0.1 Other 44.3 31.9
95.5$ 101.8$
SCHEDULE 9DEFERRED REVENUE
Real Property Taxes 323.1$ 316.7$ Motor Vehicle and Operators' Licenses 50.2 45.3 Deferred Federal Revenue 10.8 4.7 Other 44.6 30.9
428.7$ 397.6$
SCHEDULE 10DEPOSITS HELD IN TRUST
Retention Fund for Fee for Service Physicians 23.8$ 19.5$ Tenants' Security Deposits 17.6 16.3 Court of Queen's Bench 11.0 9.8 Mining Licenses - Non-Performance Renewal Fees 7.3 8.7 Contractors' Deposits 6.5 2.7 Scholarship Trusts 3.7 3.6 Sale of Property for Taxes 1.3 1.3 Family Support Order Services 1.3 1.2 Other 26.2 15.0
98.7$ 78.1$

2010 PROVINCE OF NEW BRUNSWICK 63
SCHEDULES TO THE FINANCIAL STATEMENTS31 March 2010
2010 2009
SCHEDULE 11OBLIGATIONS UNDER CAPITAL LEASES
New Brunswick Highway Corporation 736.4$ 756.6$ Miramichi Youth Facility 16.1 16.5 Moncton North School 5.9 6.2 Other 7.1 6.6
765.5$ 785.9$
SCHEDULE 12INVENTORIES OF SUPPLIES
Construction and Maintenance Materials 14.6$ 13.1$ Health Supplies and Vaccines 12.8 4.9 Machine Repair Parts 6.9 6.4 Stationery and Supplies 2.2 1.8 Educational Textbooks 1.3 1.1 Veterinary Supplies 1.0 0.8 Other Supplies 24.0 23.6
62.8$ 51.7$
SCHEDULE 13PREPAID AND DEFERRED CHARGES
Unamortized Premiums, Discounts, and Issue Expenses on Debentures 84.4$ 68.8$ Other 18.8 16.6
103.2$ 85.4$
(millions)

64 PROVINCE OF NEW BRUNSWICK 2010
SCHEDULES TO THE FINANCIAL STATEMENTS31 March 2010
(millions)2010 2010 2009
Budget Actual Actual
SCHEDULE 14TAXES
Personal Income Tax 1,224.0$ 1,295.5$ 1,323.0$ Corporate Income Tax 171.6 200.3 111.4 Metallic Minerals Tax 19.0 32.5 4.7
1,414.6 1,528.3 1,439.1
Provincial Real Property Tax 404.0 411.9 385.3
Harmonized Sales Tax 999.0 932.5 1,060.8 Gasoline and Motive Fuels Tax 199.0 198.1 195.1 Tobacco Tax 90.0 102.6 103.7 Pari-mutuel Tax 0.1 0.1 0.1
1,288.1 1,233.3 1,359.7
Insurance Premium Tax 41.5 42.4 41.2 Financial Corporation Capital Tax 7.0 12.7 7.4 Large Corporation Capital Tax --- 9.2 13.5 Other 6.8 6.1 6.6
55.3 70.4 68.7 3,162.0$ 3,243.9$ 3,252.8$
SCHEDULE 15LICENSES AND PERMITS
Motor Vehicle 101.6$ 104.2$ 95.0$ Fish and Wildlife 5.4 5.9 5.4 Mines 1.5 4.3 2.1 Liquor Licenses 1.2 0.9 0.9 Other 13.6 13.7 13.2
123.3$ 129.0$ 116.6$
SCHEDULE 16ROYALTIES
Forest 34.1$ 28.8$ 40.4$ Mines 39.0 10.8 39.1
73.1$ 39.6$ 79.5$

2010 PROVINCE OF NEW BRUNSWICK 65
SCHEDULES TO THE FINANCIAL STATEMENTS31 March 2010
(millions)2010 2010 2009
Budget Actual Actual
SCHEDULE 17INVESTMENT INCOME
Net Income of Government Enterprises New Brunswick Liquor Corporation 160.3$ 157.9$ 152.7$ New Brunswick Lotteries and Gaming Corporation 122.0 115.9 120.6 New Brunswick Securities Commission 5.2 6.3 6.1 New Brunswick Municipal Finance Corporation --- 0.1 (0.2) New Brunswick Electric Finance Corporation (61.0) (212.2) 34.4
226.5 68.0 313.6Other Investment Income 39.0 38.6 43.7
265.5$ 106.6$ 357.3$
SCHEDULE 18OTHER PROVINCIAL REVENUE
Sales of Goods and Services General 230.0$ 221.5$ 209.3$ Institutional 28.1 27.2 28.2 Leases and Rentals 21.2 22.3 21.0 Intergovernmental 8.5 8.8 8.3 Provincial Parks 4.4 5.0 4.4 Fines and Penalties 11.2 13.9 14.5 Other Revenue 48.6 55.1 61.0
352.0$ 353.8$ 346.7$
SCHEDULE 19UNCONDITIONAL GRANTS
Canada Health Transfer 557.0$ 554.8$ 529.4$ Canada Social Transfer 242.1 241.1 235.0 Wait Times Reduction Transfer 5.6 5.6 --- Statutory Subsidies 1.9 1.9 1.9
806.6$ 803.4$ 766.3$

66 PROVINCE OF NEW BRUNSWICK 2010
SCHEDULES TO THE FINANCIAL STATEMENTS31 March 2010
(millions)2010 2010 2009
Budget Actual Actual
SCHEDULE 20CONDITIONAL GRANTS
Education 147.4$ 172.4$ 142.3$ Economic Development 118.5 94.3 60.5 Central Government Services 38.0 45.4 37.3 Health 41.3 39.9 58.3 Amortization of Deferred Capital Contributions 30.6 34.6 30.9 Social Services 4.9 4.8 22.1 Transportation 0.3 0.9 0.7 Other 10.7 15.5 24.3
391.7$ 407.8$ 376.4$
SCHEDULE 21EDUCATION AND TRAINING
Education 985.8$ 979.6$ 966.4$ Maritime Provinces Higher Education Commission 289.0 289.8 123.4 Post-Secondary Education, Training and Labour 194.5 169.5 162.7 Pension Expense 207.0 130.5 121.6 Amortization Expense 31.8 30.8 29.2 Provision Expense 12.4 19.9 27.8 Supply and Services 6.0 4.9 4.9 Atlantic Education International Inc. 1.3 1.8 1.3 General Government 0.7 (5.1) 14.7
1,728.5$ 1,621.7$ 1,452.0$
SCHEDULE 22HEALTH
Regional Health Authorities 1,688.9$ 1,691.4$ 1,637.3$ Health 595.5 650.2 621.2 Ambulance New Brunswick Inc. 79.4 78.0 71.9 Amortization Expense 65.2 66.0 69.4 FacilicorpNB 58.4 60.2 8.2 Pension Expense 34.6 36.6 35.8 New Brunswick Health Council 2.0 1.7 1.0 Supply and Services --- 0.9 0.9
2,524.0$ 2,585.0$ 2,445.7$

2010 PROVINCE OF NEW BRUNSWICK 67
SCHEDULES TO THE FINANCIAL STATEMENTS31 March 2010
(millions)2010 2010 2009
Budget Actual Actual
SCHEDULE 23SOCIAL DEVELOPMENT
Social Development 945.2$ 967.4$ 935.8$ Provision Expense 4.0 3.8 3.6 General Government 1.1 1.1 1.1 Amortization Expense 1.1 1.1 1.1
951.4$ 973.4$ 941.6$
SCHEDULE 24PROTECTION SERVICES
Public Safety 138.5$ 143.2$ 161.5$ Justice 36.0 38.4 34.1 Attorney General 16.7 16.1 15.8 New Brunswick Legal Aid Services Commission 6.9 7.6 7.8 Pension Expense 2.8 2.5 1.0 Provision Expense 0.3 1.0 3.0 General Government 0.4 0.3 0.3 New Brunswick Credit Union Deposit Insurance Corporation 0.1 0.2 0.2 Amortization Expense --- 0.1 0.1
201.7$ 209.4$ 223.8$
SCHEDULE 25ECONOMIC DEVELOPMENT
Regional Development Corporation 217.3$ 206.4$ 139.0$ Provision Expense 20.0 67.0 79.1 Tourism and Parks 33.7 33.5 33.7 Business New Brunswick 56.8 33.0 31.5 Kings Landing Corporation --- 3.3 3.3 Amortization Expense 1.1 1.4 1.3
328.9$ 344.6$ 287.9$
SCHEDULE 26LABOUR AND EMPLOYMENT
Post-Secondary Education, Training and Labour 125.9$ 140.9$ 123.8$ General Government 0.6 0.6 0.6
126.5$ 141.5$ 124.4$

68 PROVINCE OF NEW BRUNSWICK 2010
SCHEDULES TO THE FINANCIAL STATEMENTS31 March 2010
(millions)2010 2010 2009
Budget Actual Actual
SCHEDULE 27RESOURCES
Natural Resources 90.2$ 90.3$ 85.1$ Agriculture and Aquaculture 37.2 34.9 35.3 Environment 21.8 21.1 23.1 Energy Efficiency and Conservation Agency of New Brunswick 14.6 14.1 12.9 Forest Protection Limited 5.7 5.8 5.2 Energy 4.0 4.0 4.2 Fisheries 4.8 4.0 3.9 Recycle New Brunswick 4.0 4.0 3.8 Provision Expense 0.3 3.5 2.6 Amortization Expense 0.6 1.2 1.1 Supply and Services --- 0.7 0.2
183.2$ 183.6$ 177.4$
SCHEDULE 28TRANSPORTATION
Transportation 224.0$ 224.7$ 235.6$ Amortization Expense 174.0 175.6 163.5 Supply and Services --- 0.4 0.3 Provision Expense 0.3 (0.2) 0.4
398.3$ 400.5$ 399.8$

2010 PROVINCE OF NEW BRUNSWICK 69
SCHEDULES TO THE FINANCIAL STATEMENTS31 March 2010
(millions)2010 2010 2009
Budget Actual Actual
SCHEDULE 29CENTRAL GOVERNMENT
Pension Expense 250.1$ 151.6$ 164.5$ Supply and Services 127.1 129.0 116.6 Local Government 117.2 114.9 113.7 General Government 97.9 65.7 80.9 Service New Brunswick 61.3 56.6 56.2 Legislative Assembly 20.5 21.7 25.4 Wellness, Culture and Sport 20.6 20.9 21.6 Amortization Expense 9.2 14.8 14.5 Finance 12.8 12.6 13.5 New Brunswick Investment Management Corporation 11.7 11.3 11.5 Algonquin Golf and Algonquin Properties Ltd. 10.2 9.5 10.4 Provision Expense 6.0 22.7 (0.4) Executive Council 5.5 5.4 5.5 Office of Human Resources 5.4 5.3 5.7 Office of the Comptroller 4.5 4.3 4.2 Intergovernmental Affairs 3.6 3.5 4.5 Office of the Premier 1.7 1.7 1.7
765.3$ 651.5$ 650.0$