Embed Size (px)
Citation preview

20
20
GC
WW
WA
TE
R Q
UA
LIT
Y R
EP
OR
T
Our Most Essential Resource
Using the most advanced technology to bringyou the cleanest, highest quality...

Where Your Water Comes FromGCWW supplies water from two sources: the Ohio River and the Great Miami Buried Valley Aquifer (GMBVA). Surface water from the Ohio River is treated at the Richard Miller Treatment Plant. This plant, located on the east side of Hamilton County, supplies about 88% of drinking water to GCWW’s customers. The Charles M. Bolton Treatment Plant treats groundwater from 13 wells in the GMBVA. It is located in the southern part of Butler County and supplies about 12% of drinking water to GCWW customers.
I-75I-71
I-275
I-275
I-275
I-75 • I
-71
I-74
I-74
I-471
I-275
I-275I-71
I-75
Ohio River
Pierce Twp.
Clermont County
Ham
ilton
Cou
nty
Union Twp.
CVG Airport
City ofMason
Village ofSouth Lebanon
City of Lebanon
Warren CountyBu
tler C
ount
yClermont County
City of Norwood
City of Reading
HebronPetersburg
Burlington
City ofFlorence
City ofWalton
Verona
Belleview
Hathaway
Boon
e Co
unty
Kent
on C
ount
y
Rabbit Hash
Butler County
Dear
born
Cou
nty,
INHa
milt
on C
ount
y, O
H
East Fork
LunkenAirport
City of Cincinnati (Retail Service Area)
GCWW Retail Service Areas
Wholesale Areas
County Boundaries
Service Area Map
Only Your Tap Water Delivers These Protective BenefitsProtection of Public Health and Welfare
A safe water supply is critical to protecting public health. In the United States, water utilities monitor for more than 100 contaminants and must meet close to 90 regulations for water supply and quality. The same system of water mains, pumps and storage tanks transports water to home faucets and fire hydrants.
GCWW also takes great care to protect your water supply from chemical spills into the Ohio River that may contaminate the drinking water supply. GCWW has the ability to shut down river intake pumping, utilize stored and supplementary water until the spill passes, and use advanced treatment systems to remove contaminants.
2 3
2 0 2 0 G C W W WAT E R Q UA L I T Y R E P O R T
Greater Cincinnati Water Works (GCWW) supplies an average of more than 43-billion gallons of water each year through more than 3,180 miles of water mains to more than 240,000 residential and commercial accounts, representing more than 1.1 million customers. The GCWW service area has grown to include the entire City of Cincinnati, most of Hamilton County and parts of Butler, Warren and Clermont Counties in Ohio, and Boone County in Kentucky.
Sources of Your Drinking WaterThe sources of drinking water - both tap and bottled - include rivers, lakes, streams, ponds, reservoirs, springs and wells. As water travels over the surface of the land or through the ground, it dissolves naturally-occurring minerals (in some cases radioactive material) and can pick up substances resulting from the presence of animals or from human activity. As with all surface waters, the Ohio EPA has classified the Ohio River as highly susceptible to potential contamination. The Ohio EPA has also classified our portion of the Great Miami Buried Valley Aquifer as highly susceptible to contamination due to lack of an overlaying protective clay layer, the presence of low levels of nitrate in the groundwater, and the presence of nearby potential contaminant sources.
Contaminants that may be present in source water include:
• Microbial contaminants, such as viruses and bacteria, which may come from sewage treatment plants, septic systems, agricultural livestock operations and wildlife;
• Inorganic contaminants, such as salts and metals, which can be naturally-occurring or result from urban stormwater runoff, industrial or domestic wastewater discharges, oil and gas production, mining or farming;
• Pesticides and herbicides, which may come from variety of sources such as agriculture, urban stormwater runoff and residential uses;
• Organic chemical contaminants, including synthetic and volatile organic chemicals, which
are byproducts of industrial processes and petroleum production, and can also come from gas stations, urban stormwater runoff, and septic systems; and
• Radioactive contaminants, which can be naturally-occurring or the result of oil and gas production and mining activities.
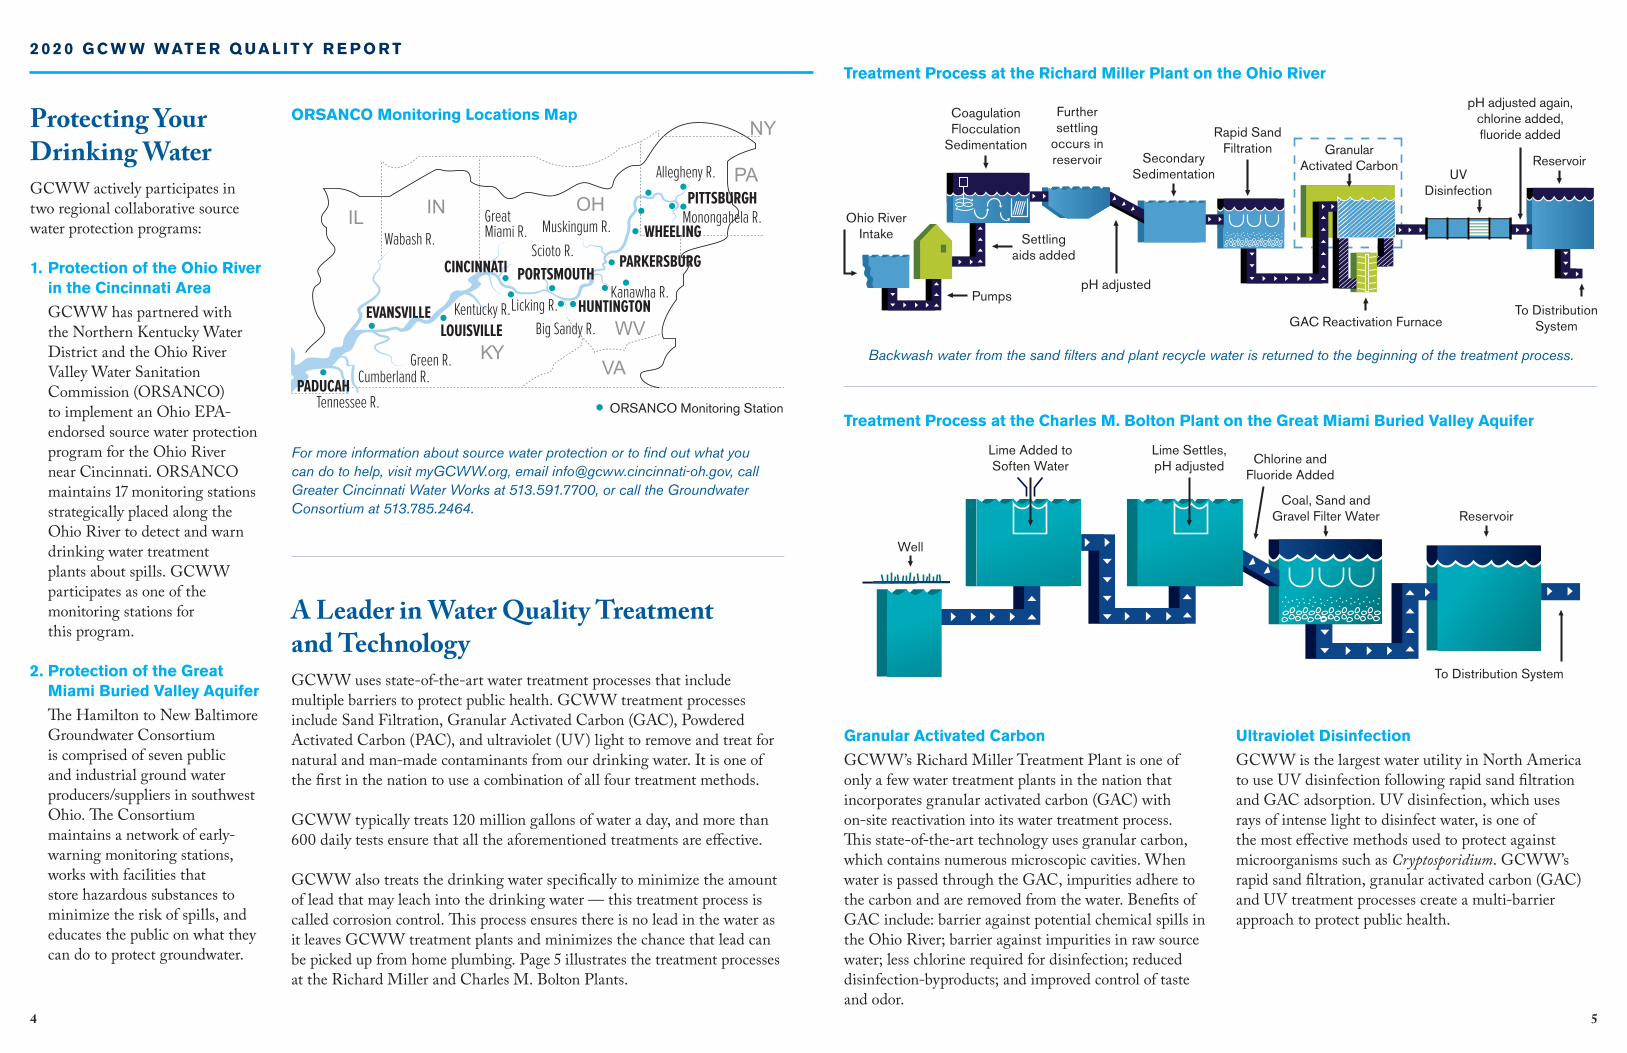
Protecting Your Drinking WaterGCWW actively participates in two regional collaborative source water protection programs:
1. Protection of the Ohio River in the Cincinnati Area GCWW has partnered with the Northern Kentucky Water District and the Ohio River Valley Water Sanitation Commission (ORSANCO) to implement an Ohio EPA-endorsed source water protection program for the Ohio River near Cincinnati. ORSANCO maintains 17 monitoring stations strategically placed along the Ohio River to detect and warn drinking water treatment plants about spills. GCWW participates as one of the monitoring stations for this program.
2. Protection of the Great Miami Buried Valley Aquifer The Hamilton to New Baltimore Groundwater Consortium is comprised of seven public and industrial ground water producers/suppliers in southwest Ohio. The Consortium maintains a network of early-warning monitoring stations, works with facilities that store hazardous substances to minimize the risk of spills, and educates the public on what they can do to protect groundwater.
A Leader in Water Quality Treatment and TechnologyGCWW uses state-of-the-art water treatment processes that include multiple barriers to protect public health. GCWW treatment processes include Sand Filtration, Granular Activated Carbon (GAC), Powdered Activated Carbon (PAC), and ultraviolet (UV) light to remove and treat for natural and man-made contaminants from our drinking water. It is one of the first in the nation to use a combination of all four treatment methods.
GCWW typically treats 120 million gallons of water a day, and more than 600 daily tests ensure that all the aforementioned treatments are effective.
GCWW also treats the drinking water specifically to minimize the amount of lead that may leach into the drinking water — this treatment process is called corrosion control. This process ensures there is no lead in the water as it leaves GCWW treatment plants and minimizes the chance that lead can be picked up from home plumbing. Page 5 illustrates the treatment processes at the Richard Miller and Charles M. Bolton Plants.
ORSANCO Monitoring Locations Map
Tennessee R.
Kentucky R. Licking R. Kanawha R.
Muskingum R. Monongahela R.
Allegheny R.
Green R.Cumberland R.
Great Miami R. Wabash R.
Scioto R.CINCINNATI PORTSMOUTH
OH
KYVA
WV
PA
NY
INIL
HUNTINGTON
PARKERSBURG
WHEELING
PITTSBURGH
LOUISVILLEEVANSVILLE
Big Sandy R.
PADUCAHORSANCO Monitoring Station
For more information about source water protection or to find out what you can do to help, visit myGCWW.org, email [email protected], call Greater Cincinnati Water Works at 513.591.7700, or call the Groundwater Consortium at 513.785.2464.
4 5
Granular Activated Carbon
GCWW’s Richard Miller Treatment Plant is one of only a few water treatment plants in the nation that incorporates granular activated carbon (GAC) with on-site reactivation into its water treatment process. This state-of-the-art technology uses granular carbon, which contains numerous microscopic cavities. When water is passed through the GAC, impurities adhere to the carbon and are removed from the water. Benefits of GAC include: barrier against potential chemical spills in the Ohio River; barrier against impurities in raw source water; less chlorine required for disinfection; reduced disinfection-byproducts; and improved control of taste and odor.
Ultraviolet Disinfection
GCWW is the largest water utility in North America to use UV disinfection following rapid sand filtration and GAC adsorption. UV disinfection, which uses rays of intense light to disinfect water, is one of the most effective methods used to protect against microorganisms such as Cryptosporidium. GCWW’s rapid sand filtration, granular activated carbon (GAC) and UV treatment processes create a multi-barrier approach to protect public health.
Treatment Process at the Richard Miller Plant on the Ohio River
Backwash water from the sand filters and plant recycle water is returned to the beginning of the treatment process.
Ohio River Intake
Pumps
Settling aids added
pH adjusted
pH adjusted again, chlorine added, fluoride added
Granular Activated Carbon
Rapid Sand Filtration
SecondarySedimentation
Further settling
occurs in reservoir
Coagulation Flocculation
Sedimentation
GAC Reactivation Furnace
ReservoirUV
Disinfection
To Distribution System
Treatment Process at the Charles M. Bolton Plant on the Great Miami Buried Valley Aquifer
Well
Lime Added to Soften Water
Lime Settles, pH adjusted Chlorine and
Fluoride Added
Coal, Sand and Gravel Filter Water Reservoir
To Distribution System
2 0 2 0 G C W W WAT E R Q UA L I T Y R E P O R T
6 7
TABLE A: Regulated Contaminants Miller Water (from the Ohio River)Bolton Water
(from the Great Miami Valley Buried Aquifer)Typical Source of Contamination
Substance (Unit)Maximum Allowed
(MCL)MCLG
Highest Compliance Level Detected
Range of Detection
ViolationYear
SampledHighest Compliance
Level DetectedRange of Detection
ViolationYear
Sampled
Fluoride (ppm) 4 4 0.88 0.68 - 1.04 No 2020 0.89 0.73 - 1.01 No 2020Additive which promotes strong teeth.
May come from erosion of natural deposits.
Nitrate (ppm) 10 10 1.00 0.50 - 1.00 No 2020 1.60 na3 No 2020Runoff from fertilizer use, leaching from septic tanks, sewage,
erosion of natural deposits.
TTHMs (ppb) [Trihalomethanes]1 80 na 57.0 12.8 - 56.9 No 2020 57.0 12.8 - 56.9 No 2020 Byproduct of drinking water chlorination.
HAA5 (ppb) [Haloacetic Acids]1 60 na 12.3 1.89 - 15.6 No 2020 12.3 1.89 - 15.6 No 2020 Byproduct of drinking water chlorination.
Turbidity (NTU)TT1 < 1 NTU Max and
TT2 < 0.3 NTU 95% of the time
nana
0.09100% < 0.3 NTU
0.01 - 0.09 No 2020 nr nr No na Soil runoff.
1st Compliance Period (Jan - June)
Lead1 (ppb)
AL = 15(the 90th percentile must be less than 15
ppb)
0
90th percentile 5.00 ppb nd - 30.5 No 2020 90th percentile 5.00 ppb nd - 30.5 No 2020
May come from erosion of natural deposits. There is no detectable lead in our water as it leaves the treatment plants. However, corrosion of household plumbing is a source of lead and copper contamination. GCWW tests water samples collected at customers taps, as required
by the Safe Drinking Water Act to ensure safe water.
(1 out of 134 samples tested during the first compliance period was > the AL)4
(1 out of 134 samples tested during the first compliance period was > the AL)4
Copper1 (ppm)
AL = 1.3 (the 90th percentile must
be less than 1.3 ppm)1.3
90th percentile 0.022 ppm nd - 0.066 No 2020 90th percentile 0.022 ppm nd - 0.066 No 2020(0 out of 134 samples tested during the first compliance
period were > the AL)(0 out of 134 samples tested during the first compliance
period were > the AL)
2nd Compliance Period (July - Dec)
Lead1 (ppb)
AL = 15(the 90th percentile must be less than 15
ppb)
0
90th percentile 6.00 ppb nd - 41.4 No 2020 90th percentile 6.00 ppb nd - 41.4 No 2020
(5 out of 110 samples tested during the second compliance period were > the AL)4
(5 out of 110 samples tested during the second compliance period were > the AL)4
Copper1 (ppm)
AL = 1.3(the 90th percentile must
be less than 1.3 ppm)1.3
90th percentile 0.021 ppm nd - 0.043 No 2020 90th percentile 0.021 ppm nd - 0.043 No 2020(0 out of 110 samples tested during the second compliance
period were > the AL)(0 out of 110 samples tested during the second compliance
period were > the AL)
Total Organic Carbon2 TT na 2.23 1.92 - 3.25 No 2020 nr nr No na Naturally present in the environment.
Total Chlorine1 (ppm) MRDL = 4 MRDLG = 4 1.17 1.05 - 1.27 No 2020 1.17 1.05 - 1.27 No 2020 Water additive used to control microbes.
Barium (ppm) 2 2 0.028 na3 No 2020 0.013 na3 No 2020Erosion of natural deposits; Discharge of drilling wastes;
Discharge from metal refineries.
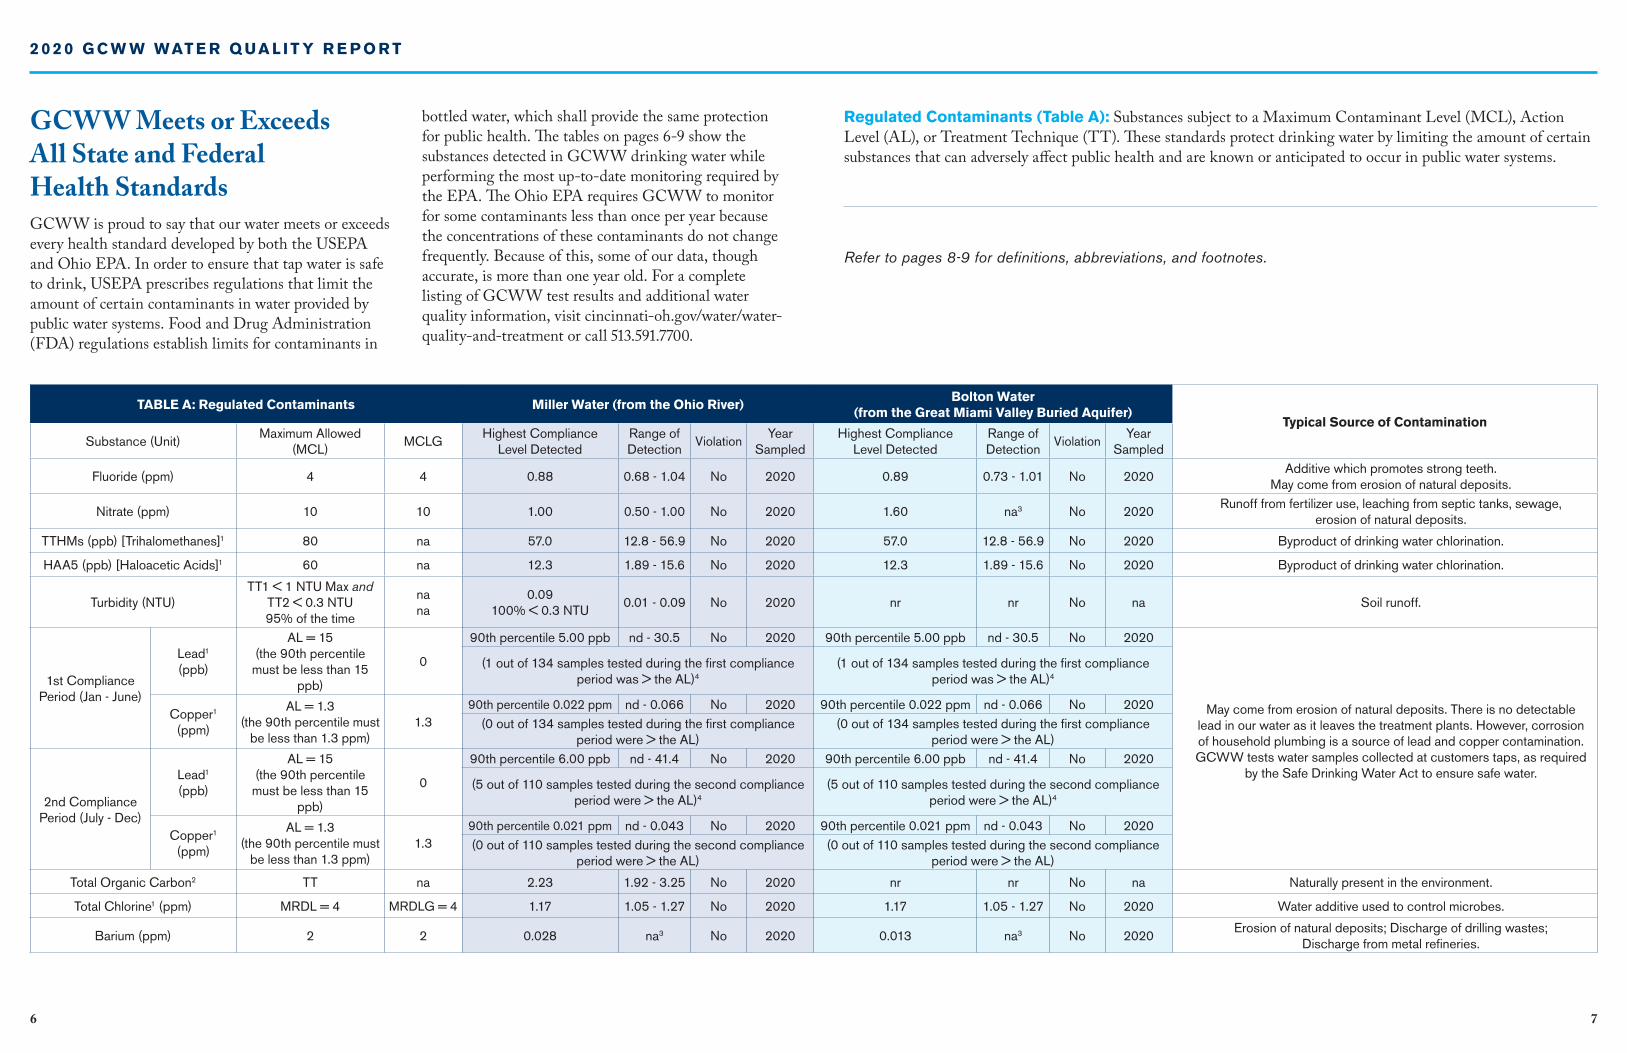
GCWW Meets or Exceeds All State and Federal Health StandardsGCWW is proud to say that our water meets or exceeds every health standard developed by both the USEPA and Ohio EPA. In order to ensure that tap water is safe to drink, USEPA prescribes regulations that limit the amount of certain contaminants in water provided by public water systems. Food and Drug Administration (FDA) regulations establish limits for contaminants in
Regulated Contaminants (Table A): Substances subject to a Maximum Contaminant Level (MCL), Action Level (AL), or Treatment Technique (TT). These standards protect drinking water by limiting the amount of certain substances that can adversely affect public health and are known or anticipated to occur in public water systems.
bottled water, which shall provide the same protection for public health. The tables on pages 6-9 show the substances detected in GCWW drinking water while performing the most up-to-date monitoring required by the EPA. The Ohio EPA requires GCWW to monitor for some contaminants less than once per year because the concentrations of these contaminants do not change frequently. Because of this, some of our data, though accurate, is more than one year old. For a complete listing of GCWW test results and additional water quality information, visit cincinnati-oh.gov/water/water-quality-and-treatment or call 513.591.7700.
2 0 2 0 G C W W WAT E R Q UA L I T Y R E P O R T
Refer to pages 8-9 for definitions, abbreviations, and footnotes.

TABLE B: Unregulated Contaminants Miller Water (from the Ohio River) Bolton Water (from the Great Miami Buried Valley Aquifer)Typical Source of Contamination
Substance (Unit) MCLGAverage Level
DetectedRange of Detection
ViolationYear
SampledAverage Level
DetectedRange of Detection
ViolationYear
Sampled
Chloroform (ppb)1 70 8.37 nd - 28.86 na 2020 8.37 nd - 28.86 na 2020
Byproducts of drinking water disinfection, measured at representative points in the distribution system.
Bromodichloromethane (ppb)1 0 7.27 1.95 - 13.45 na 2020 7.27 1.95 - 13.45 na 2020
Dibromochloromethane (ppb)1 60 9.60 3.06 - 19.81 na 2020 9.60 3.06 - 19.81 na 2020
Bromoform (ppb)1 0 6.22 nd - 16.08 na 2020 6.22 nd - 16.08 na 2020
Monochloroacetic Acid (ppb)1 70 nd nd - nd na 2020 nd nd - nd na 2020
Monobromoacetic Acid (ppb)1 na nd nd - 1.88 na 2020 nd nd - 1.88 na 2020
Dichloroacetic Acid (ppb)1 0 3.32 nd - 10.0 na 2020 3.32 nd - 10.0 na 2020
Trichloroacetic Acid (ppb)1 20 nd nd - 3.72 na 2020 nd nd - 3.72 na 2020
Dibromoacetic Acid (ppb)1 na 3.02 1.45 - 6.08 na 2020 3.02 1.45 - 6.08 na 2020
Sulfate (ppm) na 58 43 - 76 na 2020 42 42 - 43 na 2020 Erosion of natural deposits.
Unregulated Contaminants (Table B): Unregulated contaminants are those for which EPA has not established drinking water standards. The purpose of unregulated contaminant monitoring is to assist EPA in determining the occurrence of unregulated contaminants in drinking water and whether future regulation is warranted.
2 0 2 0 G C W W WAT E R Q UA L I T Y R E P O R T
98
Footnotes: 1. Miller and Bolton were considered as one distribution system for regulatory purposes by Ohio EPA during 2020. Data listed for each system represents the combined distribution system. 2. The value reported under “Highest Compliance Level Detected” for Total Organic Carbon (TOC) is the lowest ratio between percentage of TOC actually removed to the percentage of TOC required to be removed. A value of greater than one (1) indicates that the water system is in compliance with TOC removal requirements. A value of less than one (1) indicates a violation of the TOC removal requirements. 3. GCWW collects one sample per year. 4. 1 out of 134 samples was found to have lead levels in excess of the lead threshold level of 15 ppb during the first compliance period of 2020 (Jan-June): 1 result between 30-40 ppb. 5 out of 110 samples were found to have lead levels in excess of the lead threshold level of 15 ppb during the second compliance period of 2020 (July-Dec): 2 results between 15-20 ppb; 2 results between 20-30 ppb; 1 result between 40-50 ppb.
Definitions Maximum Contaminant Level Goal or MCLG: The level of a contaminant in drinking water below which there is no known or expected risk to health. MCLGs allow for a margin of safety.
Maximum Contaminant Level or MCL: The highest level of a contaminant that is allowed in drinking water. MCLs are set as close to the MCLGs as feasible using the best available treatment technology.
Action Level or AL: The concentration of a contaminant, which, if exceeded, triggers treatment or other requirements which a water system shall follow.
Treatment Technique or TT: A method for treating water to achieve acceptable levels of the
contaminants in lieu of establishing a maximum contaminant level.
Maximum Residual Disinfection Level or MRDL: The highest level of a disinfectant allowed in drinking water. There is convincing evidence that addition of disinfectant is necessary for control of microbial contaminants.
Maximum Residual Disinfection Level Goal or MRDLG: The level of drinking water disinfectant below which there is no known or expected risk to health. MRDLGs do not reflect the benefits of the use of disinfectants to control microbial contaminants.
Turbidity: Utilities who treat surface water are required to report on turbidity as an indication of the effectiveness of the filtration system. Turbidity is a measure of the cloudiness of water. The turbidity limit set by the EPA is 0.3 NTU in 95% of the samples
analyzed each month, and shall not exceed 1 NTU at any time. As reported in the table, GCWW’s highest turbidity result for 2020 was 0.09 NTU (Miller Water) and lowest monthly percentage of samples meeting the turbidity limits was 100%.
The < symbol: A symbol which means less than. A result of <5 means that the lowest level that could be detected was 5 and the contaminant in that sample was not detected.
Lead Threshold Level: The concentration of lead in an individual tap water sample. The lead threshold level is exceeded at 0.015 milligrams per liter (15 ppb) concentration of lead in an individual tap water sample.
Abbreviationsppb: parts per billion or micrograms per liter; ppm: parts per million or milligrams per liter; nr: not regulated; na: not applicable; NTU: NephelometricTurbidity Unit (used to measure clarity in drinking water); nd: not detectable at testing limits; TTHMs: Total Trihalomethanes; HAA5: Haloacetic Acids

Drinking water, including bottled water, may reasonably be expected to contain small amounts of contaminants. The presence of contaminants does not necessarily indicate that the water poses a health risk. However, some people may be more vulnerable to contaminants in drinking water than the general population. Immunocompromised persons, such as persons with cancer undergoing chemotherapy, persons who have undergone organ transplants, people with HIV/AIDS or other immune system disorders, some elderly, and infants can be particularly at risk from infections. These people should seek advice about drinking water from their healthcare providers. More information about contaminants and potential health effects can be obtained by calling the United States Environmental Protection Agency’s (USEPA) Safe Drinking Water Hotline at 800.426.4791.
Cryptosporidium (Crypto) is a microscopic organism, that when ingested, can result in diarrhea, fever and other gastrointestinal symptoms. Crypto is found in surface waters and comes from animal and human waste. GCWW routinely tests for Crypto and did not detect it in our finished water in 2020. GCWW also tested for Crypto in the Ohio River surface water and it was detected in 3 of 12 samples during 2020. USEPA/CDC guidelines on appropriate means to lessen the risk of infection by Cryptosporidium and other microbial contaminants are available from the Safe Drinking Water Hotline at 800.426.4791.
1If there are reported
contaminants, how can my water be safe?
6Sometimes my water
is reddish-brown. Is this safe?
7Why does drinking water sometimes
look cloudy?
4What is the amount of sodium added to
my water?
2What is
Cryptosporidium?
3Why is fluoride added
to my water?
5Is there lead in
my water?
8How hard is
GCWW’s water?
Frequently Asked Questions
Fluoride is added to the water to protect teeth as required by a state law passed in 1969. According to
the American Dental Association, persons who drink fluoridated water have a 20% to 40% reduction in the amount of cavities that would have occurred without fluoride. Some home filtration devices remove fluoride. Bottled water may not contain fluoride.
GCWW has tested for sodium in treated water as it leaves the treatment plants and has found 25 mg (milligrams) per liter in the Richard Miller Water and 32 mg per liter in the Charles M. Bolton Water. There are approximately four cups in a liter.
There is no detectable lead in drinking water as it leaves the treatment plants. If present, elevated levels of lead can cause serious health problems, especially for pregnant women and young children. Lead in drinking water
Hard water is water that contains more minerals, such as calcium and magnesium. Water from GCWW’s Richard Miller Plant has an average hardness of 113 mg per liter or 7 grains per gallon. Water from the Charles M. Bolton Plant averages 133 mg per liter or 8 grains per gallon. Hardness does not affect the safety of water.
is primarily from materials and components associated with service lines and home plumbing. GCWW is responsible for providing high quality drinking water, but cannot control the variety of materials used in plumbing components. When your water has been sitting for several hours, you can minimize the potential for lead exposure by flushing your tap for 30 seconds to 3 minutes before using water for drinking or cooking. If you are concerned about lead in your water, you may wish to have your water tested. A list of laboratories certified in the State of Ohio may be found at epa.ohio.gov/ddagw or by calling 614.644.2752. Information on lead in drinking water, testing methods, and steps you can take to minimize exposure is available from the Safe Drinking Water Hotline 800.426.4791 or at epa.gov/safewater/lead. Lead information can be found online at Lead.myGCWW.org or by calling 513.651.LEAD (5323). Our lead program is being used to meet a portion of the notification requirements in OAC Rule 3745-83-02.
The reddish-brown color can be caused by rust from corrosion in GCWW’s pipes, the pipes in your home or from corrosion in your home’s water heater. If you have rusty water, try running cold water for several minutes. If you have questions or your laundry is stained from rusty water, call GCWW at 513.591.7700. We will deliver a laundry aid to remove the rust. Do NOT put stained laundry in the dryer.
Cloudy water that clears quickly from the bottom up is caused by tiny air bubbles in the water similar to gas bubbles in soda. After a while, the bubbles rise to the top and disappear. This cloudiness
occurs more often in the winter when drinking water is cold. Air does not affect the safety of water.
10 11
2 0 2 0 G C W W WAT E R Q UA L I T Y R E P O R T

Attend the Following Meetings to Participate in Water Decisions:City of Cincinnati CouncilWebsite: cincinnati-oh.govPhone: 513.352.3246
ORSANCO Website: orsanco.orgPhone: 513.231.7719
OKI Regional Council of Governments Groundwater Committee Website: oki.orgPhone: 513.621.6300
Educational ResourcesTwo online Teacher Resource areas are available for teachers, students and parents. These sites are full of educational resources, videos, activity ideas, links, and more -- schedule a group tour of the Water Museum or Historic Old River Station online as well!
Water QualityWebsite: cincinnati-oh.gov/water/about/teacher-resources
Stormwater Website: cincinnati-oh.gov/stormwater/teacher-resources
City of Cincinnati is an Equal Opportunity/Affirmative Action Employer. Notice Under the ADA: The City of Cincinnati will not discriminate against qualified individuals with disabilities in its programs, services, or activities. If you require any special accommodations or communication aids visit www.cincinnati-oh.gov/manager/ada.
This report meets the Ohio and USEPA’s National Primary Drinking Water Regulation for Consumer Confidence Reports.GCWW has a current unconditioned license to operate.
For More Information About...Lead AwarenessWebsite: lead.myGCWW.orgPhone: 513.651.LEAD (5323)
USEPA Safe Drinking WaterWebsite: epa.gov/ground-water-and-drinking-waterSafe Drinking Water Hotline: 800.426.4791
The Food and Drug Administration (FDA) Website: fda.govPhone: 888.463.6332
NSF InternationalWebsite: nsf.orgPhone: 800.673.6275
Contact GCWWFor more information about water quality, customer billing, or to request additional copies or submit comments about this report, call 513.591.7700 or visit myGCWW.org.
20
20
GC
WW
WA
TE
R Q
UA
LIT
Y R
EP
OR
T


![Extreme Scoping 2006 Cincinnati - Wild Apricot · Time versus Quality Everyone wants quality, but rarely is the extra time given ... (Enterprise Information Management [EIM]) ¾Assemble](https://img.dokumen.tips/doc/110x75/5f0443197e708231d40d1b96/extreme-scoping-2006-cincinnati-wild-apricot-time-versus-quality-everyone-wants.jpg)