Embed Size (px)
Citation preview

2020 ANNUAL REPORT
JUMBO INTERACTIVE LIMITED

4 Introduction
6 Highlights
8 Letter from the Chairman
11 Letter from the CEO
12 Review of Operations
13 Key Performance Indicators
14 Like-for-Like Analysis
16 Data, AI and Lotteries
20 Customer Support
22 Powered by Jumbo
23 $1 Billion Vision
24 Jumbo Goes International
26 Leadership Team
28 People of Jumbo
30 Jumbo Turns 25
32 Corporate Responsibility
34 Financial Report
38 Directors’ Report
56 Auditor’s Independence Declaration
58 Consolidated Statement of Profit or Loss and Other
Comprehensive Income
59 Consolidated Statement of Financial Position
60 Consolidated Statement of Changes in Equity
62 Consolidated Statement of Cash Flows
63 Notes to the Consolidated Financial Statements
95 Directors’ Declaration
96 Independent Auditor’s Report
100 Shareholder Information
102 Company Information
TABLE OF CONTENTSCovid-19 has shown the
importance of having a robust Internet sales channel. The Australian lottery industry has remained healthy while many international lotteries saw dramatic declines in sales. Jumbo has the mature solution to help these lotteries in need."

Following on from a breakout year in 2019, Jumbo has provided certainty for the next 10 years with a fresh agreement with Tabcorp. This 10 year runway gives Jumbo the ability to continue the strong growth of the Australian ticket selling business and build the “Powered by Jumbo” software business in Australia and overseas.
Covid-19 has highlighted the benefits of online sales and the lottery industry is no different. Around the world many lotteries suffered during home confinement, however in Australia lotteries continued marching forward due to the availability of a healthy internet sales channel. Jumbo responded to the challenge by increasing capacity and customer support to address the influx of a new older demographic. This trend was highlighted when a 72 year old Jumbo customer won the $80 million Powerball during the Covid-19 period. It’s nothing new for a Jumbo customer to win big, but in the past the age was typically around 30. This new winner unwittingly heralded in a new older demographic into Jumbo that has been dominated younger tech-savvy players.
Covid-19 has also highlighted the importance of a modern lottery having a vibrant online sales channel. Many lotteries that did not have an online channel suffered badly due to retail sales channels coming under pressure. Jumbo is in the business of selling software and services to lotteries wishing to build their online channel. Jumbo has reached out to many of these affected lotteries to provide a path forward.
Jumbo’s “$1 billion vision” continues to be an important focus and guiding light over the next 2 years. The vision is to reach $1 billion in ticket sales on the Jumbo platform by FY22. This includes both the ticket selling business (OzLotteries.com) and the “Powered by Jumbo” SaaS business. While ambitious it is also achievable with the trend still very much towards the shift to online.
CERTAINTY TO 2030
INTRODUCTIONThe 10 year runway gives management the ability to continue the strong growth of the Australian ticket selling business and build the “Powered by Jumbo” software business in Australia and overseas."
4 JUMBO INTERACTIVE LTD ANNUAL REPORT 2020 JUMBO INTERACTIVE LTD ANNUAL REPORT 2020 5

£6.5m up 32%
$340m up 6%
827,411 up 9%
50%
TTV increased 6%from $320 mil in FY19 despite a 20% drop in the number of large Jackpots from 49 in FY19 to 39 in FY20.
Current contracts operationalised
Active Customers increased 9% from 761,863 in FY19
Gatherwell UK TTV up 32% on a 12-month basis to 30 June 2020
HIGHLIGHTS
OZLOTTERIES.COM AUSTRALIAN LOTTERY TICKET SELLING BUSINESS
"POWERED BY JUMBO" GLOBAL SAAS BUSINESS
$71.1m UP 9%
$43.2m UP 8%
$26.5m STEADY
Revenue up 9% despite a 20% drop in the number of large jackpots from 49 in FY19 to 39 in FY20
EBITDA-underlying up 8%
NPAT-underlying up 0.2%
JUMBO GROUP
(A$12.6m)
6 JUMBO INTERACTIVE LTD ANNUAL REPORT 2020 JUMBO INTERACTIVE LTD ANNUAL REPORT 2020 7

Dear Shareholder,
The 2019/20 year has not been an easy time for a lot of businesses due to the Covid-19 pandemic, however Jumbo Interactive Limited (Jumbo) still achieved an increase in ticket sales by $28 million bringing the total sales for the year to $349 million.
The online lottery industry has experienced further growth and this is expected to continue, especially as we broaden the charity lottery tickets we are now selling through our Powered by Jumbo software, which we feel will not only assist our profitability but also the deserving charities we are focussing on. This, together with the 10 year agreement recently announced with Tabcorp, will give both shareholders and Jumbo the confidence it requires to continue to develop online sales.
In my last year‘s letter to shareholders I stated that we remained focussed on board diversification and, prior to our Annual General Meeting, in September 2019 we announced the appointment of Professor Sharon Christensen to our board. Professor Christensen has over 29 years of legal and regulatory experience and is a research leader in regulatory responses to digital innovation and disruption. This now gives Jumbo a five person board of which four are Non-Executive directors. I should also note that after 14 years on the board, I have announced my resignation, however I did undertake to continue in the position until an experienced Chairman can be appointed to take my place.
We have often been asked if the Covid-19 pandemic has had an effect on our operation. With the experience of our major shareholder and CEO Mr. Mike Veverka and his very skilled staff we have been able to continue to work both within the office and from the staffs‘ respective homes. This was a platform put in place many years ago in the event of such a situation where working from the office was not an option. It would be remiss of me at this point not to acknowledge the diversification and wealth of experience our staff have. This is supported not only by our CEO but also our Key Management Personnel. Despite the challenges of the Covid-19 pandemic, we are proud and fortunate to still pay a full dividend and not rely on JobKeeper support.
Whilst we continue to focus our growth within Australia, during the financial year we did acquire Gatherwell Limited which is located in the United Kingdom and operates as a lottery manager to raise funds for good charitable and public social causes. We also continue to look at other potential opportunities, however this does not take our focus off our Australian activities which has been the success of the Company and its growth since its incorporation.
I have enjoyed being part of the evolution of Jumbo and would like to conclude by thanking the board of directors, our CEO, Key Management Personnel and all our staff for their on-going support and their efforts and input into the continued growth of our Company.
David K Barwick Chairman
FURTHER GROWTH
We remain focused on boardDiversification."
LETTER FROM THE CHAIRMAN
8 JUMBO INTERACTIVE LTD ANNUAL REPORT 2020

With Internet Sales of Lottery tickets at 28% of all tickets sold in Australia and under 10% globally, the industry clearly has a lot of growth ahead.
Lotteries are perfect for the Internet and customers enjoy a top quality experience whether they play on OzLottries.com or another lottery using the Jumbo platform. Continual innovation is driving the customer experience even higher and is ensuring lotteries continue to remain popular into the future.
The recent 10 year agreement with Tabcorp is an important milestone as it gives Jumbo certainty and the ability to plan long term. The next 10 years will be exciting as the Internet share of ticket sales race up as players, young and old, enjoy the experience of playing online. New innovations such as Advanced Data Analytics, Artificial Intelligence and Machine Learning are making subtle but effective improvements to our App. Improvements such as removing customer pain points and irrelevant information are streamlining our App and providing our customers with an unparalleled experience.
2020 was a year where the number of large Jackpots reached only 39 compared to 49 for the previous year.However we were able to increase ticket sales from $321 million to $349 million. This is clear evidence of the trend to online that is being accelerated by Covid-19. 350,319 new customers signed up to OzLotteries.com and the number of active customers increase from 761,863 in FY19 to 827,411 in FY20.
2020 also saw the acquisition of Gatherwell Limited in the UK, the largest external lotteries manager to local authorities in the UK. This fast growing digital lottery company is a perfect fit for Jumbo and provides a launch pad into the UK market. Jumbo specialises in medium to large lotteries so the addition of a company specialising in smaller lotteries completes the picture.
The “Powered by Jumbo” Software as a Service business got off to a great start with the signing of 5 clients with combined ticket sales of ~$140 million. This gave our team the opportunity to improve our offering and gain experience in working with clients as partners. Covid-19 has
disproportionately impacted lotteries without an online sales channel causing many to fast-track their internet strategies. The Jumbo PBJ team is on the front foot with solutions to assist those lotteries, wherever they may be in the world.
Jumbo also recently passed the 25 years in business milestone. From humble beginnings with a single computer in 1995, Jumbo has navigated many challenges and is ready for the growth that lies ahead. Our staff and partners over the years deserve enormous credit for this growth due to their efforts and trust in the vision to grow through technology.
Mike Veverka CEO
CONTINUAL INNOVATION
With the certainty of a 10 year agreement with Tabcorp, we can push forward with plans to deliver further growth."
LETTER FROM THE CEO
JUMBO INTERACTIVE LTD ANNUAL REPORT 2020 11

GROUP PERFORMANCE2020 was a positive year for both Ozlotteries.com and the new “Powered by Jumbo” SaaS business segments. Covid-19 is proving to be a driver for growth of Internet lotteries due to the “play from home” focus and the absence of any supply chain issues (nothing needs to be physically delivered). The group delivered an 8.7% increase in ticket sales (TTV) to $349 million and a 9.1% increase in Revenue to $71 million for the 12 months to June 30, 2020. Underlying EBITDA grew 7.7% to $43.2 million and underlying Net profit after tax remained steady at $26.5 million.
OZLOTTERIES.COM PERFORMANCEFor a year that produced 10 fewer large jackpots that the previous year (39 in FY2020) compared to 49 in FY2019), the OzLotteries.com business still managed to deliver growth evident in the 6.3% increase in ticket sales (TTV) to $340 million. Active customers (defined as a customer that made a purchase over the 12 months to June 30, 2020 also increased 9% to 827,411. This positive result for a year with fewer jackpots was driven by better software tools that helped keep players engaged more frequently. Delivering a premium service at a premium price has been the simple but effective model for OzLotteries.com for over a decade. Customers enjoy the choice, features and above all the experience. Our designers are continually thinking of ways to improve the experience and new software tools are giving feedback so we know exactly where that experience is appreciated the most.
POWERED BY JUMBO PERFORMANCEThe inaugural year for the "Powered by Jumbo" SaaS business was devoted to onboarding new lotteries and bringing them up to fully operational status. The first lottery (Mater) was 100% operationalised in July 2020 and the remaining lotteries are scheduled for completion by December 2020. During FY20, revenue from the portion of sales that were operationalised reached ~$0.3 mil and this is expected to climb to an annualised rate of ~$4.4 million pa once complete. The acquisition of Gatherwell Limited on 29 November 2019 gave the "Powered by Jumbo" business a foothold in the growing UK market. For the seven month period to 30 June 2020, TTV was $7,715,000, Revenue $1,520,000 and underlying net profit before tax $414,000. On a full year basis, Gatherwell ticket sales grew 32% to £6.55 million.
350,319827,411
25.6%$383.12$14.28
POSITIVE PERFORMANCE
REVIEW OF OPERATIONS KEY PERFORMANCE INDICATORS OZLOTTERIES.COM BUSINESS SEGMENT
Number of new customers (FY19: 444,004)
Active customers (defined as a customer that made a purchase over the 12 months to June 30, 2020) also increased 9%
Cost per lead (FY19: $13.81)
Avg spend per customer (FY19: $385.44)
Dormancy rate (FY19: 13.6%)
" Love playing and I can’t wait to win. Awesome app will rather the App then [sic] going into the store"
" It’s great & easy to purchase. Great design"
" Great way to play with more chances to win a share. Will be playing this way from now on"
" Such an easy option"
" Congratulations, very easy to use"
" Very user friendly. Despite rarely having any success, it’s something I look forward to each week"
" The app makes it super easy to purchase tickets at the comfort of your own home without going out and whenever you want to especially in times like these. Also getting notified as to when the super draws are on and also knowing what the week to week jackpots are which is handy"
CUSTOMER COMMENTS
12 JUMBO INTERACTIVE LTD ANNUAL REPORT 2020 JUMBO INTERACTIVE LTD ANNUAL REPORT 2020 13

Sales are significantly affected by Jackpots with higher jackpots attracting higher sales. Jackpots are often random making it difficult to determine if sales growth is due to jackpots or a steadily improving business. A like-for-like analysis focuses on sales from specific jackpot sizes removing the variation and allowing the true growth to be visible. The following graphs demonstrate clear growth over a variety of games and jackpot levels.
LIKE FOR LIKE GROWTH
SALES FROM ALL JACKPOTS UNDER $15 MILLION
SALES FROM OZLOTTO $15 MIL JACKPOTS
SALES FROM POWERBALL $20 MIL JACKPOTSSALES FROM POWERBALL $80 MILLION JACKPOTS
Sep 2019
Mar 2020
July 2020
2016
2020
2019
2018
201720162017
2018
2019
20202020
20192018
2017
LIKE FOR LIKE ANALISYS
Innovation and Customer Experience are growing sales, not just Jackpots."
Sales growth is strong even in smaller Jackpots"
14 JUMBO INTERACTIVE LTD ANNUAL REPORT 2020 JUMBO INTERACTIVE LTD ANNUAL REPORT 2020 15

PEAK LOADSLotteries are unique because of the very large spikes in sales just before draw closure. The graphs below show hourly sales in the 48 hours leading up to draw closure for the recent $80 mil Powerball. The first 24 hours show the “day before” compared to the last 24 hours “last day” sales. The peak load is over 7x higher than the same hour the day before – proof that people love leaving it to the last minute!
Technically this poses a challenge to computer engineers that must still maintain fast and very high standard transactional integrity during peak loads. Not only does the number of simultaneous customers increase but the computing power for each sale also increases as customer experience features are added. Jumbo has spent years perfecting its solution and the benefits are clear in the large jump in sales that OzLotteries.com produced in 2019.
Our “Powered by Jumbo” partners are also eager to improve sales by taking advantage of the last minute rush. Historically many charity lotteries have been missing out on sales simply because their systems were not able to handle peak loads reliably.
Hourly sales for the 2 last days of the recent $80 million Powerball
Hourly sales for the “day before” and “day of” the recent $80 million Powerball overlayed to highlight comparative scale.
JUL 8
0 1 2 3 4 5 6 7 8 9 10 11 12 13 14 15 16 17 18 19 20 21 22 23
8:00 8:0016:00 16:00JUL 9
DATA, AI & LOTTERIES
Hourly sales for the last day of the recent $80 million Powerball
Hourly sales for the second last day of the recent $80 million Powerball
COHORT ANALYSISDifferent groups of people exhibit different behaviours and analysing those trends to greater level of detail is providing new insights to Jumbo and our partners.
Mobile App customers spend more than website customers Months since initial purchase
Mobile App
Website
Below 25 25-3435-49 50-54 65+
Under 15m 15-50m 50+
Older customers spend more Months since initial purchase
Customers that sign up during low jackpot weeks spend more over the long term Months since initial purchase
0
0
0
5
5
5
10
10
10
15
15
15
16 JUMBO INTERACTIVE LTD ANNUAL REPORT 2020 JUMBO INTERACTIVE LTD ANNUAL REPORT 2020 17

REMOVING PAIN POINTSNot all features are visible. Many are subtle improvements removing pain points and delivering a better overall experience. An over cluttered screen with multiple options can annoy customers to the point of making them give up.
One technique used by Jumbo designers is a “Rage Click” detector. This is when software reports a barrage of mouse clicks with no result. The customer has lost patience with finding the right button and has become angry. This technique revealed up to $500,000 in lost sales over a 6 month period resulting from 6,506 customers failing to check out their purchase as a result of confusion around a simple button. Without data analytics this might have continued for years without ever being detected.
Our “Powered by Jumbo” partners find this level of feedback especially rewarding. Normally a charity lottery operator would not have the resources to use these tools but once partnered with Jumbo they are available to all partners.
$
Jackpot!
Jack pot!
DATA, AI & LOTTERIES COVID-19 EFFECTAs a nimble, digital and 100% pure online company, Jumbo was able to manage the Covid-19 period well. Online lotteries have no supply chain issues with no importation, warehousing or physical deliveries. Social restrictions drove players online as was highlighted in July 2020 when 63,800 new customer signed up - the highest since September 2019 when the Powerball reached a record $150 million. During the Covid-19 months in 2020, a larger percentage of new signups appeared from the 65 years and older category (peaking at 24% of all signups). This is obviously a result of social distancing and home confinement measures affecting particularly older demographics leaving their home. This trend is new to OzLotteries.
com which has historically attracted a younger tech-savvy demographic. Subtle design changes have been made to enhance the experience for this older demographic who tend to spend more as is evidenced in the Cohort Analysis.
% of new signups in the 65+ age demographic
JAN
FEB
MA
R
APR
24%
MAY
JUN
Covid-19 restrictions have driven players online, especially the older demographic. Sales in the recent $80 million Powerball even exceeded the last $100 million Jackpot."
18 JUMBO INTERACTIVE LTD ANNUAL REPORT 2020 JUMBO INTERACTIVE LTD ANNUAL REPORT 2020 19
CUSTOMER SERVICE
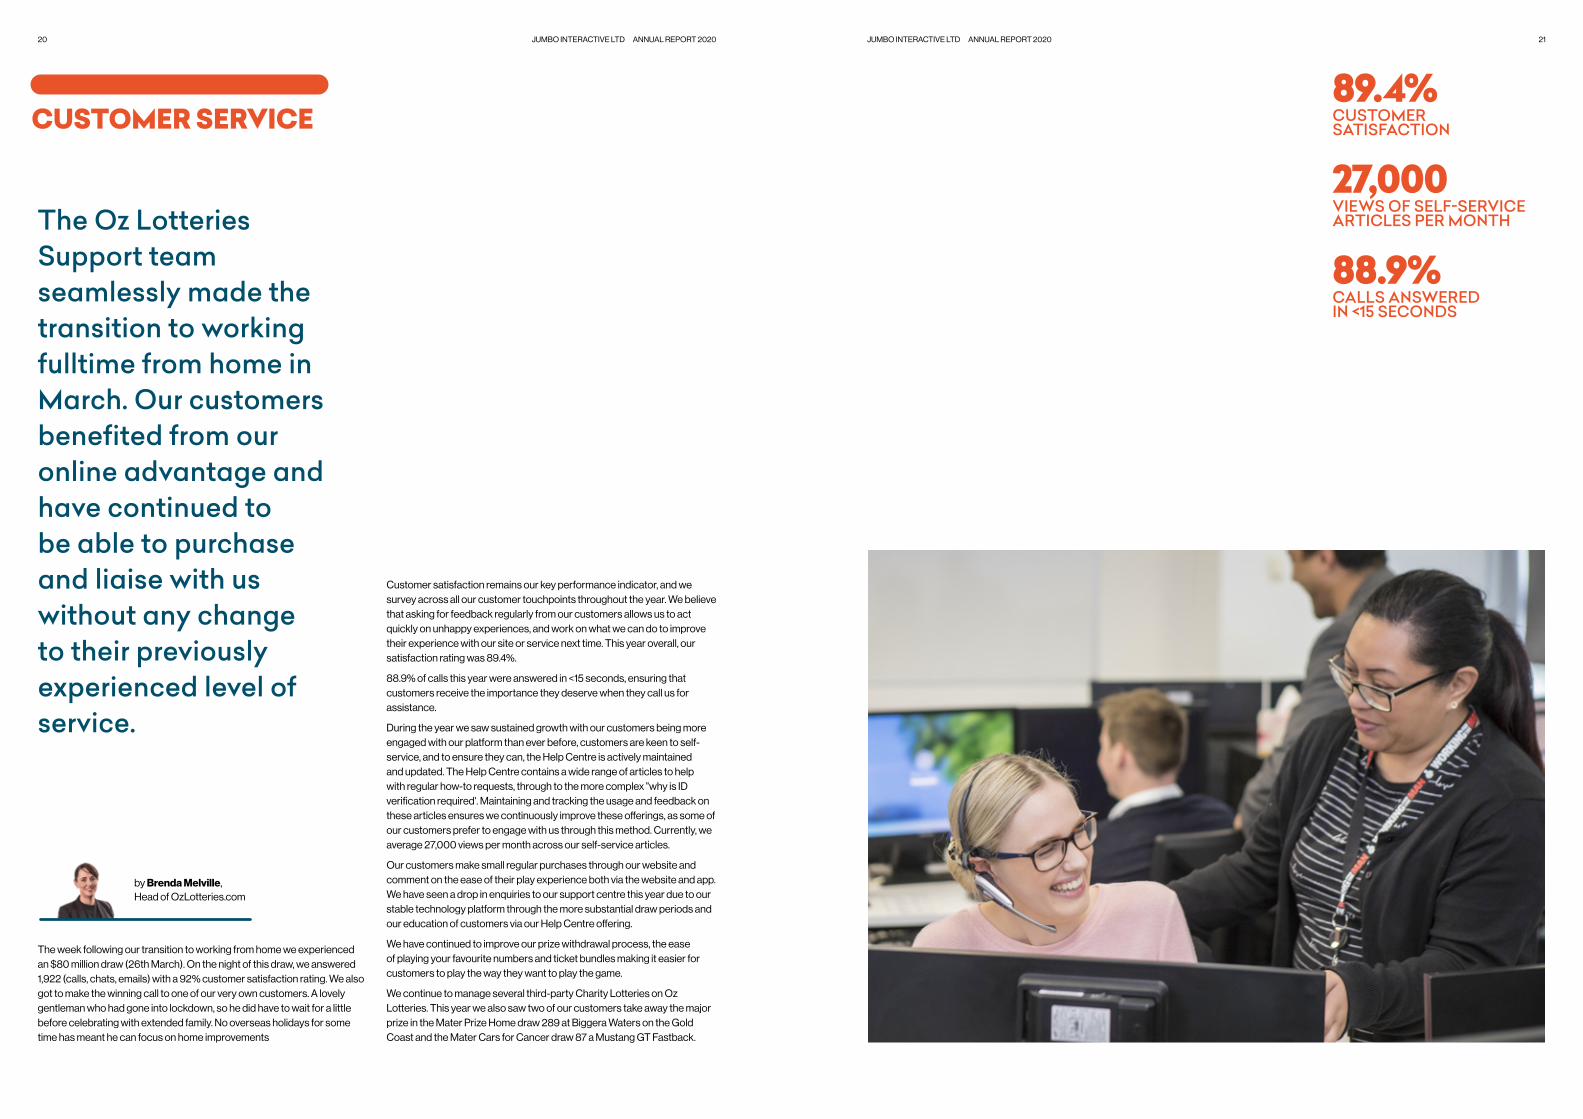
The week following our transition to working from home we experienced an $80 million draw (26th March). On the night of this draw, we answered 1,922 (calls, chats, emails) with a 92% customer satisfaction rating. We also got to make the winning call to one of our very own customers. A lovely gentleman who had gone into lockdown, so he did have to wait for a little before celebrating with extended family. No overseas holidays for some time has meant he can focus on home improvements
Customer satisfaction remains our key performance indicator, and we survey across all our customer touchpoints throughout the year. We believe that asking for feedback regularly from our customers allows us to act quickly on unhappy experiences, and work on what we can do to improve their experience with our site or service next time. This year overall, our satisfaction rating was 89.4%.
88.9% of calls this year were answered in <15 seconds, ensuring that customers receive the importance they deserve when they call us for assistance.
During the year we saw sustained growth with our customers being more engaged with our platform than ever before, customers are keen to self-service, and to ensure they can, the Help Centre is actively maintained and updated. The Help Centre contains a wide range of articles to help with regular how-to requests, through to the more complex "why is ID verification required'. Maintaining and tracking the usage and feedback on these articles ensures we continuously improve these offerings, as some of our customers prefer to engage with us through this method. Currently, we average 27,000 views per month across our self-service articles.
Our customers make small regular purchases through our website and comment on the ease of their play experience both via the website and app. We have seen a drop in enquiries to our support centre this year due to our stable technology platform through the more substantial draw periods and our education of customers via our Help Centre offering.
We have continued to improve our prize withdrawal process, the ease of playing your favourite numbers and ticket bundles making it easier for customers to play the way they want to play the game.
We continue to manage several third-party Charity Lotteries on Oz Lotteries. This year we also saw two of our customers take away the major prize in the Mater Prize Home draw 289 at Biggera Waters on the Gold Coast and the Mater Cars for Cancer draw 87 a Mustang GT Fastback.
89.4% CUSTOMER SATISFACTION
27,000 VIEWS OF SELF-SERVICE ARTICLES PER MONTH
88.9% CALLS ANSWERED IN <15 SECONDS
The Oz Lotteries Support team seamlessly made the transition to working fulltime from home in March. Our customers benefited from our online advantage and have continued to be able to purchase and liaise with us without any change to their previously experienced level of service.
by Brenda Melville,Head of OzLotteries.com
20 JUMBO INTERACTIVE LTD ANNUAL REPORT 2020 JUMBO INTERACTIVE LTD ANNUAL REPORT 2020 21
POWERED BY JUMBO $1 BILLION VISION
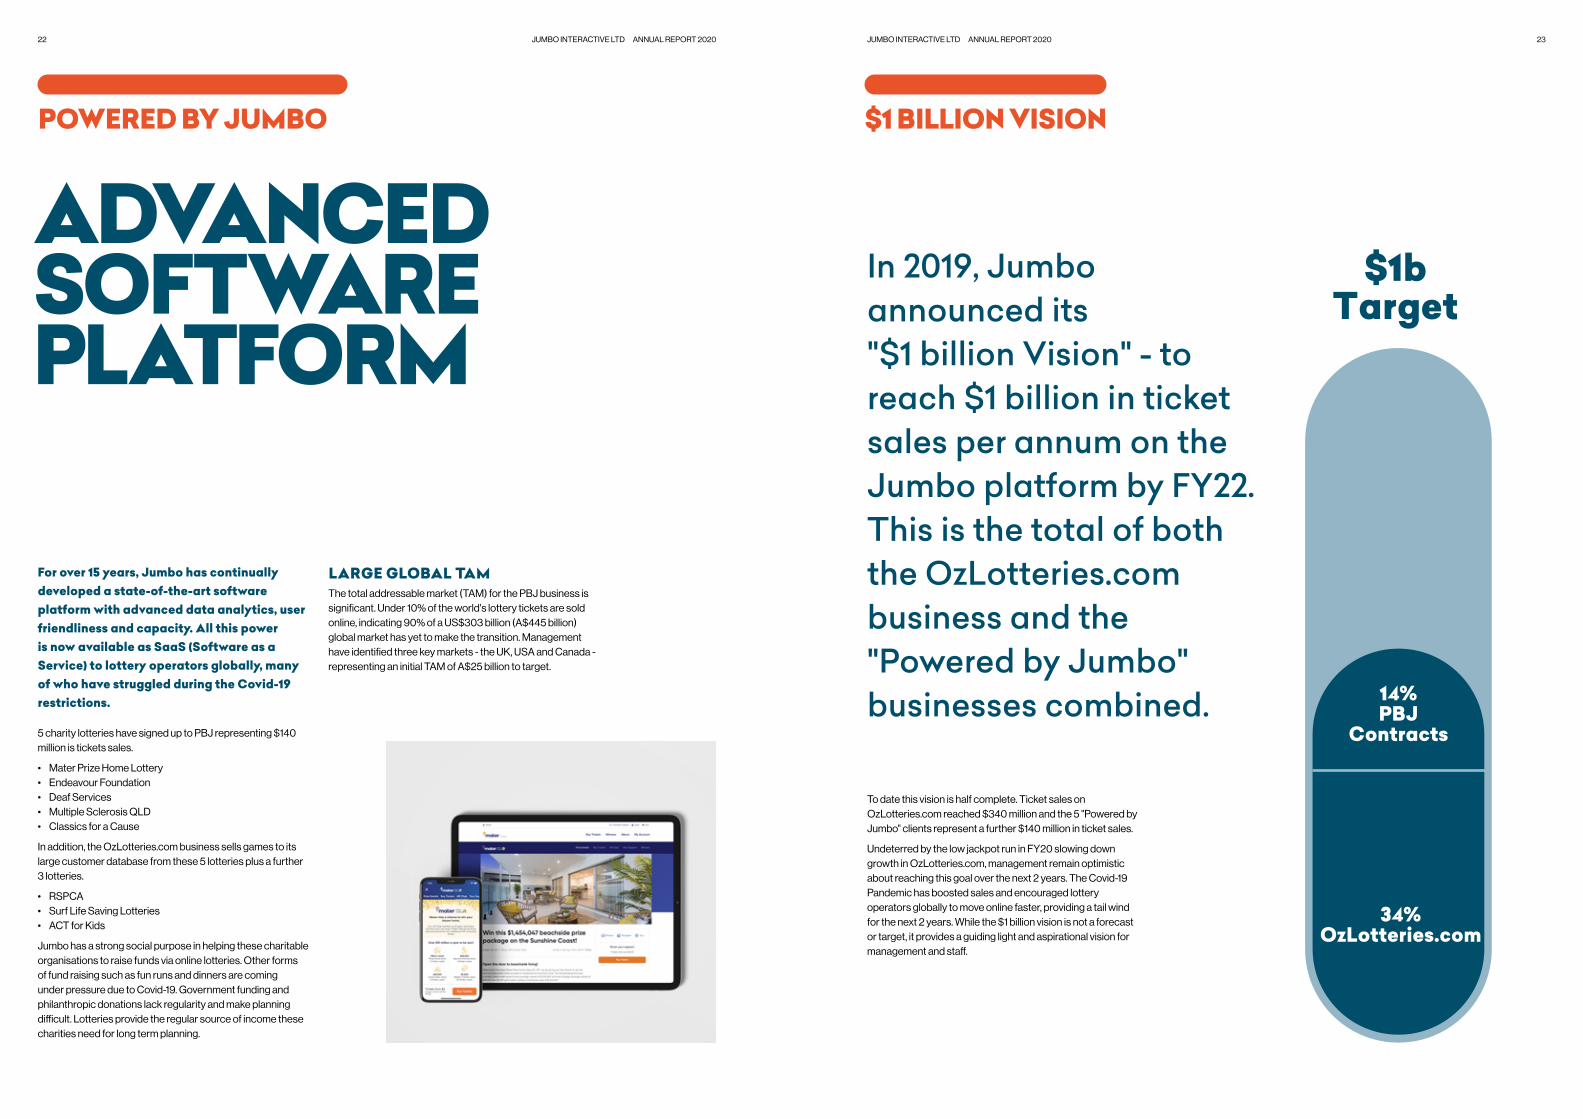
For over 15 years, Jumbo has continually developed a state-of-the-art software platform with advanced data analytics, user friendliness and capacity. All this power is now available as SaaS (Software as a Service) to lottery operators globally, many of who have struggled during the Covid-19 restrictions.
5 charity lotteries have signed up to PBJ representing $140 million is tickets sales.
• Mater Prize Home Lottery• Endeavour Foundation• Deaf Services• Multiple Sclerosis QLD• Classics for a Cause
In addition, the OzLotteries.com business sells games to its large customer database from these 5 lotteries plus a further 3 lotteries.
• RSPCA• Surf Life Saving Lotteries• ACT for Kids
Jumbo has a strong social purpose in helping these charitable organisations to raise funds via online lotteries. Other forms of fund raising such as fun runs and dinners are coming under pressure due to Covid-19. Government funding and philanthropic donations lack regularity and make planning difficult. Lotteries provide the regular source of income these charities need for long term planning.
LARGE GLOBAL TAMThe total addressable market (TAM) for the PBJ business is significant. Under 10% of the world's lottery tickets are sold online, indicating 90% of a US$303 billion (A$445 billion) global market has yet to make the transition. Management have identified three key markets - the UK, USA and Canada - representing an initial TAM of A$25 billion to target.
ADVANCED SOFTWARE PLATFORM
To date this vision is half complete. Ticket sales on OzLotteries.com reached $340 million and the 5 "Powered by Jumbo" clients represent a further $140 million in ticket sales.
Undeterred by the low jackpot run in FY20 slowing down growth in OzLotteries.com, management remain optimistic about reaching this goal over the next 2 years. The Covid-19 Pandemic has boosted sales and encouraged lottery operators globally to move online faster, providing a tail wind for the next 2 years. While the $1 billion vision is not a forecast or target, it provides a guiding light and aspirational vision for management and staff.
In 2019, Jumbo announced its "$1 billion Vision" - to reach $1 billion in ticket sales per annum on the Jumbo platform by FY22. This is the total of both the OzLotteries.com business and the "Powered by Jumbo" businesses combined.
34% OzLotteries.com
14% PBJ
Contracts
$1b Target
22 JUMBO INTERACTIVE LTD ANNUAL REPORT 2020 JUMBO INTERACTIVE LTD ANNUAL REPORT 2020 23

JUMBO GOES INTERNATIONAL
This past financial year has been a significant one for Jumbo’s international ambitions. In November 2019, Jumbo completed the acquisition of Gatherwell Ltd, the largest external lotteries manager to local authorities in the UK. The acquisition marks the first phase of Jumbo’s entry into the UK market, and the first major international transaction to date.
With the Australian business going from strength-to-strength, Jumbo’s Management has an opportunity to export its SaaS business model and its lottery management proposition to the international lottery market. Focusing on two sectors – the government and charity lottery sectors.
Over the past 6 months Management has been reviewing the different markets and overlaid our propositions for both government and charity to identify a clear and precise go-to-market strategy for Jumbo’s International business.
Management has identified three markets, in the UK, the US and Canada, that have a collective value, or Total Addressable Market (TAM), of over $25bn1. These markets are the beginning of Jumbo’s expansion into the European and North American markets. Management believes that focus is key to success in the early days of expansion so it has defined an approach that will focus on prioritising government or charity sectors, market-by-market.
THE UK MARKETManagement’s priority is to gain further market share in the society lottery2 sector (charity and local authority). The sector is worth an estimated $1.6bn3 in TTV and is a fragmented, yet lucrative market. Jumbo will utilise its acquisition of Gatherwell and focus on further growth in its local authorities and schools’ business, alongside gaining market share in the charity sector.
THE US MARKETThe government lottery sector in the US is by far the most lucrative to Jumbo with a TAM of $22bn4 . A market that has had historic barriers to entry is starting to open, with state legislation changing and requirements for digital lottery and innovation being demanded by lottery directors and
stakeholders alike. To date 11 out of the 48 jurisdictional lotteries have an iLottery or digital platform, and a further half dozen are likely to start preparations for iLottery within the next 12 months.
Management has identified the need for distinct propositions for the US market, these will be Jumbo iLottery® and Jumbo iRetailer®. Both propositions are based on our PBJ platform and marketing services. The iLottery proposition provides lotteries with an integrated digital lottery channel that is more efficient and effective than its industry competitors.
The iRetailer proposition provides lotteries with a standalone digital channel that is self-sufficient and does not require operating cost or marketing budget to be diverted from the lottery’s main operations. The iRetailer model is focused on smaller US states or those states that have constrained or restrictive marketing budgets.
1 Total TAM of $25bn equates to TAM by region of: UK $1.6bn; US $22bn; and Canada $1.3bn2 Society Lotteries is the legal term in the UK for regulated charity and local authority lotteries. 3 UK TAM of $1.6bn: The UK Gambling Commission reports TTV for sector of £775m (Sept 2019) applying a 5-year CAGR of +14% and/or PY rise of 8% gives a range of £837m to £884m in sector growth (to Sept’20). Using 6-month average GBP £1 to AUD $1.89, this leaves forecast TTV between $1.67m and $1.58m (Reference UKGC Annual Report 18/19)4 2018 US lottery sales were USD77bn. Draw games were USD28bn. With 50% iLottery penetration forecast in next 5 years (23 US lotteries). Management has modelled 25% of draw game sales likely to be converted to digital, this coupled with a doubling of sales with the upsell of Instant Win Games, Management forecasts the iLottery market to be worth $14.6bn (3% growth adjustment) USD $1 to AUD $1.50 equating to a TAM of $21.9bn
by Richard Bateson,International Lottery Advisor
THE CANADIAN MARKETWith a TTV of $1.3bn the charity lottery market in Canada is significant. The market is well defined and consolidated versus the US charity market leading to Jumbo being able to partner or acquire to gain a meaningful presence and market share in Canada. Once there is an established foothold in Canada, Management believes the model can be exported to other parts of the North American region, using the expertise of the local market in adjacent markets.
AMBITIONThe international ambition is to drive sustainable businesses in the UK, the US and Canada that will be used as a beachhead in each region to grow into other markets and sectors. International will support roughly a third of the $1bn TTV vision, set out by the CEO. In the longer-term the ambition is to have an International Business that is equal to or bigger than the Australian business by 2026.
The international ambition is to drive meaningful businesses in the UK, the US and Canada that will be used as a beachhead in each region to grow into other markets and sectors. International will support roughly a third of the $1bn TTV vision, set out by the CEO. In the longer-term the ambition is to have an International Business that is equal to or bigger than the Australian business by 2026.
UK $1.6 bn
Canada $1.3 bn
USA $22 bn
$ 25 bn TAM
Total addressable
market
24 JUMBO INTERACTIVE LTD ANNUAL REPORT 2020 JUMBO INTERACTIVE LTD ANNUAL REPORT 2020 25

LEADERSHIP TEAM
Jumbo has a stable leadership team that has amassed unique digital experience in the world lottery industry.
Left to right, top to bottom: Mike Veverka, David Barwick, Sharon Christensen, Giovanni Rizzo, Bill Lyne, David Todd, Brad Board, Xavier Bergade, Brian J. Roberts, Richard Bateson
MIKE VEVERKA Chief Executive Officer & Executive Director (BEng (Hons))Mike Veverka is CEO and founder of Jumbo Interactive. He has a proven track record in business and computing, establishing several successful startups to meet new consumer demands for online products. His entrepreneurial flair and ambition for innovation were displayed at the age of fifteen when he created and sold his first software package to Hewlett Packard. Mike worked as a design engineer and computer programmer before founding ‘Squirrel Software Technologies’ that provided some of Australia’s first internet services and e-commerce software. As founder and leader, Mike plays a pivotal role in the growth strategy, innovation and promotion of Jumbo.
DAVID BARWICKChairman and Non-Executive DirectorDavid Barwick has over 40 years experience in the management and administration of publicly listed companies in Australia and North America. During this period David has held the positions of Chairman, Managing Director or President of over 30 public companies with strengths in strategic planning, restructuring and financing entities
SHARON CHRISTENSEN Non- Executive DirectorProfessor Sharon Christensen has 29 years of commercial, legal and regulatory experience and is a research leader in regulatory responses to digital innovation and disruption. Most recently, Sharon was a Non-Executive Director of Property Exchange Australia Ltd, the operator of the national online property exchange network. Sharon holds a Bachelor of Laws (Honours) and Master of Laws and is a member of the Australian Institute of Company Directors
GIOVANNI RIZZO Non- Executive DirectorGiovanni Rizzo is a specialist in the gaming industry with over 20 years’ experience in various management roles of large listed lottery, casino and electronic gaming machine businesses in South Africa, Canada and Australia. Most recently, Giovanni was Head of Investor Relations at Tatts Group Limited, Australia’s exclusive operator of licenced lotteries. Giovanni holds a Bachelor of Commerce (Honours) in Finance and Audit and is a Chartered Accountant in Australia, New Zealand and South Africa.
BILL LYNE Non-Executive Director and Company Secretary (BCom, CA, FCIS, FGIA, FAICD, FFIN)Bill Lyne is the Principal of Australian Company Secretary Service that provides secretarial, corporate compliance and governance services to public company clients in a wide range of industries. Prior to this, Bill was Company Secretary and CFO of First Australian Building Society, having previously spent many years in credit and lending positions in merchant banking. Bill holds a Bachelor of Commerce and is a Chartered Accountant. He is a Fellow of the Institute of Chartered Secretaries & Administrators (UK), Governance Institute of Australia, and the Australian Institute of Company Directors. He is also a fellow of and has life membership with the Financial Services Institute of Australasia.
DAVID TODDChief Financial Officer (MBA, Grad DipACG, CAIB(SA), BCom, FGIA, FCIS)David has extensive capabilities in business administration with strengths in credit risk management and international business. His experience in financial management spans 25 years in the banking industries of South Africa, New Zealand and Australia, and small cap and SME environments. David holds a Bachelor of Commerce, a Master of Business Administration, an Associate Diploma in Banking, and a Graduate Diploma of Advanced Corporate Governance. He is a Fellow of the Governance Institute of Australia and a Fellow of the Institute of Chartered Secretaries and Administrators (UK). David brings a wealth of commercial expertise to Jumbo Interactive as Chief Financial Officer.
BRAD BOARD Chief Operating OfficerHaving joined Jumbo in 2001 Brad has been actively involved in Jumbo’s evolution and growth into the leading digital lottery business it is today. Brad has significant lottery and e-commerce experience and ensures that the brand, digital experiences and service offerings provided by Jumbo effectively engage and satisfy it’s 2,000,000+ customers in Australia and Internationally. In addition to responsibility for Jumbo’s marketing and product strategy he ensures various departments and subsidiaries are interacting efficiently with each other and in accordance with Jumbo’s overall strategic goals.
XAVIER BERGADEChief Technology OfficerAs Chief Technology Officer, Xavier ensures that Jumbo’s technology services are continually improving and innovating while remaining secure for customer transactions. He is responsible for the adaptation of the successful Australian OzLotteries.com website to other markets and ensuring capabilities for customer purchases on any device demands that websites continually evolve as new mobile and computer products are
released to market with unprecedented frequency.
BRIAN J. ROBERTSPresident, North America (DipEC Cert(OM))Brian has extensive experience in lotteries and gaming, software development and production and is a recognised creative innovator. His experience in the lottery and gaming industry spans over 40 years with senior roles including Director of Creative Content Development at GTECH, COO and Senior Vice President of Marketing at On-Point Technology Systems, President of LotoMark and Vice President of Lottery Operations at International Totalizator and Lottery Systems. Brian has developed, implemented and managed gaming systems across many international jurisdictions. He holds over twenty issued and pending gaming industry USA patents.
RICHARD BATESON International Lottery AdvisorRichard has worked in the lottery industry for the past 18 years. A former director of Camelot UK Lotteries Ltd (B2C) and Camelot Global Solutions Ltd (B2B), Richard has been on both sides of the lottery fence working for the UK National Lottery and vendor operations and sales with Camelot Global. During his time at Camelot, Richard grew UK National Lottery sales from £5.2bn to £6.9bn over a 4 year period – and grew the digital customer base by 4m players. Richard was also President of EuroMillions for 5 years, and a member of the Board for 13 years – creating a €7bn game brand. Within the B2B business Richard set-up the commercial division that supported the successful Irish National Lottery bid for Camelot’s shareholder, won contracts with US states in New York, Kentucky and Arkansas – alongside working in the States of Texas and California.
26 JUMBO INTERACTIVE LTD ANNUAL REPORT 2020 JUMBO INTERACTIVE LTD ANNUAL REPORT 2020 27

DISTRIBUTED WORKPLACEThe COVID-19 pandemic resulted in Jumbo and the world dealing with unforeseen challenges that have had unprecedented health and economical impacts. During this period we have worked closely with our employees to ensure the health and welfare of our people and their families, and have supported our employees to adjust in a rapidly changing environment. Jumbo was able to demonstrate agility in responding quickly to the dangers of the COVID-19 outbreak, moving all employees to work remotely with minimal interruption to their work cycles and their ability to remain productive. Our transition to a distributed workplace has strengthened the resilience of our operational framework and technology, and our people have embraced remote-first processes and tools. Employees remain highly productive and exceptionally engaged, having adapted to the transition seamlessly. Jumbo provides a flexible work environment where employees are empowered to choose a workplace where they are most comfortable and productive. This flexibility enables our people to manage their work and time to suit their needs, whilst continuing to achieve their career and personal objectives.
CULTUREJumbo’s workplace culture remains strong despite the unforeseen challenges; however we recognise that in transitioning to a distributed workplace that a new culture will emerge. This is an opportunity for Jumbo to recreate a culture that is strengthened by the values, attitudes and behaviours of our employees, in alignment with our vision and strategy. Our leaders will play an essential role in establishing culture at a team level, by demonstrating compassion, promoting psychological safety, and actively taking action to keep teams intact. By utilising Jumbo’s strong communications technology, we are able to keep connected with our employees and promote a sense of belonging. We also like to have fun, and initiatives such as virtual social events and delivery of gifts to employees help to boost employee morale and encourage colleagues to stay in touch. When safe to do so, we will resume physical social gatherings for employees to further interact in a safe environment with friends and family.
DIVERSITYOver the last 12 months, female representation across our workforce has increased by more than 5%. Whilst progress has been made, we recognise more remains to be done to improve the gender balance. Diversity is a business priority and our practices continue to evolve. Our EmpowHer graduate program offers a safe learning environment to help women launch their career in technology, providing invaluable on-the-job experience to quickly advance the skills that will enable graduates to establish a successful career. Jumbo’s strong company culture and core values underpin our ability to attract and retain employees. We are committed to building a high-performing workforce and take pride in the diversity of our people and our inclusive workplace. All employees play a vital role in creating a collaborative environment in which our people feel valued and respected for their individuality and contributions.
CAREER DEVELOPMENTOur people are fundamental to our success. We strive to continuously build a culture where our employees are provided with learning opportunities to develop and are encouraged to contribute towards making work easier, fun and productive. Jumbo’s Career Pathways represent career development opportunities within Jumbo and supports our people with the necessary tools to set career goals. By creating opportunities through a range of solutions including coaching and mentoring, on-the-job experience and formal training, we reduce the risk of skills and knowledge shortages and enhance performance. Development areas range across both technical and personal skill sets, including leadership, innovation, collaboration and more. Retaining high calibre people is integral to Jumbo’s ongoing success and attracting talented individuals as new skills are required is a key priority. The retention of our employees is a key indicator that our people feel engaged and enabled and our employee engagement remains high in a challenging environment.
GREAT PEOPLEPEOPLE OF JUMBO
by Abby Perry,Head of Human Resources
28 JUMBO INTERACTIVE LTD ANNUAL REPORT 2020 JUMBO INTERACTIVE LTD ANNUAL REPORT 2020 29

2020 marks 25 years since Jumbo was founded with a vision to develop software and services for the burgeoning Internet. 1995 was also the year of the successful Netscape IPO that launched an era of Internet technology companies.
The early days of Jumbo saw a variety of software products and services developed including an e-commerce platform, online marketing services and web development tools.
Following a successful IPO in 1999, that company (Benon Technologies Pty Ltd) became the main operating entity and a wholly owned subsidiary of Jumbo Interactive Limited that is still operating today. At that time the company was known as Jumbomall.com, an online shopping mall concept that provided virtual store fronts to businesses and marketed them to a global audience. One of those businesses was the RSL Art Union, a successful charity lottery that worked with the team at Jumbo to explore the idea of selling lottery tickets over the Internet.
Lotteries over the Internet proved to be a very successful concept due to the vast improvement in customer experience which in turn helped the lottery to grow. Continual improvements to the software and a decision to focus exclusively on lotteries helped propel the business to greater heights. Additional lotteries were added via the acquisition
of TMS Global Services Pty Ltd in 2005 which gave Jumbo the right to sell national games such as OzLotto and the Powerball. This was accomplished via agreements with the Tatts Group and a number of state run lottery organisations that were the basis to the agreements Jumbo operates under today.
Technological advances continued to come enabling many of the features we take for granted today - Mobile Apps and Social Media (Lotto Party) are perfect examples. The Internet penetration of lottery ticket sales (percentage of tickets sold over the Internet compared to overall sales) continued to rise driven primarily by younger tech-savvy customers. However the rapid rise led to the need for a complete rewrite of the software platform in 2016. The project was completed in 2018 just in time for the new Powerball game which was relaunched around the same time. This project also saw the launch of the “Powered by Jumbo” software platform for lotteries which is not only a return to the software development roots of Jumbo, but an important driver of growth in domestic and international markets.
25 years in business is in itself an achievement and thanks to the efforts of many people Jumbo is well positioned for further growth enabling lotteries around the world to grow through technology.
HAPPY BIRTHDAY
JUMBO TURNS 25
MILESTONES 1995Company founded as "Squirrel Software Technologies Pty Ltd" which would later be renamed to "Benon Technologies Pty Ltd".
1999IPO on the Australian Stock Exchange as "Jumbomall.com" providing e-commerce software and services to small businesses globally.
2000Began selling lottery tickets online for the RSL Charity Lottery.
2005Acquired TMS Global Services Pty Ltd and began selling the Australian Powerball and OzLotto games online.
2011Launched the OzLotteries App that would later grow to 75% of all sales. Paid first dividend.
2017The Tatts group invests $15 million and becomes a substantial shareholder. Extends agreement a further 5 years.
2019Launched the "Powered by Jumbo" Saas business.
2020Agreement with Tabcorp extended a further 10 years.
30 JUMBO INTERACTIVE LTD ANNUAL REPORT 2020 JUMBO INTERACTIVE LTD ANNUAL REPORT 2020 31

BUSINESS SUSTAINABILITY THROUGH ENVIRONMENTAL, SOCIAL AND GOVERNANCE RESPONSIBILITYJumbo is committed to operational excellence in a sustainable and responsible manner, whilst creating lasting value for all of our stakeholders.
As a leading developer and operator of world-class digital lottery experiences, our responsibilities extend to our customers, staff, shareholders, suppliers, government, communities, and the environment in which we operate.
Jumbo’s aim is to use our experience and expertise to develop relationships with clients and customers to improve lives.
ENVIRONMENTBeing a predominantly digital operation, Jumbo’s environmental impacts are far less significant compared to more tangible products, which require manufacturing and transportation. Accordingly, Jumbo is a non-carbon intensive office and technology based business.
By providing digital tickets to our customers, rather than paper, assists our customers in reducing their own environmental footprints.
Despite the minimal environmental impact of operations, Jumbo is aware of the different types of pollution that the digital sector creates, such as
• Pollution from the production of IT hardware;• Pollution from e-waste i.e. used electrical and electronic equipment;• Pollution from daily digital use.
Procedures and initiatives to address this impact include cutting back our digital environmental footprint via optimizing our equipment rate, and re-purposing or recycling hardware.
Our relatively small environmental footprint arises largely from the energy used by our few offices, and from consumables.
• Our Brisbane head office has a 5 star NABERS energy rating and a 3 star NABERS water rating; and
• Our Melbourne office has a 5 star NABERS energy rating and a 3 star NABERS water rating
Jumbo continually reviews the digital ecology with the goal of operating at an impact-neutral level, including responsible purchasing initiatives, and developing procedures to reduce digital carbon footprint in the office.
COMMUNITY, CUSTOMERS, AND RESPONSIBLE GAMBLINGSOCIAL CONTRIBUTIONThe lottery industry is an essential contributor to the community. Not only does the substantial tax revenue from lotteries contribute to a host of social services, but also, there is a strong social responsibility aspect to lotteries, particularly in the charity lottery space.
Our charity partners are the embodiment of social responsibility, having the specific goal of helping the community.
The funds raised by our charity partners enable them to provide services and support to the community, which improves the quality of the community.
Their partnership with Jumbo not only improves their fund-raising abilities in support of their services, but also offers a reduction of their carbon footprint, and reducing their dependency on government assistance.
Jumbo also provides services to our regional neighbours in Fiji, Samoa and the Cook Islands, enabling these countries to raise funds for their local communities.
CUSTOMERS Our products and services improve the quality of life for our customers, and our clients’ customers, offering hope in uncertain times, and providing them with the opportunity to dream.
Although lotteries are not associated with problem gambling issues, Jumbo does not encourage excessive gambling, or extending customers beyond their financial means. In addition to Jumbo’s OzLotteries having robust in-house procedures for customer care, the PBJ platform has numerous solutions built in to ensure Responsible Gambling principles are implemented.
Customer accounts can be flagged on the PBJ platform, and facilities offering protection for vulnerable customers, such as self-exclusion, setting spend limits, and provision of Responsible Gambling Account Statements to show spending and prize amounts, are enabled.
Oz Lotteries frontline staff is trained to spot the signs of problem gambling, such as change in spending or frequency of play. Oz lotteries staff actively monitors player behaviour, and is very proactive with reaching out to customers to offer assistance.
OzLotteries complies with each State and Territory’s Responsible Gambling Code of Practice, underpinned by our Responsible Gambling Policy which is available on the website https://www.ozlotteries.com/about/responsible-gaming.
To ensure that Jumbo protects its customers’ privacy in accordance with the APPs, we are committed to ensuring the collection, accuracy, storage, security, use, disclosure and destruction of Personal Information is compliant with the APPs. Our Privacy Policy is available on the website https://www.ozlotteries.com/about/privacy.
Jumbo did not have any eligible data breaches to report under the Data Breach Notification Scheme, which falls under Part IIIC of the Privacy Act 1988, in FY20.
CLIENTSJumbo provides its PBJ clients with not only the personalisation of the product based on the client’s applicable Responsible Gambling and Codes of Practice requirements, but also assistance with the development of procedures, and assistance with staff training, to maximise the Responsible Gambling solutions available on the PBJ platform.
Jumbo continues to improve on these solutions to improve efficiency and efficacy of Responsible Gambling service delivery.
WORKPLACE Our people reflect Jumbo’s culture and values, and their diverse capabilities enable us to achieve exceptional performance.
Our relationship with our people is enshrined in our Code of Conduct which defines our workplace principles.
WORKPLACE CULTUREJumbo recognises that our people are vital to our success, and continues to provide a supportive and collaborative environment.
Initiatives such as conducting a Workplace Respect Training Day, Info Xchange programs, and the provision of a Learning and Development
CORPORATE RESPONSIBILITY
Platform for all employees are testament to Jumbo’s commitment to investing in the professional development of our staff.
The prevalence of Covid-19 in 2020 impacted on Jumbo’s ability to action its wellbeing initiatives, which historically included free breakfast and lunch, subsidised wellness activities, company sponsored participation in sporting and charity events, and a variety of social activities. Undeterred, Jumbo arranged care package deliveries for each employee, ensuring staff were supported through Brisbane’s lock-down period.
WORKPLACE GIVINGJumbo provides contributions to numerous charities and community organisations through corporate sponsorships, and by encouraging employees in their charitable initiatives.
Jumbo’s internal charity fund, ‘Just Giving’, receives voluntary donations from both our people and Jumbo, and our people decide on which charities to support for the benefit of the local communities.
In FY 2020, the following charities were supported:
• RSPCA – fundraising through their RSPCA CupcakeDay• Movember Foundation – fundraising• Heart Foundation - fundraising• World’s Greatest Shave - fundraising• Cancer Council – donation from Just Giving• WIRES – fundraising• Red Cross – fundraising
WOMEN IN LOTTERY LEADERSHIPJumbo continues its support of the Women In Lottery Leadership (WILL), following the inaugural scholarship grant of US$50,000. Further information can be found here:
http://womeninlotteryleadership.com/.
GENDER DIVERSITY Our Gender Diversity Policy has an objective of 45% female employees by 2023.
As at 30 June 2020, females account for 42% of Jumbo employees. In addition to the Gender Diversity Policy, Jumbo has taken a pragmatic approach which focuses on female empowerment, and championing programs offering opportunities for women, such as the EmpowHer Program.
In addition to our Graduate Program, Jumbo provides an allocated position for a female under the EmpowHer program. In 2021, Jumbo will increase this allocation to two places under the EmpowHer Program.
Further information can be found under the section “Our People”.
GOVERNANCEOur Corporate Governance Statement in this Annual Report describes in full our approach to corporate governance and compliance with the fourth edition of the ASX Corporate Governance Council’s Corporate Governance Principles and Recommendations. The CGS is also available on our website https://www.jumbointeractive.com/governance/corporate_governance_statement.pdf.
We have established a governance framework to support our business and help us deliver on our strategy.
OUR BOARDAs at the date of this report, our Board comprises five Directors – four independent non-executive Directors and one executive Director being Jumbo’s founder and CEO, Mike Veverka. Details of the Directors’ qualifications and experience are in the Board of Directors section of the Directors’ Report.
Jumbo has experienced rapid growth over the recent financial year. To meet the increasing demands of being a significantly larger company, we
further expanded the Board with the appointment of Sharon Christensen as an independent non-executive Director effective 1 September 2019.
The Board has two standing committees – the Audit and Risk Management committee and the Nominations and Remuneration Committee. The committees assist the Board by focusing in more detail on specific areas of our operations and governance framework.
MODERN SLAVERYThe Modern Slavery Act 2018 (Cth) (‘Act’) requires reporting entities subject to the Act to produce an annual modern slavery statement.
Whilst Jumbo is not a reporting entity subject to the Act, Jumbo is committed to operating ethically, and in accordance with the highest adherence to corporate social responsibility, environmental and workplace safety protection, and staff inclusion and diversity. Accordingly, Jumbo implemented a Modern Slavery Policy to guide its operations and partnerships.
Jumbo has a relatively simple supply chain that includes the following products and services:
• lottery entries from official national and registered charity lotteries;• purchase of products and services needed for the businesses day-to-
day operations including office supplies; • employment and training of staff;• external professional services including financial auditing and legal
advice;• leasing of office space; • IT infrastructure and support services; and • travel.
Jumbo endeavours to only work with suppliers that are aligned to our values. We expect our business partners to operate in accordance with all applicable modern slavery laws including those prohibiting human slavery and slavery like practices, human trafficking and child labour.
We have a whistle-blower policy and an external hotline for staff and business partners to use.
Shareholders
Governance Framework
Jumbo Interactive Limited Board of DirectorsOversees management on behalf of shareholders
Chief Executive OfficerResponsible for the day-to-day management of Jumbo and the
implementation of our strategy
Key Management PersonnelResponsible for running the business and delivering on our
strategic objectives
Audit & RiskManagement
CommitteeOversees financial reporting and risk
management
Nomination and Remuneration
CommitteeConsiders Board
composition and succession planning, and oversees the remuneration an incentive
framework for all our people
by Nikki Searby,Legal Counsel and Investor Relations
Our Board
Modern Slavery
32 JUMBO INTERACTIVE LTD ANNUAL REPORT 2020 JUMBO INTERACTIVE LTD ANNUAL REPORT 2020 33

FINANCIAL REPORT
Cycling off a comparative period of high large jackpotactivity, an increase in customer activity and engagement with mixed large jackpot activity has seen an increase in Total Transaction Value (TTV) and Revenue.
JUMBO INTERACTIVE LTD ANNUAL REPORT 2020 3534 JUMBO INTERACTIVE LTD ANNUAL REPORT 2020

Financial Headlines
$’000 FY2020 FY2019 Variance %
TTV 348,601 320,659 8.7%
Revenue 71,168 65,212 9.1%
Revenue margin 20.4% 20.3% 0.1ppt
EBITDA - underlying1 43,223 40.188 7.6%
EBIT - underlying1 37,236 36,755 1.3%
NPAT - underlying1 26,465 26,420 0.2%
Adjustments - acquisition costs (406) - -
- fair value revaluation (176) - -
EBITDA - statutory 42,641 40,188 6.1%
EBIT - statutory 36,654 36,755 (0.3%)
NPAT - statutory 25,883 26,420 (2.0%)
Cash at bank 72,259 84,583 (14.6%)
Net assets 78,919 77,378 2.0%
Net tangible assets 53,174 61,780 (20.7%)
Share price at year end (cps) 958.0 2015.0 (52.5%)
Dividends paid per share (cps) 40.0 34.0 17.6%
Total shareholder return (%) (50.5%) 309.8% (360.3ppt)
Earnings Per Share - underlying (cps) 42.5 43.9 (3.2%)
Return on capital employed (%) 32.8% 34.1% (1.3ppt)
Shares on issue (million) 62.4 62.1 0.5%
Market capitalisation (million) 598.0 1,251.8 (52.2%)
EBITDA margin - underlying (%) 60.7% 61.6% (0.9ppt)
EBIT margin - underlying (%) 52.3% 56.6% (4.3ppt)
FY 2020 IN REVIEW
1 refer page 43 for the reconciliation to statutory earnings
HighlightsCycling off a comparative period of high large jackpot activity, an increase in customer activity and engagement (new and active customers) with mixed large jackpot activity (number and average value) has seen an increase in Total Transaction Value (TTV) and Revenue, and with a step-up in costs, has resulted in a marginal increase in underlying Net Profit After Tax.
5 year Total Transaction Value and average large jackpots (in $ millions)
• Revenue $71.168 million – 9% increase • Net Profit After Tax – underlying $26.465 million – 0.2% increase • Dividends paid 40.0 cents (fully franked) – 18% increase
FY2021 outlook • The signing of revised 10 year agreements with Tabcorp introduces new
expenses in Service fees in COSs but gives long-term certainty to the Reseller business segment
• The burgeoning SaaS business segment is set to make a meaningful contribution from existing agreements going fully live, and a full year con-tribution from Gatherwell in the UK
FY16
400
350
300
250
200
150
100
50
80
70
60
50
40
30
20
10
153.3 145.3
183.1
28.4
38.4
320.7348.6
40.1
28.842.2
FY17 FY18 FY19 FY20
FY2019 has not been adjusted for comparative purposes to reflect changes from the effect of adopting accounting policy AASB 16 Leases from 1 July 2019, but is provided in the following table for information purposes:
Statement of Profit or Loss and other comprehensive income Previous policy Adjustments Revised policy
30 June 2019 $'000 $'000 $'000
Revenue 65,212 - 65,212
Occupancy expenses (742) 772 30
Administrative expenses (19,117) (750) (19,867)
• depreciation and amortisation (3,433) (750) (4,183)
Finance costs (7) (164) (171)
Profit before income tax 38,219 (142) 38,077
Income tax expense (11,799) 43 (11,756)
Net profit after tax 26,420 (99) 26,321
EBIT 36,755 20 36,775
EBITDA 40,188 753 40,941
EBIT margin (%) 56.4 - 56.4
EBITDA margin (%) 61.6 1.2 62.8
36 JUMBO INTERACTIVE LTD ANNUAL REPORT 2020 JUMBO INTERACTIVE LTD ANNUAL REPORT 2020 37

The Directors of Jumbo Interactive Limited (Company), present their report on the consolidated entity (Group), consisting of Jumbo Interactive Limited and the entities it controlled at the end of, and during, the financial year ended 30 June 2020.
Board of DirectorsThe following persons were Directors of the Company during the whole of the financial year and up to the date of this report, unless otherwise stated:
David K Barwick: Chairman, Independent Non-Executive Director.
Mike Veverka: Managing Director and Chief Executive Officer.
Bill Lyne: Independent Non-Executive Director.
Giovanni Rizzo: Independent Non-Executive Director.
Sharon Christensen: Independent Non-Executive Director (appointed 1 September 2019).
Details of the experience, qualifications and special responsibilities, and other Directorships of listed companies, in respect of each of the Directors as at the date of this Directors’ Report are set out in the pages as follows:
David K BarwickExperience: Appointed as a Board member on 30 August 2006 and Chairman on 7 November 2007. David Barwick is an accountant by profes-sion with over 40 years experience in the management and administration of publicly listed companies both in Australia and North America. During this period David has held the position of Chairman, Managing Director or President of over 30 public companies covering a broad range of activities.
Special responsibilities: Chairman (Non-Executive); member of the Nomination and Remuneration Committee; and member of the Audit and Risk Management Committee.
Australian Listed Company Directorships held in the past three years: None,
Interest in shares and options: 3,000 ordinary shares only in Jumbo Interactive Limited.
Mike VeverkaExperience: Mike Veverka has been Chief Executive Officer and Director of Jumbo Interactive Limited since the restructuring of the Company 8 September 1999. Mike was instrumental in the development of the e-com-merce software that is the foundation of the various Jumbo operations. Mike was the original founder of subsidiary Benon Technologies Pty Ltd in 1995 when development of the software began.
Mike also established a leading Internet Service Provider in Queensland which operated successfully for three years before being sold. Mike is regarded as a pioneer in the Australian internet industry with many success-ful internet endeavours to his name. Mike graduated with an Honours degree in engineering in 1987.
Qualifications: Bachelor of Engineering (Hons).
Special responsibilities: Chief Executive Officer.
Australian Listed Company Directorships held in the past three years: None.
Interest in shares and options: 9,515,729 ordinary shares, nil options and 20,202 rights over ordinary shares in Jumbo Interactive Limited.
Bill LyneExperience: Appointed as a board member on 30 October 2009. Bill Lyne is the principal of Australian Company Secretary Service, providing company secretarial, compliance and governance services to public companies. He is currently company secretary of two other publicly listed companies, is a former secretary and/or director of a number of other listed companies,
and has a wealth of experience in corporate governance principles and practices.
Bill is a fellow of Governance Institute Australia and has been a presenter at GIA courses in company secretarial practice.
Qualifications: Bachelor of Commerce; Chartered Accountant.
Special responsibilities: Chair of the Audit and Risk Management Committee; member of the Nomination and Remuneration Committee; and Company Secretary.
Australian Listed Company Directorships held in the past three years: None.
Interest in shares and options: 2,000 ordinary shares only in Jumbo Interactive Limited.
Giovanni RizzoExperience: Appointed as a board member on 1 January 2019. Giovanni Rizzo is a specialist in the gaming industry with over 20 years’ experience in various management roles of large listed lottery, casino and electronic gaming machine businesses in South Africa, Canada and Australia. Most recently, Giovanni was Head of Investor Relations at Tatts Group Limited, Australia’s exclusive operator of licenced lotteries.
Qualifications: Bachelor of Commerce (Honours) in Finance and Audit; Chartered Accountant in Australia, New Zealand and South Africa.
Special responsibilities: Chair of the Nomination and Remuneration Committee; member of the Audit and Risk Management Committee.
Australian Listed Company Directorships held in the past three years: None.
Interest in shares and options: 2,000 ordinary shares only in Jumbo Interactive Limited.
Sharon ChristensenExperience: Appointed as a board member on 1 September 2019, Sharon Christensen has 29 years of commercial, legal and regulatory experience and is a research leader in regulatory responses to digital innovation and disruption. Most recently, Sharon was a Non-Executive Director of Property Exchange Australia Ltd, the operator of the national online property exchange network, and is a member of the Australian Institute of Company Directors.
Qualifications: Bachelor of Laws (Honours); Master of Laws.
Special responsibilities: Member of the Nomination and Remuneration Committee.
Australian Listed Company Directorships held in the past three years: None.
Interest in shares and options: 2,050 ordinary shares only in Jumbo Interactive Limited.
Company SecretaryMr Bill Lyne was appointed Company Secretary 19 October 2007.
Refer to the information on Directors for details of experience and qualifications.
Principal ActivitiesThe principal activity of the Group during the financial year was the retail of lottery tickets through the internet and mobile devices sold both in Australia and eligible overseas jurisdictions.
There were no significant changes in the nature of the Group’s principal activities that occurred during the financial year.
DIRECTORS’ REPORTReview of operationsA review of the Group’s operations for the financial year and the results of those operations, is contained in the Operating and Financial Review as set out on pages 42 to 45 of this report.
DividendsA fully franked final dividend of 21.5 cents per fully paid ordinary share for the year ended 30 June 2019 was paid on 20 September 2019, and a fully franked interim dividend of 18.5 cents per fully paid ordinary share for the year ended 30 June 2020 was paid on 20 March 2020.
On 26 August 2020, the Directors have determined to pay a fully franked final dividend for the financial year ended 30 June 2020 of 17.0 cents per fully paid ordinary share (2019: 21.5 cents per fully paid ordinary share), to be paid on 30 September 2020.
Further details of dividends provided for or paid are set out in note 15: Dividends to the Consolidated Financial Statements on page 78.
State of AffairsChanges in the state of affairs are set out on page 45 and form part of the Directors’ Report for the financial year ended 30 June 2020.
Corporate Governance StatementThe Corporate Governance Statement is available on the Company's website at https://www.jumbointeractive.com/governance/corporate_gov-ernance_statement.pdf.
Events after the reporting dateApart from (i) the revised long-form reseller agreement signed with Tabcorp as announced 25 August 2020 and consequent payment of the $15,000,000 extension fee, and (ii) the final dividend declared, as at the date of this Directors’ Report, the directors are not aware of any matter or circumstance that has arisen that has significantly affected, or may significantly affect, the operations of the Company in the financial years sub-sequent to 30 June 2020.
The above items are not recognised in the financial statements 30 June 2020.
Likely developments, key business strategies and future prospectsThe Company is evolving from a single- to a dual-stream revenue business with the burgeoning Software-as-a-Service (SaaS) business segment taking shape and which will expand in FY2021.
Our businessThe Group is a leading digital retailer of both national jackpot lotteries and charity lotteries. We utilise the latest technology to craft an engaging and entertaining purchase experience for our customers across a range of digi-tal platforms.
Reseller businessThis is a well established digital reseller business through its flagship ser-vice www.ozlotteries.com, which activities include the sale of Australian lotteries (national and charities) in eligible jurisdictions in both Australia and internationally.
There is a long, strong relationship that started with Tattersall’s more than 15 years ago and continues today with Tabcorp following the merger of the companies in December 2017. Sale of national lottery games are undertaken through the following lottery agreements with Tabcorp:
• Victoria – 10 years to 25 August 2030 with renewal negotiations 9 months prior to expiry, for sales to customers in Victoria
• New South Wales – 10 years to 25 August 2030 with renewal negotia-tions 9 months prior to expiry, for sales to customers in New South Wales, Tasmania and the Australia Capital Territory
• South Australia - 10 years to 25 August 2030 with renewal negotiations 9 months prior to expiry, for sales to customers in South Australia
• Northern Territory - 10 years to 25 August 2030 with renewal negotiations 9 months prior to expiry, for sales to customers in the Northern Territory and eligible overseas jurisdictions
Tabcorp have a strategically important substantial stake in the Company which is currently 11.6%.
The domestic internet market is currently estimated to be ~28% of the total domestic lottery market, and increasing at ~3 to ~4 percentage points p.a. (the five year CAGR to FY2020 is 21.9%). This compares to more mature overseas markets such as UK and Finland where the internet market is esti-mated to have reached ~31% and ~48% respectively.
The Company started selling Charity lottery tickets in July 2015 and added one charity during the financial year for a current total of seven chari-ties, and increased sales by 14% in FY2020. At least one further charity is expected to be added in FY2021, and sales growth is expected to continue.
Charity lottery games are undertaken through the following lottery agreements:
• Mater – 5 years from 19 April 2017 • Endeavour Foundation – 5 years from 12 June 2017 • Surf Life Saving Lotteries - 5 years from 31 May 2017 • RSPCA – 5 years from 24 April 2018 • The Deaf Lottery Association – 5 years from 21 November 2017 • ACT for kids – 5 years from 19 July 2017 • Classics For A Cause – 1 + 1 year from 1 June 2020
The Company is well placed to continue with its medium to long term plans with confidence to grow the internet lottery business segment in Australia.
Software-as-a-Service (SaaS) businessThe burgeoning SaaS business is engaged in licensing its lottery platform (PoweredByJumbo) (PBJ) which has been developed from experience over the past 15 years and is used for the Company’s www.ozlotteries.com business, as well as providing lottery services. The Company currently has agreements signed with customers with TTV of ~$140 million that is expected to generated incremental revenue of ~$4.5 million, incremental profit of ~$3.4 million, and incremental EBITDA of ~$3.9 million, with ~75% estimated in FY2021 and 100% in FY2022.
The Company currently has the following SaaS agreements:
• Mater – 5 + 5 years from 8 November 2018. Fully live July 2020 • Endeavour Foundation – 5 + 5 years from 15 August 2019. Digital live and
expected to be fully live by 31 October 2020 • Deaf Services – 5 + 5 from 5 December 2019. Expected to be fully live by
September 2020 • Multiple Sclerosis Queensland – 5 + 5 from 25 February 2020. Anticipated
to be fully live by 31 December 2020 • Classics For A Cause – signed 8 April 2020 - 1 + 1 year from live date
expected to be by 30 September 2020
The SaaS objective is to sign up customers with an aggregate TTV of $100 million each year whether this be two customers with TTV of $50 million each or 10 customers with TTV of $10 million each.
The Company acquired Gatherwell Limited in the UK on 29 November 2019, which is a licenced External Lottery Manager providing a turnkey digital lot-tery solution to lotteries across the UK, that also has application in Australia and elsewhere internationally. Gatherwell’s main customers are schools through www.yourschoollottery.co.uk , local authorities/councils, and small society lotteries through www.onelottery.co.uk and other individual brands. There are good growth prospects with approximately 32,770 schools of which ~1,300 are existing Gatherwell customers ~ 4% and about 408 princi-pal councils of which ~67 are existing Gatherwell customers ~16%.
The SaaS business segment is also well placed for expected strong growth over the medium to long term.
38 JUMBO INTERACTIVE LTD ANNUAL REPORT 2020 JUMBO INTERACTIVE LTD ANNUAL REPORT 2020 39

GroupThe new 10 year extension to the Tabcorp agreements and strategy to accelerate the growth of the SaaS business will result in an uplift of oper-ating expenses for FY2021. These increased operating expenses will underpin the planned continued growth of Jumbo over the next three to five years with the principal uplift relating to increased marketing expenses and marketing software capabilities to drive TTV growth. There will also be an uplift in employee costs and consulting/contracting costs to give Jumbo the bench strength to accelerate the growth of the SaaS business.
Coronavirus (COVID-19) pandemic
There has been a positive financial impact of COVID-19 up to 30 June 2020 for the Group. With people working from home and social distancing being in effect there has been an increase in digital lottery sales but increased levels of unemployment and uncertainty of reduced spend of disposable
income. Tracking low level jackpots has seen an increase in ticket sales on a like-for-like basis. Gatherwell’s core subscription business has held up well and signing up of new customers has had to be deferred due to lock-down restrictions in the UK which in turn will defer expected future growth.
We remain committed to keeping our employees and their families safe and ensuring their ongoing health and wellbeing during this unprecedented time. A work from home (WFH) policy has been introduced and staff can work between home and the office as required. The Company has a COVID-safe plan that it operates to.
Environmental regulation
The Group’s operations are not regulated by any significant environmental regulation under a law of the Commonwealth or of a State or Territory.
Directors’ meetingsThe number of meetings of the Board of Directors (including board committees) held during the year ended 30 June 2020 and the number of meetings attended by each Director is set out in the table below:
Meetings table1 Board Audit and Risk Management Committee Nomination and Remuneration Committee
Director Eligible to attend Attended Eligible to attend Attended Eligible to attend Attended
David Barwick 20 20 9 9 3 3
Mike Veverka 20 20 - - - -
Bill Lyne 20 19 9 8 3 3
Sharon Christensen 17 17 - - 2 2
Giovanni Rizzo 20 20 9 9 3 3
1 Meetings include Circulating Resolutions
On the advice of the Audit and Risk Management Committee, the Directors are satisfied that the provision of non-audit services by the auditor, as set out above, did not compromise the auditor independence requirements of the Corporations Act 2001 for the following reasons:
• all non-audit services have been reviewed by the Audit and Risk Management Committee to ensure that they do not impact the integrity and objectivity of the auditor; and
• none of the non-audit services undermine the general principles relat-ing to auditor independence as set out in APES 110 Code of Ethics for Professional Accountants.
Details of the amounts paid to BDO for non-audit services throughout the year are set out below:
Consolidated
Taxation services2020
$2019
$
Tax compliance services - tax returns 52,500 43,000
Other tax advice 9,300 6,000
Total taxation services 61,800 49,000
Other services
Accounting advice - 5,250
Whistleblower services 6,500 5,000
Due diligence 84,423 -
Total other services 90,923 10,250
Total fees for non-audit services 152,723 59,250
CEO and CFO declarationThe Chief Executive Officer (CEO) and Chief Financial Officer (CFO) have provided a written declaration to the Board in accordance with section 295A of the Corporations Act 2001.
With regards to the financial records and systems of risk management and internal compliance in this written declaration, the Board received assurance from the CEO and CFO that the declaration was founded on a sound system of risk management and internal control, and that the system was operat-ing effectively in all material respects in relation to the reporting of financial risks.
Proceedings against the CompanyNo person has applied to the Court under section 237 of the Corporations Act 2001 for leave to bring proceedings on behalf of the Company, or to intervene in any proceedings to which the Company is a party, for the pur-pose of taking responsibility on behalf of the Company for all or part of those proceedings.
No proceedings have been brought or intervened in on behalf of the Company with leave of the Court under section 237 of the Corporations Act 2001.
Remuneration ReportThe Remuneration Report is set out on pages 47 to 55, and forms part of the Directors’ Report for the financial year ended 30 June 2020.
Rounding of amountsThe company satisfies the requirements of ASIC Corporations (Rounding in Financial/Directors’ Reports) Instrument 2016/191 issued by the Australian Securities and Investments Commission in relation to rounding of amounts in the directors’ report and the financial statements to the nearest thousand dollars. Amounts have been rounded off in the directors’ report and financial statements in accordance with that Legislative Instrument.
Auditor’s Independence Declaration
A copy of the Auditor’s Independence Declaration, as required under section 307C of the Corporations Act 2001, is set out on page 56.
This Directors’ Report is made in accordance with a resolution of the Directors of the Company.
David K BarwickChairman Brisbane26 August 2020
Share optionsUnissued ordinary shares of the Company under options at the date of this report are as follows:
Date options granted Expiry date
Exercise price
of shares
Number under option
18 November 2015 18 November 2020 $1.75 100,000
15 November 2017 15 November 2022 $3.50 600,000
700,000
The holders of these options do not have any rights under the options to participate in any share issue of the Company or of any other entity.
During or since the financial year ended 30 June 2020, the following ordi-nary shares of Jumbo Interactive Limited were issued on the exercise of options granted.
Date options granted Issue price of share Number of shares issued
18 November 2015 $1.75 150,000
15 November 2017 $3.50 150,000
300,000
No amounts are unpaid on these shares.
During or since the financial year ended 30 June 2020, the following rights were granted by Jumbo Interactive Limited to Directors and key manage-ment personnel, including the five most highly remunerated officers, of the Group as part of their remuneration.
NameNumber of
rights grantedNumber of ordinary
shares under right
Directors
Mike Veverka 70,453 70,453
Other key management personnel
Xavier Bergade 30,823 30,823
Brad Board 30,823 30,823
David Todd 30,823 30,823
162,922 162,922
Indemnifying officers or auditorDuring the financial year, the Company paid a premium in respect of a con-tract insuring directors, secretaries and executive officers of the Company and its controlled entities against a liability incurred as director, secretary or executive officer to the extent permitted by the Corporations Act 2001. The contract of insurance prohibits disclosure of the nature of the liability and the amount of the premium.
The Company has not otherwise, during or since the end of the financial year, except to the extent permitted by law, indemnified or agreed to indem-nify an officer of the Company or any of its controlled entities against a liability incurred as such an officer. No indemnity has been provided to, or insurance paid on behalf of, the auditor of the Group.
Non-audit servicesDuring the financial year, the Company’s auditor BDO Audit Pty Ltd, or their related practices (herein also referred to BDO), performed other services in addition to its audit responsibilities.
On the advice of the Audit and Risk Management Committee, the Directors are satisfied that the provision of non-audit services, during the year, by the auditor (or by another person or firm on behalf of the auditor), is com-patible with the general standard of independence for auditors imposed by the Corporations Act 2001.
40 JUMBO INTERACTIVE LTD ANNUAL REPORT 2020 JUMBO INTERACTIVE LTD ANNUAL REPORT 2020 41

Consolidated results of operationsThe Company reports revenue on a net revenue inflow basis where it considers that it acts more as an Agent than as a Principal such as with the sale of lot-tery tickets. The gross amount received for the sale of goods and rendering of services is advised as Total Transaction Value (TTV) for information purposes. Refer to note 2: Revenue and other income for details.
Continuing operations FY2020 FY2019Variance
%
TTV 348,601 320,659 8.7%
Revenue 71,168 65,212 9.1%
Cost of sales (5,326) (5,068) 5.1%
Gross profit 65,842 60,144 9.5%
Other income 1,318 1,936 (31.9%)
Expenses (29,735) (23,861) 24.6%
NPBT 37,425 38,219 (2.1%)
Income tax Expense (11,542) (11,799) (2.2%)
NPAT 25,883 26,420 (2.0%)
EBITDA 42,641 40,188 6.1%
EBIT 36,654 36,755 (0.3%)
Cycling off a comparative period of relatively high large jackpot activity, the Company achieved a reasonable increase in TTV and Revenue due mainly to increased customer activity together with the acquisition of Gatherwell Ltd in the UK on 29 November 2019. During the financial year, the number of new online accounts increased by 21.1% to 350,319 (2019: 444,004) and number of active online customers increased by 8.6% to 827,411 (2019: 761,863), while the number of large jackpots decreased by 20.4% to 39 (2019: 49) and average value increased by 4.4% to $40.1 million (2019: $38.4million). The increase in expenses is largely related to (i) increased depreciation and amortisation with increased investment in the software platform and the introduction of accounting standard AASB 16 Leases, (ii) increased employee benefits with an increase in staff headcount to underpin the planned growth in the burgeoning Software-as-a-Service (SaaS) busi-ness segment, and (iii) being a larger company in the ASX300 Index with increased associated costs such as share registry activity, remuneration for an expanded Board. The overall decrease in Net profit after tax resulted from an increase in TTV and Revenue and a step-up in costs to position the Company for SaaS growth.
The Company continues to invest in the three main pillars that support the ongoing growth of the Company with $6,432,000 (2019: $4,839,000) on its proprietary software platform (intangible assets), $5,577,000 (2019: $6,956,000) in marketing activities primarily to acquire new and retain existing customers, and $11,613,000 (2019: $8,731,000) on employees who provide the software development and marketing skills, customer support services, and management.
Comparative analysisCompared to FY2019:
TTV increased $27,942,000 or 8.7% to $348,601,000, principally due to:
• $20,253,000 or 6.3% increase to $339,983,000 in Australia Lotteries mainly as a result of increased customer activity; and
• $7,715,000 from Gatherwell Ltd for seven months since being acquired 29 November 2019.
Revenue increased $5,956,000 or 9.1% to $71,168,000 due mainly to:
• $4,463,000 or 6.9% increase to $68,746,000 in Australia Lotteries as a result of the increased TTV and the inclusion of $260,000 from the
burgeoning Software-as-a-Service business. The revenue margin is affected by product mix, driven by large jackpot activity, and was an edge higher at 20.4% (2019: 20.3%); and
• $1,520,000 from Gatherwell Ltd for the seven months since being acquired 29 November 2019.
Cost of sales increased by $258,000 or 5.1% to $5,326,000 with a change in presentation of bank merchant fees and service fees for FY2019 from Expenses to COSs (see note 3: Expenses for details).
• the margin to TTV is a slightly lower at 1.5% (2019: 1.6%).
Other income, being mainly interest on cash and cash equivalents, decreased by $618,000 or 31.9% to $1,318,000 largely as a result of:
• $487,000 or 33.3% decrease in interest on cash and cash equivalents for Australia Lotteries and Corporate through lower average balances mainly with the acquisition of Gatherwell Ltd for ~$10,000,000 cash and lower average interest rates (see note 19 (ii): Business combinations for details); and $107,000 or 26.9% decrease in foreign currency gains
Expenses increased by $5,874,000 or 24.6% to $29,735,000 with a change in presentation of bank merchant fees and service fees for FY2019 from Expenses to COSs (see note 3: Expenses for details). The increase is mainly due to:
• $1,378,000 or 19.8% decrease in marketing costs to $5,578,000 largely in Australia Lotteries due to the lower number of large jackpots;
• $2,553,000 or 74.4% increase in depreciation and amortisation to $5,986,000 mainly due to (i) a change in accounting standards AASB 16 Leases (see note 13: Lease liabilities for details) and (ii) increased intangi-bles generated internally and through the Gatherwell Ltd acquisition (see notes 9: Intangible assets and 10: Right-of-use assets and details);
• $2,757,000 or 31.6% increase in employee costs to $11,488,000 due largely to increased staff numbers to support the expanding business
• $2,180,000 or 55.8% increase in other administrative expenses mainly as a result of an expanded business.
OPERATING AND FINANCIAL REVIEW
NPBT of operations decreased $794,000 or 2.1% to $37,425,000, principally due to:
• $211,000 or 0.5% increase in Australia Lotteries profits due to increased TTV and Revenue and costs which increased by 18.2%;
• a decrease of $44,000 or 8.9% in All Other Segment profits from decreased TTV/Revenue and increased expenses;
• $151,000 contribution from Gatherwell Ltd acquired 29 November 2019; and
• $1,112,000 or 41.5% increase in Corporate losses mainly as a result of decreased other revenue $156,000 and increased expenses $956,000
Australia Lotteries NPBT increased by 0.5% or $211,000 due to:
• increased TTV by 6.3% or $20,253,000 and Revenue and other income by 6.0% or $3,958,000 largely from improved customer activity;
• increased cost of sales by 1.4% or $70,000; and • increased costs by 18.2% or $3,677,000 largely due to lower market-
ing expenses $1,406,000, increased depreciation and amortisation $2,264,000, increased employee benefits $2,444,000
All Other Segments NPBT decreased 8.9% or $44,000 due to:
• decreased revenue of 2.9% or $27,000; and increased costs by 3.9% or $17,000.
Software-as-a-Service UK NPBT contribution $151,000 with the acquisition of Gatherwell Ltd on 29 November 2019.
The level of customer activity, together with large jackpot activity, are an important driver of sales. The level over the last three financial year periods is summarised in the following table:
Large jackpot activity FY 2020 FY 2019 FY 2018
TTV - Internet Lotteries Australia $340.0 m $319.7 m $183.0 m
Reported Revenue - Internet Lotteries Australia $68.7 m $64.3 m $39.8 m
Customer Activity
Number of new online accounts 350,319 444,004 214,908
Number of active online customers 827,411 761,863 437,540
OzLotto/Powerball
Number of jackpots1 39 49 32
Average Div 1 jackpot1 $40.1 m $38.4 m $28.4 m
Peak Div 1 jackpot2 $150 m $100 m $55 m
Aggregate Div 1 jackpots2 $1,565 m $1,880 m $910 m
1 Ozlotto/Powerball Division 1 jackpots of $15 million or more2 during the financial year period
Reconciliation to Statutory EarningsUnderlying earnings is a non-statutory measure and is the primary reporting measure used by management and the Group’s chief operating decision maker for the purposes of managing and assessing the financial perfor-mance of the business. Underlying earnings is derived by adjusting the statutory earnings for significant non-recurring, non-operating items as follows:
FY2020 $’000
FY2019 $’000
Underlying EBITDA 43,223 40,188
Underlying EBIT 37,236 36,919
Underlying NPAT 26,465 26,420
Add/(deduct) significant items
• Acquisition costs (406) -
• Fair value of financial liability (176) -
Statutory EBITDA 42,641 40,188
Statutory EBIT 36,654 36,919
Taxation benefit/(expense) - -
Statutory NPAT 25,883 26,420
The acquisition costs relate to the acquisition of Gatherwell Limited in the UK on 29 November 2019.
The revaluation of fair value is an increase in the fair value of the deferred contingent compensation liability payable for the Gatherwell acquisition based on an higher probability of this being paid when it is due after 30 June 2021.
Segment review
(a) Online Lottery SegmentThis segment consists of reseller activities with the sale of the Australian lottery games (national and charities) in Australia and other eligible jurisdictions.
Improved customer activity (new customers and engagement with existing customers) together with the mixed level of large jackpot activity combined to increase revenue by 6.9% to $68,746,000 (2019: $64,283,000) despite cycling off a comparative period of high large jackpot activity. Other income decreased by $505,000 or 35.8% mainly due to decreased interest rev-enue with lower average balances and lower average interest rates, and reduced foreign exchange gains. Net profit before tax increased by 0.5% to $40,614,000 (2019: $40,403,000) due to the higher customer activity and mixed large jackpot activity notwithstanding an increase in expenses of 18.2% or $3,677,000, which mainly relate to a decrease in market-ing $1,406,000 from lower large jackpot activity, decreased occupancy expenses $607,000 and increased finance costs $209,000 due to the adoption of AASB 16 Leases, and an increase in administrative expenses $5,479,000.
The $5,479,000 increased administrative expenses is mainly due to an increase in depreciation and amortisation $2,264,000 with an increased investment in the software platform and a change in accounting standards AASB 16 Leases, an increase in employee benefits $2,444,000 and payroll tax $163,000 to support the burgeoning SaaS business segment, and an increase in software licensing $564,000 to provide enhanced marketing capabilities to SaaS customers which will also benefit the Company’s own reseller business.
TTV for the financial year increased by 6.3% to $339,983,000 (2019: $319,730,000), which includes a 14.1% increase in charity lottery sales to $8,864,000 (2019: $7,770,000), 2.6% of TTV (2019: 2.4%).
Included in the TTV, Revenue and NPBT is $260,000 (2019: $nil) from the emerging SaaS business segment which will be reported separately in FY2021.
Jumbo invests extensively in online marketing to grow and activate the cus-tomer database whom transact via its website (www.ozlotteries.com) and associated mobile apps (iOS & Android).
The following key performance indicators (KPI’s) are used to track the effec-tiveness of these campaigns:
1. Number of new online accounts defined by new customers creating an account in a given period.
2. Number of Active Online Customers defined as customers who have spent money on tickets in a given period.
3. Average spend per active online customer defined as the total spent by active online customers divided by the number of active online customers in a given period.
4. Cost per Lead (new online accounts) defined as total cost to acquire these new accounts divided by the number of new accounts in a given period. New accounts potentially become active customers after the account has been established.
The following table summarizes the Marketing KPI’s:
www.ozlotteries.com and mobile apps FY 2020 FY 2019
Number of new online accounts 350,319 444,004
Number of active online customers 827,411 761,863
Average spend per active online customer $383.12 $385.44
Cost per lead $14.28 $13.81
42 JUMBO INTERACTIVE LTD ANNUAL REPORT 2020 JUMBO INTERACTIVE LTD ANNUAL REPORT 2020 43

The 21.1% decrease in new online accounts is largely due to a reduction in marketing on customer acquisitions due to lower large jackpot activ-ity (20.4% lower in number and 4.4% higher in average value). The 8.6% increase in active online customers is due mainly to customer engage-ment activities. The 0.6% decrease in average spend is largely due to the decrease in large jackpot activity and the 3.4% increase in CPL is mostly due to the marketing mix and decrease in large jackpot activity.
(b) All Other SegmentsThis segment consists of the sale of non-lottery products and services. TTV and Revenue and other income increased to $902,000 (2019: $929,000) and net profit before tax increased to $450,000 (2019: $494,000), due to decreased revenue and increased expenses.
(c) Software-as-a-Service (SaaS) UKThis segment consists of the provision of lottery software services in the UK with the acquisition of Gatherwell Limited on 29 November 2019. Gatherwell provides a turnkey digital lottery solution to charities in the UK and has appli-cation in Australia and elsewhere internationally. For the seven month period to 30 June 2020, TTV was $7,715,000, Revenue $1,520,000 and net profit before tax $151,000.
The NPBT of $151,000 is after the Consolidation expense of $263,000 (2019: $nil) amortisation of developed software and customer contracts and relations that arose on consolidation with the acquisition of Gatherwell Limited in the UK on 29 November 2019. Before this expense, the underlying NPBT of Gatherwell is $414,000.
(d) CorporateThe net loss increased by 41.5% or $1,112,000 to NLBT $3,790,000 (2019: NLBT $2,678,000) mainly due to increased expenses $956,000 or 29.8% largely from (i) non-recurring costs $406,000 relating to the acquisition of Gatherwell Limited, (ii) decreased employee benefits in salaries and share-based payments $466,000 with a reduction in the exercise of staff options during the financial year, (iii) increased expenses associated with being a larger company in the ASX300 Index - increased share registry related expenses $234,000 from increased share register activity and market capitalisation, and increased directors’ remuneration $299,000 with the appointment of additional directors on 1 January 2019 and 1 September 2019, and increased insurance expenses $224,000. With an increased probability of paying the earnout milestone following 30 June 2021 year end (deferred contingent consideration) for the Gatherwell acquisition, increase in the fair value of this consideration amount payable has been expensed $176,000. Other revenue decreased 29.6% or $156,000 from lower average balances and lower average interest rates.
Summary of resultsThe annual comparison of results of the Company for the past five years is summarised below:
Revenue/profits ($’000) FY2020 FY2019 FY2018 FY2017 FY2016
TTV 348,601 320,659 183,146 145,322 153,302
Revenue 71,168 65,212 39,775 32,429 34,083
NPAT – overall operations 25,883 26,420 12,127 5,640 4,670
NPAT – continuing operations 25,883 26,420 11,753 7,597 7,323
NPAT – discontinued operations - - 374 (1,957) (2,653)
EBITDA – continuing operations 42,641 40,188 19,415 14,094 13,717
EBIT – continuing operations 36,654 36,755 16,241 10,463 10,073
Assets FY2020 FY2019 FY2018 FY2017 FY2016
Cash at bank1 ($’000) 72,259 84,583 47,919 43,320 25,306
Net assets ($’000) 78,919 77,378 47,211 42,900 24,696
Net tangible assets ($’000) 53,174 61,780 33,124 30,484 12,949
Return on capital employed (%) – overall operations 32.8 34.1 25.7 13.1 18.9
Return on capital employed (%) – continuing operations 32.8 34.1 24.9 17.7 29.6
Return on capital employed (%) – discontinued operations - - 0.8 (4.6) (10.7)
1 includes cash held under term deposit and customer account balances payable (refer note 7: Cash and Cash Equivalents and Note 11: Trade and Other Payables for details)
Share price FY2020 FY2019 FY2018 FY2017 FY2016
Earnings per share (cps) 42.5 43.9 23.4 12.6 10.6
Dividends paid per share (cps) 40.0 34.0 35.5 8.5 3.5
Share price at financial year end (cps) 958.0 2015.0 500.0 266.0 130.0
Total shareholder return (%) (50.5) 309.8 101.3 111.2 57.1
Shares on issue (million) 62.4 62.1 54.4 50.7 44.1
Market capitalisation ($’million) 598.0 1,251.8 271.9 134.8 57.3
Financial positionThe net assets of the Group have increased by $1,541,000 from 30 June 2019 to $78,919,000.
The Group’s working capital, being current assets less current liabilities, has decreased from $61,870,000 in 2019 to $52,434,000 in 2020 mainly as a result of decreased cash and cash equivalents of $12,324,000. $8,789,000 of this decrease was the purchase of Gatherwell Limited in the UK for cash (see note 19: Business combinations for details)
Non-current assets increased by $17,394,000 to $33,520,000 due mainly to (i) the investment in the software platform, (ii) goodwill, intangible assets and deferred consideration on the acquisition of Gatherwell Limited, and (iii) right-of-use assets on the adoption of new accounting standard AASB 16 Leases.
The Directors believe the Group is in a sound financial position to expand and grow its current operations.
Significant changes in State of AffairsSignificant changes in the state of affairs of the Group for the financial year were as follows:
Decrease in cash of $12,324,000 resulting from: $’000
Purchase of Gatherwell Limited including contingent consideration and net of cash acquired (see note 19: Business combinations for details)
8,789
Other activities (see Statement of Cash Flows for details) 3,535
12,324
Increase in non-current assets of $17,394,000 resulting from: $’000
investment in website development costs net of amortisation (see note 9: Intangible assets for details)
2,038
Goodwill, software and customer relationships and contracts on acquisition of Gatherwell Limited (see note 9: Intangibles assets and note 19: Business combinations for details)
8,090
Right-of-use assets with adopting AASB 16 Leases (see note 10: Right-of-use assets for details)
5,185
Other non-current assets (see note 19: Business combinations for details)
1,761
Changes in other non-current assets (see notes 4, 8, and 9 for details)
320
17,394
Increase in non-current liabilities of $6,417,000 from: $’000s
Lease liabilities with adopting AASB 16 Leases (see note 13: Lease liabilities for details)
4,395
Contingent consideration at fair value for Gatherwell acquisition (see note 19: Business combinations for details)
1,581
Changes in other non-current liabilities 441
6,417
44 JUMBO INTERACTIVE LTD ANNUAL REPORT 2020 JUMBO INTERACTIVE LTD ANNUAL REPORT 2020 45

Content Page
1. Remuneration Report Introduction 472. Directors and Executives 473. Remuneration policy and link to performance 474. Elements of remuneration 485. Details of Remuneration 516. Performanced base remuneration granted and forfeited during the year 527. Employment contracts of directors and KMP 528. Options and rights granted as remuneration 529. Equity instruments issued on exercise of remuneration options 5410. Value of options and rights to key management personnel 5411. Other transactions and balances 55
REMUNERATION REPORT – AUDITED
1. Remuneration Report IntroductionThe directors present the Jumbo Interactive Limited Remuneration Report for the year ended 30 June 2020, outlining key aspects of our remuneration policy and framework, and remuneration awarded this financial year.
The remuneration framework has been re-designed and new remuneration approach adopted FY2020 and beyond.
The information in this Report has been audited.
2. Directors and Executives
The Key Management Personnel (KMP) of the Group (being those whose remuneration must be disclosed in this Report) includes the Non-Executive Directors and those Executives who have the authority and responsibility for planning, directling and controlling the activities of Jumbo.
The Non-Executive Directors and Executives that were the KMP of the Group during the financial year are identified as follows:
Directors and executives
Name Position held
Non-Executive Directors
David K Barwick Chairman, Independent Non-Executive Director
Sharon Christensen Independent Non-Executive Director
Bill Lyne Independent Non-Executive Director
Giovanni Rizzo Independent Non-Executive Director
Executive KMP
Mike Veverka Director and Chief Executive Officer
David Todd Chief Financial Officer
Xavier Bergade Chief Technical Officer
Brad Board Chief Operating Officer
There have been no changes since the end of the reporting period.
3. Remuneration and link to performanceOur Nomination and Remuneration committee is made up of independ-ent non-executive directors. The committee reviews and determines our remuneration policy and structure annually to ensure it remains aligned to business requirements, and meets our remuneration principles. From time to time, the committee also engages external remuneration consultants to assist with this review (see later in this section for further information). In particular the board aims to ensure that remuneration framework is structured:
• to make the remuneration approach and outcomes easier to understand and more transparent to shareholders;
• to strengthen alignment of remuneration with our strategic vision, with its unique challenges and opportunities, to create long-term shareholder value;
• to attract, motivate and retain the talent that we require to succeed in the long-term; and,
• to create a maximum remuneration opportunity for senior Executives that rewards them with both cash and locked-in equity that ensures strategic decisions are focused on delivering long-term value rather than short-term outcomes.
Total Remuneration Opportunity (TRO) comprises fixed remuneration and incentives.
The remuneration framework for Executive KMP comprises four components:
• 50% is paid as a fixed remuneration (FR) not ‘at risk’ that comprises a base salary and superannuation. The base salary is benchmarked at the 25th percentile of a group of peer companies in the ASX300 based on market capitalisation which is reviewed annually.
• 25% is payable as a short term incentive (STI) ‘at risk’ component awarded on the achievement of performance conditions over a 12-month period that comprises a 50% cash component and a 50% component
deferred for 2 years into restricted equity with a formal clawback mechanism.
• 25% is payable as a long term incentive (LTI) ‘at risk’ component awarded on the achievement of a performance condition over a three-year period that comprises a 100% restricted equity component with a formal claw-back mechanism.
• minimum shareholding requirement (MSR) comprising holding fully paid ordinary shares in the Company to the value of 100% of the TRO within five years of falling under the remuneration framework.
In establishing the TRO for FY2020, the Company considered data from peer groups and benchmarked this against the 25th percentile of executive remuneration of a peer group of companies, adjusted for role complexity, and scope and availability of similar qualified executives in the domestic market. The Company engaged an independent remuneration consultant in providing this information and the peer benchmark group selected was 56 companies within the ASX300 index based on a 12-month average market capitalisation within 50% to 200% of Jumbo's market capitalisation of $960 million at 31 December 2018.
Balancing short-term and long-term performanceAnnual incentives are set at a maximum of 50% of fixed remuneration, in order to drive performance without encouraginng undue risk-taking. Sustainability of results is also ensured by the deferral of 50% of the short-term incentives for 2 years. This also encourages talent retention. Long-term incentives are assessed over a three year period and are designed to pro-mote long-term stability in shareholder returns.
The target remuneration mix for FY2020 is shown in figures below. It reflects the STI opportunity for the current year that will be available if the performance conditions are satisfied at target, and the value of the LTI rights granted at the beginning of the year, as determined at the grant date.
46 JUMBO INTERACTIVE LTD ANNUAL REPORT 2020 JUMBO INTERACTIVE LTD ANNUAL REPORT 2020 47

Setting the annual STI poolThe Nomination and Remuneration Committee will set an organisational total financial STI pool before the start of the financial year based on growth from the prior financial year. This financial STI pool will be formed as follows:
• for every 1% of underlying NPAT growth between 5.0% to 10.0% under-lying NPAT growth over the prior financial year, 0.5% of NPAT will be allocated to the STI pool
• for every 1% of underlying NPAT growth between 10.0% to 20.0% under-lying NPAT growth over the prior financial year, 0.25% of NPAT will be allocated to the STI pool
• total organisational pool size will be capped at 5% of annual NPAT
Each executive’s share of the total STI pool created will be based on a calcu-lation schedule of receiving between 0% to 100% of their maximum potential Financial STI opportunity depending on the level of underlying NPAT growth achieved between 6% to 20%. As an example, if the underlying NPAT growth for a financial year comes in at 12%, then the executive will receive 60% of their maximum Financial STI potential.
Assessing performance and claw-back of remunerationThe Nomination and Remuneration committee is responsible for assessing performance against KPIs and determining the STI and LTI to be paid. To assist in this assessment, the committee receives detailed reports on the performance from management which are based on independently verifiable data such as financial measures, market share, signed agreements and data available from independent providers.
In the event of serious misconduct or a material misstatement in the Company’s financial statements, the committee can cancel or defer perfor-mance-based remuneration and may also claw back performance-based remuneration paid in previous financial years.
4. Elements of remuneration
(i) Fixed annual remuneration (FR)The FR of Executives will consist of the cash salary, statutory superannua-tion contributions and other employee-elected salary sacrificed benefits.
FR will be set with reference to the Executive’s knowledge, experience and skills, the magnitude of the responsibilities and complexities associated with the role and peer benchmarks. Benchmarking will be set at the 25th percen-tile of the Jumbo benchmark peer group. The peer group are comparable companies within the ASX300.
In light of the significant challenges that COVID-19 is posing to the Australian economy and in recognition of the hardship that many of our customers may be facing, the Nomination and Remuneration Committee has decided to freeze any fixed remuneration increases for KMP for FY2021. The level of fixed remuneration for KMP will be reviewed for the FY2022 financial year.
FR will always be considered in the context of the total remuneration pack-age payable to an Executive to ensure that the entire remuneration package is fair and competitive.
1 Jul2019
30 Jun2020
30 Jun2021
30 Jun2022
Two-year restriction period
Short-term Incentive(25% of TRO and subject to financial/operational hurdles)
50% of STI deferred into restricted rights/shares(1-year time-based restriction + 1 year lock-up period)
One-year performance period
Grant of Rights
Payment of 50% cash STI
Vesting of Rights
1 Jul2019
30 Jun2020
30 Jun2021
30 Jun2022
30 Jun2023
Three-year performance period
Long-term Incentive Performance Hurdle(25% of TRO and subject to long term share price growth)
100% of LTI held as restricted rights(Qualification price performance hurdle - 100% weighting = Cliff Vesting)
Exercise period to exercise vested perfomance rights
Grant of Rights
Vesting of Rights
(ii) Short term incentives
Feature Description
Maximum opportunity CEO and other executives - 25% of FR
Performance metricsThe STI metrics align with our strategic priorities of market competitiveness, operational excellence, shareholder value and fostering tal-ented and engaged people 50% of the STI is allocated to financial targets and 50% to non-financial targets
Metric Target Weighting Reason for selection
Financial Underlying NPAT 1
Sliding scale from 6% increase (10% of STI) to 20% and above increase (100% of STI) 50.0%
Reflects improvements in both revenue and cost control
Non-financial
EPS accretive business acquisition At least one 12.5%
New SaaS agreements At least two 10.0%
Focus of the Group’s growth strategy for the next 2 to 5 years
New ticket Reseller agreement At least one 7.5%
Focus of the Group’s growth strategy for the next 2 to 5 years
Product use satisfaction as measured through product feedback, customer sur-veys and app store/IOS rating Index of more than 75 5.0%
Maintaining competitive advan-tage and market share
Data protection and customer privacy No reportable breaches 5.0%
Compliance with regulations No reportable breaches 2.5%
New customer accounts 345,745 2.5% Maintaining market share
Delivery of new agreements within stated timeframes Actual 2.5%
Staff moraleFinancial year end staff survey of no less than 4/5 2.5%
Reducing staff turnover will reduce costs and hence improve NPAT
Delivery of STI
50% of the STI award is paid in cash
50% of the STI is deferred for two years into shares and is subject to forfeiture on resignation. This encourages retention and share-holder alignment
Board discretionThe Board has the discretion to adjust remuneration outcomes up or down to prevent any inappropriate reward outcomes, including reducing (down to zero, if appropriate) any deferred STI award
1 statutory NPAT before non-recurring/operating revenue/expenses and KMP/staff incentives
(iii) Long-term incentivesExecutive KMP participate in an LTI award comprising annual grants of rights over fully paid ordinary shares which are subject to a three-year relative to Total Return growth rate condition. Further detail is shown in the table below:
Feature Description
Maximum allocation Each Executive will receive an annual grant of rights to a dollar value equal to 25% of their FR with the number of rights based on the 10-day VWAP period up to 30 June of each year. The rights are exercisable into shares three years after grant and achieve-ment of the price performance hurdle. The allocation is divided by the hurdle price of the shares to determine the number of instruments.
Performance hurdle The JIN share price must outperform the historical growth rate of the ASX ‘total return’ All Ordinaries index (XAOA:ASX) in order for the rights award to vest. If the JIN share price does not outperform the ASX All Ordinaries growth hurdle set, no vesting occurs even if JIN has outperformed its peers. This is designed to focus executives on delivering sustainable long-term shareholder returns.
Hurdle price JIN’s share price performance hurdle will be determined in three steps: (i) first, the ‘total return’ will be based on the 15-year average return of the ASX All Ordinaries Total Return Index (XAOA:ASX); (ii) second, the ‘return’ will be multiplied over a 3-year per-formance period on a compound basis and applied to JIN’s 90-day VWAP at the effective date to create the qualification price performance hurdle; and (iii) dividends earned will be included in the 3-year targeted CAGR share price over the qualifying perfor-mance period.
Forfeiture and termination Rights will lapse if the performance hurdle price is not met. Rights will be forfeited on cessation of employment unless the Board determines otherwise as a ‘good leaver’, e.g. retirement due to injury, disability, death or redundancy.
(d) Link between remuneration and performance
FY2020 performance and impact on remunerationThe Group’s performance in FY2020 was reasonable given it was cycling off high jackpot levels in FY2019, and the step-up expenses for the financial year. Management delivered an underlying operating NPAT growth result of 1% which is at the low end of the range, while achieving non-financial targets that will underpin future growth. For more information on strategic priorities and FY2020 results, see pages 42 to 45 of the Operating and Financial Review.
As a result of the performance, the Board awarded Executives 50% of their respective maximum short-term incentives. Half of this incentive is payable as cash with the remaining portion paid in the form of restricted rights. The rights granted under the long-term incentive scheme will be tested in FY2022 subject to satisfying performance conditions.
48 JUMBO INTERACTIVE LTD ANNUAL REPORT 2020 JUMBO INTERACTIVE LTD ANNUAL REPORT 2020 49

Performance against key measures and impact on variable remuneration
Metric Target PerformanceImpact on
incentive award
STI 50% of maximum STI awarded
NPAT 6% to 20% and above increase 1% increase 0%
EPS business acquisition At least one One 100%
New SaaS agreements At least two Two 100%
New ticket reseller agreements At least one One 100%
Product use satisfaction 80 or more index 80.5 100%
Data protection and customer privacy No reportable breaches No reportable breaches 100%
Compliance with regulations No reportable breaches No reportable breaches 100%
New customer accounts 345,745 350,319 100%
Delivery of new agreements in time Actual Extended at customer request 100%
Staff morale No less then 4/5 survey result 4.3/5 100%
LTI No vesting from prior grant
3 year share price hurdle Outperform historic growth rate of ASX All Ordinaries Index (XAOA)
FY2020 - 90-day VWAP $24.98 at 30 June 2022n/a
Statutory performance indicatorsWe aim to align our executive remuneration to our strategic and business objectives and the creation of shareholder wealth. The table below shows measures of the Group’s financial performance over the last five years as required by the Corporations Act 2001. However, these are not necessarily consistent with the measures used in determining the variable amounts of remuneration to be awarded to KMPs (see the table above). As a consequence, there may not always be a direct correlation between the statutory key performance measures and the variable component awarded.
Statutory key performance indicators of the Group over the last five years
FY 2020 FY 2019 FY 2018 FY 2017 FY 2016
TTV continuing operations ($’000s) $348,601 $320,659 $183,146 $145,322 $153,302
Net profit after tax – continuing operations ($’000s) $25,883 $26,420 $11,753 $7,597 $7,323
Net profit after tax – overall operations ($’000s) $25,883 $26,420 $12,127 $5,640 $4,670
Share price at year end (cps) 958 2015 500 266 130
Dividends paid per share (cps) 40.0 34.0 35.5 8.5 3.5
Total shareholder return (%) (50.5%) 309.8% 101.3% 111.2% 57.1%
Earnings per share (cps) 41.5 43.9 23.4 12.6 10.6
Return of capital employed (%) 32.8% 34.1% 25.7% 13.1% 18.9%
Market capitalisation ($‘000s) $598,020 $1,251,794 $271,871 $134,793 $57,284
5. Details of RemunerationDetails of compensation of KMP of Jumbo are set out below:
2020 Short term employee benefits
Post employment
benefits Long term benefits
Equity-set-tled share
based payments
Cash salary, fees and
annual leave $
Cash bonus
$
Non-mon-etary
benefits $
Superan-nuation $
Long ser-vice leave
$
Termination benefits
$
Options and Rights1
$Total
$
Proportion of remu-neration that is
performance based %
Directors
David Barwick 189,954 - - 18,046 - - - 208,000 -
Mike Veverka 843,254 100,000 - 69,406 109,781 - 179,522 1,301,963 21.5
Sharon Christensen2 82,192 - - 7,808 - - - 90,000 -
Bill Lyne 114,115 - - 10,845 - - - 125,000 -
Bill Lyne – as Company Secretary 30,412 - - - - - - 30,412 -
Giovanni Rizzo 114,115 - - 10,845 - - - 125,000 -
Other KMP
David Todd 360,456 43,750 - 30,365 7,836 - 82,368 524,775 24.0
Xavier Bergade 354,666 43,750 - 30,365 5,755 - 143,598 578,134 32.4
Brad Board 347,644 43,750 - 30,365 13,840 - 82,368 517,967 24.3
Total KMP remuneration 2,436,888 231,250 - 208,045 137,212 - 487,856 3,501,251
1includes share based payments over the remaining term on those options exercised, if any, during the financial year2appointed a non-executive director on 1 September 2019
2019 Short term employee benefits
Post employment
benefits Long term benefits
Equity-set-tled share based pay-
ments
Cash salary, fees and
annual leave $
Cash bonus
$
Non-mon-etary
benefits $
Superan-nuation $
Long ser-vice leave
$
Termination benefits
$Options1
$Total
$
Proportion of remu-neration that is
performance based %
Directors
David Barwick 110,500 - - 10,497 - - - 120,977 -
Mike Veverka 489,122 299,280 - 49,095 7,251 - 470,343 1,315,091 22.8
Bill Lyne 83,625 - - 7,944 - - - 91,569 -
Bill Lyne – as Company Secretary 26,353 - - - - - - 26,353 -
Giovanni Rizzo2 26,250 - - 2,494 - - - 28,744 -
Other KMP
David Todd 263,846 158,025 - 38,287 4,084 - 231,342 695,584 22.7
Xavier Bergade 260,075 158,025 - 38,287 4,084 - 145,572 606,043 26.1
Brad Board 262,976 158,025 - 37,213 3,896 - 87,626 549,736 28.7
Total KMP remuneration 1,522,747 773,355 - 183,817 19,315 - 934,883 3,434,117
1includes share based payments over the remaining term on those options exercised, if any, during the financial year2appointed a non-executuve director on 1 January 2019
50 JUMBO INTERACTIVE LTD ANNUAL REPORT 2020 JUMBO INTERACTIVE LTD ANNUAL REPORT 2020 51

6. Performanced base remuneration granted and forfeited during the yearThe table below shows for each KMP how much of their STI was awarded and how much was forfeited. It also shows the value of rights that were granted, exercised and forfeited during FY2020. The number of rights and deferred shares and percentages vested/forfeited for each grant are disclosed in section 8 below.
Performance based remuneration granted and forfeited during the year
Total STI bonus (cash and rights) LTI rights
2020Total opportunity
$Awarded
%Forfeited
%Value granted 1
$Value exercised
$
Mike Veverka 400,000 50 50 400,000 -
David Todd 175,000 50 50 175,000 -
Xavier Bergade 175,000 50 50 175,000 -
Brad Board 175,000 50 50 175,000 -
1 The value at grant date calculated in accordance with AASB 2 Share-based Payment of rights granted during the year as part of remuneration
7. Employment contracts of directors and KMPThe employment conditions of non-executive directors are formalised by let-ters of appointment and KMP are formalised in contracts of employment.
The employment contracts stipulate a range of terms and conditions. These contracts do not fix the amount of remuneration increases from year to year, with remuneration levels reviewed generally each year by the Nomination and Remuneration Committee.
The Company may terminate an employment contract without cause by providing generally four weeks written notice or making payment in lieu of notice, based on the individual’s annual salary component. The employee is entitled to pro-rata STI for the year, and unvested LTI will remain on foot subject to achievement of the performance hurdles. The Board has the dis-cretion to award a greater or lower amount.
The Company or the individual may terminate an employment contract with cause, by providing generally four weeks written notice or making payment in lieu of notice, based on the individual’s annual salary component. The STI is not awarded and all unvested LTI will lapse. Vested and unexercised LTI can be exercised within a period of 30 days from termination.
The policy of the Company is that service contracts are generally unlimited in term.
KMP
KMP
Duration of service
agreement
Fixed remuneration at end of FY20201 Notice period2
Mike Veverka Ongoing $800,000 12 months
David Todd Ongoing $350,000 6 months
Xavier Bergade Ongoing $350,000 6 months
Brad Board Ongoing $350,000 6 months
1 fixed remuneration includes a superannuation component, currently 9.5%2 any termination payment (notice and severance) will be subject to compliance with all rele-vant legislation and will not exceed 12 months
There is no change to the base salaries including superannuation for the financial year ending 30 June 2021.
Non-Executive DirectorsNon-executive directors receive a board fee and fees for chairing or par-ticipating on board committees per the table below. They do not receive performance-based pay or retirement allowances. The fees are inclusive of superannuation.
Fees are reviewed annually by the Nomination and Remuneration Committee taking into account comparable roles and market data provided by the Committee’s independent remuneration advisor. The fees for FY2020 were based on the benchmarking from the independent remuneration consult-ant data referred to in section 3 of this report. The current base fees were reviewed with effect from 1 July 2020.
The maximum annual aggregate directors’ fee pool limit is $750,000 and was approved by shareholders at the Annual General Meeting on 24 October 2019.
FY2021 FY2020
Base fees
Chair $188,000 $188,000
Other nonexecutive directors $100,000 $100,000
Additional fees
Sub-committee chair $15,000 $15,000
Sub-committee member $10,000 $10,000
A minimum shareholding requirement (MSR) applies to non-executive direc-tors comprising holding fully paid ordinary shares in the Company to the value of 100% of TRO within five years of of falling under the remuneration framework or appointment.
8. Options and rights granted as remuneration
Terms and conditions of the share-based payment arrangements
OptionsOptions are issued to key management personnel as part of their remuner-ation at the discretion of the Board. The options are not necessarily issued based upon performance criteria, but are issued to selected executives of the Company and its subsidiaries to increase goal congruence between executives, directors and shareholders.
Options will vest in key management personnel when the share price equals the exercise price, as measured by the five trading day moving volume weighted average price, and on condition that they are currently employed by the Jumbo Interactive Limited Group at the time of vesting. If the key management person leaves before their options vest, then the options will lapse immediately. In the event of retirement or retrenchment, the options will lapse one month after the event and if deceased, the options will lapse three months after the event.
There were no options granted to key management personnel as compensa-tion during the reporting period.
Rights granted over deferred sharesPerformance rights are granted by the Company for nil consideration. Each right is a right to receive one fully paid ordinary share in Jumbo Interactive Limited at no cost if the vesting conditions are satisfied. Rights granted carry no dividend or voting rights.
Short term incentives (STIs)50% of any STI for KMP will be awarded in rights to ordinary shares with the number of rights based on the 10-day VWAP period up to 30 June each year. The rights will vest and convert into shares after a 12-month time based qualifying period provided the executive remains employed by the Group at the vest-ing date, unless otherwise determined by the Board. The sale of these shares is restricted for a further 12 months, resulting in a total two-year lock-up period. Executives will have full entitlement to dividends and voting rights during the 12-month lock-up period. The rights awarded to the CEO under the STI for FY2020 are subject to shareholder approval at the upcoming Jumbo AGM.
Grant date Vesting date Grant date value
30 June 2020 30 June 2021 $9.95
Long term incentives (LTIs)KMP receive an annual grant of rights to a dollar value equal to 25% of their Total Remuneration Opportunity with the number of rights based on the 10-day VWAP period up to 30 June of each year. The rights are exercisable into shares 3 years after grant and achievement of the price performance hurdle and pro-vided the executive remains employed by the Group at the vesting date, unless otherwise determined by the Board. The rights awarded to the CEO under the LTI for FY2020 are subject to shareholder approval at the upcoming Jumbo AGM.
Grant date Vesting date Grant date value
1 July 2019 1 July 2022 $19.80
1 July 2020 1 July 2024 $10.61
Details of the terms and conditions of rights granted to key management personnel as compensation during the reporting period are as follows:
Options and Rights
FY2020
No. options/rights
grantedNo. options/
rights vested
Fair value per option/right
at grant date Exercise priceAmount paid
or payable Expiry date Date exercisable
Directors
Mike Veverka - - - - - - -
LTI rights FY2020 20,202 - $11.809 - - 1 July 2023 1 July 2022
STI rights FY2020 10,050 - $9.95 - - 30 June 2021 30 June 2021
30,252 -
Other key management personnel
David Todd
LTI rights FY2020 8,838 - $11.809 - - 1 July 2023 1 July 2022
STI rights FY2020 4,397 - $9.95 - - 30 June 2021 30 June 2021
Xavier Bergade
LTI rights FY2020 8,838 - $11.809 - - 1 July 2023 1 July 2022
STI rights FY2020 4,397 - $9.95 - - 30 June 2021 30 June 2021
Brad Board
LTI rights FY2020 8,838 - $11.809 - - 1 July 2023 1 July 2022
STI rights FY2020 4,397 - $9.95 - - 30 June 2021 30 June 2021
39,705 -
52 JUMBO INTERACTIVE LTD ANNUAL REPORT 2020 JUMBO INTERACTIVE LTD ANNUAL REPORT 2020 53

The weighted average fair value of rights granted during the 2020 financial year was $11.19.
9. Equity instruments issued on exercise of remuneration optionsDetails of equity instruments issued during the period to key management personnel as a result of options exercised that had previously been granted as compensation are as follows:
2020
Number of shares issued on
exercise of optionsNumber of
options exercised Amount paid per shareAmount unpaid
per share
Other key management personnel
David Todd 25,000 25,000 $3.50 -
Xavier Bergade 150,000 150,000 $3.50 -
Brad Board 25,000 25,000 $3.50 -
200,000 200,000
10. Value of options and rights to key management personnelDetails of the value of options granted and exercised during the year to key management personnel as part of their remuneration are summarised below:
NameValue of options at grant date1
$Value of options exercised at exercise date2
$
Other key management and personnel
David Todd 3,829 404,250
Xavier Bergade - 2,706,000
Brad Board 3,829 404,250
2 The value of options exercised has been determined as the intrinsic value of the options at exercise date i.e. the market price of shares of the Company as at close of trading on the date the options were exercised after deducting the price paid to exercise the options.
Key management personnel include close family members and entities over which the key management person or their close family members have direct or indirect control, joint control or significant influence.
Details of options and rights over ordinary shares of Jumbo Interactive Limited, held indirectly or beneficially by key management personnel are as follows:
Options
FY2020Balance at
1 July 2019
Granted as remuneration
during the year
Exercised during
the yearOther changes during the year
Balance at 30 June 2020
Vested at 30 June 2020
Total vested and exercisable at 30 June 2020
Total vested and unexer-
cisable at 30 June 2020
Mike Veverka - - - - - - - -
David Todd 25,000 - (25,000) - - - - -
Xavier Bergade 750,000 - (150,000) - 600,000 600,000 600,000 -
Brad Board 25,000 - (25,000) - - - - -
800,000 - (200,000) - 600,000 600,000 600,000 -
Rights to deferred shares
FY2020Balance at
1 July 2019
Granted as remuneration
during the year
Exercised during
the yearOther changes during the year
Balance at 30 June 2020
Vested at 30 June 2020
Total vested and exercisable at 30 June 2020
Total vested and unexer-
cisable at 30 June 2020
Mike Veverka - 30,252 - - 30,252 - - -
David Todd - 13,235 - - 13,235 - - -
Xavier Bergade - 13,235 - - 13,235 - - -
Brad Board - 13,235 - - 13,235 - - -
- 69,957 - - 69,957 - - -
ShareholdingsDetails of ordinary shares in Jumbo Interactive Limited held directly, indirectly or beneficially by key management personnel and their related parties are as follows:
FY2020Balance at
1 July 2019
Granted as remuneration
during the year
Issued on exercise of options
during the yearOther changes
during the year1Balance at
30 June 2020
Directors
David Barwick - - - 3,000 3,000
Bill Lyne - - - 2,000 2,000
Sharon Christensen
- - - 2,050 2,050
Giovanni Rizzo - - - 2,000 2,000
Mike Veverka 9,656,848 - - (141,119) 9,515,729
Other key management personnel
David Todd 50,000 - 25,000 (25,000) 50,000
Xavier Bergade 150,000 - 150,000 (150,000) 150,000
Brad Board 10,000 - 25,000 (25,000) 10,000
9,866,848 - 200,000 (332,069) 9,734,779
1 these were mainly on-market sale of the shares that were issued on exercise of options during the year
11. Other transactions and balances
Other related party transactions
Consolidated Group
2020 $
2019 $
Transactions between related parties are on normal commercial terms and conditions no more favourable than those available to other parties unless otherwise stated.
i. Mr Mike Rosch, the father of Mr Mike Veverka, the CEO and executive director of the Company. rented an office from the Group.
office rent received 8,580 7,865
amounts owing to Group at year end 787 715
ii. Mrs Julie Rosch, the mother of Mr Mike Veverka, the CEO and Executive Director of the Company, is engaged as a full time employee within the Group.
Salary and superannuation 86,505 84,315
54 JUMBO INTERACTIVE LTD ANNUAL REPORT 2020 JUMBO INTERACTIVE LTD ANNUAL REPORT 2020 55
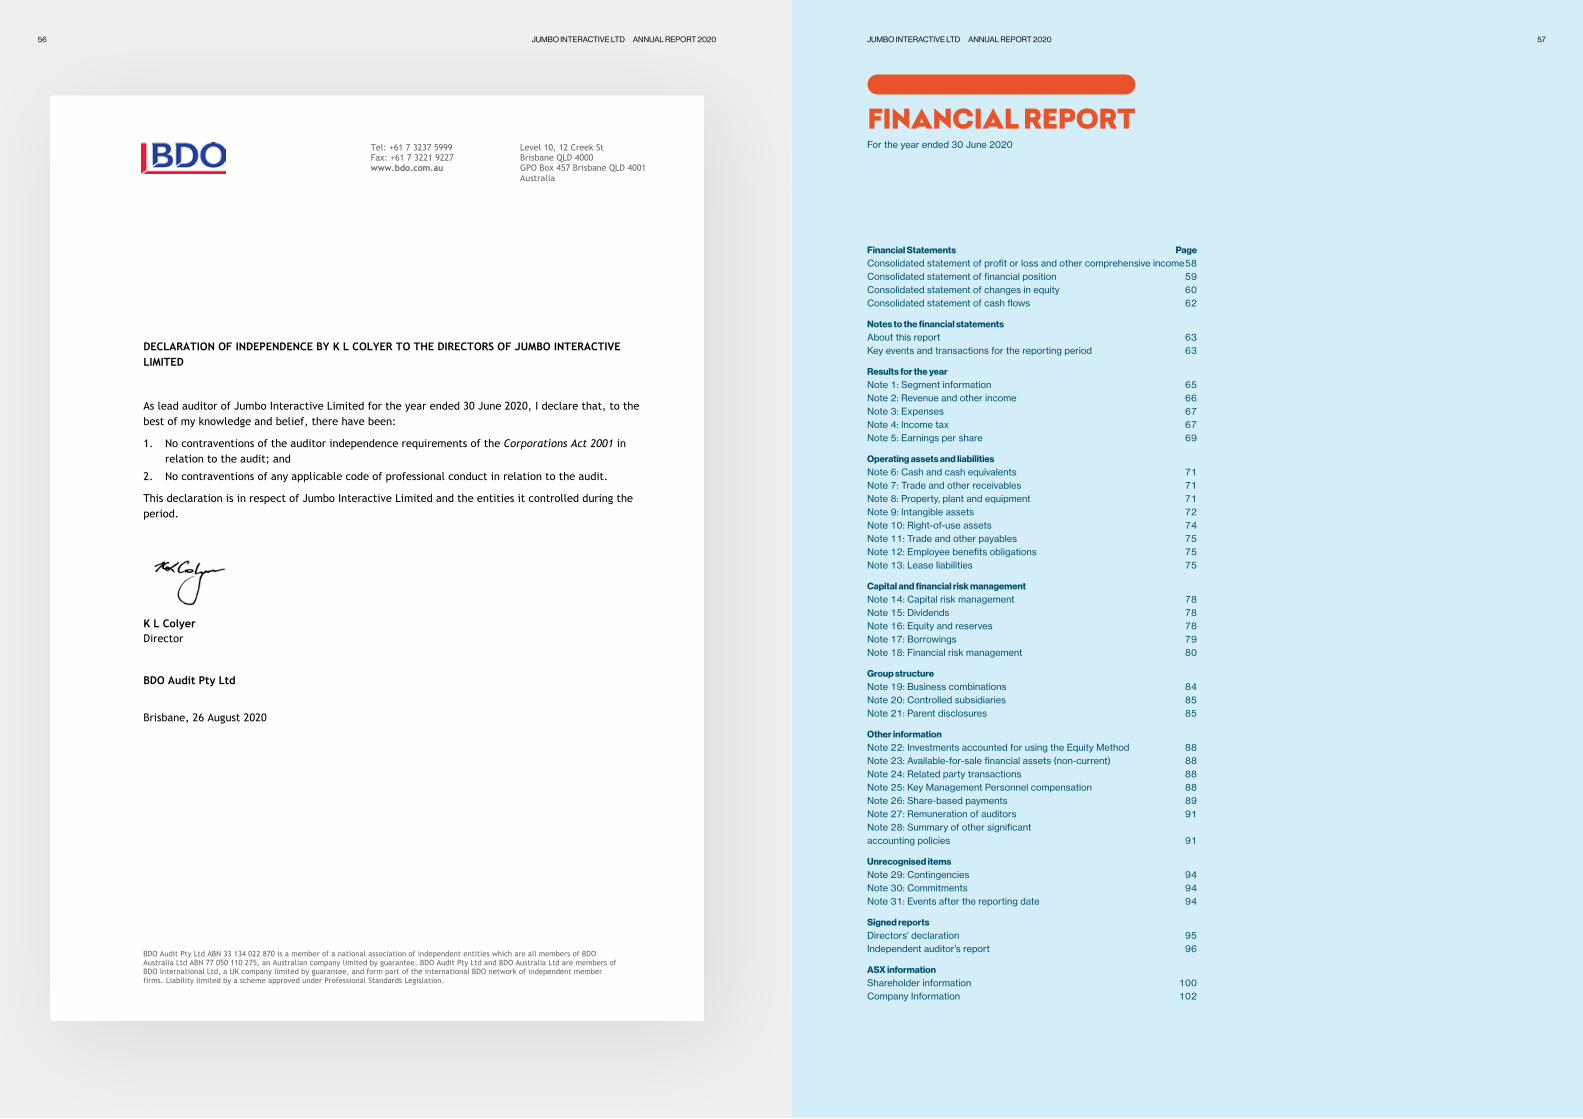
Level 10, 12 Creek St Brisbane QLD 4000 GPO Box 457 Brisbane QLD 4001 Australia
Tel: +61 7 3237 5999 Fax: +61 7 3221 9227 www.bdo.com.au
BDO Audit Pty Ltd ABN 33 134 022 870 is a member of a national association of independent entities which are all members of BDO Australia Ltd ABN 77 050 110 275, an Australian company limited by guarantee. BDO Audit Pty Ltd and BDO Australia Ltd are members of BDO International Ltd, a UK company limited by guarantee, and form part of the international BDO network of independent member firms. Liability limited by a scheme approved under Professional Standards Legislation.
DECLARATION OF INDEPENDENCE BY K L COLYER TO THE DIRECTORS OF JUMBO INTERACTIVE LIMITED
As lead auditor of Jumbo Interactive Limited for the year ended 30 June 2020, I declare that, to the best of my knowledge and belief, there have been:
1. No contraventions of the auditor independence requirements of the Corporations Act 2001 in relation to the audit; and
2. No contraventions of any applicable code of professional conduct in relation to the audit.
This declaration is in respect of Jumbo Interactive Limited and the entities it controlled during the period.
K L Colyer Director
BDO Audit Pty Ltd
Brisbane, 26 August 2020
Financial Statements PageConsolidated statement of profit or loss and other comprehensive income 58Consolidated statement of financial position 59Consolidated statement of changes in equity 60Consolidated statement of cash flows 62
Notes to the financial statementsAbout this report 63Key events and transactions for the reporting period 63
Results for the yearNote 1: Segment information 65Note 2: Revenue and other income 66Note 3: Expenses 67Note 4: Income tax 67Note 5: Earnings per share 69
Operating assets and liabilitiesNote 6: Cash and cash equivalents 71Note 7: Trade and other receivables 71Note 8: Property, plant and equipment 71Note 9: Intangible assets 72Note 10: Right-of-use assets 74Note 11: Trade and other payables 75Note 12: Employee benefits obligations 75Note 13: Lease liabilities 75
Capital and financial risk managementNote 14: Capital risk management 78Note 15: Dividends 78Note 16: Equity and reserves 78Note 17: Borrowings 79Note 18: Financial risk management 80
Group structureNote 19: Business combinations 84Note 20: Controlled subsidiaries 85Note 21: Parent disclosures 85
Other informationNote 22: Investments accounted for using the Equity Method 88Note 23: Available-for-sale financial assets (non-current) 88Note 24: Related party transactions 88Note 25: Key Management Personnel compensation 88Note 26: Share-based payments 89Note 27: Remuneration of auditors 91Note 28: Summary of other significant accounting policies 91
Unrecognised itemsNote 29: Contingencies 94Note 30: Commitments 94Note 31: Events after the reporting date 94
Signed reportsDirectors’ declaration 95Independent auditor’s report 96
ASX informationShareholder information 100Company Information 102
For the year ended 30 June 2020
FINANCIAL REPORT
56 JUMBO INTERACTIVE LTD ANNUAL REPORT 2020 JUMBO INTERACTIVE LTD ANNUAL REPORT 2020 57

Jumbo Interactive Limited and its Controlled Subsidiaries
Consolidated Statement Of Profit Or Loss And Other Comprehensive Income
For the year ended 30 June 2020
Note2020 $’000
2019 $’000
Revenue from operations 2 71,168 65,212
Cost of sales 3 (5,326) (5,068)
Gross profit 65,842 60,144
Other revenue/income 2 1,318 1,936
Distribution expenses (31) (28)
Marketing costs (5,578) (6,956)
Occupancy expenses (104) (742)
Administrative expenses 3 (23,624) (16,128)
Fair value movement on financial liabilities 19 (176) -
Finance costs (222) (7)
Profit/(loss) before income tax expense 37,425 38,219
Income tax expense 4 (11,542) (11,799)
Profit/(loss) after income tax expense for the year attributable to the owners of Jumbo Interactive Limited 25,883 26,420
Other comprehensive income
Items that may be reclassified subsequently to profit or loss
Foreign currency translation (676) (6)
Other comprehensive income for the year, net of tax (676) (6)
Total comprehensive income for the year attributable to the owners of Jumbo Interactive Limited 25,207 26,414
Earnings Per Share (cents per share) ¢ ¢
Basic earnings per share (cents per share) 5 41.5 43.9
Diluted earnings per share (cents per share) 5 41.1 42.5
The above Consolidated Statement of Profit or Loss and Other Comprehensive Income should be read in conjunction with the accompanying notes.
Jumbo Interactive Limited and its Controlled Subsidiaries
Consolidated Statement Of Financial Position
As at 30 June 2020
Note2020 $’000
2019 $’000
CURRENT ASSETS
Cash and cash equivalents 6 72,259 84,583
Trade and other receivables 7 1,961 922
Inventories 31 31
Other current assets 19 1,757 -
TOTAL CURRENT ASSETS 76,008 85,536
NON-CURRENT ASSETS
Property, plant and equipment 8 485 451
Intangible assets 9 24,824 14,683
Right-of-use assets 10 5,185 -
Deferred tax assets 4 1,265 992
Other non-current assets 19 1,761 -
TOTAL NON-CURRENT ASSETS 33,520 16,126
TOTAL ASSETS 109,528 101,662
CURRENT LIABILITIES
Trade and other payables 11 19,060 22,070
Lease liabilities 13 990 -
Current tax liabilities 4 1,235 1,258
Contingent consideration at fair value 19 1,757 -
Employee benefit obligations 12 532 338
TOTAL CURRENT LIABILITIES 23,574 23,666
NON-CURRENT LIABILITIES
Lease liabilities 13 4,395 -
Employee benefit obligations 12 668 517
Make good provision 47 24
Contingent consideration at fair value 19 1,581 -
Deferred tax liabilities 4 344 77
TOTAL NON-CURRENT LIABILITIES 7,035 618
TOTAL LIABILITIES 30,609 24,284
NET ASSETS 78,919 77,378
EQUITY
Contributed equity 16 80,089 79,302
Accumulated losses (17,399) (17,399)
Profits Appropriation Reserve 16.027 15,103
Reserves 202 372
TOTAL EQUITY 78,919 77,378
The above Consolidated Statement of Financial Position should be read in conjunction with the accompanying notes.
58 JUMBO INTERACTIVE LTD ANNUAL REPORT 2020 JUMBO INTERACTIVE LTD ANNUAL REPORT 2020 59

Jumbo Interactive Limited and its Controlled Subsidiaries
Consolidated Statement Of Changes In Equity
For the year ended 30 June 2020
Consolidated groupContributed equity
$’000Accumulated losses
$’000Profits appropriation reserve
$’000
Share-based payments reserve
$’000Foreign currency translation reserve
$’000
Financial assets at fair value through other comprehensive income reserve
$’000Total equity
$’000
Balance at 1 July 2018 55,917 (17,399) 9,364 1,704 (73) (2,302) 47,211
Total comprehensive income for the year
Profit/(loss) for the year - - 26,420 - - - 26,420
Other comprehensive income, net of tax - - - - (6) - (6)
Total comprehensive income for the year - - 26,420 - (6) - 26,414
Transactions with owners in their capacity as owners
Issue of shares 23,385 - - - - - 23,385
Dividends paid - - (20,681) - - - (20,681)
Share-based payments - - - 1,049 - - 1,049
Total transactions with owners in their capacity as owners 23,385 - (20,681) 1,049 - - 3,753
Balance at 30 June 2019 79,302 (17,399) 15,103 2,753 (79) (2,302) 77,378
Total comprehensive income for the year
Profit/(loss) for the year - - 25,883 - - - 25,883
Other comprehensive income, net of tax - - - - (676) - (676)
Total comprehensive income for the year - - 25,883 - (676) - 25,207
Transactions with owners in their capacity as owners
Issue of shares 787 - - - - - 787
Dividends paid - - (24,959) - - - (24,959)
Share-based payments - - - 506 - - 506
Total transactions with owners in their capacity as owners 787 - (24,959) 506 - - (23,666)
Balance at 30 June 2020 80,089 (17,399) 16,027 3,259 (755) (2,302) 78,919
The above Consolidated Statement of Changes in Equity should be read in conjunction with the accompanying notes
60 JUMBO INTERACTIVE LTD ANNUAL REPORT 2020 JUMBO INTERACTIVE LTD ANNUAL REPORT 2020 61

Jumbo Interactive Limited and its Controlled Subsidiaries.
Consolidated Statement Of Cash Flows
For the year ended 30 June 2020
Note2020 $’000
2019 $’000
CASH FLOWS FROM OPERATING ACTIVITIES
Receipts from customers 76,690 71,556
Payments to suppliers and employees (37,632) (22,800)
Interest received 976 1,463
Interest and other costs of finance paid (17) (7)
Interest on lease liabilities (205) -
Income tax received 22 85
Income tax paid (11,592) (11,161)
Net cash inflows/(outflows) from operating activities 6(b) 28,242 39,136
CASH FLOWS FROM INVESTING ACTIVITIES
Payments for property, plant and equipment (243) (353)
Payments for intangibles (6,454) (4,824)
Payment for purchase of business net of cash acquired (4,996) -
Payment of deposit for contingent consideration (3,792) -
Proceeds from sale of property, plant and equipment - 3
Net cash inflows/(outflows) from investing activities (15,485) (5,174)
CASH FLOWS FROM FINANCING ACTIVITIES
Proceeds from issue of shares 16 787 23,385
Payment of lease liabilities (903) -
Dividends paid 15 (24,959) (20,681)
Net cash inflows/(outflows) from financing activities (25,075) 2,704
Net increase/(decrease) in cash and cash equivalents (12,318) 36,666
Net foreign exchange differences (6) (2)
Cash and cash equivalents at beginning of year 84,583 47,919
Cash and cash equivalents at end of year 6(a) 72,259 84,583
The above Consolidated Statement of Cash Flows should be read in conjunction with the accompanying notes.
Jumbo Interactive Limited and its Subsidiaries
Notes To The Consolidated Financial Statements
For the year ended 30 June 2020
About this reportJumbo Interactive Limited is a company limited by shares, incorporated and domiciled in Australia, whose shares are publicly traded on the Australian Securities Exchange (ASX: JIN), and is a for-profit entity for the purposes of preparing the financial statements. The consolidated financial statements are for the consolidated entity consisting of Jumbo Interactive Limited (the Company) and its subsidiaries and together are referred to as the Group or Jumbo.
The consolidated financial statements were approved for issue in accord-ance with a resolution by the Directors on 26 August 2020. The Directors have the power to amend and reissue the consolidated financial statements.
The consolidated financial statements are general purpose financial state-ments which:
• Have been prepared in accordance with the Corporations Act 2001, Australian Accountings Standards and Interpretations issued by the Australian Accounting Standards Board (AASB) and International Financial reporting Standards (IFRS) issued by the International Financial Standards Board
• Have been prepared under the historical cost convention • Are presented in Australian dollars (A$), with all amounts in the financial
report being rounded off in accordance with the requirements of ASIC Corporations (Rounding in Financial/Directors’ Reports) Instrument 2016/191 issued by the Australian Securities and Investments Commission to the nearest thousand dollars, unless otherwise indicated
• Where necessary, comparative information has been restated to conform with changes in presentation, in the current year
• Adopts all new and amended Accounting Standards and Interpretations issued by the AASB that are relevant to the operations of the Group effec-tive for reporting periods beginning on or after 1 July 2019
• Adopts AASB16 Leases in the year beginning 1 July 2019
The notes to the financial statementsThe notes include financial information which is required to understand the consolidated financial statements and is material and relevant to the operations, financial position and performance of the Group. Information is considered material and relevant if, for example:
• The amount in question is significant because of its size or nature • It is important for understanding the results of the Group • It helps explain the impact of significant changes in the Group’s business
– for example, acquisitions and impairment write downs • It relates to an aspect of the Group’s operations that is important to its
future performance
Significant and other accounting policies that summarise the measurement basis used and are relevant to an understanding of the financial statements are provided throughout the notes of the financial statements.
Key events and transactions for reporting periodThe financial position and performance of the Group was particularly affected by the following events and transactions during the reporting period:
1. Higher levels of customer activity and mixed large jackpot activity (see Directors’ Report for details);
2. Acquisition of Gatherwell Limited UK for cash 29 November 2019 (see note 19: Business combinations for details);
3. Payment of dividends (see Directors’ Report and note 15: Dividends for details); and
4. The effect of adpoting AASB 16 Leases effective 1 July 2019 (see note 10: Right-of-use assets and note 13: Lease liabilities for details).
Significant judgements and estimatesIn the process of applying the Group’s accounting policies, man-agement has made a number of judgements and applied estimates of future events. Judgements and estimates which are material to the consolidated financial statements include:
Note Page
Estimated useful life of website development costs 9 74
Goodwill and other intangible assets 9 73
Lease liabilities 13 75
Contingent consideration at fair value 19 84
In addition, in preparing the financial statements, the notes to the financial statements were ordered such that the most relevant information was presented earlier in the notes and that the disclo-sures that management deemed to be immaterial were excluded from the notes to the financial statements. The determination of the relevance and materiality of disclosures involved significant judgement.
62 JUMBO INTERACTIVE LTD ANNUAL REPORT 2020 JUMBO INTERACTIVE LTD ANNUAL REPORT 2020 63

In this sectionResults for the year provides segment information and a breakdown of indi-vidual line items in the consolidated statement of profit or loss and other comprehensive income that the Directors consider most relevant, including a summary of the accounting policies, relevant to understanding these line items.
Note 1: Segment information Page 65Note 2: Revenue and other income Page 66Note 3: Expenses Page 67Note 4: Income tax Page 67Note 5: Earnings per share Page 69
RESULTS FOR THE YEAR
Note 1: Segment informationJumbo determines and presents operating segments on a product and a geographic basis as this is how the results are reported internally to the Chief Executive Officer (CEO) (chief operating decision maker) and how the business is managed. The CEO assesses the performance of the Group based on the net profit before tax (NPBT). Comparatives for 2019 are stated on this basis.
(a) Description of segmentsThe following summary describes the operations in each of the Group’s reportable segments:
Internet Lotteries AustraliaRetail of Australian lottery tickets sold in Australia and eligible international jurisdictions, and internet database management/marketing. Revenue of $260,000 from the burgeoning Software-as-a-Service in Australia has been included.
OtherBusiness activities which are not reportable in terms of AASB 8, which are currently the online sale of an internally developed proprietary payroll software system.
Software-as-a-Service UK
An external lottery manager (ELM) providing a turnkey digital solution to lotteries.
Corporate
Corporate costs include costs in respect of the Directors, CEO, CFO, corporate advertising, promotion and marketing, corporate investment and finance, tax, audit, risk, governance, and strategic projects.
(b) Segment informationThe segment information provided to the CEO is as follows:
2020Internet Lotteries Australia
$’000Other $’000
SaaS UK $'000
Corporate
$’000
Total operations
$’000
External revenue 68,746 902 1,520 - 71,168
Internal revenue - - - - -
Total revenue 68,746 902 1,520 - 71,168
Cost of Sales (5,130) (7) (189) - (5,326)
Gross Profit 63,616 895 1,331 - 65,842
Other revenue/income from external customers 904 - 43 371 1,318
Distribution expenses (31) - - - (31)
Marketing costs (5,461) (68) (42) (7) (5,578)
Occupancy expenses (104) - - - (104)
Administrative expenses (18,095) (377) (1,174) (3,978) (23,624)
Fair value movement on financial liabilities - - - (176) (176)
Finance costs (215) - (7) - (222)
NPBT 40,614 450 151 (3,790) 37,425
Income tax expense (11,542)
NPAT (per P&L) 25,883
Interest revenue 573 - - 402 976
Depreciation and amortisation (5,606) (113) (267) - (5,986)
Fair value movement on financial liabilities - - - (176) (176)
Foreign exchange gain 323 - - (31) 291
64 JUMBO INTERACTIVE LTD ANNUAL REPORT 2020 JUMBO INTERACTIVE LTD ANNUAL REPORT 2020 65

2019Internet Lotteries Australia
$’000Other $’000
SaaS UK $'000
Corporate $’000
Total operations
$’000
External revenue 64,283 929 - - 65,212
Internal revenue - - - - -
Total revenue 64,283 929 - - 65,212
Cost of Sales (5,060) (8) - - (5,068)
Gross Profit 59,223 921 - - 60,144
Other revenue/income from external customers 1,409 - - 527 1,936
Distribution expenses (28) - - - (28)
Marketing costs (6,867) (80) - (9) (6,956)
Occupancy expenses (711) (31) - - (742)
Administrative expenses (12,616) (316) - (3,196) (16,128)
Finance costs (7) - - - (7)
NPBT 40,403 494 - (2,678) 38,219
Income tax expense (11,799)
NPAT (per P&L) 26,420
Interest revenue 936 - - 527 1,463
Depreciation and amortisation (3,342) (91) - - (3,433)
Foreign exchange gain 398 - - - 398
(c) Other segment information
Geographical informationThe entity is domiciled in Australia. Segment revenues are allocated based on the country in which the customer is located.
Consolidated Group
Total revenue from external customers 2020 $’000
2019 $’000
Australia (domicile) 65,790 60,989
United Kingdom 1,563 -
Fiji 1,467 1,628
Other 3,666 4,531
72,486 67,148
Non-current assets in Australia are $25,295,000 (2019: $15,123,000). Non-current assets in other countries are (i) UK $8,000 (2019: nil) and (ii) Fiji $6,000 (2019: $11,000).
The geographical non-current assets above are exclusive of, where appli-cable, financial instruments, deferred tax assets, post-employment benefits assets, and rights under insurance contracts.
No single external customer derives more than 10% of total revenues.
Note 2: Revenue and other incomeThe Company reports revenue from the sale of lottery tickets and related services on a net revenue inflow basis where it considers that it acts more as an Agent than as a Principal such as with the sale of lottery tickets. The gross amount received for the sale of goods and rendering of services is advised as Total Transaction Value (“TTV”) for information purposes.
Consolidated Group
2020 $’000
2019 $’000
Sales revenue
– Revenue from sale of goods (i) 2,183 2,324
– Revenue from rendering of services (i) 68,985 62,888
71,168 65,212
Other revenue/income
– Interest 976 1,463
– Other income
– Foreign exchange gains 291 398
– Export market development grants - 67
– Other 51 8
1,318 1,936
72,486 67,148
(i) the Consolidated Entity derives revenue from the transfer of goods and services at a point-in-time.
Recognition and measurementRevenue is recognised at the fair value of consideration received or receiva-ble. Amounts disclosed as revenue are net of returns, trade allowances and duties and taxes paid.
The following specific recognition criteria must also be met before revenue is recognised:
Sale of Goods and/or Rendering of ServicesRevenue from sale of goods and/or rendering of services is recognised when control of the goods or services is transferred to the buyer in an amount that reflects the consideration to which the entity expects to be enti-tled in exchange for these goods and/or services. Control is the ability of the customer to direct the use of, and obtain substantially all of the remaining benefits from, an asset. Indicators that control has passed includes that the customer has (i) a present obligation to pay, (ii) physical possession of the asset(s), (iii) legal title, (iv) risk and rewards of ownership, and (v) accepted the asset(s).
InterestRevenue is recognised as interest accrues using the effective interest method. The effective interest method uses the effective interest rate which is the rate that exactly discounts the estimated future cash receipts over the expected life of the financial asset.
DividendsDividends are recognised as revenue when the Group’s right to receive payment is established. Dividends received in the entity’s separate financial statements that are paid out of pre-acquisition profits of a subsidiary, asso-ciate or joint venture are recognised as revenue when the entity’s right to receive payment is established.
Government grantsThe export market development grant from the government is recognised at its fair value when there is reasonable assurance that the grant will be received and the Group will comply with any attached conditions.
Note 3: ExpensesProfit from continuing operations before income tax includes the following specific expenses:
Consolidated
2020 $’000
2019 $’000
Cost of sales
– Sale of goods 806 870
– Rendering of services 4,520 4,198
Administration expenses
Depreciation of non-current assets
– Plant and equipment 160 139
Amortisation of non-current assets
– Leasehold improvements 59 40
– Intangibles 4,664 3,254
– Right-of-use assets 1,103 -
Other administration expenses
– Employee benefit expense 10,250 7,842
– Defined contribution superannuation expense 1,238 889
– Bank merchant fees and charges 66 60
– Other administration expenses 6,084 3,904
Occupancy expenses
– Operating lease rentals minimum lease payments 104 742
Fair value movement on financial liabilities 176 -
Presentation - Cost of sales - rendering of servicesThe Group changed its presentation relating to the recognition of Cost of sales-rendering of services for the financial year ending 30 June 2020 under AASB 101: Presentation of Financial Statements which applies to accounting periods beginning on or after 1 January 2020 but before 1 January 2021. Service Fees and Merchant Fees were previously presented on an indirect cost basis in Administration expenses and are now disclosed in Cost of sales-rendering of services. This change has been implemented as management is of the opinion that, after judgement and consideration of all the relevant facts and circumstances, that these costs are directly related to the rendering of services. The aggregate effect of the change in presentation on the annual financial statements for the year ended 30 June 2020 is as follows:
Consolidated Statement of Comprehensive Income
2020
Previous presenta-
tion $’000
Adjustment $’000
Revised presenta-
tion $’000
Cost of sales - sale of goods 806 - 806
Cost of sales - rendering of services 1,051 3,469 4,520
Total cost of sales 1,857 3,469 5,326
Gross profit 69,311 (3,469) 65,842
Administration expenses
- Other admin expenses 55 (55) -
- Bank merchant fees and charges 3,480 (3,414) 66
Total administrative expenses (27,093) 3,469 (23,624)
2019
Cost of sales - sale of goods 870 - 870
Costof sales - rendering of services 1,209 2,989 4,198
Total cost of sales 2,079 2,989 5,068
Gross profit 63,133 (2,989) 60,144
Administration expenses
- Other admin expenses 62 (62) -
- Bank merchant fees and charges 2,987 (2,927) 60
Total administrative expenses (19,117) 2,989 (16,128)
This changed presentation has no effect on profit, the Consolidated Statement of Financial Position, or Consolidated Statement of Changes in Equity.
Note 4: Income tax
Current tax
Consolidated
Current Note2020 $’000
2019 $’000
Income tax liability 1,235 1,258
66 JUMBO INTERACTIVE LTD ANNUAL REPORT 2020 JUMBO INTERACTIVE LTD ANNUAL REPORT 2020 67

(a) Income tax expense
Consolidated
Note2020 $’000
2019 $’000
The components of tax expense comprise:
– Current tax 11,397 11,732
– Deferred tax 4(b) (6) 59
– Overprovision tax prior years (4) -
– Current tax overseas operations 155 8
Total income tax expense/(benefit) in profit and loss 11,542 11,799
Reconciliation
Profit before income tax expense 37,425 38,219
– Tax at the Australian tax rate 30% (2019: 30%) 11,227 11,466
– Income tax effect of overseas tax rates 33 30
– Share options expensed during year 152 314
– Other 130 (11)
Total income tax expense in profit or loss attributable to continuing operations 11,542 11,799
(b) Deferred tax
Deferred tax liabilities Opening balance
$’000
Charged to Profit or
Loss $’000
Closing Balance
$’000
Deferred tax liabilities comprise temporary difference recognised in the profit and loss as follows:
Property, plant and equipment
– Depreciation - - -
Accruals 72 5 77
Other - - -
Balance at 30 June 2019 72 5 77
Property, plant and equipment
– Depreciation - 282 282
Accruals 77 (15) 62
Other - - -
Balance as at 30 June 2020 77 267 344
Deferred tax assets Opening balance
$’000
Charged to Profit or
Loss $’000
Closing Balance
$’000
Deferred tax assets comprise tem-porary difference recognised in the profit and loss as follows:
Property, plant and equipment
– Depreciation 115 (5) 110
– Amortisation 166 (152) 14
Accruals 311 29 340
Provisions 444 58 502
Other 10 16 26
Balance at 30 June 2019 1,046 (54) 992
Property, plant and equipment
– Depreciation 110 60 170
– Amortisation 14 (14) -
Accruals 340 (160) 180
Provisions 502 260 762
Other 26 127 153
Balance as at 30 June 2020 992 273 1,265
Recognition and measurement
Current taxesThe income tax expense for the period is the tax payable on the current period’s taxable income based on the national income tax rate for each juris-diction adjusted by changes in deferred tax assets and liabilities attributable to temporary differences between the tax base of assets and liabilities and their carrying amounts in the consolidated financial statements.
Deferred taxesDeferred tax assets and liabilities are recognised for all temporary dif-ferences, between carrying amounts of assets and liabilities for financial reporting purposes and their respective tax bases, at the tax rates expected to apply when the assets are recovered or liabilities settled, based on those tax rates which are enacted or substantively enacted for each jurisdiction. Exceptions are made for certain temporary differences arising on initial rec-ognition of an asset or a liability if they arose in a transaction, other than a business combination, that at the time of the transaction did not affect either accounting profit or taxable profit.
Deferred tax assets are only recognised for deductible temporary differ-ences if it is probable that future taxable amounts will be available to utilise those temporary differences and losses.
Deferred tax assets and liabilities are not recognised for temporary dif-ferences between the carrying amount and tax bases of investments in subsidiaries and associates where the parent entity is able to control the timing of the reversal of the temporary differences and it is probable that the differences will not reverse in the foreseeable future.
Current and deferred tax balances relating to amounts recognised directly in other comprehensive income are also recognised directly in other compre-hensive income.
Tax consolidationJumbo Interactive Limited and its wholly owned Australian controlled sub-sidiaries are part of a tax consolidated group under Australian taxation law since 1 July 2006. Jumbo Interactive Limited is the head entity in the tax consolidated group. Entities within the tax consolidation group have entered into a tax funding agreement ‘(TFA’) and tax sharing deed (‘TSD’) with the head entity. Under the terms of the TFA, Jumbo Interactive Limited and each of the entities in the tax consolidation group have agreed to pay (or receive) a tax equivalent payment to (or from) the head entity, based on the current tax liability or current tax asset of the entity.
Note 5: Earnings per share (EPS)
(a) Basic earnings per shareBasic EPS is calculated by dividing the profit attributable to owners of the Company by the weighted average number of ordinary shares outstanding.
(b) Diluted earnings per shareDiluted EPS is calculated by dividing the profit attributable to owners of the Company by the weighted average number of ordinary shares outstanding after adjusted for the effects of dilutive potential ordinary shares.
(c) Profit after tax attributable to owners of the Company used as numerator
Consolidated
2020 $’000
2019 $’000
Profit attributable to the owners of the Company 25,883 26,420
(d) Weighted average number of shares used as denominator
Consolidated
2020 Number
2019 Number
Weighted average number of ordinary shares used as the denominator in calculating basic EPS
62,312,828 60,231,699
Adjustments for calculation of diluted EPS: — options 631,472 1,981,119
Weighted average number of ordinary shares used as the denominator in calculating diluted EPS 62,944,300 62,212,818
All outstanding options were included in the number of weighted average number of ordinary shares used to calculate diluted earnings per share because they are currently in-the-money.
68 JUMBO INTERACTIVE LTD ANNUAL REPORT 2020 JUMBO INTERACTIVE LTD ANNUAL REPORT 2020 69

In this sectionOperating assets and liabilities provides information about the working cap-ital of the Group and major balance sheet items, including the accounting policies, judgements and estimates relevant to understanding these items.
Note 6: Cash and cash equivalents Page 71Note 7: Trade and other receivables Page 71Note 8: Property, plant and equipment Page 71Note 9: Intangible assets Page 72Note 10: Right-of-use assets Page 74Note 11: Trade and other payables Page 75Note 12: Employee benefit obligations Page 75Note 13: Lease liabilities Page 75
OPERATING ASSETS AND LIABILITIES
Note 6: Cash and cash equivalents
Consolidated
Note2020 $’000
2019 $’000
(a) Cash and cash equivalents
Total cash and cash equivalents 72,259 84,583
Included in the above balance:
General account balances 61,278 73,799
Online lottery customer account balances 11 10,981 10,784
72,259 84,583
Online lottery customer account balances are deposits and prize winnings earmarked for payment to customers on demand.
At the review period end 30 June 2020, $632,000 was held in trust for the payment of prizes and charity distributions relating to the Gatherwell busi-ness, and neither the cash nor the corresponding liability is recognised in the Statement of Financial Position.
Recognition and measurement
Cash and cash equivalents includes cash on hand, and deposits held ‘at call’ and with original maturities of three months or less, with financial institutions.
Consolidated
2020 $’000
2019 $’000
(b) Reconciliation of Cash Flow from Operations with Profit after Income Tax
Profit/(loss) for the year after income tax 25,883 26,420
Non-cash flows
Amortisation 5,826 3,294
Depreciation 160 139
Fair value movement on contingent consideration 176 -
Share option expense 506 1,049
Net foreign exchange effects - (gain)/loss (33) (6)
Other - 2
Changes in operating assets and liabilities, net of the effects of purchase and disposal of subsidiaries
Decrease/(increase) in trade receivables (14) (138)
Decrease/(increase) in other receivables (918) (275)
Decrease/(increase) in inventories - 26
Decrease/(increase) in DTA (273) 54
Increase/(decrease) in trade payables (5,919) 6,026
Increase/(decrease) in other payables 1,713 1,698
Increase/(decrease) in other provisions 891 178
Increase/(decrease) in DTL 267 5
Increase/(decrease) in provision for income tax (23) 664
Cash flow from operations 28,242 39,136
Note 7: Trade and other receivables
Consolidated
Current 2020 $’000
2019 $’000
Trade receivables 311 190
Allowance for doubtful debts - -
311 190
Other receivables 160 232
Prepayments 1,490 500
1,961 922
All receivables that are neither past due nor impaired are with long standing clients who have a good credit history with the Group.
Recognition and measurementTrade receivables are recognised at original invoice amounts less an allow-ance for uncollectible amounts, and generally have repayment terms ranging from seven to 31 days.
The Group applies the simplified approach to providing for expected credit losses prescribed by AASB 9, which requires the use of the lifetime expected loss provision for all trade receivables. Refer note 18(b): Financial risk management for details.
Trade receivables had not had a significant increase in credit risk since they were originated.
Note 8: Property, plant and equipment
Consolidated
2020 $’000
2019 $’000
Plant and equipment–at cost 1,887 1,741
Accumulated depreciation (1,598) (1,430)
289 311
Leasehold improvements–at cost 777 661
Accumulated amortisation (581) (521)
196 140
Total property, plant and equipment 485 451
70 JUMBO INTERACTIVE LTD ANNUAL REPORT 2020 JUMBO INTERACTIVE LTD ANNUAL REPORT 2020 71

Movements in Carrying Amounts
Consolidated GroupPlant and
equipment $’000
Leasehold Improvements
$’000Total
$’000
2019
Balance at the beginning of year 219 61 280
Additions 234 119 353
Disposals (3) - (3)
Depreciation/amortisation expense (139) (40) (179)
Carrying amount at the end of year 311 140 451
2020
Balance at the beginning of year 311 140 451
Additions 125 115 240
Additions through acquisition 16 - 16
Disposals (3) - (3)
Depreciation/amortisation expense (160) (59) (219)
Carrying amount at the end of year 289 196 485
Recognition and measurement
(i) Initial recognition and measurement
Property, plant and equipmentProperty, plant and equipment is stated at historical cost, including costs directly attributable to bringing the asset to the location and condition necessary for it to be capable of operating in the manner intended by man-agement, less depreciation and any impairments.
(ii) Subsequent costsImprovements to leasehold property are recognised as a separate asset.
All repairs and maintenance are charged to the profit or loss during the reporting period in which they occur.
(iii) Depreciation and amortisationProperty, plant and equipment are depreciated or amortised from the date of acquisition, or, in respect of internally generated assets, from the time an asset is held ready for use.
Plant and equipment are depreciated using the straight-line method to allo-cate their costs, net of their residual values, over their estimated useful lives.
Leasehold improvements are amortised over the shorter of either the unex-pired term of the lease or the estimated useful life of the improvements.
The depreciation and amortisation rates used during the year were based on the following range of useful lives:
Plant and equipment Two to five years
Leasehold improvements Up to six years
The depreciation and amortisation rates are reviewed annually and adjusted if appropriate. An asset’s carrying amount is written down to its recoverable amount if the asset’s carrying value is greater than its estimated recoverable amount.
(iv) DerecognitionAn item of property, plant or equipment is derecognised when it is disposed of or no future economic benefits are expected from its use or disposal.
Gains and losses on disposal are calculated as the difference between the net disposal proceeds and the asset’s carrying value, and are included in profit or loss in the year that the item is derecognised.
Note 9: Intangible assets
Consolidated
2020 $’000
2019 $’000
Goodwill 9,957 3,687
Accumulated impairment losses (855) (855)
Net carrying value 9,102 2,832
Intellectual property 53 53
Accumulated impairments loss (23) (23)
Net carrying value 30 30
Website development costs 38,795 32,364
Accumulated amortisation (25,783) (21,390)
Net carrying value 13,012 10,974
Customer contracts and relationships costs 1,258 -
Accumulated amortisation (147) -
Net carrying value 1,111 -
Software costs 936 133
Accumulated amortisation (227) (133)
Net carrying value 709 -
Domain names – cost 904 904
Accumulated impairment losses (62) (62)
Net carrying value 842 842
Other 86 63
Accumulated amortisation (68) (58)
Net carrying value 18 5
Total intangibles 24,824 14,683
Significant judgements and estimates
Impairment assessment of goodwill and domain namesA key judgement by management with regards to the Internet Lotteries Australia segment CGU is that the reseller agreements with the Tatts Group will continue. The key assumptions used for value-in-use calculations are discussed further in note 9(b). Goodwill is tested for impairment half yearly.
Impairments assessment of other intangible assetsThe Group considers half yearly whether there have been any indica-tors of impairment and then tests whether non-current assets have incurred any impairment in accordance with the accounting policy.
Estimated useful life of website development costsManagement estimates the useful of intangible assets-website development costs based on the expected period of time over which economic benefits from the use of the asset will be derived. Management reviews useful life assumptions on an annual basis having given consideration to variables including historical and fore-cast usage rates, technological advancements and changes in legal and economic conditions.
The amortisation period relating to the website developments costs is five years from 1 July 2015 and three years prior to that.
(a) Movements in carrying values
Consolidated Group
2019Goodwill
$’000
Intellectual property
$’000
Website development
costs $’000
Customer con-tracts and
relationships $'000
Software $’000
Domain names $’000
Other $’000
Total $’000
Balance at the beginning of the year 2,832 30 9,396 - - 842 13 13,110
Additions internally developed - - 4,839 - - - - 4,839
Amortisation charge - - (3,246) - - - (8) (3,254)
Effects of movements in foreign exchange - - (15) - - - - (15)
Closing value at 30 June 2019 2,832 30 10,974 - - 842 5 14,683
2020 -
Balance at the beginning of the year 2,832 30 10,974 - - 842 5 14,683
Additions through acquisitions 6,761 - - 1,356 865 - - 8,982
Additions internally developed - - 6,431 - - - 23 6,454
Amortisation charge - - (4,391) (161) (102) - (10) (4,664)
Effects of movements in foreign exchange (490) - (2) (84) (54) - - (631)
Closing value at 30 June 2020 9,102 30 13,012 1,111 709 842 18 24,824
Domain namesDomain names have an indefinite useful life because:
• There is no time limit on the expected usage of the domain names; • Licence renewal is automatic on payment of the renewal fee without satisfaction of further renewal conditions; • The cost is not significant when compared with future economic benefits expected to flow from renewal. As such, the useful life can include the
renewal period; and • Since there is no limit on the number of times the licence can be renewed this leads to the assessment of “indefinite” useful life.
This assessment has been based on:
• Technical, technological, commercial and other types of obsolescence; • The stability of the industry in which the asset operates and changes in the market demand for the products and/or services output from the asset; • The level of maintenance expenditure required to obtain the expected future economic benefits from the asset and the entity’s ability and intention
to reach such a level; and • The period of control over the asset and legal or similar limits on the use of the asset.
(b) Impairment testing of Cash-Generating Units containing goodwill or intangible assets with indefinite useful livesGoodwill and domain names have been allocated to the Australian Internet Lottery cash-generating unit which is an operating segment.
The recoverable amount of the cash-generating units is based on a val-ue-in-use calculation using a discounted cash flow model based on a one year projection approved by management and extrapolated over a five year period using a steady rate, together with a terminal value. The growth rate used in these projections does not exceed the historical growth rate of the relative cash-generating unit.
Key assumptions used for value-in-use calculation of the CGU are as follows:
• Annual growth rate of 3% except SaaS UK (Gatherwell) of 10% given its recent growth rate and early growth stage (2019: 3%);
• Terminal growth rate of 3% (2019: 3%); • Discount rate of 14% being the calculated weighted average cost of capi-
tal based on the capital asset pricing model (2019: 14%); and • Reseller agreements will be renewed as and when they expire.
Management determined projections based on past performance and its expectations for the future. The growth rate used is consistent with those used in industry reports. The discount rate used is pre-tax and is specific to the relevant segment in which the unit operates.
Internet Lotteries Australia CGU is estimated to be $310,000,000 which exceeds the carrying amount of goodwill, domain names and other intan-gible assets by $288,389,000. If a discount rate of 15% and growth rate of
0% was used instead of 14% and 3% respectively, the recoverable amount of goodwill, domain names and other intangible assets would still exceed the carrying amount. Should the lottery reseller agreements be cancelled or not be extended for further periods when they expire, an impairment loss would be recognised up to the maximum carrying value of $21,611,000.
SaaS UK CGU is estimated to be $9,231,000 which exceeds the carrying amount of goodwill, customer contracts and relationships, and software by $1,141,000. If a discount rate of 15% and a growth rate of 7% was used instead of 14% and 10% respectively, an impairment loss of $367,000 would be recognised. Should all customer contracts cease, an impairment loss would be recognised up to the maximum carrying value of $8,090,000.
Recognition and measurement
GoodwillGoodwill represents the excess of the cost of the business combination over the Group’s share of the net fair value of the identifiable assets, liabilities and contingent liabilities acquired. Goodwill is not amortised but is measured at cost less any accumulated impairment losses. Goodwill is tested for impair-ment annually, or more frequently if events or changes in circumstances indicate that the carrying value may be impaired. Gains and losses on the disposal of an entity include the carrying amount of goodwill relating to the entity sold.
Goodwill acquired is allocated to each of the cash-generating units expected to benefit from the combination’s synergies. Impairment is deter-mined by assessing the recoverable amount of the cash-generating unit
72 JUMBO INTERACTIVE LTD ANNUAL REPORT 2020 JUMBO INTERACTIVE LTD ANNUAL REPORT 2020 73

to which the goodwill relates. Impairment losses on goodwill cannot be reversed.
Intellectual PropertyAcquired intellectual property is stated at cost, and is measured at cost less any accumulated impairment losses. Intellectual property is considered to have an indefinite useful life and is not amortised. The carrying value of intellectual property is tested for impairment annually, or more frequently if events or changes in circumstances indicate that the carrying value may be impaired. Impairment losses are recognised in profit or loss. Any reversal of impairment losses of intellectual property is recognised in profit or loss.
Website Developments CostsExpenditure during the research phase of a project is recognised as an expense when incurred. Development costs are capitalised only when tech-nical and financial feasibility studies identify that we have the resources to complete the development and the project will deliver future economic bene-fits and these benefits can be measured reliably.
Development costs have a finite life and are amortised on a straight-line basis matched to the future economic benefits over the useful life of the pro-ject of three years up to 30 June 2015 and five years from 1 July 2015.
Customer contracts and relationshipsCustomer contracts and relationships acquired in a business combination are amortised on a straight-line basis over the period of their expected ben-efit, being their finite life of 5 years.
SoftwareSoftware acquired in a business combination is amortised on a straight-line basis over the period of their expected benefit, being their finite life of 5 years.
Domain NamesAcquired domain names are stated at cost and are considered to have indef-inite useful lives and are not amortised. The useful life is assessed annually to determine whether events or circumstances continue to support an indef-inite useful life assessment. The carrying value of domain names is tested semi-annually at each reporting date for impairment.
Impairment of assetsAssets are tested for impairment at the end of each reporting period or whenever events or changes in circumstances indicate that the carrying amount may not be recovered.
An impairment loss is recognised for the amount by which the asset’s carry-ing amount exceeds its recoverable amount. For the purposes of assessing impairment, assets are grouped at the lowest levels for which there are separately identifiable cash flows which are largely independent of the cash flows from other assets or groups of assets (CGUs).
The recoverable amount is the greater of the asset’s fair value less costs to sell and value-in-use. In assessing value-in-use, the estimated cash flows are discounted to their present value using a pre-tax discount rate that reflects market assessments of the time value of money and the specific risks of the asset.
Impairment losses are recognised in the profit or loss. Non-financial assets other than goodwill that incur impairment are reviewed for possible reversal of impairment at each reporting period.
Note 10: Right-of-use assets
Consolidated
2020 $’000
2019 $’000
Land and buildings - right-of-use 6,077 -
Less: Accumulated amortisation (1,038) -
5,039 -
Plant and equipment - right-of-use 164 -
Less: Accumulated amortisation (18) -
146 -
5,185 -
The consolidated entity has adopted AASB16 Leases from 1 July 2019 - see note 13: Lease liabilities for details.
$6,058,000 right-of-use assets were recognised on adoption of AASB 16 Leases, with additions of $183,000 during the year. Other than an amortisa-tion expense of $1,103,000, there were no other movements.
The consolidated entity leases land and buildings for its offices under agree-ments of between two to seven years with, in some cases, options to extend which have been included in the lease liability where the options is expected to be exercised. The leases have various escalation clauses. On renewal, the terms of the leases are renegotiated. The consolidated entity also leases plant and equipment under agreements of four years.
The consolidated entity leases land and buildings and office equipment under agreements of less than one year. These leases are either short-term or low-value, so have been expensed as incurred and not capitalised as right-of-use assets.
For impairment testing, the right-of-use assets have been allocated to the internet lotteries cash-generating unit. Refer to note 9 for further information on the impairment testing key assumptions and sensitivity analysis.
Recognition and measurementA right-of-use asset is recognised at the commencement date of a lease. The right-of-use asset is measured at cost, which comprises the initial amount of the lease liability, adjusted for, as applicable, any lease payments made at or before the commencement date net of any lease incentives received, any initial direct costs incurred, and, except where included in the cost of inventories, an estimate of costs expected to be incurred for disman-tling and removing the underlying asset, and restoring the site or asset.
Right-of-use assets are depreciated on a straight-line basis over the unex-pired period of the lease or the estimated useful life of the asset, whichever is the shorter. Where the consolidated entity expects to obtain ownership of the leased asset at the end of the lease term, the depreciation is over its estimated useful life. Right-of use assets are subject to impairment or adjusted for any remeasurement of lease liabilities.
The consolidated entity has elected not to recognise a right-of-use asset and corresponding lease liability for short-term leases with terms of 12 months or less and leases of low-value assets. Lease payments on these assets are expensed to profit or loss as incurred.
Note 11: Trade and other payables
Consolidated
Note2020 $’000
2019 $’000
Total trade and other payables 19,060 22,070
Included in the above:
Trade creditors 1,341 7,260
GST payable 1,020 742
Sundry creditors and accrued expenses 4,373 2,462
Employee benefits 1,345 822
8,079 11,286
Customer funds payable 6(a) 10,981 10,784
19,060 22,070
Recognition and measurementTrade and other payables represent liabilities for goods and services provided to the Group prior to the year end and which are unpaid. These amounts are unsecured and have seven to 31 day payment terms.
(i) Employee benefitsLiabilities for wages and salaries, including non-monetary benefits, annual leave and accumulating sick leave expected to be settled within 12 months of the end of the reporting period are recognised in other liabilities in respect of employees’ services rendered up to the end of the reporting period and are measured at amounts expected to be paid when the liabilities are settled. Liabilities for non-accumulating sick leave are recognised when leave is taken and measured at the actual rates paid or payable.
(ii) SuperannuationEmployees have defined contribution superannuation funds. Contributionsa are recognised as expenses as they become payable. Prepaid contributions are recognised as an asset to the extent that a cash refund or a reduction in future payments is available.
(iii) Termination benefitsTermination benefits are payable when employment is terminated before the retirement date, or when an employee accepts voluntary redundancy in exchange for these benefits. The Group recognises termination benefits as an expense and a liability on the earlier of when the Group:
• Can no longer withdraw the offer and the benefits; and • Recognises costs for restructuring under AASB 137 Provisions,
Contingent Liabilities and Contingent Assets and which involves the pay-ment of termination benefits.
Benefits falling due more than 12 months after the end of the reporting period are discounted to present value.
Note 12: Employee benefit obligations
Consolidated
2020 $’000
2019 $’000
CURRENT
Long service leave 532 338
NON-CURRENT
Long service leave 668 517
1,200 855
Recognition and measurement
(i) Long service leaveLiabilities for long service leave are not expected to be settled wholly within 12 months after the end of the reporting period. They are recognised as part of the provision for employee benefits and measured as the present value of expected future payments to be made in respect of services provided by employees to the end of the reporting period. Consideration is given to expected future salaries and wages levels, experience of employee depar-tures and periods of service. Expected future payments are discounted using corporate bond rates at the end of the reporting period with terms to maturity and currency that match, as closely as possible, the estimated future cash outflows.
Note 13: Lease liabilities
Consolidated
2020 $’000
2019 $’000
CURRENT
Lease liabilities 990 -
NON-CURRENT
Lease liabilities 4,395 -
5,385 -
Recognition and measurementThe consolidated entity has adopted AASB 16 Leases from 1 July 2019. The standard replaces AASB 117 ‘Leases’ and for lessees eliminates the classifi-cations of operating leases and finance leases. Except for short-term leases and leases of low-value assets, right-of-use assets and corresponding lease liabilities are recognised in the statement of financial position. Straight-line operating lease expense recognition is replaced with a depreciation charge for the right-of-use assets (included in operating costs) and an interest expense on the recognised lease liabilities (included in finance costs). In the earlier periods of the lease, the expenses associated with the lease under AASB 16 will be higher when compared to lease expenses under AASB 117. However, EBITDA (Earnings Before Interest, Tax, Depreciation and Amortisation) results improve as the operating expense is now replaced by interest expense and depreciation in profit or loss. For classification within the statement of cash flows, the interest portion is disclosed in operating activities and the principal portion of the lease payments are separately dis-closed in financing activities. For lessor accounting, the standard does not substantially change how a lessor accounts for leases.
74 JUMBO INTERACTIVE LTD ANNUAL REPORT 2020 JUMBO INTERACTIVE LTD ANNUAL REPORT 2020 75

Impact of adoptionAASB 16 Leases was adopted using the modified retrospective approach and as such the comparatives have not been restated.
The following is a reconciliation of total operating lease commitments at 30 June 2019 (as disclosed in the financial statements to 30 June 2019) to the lease liabilities recognised at 1 July 2019:
$’000
Operating lease commitments as at 1 July 2019 (AASB 117) 6,032
Adjustment to operating lease commitments as at 1 July 2019 737
Discount using incremental borrowing rate (666)
Short term leases not recognised as a lease liability (AASB 16) (45)
Total lease liabilities recognised as at 1 July 2019 (AASB 16) 6,058
The impact of adoption on opening retained profits as at 1 July 2019 as as follows:
Right-of-use assets (AASB 16) 6,058
Lease liabilities - current (AASB16) (897)
Lease liabilities - non-current (AASB 16) (5,161)
Adjustment in opening retained profits as at 1 July 2019 -
A lease liability is recognised at the commencement date of a lease. The lease liability is initially recognised at the present value of the lease pay-ments to be made over the term of the lease, discounted using the interest rate implicit in the lease or, if that rate cannot be readily determined, the con-solidated entity’s incremental borrowing rate. Lease payments comprise of fixed payments less any lease incentives receivable, variable lease payments that depend on an index or a rate, amounts expected to be paid under resid-ual value guarantees, exercise price of a purchase option when the exercise of the option is reasonably certain to occur, and any anticipated termination penalties. The variable lease payments that do not depend on an index or a rate are expensed in the period in which they are incurred.
Lease liabilities are measured at amortised cost using the effective interest method. The carrying amounts are remeasured if there is a change in the following: future lease payments arising from a change in an index or a rate used; residual guarantee; lease term; certainty of a purchase option and termination penalties. When a lease liability is remeasured, an adjustment is made to the corresponding right-of use asset, or to profit or loss if the carry-ing amount of the right-of-use asset is fully written down.
Significant judgements and estimates
A key judgement by management is the incremental borrowing rate of 3.50% p.a. being applied as the discount rate in the initial recognition of the lease values.
In this sectionCapital and financial risk management provides information about the cap-ital management practices of the Group and shareholder returns for the year, discusses the Group’s exposure to various financial risks, explains how these affect the Group’s financial position and performance and what the Group does to manage these risks.
Note 14: Capital risk management Page 78Note 15: Dividends Page 78Note 16: Equity and reserves Page 78Note 17: Borrowings Page 79Note 18: Financial risk management Page 80
CAPITAL AND FINANCIAL RISK MANAGEMENT
76 JUMBO INTERACTIVE LTD ANNUAL REPORT 2020 JUMBO INTERACTIVE LTD ANNUAL REPORT 2020 77

Note 14: Capital risk management
Consolidated
Note2020 $’000
2019 $’000
Total borrowings 17 - -
Less: cash and cash equivalents 6(a) (72,259) (84,583)
Net debt - -
Total equity 16 80,089 79,302
Total capital 80,089 79,302
Gearing ratio 0% 0%
The Group’s objective is to maintain a strong capital base so as to aintain investor, creditor and market confidence and sustain future development of the business.
The Group monitors its capital structure by reference to its gearing ratio. his ratio is calculated as total net debt divided by total capital. Net debt is calculated by as total borrowings less cash and cash equivalents (up to a minimum of zero). Total capital is net debt plus total equity. There were no changes in the Group’s approach to capital management during the year.
Note 15: Dividends
(a) Ordinary shares
Consolidated
2020 $’000
2019 $’000
Final fully franked ordinary dividend of 21.5 (2019:
11.0) cents per share franked at the tax rate of
30% (2019: 30%) 13,410 6,438
Interim fully franked ordinary dividend of 18.5
(2019: 15.0) cents per share franked at the tax
rate of 30% (2019: 30%) 11,549 9,273
Special fully franked ordinary dividend of nil (2019:
8.0) cents per share franked at the tax rate of 30%
(2019: 30%) - 4,970
Total dividends paid or provided for 24,959 20,681
Dividends paid in cash or satisfied by the issue of
shares under the dividend reinvestment plan during
the years ended 30 June 2020 and 30 June 2019
were as follows:
Paid in cash 24,959 20,681
Satisfied by issue of shares - -
24,959 20,681
(b) Dividends not recognised at the end of the reporting period
Consolidated
2020 $’000
2019 $’000
Since year end, the Directors have recommended
the payment of a final 2020 fully franked ordi-
nary dividend of 17.0 (2019: 21.5) cents per share
franked at the rate of 30% (2019: 30%). The aggre-
gate amount of the proposed dividend expected
to be paid on 30 September 2020 (2019: 22
September 2019), but not recognised as a liability
at year end, is: 10,616 13,357
(c) Franked dividends
Consolidated
2020 $’000
2019 $’000
The franked portions of dividends paid and recom-
mended after 30 June 2020 will be franked out of
existing franking credits or out of franking credits aris-
ing from the payment of income tax in the year ending
30 June 2020.
Franking credits available for subsequent financial
years based on a tax rate of 30% (2019: 30%): 12,372 11,509
The above amounts represent the balance of the franking account as at he reporting date adjusted for:
(i) Franking credits that will arise from the payment of the amount of the pro-vision for income tax, and
(ii) Franking debits that will arise from the payment of dividends recognised as a liability at the reporting date.
The impact on the franking account of the dividends paid and recommended by the directors since the end of the reporting period, but not recognised as a liability at the reporting date, will be a reduction in the franking account of $4,550,000 (2019: $5,724,000).
Note 16: Equity and reserves
(a) Contributed equity
Issued shares
Consolidated Consolidated
2020 Shares
2020 $'000
2019 Shares
2019 $’000
Ordinary shares – fully paid 62,423,757 80,089 62,123,757 79,302
Movements in ordinary share capital
Consolidated
Details Shares $’000
Opening balance 1 July 2018 54,374,265 55,917
Shares issued during the year
2 Jul 2018-Exercise of options 50,000 200
3 Jul 2018-Exercise of options 3,474,492 8,234
5 Jul 2018-Exercise of options 30,000 120
9 July 2018-Exercise of options 15,000 60
13 Jul 2018-Exercise of options 20,000 80
16 Jul 2018-Exercise of options 25,000 100
18 Jul 2018-Exercise of options 25,000 100
20 Aug 2018-Exercise of options 115,000 460
22 Aug 2018-Exercise of options 50,000 200
24 Aug 2018-Exercise of options 170,000 630
28 Aug 2018-Exercise of options 25,000 87
29 Aug 2018-Exercise of options 150,000 600
13 Sep 2018-Exercise of options 125,000 437
17 Sep 2018-Exercise of options 250,000 788
18 Sep 2018-Exercise of options 150,000 525
19 Sep 2018-Exercise of options 25,000 87
20 Sep 2018-Exercise of options 225,000 788
24 Sep 2018-Exercise of options 150,000 525
24 Sep 2018-Exercise of options 100,000 350
26 Sep 2018-Exercise of options 100,000 350
10 Oct 2018-Exercise of options 150,000 525
7 Dec 2018-Exercise of options 150,000 525
11 Dec 2018-Exercise of options 150,000 525
11 Jan 2019-Exercise of options 150,000 525
21 Jan 2019-Exercise of options 150,000 525
15 Feb 2019-Exercise of options 125,000 438
20 Feb 2019-Exercise of options 100,000 350
27 Feb 2019-Exercise of options 100,000 350
1 Mar 2019-Exercise of options 200,000 700
4 Mar 2019-Exercise of options 50,000 175
5 Mar 2019-Exercise of options 100,000 350
6 Mar 2019-Exercise of options 250,000 875
8 Mar 2019-Exerciee of options 500,000 1,750
11 Apr 2019-Exercise of options 50,000 175
30 Apr 2019-Exercise of options 250,000 875
Balance 30 June 2019 62,123,757 79,302
Balance 1 July 2019 62,123,757 79,302
Shares issued during the year
23 Aug 2019-Exercise of options 250,000 613
19 Nov 2019-Exercise of options 50,000 175
Balance 30 June 2020 62,423,757 80,089
Issued capital represents the amount of consideration received for securi-ties issued or paid for securities bought back by Jumbo.
Costs directly attributable to the issue of new shares or options are deducted from the consideration received, net of income taxes.
(b) Ordinary sharesOrdinary shares have no par value and the company does not have a limited amount of authorised share capital.
Ordinary shareholders are entitled to participate in dividends and the pro-ceeds on winding up of the Company in proportion to the number of and amounts paid on the shares held. Every ordinary shareholder present at a meeting in person or by proxy is entitled to one vote on a show of hands and upon a poll each share is entitled to one vote.
(c) Options(i) Details of the employee option plan, including details of options issued,
exercised and lapsed during the financial year and options outstand-ing at the end of the financial year are set out in note 26: Share-Based Payments.
(ii) For information relating to share options issued to third parties during the financial year, refer to note 26: Share-Based Payments.
(d) Reserves
Nature and purpose of reserves
Profits appropriation reserveThe profits appropriation reserve records accumulated profits available for distribution at the Directors’ discretion. In June 2010, there was a change in the test for payment of dividends from a ‘profit test’ to ‘solvency test’ (s254T Corporations Act 2001), and the profits appropriation reserve was estab-lished to ensure the accumulated losses up until then were ‘ring-fenced’ and that future profits were available for distribution, in particular for dividend payments.
Share-based payments reserveThe share-based payments reserve records items recognised as expenses on the fair value of share-based remuneration provided to employees. This reserve can be reclassified as retained earnings if options lapse.
Foreign currency translation reserveThe foreign currency translation reserve records the foreign exchange differ-ences arising on translation of investments in foreign controlled subsidiaries. Amounts are reclassified to profit or loss when an entity is disposed of.
Financial assets at fair value through other comprehensive income (FVOCI) reserveThe financial assets at fair value reserve comprises changes in the fair value of FVOCI investments which are recognised in other comprehensive income including when investments are sold or reclassified.
Note 17: Borrowings
(a) Facilities with Banks
Consolidated
Note2020 $’000
2019 $’000
Credit facility
Bank guarantees 800 550
Commercial card 300 300
Facilities utilised
Bank guarantees 29 (682) (478)
Commercial credit card (295) (295)
Amount available 123 77
The facilities are provided by Australia and New Zealand Banking Group Limited subject to general and specific terms and conditions being set and met periodically.
There were no outstanding interest bearing liabilities for the financial year ended 30 June 2020 (2019: nil).
78 JUMBO INTERACTIVE LTD ANNUAL REPORT 2020 JUMBO INTERACTIVE LTD ANNUAL REPORT 2020 79
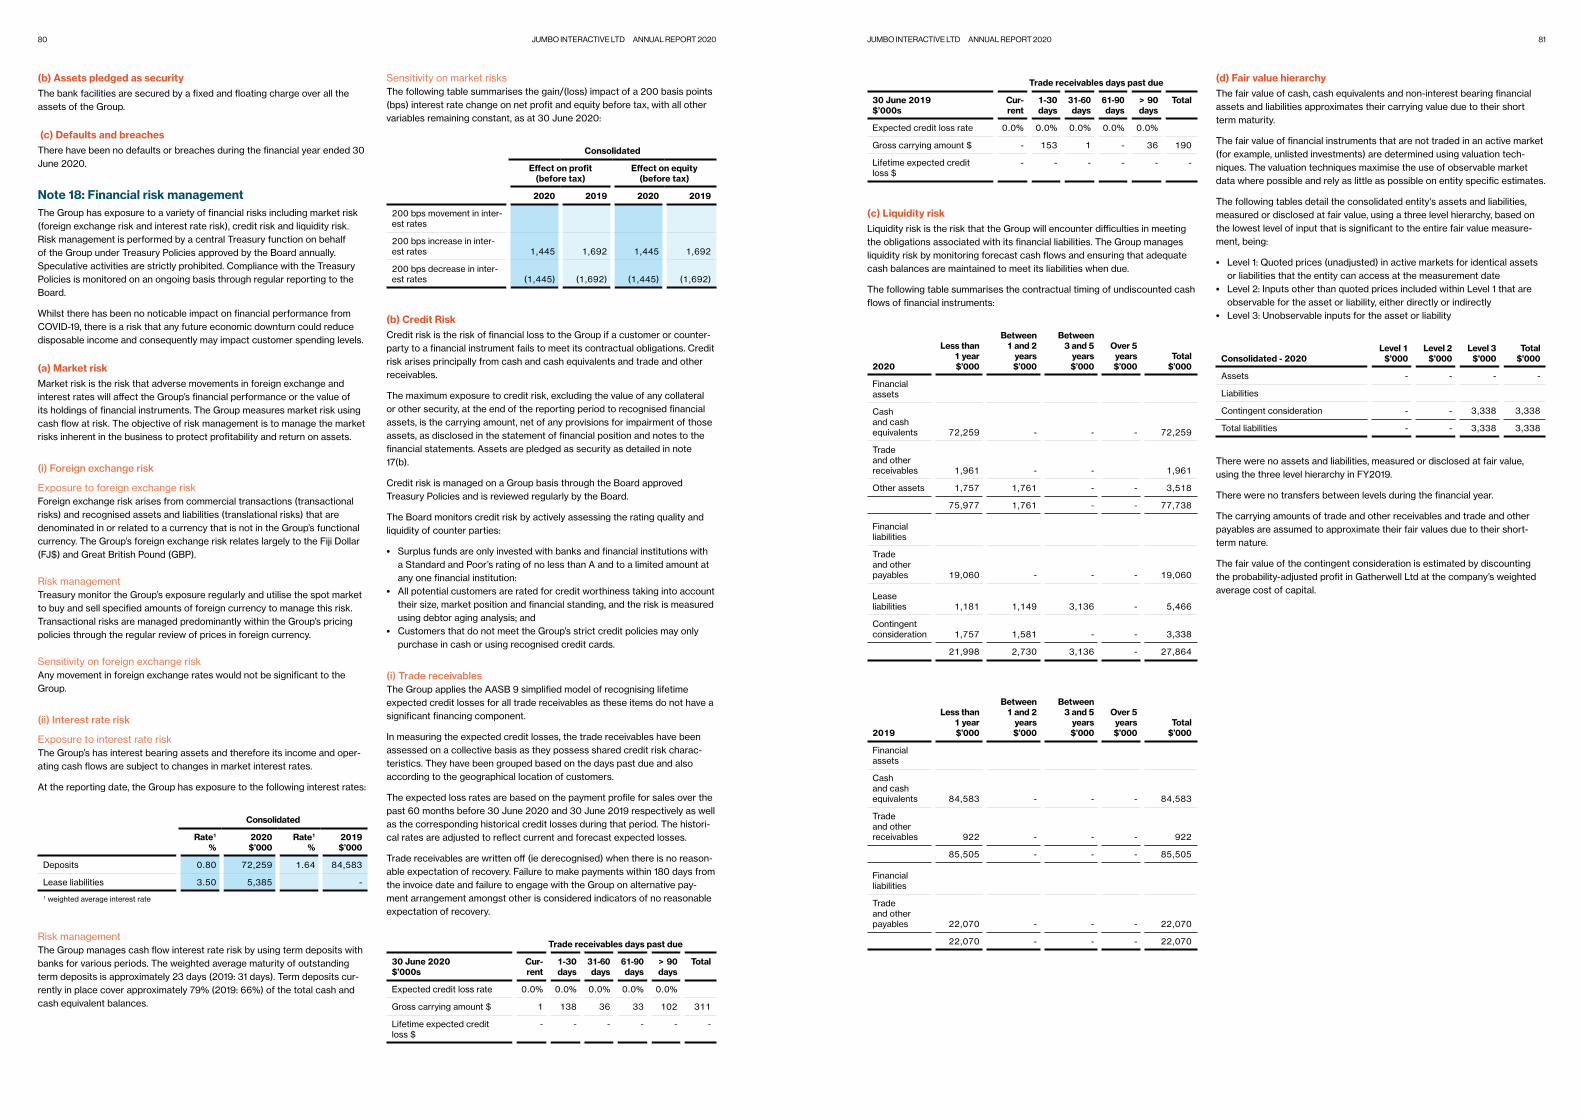
Trade receivables days past due
30 June 2019 $’000s
Cur-rent
1-30 days
31-60 days
61-90 days
> 90 days
Total
Expected credit loss rate 0.0% 0.0% 0.0% 0.0% 0.0%
Gross carrying amount $ - 153 1 - 36 190
Lifetime expected credit loss $
- - - - - -
(c) Liquidity riskLiquidity risk is the risk that the Group will encounter difficulties in meeting the obligations associated with its financial liabilities. The Group manages liquidity risk by monitoring forecast cash flows and ensuring that adequate cash balances are maintained to meet its liabilities when due.
The following table summarises the contractual timing of undiscounted cash flows of financial instruments:
2020
Less than 1 year $’000
Between 1 and 2
years $’000
Between 3 and 5
years $’000
Over 5 years $’000
Total $’000
Financial assets
Cash and cash equivalents 72,259 - - - 72,259
Trade and other receivables 1,961 - - 1,961
Other assets 1,757 1,761 - - 3,518
75,977 1,761 - - 77,738
Financial liabilities
Trade and other payables 19,060 - - - 19,060
Lease liabilities 1,181 1,149 3,136 - 5,466
Contingent consideration 1,757 1,581 - - 3,338
21,998 2,730 3,136 - 27,864
2019
Less than 1 year $’000
Between 1 and 2
years $’000
Between 3 and 5
years $’000
Over 5 years $’000
Total $’000
Financial assets
Cash and cash equivalents 84,583 - - - 84,583
Trade and other receivables 922 - - - 922
85,505 - - - 85,505
Financial liabilities
Trade and other payables 22,070 - - - 22,070
22,070 - - - 22,070
(d) Fair value hierarchyThe fair value of cash, cash equivalents and non-interest bearing financial assets and liabilities approximates their carrying value due to their short term maturity.
The fair value of financial instruments that are not traded in an active market (for example, unlisted investments) are determined using valuation tech-niques. The valuation techniques maximise the use of observable market data where possible and rely as little as possible on entity specific estimates.
The following tables detail the consolidated entity's assets and liabilities, measured or disclosed at fair value, using a three level hierarchy, based on the lowest level of input that is significant to the entire fair value measure-ment, being:
• Level 1: Quoted prices (unadjusted) in active markets for identical assets or liabilities that the entity can access at the measurement date
• Level 2: Inputs other than quoted prices included within Level 1 that are observable for the asset or liability, either directly or indirectly
• Level 3: Unobservable inputs for the asset or liability
Consolidated - 2020Level 1
$'000Level 2
$'000Level 3
$'000Total
$'000
Assets - - - -
Liabilities
Contingent consideration - - 3,338 3,338
Total liabilities - - 3,338 3,338
There were no assets and liabilities, measured or disclosed at fair value, using the three level hierarchy in FY2019.
There were no transfers between levels during the financial year.
The carrying amounts of trade and other receivables and trade and other payables are assumed to approximate their fair values due to their short-term nature.
The fair value of the contingent consideration is estimated by discounting the probability-adjusted profit in Gatherwell Ltd at the company’s weighted average cost of capital.
(b) Assets pledged as securityThe bank facilities are secured by a fixed and floating charge over all the assets of the Group.
(c) Defaults and breachesThere have been no defaults or breaches during the financial year ended 30 June 2020.
Note 18: Financial risk managementThe Group has exposure to a variety of financial risks including market risk (foreign exchange risk and interest rate risk), credit risk and liquidity risk. Risk management is performed by a central Treasury function on behalf of the Group under Treasury Policies approved by the Board annually. Speculative activities are strictly prohibited. Compliance with the Treasury Policies is monitored on an ongoing basis through regular reporting to the Board.
Whilst there has been no noticable impact on financial performance from COVID-19, there is a risk that any future economic downturn could reduce disposable income and consequently may impact customer spending levels.
(a) Market riskMarket risk is the risk that adverse movements in foreign exchange and interest rates will affect the Group’s financial performance or the value of its holdings of financial instruments. The Group measures market risk using cash flow at risk. The objective of risk management is to manage the market risks inherent in the business to protect profitability and return on assets.
(i) Foreign exchange risk
Exposure to foreign exchange riskForeign exchange risk arises from commercial transactions (transactional risks) and recognised assets and liabilities (translational risks) that are denominated in or related to a currency that is not in the Group’s functional currency. The Group’s foreign exchange risk relates largely to the Fiji Dollar (FJ$) and Great British Pound (GBP).
Risk managementTreasury monitor the Group’s exposure regularly and utilise the spot market to buy and sell specified amounts of foreign currency to manage this risk. Transactional risks are managed predominantly within the Group’s pricing policies through the regular review of prices in foreign currency.
Sensitivity on foreign exchange riskAny movement in foreign exchange rates would not be significant to the Group.
(ii) Interest rate risk
Exposure to interest rate riskThe Group’s has interest bearing assets and therefore its income and oper-ating cash flows are subject to changes in market interest rates.
At the reporting date, the Group has exposure to the following interest rates:
Consolidated
Rate1 %
2020 $’000
Rate1 %
2019 $’000
Deposits 0.80 72,259 1.64 84,583
Lease liabilities 3.50 5,385 -
1 weighted average interest rate
Risk managementThe Group manages cash flow interest rate risk by using term deposits with banks for various periods. The weighted average maturity of outstanding term deposits is approximately 23 days (2019: 31 days). Term deposits cur-rently in place cover approximately 79% (2019: 66%) of the total cash and cash equivalent balances.
Sensitivity on market risksThe following table summarises the gain/(loss) impact of a 200 basis points (bps) interest rate change on net profit and equity before tax, with all other variables remaining constant, as at 30 June 2020:
Consolidated
Effect on profit (before tax)
Effect on equity (before tax)
2020 2019 2020 2019
200 bps movement in inter-est rates
200 bps increase in inter-est rates 1,445 1,692 1,445 1,692
200 bps decrease in inter-est rates (1,445) (1,692) (1,445) (1,692)
(b) Credit RiskCredit risk is the risk of financial loss to the Group if a customer or counter-party to a financial instrument fails to meet its contractual obligations. Credit risk arises principally from cash and cash equivalents and trade and other receivables.
The maximum exposure to credit risk, excluding the value of any collateral or other security, at the end of the reporting period to recognised financial assets, is the carrying amount, net of any provisions for impairment of those assets, as disclosed in the statement of financial position and notes to the financial statements. Assets are pledged as security as detailed in note 17(b).
Credit risk is managed on a Group basis through the Board approved Treasury Policies and is reviewed regularly by the Board.
The Board monitors credit risk by actively assessing the rating quality and liquidity of counter parties:
• Surplus funds are only invested with banks and financial institutions with a Standard and Poor’s rating of no less than A and to a limited amount at any one financial institution:
• All potential customers are rated for credit worthiness taking into account their size, market position and financial standing, and the risk is measured using debtor aging analysis; and
• Customers that do not meet the Group’s strict credit policies may only purchase in cash or using recognised credit cards.
(i) Trade receivablesThe Group applies the AASB 9 simplified model of recognising lifetime expected credit losses for all trade receivables as these items do not have a significant financing component.
In measuring the expected credit losses, the trade receivables have been assessed on a collective basis as they possess shared credit risk charac-teristics. They have been grouped based on the days past due and also according to the geographical location of customers.
The expected loss rates are based on the payment profile for sales over the past 60 months before 30 June 2020 and 30 June 2019 respectively as well as the corresponding historical credit losses during that period. The histori-cal rates are adjusted to reflect current and forecast expected losses.
Trade receivables are written off (ie derecognised) when there is no reason-able expectation of recovery. Failure to make payments within 180 days from the invoice date and failure to engage with the Group on alternative pay-ment arrangement amongst other is considered indicators of no reasonable expectation of recovery.
Trade receivables days past due
30 June 2020 $’000s
Cur-rent
1-30 days
31-60 days
61-90 days
> 90 days
Total
Expected credit loss rate 0.0% 0.0% 0.0% 0.0% 0.0%
Gross carrying amount $ 1 138 36 33 102 311
Lifetime expected credit loss $
- - - - - -
80 JUMBO INTERACTIVE LTD ANNUAL REPORT 2020 JUMBO INTERACTIVE LTD ANNUAL REPORT 2020 81

Level 3 assets and liabilitiesMovements in level 3 assets and liabilities during the current and previous financial year are set out below:
Consolidated
Contingent consideration
$'000Total
$'000
Balance at 1 July 2018 - -
Balance at 30 June 2019 - -
Additions 3,410 3,410
Effects of movements in foreign exchange recognised in other compre-hensive income (248) (248)
Fair value movement recognised in profit or loss 176 176
Balance at 30 June 2020 3,338 3,338
The level 3 assets and liabilities unobservable inputs and sensitivity are as follows:
DescriptionUnobservable inputs Range Sensitivity
Contingent consideration Probability rate 90%
5% change would increase/decrease fair value by $88,000
Future profit$568,000 to $663,000
Less than $500,000 would decrease fair value by $1,581,000
Discount rate 16%
1.00% change would increase/decrease fair value by $14,000
In this sectionGroup structure provides information about particular subsidiaries and associates and how changes have affected the financial position and perfor-mance of the Group.
Note 19: Business combinations Page 84Note 20: Controlled subsidiaries Page 85Note 21: Parent disclosures Page 85
GROUP STRUCTURE
82 JUMBO INTERACTIVE LTD ANNUAL REPORT 2020 JUMBO INTERACTIVE LTD ANNUAL REPORT 2020 83

Note 19: Business combinationsOn 29 November 2019, the Group acquired 100% of the issued share capital and voting rights of Gatherwell Limited (Gatherwell), a company based in the United Kingdom that operates as an External Lottery Manager. The primary objective of the acquisition is to provide the Group an entry point to licence its lottery software platform in the UK charities lottery market.
Details of the business combination are as follows:
Fair value of purchase consideration Note $’000s
Cash paid on completion 5,684
Contingent consideration 19(b) 3,410
Working capital settlement adjustment payable 19(a) 78
Total consideration 9,172
Fair value of identifiable assets and liabilities at acqusiition date:
Note $’000s
Cash 688
Trade and oher receivables 108
Property, plant and equipment 11
Software 865
Customer contracts and relationships 1,356
Trade and other payables (617)
Net assets 2,411
Goodwill on consolidation 19(d) 6,761
Gatherwell acquisition at fair value 9,172
Cash consideration paid 5,684
Cash acquired on acquisition (688)
Cash outflow 4,996
Acquisition costs charged to expenses 19(a) 406
(a) Consideration transferredAcquisition-related costs amounted to $406,000 are not included as part of the consideration transferred and have been recognised as an expense in the consolidated statement of profit or loss and other comprehensive income, as part of administrative expenses.
The actual net working capital was in excess of the target working capital resulting in a working capital settlement adjustment $78,000 being payable to the vendors of Gatherwell.
(b) Contingent considerationThe contingent consideration arrangement requires the Group to pay the former owners of Gatherwell up to an additional undiscounted amount of GBP2,000,000 (~$3,518,000) in cash to the Gatherwell Vendors if certain Revenue and Profit targets are met, to be paid in up to two instalments fol-lowing the 30 June 2020 and 30 June 2021 financial year ends.
The contingent consideration funds are held by an Escrow Agent in the UK in an interest-bearing bank account from which any instalments will be paid.
Following the 30 June 2021 financial year end, any amount not paid out will be returned to Jumbo.
At 30 June 2020 these funds, held in an Escrow account for the Gatherwell contingent consideration, are recognised in the Statement of Financial Position as:
$'000s
Other current assets 1,757
Other non-curent assets 1,761
Total 3,518
The fair value of the contingent consideration arrangement of $3,410,000 was estimated by calculating the present value of the future expected cash flows. The estimates are based on a discount rate of 16% and assumed probability-adjusted profit in Gatherwell of GBP300,000 (~$568,000) to GBP350,000 (~$663,000).
The probability-adjusted profit in Gatherwell is recalculated at each reporting date with any gains/losses on the fair value of the contingent con-sideration recognised in profit or loss.
At 30 June 2020 the fair value of the contingent consideration liability is rec-ognised on the Statement of Financial Position as:
$'000s
Current contingent consideration 1,757
Non-current contingent consideration 1,581
Total 3,338
(c) Identifiable net assetsDeveloped software and customer contracts and relationships have been identified as separately identifiable assets. These assets have been valued by an independent valuer according to the cost approach/cost to create methodology for developed software and income approach/excess earnings methodology for customer contracts and relationships.
(d) GoodwillThe goodwill that arose on the combination can be attributed to Gatherwell’s strong position, competitive advantage and strong growth prospects in the digital charities lottery market. No amount of goodwill is expected to be deductible for tax purposes.
(e) Revenue and profit contributionGatherwell contributed TTV of $7,612,000, revenue of $1,520,000 and net profit of $267,000 to the Group from the date of acquisition to 30 June 2020. If the acquisition had occurred on 1 July 2019, the Group’s pro-forma TTV, revenue and net profit after tax for the financial year ended 30 June 2020 would have been $12,570,000, $2,505,000, and $477,000 respectively.
Recognition and measurementThe acquisition method of accounting is used to account for business combinations regardless of whether equity instruments or other assets are acquired.
The consideration transferred is the sum of the acquisition-date fair values of the assets transferred, equity instruments issued or liabilities incurred by the acquirer to former owners of the acquiree and the amount of any non-controlling interest in the acquiree. For each business combination, the non-controlling interest in the acquiree is measured at either fair value or at the proportionate share of the acquiree’s identifiable net assets. All acquisi-tion costs are expensed as incurred to profit or loss.
On the acquisition of a business, the consolidated entity assesses the finan-cial assets acquired and liabilities assumed for appropriate classification and designation in accordance with the contractual terms, economic conditions, the consolidated entity’s operating or accounting policies and other perti-nent conditions in existence at the acquisition-date.
Significant judgements and estimates
A key judgement by management is a 100% probabilty of the contin-gent consideration being paid following the 30 June 2020 financial year end and a 90% probability of the contingent consideration being paid following the 30 June 2021 financial year end.
Where the business combination is achieved in stages, the consolidated entity remeasures its previously held equity interest in the acquiree at the acquisition-date fair value and the difference between the fair value and the previous carrying amount is recognised in profit or loss.
Contingent consideration to be transferred by the acquirer is recognised at the acquisition-date fair value. Subsequent changes in the fair value of the contingent consideration classified as an asset or liability is recognised in profit or loss. Contingent consideration classified as equity is not remeas-ured and its subsequent settlement is accounted for within equity.
The difference between the acquisition-date fair value of assets acquired, liabilities assumed and any non-controlling interest in the acquiree and the fair value of the consideration transferred and the fair value of any pre-exist-ing investment in the acquiree is recognised as goodwill. If the consideration transferred and the pre-existing fair value is less than the fair value of the identifiable net assets acquired, being a bargain purchase to the acquirer, the difference is recognised as a gain directly in profit or loss by the acquirer on the acquisition-date, but only after a reassessment of the identification and measurement of the net assets acquired, the non-controlling interest in the acquiree, if any, the consideration transferred and the acquirer’s previ-ously held equity interest in the acquirer.
Business combinations are initially accounted for on a provisional basis. The acquirer retrospectively adjusts the provisional amounts recognised and also recognises additional assets or liabilities during the measurement period, based on new information obtained about the facts and circumstances that existed at the acquisition-date. The measurement period ends on either the earlier of (i) 12 months from the date of the acquisition or (ii) when the acquirer receives all the information possible to determine fair value.
Note 20: Controlled subsidiariesThe Group’s subsidiaries that were controlled during the year and prior years are set out below:
Percentage Ownership
Country of Incorporation
2020 %
2019 %
Direct subsidiaries of the ultimate parent entity Jumbo Interactive Limited:
Benon Technologies Pty Ltd Australia 100 100
TMS Global Services Pty Ltd Australia 100 100
Intellitron Pty Ltd Australia 100 100
Jumbo Lotteries Pty Ltd Australia 100 100
Jumbo Interactive Asia Pty Ltd Australia 100 100
Cook Islands Tattslotto Pty Ltd Cook Islands 1 1
Jumbo Interactivo de Mexico SA de CV Mexico 100 100
Gatherwell Limited UK 100 -
Subsidiaries of TMS Global Services Pty Ltd:
TMS Global Services (NSW) Pty Ltd Australia 100 100
TMS Global Services (VIC) Pty Ltd Australia 100 100
TMS Fiji Limited Fiji 100 100
TMS Fiji On-Line Limited Fiji 100 100
TMS Global Services (PNG) Limited Papua New Guinea 100 100
Cook Islands Tattslotto Pty Ltd Cook Islands 99 99
Jumbo Lotteries North America, Inc. United States of America 100 100
Principles of consolidationThe consolidated financial statements comprise the financial statements of Jumbo Interactive Limited and its subsidiaries at 30 June each year (‘the Group’). Subsidiaries are entities over which the Group has control. The
Group has control over an entity when the Group is exposed to, or has rights to, variable returns from its involvement with the entity, and has the ability to use its power to affect those returns. Subsidiaries are consolidated from the date on which control is transferred to the Group and are deconsolidated from the date on which control ceases.
All intercompany balances and transactions, including unrealised profits aris-ing from intragroup transactions have been eliminated. Unrealised losses are also eliminated unless the transaction provides evidence of the impairment of the asset transferred.
Changes in ownership interestsWhen the Group ceases to have control, joint control or significant influ-ence, any retained interest in the entity is remeasured to its fair value with the change in carrying amount recognised in the profit or loss. This fair value becomes the initial carrying value for the purposes of subsequently accounting for the retained interest as an associate, joint venture or availa-ble-for-sale financial asset. In addition, any amount previously recognised in other comprehensive income in respect of that entity, are accounted for as if the Group had directly disposed of the relative assets or liabilities. This may mean that amounts previously recognised in other comprehensive income are reclassified to profit or loss.
If the ownership interest in an associate or a joint venture is reduced, but significant influence or control is retained, only a proportionate share of the amounts previously recognised in other comprehensive income are reclassi-fied to profit or loss, where appropriate.
Note 21: Parent disclosuresThe parent and ultimate parent entity within the Group is Jumbo Interactive Limited.
(a) Summary financial informationThe individual financial statements for the parent entity show the following aggregated amounts as follows:
2020 $’000
2019 $’000
Current assets 25,336 32,946
Non-current assets 38,438 34,043
Total assets 63,774 66,989
Current liabilities 3,216 1,986
Non-current liabilities 2,308 198
Total liabilities 5,524 2,184
Net assets 58,250 64,805
Issued capital 80,089 79,302
Retained earnings/(accumulated losses) (26,037) (26,037)
Profits appropriation reserve 3,245 11,090
Other reserves 953 450
Total shareholders’ equity 58,250 64,805
Profit for the year 17,113 21,359
Total comprehensive income for the year 17,113 21,359
(b) GuaranteesThe parent entity has provided guarantees to third parties in relation to the obligations of controlled entities in respect to banking facilities. The guar-antees are for the terms of the facilities per note 17: Borrowings, and are ongoing.
The parent entity has also provided a guarantee in favour of Tabcorp in respect of payment obligations of a subsidiary company in terms of the Agent reseller agreements, between its subsidiary and the favouree.
84 JUMBO INTERACTIVE LTD ANNUAL REPORT 2020 JUMBO INTERACTIVE LTD ANNUAL REPORT 2020 85
(c) Contractual commitmentsThere were no contractual commitments for the acquisition of property, plant and equipment entered into by the parent entity at 30 June 2020 (2019: $Nil).
(d) Contingent liabilitiesThe parent entity has no contingent liabilities other than the guarantees referred to above.
Recognition and measurementThe financial information for the parent entity, Jumbo Interactive Limited, has been prepared on the same basis as the consolidated financial statements, except as set out below:
(i) Investments in subsidiaries and associatesInvestments in subsidiaries and associates are accounted for at cost in the financial statements of Jumbo Interactive Limited. Dividends received from associates are recognised in the parent entity’s income statement, rather than being deducted from the carrying amount of these investments.
(ii) Tax consolidationJumbo Interactive Limited and its wholly owned subsidiaries have imple-mented the tax consolidation legislation for the whole of the financial year. Refer to note 4 for details.
In this sectionOther information provides information on other items which require disclosure to comply with Australian Accounting Standards and other regulatory pronouncements however are not consider critical in understanding the financial performance or posi-tion of the Group.
Note 22: Investments accounted for using the Equity Method Page 88Note 23: Financial assets at fair value through other comprehensive income Page 88Note 24: Related party transactions Page 88Note 25: Key Management Personnel compensation Page 88Note 26: Share-based payments Page 88Note 27: Remuneration of auditors Page 89Note 28: Summary of other significant accounting policies Page 91
OTHER INFORMATION
86 JUMBO INTERACTIVE LTD ANNUAL REPORT 2020 JUMBO INTERACTIVE LTD ANNUAL REPORT 2020 87
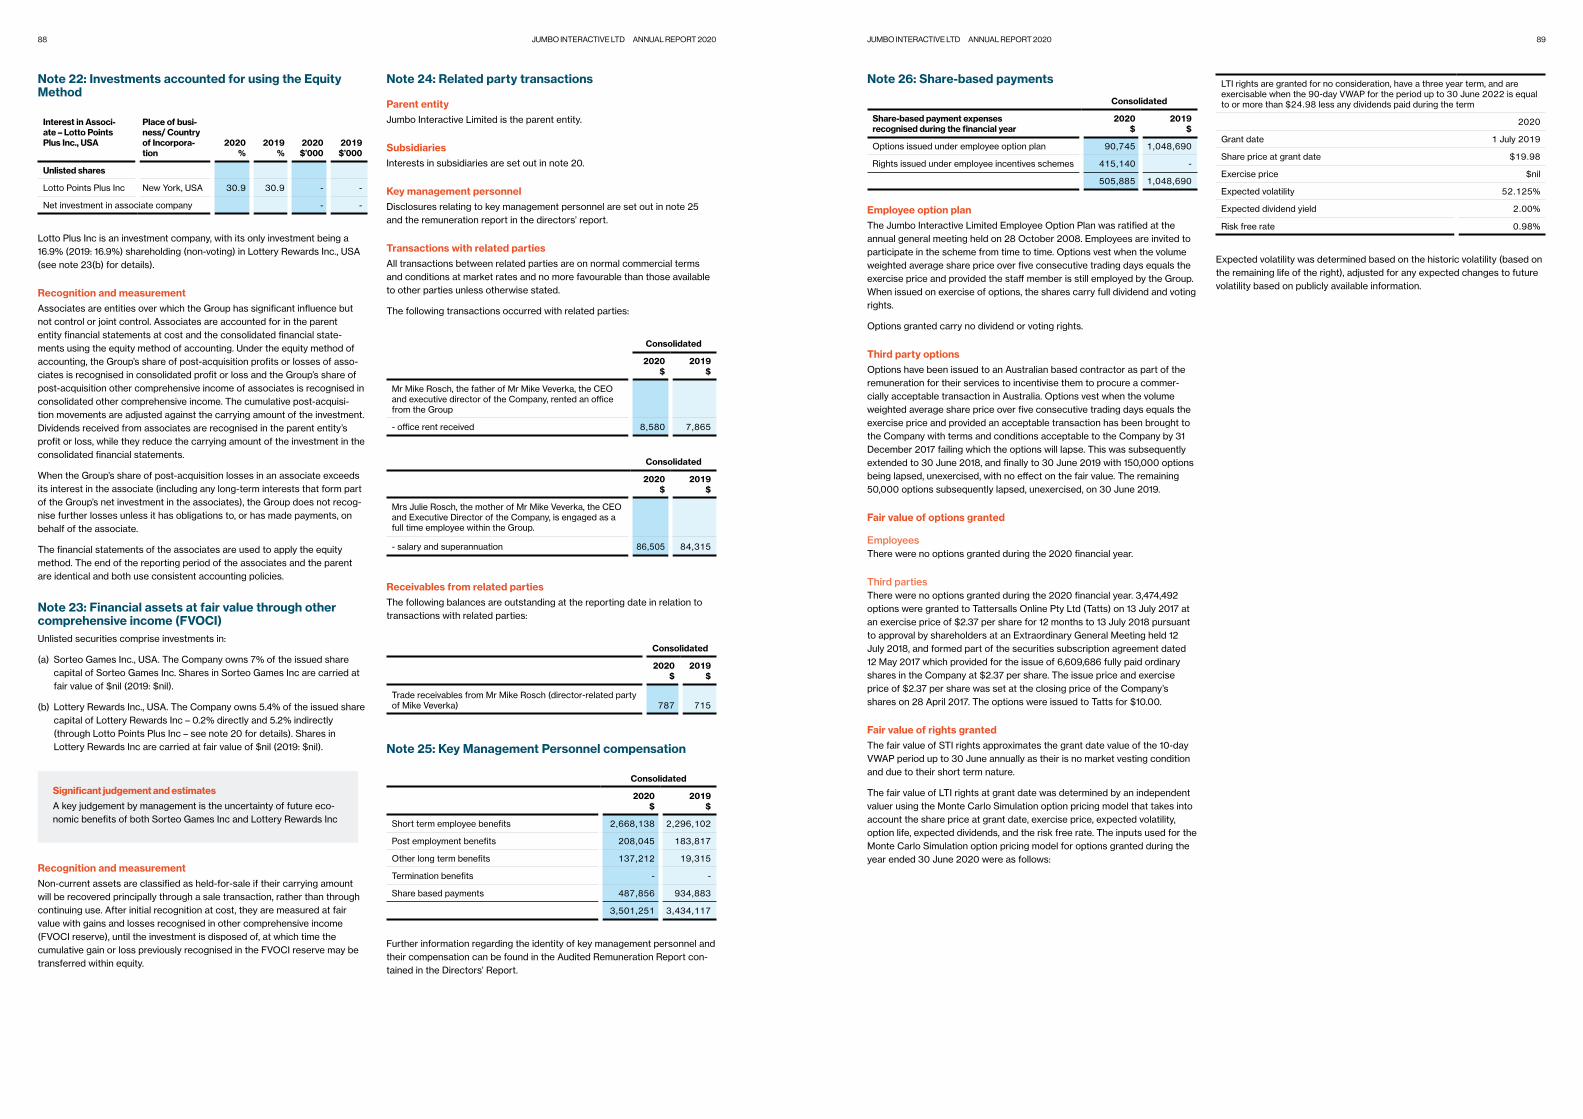
Note 22: Investments accounted for using the Equity Method
Interest in Associ-ate – Lotto Points Plus Inc., USA
Place of busi-ness/ Country of Incorpora-tion
2020 %
2019 %
2020 $’000
2019 $’000
Unlisted shares
Lotto Points Plus Inc New York, USA 30.9 30.9 - -
Net investment in associate company - -
Lotto Plus Inc is an investment company, with its only investment being a 16.9% (2019: 16.9%) shareholding (non-voting) in Lottery Rewards Inc., USA (see note 23(b) for details).
Recognition and measurementAssociates are entities over which the Group has significant influence but not control or joint control. Associates are accounted for in the parent entity financial statements at cost and the consolidated financial state-ments using the equity method of accounting. Under the equity method of accounting, the Group’s share of post-acquisition profits or losses of asso-ciates is recognised in consolidated profit or loss and the Group’s share of post-acquisition other comprehensive income of associates is recognised in consolidated other comprehensive income. The cumulative post-acquisi-tion movements are adjusted against the carrying amount of the investment. Dividends received from associates are recognised in the parent entity’s profit or loss, while they reduce the carrying amount of the investment in the consolidated financial statements.
When the Group’s share of post-acquisition losses in an associate exceeds its interest in the associate (including any long-term interests that form part of the Group’s net investment in the associates), the Group does not recog-nise further losses unless it has obligations to, or has made payments, on behalf of the associate.
The financial statements of the associates are used to apply the equity method. The end of the reporting period of the associates and the parent are identical and both use consistent accounting policies.
Note 23: Financial assets at fair value through other comprehensive income (FVOCI)Unlisted securities comprise investments in:
(a) Sorteo Games Inc., USA. The Company owns 7% of the issued share capital of Sorteo Games Inc. Shares in Sorteo Games Inc are carried at fair value of $nil (2019: $nil).
(b) Lottery Rewards Inc., USA. The Company owns 5.4% of the issued share capital of Lottery Rewards Inc – 0.2% directly and 5.2% indirectly (through Lotto Points Plus Inc – see note 20 for details). Shares in Lottery Rewards Inc are carried at fair value of $nil (2019: $nil).
Recognition and measurementNon-current assets are classified as held-for-sale if their carrying amount will be recovered principally through a sale transaction, rather than through continuing use. After initial recognition at cost, they are measured at fair value with gains and losses recognised in other comprehensive income (FVOCI reserve), until the investment is disposed of, at which time the cumulative gain or loss previously recognised in the FVOCI reserve may be transferred within equity.
Note 24: Related party transactions
Parent entityJumbo Interactive Limited is the parent entity.
SubsidiariesInterests in subsidiaries are set out in note 20.
Key management personnelDisclosures relating to key management personnel are set out in note 25 and the remuneration report in the directors’ report.
Transactions with related partiesAll transactions between related parties are on normal commercial terms and conditions at market rates and no more favourable than those available to other parties unless otherwise stated.
The following transactions occurred with related parties:
Consolidated
2020 $
2019 $
Mr Mike Rosch, the father of Mr Mike Veverka, the CEO and executive director of the Company, rented an office from the Group
- office rent received 8,580 7,865
Consolidated
2020 $
2019 $
Mrs Julie Rosch, the mother of Mr Mike Veverka, the CEO and Executive Director of the Company, is engaged as a full time employee within the Group.
- salary and superannuation 86,505 84,315
Receivables from related partiesThe following balances are outstanding at the reporting date in relation to transactions with related parties:
Consolidated
2020 $
2019 $
Trade receivables from Mr Mike Rosch (director-related party of Mike Veverka) 787 715
Note 25: Key Management Personnel compensation
Consolidated
2020 $
2019 $
Short term employee benefits 2,668,138 2,296,102
Post employment benefits 208,045 183,817
Other long term benefits 137,212 19,315
Termination benefits - -
Share based payments 487,856 934,883
3,501,251 3,434,117
Further information regarding the identity of key management personnel and their compensation can be found in the Audited Remuneration Report con-tained in the Directors’ Report.
Significant judgement and estimates
A key judgement by management is the uncertainty of future eco-nomic benefits of both Sorteo Games Inc and Lottery Rewards Inc
Note 26: Share-based payments
Consolidated
Share-based payment expenses recognised during the financial year
2020 $
2019 $
Options issued under employee option plan 90,745 1,048,690
Rights issued under employee incentives schemes 415,140 -
505,885 1,048,690
Employee option planThe Jumbo Interactive Limited Employee Option Plan was ratified at the annual general meeting held on 28 October 2008. Employees are invited to participate in the scheme from time to time. Options vest when the volume weighted average share price over five consecutive trading days equals the exercise price and provided the staff member is still employed by the Group. When issued on exercise of options, the shares carry full dividend and voting rights.
Options granted carry no dividend or voting rights.
Third party optionsOptions have been issued to an Australian based contractor as part of the remuneration for their services to incentivise them to procure a commer-cially acceptable transaction in Australia. Options vest when the volume weighted average share price over five consecutive trading days equals the exercise price and provided an acceptable transaction has been brought to the Company with terms and conditions acceptable to the Company by 31 December 2017 failing which the options will lapse. This was subsequently extended to 30 June 2018, and finally to 30 June 2019 with 150,000 options being lapsed, unexercised, with no effect on the fair value. The remaining 50,000 options subsequently lapsed, unexercised, on 30 June 2019.
Fair value of options granted
EmployeesThere were no options granted during the 2020 financial year.
Third partiesThere were no options granted during the 2020 financial year. 3,474,492 options were granted to Tattersalls Online Pty Ltd (Tatts) on 13 July 2017 at an exercise price of $2.37 per share for 12 months to 13 July 2018 pursuant to approval by shareholders at an Extraordinary General Meeting held 12 July 2018, and formed part of the securities subscription agreement dated 12 May 2017 which provided for the issue of 6,609,686 fully paid ordinary shares in the Company at $2.37 per share. The issue price and exercise price of $2.37 per share was set at the closing price of the Company’s shares on 28 April 2017. The options were issued to Tatts for $10.00.
Fair value of rights grantedThe fair value of STI rights approximates the grant date value of the 10-day VWAP period up to 30 June annually as their is no market vesting condition and due to their short term nature.
The fair value of LTI rights at grant date was determined by an independent valuer using the Monte Carlo Simulation option pricing model that takes into account the share price at grant date, exercise price, expected volatility, option life, expected dividends, and the risk free rate. The inputs used for the Monte Carlo Simulation option pricing model for options granted during the year ended 30 June 2020 were as follows:
LTI rights are granted for no consideration, have a three year term, and are exercisable when the 90-day VWAP for the period up to 30 June 2022 is equal to or more than $24.98 less any dividends paid during the term
2020
Grant date 1 July 2019
Share price at grant date $19.98
Exercise price $nil
Expected volatility 52.125%
Expected dividend yield 2.00%
Risk free rate 0.98%
Expected volatility was determined based on the historic volatility (based on the remaining life of the right), adjusted for any expected changes to future volatility based on publicly available information.
88 JUMBO INTERACTIVE LTD ANNUAL REPORT 2020 JUMBO INTERACTIVE LTD ANNUAL REPORT 2020 89
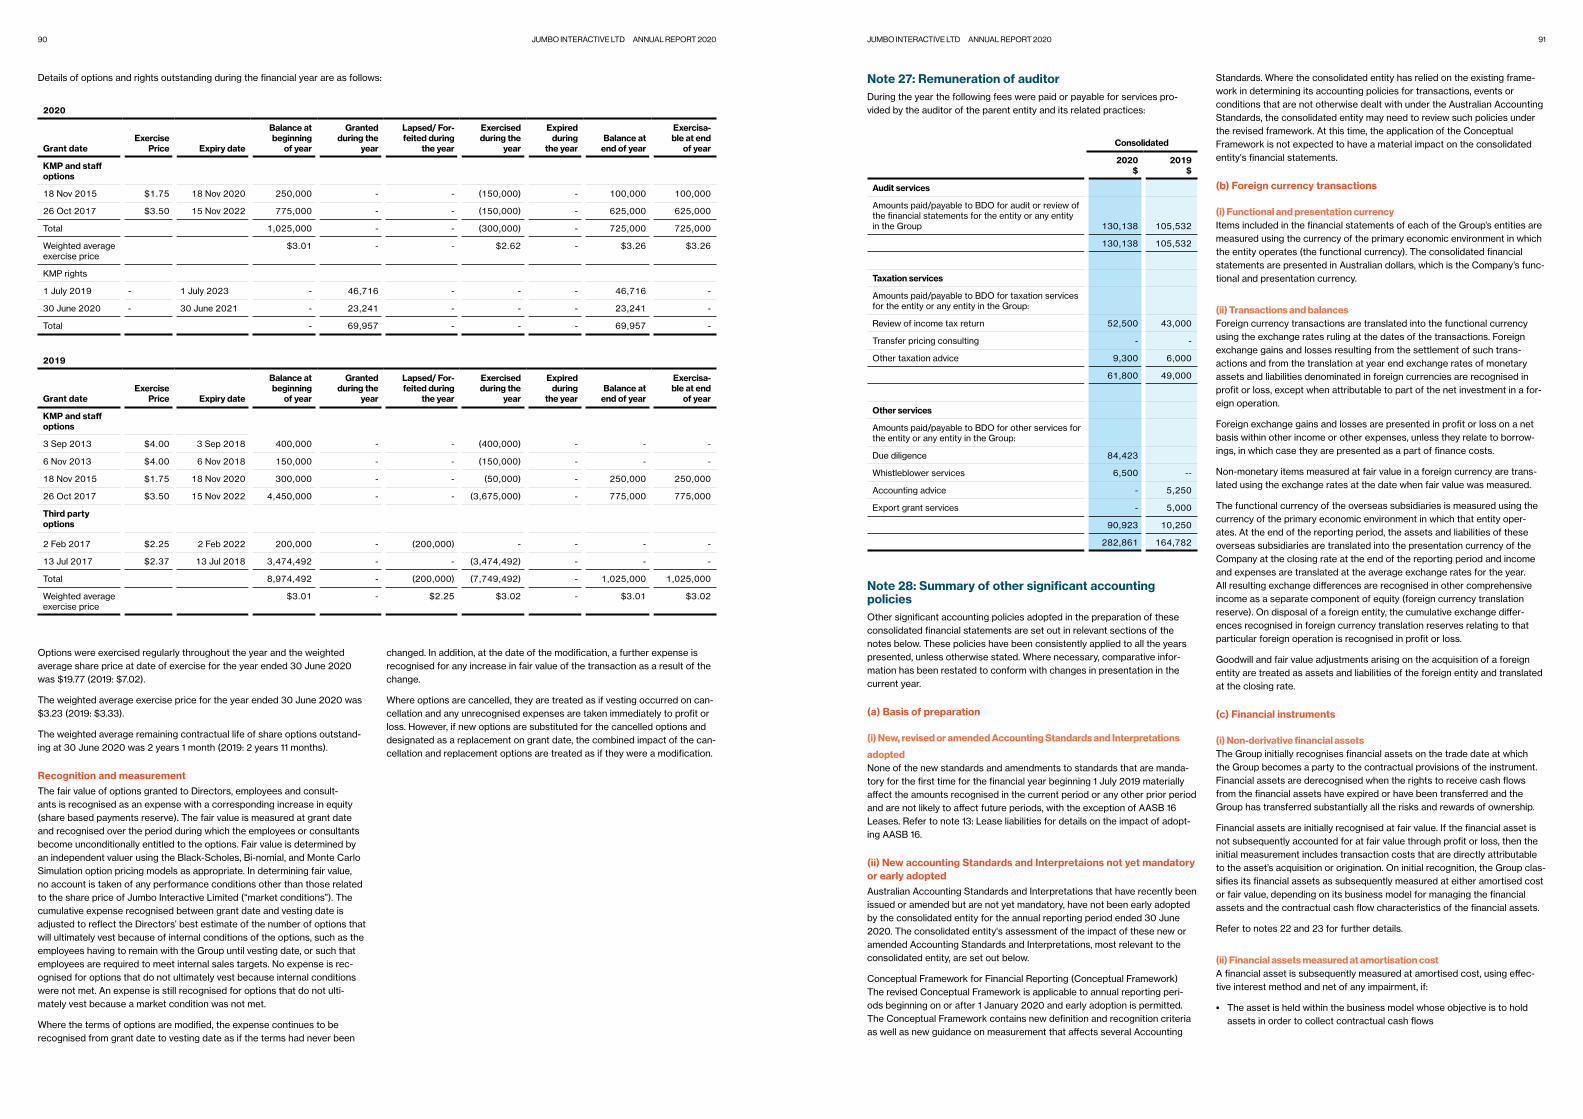
Details of options and rights outstanding during the financial year are as follows:
2020
Grant dateExercise
Price Expiry date
Balance at beginning
of year
Granted during the
year
Lapsed/ For-feited during
the year
Exercised during the
year
Expired during
the yearBalance at
end of year
Exercisa-ble at end
of year
KMP and staff options
18 Nov 2015 $1.75 18 Nov 2020 250,000 - - (150,000) - 100,000 100,000
26 Oct 2017 $3.50 15 Nov 2022 775,000 - - (150,000) - 625,000 625,000
Total 1,025,000 - - (300,000) - 725,000 725,000
Weighted average exercise price
$3.01 - - $2.62 - $3.26 $3.26
KMP rights
1 July 2019 - 1 July 2023 - 46,716 - - - 46,716 -
30 June 2020 - 30 June 2021 - 23,241 - - - 23,241 -
Total - 69,957 - - - 69,957 -
2019
Grant dateExercise
Price Expiry date
Balance at beginning
of year
Granted during the
year
Lapsed/ For-feited during
the year
Exercised during the
year
Expired during
the yearBalance at
end of year
Exercisa-ble at end
of year
KMP and staff options
3 Sep 2013 $4.00 3 Sep 2018 400,000 - - (400,000) - - -
6 Nov 2013 $4.00 6 Nov 2018 150,000 - - (150,000) - - -
18 Nov 2015 $1.75 18 Nov 2020 300,000 - - (50,000) - 250,000 250,000
26 Oct 2017 $3.50 15 Nov 2022 4,450,000 - - (3,675,000) - 775,000 775,000
Third party options
2 Feb 2017 $2.25 2 Feb 2022 200,000 - (200,000) - - - -
13 Jul 2017 $2.37 13 Jul 2018 3,474,492 - - (3,474,492) - - -
Total 8,974,492 - (200,000) (7,749,492) - 1,025,000 1,025,000
Weighted average exercise price
$3.01 - $2.25 $3.02 - $3.01 $3.02
Options were exercised regularly throughout the year and the weighted average share price at date of exercise for the year ended 30 June 2020 was $19.77 (2019: $7.02).
The weighted average exercise price for the year ended 30 June 2020 was $3.23 (2019: $3.33).
The weighted average remaining contractual life of share options outstand-ing at 30 June 2020 was 2 years 1 month (2019: 2 years 11 months).
Recognition and measurementThe fair value of options granted to Directors, employees and consult-ants is recognised as an expense with a corresponding increase in equity (share based payments reserve). The fair value is measured at grant date and recognised over the period during which the employees or consultants become unconditionally entitled to the options. Fair value is determined by an independent valuer using the Black-Scholes, Bi-nomial, and Monte Carlo Simulation option pricing models as appropriate. In determining fair value, no account is taken of any performance conditions other than those related to the share price of Jumbo Interactive Limited (“market conditions”). The cumulative expense recognised between grant date and vesting date is adjusted to reflect the Directors’ best estimate of the number of options that will ultimately vest because of internal conditions of the options, such as the employees having to remain with the Group until vesting date, or such that employees are required to meet internal sales targets. No expense is rec-ognised for options that do not ultimately vest because internal conditions were not met. An expense is still recognised for options that do not ulti-mately vest because a market condition was not met.
Where the terms of options are modified, the expense continues to be recognised from grant date to vesting date as if the terms had never been
changed. In addition, at the date of the modification, a further expense is recognised for any increase in fair value of the transaction as a result of the change.
Where options are cancelled, they are treated as if vesting occurred on can-cellation and any unrecognised expenses are taken immediately to profit or loss. However, if new options are substituted for the cancelled options and designated as a replacement on grant date, the combined impact of the can-cellation and replacement options are treated as if they were a modification.
Note 27: Remuneration of auditorDuring the year the following fees were paid or payable for services pro-vided by the auditor of the parent entity and its related practices:
Consolidated
2020 $
2019 $
Audit services
Amounts paid/payable to BDO for audit or review of the financial statements for the entity or any entity in the Group 130,138 105,532
130,138 105,532
Taxation services
Amounts paid/payable to BDO for taxation services for the entity or any entity in the Group:
Review of income tax return 52,500 43,000
Transfer pricing consulting - -
Other taxation advice 9,300 6,000
61,800 49,000
Other services
Amounts paid/payable to BDO for other services for the entity or any entity in the Group:
Due diligence 84,423
Whistleblower services 6,500 --
Accounting advice - 5,250
Export grant services - 5,000
90,923 10,250
282,861 164,782
Note 28: Summary of other significant accounting policiesOther significant accounting policies adopted in the preparation of these consolidated financial statements are set out in relevant sections of the notes below. These policies have been consistently applied to all the years presented, unless otherwise stated. Where necessary, comparative infor-mation has been restated to conform with changes in presentation in the current year.
(a) Basis of preparation
(i) New, revised or amended Accounting Standards and Interpretations
adoptedNone of the new standards and amendments to standards that are manda-tory for the first time for the financial year beginning 1 July 2019 materially affect the amounts recognised in the current period or any other prior period and are not likely to affect future periods, with the exception of AASB 16 Leases. Refer to note 13: Lease liabilities for details on the impact of adopt-ing AASB 16.
(ii) New accounting Standards and Interpretaions not yet mandatory or early adoptedAustralian Accounting Standards and Interpretations that have recently been issued or amended but are not yet mandatory, have not been early adopted by the consolidated entity for the annual reporting period ended 30 June 2020. The consolidated entity's assessment of the impact of these new or amended Accounting Standards and Interpretations, most relevant to the consolidated entity, are set out below.
Conceptual Framework for Financial Reporting (Conceptual Framework)The revised Conceptual Framework is applicable to annual reporting peri-ods beginning on or after 1 January 2020 and early adoption is permitted. The Conceptual Framework contains new definition and recognition criteria as well as new guidance on measurement that affects several Accounting
Standards. Where the consolidated entity has relied on the existing frame-work in determining its accounting policies for transactions, events or conditions that are not otherwise dealt with under the Australian Accounting Standards, the consolidated entity may need to review such policies under the revised framework. At this time, the application of the Conceptual Framework is not expected to have a material impact on the consolidated entity's financial statements.
(b) Foreign currency transactions
(i) Functional and presentation currencyItems included in the financial statements of each of the Group’s entities are measured using the currency of the primary economic environment in which the entity operates (the functional currency). The consolidated financial statements are presented in Australian dollars, which is the Company’s func-tional and presentation currency.
(ii) Transactions and balancesForeign currency transactions are translated into the functional currency using the exchange rates ruling at the dates of the transactions. Foreign exchange gains and losses resulting from the settlement of such trans-actions and from the translation at year end exchange rates of monetary assets and liabilities denominated in foreign currencies are recognised in profit or loss, except when attributable to part of the net investment in a for-eign operation.
Foreign exchange gains and losses are presented in profit or loss on a net basis within other income or other expenses, unless they relate to borrow-ings, in which case they are presented as a part of finance costs.
Non-monetary items measured at fair value in a foreign currency are trans-lated using the exchange rates at the date when fair value was measured.
The functional currency of the overseas subsidiaries is measured using the currency of the primary economic environment in which that entity oper-ates. At the end of the reporting period, the assets and liabilities of these overseas subsidiaries are translated into the presentation currency of the Company at the closing rate at the end of the reporting period and income and expenses are translated at the average exchange rates for the year. All resulting exchange differences are recognised in other comprehensive income as a separate component of equity (foreign currency translation reserve). On disposal of a foreign entity, the cumulative exchange differ-ences recognised in foreign currency translation reserves relating to that particular foreign operation is recognised in profit or loss.
Goodwill and fair value adjustments arising on the acquisition of a foreign entity are treated as assets and liabilities of the foreign entity and translated at the closing rate.
(c) Financial instruments
(i) Non-derivative financial assetsThe Group initially recognises financial assets on the trade date at which the Group becomes a party to the contractual provisions of the instrument. Financial assets are derecognised when the rights to receive cash flows from the financial assets have expired or have been transferred and the Group has transferred substantially all the risks and rewards of ownership.
Financial assets are initially recognised at fair value. If the financial asset is not subsequently accounted for at fair value through profit or loss, then the initial measurement includes transaction costs that are directly attributable to the asset’s acquisition or origination. On initial recognition, the Group clas-sifies its financial assets as subsequently measured at either amortised cost or fair value, depending on its business model for managing the financial assets and the contractual cash flow characteristics of the financial assets.
Refer to notes 22 and 23 for further details.
(ii) Financial assets measured at amortisation costA financial asset is subsequently measured at amortised cost, using effec-tive interest method and net of any impairment, if:
• The asset is held within the business model whose objective is to hold assets in order to collect contractual cash flows
90 JUMBO INTERACTIVE LTD ANNUAL REPORT 2020 JUMBO INTERACTIVE LTD ANNUAL REPORT 2020 91

• The contractual terms of the financial asset give rise, on specified dates, to cash flows that are solely payments of principal and interest.
The Group assesses at each reporting date whether there is objective evi-dence that a financial asset (or group of financial assets) is impaired.
Refer to notes 6 and 7 for further details.
(iii) Non-derivative liabilitiesThe Group initially recognises loans on the date when they originated. Other financial liabilities are initially recognised on the trade date. The Group derecognises a financial liability when its contractual obligations are dis-charged or cancelled or expire.
Non-derivative financial liabilities are initially recognised at fair value less any directly attributable transaction costs. Subsequent to initial recognition, these liabilities are measured at amortised cost using the effective interest rate method.
Refer to note 11 for further detail
(d) Goods and Services Tax (GST)Revenues, expenses and assets are recognised net of GST, unless the amount of GST incurred is not recoverable from the Australian Taxation Office (ATO), in which case the GST is recognised as part of the cost of acquisition of the asset or as part of the expense item.
Receivables and payables are stated with the amount of GST receivable or payable included. The net amount of GST recoverable from, or payable to, the ATO is included as part of receivables or payables in the consolidated statement of financial position.
Cash flows are included in the consolidated statement of cash flows on a gross basis and the GST component of cash flows arising from investing and financing activities, which is recoverable from, or payable to, the ATO, are classified as operating cash flows.
Commitments and contingencies are disclosed net of the amount of GST recoverable from, or payable to, the ATO.
In this sectionUnrecognised items provide information about items that are not recognised in the consolidated financial statements but could potentially have a signifi-cant impact on the Group’s financial position and performance.
Note 29: Contingencies Page 94Note 30: Commitments Page 94Note 31: Events after the reporting date Page 94
UNRECOGNISED ITEMS
92 JUMBO INTERACTIVE LTD ANNUAL REPORT 2020 JUMBO INTERACTIVE LTD ANNUAL REPORT 2020 93

Note 29: ContingenciesContingencies relate to the outcome of future events and may result in an asset or liability, however due to current uncertainty do not qualify for recognition.
Estimates of the potential financial effect of contingent liabilities that may become payable:
Consolidated
2020 $’000
2019 $’000
Guarantees provided by the Group’s bankers 682 478
The Group’s bankers have provided guarantees to third parties in relation to premises leased by Group companies. These guarantees have no expiry term and are payable on demand, and are secured by a fixed and floating charge over the Group’s assets.
Note 30: Commitments
Short-term lease commitments (2019: Operating lease commitments under AASB 117)
Consolidated
2020 $’000
2019 $’000
Non-cancellable operating leases contracted for but not capitalised in the consolidated financial statements
Payable
Not later than one year 48 1,096
Later than one year but not later than five years - 4,044
Later than five years - 892
48 6,032
The Group leases various premises in Fiji under operating leases expiring in less than one year.
Recognition and measurement pre 1 July 2019
Leased propertyLeases in which a significant portion of the risks and rewards of ownership are not transferred to the Group as lessee are classified as operating leases and payments (net of incentives received from the lessor) are charged to profit or loss on a straight-line basis over the period of the lease.
Make goodThe Group is required under terms of certain leases to restore the leased premises at the end of the lease to its original condition. A provision has been recognised for the present value of the estimated expenditure required to demolish any leasehold improvements at the end of the lease. These costs have been capitalised as part of the cost of leasehold improvements and are amortised over the shorter of the term of the lease or the useful life of the assets.
Note 31: Events after the reporting dateApart from (i) the revised long-form reseller agreement signed with Tabcorp as announced 25 August 2020 and payment of the $15,000,000 exten-sion fee, and (ii) the final dividend declared, as at the date of this Directors’ Report, the directors are not aware of any matter or circumstance that has arisen that has significantly affected, or may significantly affect, the opera-tions of the Company in the financial years subsequent to 30 June 2020.
The above items are not recognised in the financial statements 30 June
2020.
The Directors of the Company declare that:
1. The consolidated financial statements, comprising the Consolidated Statement of Profit or Loss and Other Comprehensive Income, Consolidated Statement of Financial Position, Consolidated Statement of Changes in Equity and Consolidated Statement of Cash Flows, and accompanying notes, are in accordance with the Corporations Act 2001 and:
a. comply with Australian Accounting Standards and the Corporations Regulations 2001; and
b. give a true and fair view of the consolidated entity’s financial position as at 30 June 2020 and of its performance for the year ended on that date.
2. The Company has included in the notes to the consolidated financial statements an explicit and unreserved statement of compliance with International Financial Reporting Standards.
3. In the Directors’ opinion, there are reasonable grounds to believe that the Company will be able to pay its debts as and when they become due and payable.
4. The remuneration disclosures included in pages 47 to 55 of the Directors’ report (as part of the audited Remuneration Report), for the year ended 30 June 2020, comply with section 300A of the Corporations Act 2001.
5. The Directors have been given the declarations by the Chief Executive Officer and Chief Financial Officer required by section 295A.
This declaration is made in accordance with a resolution of the Directors.
David K BarwickChairmanBrisbane, 26 August 2020
DIRECTORS’ DECLARATION
94 JUMBO INTERACTIVE LTD ANNUAL REPORT 2020 JUMBO INTERACTIVE LTD ANNUAL REPORT 2020 95

Level 10, 12 Creek St Brisbane QLD 4000 GPO Box 457 Brisbane QLD 4001 Australia
Tel: +61 7 3237 5999 Fax: +61 7 3221 9227 www.bdo.com.au
BDO Audit Pty Ltd ABN 33 134 022 870 is a member of a national association of independent entities which are all members of BDO Australia Ltd ABN 77 050 110 275, an Australian company limited by guarantee. BDO Audit Pty Ltd and BDO Australia Ltd are members of BDO International Ltd, a UK company limited by guarantee, and form part of the international BDO network of independent member firms. Liability limited by a scheme approved under Professional Standards Legislation.
INDEPENDENT AUDITOR'S REPORT
To the members of Jumbo Interactive Limited
Report on the Audit of the Financial Report
Opinion
We have audited the financial report of Jumbo Interactive Limited (the Company) and its subsidiaries (the Group), which comprises the consolidated statement of financial position as at 30 June 2020, the consolidated statement of profit or loss and other comprehensive income, the consolidated statement of changes in equity and the consolidated statement of cash flows for the year then ended, and notes to the financial report, including a summary of significant accounting policies and the directors’ declaration.
In our opinion the accompanying financial report of the Group, is in accordance with the Corporations Act 2001, including:
(i) Giving a true and fair view of the Group’s financial position as at 30 June 2020 and of its financial performance for the year ended on that date; and
(ii) Complying with Australian Accounting Standards and the Corporations Regulations 2001.
Basis for opinion
We conducted our audit in accordance with Australian Auditing Standards. Our responsibilities under those standards are further described in the Auditor’s responsibilities for the audit of the Financial Report section of our report. We are independent of the Group in accordance with the Corporations Act 2001 and the ethical requirements of the Accounting Professional and Ethical Standards Board’s APES 110 Code of Ethics for Professional Accountants (including Independence Standards) (the Code) that are relevant to our audit of the financial report in Australia. We have also fulfilled our other ethical responsibilities in accordance with the Code.
We confirm that the independence declaration required by the Corporations Act 2001, which has been given to the directors of the Company, would be in the same terms if given to the directors as at the time of this auditor’s report.
We believe that the audit evidence we have obtained is sufficient and appropriate to provide a basis for our opinion.
Key audit matters
Key audit matters are those matters that, in our professional judgement, were of most significance in our audit of the financial report of the current period. These matters were addressed in the context of our audit of the financial report as a whole, and in forming our opinion thereon, and we do not provide a separate opinion on these matters.
BDO Audit Pty Ltd ABN 33 134 022 870 is a member of a national association of independent entities which are all members of BDO Australia Ltd ABN 77 050 110 275, an Australian company limited by guarantee. BDO Audit Pty Ltd and BDO Australia Ltd are members of BDO International Ltd, a UK company limited by guarantee, and form part of the international BDO network of independent member firms. Liability limited by a scheme approved under Professional Standards Legislation.
Impairment assessment of Goodwill and Other Intangible Assets
Key audit matter How the matter was addressed in our audit
The Group’s disclosures in respect to intangible assets, including the impairment assessments of goodwill and other intangible assets are included in Note 9.
The carrying value of intangible assets represent a significant asset of the Group.
The Group is required to annually test the amount of goodwill and indefinite useful life intangible assets for impairment and assess other intangible assets for impairment indicators. This annual impairment test was significant to our audit because the goodwill and intangible assets balance is material to the financial statements and because management’s assessment process is complex, highly judgmental and includes estimates and assumptions relating to expected future market or economic conditions.
Our procedures included, amongst others:
• Evaluating management’s determination of the Group’s Cash Generating Units ("CGU's") to ensure they are appropriate, including being at a level no higher than the operating segments of the entity
• Evaluating management’s process regarding the valuation of the Group’s goodwill and other intangible assets
• Assessing the Group’s assumptions and estimates relating to forecast revenue, costs, capital expenditure, discount rates and the life of reseller agreements used to determine the recoverable amount of its assets
• Assessing the Group’s assumptions and estimates relating to forecast revenue, costs, capital expenditure, discount rates and the life of the revised reseller agreements based on the Binding Term sheet entered into on 28 June 2020, used to determine the recoverable value of its assets. Comparing the terms of the Binding Term sheet with the revised long-form reseller agreement signed on 25 August 2020
• Assessing the historical accuracy of forecasting of the Group by comparing the current year actual results with FY19 figures included in prior year forecasts to consider whether any forecasts included assumptions, that with hindsight, had been optimistic
• Challenging key assumptions by performing sensitivity analysis on the growth rates and discount rate assumptions used.
Revenue recognition and measurement
Key audit matter How the matter was addressed in our audit
• The assessment of revenue recognition was significant to our audit because revenue is a material balance in the financial statements for the year ended 30 June 2020
• The assessment of revenue recognition and measurement required significant auditor effort.
Our procedures included, amongst others:
• Assessing the revenue recognition policy for compliance with AASB 15 Revenue from Contracts with Customers, including the revenue recognition policy of the Gatherwell Limited
• Documenting the processes and assessing the internal controls relating to revenue processing and recognition
• Tracing a sample of revenue transactions to supporting documentation
• Developing expectations of monthly trends taking into account of seasonality and timing of major prize monies for each lotto draw and comparing with actual revenue recognised each month
• Assessing the adequacy of the Group's disclosures within the financial statements
96 JUMBO INTERACTIVE LTD ANNUAL REPORT 2020 JUMBO INTERACTIVE LTD ANNUAL REPORT 2020 97

BDO Audit Pty Ltd ABN 33 134 022 870 is a member of a national association of independent entities which are all members of BDO Australia Ltd ABN 77 050 110 275, an Australian company limited by guarantee. BDO Audit Pty Ltd and BDO Australia Ltd are members of BDO International Ltd, a UK company limited by guarantee, and form part of the international BDO network of independent member firms. Liability limited by a scheme approved under Professional Standards Legislation.
Accounting for the Acquisition of Gatherwell Limited
Key audit matter How the matter was addressed in our audit
As disclosed in Note 19 of the financial report, the company acquired Gatherwell Limited (a company based in UK).
The audit of the accounting for this acquisition is a key audit matter due to the significant judgment and complexity involved in assessing the determination of the fair value of identifiable intangible assets and the final purchase price which included contingent deferred consideration.
Our procedures included, amongst others:
• Obtaining an understanding of the transaction including an assessment of the accounting acquirer and whether the transaction constituted a business or an asset acquisition
• Comparing the assets and liabilities recognised on acquisition against the historical financial information included in the due diligence report
• Obtaining a copy of the Purchase Price Allocation (PPA) report prepared by an independent expert to assess the determination of the fair values of the identifiable intangible assets associated with the acquisition
• In conjunction with internal experts, reviewing the valuation methodology used in the PPA report, in assessing the fair values of intangible assets acquired including developed software, customer contracts and relationships
• Assessing the estimation of the contingent consideration by challenging the key assumptions including probability of achievement of future profit targets. This included comparing the actual performance since acquisition against the forecast performance
• Assessing the adequacy of the Group's disclosures of the acquisition
Other information
The directors are responsible for the other information. The other information comprises the information in the Group’s annual report for the year ended 30 June 2020, but does not include the financial report and the auditor’s report thereon.
Our opinion on the financial report does not cover the other information and we do not express any form of assurance conclusion thereon.
In connection with our audit of the financial report, our responsibility is to read the other information and, in doing so, consider whether the other information is materially inconsistent with the financial report or our knowledge obtained in the audit or otherwise appears to be materially misstated.
If, based on the work we have performed, we conclude that there is a material misstatement of this other information, we are required to report that fact. We have nothing to report in this regard.
Responsibilities of the directors for the Financial Report
The directors of the Company are responsible for the preparation of the financial report that gives a true and fair view in accordance with Australian Accounting Standards and the Corporations Act 2001 and for such internal control as the directors determine is necessary to enable the preparation of the financial report that gives a true and fair view and is free from material misstatement, whether due to fraud or error.
BDO Audit Pty Ltd ABN 33 134 022 870 is a member of a national association of independent entities which are all members of BDO Australia Ltd ABN 77 050 110 275, an Australian company limited by guarantee. BDO Audit Pty Ltd and BDO Australia Ltd are members of BDO International Ltd, a UK company limited by guarantee, and form part of the international BDO network of independent member firms. Liability limited by a scheme approved under Professional Standards Legislation.
In preparing the financial report, the directors are responsible for assessing the ability of the group to continue as a going concern, disclosing, as applicable, matters related to going concern and using the going concern basis of accounting unless the directors either intend to liquidate the Group or to cease operations, or has no realistic alternative but to do so.
Auditor’s responsibilities for the audit of the Financial Report
Our objectives are to obtain reasonable assurance about whether the financial report as a whole is free from material misstatement, whether due to fraud or error, and to issue an auditor’s report that includes our opinion. Reasonable assurance is a high level of assurance, but is not a guarantee that an audit conducted in accordance with the Australian Auditing Standards will always detect a material misstatement when it exists. Misstatements can arise from fraud or error and are considered material if, individually or in the aggregate, they could reasonably be expected to influence the economic decisions of users taken on the basis of this financial report.
A further description of our responsibilities for the audit of the financial report is located at the Auditing and Assurance Standards Board website (http://www.auasb.gov.au/Home.aspx) at: https://www.auasb.gov.au/admin/file/content102/c3/ar1_2020.pdf
This description forms part of our auditor’s report.
Report on the Remuneration Report
Opinion on the Remuneration Report
We have audited the Remuneration Report included in pages 47 to 55 of the directors’ report for the year ended 30 June 2020.
In our opinion, the Remuneration Report of Jumbo Interactive Limited, for the year ended 30 June 2020, complies with section 300A of the Corporations Act 2001.
Responsibilities
The directors of the Company are responsible for the preparation and presentation of the Remuneration Report in accordance with section 300A of the Corporations Act 2001. Our responsibility is to express an opinion on the Remuneration Report, based on our audit conducted in accordance with Australian Auditing Standards.
BDO Audit Pty Ltd
K L Colyer Director
Brisbane, 26 August 2020
98 JUMBO INTERACTIVE LTD ANNUAL REPORT 2020 JUMBO INTERACTIVE LTD ANNUAL REPORT 2020 99

The Company has 62,448,757 ordinary shares on issue, each fully paid. There are 13,551 holders of these ordinary shares as at 31 July 2020. Shares are quoted on the Australian Securities Exchange under the code JIN and on the German Stock Exchange.
In addition, there are an aggregate total 700,000 options and 46,716 rights over ordinary shares on issue but not quoted on the Australian Securities Exchange.
Corporate Governance StatementThe Corporate Governance Statement is available on the Company's website at https://www.jumbointeractive.com/governance/corporate_gov-ernance_statement.pdf
(a)The range of fully paid ordinary shares as at 31 July 2020
RangeTotal
Holders Units % of issued capital
1 – 1,000 9,595 3,517,177 5.63
1,001 – 5,000 3,253 7,507,553 12.02
5,001 – 10,000 408 2,991,576 4.79
10,001 – 100,000 263 6,551,464 10.49
100,001 – and over 32 41,880,987 67.06
Total 13,551 62,448,757 100.00
(b)Unmarketable parcels
Minimum parcel size Holders Units
Minimum $500.00 parcel at $10.88 per unit 46 574 16,507
The number of shareholders holding less than the marketable parcel of shares is 574 (shares 16,507)
(c) Substantial holders of 5% or more fully paid ordinary shares as at 31 July 20201:
Name Notice dateOrdinary
Shares Percentage Held
Vesteon Pty Ltd and associates 15 October 2018 9,436,955 15.8
Tatts Online Pty Ltd 5 July 2018 7,234,178 12.5
1 as disclosed in substantial shareholder notices received by the Company
(d) Voting rightsThe voting rights attached to each class of equity security are as follows:
Ordinary shares • Each ordinary share is entitled to one vote when a poll is called, otherwise
each member present at a meeting or by proxy has one vote on a show of hands.
Options and Rights over Unissued Shares • Holders have no voting rights until their options/rights are exercised.
SHAREHOLDER INFORMATION
(e)Top 20 holders of fully paid ordinary shares as at 31 July 2020
Name Units % of Units
1. VESTEON PTY LTD 8,798,938 14.09
2. JP MORGAN NOMINEES AUSTRALIA PTY LTD 7,925,787 12.69
3. TATTS ONLINE PTY LTD 7,234,178 11.58
4. HSBC CUSTODY NOMINEES (AUSTRALIA) LIMITED 6,132,380 9.82
5. CITICORP NOMINEES LIMITED 1,754,072 2.81
6. NATIONAL NOMINEES LIMITED 1,691,631 2.71
7. BNP PARIBAS NOMINEES PTY LTD <BP2S MILAN BPAA DRP> 1,161,702 1.86
8. MR BARNABY COLMAN CADDICK 1,125,000 1.80
9. BNP PARIBAS NOMS PTY LTD <DRP> 680,911 1.09
10. MR MIKE VEVERKA <VEVERKA S/F A/C> 666,791 1.07
11. BNP PARIBAS NOMINEES PTY LTD <AGENCY LENDING DRP A/C> 573,420 0.92
12.SEYMOUR GROUP PTY LTD 400,000 0.64
13. UBS NOMINEES PTY LTD 358,215 0.57
14. BNP PARIBAS NOMINEES PTY LTD <IB AU NOMS RETAIL CLIENT DRP> 318,214 0.51
15. HSBC CUSTODY NOMINEES (AUSTRALIA) LIMITED - A/C 2 308,152 0.49
16. BNP PARIBAS NOMS (NZ) LTD <DRP> 303,092 0.49
17. BUTTONWOOD NOMINEES PTY LTD 263,367 0.42
18. MR JOHN ROSAIA 220,021 0.35
19. MR BRIAN ROBERTS 186,534 0.30
20. SANDHURST TRUSTEES LTD <BERKHOLTS INVESTMENTS A/C> 173,198 0.28
Total Top 20 shareholders of ordinary fully paid shares 40,275,609 64.49
Total remaining holders balance 22,173,148 35.51
(f) Unquoted securities as at 31 July 2020Options over Unissued Shares. A total of 700,000 options are on issue to employees for services rendered.
Exercise price Expiry date Number on issue
Number of holders
$1.75 18 November 2020 100,000 1
$3.50 15 November 2022 600,000 1
Rights over Unissued Shares. A total of 46,716 rights are on issue to KMP
Exercise price Expiry date Number on issue
Number of holders
$nil 1 July 2022 46,716 4
(g) On-market buy-backThere is no current on-market buy-back in effect.
100 JUMBO INTERACTIVE LTD ANNUAL REPORT 2020 JUMBO INTERACTIVE LTD ANNUAL REPORT 2020 101

Jumbo Interactive LimitedABN 66 009 189 128www.jumbointeractive.com
DirectorsDavid K Barwick (Non-Executive Chairman)Bill Lyne (Non-Executive Director)Sharon Christensen (Non-Executive Director)Giovanni Rizzo (Non-Executive Director)Mike Veverka (Executive Director and Chief Executive Officer)
Chief Financial OfficerDavid Todd
Company SecretaryBill Lyne
Registered OfficeLevel 1, 601 Coronation Drive, Toowong, QLD 4066Telephone: 07 3831 3705Facsimile: 07 3369 7844
AuditorBDO Audit Pty LtdLevel 10, 12 Creek Street, Brisbane, QLD 4000
Share RegistrarComputershare Investor Services Pty LtdLevel 1, 200 Mary Street, Brisbane, QLD 4000Telephone: 07 3237 5999Facsimile: 07 3221 9227
COMPANY INFORMATION
102 JUMBO INTERACTIVE LTD ANNUAL REPORT 2020 JUMBO INTERACTIVE LTD ANNUAL REPORT 2020 103

Jumbo Interactive Limited
Level 1, 601 Coronation DrivePO Box 824Toowong, Queensland, 4066Australia+61 7 3831 3705www.jumbointeractive.com
See you next year