Embed Size (px)
Citation preview

2019 MID-YEAR REVIEWAND OUTLOOK
1

WELCOME!
2

3
Our Team
Shirley PowellSenior Vice President, Communications & Industry Relations
Chintan TalatiSenior Director, Public Relations
Mark SchirmerDirector, Public Relations
Dara HailesManager, Public Relations

4
Our Team
Marianne JohnsonExecutive Vice President and Chief Product Officer
Mark LuberChief Data Officer
Jonathan SmokeChief Economist
Charlie ChesbroughSenior Economist
Michelle KrebsSenior Industry Analyst

5
OUR VISION
Transform the way the world buys, sells, owns and uses cars
5
OUR PURPOSE
Empower clients to thrive in a rapidly changing marketplace

6
Schedule
10 a.m. – State of the Industry
• Economy – Jonathan Smoke• Market Conditions – Charlie Chesbrough• OEM Performance – Michelle Krebs• Curves Ahead – Jonathan Smoke
Q&A
11 a.m. – The Data Revolution
• Advanced Data & AI – Marianne Johnson
Q&A
Noon – Lunch

STATE OF THE INDUSTRY
7

JONATHAN SMOKE
8
2019 MID-YEAR REVIEWAND OUTLOOKJune 26 // TROY
C H I E F E C O N O M I S T

Overall Economy GDP Growth 1.4%(Q2 NY Fed Nowcast)
3.1% (Q1 ’19) 4.2% (Q2 ’18)
Employment Conditions
U3 UnemploymentRate
3.6%(May)
4.0% (June ’18)
Buyer Confidence UofM Consumer Sentiment
97.9(June Early)
100.0 (May ’19) 98.2 (June ’18)
Wages EarningsGrowth
3.1%(May)
3.2% (April)3.4% (March)
Buyer Ability DisposableIncome Y/Y
3.8% (April ’19)
4.9% (2018)
9Source: IRS
OUR ECONOMY: Under Pressure

Credit Availability NY Fed 1,160(Q1 ’19)
1,128(Q2 ’18)
Interest Rates Target Fed Funds Rate
2.25 -2.50%(June ’19)
1.75 -2.00% (June ’18)
Borrowing Costs Avg Rate 60m Auto Loan
6.33% (May ’19)
5.96% (Dec ’18)6.06% (May ’18)
Ownership Costs Weekly Retail Gasoline Price
$2.74 (June ’19)
$2.89(June ’18)
10Source: IRS
OUR ECONOMY: Under Pressure

CHARLIE CHESBROUGH
11
2019 MID-YEAR REVIEWAND OUTLOOKJune 26 // TROY
S E N I O R E C O N O M I S T
Source: BEA Light Vehicle SAAR, Cox Automotive Industry Analysis 12
16.0
16.2
16.4
16.6
16.8
17.0
17.2
17.4
17.6
17.8
18.0
Jan
-20
18
Feb
-20
18
Mar
-20
18
Ap
r-2
018
May
-20
18
Jun
-20
18
Jul-
20
18
Au
g-2
01
8
Sep
-20
18
Oct
-20
18
No
v-20
18
Dec
-20
18
Jan
-20
19
Feb
-20
19
Mar
-20
19
Ap
r-2
019
May
-20
19
Jun
-20
19
New Light Vehicle Seasonally Adjusted Annualized Rate (Millions)
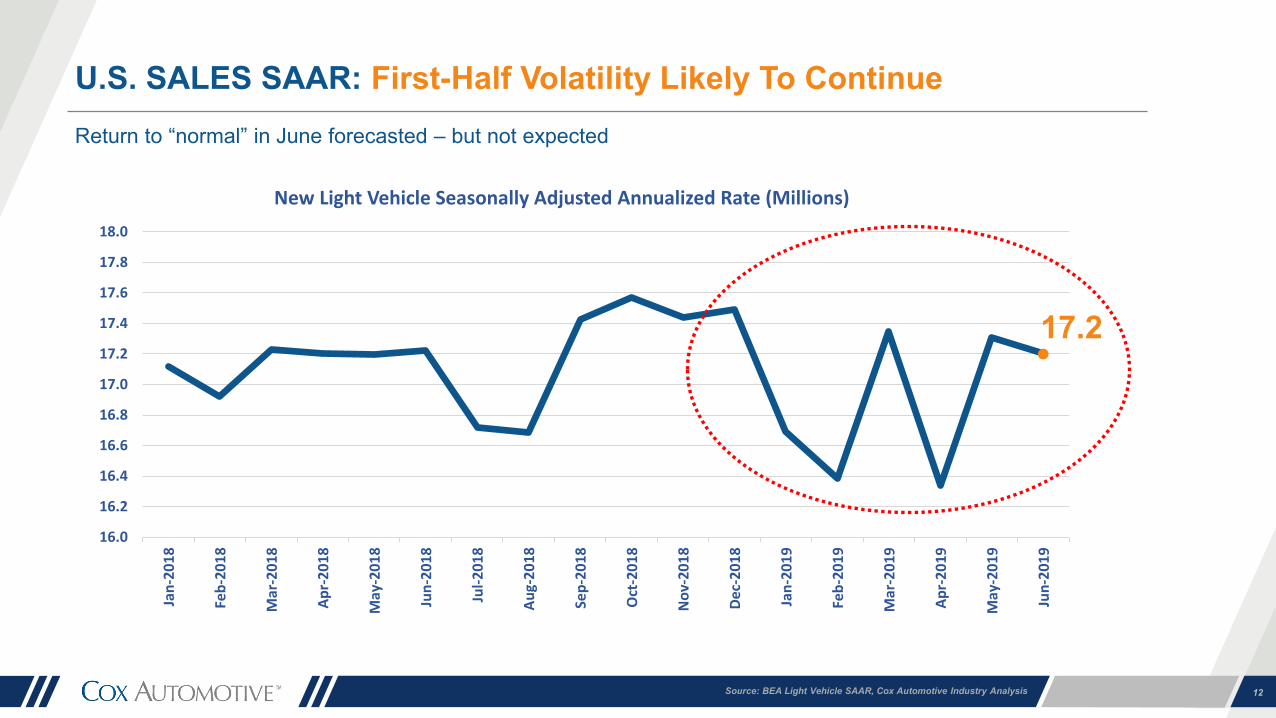
U.S. SALES SAAR: First-Half Volatility Likely To ContinueReturn to “normal” in June forecasted – but not expected
17.2

Source: Cox Automotive Industry Analysis 13
U.S. NEW-VEHICLE SALES: First Half Down, Second Half More
Month Jun-18 Jun-19 YOY May-19 MOM Change
Sales Millions 1.55 1.51 -2.7% 1.59 -5.0%
Quarter 2018 2019 ChangeSales Millions Q1 4.1 4.0 -3.1%
Q2 4.5 4.4F -1.3%Q3 4.3 4.2F -2.0%Q4 4.4 4.2F -4.0%
Year 17.3 16.8F -2.5%
1st Half 8.6 8.4F -2.2%
Pace of sales decline expected to increase in H2:
Higher vehicle prices, consumer budget
constraints, credit tightening slow purchases

Source: Cox Automotive Industry Analysis 14
U.S. NEW-VEHICLE MARKET: Channels Reveal Weakness
New Market FleetRetail
PurchaseRetail Lease
2018 0.5% 4.3% -0.4% -0.2%
2019F -2.4% 4.0% -3.5% -4.6%
YTD -2.2% 6.9% -5.2% -2.9%
Tax Reform
Vehicle Affordability
Residual Values
Cox Automotive Sales Forecast
2019 = 16.8 million2020 = 16.5 million

Source: Cox Automotive Industry Analysis, 12m average, KBB data 15
Average MSRP approaching $40,000 – affordability issue likely increasing
MARKET PRICING: Higher Prices Off-setting Lower Volumes
$32,711
$39,509
$30,879
$36,950
93.4%
93.6%
93.8%
94.0%
94.2%
94.4%
94.6%
$30,000$31,000$32,000$33,000$34,000$35,000$36,000$37,000$38,000$39,000$40,000
Jan-
2013
Jan-
2014
Jan-
2015
Jan-
2016
Jan-
2017
Jan-
2018
Jan-
2019
Avg MSRP Avg Price Price Strength
Average MSRP and Transaction Price Price Strength

Source: Cox Automotive Industry Analysis, 12m total, KBB data 16
Revenue at post recession peaks, but weakening prices eroding growth
MARKET REVENUE: Annual Pace Near $680 billion, Still Rising
0.0%
2.0%
4.0%
6.0%
8.0%
10.0%
12.0%
$500$520$540$560$580$600$620$640$660$680$700
Jan-
2014
Jan-
2015
Jan-
2016
Jan-
2017
Jan-
2018
Jan-
2019
12m Revenue Revenue Growth
Market Revenue (12m Total, Billion $) Revenue Growth

Source: KBB MSRP data 17
Continued shift to expensive vehicles
MARKET CONDITIONS: Affordability Issues Worsening In 2019
7%
47%
24%
16%
6%
2%
30%
24%
20%
25%
0%
5%
10%
15%
20%
25%
30%
35%
40%
45%
50%
< $20,000 $20,000-29,999
$30,000-39,999
$40,000-49,999
$50,000+
2012 2013 2014 2015 2016 2017 2018 2019

Source: Cox Automotive Industry Analysis, KBB data 18
Average MSRP up 21% since 2012 but variation significant across vehicle product segments
SEGMENT PRICING: “Largest” Vehicles = Largest Price Increases
-5%
0%
5%
10%
15%
20%
25%
30%
MSRP Change: 2012-2019

Source: Cox Automotive Industry Analysis, IHS and Kelley Blue Book, Dealertrack Data 19
Rising lease payments will lead some potential buyers to used market
MONTHLY PAYMENTS: Differences Drive Consumer Choices
$496
$563
$418
$350
$400
$450
$500
$550
$600
2014 2015 2016 2017 2018 2019
LeaseLoanUsed
$78$67
$145
$20
$40
$60
$80
$100
$120
$140
$160
2014 2015 2016 2017 2018 2019
Lease VS. Used
New Loan VS. Lease
New Loan VS. Used
Monthly Payment Payment Difference
Source: Cox Automotive Industry Analysis, IHS and Kelley Blue Book Data 20
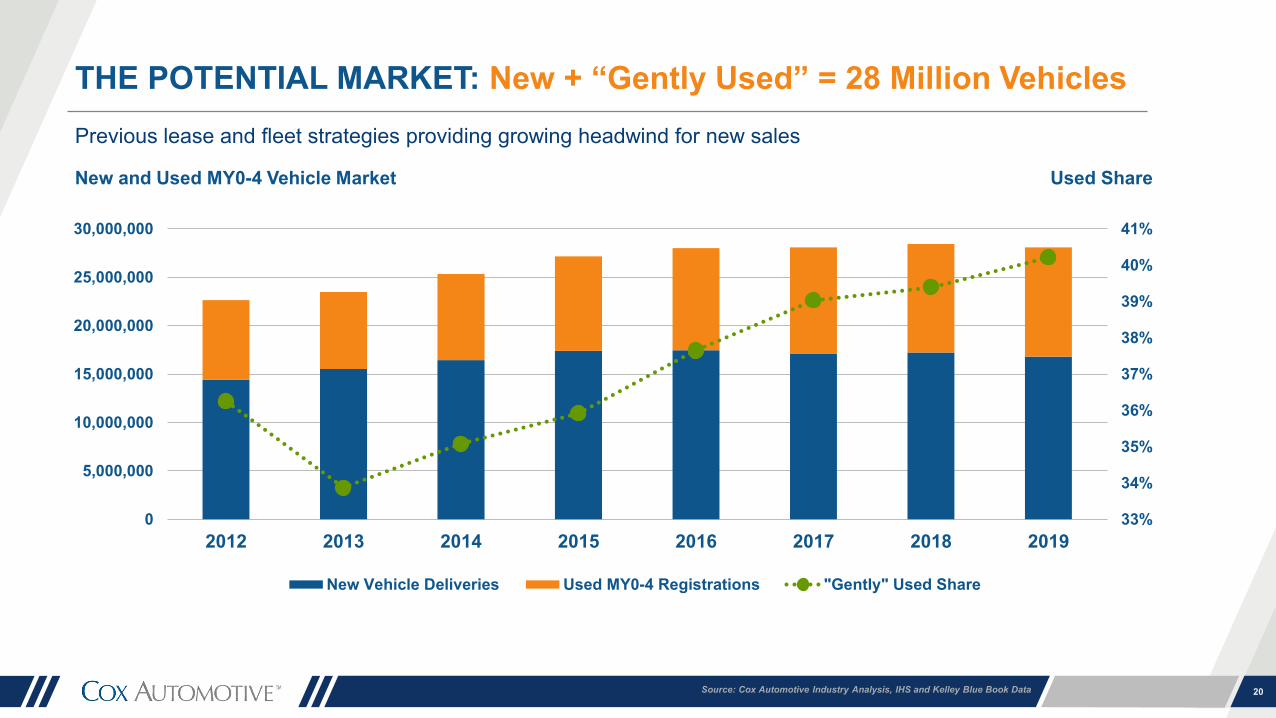
Previous lease and fleet strategies providing growing headwind for new sales
THE POTENTIAL MARKET: New + “Gently Used” = 28 Million Vehicles
33%
34%
35%
36%
37%
38%
39%
40%
41%
0
5,000,000
10,000,000
15,000,000
20,000,000
25,000,000
30,000,000
2012 2013 2014 2015 2016 2017 2018 2019
New Vehicle Deliveries Used MY0-4 Registrations "Gently" Used Share
New and Used MY0-4 Vehicle Market Used Share

Source: Cox Automotive Industry Analysis 21
A lot of “gently used” vehicles and potential new customers – dealers benefit twice
OFF-LEASE MATURITIES: Threat Volume At Peak
2.2
2.5
3.0
3.4
3.94.1 4.1
0.0
0.5
1.0
1.5
2.0
2.5
3.0
3.5
4.0
4.5
2014 2015 2016 2017 2018 2019F 2020F
Off-Lease Maturities (annual volume, millions)

Source: Cox Automotive Industry Analysis, IHS Data 22
High demand for off-lease vehicles and supply limitations from recession keep prices elevated
THE USED-VEHICLE MARKET: Decline Due To Supply Constraints
39.4 39.439.2 39.0
35
36
37
38
39
40
2012 2013 2014 2015 2016 2017 2018 2019F 2020F
Used Sales (annual, millions)
4,000,000
5,000,000
6,000,000
7,000,000
8,000,000
9,000,000
10,000,000
11,000,000
12,000,000
Jan-
2013
Jan-
2014
Jan-
2015
Jan-
2016
Jan-
2017
Jan-
2018
Jan-
2019
MY 0-4 MY 5-8 MY 9-12 MY 13-16 MY 17+
Total Registrations By Model Year (12m average)

Source: Cox Automotive Industry Analysis, Manheim Auction Data 23
Strong demand for affordable transportation coupled with limited supply causing tight market
AUCTION MARKET: Prices Near Highs, Continued Growth Expected
-15%
-10%
-5%
0%
5%
10%
15%
20%
Jan-
1996
Jan-
1999
Jan-
2002
Jan-
2005
Jan-
2008
Jan-
2011
Jan-
2014
Jan-
2017
Manheim Index (annual change)
-6%
-4%
-2%
0%
2%
4%
6%
8%
ALL
CO
MPA
CT
CA
R
FULL
SIZE
CA
R
LUXU
RY
CA
R
MID
SIZE
CA
R
PIC
KU
P
SPO
RTS
CA
R
SUV
VAN
Segment Prices May (annual change)

Source: Cox Automotive Dealer Sentiment Index 24
DEALER SENTIMENT – NEW MARKET: Down From Peak
Good
Poor
57 57
61
65
5960
57
5354
57 57
61
65
5960
57
5354
Q2 2017 Q3 2017 Q4 2017 Q1 2018 Q2 2018 Q3 2018 Q4 2018 Q1 2019 Q2 2019
Overall Franchise Note: Scale 1 - 100
Franchise dealers’ outlook trending lower – reflecting
weaker new-vehicle sales environment

Source: Cox Automotive Dealer Sentiment Index 25
Good
Poor
Note: Scale 1 - 100
5557
5556
5557
5153
56
7068
6769
72 72
6866
72
50
5351
5250
52
4648
51
Q2 2017 Q3 2017 Q4 2017 Q1 2018 Q2 2018 Q3 2018 Q4 2018 Q1 2019 Q2 2019
Overall Franchise Independent
DEALER SENTIMENT – USED MARKET: Rising, Strong Market
Used-vehicle dealers enjoying robust
market – franchise especially from
off-lease opportunity, high demand

MICHELLE KREBS
26
2019 MID-YEAR REVIEWAND OUTLOOKJune 26 // TROY
S E N I O R I N D U S T R Y A N A LY S T

JUNE & FIRST-HALF FORECAST: A Slowing Industry
Monthly Forecast First Half ForecastJune ‘19 June ‘18 YOY% Jan – Jun ‘19 Jan-June ‘18 YOY%
GM 242,000 255,000* -5.2% 1,397,825 1,473,414 -5.1%Ford Motor Co 218,000 229,000* -5.0% 1,230,763 1,271,714 -3.2%Toyota Motor Co 203,000 209,602 -3.1% 1,151,353 1,189,309 -3.2%FCA Group 198,000 202,264 -2.1% 1,088,027 1,115,476 -2.5%American Honda 145,000 146,563 -1.1% 786,094 787,824 -0.2% Nissan NA 133,000 145,096 -8.3% 726,532 780,695 -6.9%Hyundai Kia 125,000 120,623 3.6% 650,289 628,612 3.4%Subaru 62,000 59,841 3.6% 340,014 322,860 5.3%VW 55,000 53,304 3.2% 314,966 310,261 1.5%Grand Total 1,512,000 1,553,200 -2.7% 8,417,457 8,615,260 -2.2%June 2019 Cox Automotive Industry Insights Forecast; all historical data from OEM sales announcementsNote: Total includes brands not shown. GM and Ford monthly sales are estimated
Cox Automotive Forecast: June Auto Sales to Slow Following Surprisingly Strong May
27

Source: Cox Automotive Industry Analysis, KBB data 28
Of Top 5 Volume Segments, three are in decline and full-size pickups are just hanging on
SEGMENT SALES YTD: Cars Continue To Drag Down Market
-20%
-15%
-10%
-5%
0%
5%
10%
15%
Source: Cox Automotive Industry Analysis, KBB data 29
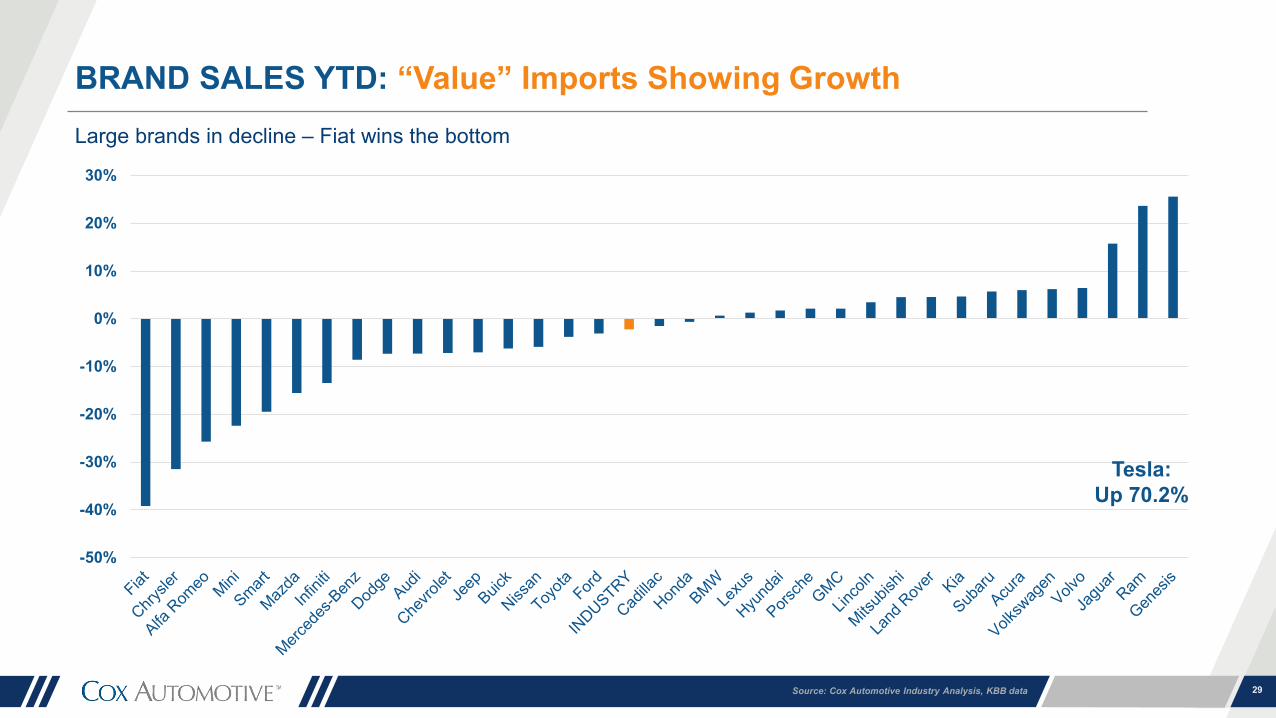
Large brands in decline – Fiat wins the bottom
BRAND SALES YTD: “Value” Imports Showing Growth
-50%
-40%
-30%
-20%
-10%
0%
10%
20%
30%
Tesla:Up 70.2%

SEGMENT PERFORMANCE: So What About Electrics?
U.S. Luxury Share: 8.7%Beats Acura, Lincoln and Cadillac Behind Lexus, BMW, Mercedes, Audi
Brand Rep: Gold Standard Top in 7 of 12 factors luxury-vehicle shoppers consider important
Highest Interest: Top-of-mind brand for EV shoppersWithout Telsa, EV shopping would be stagnant on KBB.com
Electric VehicleMarket =
Electric VehicleMarket
< New Cox Automotive EV Study: • Consumers can see the future
Barriers Remain: • Cost of purchase vs ownership• Infrastructure • Skeptical dealers
Tools Needed: • Education & training• Incentives• Marketing
Global Impact:• China & Europe• Investments – 45% in next 5 Years• Battery supply
30

31
U.S. NEW-VEHICLE SALES: What We’re Watching
Nissan – Turmoil at the top. Relied on fleet and incentives during the good times. Now what? And Infiniti has few new products in the coming years.
Tesla – Everyone is watching, always. Every quarter is new adventure, as the bulls and shorts fight it out on Twitter. The real question: Is demand softening?
Ford – Will Ford execute critically-important launches of the high-volume, high-profit Explorer and Escape?
Fiat & Mini – Limited, small-vehicle portfolios and no U.S. production capacity may spell trouble for these brands as the market slows.
European Luxury – There are new bosses at all the luxury houses from Germany. With tariff threats and a push for
electric, will they hold share?

JONATHAN SMOKE
32
2019 MID-YEAR REVIEWAND OUTLOOKJune 26 // TROY
C H I E F E C O N O M I S T

33
FIVE TAKEAWAYS: First Half 2019
THE SEASONOF VOLATILITY
AFFORDABILITY WORSENS
CREDIT CRUNCH
ALL PATHS LEAD TO USED
FLEET – THENEW NORMAL
Lo/Hi— Black Keys
La La Land—Bryce Vine
featuring YG
Easier—5 Seconds of
Summer
Jump—Armin van
Buuren Remix
Don’t Stop Me Now—
First Ladies of Disco

34
Curves Ahead“The first half of the year was marked by volatility. The second half will be worse.”

CURVES AHEAD: Geopolitical Risks / Trade & Tariff
Ratification of USMCA (ITC Report Delivered)
Immigration Related Tariffs on Mexico (for now)
Section 232 Tariff on Imported Autos and Parts / Action on EU and Japan Postponed to Nov. 18
China Trade Deal (March 1; tbd)
EU Trade Deal
Japan Trade Deal
UK Trade Deal Post Brexit?
35

Source: Cox Automotive industry insight 36
CURVES AHEAD: Tariff Exposure
100% 99%
88%
80%
73%
61% 60% 59% 59%
53% 51% 51% 51% 50% 49%
38%34%
32% 31% 30% 29%
15% 14%
1% 0% 0% 0%1%4%
10% 9%
2%
18%14%
26%
51%
62%
54%
21%
70%
5%
59%
99%
79%
100%
0%
20%
40%
60%
80%
100%
Domestic Share Import Share Riskiest Imports
ALFA ROMEO
ASTON MARTIN
AUDI
BENTLEY
FERRARI
FIAT
GENESIS
JAGUAR
LAMBORGHINI
LAND ROVER
LOTUS
MASERATI
MCLAREN
MINI
MITSUBISHI
PORSCHE
ROLLS ROYCE
SMART

37Source: Cox Automotive estimates based on IHS Markit Registrations
0%
5%
10%
15%
20%
25%
30%
35%
COMPACT CAR LUXURY CUV VAN PICKUP MIDSIZE CAR SUV
Composition of New Vehicles Sold Retail in 2018 in the US by Major Segments and Major Regions of Origin
USA MEXICO+CANADA JAPAN SOUTH KOREA EUROPE
CURVES AHEAD: Tariff Exposure

UAW Negotiations
• Contracts Expire Sept. 14, 2019• Issues: Health Care, Plant Closing,
Tiered Job Structure• Likely Target: GM
CURVES AHEAD: Industry Risks
Fuel Economy Standards
• CARB vs. the 50 State Solution• Safer Affordable Fuel-Efficient
(SAFE) Vehicles Rule proposal• MY2021 - 2026
Credit Steve Carmody
38

Copyright @ Free Vector Maps
CURVES AHEAD: Economic / Financial Risk
U.S. Economy China
Slowdown / Showdown
Brexit
39
The Middle East

Q&A
40
2019 MID-YEAR REVIEWAND OUTLOOKJune 26 // TROY

THANK YOU!
FOR MORE NEWS:www.coxautoinc.com/newsroom
TO DOWNLOAD PRESENTATION:www.coxautoinc.com/newsroom/market-insights/ 2019-mid-year-review
53