Embed Size (px)
Citation preview
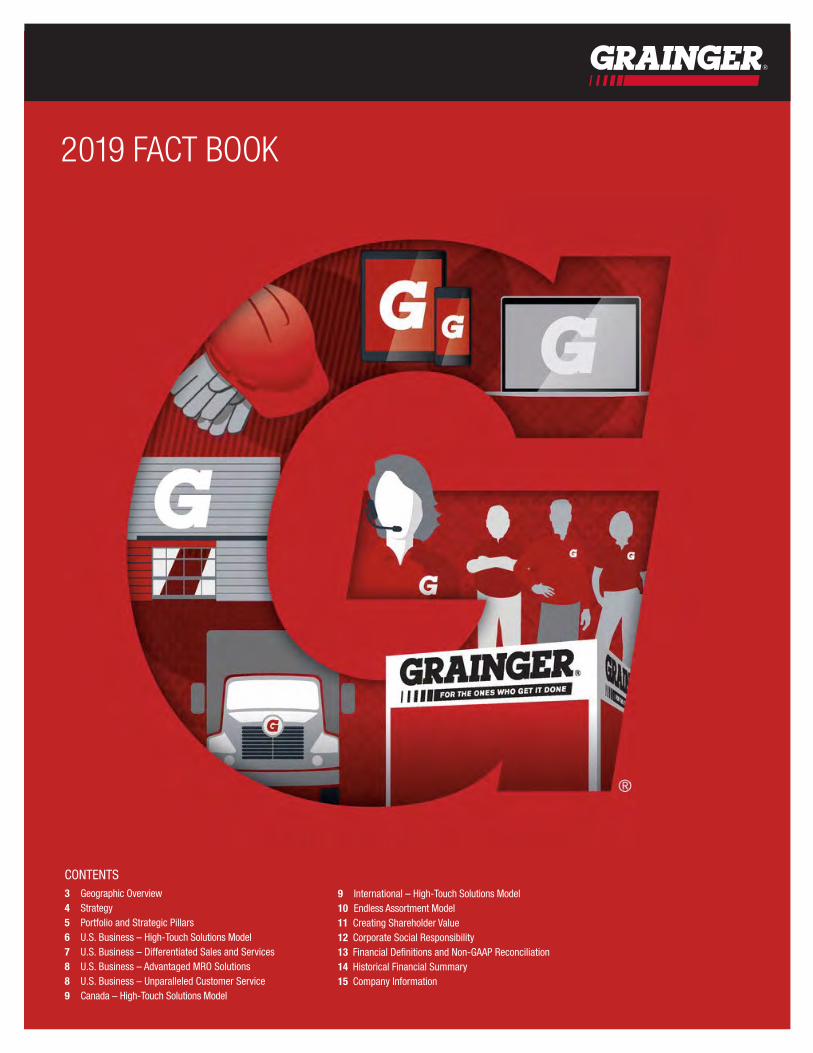
2019 FACT BOOK
CONTENTS3 Geographic Overview 4 Strategy 5 Portfolio and Strategic Pillars6 U.S. Business – High-Touch Solutions Model7 U.S. Business – Differentiated Sales and Services 8 U.S. Business – Advantaged MRO Solutions 8 U.S. Business – Unparalleled Customer Service9 Canada – High-Touch Solutions Model
9 International – High-Touch Solutions Model10 Endless Assortment Model 11 Creating Shareholder Value 12 Corporate Social Responsibility13 Financial Definitions and Non-GAAP Reconciliation 14 Historical Financial Summary 15 Company Information
W.W. GRAINGER, INC. AND SUBSIDIARIES 2
SAFE HARBOR STATEMENTAll statements in this Fact Book, other than those relating to historical facts, are “forward-looking statements.” Forward-looking statements can generally be identified by their use of terms such as “anticipate,” “estimate,” “believe,” “expect,” “could,” “forecast,” “may,” “intend,” “plan,” “predict,” “project” “will” or “would” and similar terms and phrases, including references to assumptions. Forward-looking statements are not guarantees of future performance and are subject to a number of assumptions, risks and uncertainties, many of which are beyond our control, which could cause actual results to differ materially from such statements.
Forward-looking statements include, but are not limited to, statements about future strategic plans and future financial and operating results. Important factors that could cause actual results to differ materially from those in the forward-looking statements include, among others: higher product costs or other expenses; a major loss of customers; loss or disruption of source of supply; increased competitive pricing pressures; failure to develop or implement new technology initiatives; the implementation, timing and results of our strategic pricing initiatives; the outcome of pending and future litigation or governmental or regulatory proceedings, including with respect to wage and hour, anti-bribery and corruption, environmental, advertising, privacy and cybersecurity matters; investigations, inquiries, audits and changes in laws and regulations; disruption of information technology or data security systems; general industry, economic, market or political conditions; general global economic conditions; currency exchange rate fluctuations; market volatility; commodity price volatility; labor shortages; facilities disruptions or shutdowns; higher fuel costs or disruptions in transportation services; natural and other catastrophes; unanticipated and/or extreme weather conditions; loss of key members of management; our ability to operate, integrate and leverage acquired businesses; changes in credit ratings; changes in effective tax rates and other factors which can be found in our filings with the Securities and Exchange Commission, including our most recent periodic reports filed on Form 10-K and Forms 10-Q, which are available on our Investor Relations website. Forward-looking statements are given only as of the date of this communication and we disclaim any obligation to update or revise any forward-looking statement, whether as a result of new information, future events or otherwise, except as required by law.
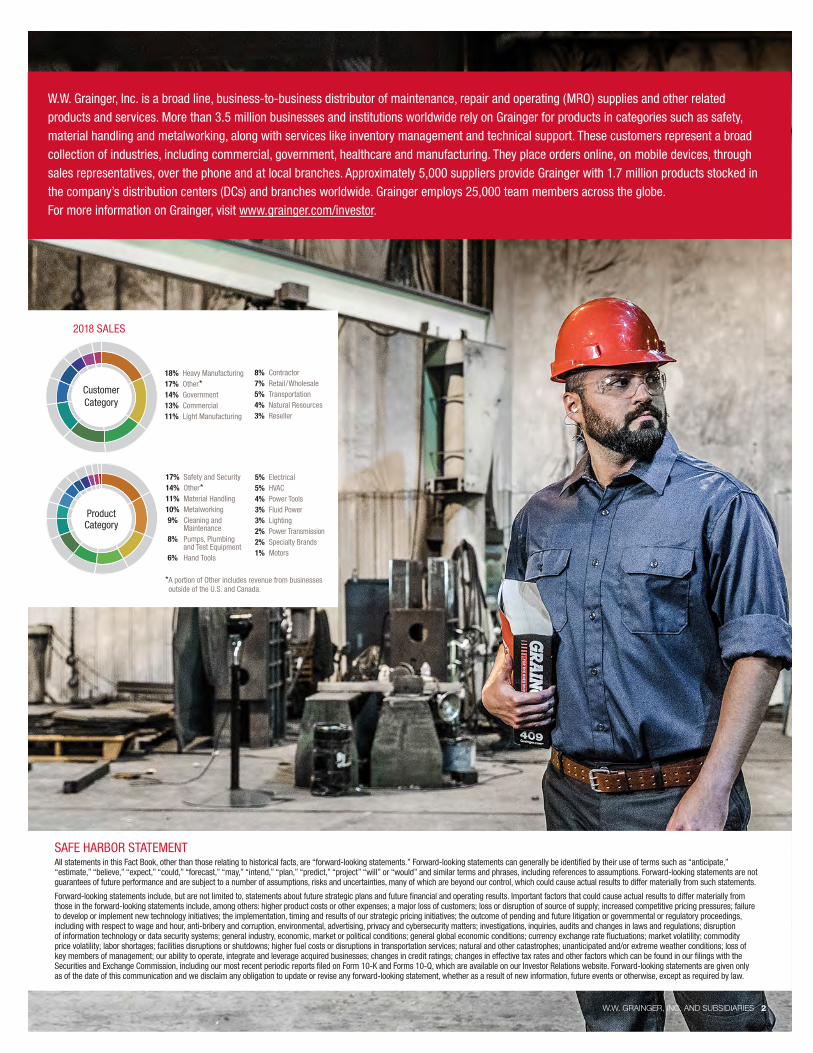
W.W. Grainger, Inc. is a broad line, business-to-business distributor of maintenance, repair and operating (MRO) supplies and other related products and services. More than 3.5 million businesses and institutions worldwide rely on Grainger for products in categories such as safety, material handling and metalworking, along with services like inventory management and technical support. These customers represent a broad collection of industries, including commercial, government, healthcare and manufacturing. They place orders online, on mobile devices, through sales representatives, over the phone and at local branches. Approximately 5,000 suppliers provide Grainger with 1.7 million products stocked in the company’s distribution centers (DCs) and branches worldwide. Grainger employs 25,000 team members across the globe. For more information on Grainger, visit www.grainger.com/investor.
ProductCategory
CustomerCategory
2018 SALES
17% Safety and Security 14% Other* 11% Material Handling10% Metalworking 9% Cleaning and Maintenance 8% Pumps, Plumbing and Test Equipment 6% Hand Tools
18% Heavy Manufacturing 17% Other* 14% Government 13% Commercial 11% Light Manufacturing
8% Contractor 7% Retail/Wholesale 5% Transportation 4% Natural Resources 3% Reseller
5% Electrical 5% HVAC 4% Power Tools 3% Fluid Power 3% Lighting 2% Power Transmission 2% Specialty Brands 1% Motors
* A portion of Other includes revenue from businesses outside of the U.S. and Canada.
W.W. GRAINGER, INC. AND SUBSIDIARIES 3
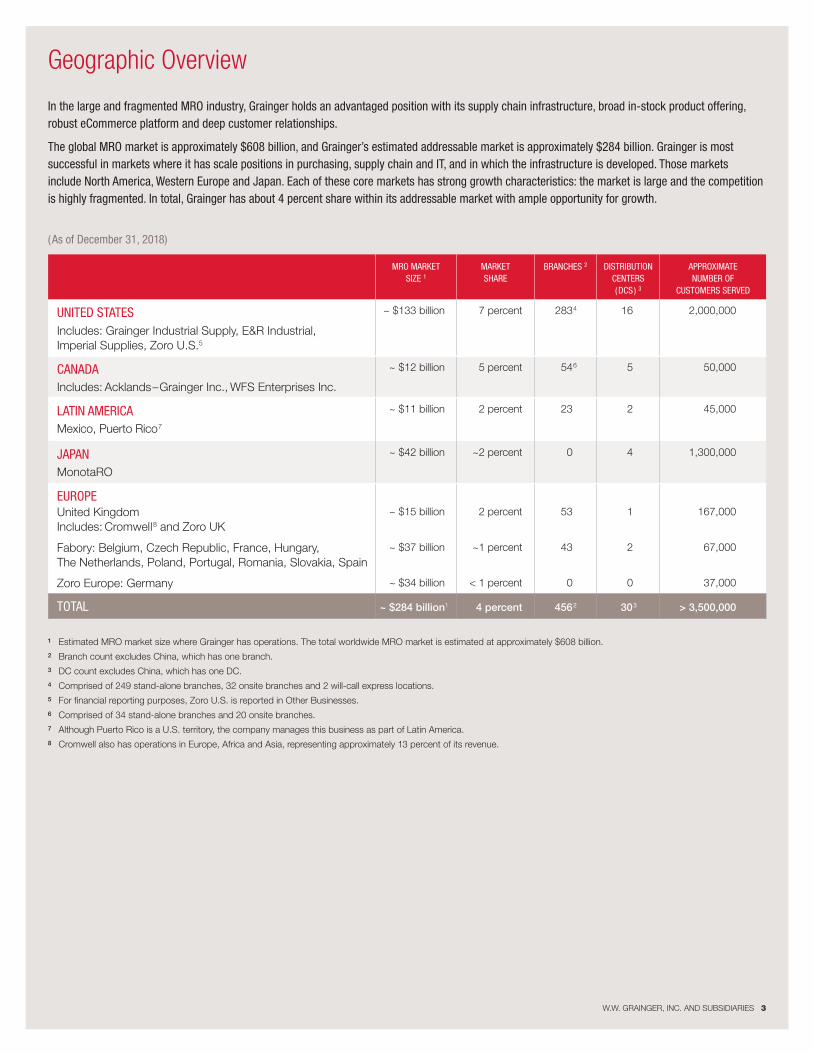
MRO MARKET SIZE 1
MARKET SHARE
BRANCHES 2 DISTRIBUTION CENTERS (DCS) 3
APPROXIMATE NUMBER OF
CUSTOMERS SERVED
UNITED STATES
Includes: Grainger Industrial Supply, E&R Industrial, Imperial Supplies, Zoro U.S.5
~ $133 billion 7 percent 2834 16 2,000,000
CANADA Includes: Acklands–Grainger Inc., WFS Enterprises Inc.
~ $12 billion 5 percent 546 5 50,000
LATIN AMERICA Mexico, Puerto Rico7
~ $11 billion 2 percent 23 2 45,000
JAPAN MonotaRO
~ $42 billion ~2 percent 0 4 1,300,000
EUROPEUnited Kingdom
Includes: Cromwell8 and Zoro UK~ $15 billion 2 percent 53 1 167,000
Fabory: Belgium, Czech Republic, France, Hungary, The Netherlands, Poland, Portugal, Romania, Slovakia, Spain
~ $37 billion ~1 percent 43 2 67,000
Zoro Europe: Germany ~ $34 billion < 1 percent 0 0 37,000
TOTAL ~ $284 billion1 4 percent 4562 303 > 3,500,000
(As of December 31, 2018)
1 Estimated MRO market size where Grainger has operations. The total worldwide MRO market is estimated at approximately $608 billion. 2 Branch count excludes China, which has one branch. 3 DC count excludes China, which has one DC.4 Comprised of 249 stand-alone branches, 32 onsite branches and 2 will-call express locations.5 For financial reporting purposes, Zoro U.S. is reported in Other Businesses.6 Comprised of 34 stand-alone branches and 20 onsite branches.7 Although Puerto Rico is a U.S. territory, the company manages this business as part of Latin America.8 Cromwell also has operations in Europe, Africa and Asia, representing approximately 13 percent of its revenue.
In the large and fragmented MRO industry, Grainger holds an advantaged position with its supply chain infrastructure, broad in-stock product offering, robust eCommerce platform and deep customer relationships.
The global MRO market is approximately $608 billion, and Grainger’s estimated addressable market is approximately $284 billion. Grainger is most successful in markets where it has scale positions in purchasing, supply chain and IT, and in which the infrastructure is developed. Those markets include North America, Western Europe and Japan. Each of these core markets has strong growth characteristics: the market is large and the competition is highly fragmented. In total, Grainger has about 4 percent share within its addressable market with ample opportunity for growth.
Geographic Overview
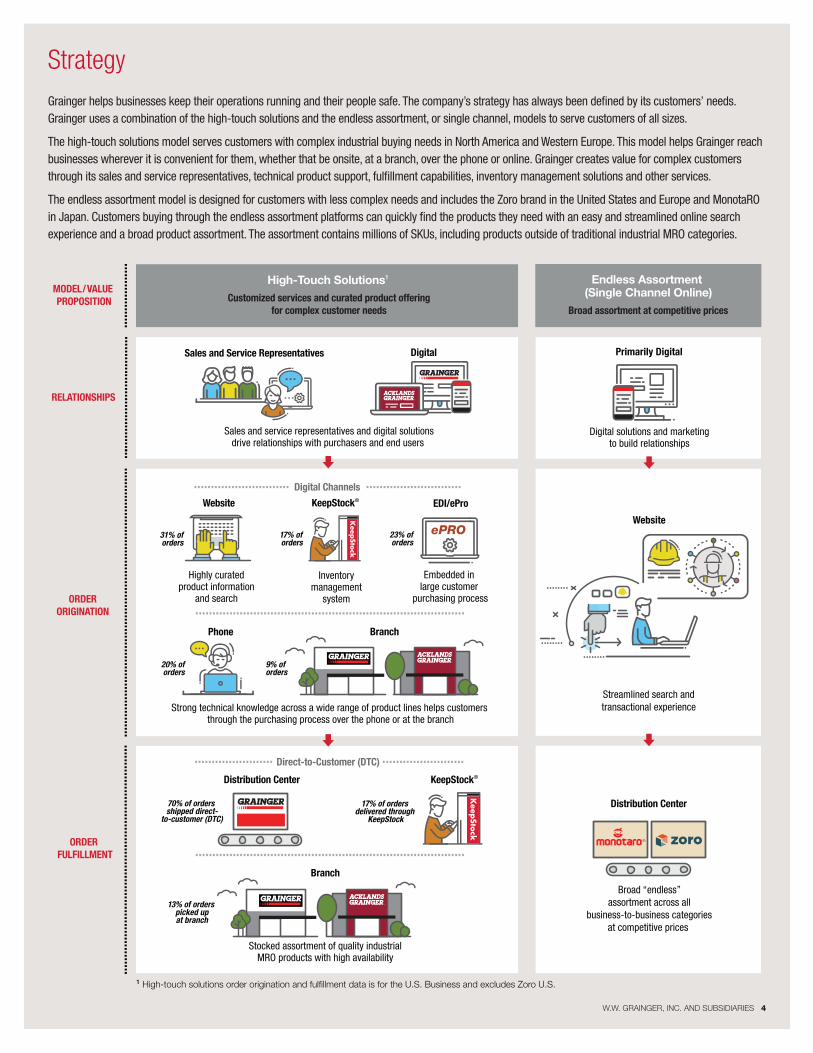
Sales and Service Representatives Digital
Website KeepStock® EDI/ePro
Phone Branch
Sales and service representatives and digital solutionsdrive relationships with purchasers and end users
Primarily Digital
Digital solutions and marketingto build relationships
Website
Highly curatedproduct information
and search
Embedded in large customer
purchasing process
Strong technical knowledge across a wide range of product lines helps customers through the purchasing process over the phone or at the branch
Broad “endless”assortment across all
business-to-business categoriesat competitive prices
Stocked assortment of quality industrialMRO products with high availability
Endless Assortment (Single Channel Online)
Distribution Center
Broad assortment at competitive prices
KeepStock®
Inventory management
system
High-Touch Solutions1
Customized services and curated product offeringfor complex customer needs
MODEL/VALUE PROPOSITION
RELATIONSHIPS
ORDERORIGINATION
ORDER FULFILLMENT
Branch
Distribution Center
Streamlined search andtransactional experience
Digital Channels
Direct-to-Customer (DTC)
20% of orders
9% of orders
31% of orders
17% of orders
23% of orders
70% of orders shipped direct-
to-customer (DTC)
17% of orders delivered through
KeepStock
13% of orders picked upat branch
1 High-touch solutions order origination and ful�llment data is for the U.S. Business and excludes Zoro U.S.
Grainger helps businesses keep their operations running and their people safe. The company’s strategy has always been defined by its customers’ needs. Grainger uses a combination of the high-touch solutions and the endless assortment, or single channel, models to serve customers of all sizes.
The high-touch solutions model serves customers with complex industrial buying needs in North America and Western Europe. This model helps Grainger reach businesses wherever it is convenient for them, whether that be onsite, at a branch, over the phone or online. Grainger creates value for complex customers through its sales and service representatives, technical product support, fulfillment capabilities, inventory management solutions and other services.
The endless assortment model is designed for customers with less complex needs and includes the Zoro brand in the United States and Europe and MonotaRO in Japan. Customers buying through the endless assortment platforms can quickly find the products they need with an easy and streamlined online search experience and a broad product assortment. The assortment contains millions of SKUs, including products outside of traditional industrial MRO categories.
W.W. GRAINGER, INC. AND SUBSIDIARIES 4
Strategy
W.W. GRAINGER, INC. AND SUBSIDIARIES 5
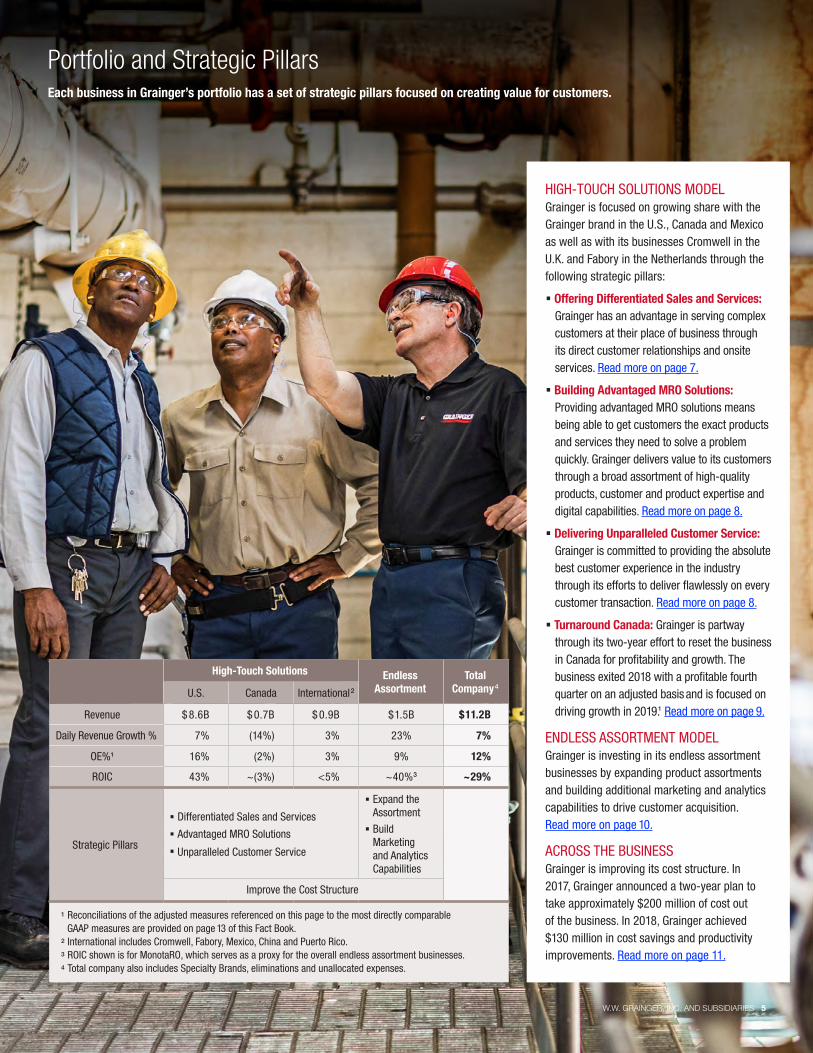
HIGH-TOUCH SOLUTIONS MODELGrainger is focused on growing share with the Grainger brand in the U.S., Canada and Mexico as well as with its businesses Cromwell in the U.K. and Fabory in the Netherlands through the following strategic pillars:
• Offering Differentiated Sales and Services: Grainger has an advantage in serving complex customers at their place of business through its direct customer relationships and onsite services. Read more on page 7.
• Building Advantaged MRO Solutions: Providing advantaged MRO solutions means being able to get customers the exact products and services they need to solve a problem quickly. Grainger delivers value to its customers through a broad assortment of high-quality products, customer and product expertise and digital capabilities. Read more on page 8.
• Delivering Unparalleled Customer Service: Grainger is committed to providing the absolute best customer experience in the industry through its efforts to deliver flawlessly on every customer transaction. Read more on page 8.
• Turnaround Canada: Grainger is partway through its two-year effort to reset the business in Canada for profitability and growth. The business exited 2018 with a profitable fourth quarter on an adjusted basis and is focused on driving growth in 2019.1 Read more on page 9.
ENDLESS ASSORTMENT MODELGrainger is investing in its endless assortment businesses by expanding product assortments and building additional marketing and analytics capabilities to drive customer acquisition. Read more on page 10.
ACROSS THE BUSINESSGrainger is improving its cost structure. In 2017, Grainger announced a two-year plan to take approximately $200 million of cost out of the business. In 2018, Grainger achieved $130 million in cost savings and productivity improvements. Read more on page 11.
Each business in Grainger’s portfolio has a set of strategic pillars focused on creating value for customers.
Portfolio and Strategic Pillars
High-Touch Solutions Endless Assortment
Total Company4
U.S. Canada International2
Revenue $ 8.6B $ 0.7B $ 0.9B $1.5B $11.2B
Daily Revenue Growth % 7% (14%) 3% 23% 7%
OE%1 16% (2%) 3% 9% 12%
ROIC 43% ~(3%) <5% ~40%3 ~29%
Strategic Pillars
• Differentiated Sales and Services
• Advantaged MRO Solutions
• Unparalleled Customer Service
• Expand the Assortment
• Build Marketing and Analytics Capabilities
Improve the Cost Structure
1 Reconciliations of the adjusted measures referenced on this page to the most directly comparable GAAP measures are provided on page 13 of this Fact Book. 2 International includes Cromwell, Fabory, Mexico, China and Puerto Rico. 3 ROIC shown is for MonotaRO, which serves as a proxy for the overall endless assortment businesses. 4 Total company also includes Specialty Brands, eliminations and unallocated expenses.
W.W. GRAINGER, INC. AND SUBSIDIARIES 6
U.S. Business – High-Touch Solutions Model
Total U.S. MRO Market Volume Growth 3% (1%) (3%) 2.5% 3.5%
U.S. MEDIUM Daily volume growth on $1.0 billion of revenue
U.S. LARGE Daily volume growth on $6.8 billion of revenue
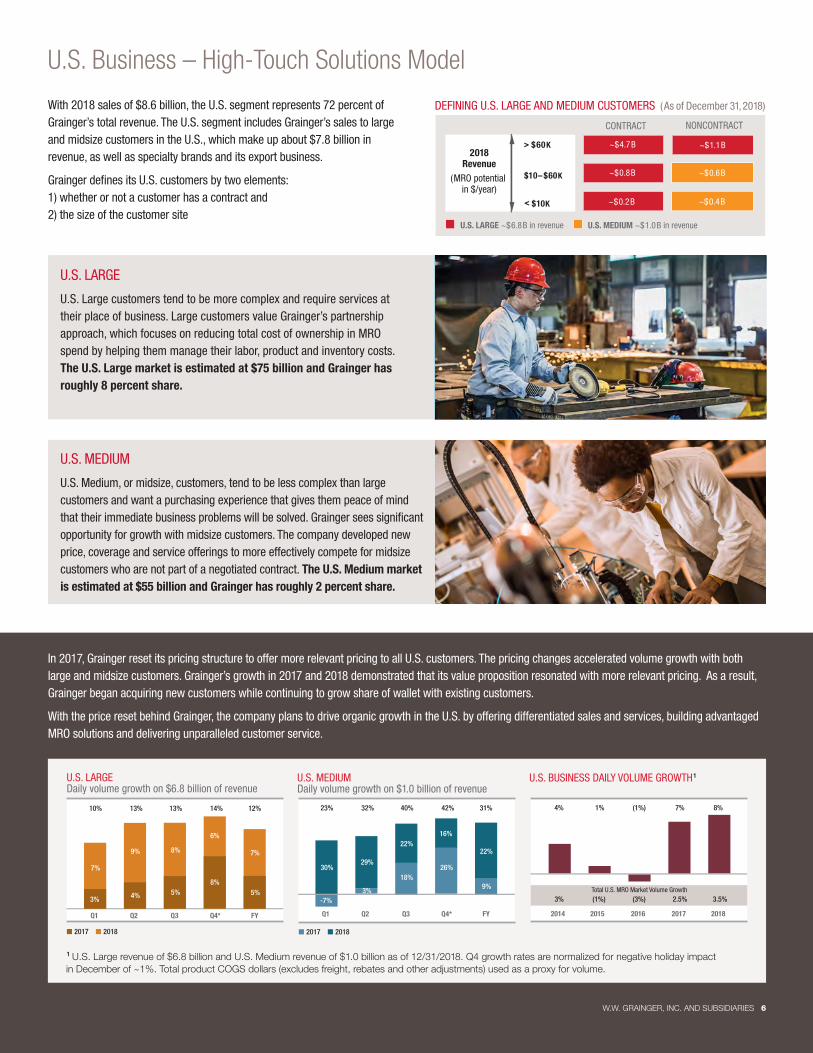
1 U.S. Large revenue of $6.8 billion and U.S. Medium revenue of $1.0 billion as of 12/31/2018. Q4 growth rates are normalized for negative holiday impact in December of ~1%. Total product COGS dollars (excludes freight, rebates and other adjustments) used as a proxy for volume.
Q1 Q2 Q3 Q4* FY
10% 13% 13% 14% 12%
Q1 Q2 Q3 Q4* FY
23% 32% 40% 42% 31%
7%
9% 8%
6%
7%
5%8%
5%4%3%
� 2017 � 2018 � 2017 � 2018
-7%3%
18%26%
9%
22%
16%22%
29%30%
U.S. BUSINESS DAILY VOLUME GROWTH1
2014 2015 2016 2017 2018
4% 1% (1%) 7% 8%
2013 2014 2015 2016 2017
CONTRACT
> $60K
$10– $60K
< $10K
2018Revenue
(MRO potential in $/year)
~$4.7B
NONCONTRACT
~$1.1B
~$0.8B ~$0.6B
~$0.2B ~$0.4B
DEFINING U.S. LARGE AND MEDIUM CUSTOMERS (As of December 31, 2018)
U.S. LARGE ~$6.8B in revenue U.S. MEDIUM ~$1.0B in revenue
With 2018 sales of $8.6 billion, the U.S. segment represents 72 percent of Grainger’s total revenue. The U.S. segment includes Grainger’s sales to large and midsize customers in the U.S., which make up about $7.8 billion in revenue, as well as specialty brands and its export business.
Grainger defines its U.S. customers by two elements: 1) whether or not a customer has a contract and 2) the size of the customer site
In 2017, Grainger reset its pricing structure to offer more relevant pricing to all U.S. customers. The pricing changes accelerated volume growth with both large and midsize customers. Grainger’s growth in 2017 and 2018 demonstrated that its value proposition resonated with more relevant pricing. As a result, Grainger began acquiring new customers while continuing to grow share of wallet with existing customers.
With the price reset behind Grainger, the company plans to drive organic growth in the U.S. by offering differentiated sales and services, building advantaged MRO solutions and delivering unparalleled customer service.
U.S. LARGE
U.S. Large customers tend to be more complex and require services at their place of business. Large customers value Grainger’s partnership approach, which focuses on reducing total cost of ownership in MRO spend by helping them manage their labor, product and inventory costs. The U.S. Large market is estimated at $75 billion and Grainger has roughly 8 percent share.
U.S. MEDIUM
U.S. Medium, or midsize, customers, tend to be less complex than large customers and want a purchasing experience that gives them peace of mind that their immediate business problems will be solved. Grainger sees significant opportunity for growth with midsize customers. The company developed new price, coverage and service offerings to more effectively compete for midsize customers who are not part of a negotiated contract. The U.S. Medium market is estimated at $55 billion and Grainger has roughly 2 percent share.
W.W. GRAINGER, INC. AND SUBSIDIARIES 7
Note: Data on page is for the U.S. Segment, which excludes Zoro U.S.
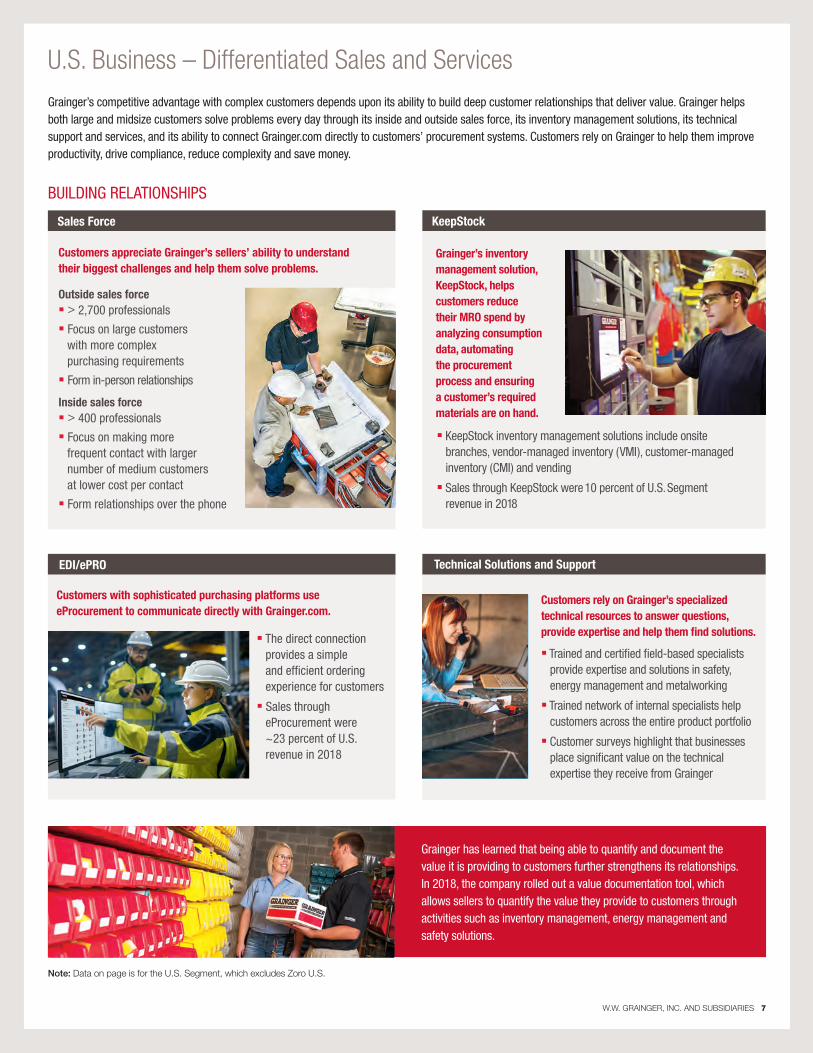
Grainger has learned that being able to quantify and document the value it is providing to customers further strengthens its relationships. In 2018, the company rolled out a value documentation tool, which allows sellers to quantify the value they provide to customers through activities such as inventory management, energy management and safety solutions.
Grainger’s competitive advantage with complex customers depends upon its ability to build deep customer relationships that deliver value. Grainger helps both large and midsize customers solve problems every day through its inside and outside sales force, its inventory management solutions, its technical support and services, and its ability to connect Grainger.com directly to customers’ procurement systems. Customers rely on Grainger to help them improve productivity, drive compliance, reduce complexity and save money.
U.S. Business – Differentiated Sales and Services
BUILDING RELATIONSHIPS
Outside sales force• > 2,700 professionals
• Focus on large customers with more complex purchasing requirements
• Form in-person relationships
Inside sales force• > 400 professionals
• Focus on making more frequent contact with larger number of medium customers at lower cost per contact
• Form relationships over the phone
• The direct connection provides a simple and efficient ordering experience for customers
• Sales through eProcurement were ~23 percent of U.S. revenue in 2018
Sales Force
EDI/ePRO
• KeepStock inventory management solutions include onsite branches, vendor-managed inventory (VMI), customer-managed inventory (CMI) and vending
• Sales through KeepStock were 10 percent of U.S. Segment revenue in 2018
KeepStock
Customers rely on Grainger’s specialized technical resources to answer questions, provide expertise and help them find solutions.
• Trained and certified field-based specialists provide expertise and solutions in safety, energy management and metalworking
• Trained network of internal specialists help customers across the entire product portfolio
• Customer surveys highlight that businesses place significant value on the technical expertise they receive from Grainger
Technical Solutions and Support
Customers appreciate Grainger’s sellers’ ability to understand their biggest challenges and help them solve problems.
Grainger’s inventory management solution, KeepStock, helps customers reduce their MRO spend by analyzing consumption data, automating the procurement process and ensuring a customer’s required materials are on hand.
Customers with sophisticated purchasing platforms use eProcurement to communicate directly with Grainger.com.
1.1 million CUSTOMERSwith limitless needs 2.9 million PRODUCTS available online
Personalized, relevant, effortless experience for each customer
Getting customers relevant solutions quickly
CreateInvoice
ReceivePayment
FulfillOrder
DeliverOrder
CreateOrder
W.W. GRAINGER, INC. AND SUBSIDIARIES 8
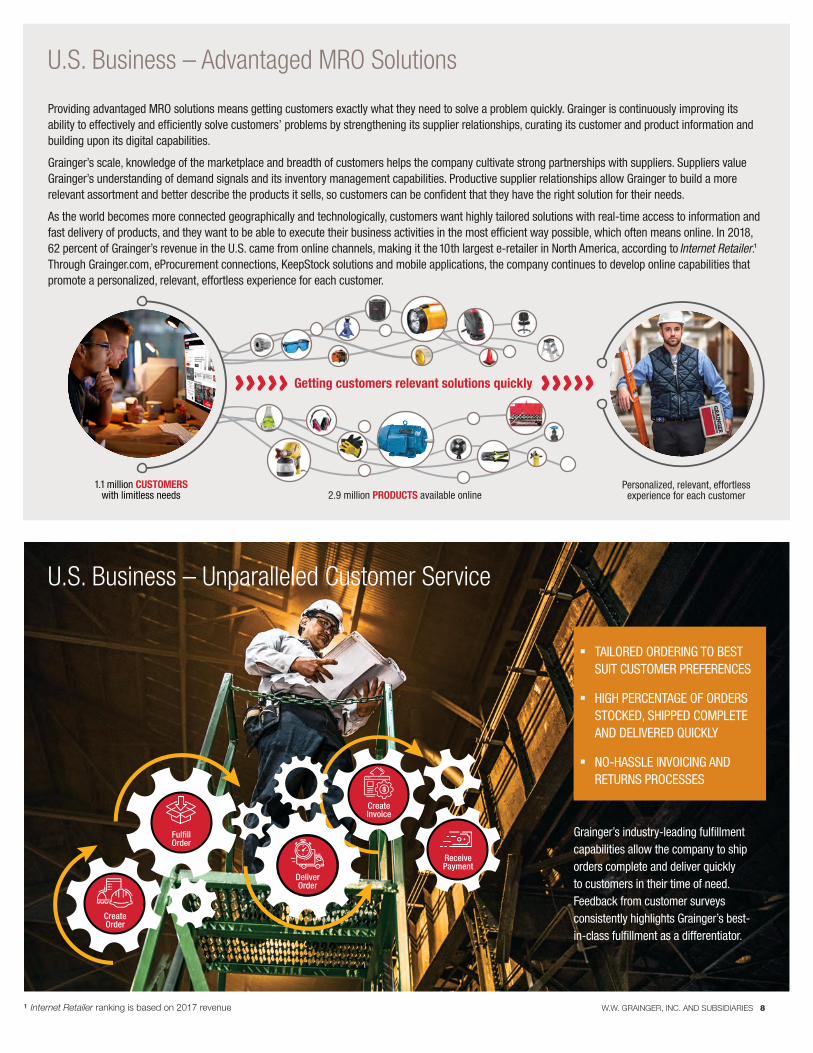
Providing advantaged MRO solutions means getting customers exactly what they need to solve a problem quickly. Grainger is continuously improving its ability to effectively and efficiently solve customers’ problems by strengthening its supplier relationships, curating its customer and product information and building upon its digital capabilities.
Grainger’s scale, knowledge of the marketplace and breadth of customers helps the company cultivate strong partnerships with suppliers. Suppliers value Grainger’s understanding of demand signals and its inventory management capabilities. Productive supplier relationships allow Grainger to build a more relevant assortment and better describe the products it sells, so customers can be confident that they have the right solution for their needs.
As the world becomes more connected geographically and technologically, customers want highly tailored solutions with real-time access to information and fast delivery of products, and they want to be able to execute their business activities in the most efficient way possible, which often means online. In 2018, 62 percent of Grainger’s revenue in the U.S. came from online channels, making it the 10th largest e-retailer in North America, according to Internet Retailer.1 Through Grainger.com, eProcurement connections, KeepStock solutions and mobile applications, the company continues to develop online capabilities that promote a personalized, relevant, effortless experience for each customer.
U.S. Business – Advantaged MRO Solutions
U.S. Business – Unparalleled Customer Service
Grainger’s industry-leading fulfillment capabilities allow the company to ship orders complete and deliver quickly to customers in their time of need. Feedback from customer surveys consistently highlights Grainger’s best- in-class fulfillment as a differentiator.
• TAILORED ORDERING TO BEST SUIT CUSTOMER PREFERENCES
• HIGH PERCENTAGE OF ORDERS STOCKED, SHIPPED COMPLETE AND DELIVERED QUICKLY
• NO-HASSLE INVOICING AND RETURNS PROCESSES
1 Internet Retailer ranking is based on 2017 revenue
W.W. GRAINGER, INC. AND SUBSIDIARIES 9
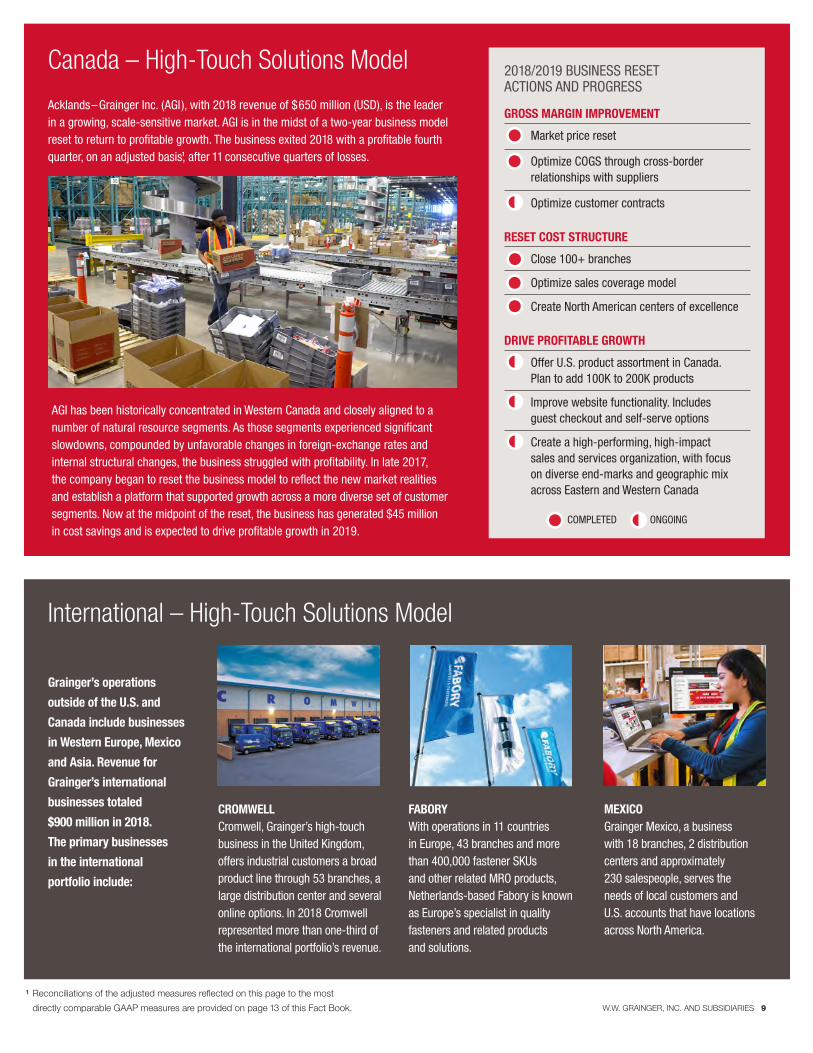
Acklands–Grainger Inc. (AGI), with 2018 revenue of $650 million (USD), is the leader in a growing, scale-sensitive market. AGI is in the midst of a two-year business model reset to return to profitable growth. The business exited 2018 with a profitable fourth quarter, on an adjusted basis,1 after 11 consecutive quarters of losses.
Grainger’s operations
outside of the U.S. and
Canada include businesses
in Western Europe, Mexico
and Asia. Revenue for
Grainger’s international
businesses totaled
$900 million in 2018.
The primary businesses
in the international
portfolio include:
Canada – High-Touch Solutions Model
International – High-Touch Solutions Model
CROMWELLCromwell, Grainger’s high-touch business in the United Kingdom, offers industrial customers a broad product line through 53 branches, a large distribution center and several online options. In 2018 Cromwell represented more than one-third of the international portfolio’s revenue.
FABORYWith operations in 11 countries in Europe, 43 branches and more than 400,000 fastener SKUs and other related MRO products, Netherlands-based Fabory is known as Europe’s specialist in quality fasteners and related products and solutions.
MEXICOGrainger Mexico, a business with 18 branches, 2 distribution centers and approximately 230 salespeople, serves the needs of local customers and U.S. accounts that have locations across North America.
GROSS MARGIN IMPROVEMENT
Market price reset
Optimize COGS through cross-border relationships with suppliers
Optimize customer contracts
RESET COST STRUCTURE
Close 100+ branches
Optimize sales coverage model
Create North American centers of excellence
DRIVE PROFITABLE GROWTH
Offer U.S. product assortment in Canada. Plan to add 100K to 200K products
Improve website functionality. Includes guest checkout and self-serve options
Create a high-performing, high-impact sales and services organization, with focus on diverse end-marks and geographic mix across Eastern and Western Canada
2018/2019 BUSINESS RESET ACTIONS AND PROGRESS
COMPLETED ONGOING
AGI has been historically concentrated in Western Canada and closely aligned to a number of natural resource segments. As those segments experienced significant slowdowns, compounded by unfavorable changes in foreign-exchange rates and internal structural changes, the business struggled with profitability. In late 2017, the company began to reset the business model to reflect the new market realities and establish a platform that supported growth across a more diverse set of customer segments. Now at the midpoint of the reset, the business has generated $45 million in cost savings and is expected to drive profitable growth in 2019.
1 Reconciliations of the adjusted measures reflected on this page to the most
directly comparable GAAP measures are provided on page 13 of this Fact Book.
W.W. GRAINGER, INC. AND SUBSIDIARIES 10
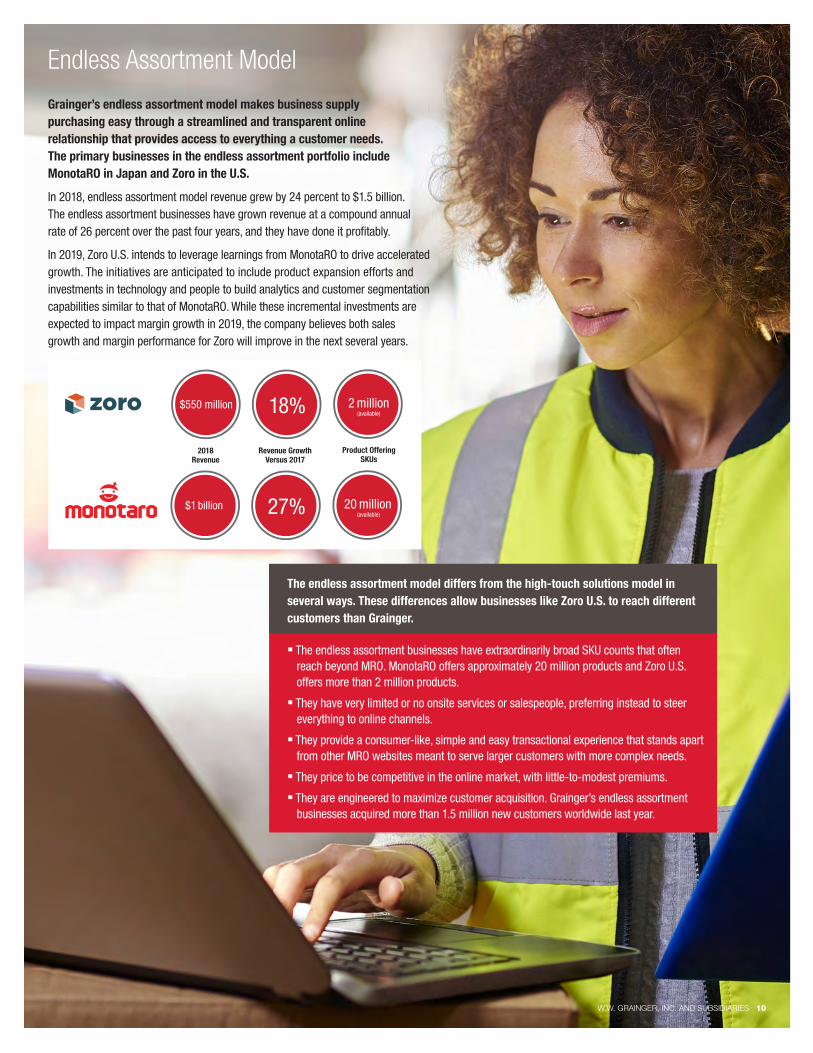
Grainger’s endless assortment model makes business supply purchasing easy through a streamlined and transparent online relationship that provides access to everything a customer needs. The primary businesses in the endless assortment portfolio include MonotaRO in Japan and Zoro in the U.S.
In 2018, endless assortment model revenue grew by 24 percent to $1.5 billion. The endless assortment businesses have grown revenue at a compound annual rate of 26 percent over the past four years, and they have done it profitably.
In 2019, Zoro U.S. intends to leverage learnings from MonotaRO to drive accelerated growth. The initiatives are anticipated to include product expansion efforts and investments in technology and people to build analytics and customer segmentation capabilities similar to that of MonotaRO. While these incremental investments are expected to impact margin growth in 2019, the company believes both sales growth and margin performance for Zoro will improve in the next several years.
The endless assortment model differs from the high-touch solutions model in several ways. These differences allow businesses like Zoro U.S. to reach different customers than Grainger.
• The endless assortment businesses have extraordinarily broad SKU counts that often reach beyond MRO. MonotaRO offers approximately 20 million products and Zoro U.S. offers more than 2 million products.
• They have very limited or no onsite services or salespeople, preferring instead to steer everything to online channels.
• They provide a consumer-like, simple and easy transactional experience that stands apart from other MRO websites meant to serve larger customers with more complex needs.
• They price to be competitive in the online market, with little-to-modest premiums.
• They are engineered to maximize customer acquisition. Grainger’s endless assortment businesses acquired more than 1.5 million new customers worldwide last year.
Endless Assortment Model
$550 million 18%
2018Revenue
Product OfferingSKUs
Revenue Growth Versus 2017
$1 billion 27%
2 million(available)
20 million (available)
SALESDollars in billions $10.0 $10.0 $10.1 $10.4 $11.2
2014 2015 2016 2017 2018
EARNINGS PER SHARE – DILUTED1
Dollars $11.45 $11.58 $11.58 $11.46* $16.70*
OPERATING MARGIN1
Percent 13.5% 13.5% 12.5% 11.1%* 12.0%*
10.3%
$10.02
$13.73
10.1%
ROIC1
Percent
31.2% 29.5% 25.8% 24.6%* 28.5%*
22.2%
* Lower number represents reported �gure; upper number represents adjusted �gure. Reconciliations of the adjusted measures re�ected on this page to the most directly comparable GAAP measures are provided on page 13 of this Fact Book.
U.S. ADJUSTED EXPENSE TO COGS1 Percent
47% 45% 43% 42% 40%
One metric Grainger uses to measure productivity in the U.S. is expense to COGS. Grainger has consistently improved productivity in the U.S. over the past several years.
CASH FLOW FROM OPERATIONSDollars in millions
$960 $990 $1,000 $1,100 $1,100
24.6%
67.4 62.0 58.8 56.3 55.9
DIVIDENDS PAIDDollars per share
$4.17 $4.59 $4.83 $5.06 $5.36
SHARES OUTSTANDING (at year end) Millions of shares
2014 2015 2016 2017 2018 2014 2015 2016 2017 2018 2014 2015 2016 2017 2018
2014 2015 2016 2017 2018 2014 2015 2016 2017 2018 2014 2015 2016 2017 2018 2014 2015 2016 2017 2018
W.W. GRAINGER, INC. AND SUBSIDIARIES 11
Creating Shareholder Value
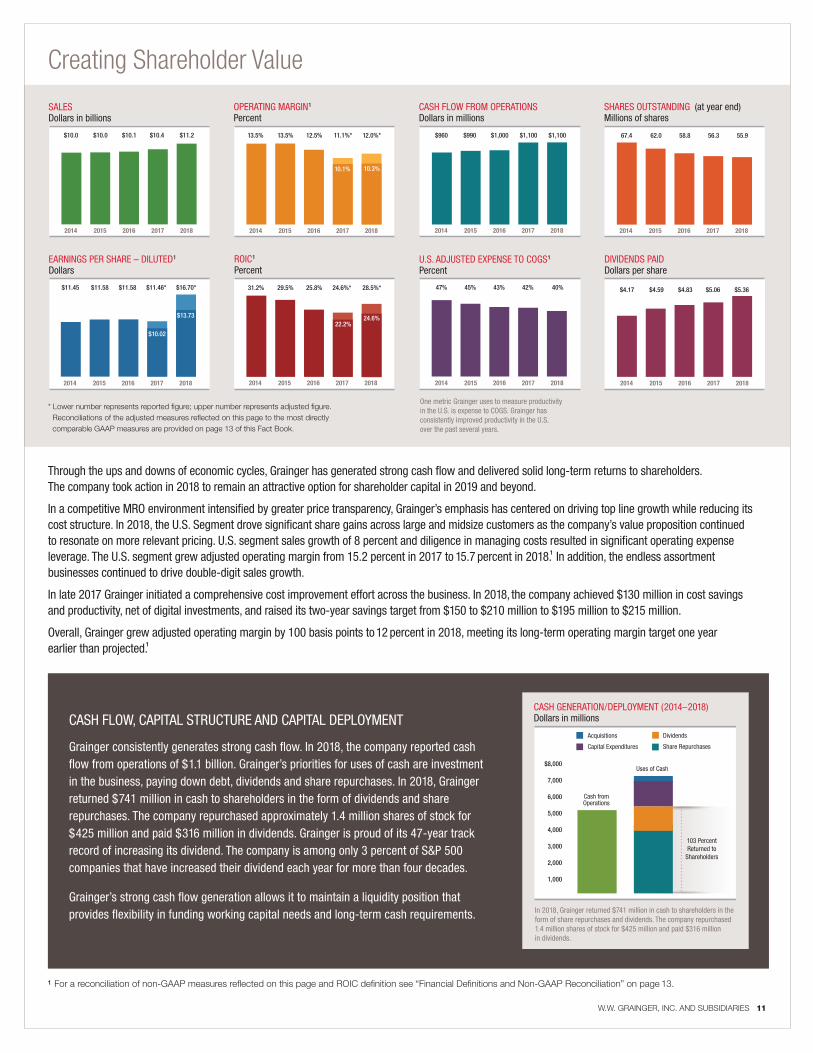
Through the ups and downs of economic cycles, Grainger has generated strong cash flow and delivered solid long-term returns to shareholders. The company took action in 2018 to remain an attractive option for shareholder capital in 2019 and beyond.
In a competitive MRO environment intensified by greater price transparency, Grainger’s emphasis has centered on driving top line growth while reducing its cost structure. In 2018, the U.S. Segment drove significant share gains across large and midsize customers as the company’s value proposition continued to resonate on more relevant pricing. U.S. segment sales growth of 8 percent and diligence in managing costs resulted in significant operating expense leverage. The U.S. segment grew adjusted operating margin from 15.2 percent in 2017 to 15.7 percent in 2018.1 In addition, the endless assortment businesses continued to drive double-digit sales growth.
In late 2017 Grainger initiated a comprehensive cost improvement effort across the business. In 2018, the company achieved $130 million in cost savings and productivity, net of digital investments, and raised its two-year savings target from $150 to $210 million to $195 million to $215 million.
Overall, Grainger grew adjusted operating margin by 100 basis points to 12 percent in 2018, meeting its long-term operating margin target one year earlier than projected.1
CASH GENERATION/DEPLOYMENT (2014–2018)Dollars in millions
Dividends
Share Repurchases
Acquisitions
Capital Expenditures
$8,000
7,000
6,000
5,000
4,000
3,000
2,000
1,000
Uses of Cash
Cash fromOperations
103 PercentReturned to
Shareholders
In 2018, Grainger returned $741 million in cash to shareholders in the form of share repurchases and dividends. The company repurchased 1.4 million shares of stock for $425 million and paid $316 million in dividends.
CASH FLOW, CAPITAL STRUCTURE AND CAPITAL DEPLOYMENT
Grainger consistently generates strong cash flow. In 2018, the company reported cash flow from operations of $1.1 billion. Grainger’s priorities for uses of cash are investment in the business, paying down debt, dividends and share repurchases. In 2018, Grainger returned $741 million in cash to shareholders in the form of dividends and share repurchases. The company repurchased approximately 1.4 million shares of stock for $425 million and paid $316 million in dividends. Grainger is proud of its 47-year track record of increasing its dividend. The company is among only 3 percent of S&P 500 companies that have increased their dividend each year for more than four decades.
Grainger’s strong cash flow generation allows it to maintain a liquidity position that provides flexibility in funding working capital needs and long-term cash requirements.
1 For a reconciliation of non-GAAP measures reflected on this page and ROIC definition see “Financial Definitions and Non-GAAP Reconciliation” on page 13.
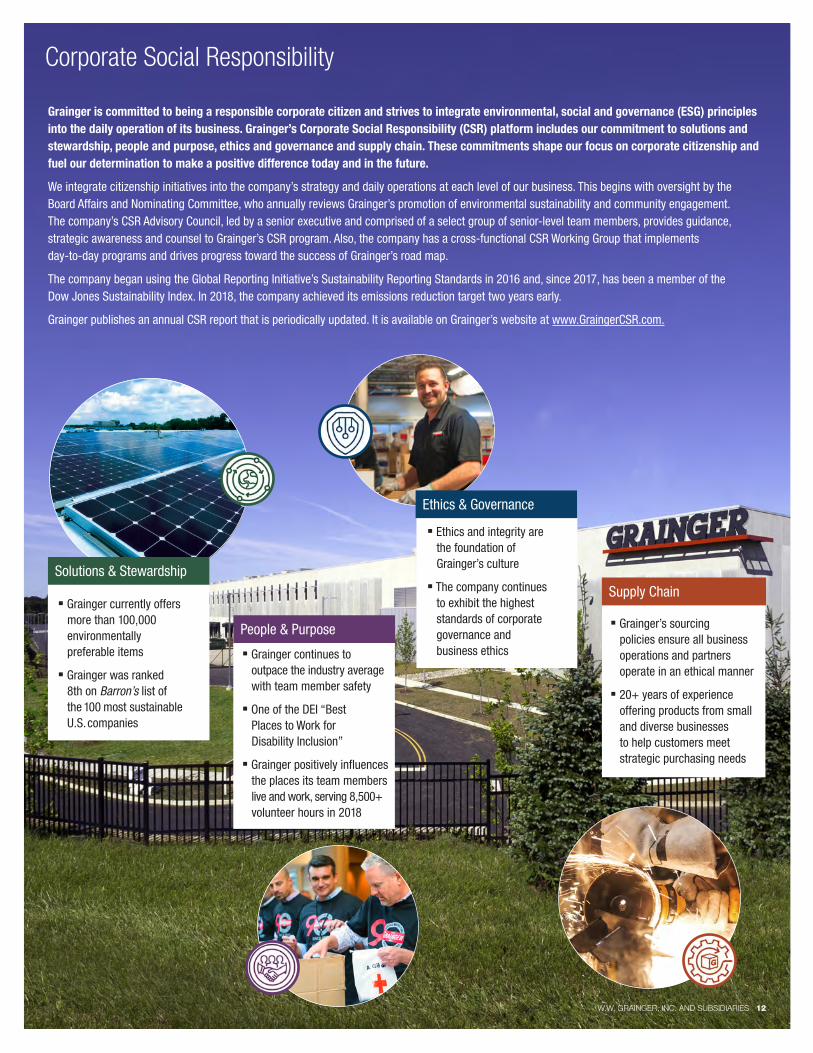
Grainger is committed to being a responsible corporate citizen and strives to integrate environmental, social and governance (ESG) principles into the daily operation of its business. Grainger’s Corporate Social Responsibility (CSR) platform includes our commitment to solutions and stewardship, people and purpose, ethics and governance and supply chain. These commitments shape our focus on corporate citizenship and fuel our determination to make a positive difference today and in the future.
We integrate citizenship initiatives into the company’s strategy and daily operations at each level of our business. This begins with oversight by the Board Affairs and Nominating Committee, who annually reviews Grainger’s promotion of environmental sustainability and community engagement. The company’s CSR Advisory Council, led by a senior executive and comprised of a select group of senior-level team members, provides guidance, strategic awareness and counsel to Grainger’s CSR program. Also, the company has a cross-functional CSR Working Group that implements day-to-day programs and drives progress toward the success of Grainger’s road map.
The company began using the Global Reporting Initiative’s Sustainability Reporting Standards in 2016 and, since 2017, has been a member of the Dow Jones Sustainability Index. In 2018, the company achieved its emissions reduction target two years early.
Grainger publishes an annual CSR report that is periodically updated. It is available on Grainger’s website at www.GraingerCSR.com.
Corporate Social Responsibility
• Grainger currently offers more than 100,000 environmentally preferable items
• Grainger was ranked 8th on Barron’s list of the 100 most sustainable U.S. companies
• Ethics and integrity are the foundation of Grainger’s culture
• The company continues to exhibit the highest standards of corporate governance and business ethics
W.W. GRAINGER, INC. AND SUBSIDIARIES 12
• Grainger’s sourcing policies ensure all business operations and partners operate in an ethical manner
• 20+ years of experience offering products from small and diverse businesses to help customers meet strategic purchasing needs
• Grainger continues to outpace the industry average with team member safety
• One of the DEI “Best Places to Work for Disability Inclusion”
• Grainger positively influences the places its team members live and work, serving 8,500+ volunteer hours in 2018
Solutions & Stewardship
People & Purpose
Ethics & Governance
Supply Chain
W.W. GRAINGER, INC. AND SUBSIDIARIES 13
TWELVE MONTHS ENDEDDECEMBER 31,
2018 2017
Operating earnings reported $1,158 $1,035
Restructuring (United States) 18 44
Branch gains (United States) (10) (33)
Other charges (United States) — (4)
Restructuring (Canada) 36 39
Branch gains (Canada) (1) —Restructuring (Other Businesses) 6 55
Intangible Charges (Other Businesses) 139 —Restructuring (Unallocated expense) (2) 11
Subtotal 186 112
Operating earnings adjusted $1,344 $1,147
2018 2017
Net earnings attributable to W.W. Grainger, Inc. reported
$782 $586
Total restructuring and impairment charges, net of branch gains and other charges
186 112
Tax effect1 (16) (13)
U.S. tax legislation2 — (3)
Discrete tax items — (12)
Total restructuring and impairment charges, net of branch gains and other charges and tax
170 84
Net earnings attributable to W.W. Grainger, Inc. adjusted
$952 $670
TWELVE MONTHS ENDEDDECEMBER 31,
2018 2017
Diluted earnings per share reported $13.73 $10.02
Restructuring (United States) 0.33 0.76
Branch gains (United States) (0.18) (0.56)
Other (gains)/charges (United States) — (0.08)
Restructuring (Canada) 0.61 0.67
Branch gains (Canada) (0.01) —Restructuring (Other Businesses) 0.11 0.94
Intangible charges (Other Businesses) 2.43 —Restructuring (Unallocated expense) (0.03) 0.18
Total pretax adjustments 3.26 1.91
Tax effect of impairment (0.10) —Tax effect1 (0.19) (0.21)
U.S. tax legislation 2 — (0.06)
Discrete tax items — (0.20)
Total, net of tax 2.97 1.44
Diluted earnings per share adjusted $16.70 $11.46
1 The tax impact of adjustments is calculated based on the income tax rate in each applicable jurisdiction, subject to deductibility limitations and the company’s ability to realize the associated tax benefits.
2 U.S. tax legislation reflects the 2017 impact of the benefit of remeasurement of deferred taxes, partially offset by a one-time deemed repatriation tax.
The company supplements GAAP financial information with certain non-GAAP measures, including adjusted operating earnings, adjusted net earnings and adjusted diluted earnings per share. Adjusted measures exclude items noted below that may not be indicative of core operating results and provide a better baseline for analyzing trends in the underlying business.
NOTE ON ROICROIC has been calculated using a 5-point (quarterly) average for net working assets to provide greater transparency. Net working assets are working assets minus working liabilities defined as follows: working assets equal total assets less cash equivalents (non-operating cash), deferred taxes and investments in unconsolidated entities, plus the LIFO reserve. Working liabilities are the sum of trade payables, accrued compensation and benefits, accrued contributions to employees’ profit sharing plans and accrued expenses.
Financial Definitions and Non-GAAP Reconciliation
W.W. GRAINGER, INC. AND SUBSIDIARIES 14
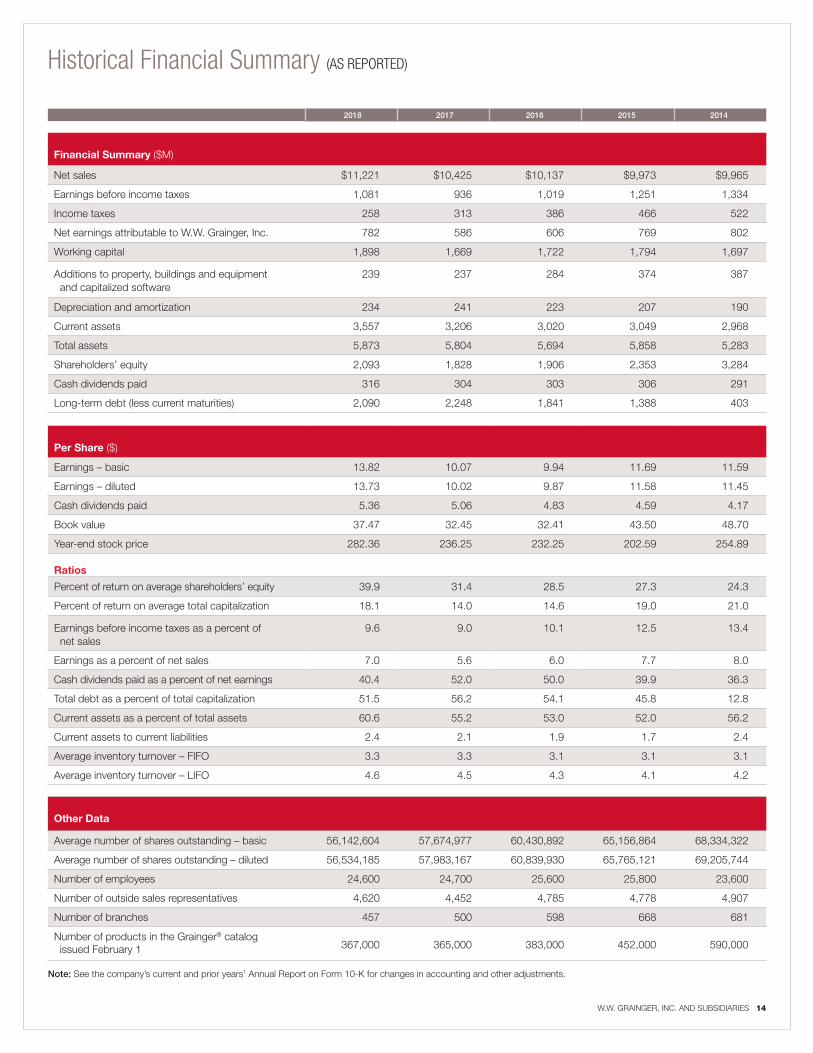
2018 2017 2016 2015 2014
Financial Summary ($M)
Net sales $11,221 $10,425 $10,137 $9,973 $9,965
Earnings before income taxes 1,081 936 1,019 1,251 1,334
Income taxes 258 313 386 466 522
Net earnings attributable to W.W. Grainger, Inc. 782 586 606 769 802
Working capital 1,898 1,669 1,722 1,794 1,697
Additions to property, buildings and equipment and capitalized software
239 237 284 374 387
Depreciation and amortization 234 241 223 207 190
Current assets 3,557 3,206 3,020 3,049 2,968
Total assets 5,873 5,804 5,694 5,858 5,283
Shareholders’ equity 2,093 1,828 1,906 2,353 3,284
Cash dividends paid 316 304 303 306 291
Long-term debt (less current maturities) 2,090 2,248 1,841 1,388 403
Per Share ($)
Earnings – basic 13.82 10.07 9.94 11.69 11.59
Earnings – diluted 13.73 10.02 9.87 11.58 11.45
Cash dividends paid 5.36 5.06 4.83 4.59 4.17
Book value 37.47 32.45 32.41 43.50 48.70
Year-end stock price 282.36 236.25 232.25 202.59 254.89
Ratios
Percent of return on average shareholders’ equity 39.9 31.4 28.5 27.3 24.3
Percent of return on average total capitalization 18.1 14.0 14.6 19.0 21.0
Earnings before income taxes as a percent of net sales
9.6 9.0 10.1 12.5 13.4
Earnings as a percent of net sales 7.0 5.6 6.0 7.7 8.0
Cash dividends paid as a percent of net earnings 40.4 52.0 50.0 39.9 36.3
Total debt as a percent of total capitalization 51.5 56.2 54.1 45.8 12.8
Current assets as a percent of total assets 60.6 55.2 53.0 52.0 56.2
Current assets to current liabilities 2.4 2.1 1.9 1.7 2.4
Average inventory turnover – FIFO 3.3 3.3 3.1 3.1 3.1
Average inventory turnover – LIFO 4.6 4.5 4.3 4.1 4.2
Other Data
Average number of shares outstanding – basic 56,142,604 57,674,977 60,430,892 65,156,864 68,334,322
Average number of shares outstanding – diluted 56,534,185 57,983,167 60,839,930 65,765,121 69,205,744
Number of employees 24,600 24,700 25,600 25,800 23,600
Number of outside sales representatives 4,620 4,452 4,785 4,778 4,907
Number of branches 457 500 598 668 681
Number of products in the Grainger® catalog issued February 1 367,000 365,000 383,000 452,000 590,000
Note: See the company’s current and prior years’ Annual Report on Form 10-K for changes in accounting and other adjustments.
Historical Financial Summary (AS REPORTED)
Company InformationCompany HeadquartersW.W. Grainger, Inc.100 Grainger Parkway Lake Forest, IL 60045-5201847.535.1000www.grainger.com
Annual MeetingThe 2019 Annual Meeting of Shareholders will be held at the company’s headquarters in Lake Forest, Illinois, at 10:00 a.m. CDT on Wednesday, April 24, 2019.
Transfer Agent, Registrar and Dividend Disbursing AgentInstructions and inquiries regarding transfers, certificates, changes of title or address, lost or missing dividend checks, consolidation of accounts and elimination of multiple mailings should be directed to:
First Class/Registered/Certified Mail: Computershare Investor Services PO Box 505000, Louisville, KY 40233-5000 800.446.2617
Courier Services: Computershare Investor Services 462 South 4th Street Suite 1600 Louisville, KY 40202
AuditorErnst & Young LLP 155 North Wacker Drive Chicago, IL 60606-1787
Investor Relations ContactsIrene M. Holman Vice President, Investor Relations 847.535.0809
Monica D. Gupta Director, Investor Relations 847.535.0099
Media Relations ContactJoseph Micucci Senior Director, External Affairs847.535.0879
TrademarksThe trademarks contained in this document are the property of their respective owners and the use of such trademarks shall inure to the benefit of the trademark owner.
W.W. GRAINGER, INC. AND SUBSIDIARIES 15