Embed Size (px)
Citation preview

2018 U.S. ETHANOL EXPORTS
The U.S. exported 1.70
billion gallons of ethanol
in 2018—up 24% from
2017 and the highest annual
volume on record.
American-made ethanol was
exported to more than 80
countries on all six
inhabited continents around
the world.
Undenatured ethanol for fuel
use accounted for 51% of
total exports in 2018.
Denatured ethanol for fuel use
made up 43%. Meanwhile,
denatured and undenatured
ethanol for non-fuel industrial
uses accounted for the
remaining 6%.
Sources: U.S. Census Bureau, Department of Commerce, and Department of Agriculture 1
158 113
396
1,193
732
617
839910
1,169
1,367
1,705
-
200
400
600
800
1,000
1,200
1,400
1,600
1,800
2008 2009 2010 2011 2012 2013 2014 2015 2016 2017 2018
Mil
lion
Gall
ons
Annual U.S. Ethanol Exports
-
50
100
150
200
250
Jan Feb Mar Apr May Jun Jul Aug Sep Oct Nov Dec
Mil
lion
Gall
ons
2018 Monthly Ethanol Exports, by Type
Denatured Fuel Ethanol Undenatured Fuel Ethanol
Undenatured Ethanol, Other Denatured Ethanol, Other
2018 U.S. ETHANOL EXPORTS
Exports surged to a
record 10.6% of total
U.S. ethanol production in
2018. More than one out
of every 10 gallons
produced was exported.
U.S. ethanol exports were
valued at $2.75 billion in
2018, up 15% from 2017 and
the second-highest on record.
Sources: U.S. Census Bureau, Department of Commerce, and Department of Agriculture2
1.7%1.0%
3.0%
8.6%
5.5%
4.6%
5.9% 6.1%
7.6%
8.7%
10.6%
0%
1%
2%
3%
4%
5%
6%
7%
8%
9%
10%
11%
2008 2009 2010 2011 2012 2013 2014 2015 2016 2017 2018
Export Share of U.S. Ethanol Production
$0
$500
$1,000
$1,500
$2,000
$2,500
$3,000
$3,500
2008 2009 2010 2011 2012 2013 2014 2015 2016 2017 2018
Mil
lion
Dol
lars
(U
.S.)
Value of U.S. Ethanol Exports
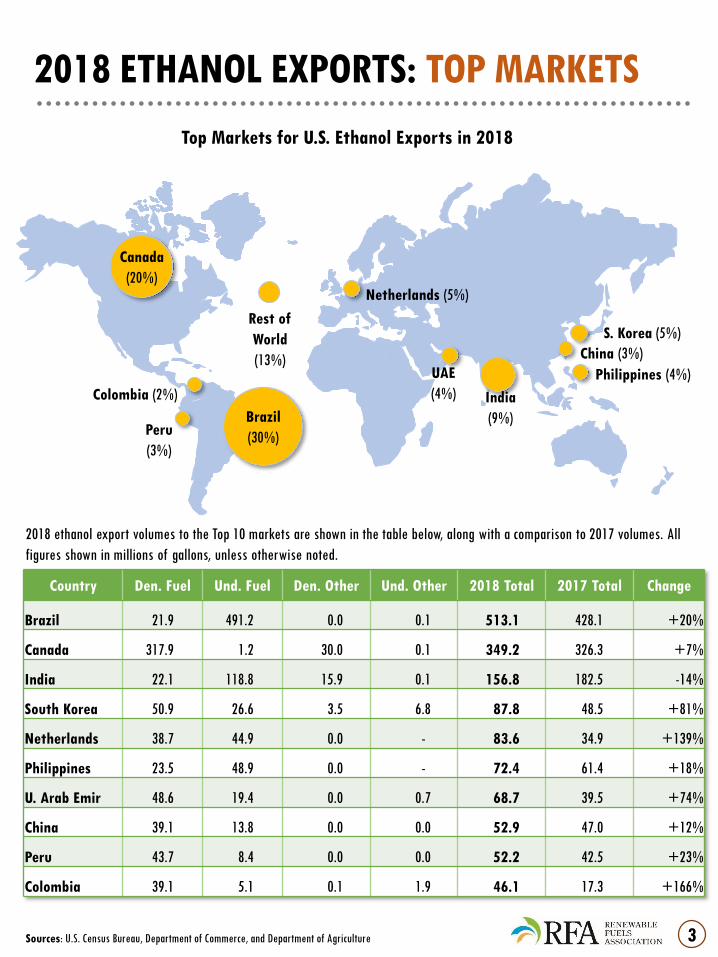
2018 ETHANOL EXPORTS: TOP MARKETS
Canada
(20%)
Brazil
(30%)
Colombia (2%)
Netherlands (5%)
Philippines (4%)
S. Korea (5%)Rest of
World
(13%)
India
(9%)
UAE
(4%)
Top Markets for U.S. Ethanol Exports in 2018
Country Den. Fuel Und. Fuel Den. Other Und. Other 2018 Total 2017 Total Change
Brazil 21.9 491.2 0.0 0.1 513.1 428.1 +20%
Canada 317.9 1.2 30.0 0.1 349.2 326.3 +7%
India 22.1 118.8 15.9 0.1 156.8 182.5 -14%
South Korea 50.9 26.6 3.5 6.8 87.8 48.5 +81%
Netherlands 38.7 44.9 0.0 - 83.6 34.9 +139%
Philippines 23.5 48.9 0.0 - 72.4 61.4 +18%
U. Arab Emir 48.6 19.4 0.0 0.7 68.7 39.5 +74%
China 39.1 13.8 0.0 0.0 52.9 47.0 +12%
Peru 43.7 8.4 0.0 0.0 52.2 42.5 +23%
Colombia 39.1 5.1 0.1 1.9 46.1 17.3 +166%
2018 ethanol export volumes to the Top 10 markets are shown in the table below, along with a comparison to 2017 volumes. All
figures shown in millions of gallons, unless otherwise noted.
Sources: U.S. Census Bureau, Department of Commerce, and Department of Agriculture 3
Peru
(3%)
China (3%)

U.S. ETHANOL EXPORTS: SHIFTING MARKETS
Exports to South America
continued their strong
expansion in 2018, led by
Brazil. Exports to East Asia
rose, with South Korea the
largest destination. Exports to
North America, primarily
Canada, continued to exhibit
slow-but-steady growth.
Exports to Brazil continued
strong growth in 2018. While
China returned as an export
destination early in 2018, the
imposition of high import
duties caused shipments to
cease. Ethanol exports to the
EU grew but have not
recovered after collapsing in
2013 due to the imposition of
duties.
Sources: U.S. Census Bureau, Department of Commerce, and Department of Agriculture4
0
200
400
600
800
1,000
1,200
1,400
1,600
1,800
2012 2013 2014 2015 2016 2017 2018
Mil
lion
Gall
ons
U.S. Exports by Region
North Africa
Middle East
EU-28
South Asia
Southeast Asia
East Asia
South America
North America
All Others
0
100
200
300
400
500
600
2012 2013 2014 2015 2016 2017 2018
Mil
lion
Gall
ons
Volatility in Major U.S. Ethanol Export Markets
Brazil India China EU-28
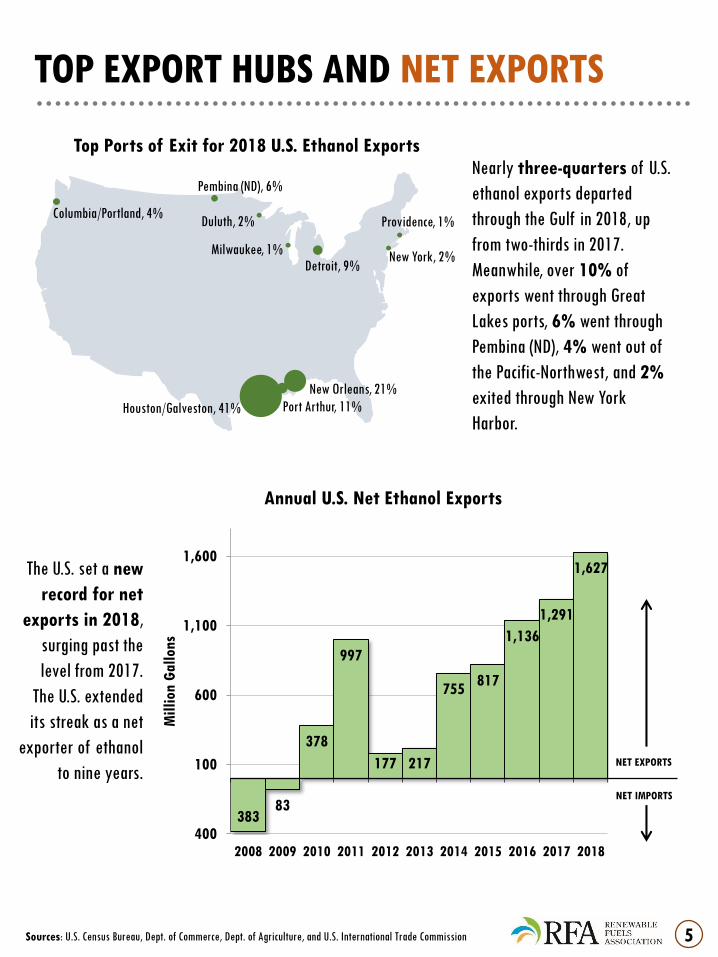
The U.S. set a new
record for net
exports in 2018,
surging past the
level from 2017.
The U.S. extended
its streak as a net
exporter of ethanol
to nine years. NET EXPORTS
NET IMPORTS
Nearly three-quarters of U.S.
ethanol exports departed
through the Gulf in 2018, up
from two-thirds in 2017.
Meanwhile, over 10% of
exports went through Great
Lakes ports, 6% went through
Pembina (ND), 4% went out of
the Pacific-Northwest, and 2%
exited through New York
Harbor.
5
38383
378
997
177 217
755817
1,136
1,291
1,627
400
100
600
1,100
1,600
2008 2009 2010 2011 2012 2013 2014 2015 2016 2017 2018
Mil
lion
Gall
ons
Annual U.S. Net Ethanol Exports
Top Ports of Exit for 2018 U.S. Ethanol Exports
Houston/Galveston, 41%
New Orleans, 21%
New York, 2%Detroit, 9%
Pembina (ND), 6%
Duluth, 2%
Milwaukee, 1%
Columbia/Portland, 4%
TOP EXPORT HUBS AND NET EXPORTS
Sources: U.S. Census Bureau, Dept. of Commerce, Dept. of Agriculture, and U.S. International Trade Commission
Port Arthur, 11%
Providence, 1%
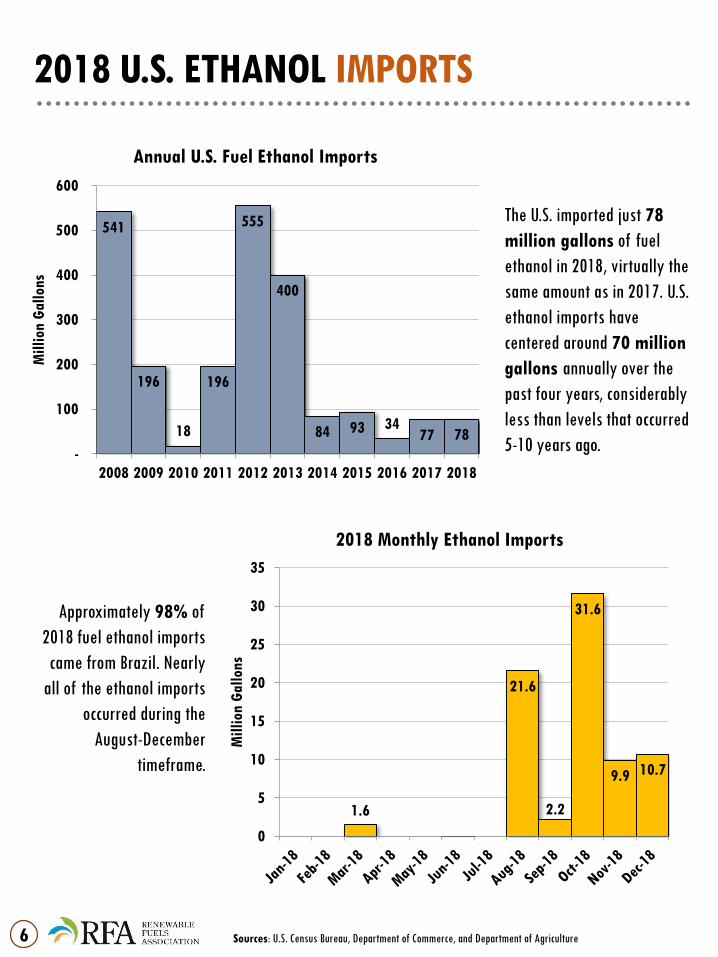
2018 U.S. ETHANOL IMPORTS
The U.S. imported just 78
million gallons of fuel
ethanol in 2018, virtually the
same amount as in 2017. U.S.
ethanol imports have
centered around 70 million
gallons annually over the
past four years, considerably
less than levels that occurred
5-10 years ago.
Approximately 98% of
2018 fuel ethanol imports
came from Brazil. Nearly
all of the ethanol imports
occurred during the
August-December
timeframe.
Sources: U.S. Census Bureau, Department of Commerce, and Department of Agriculture
541
196
18
196
555
400
84 93 3477 78
-
100
200
300
400
500
600
2008 2009 2010 2011 2012 2013 2014 2015 2016 2017 2018
Mil
lion
Gall
ons
Annual U.S. Fuel Ethanol Imports
1.6
21.6
2.2
31.6
9.9 10.7
0
5
10
15
20
25
30
35
Mil
lion
Gall
ons
2018 Monthly Ethanol Imports
6
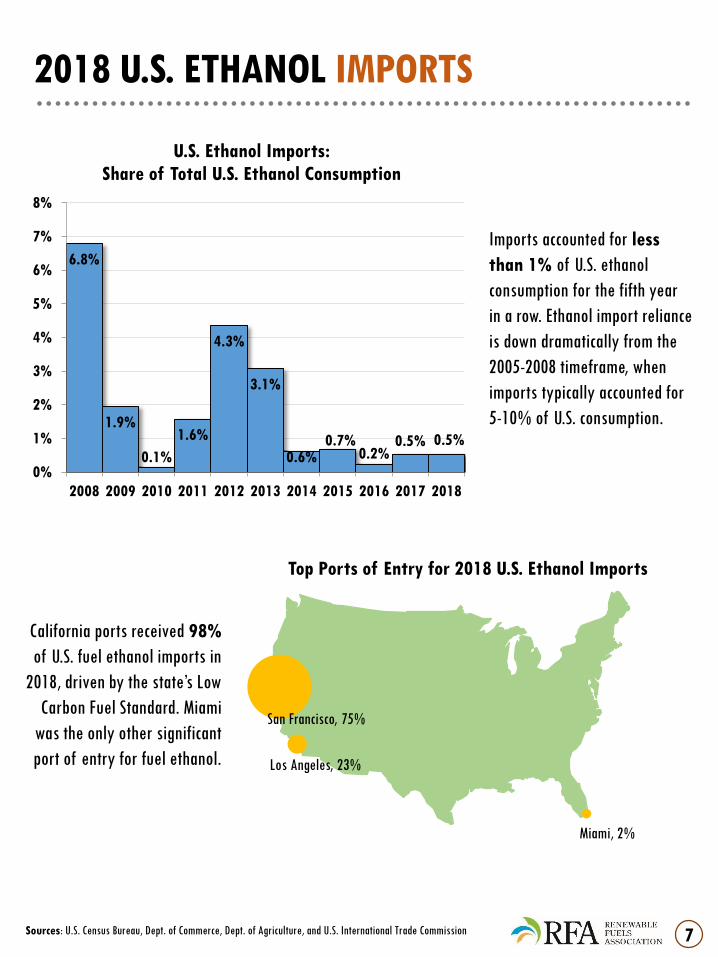
2018 U.S. ETHANOL IMPORTS
Imports accounted for less
than 1% of U.S. ethanol
consumption for the fifth year
in a row. Ethanol import reliance
is down dramatically from the
2005-2008 timeframe, when
imports typically accounted for
5-10% of U.S. consumption.
Top Ports of Entry for 2018 U.S. Ethanol Imports
Miami, 2%
Los Angeles, 23%
Sources: U.S. Census Bureau, Dept. of Commerce, Dept. of Agriculture, and U.S. International Trade Commission
San Francisco, 75%
California ports received 98%
of U.S. fuel ethanol imports in
2018, driven by the state’s Low
Carbon Fuel Standard. Miami
was the only other significant
port of entry for fuel ethanol.
6.8%
1.9%
0.1%
1.6%
4.3%
3.1%
0.6%0.7%
0.2%0.5% 0.5%
0%
1%
2%
3%
4%
5%
6%
7%
8%
2008 2009 2010 2011 2012 2013 2014 2015 2016 2017 2018
U.S. Ethanol Imports:
Share of Total U.S. Ethanol Consumption
7

ABOUT THE DATA IN THIS REPORT
U.S. Ethanol Export Data
• The export data in this report includes exports classified under the following Harmonized Tariff Schedule (HTS) codes:
• 2207200010: Ethyl alcohol and other spirits, denatured, of any strength: For fuel use
• 2207106010: Undenatured ethyl alcohol of an alcoholic strength by volume of 80 percent vol. or higher: For
non-beverage purposes: For fuel use
• 2207200090: Ethyl alcohol and other spirits, denatured, of any strength: Other
• 2207106090: Undenatured ethyl alcohol of an alcoholic strength by volume of 80 percent vol. or higher: For
non-beverage purposes: Other
• 2207200090 and 2207106090 are included in this report because there is some anecdotal evidence that exports of
ethanol intended for fuel use are sometimes classified under these codes. In any case, ethanol classified under these
codes represented just 5% of the 2017 U.S. exports discussed in this report.
U.S. Ethanol Import Data
• The import data in this report includes imports classified under the following Harmonized Tariff Schedule (HTS) codes:
• 2207200010: Ethyl alcohol and other spirits, denatured, of any strength: For fuel use
• 2207106010: Undenatured ethyl alcohol of an alcoholic strength by volume of 80 percent vol. or higher: For
non-beverage purposes: For fuel use
Sources
• All data in this report comes from the U.S. Census Bureau, U.S. Department of Commerce, U.S. Department of Agriculture,
U.S. International Trade Commission, and U.S. Energy Information Administration
The Renewable Fuels Association publishes monthly summaries of export and import data for
ethanol and distillers dried grains on its award-winning E-Blog.
This report was prepared by Scott Richman, who may be contacted at [email protected] or 636.594.2287.
Copyright © 2019 Renewable Fuels Association. All Rights Reserved8

Copyright © 2019 Renewable Fuels Association. All Rights Reserved
Renewable Fuels Association16024 Manchester Road
Suite 101
Ellisville, MO 63011
636.594.2287
www.EthanolRFA.org