Embed Size (px)
Citation preview

Supply Chain Resilience:The U.S. Ethanol Industry’s
Response to COVID-19Geoff Cooper
Renewable Fuels Association
Agricultural Outlook ForumFebruary 2021

2020 Began with Great Promise• Policy/regulatory wins in late 2019
• Restoring integrity to Renewable Fuel Standard• Removing E15 barriers and infrastructure grants• Ethanol/DDGS prioritized in trade negotiations
• Ratification of US-Mexico-Canada Agreement• China “Phase 1” Agreement includes ethanol/DDGS• Biofuel tax credits extended• 10th Circuit Court decision limits RFS refiner waivers• Strong outlook for U.S. and global economic growth

COVID-19 Changed EverythingBetween March 20 and April 24:• 48% collapse in gasoline demand
• 45% drop in ethanol blending• Record ethanol stocks levels
• 47% drop in ethanol production• In mid-April:
• 75 plants completely idled• 73 plants at 50-90% nameplate capacity• 56 plants at 90%+ nameplate capacity
• Industry response to demand shock was rapid and effective

Market Response to COVID-19
148.6
77.6
0
20
40
60
80
100
120
140
160
180
Billio
n G
allo
ns (A
nnua
lized
)
U.S. Gasoline Consumption
15.9
8.7
0
2
4
6
8
10
12
14
16
18
Billio
n G
allo
ns (A
nnua
lized
)
U.S. Ethanol Production and Blending
Production Blending
Source: U.S. Energy Information Administration

Market Response to COVID-19
500
600
700
800
900
1,000
1,100
1,200
Milli
on G
allo
ns
Weekly U.S. Ethanol Ending Stocks
Source: U.S. Energy Information Administration

Recovering from COVID-19
Source: U.S. Energy Information Administration
0.0
20.0
40.0
60.0
80.0
100.0
120.0
140.0
160.0
Gas
olin
e C
onsu
mpt
ion
(Bill
ion
Gal
lons
Ann
ualiz
ed)
Weekly U.S. Gasoline Consumption
Avg. = 142
Low = 78
Avg. = 128
0.0
2.0
4.0
6.0
8.0
10.0
12.0
14.0
16.0
18.0
Billio
n G
allo
ns (A
nnua
lized
)
Weekly U.S. Ethanol Production and Blending
Production Blending
Avg. = 14.2
Low = 7.9
Avg. = 12.6
Avg. = 15.8
Low = 8.2
Avg. = 14.3

COVID-19 Economic Impacts• Despite effective & disciplined response, ethanol industry losses
have been severe• 2020 gross revenue loss due to COVID-19 estimated at $4-5 billion• Combination of ~15% lower output (-2.5 BG) and lower prices
• Provisions providing emergency relief funding for ethanol were introduced in both the House and Senate, but not included in first three omnibus stimulus packages
• Latest COVID package specifies that USDA may “make payments to producers of advanced biofuel, biomass-based diesel, cellulosic biofuel, conventional biofuel, or renewable fuel…produced in the United States, for unexpected market losses as a result of COVID-19.”
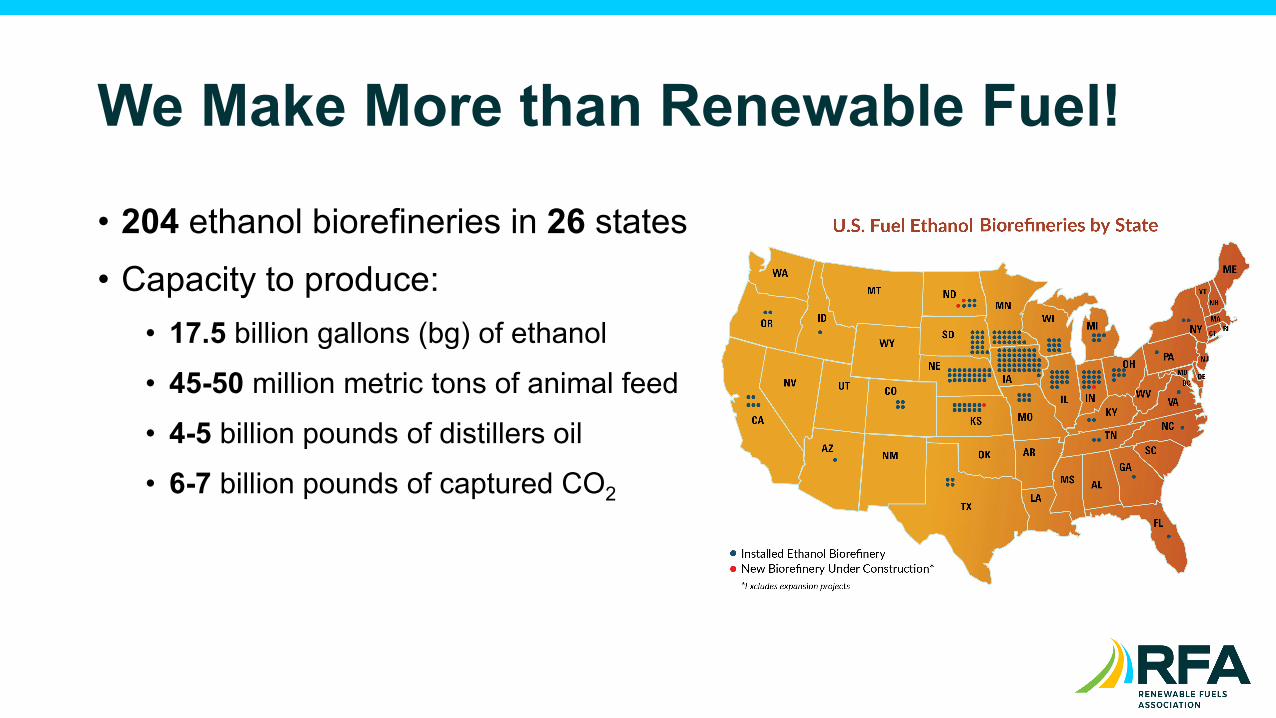
We Make More than Renewable Fuel!
• 204 ethanol biorefineries in 26 states• Capacity to produce:
• 17.5 billion gallons (bg) of ethanol
• 45-50 million metric tons of animal feed
• 4-5 billion pounds of distillers oil
• 6-7 billion pounds of captured CO2

COVID-19 Response• COVID-related reduction in ethanol
output had ripple impacts:• Reduced CO2 and dry ice production• Reduced distillers grains output• Reduced distillers corn oil output
• Resiliency and creativity:• Emphasis on co-product yields• Significant increase in high-purity
alcohol production for hand sanitizers and disinfectants
• Increased focus on CO2 capture0
50,000
100,000
150,000
200,000
250,000
300,000
Tons
CO
2
CO2 Capture by Ethanol Plants
2019 3-YR AVG (2017-2019) 2020

$0
$10
$20
$30
$40
$50
$60
$70
0%
200%
400%
600%
800%
1000%
1200%
1400%
1600%
5-Jan-20 5-Feb-20 5-Mar-20 5-Apr-20 5-May-20 5-Jun-20 5-Jul-20 5-Aug-20 5-Sep-20
Weekly $ Sales (M
M)
YoY
% C
hang
e
Dollar Sales YoY % Change
Panic Buying
Out of Stocks
Supply Chain recovery and high need
Hand Sanitizer Category: 2020 YTD Dollar Sales TrendInitial spike in sales caused increased out of stocks in March resulting in a decline in distribution. Once supply chain recovered, consistent elevated levels of sales starting April continued on to end of modeling period
Weekly % Chg vs YAG
6% 5% 3% 28% 110% 83% 69% 62% 385
%479%
256%
204%
148%
266%
395%
640%
986%
995%
1284%
1369%
1332%
1232%
1178%
1109%
1173%
1099%
1148%
982%
844%
679%
529%
470%
508%
538%
538%
573%
Source: Information Resources Inc. (IRI)Actual data through 10/4/2020.

4,000
5,000
6,000
7,000
8,000
9,000
10,000
11,000
12,000
13,000
Jul-1
8
Aug-
18
Sep-
18
Oct
-18
Nov
-18
Dec
-18
Jan-
19
Feb-
19
Mar
-19
Apr-1
9
May
-19
Jun-
19
Jul-1
9
Aug-
19
Sep-
19
Oct
-19
Nov
-19
Dec
-19
Jan-
20
Feb-
20
Mar
-20
Apr-2
0
May
-20
Jun-
20
Jul-2
0
Aug-
20
Sep-
20
Oct
-20
Nov
-20
Thou
sand
Bus
hels
Monthly U.S. Grain Use for Industrial Alcohol Production
Source: U.S. Dept. of Agriculture

U.S. Ethanol Demand Recovery
14.5 14.4 14.6
12.7
13.914.5
1.3 1.7 1.3
1.1
1.3
1.6
10.0
11.0
12.0
13.0
14.0
15.0
16.0
17.0
2017 2018 2019 2020 2021P 2022P
Billio
n G
allo
ns
U.S. Ethanol DemandUS Consumption Net Exports
16.1 15.9
13.8
15.3
16.115.8
Source: RFA calculations based on data and projections from U.S. Energy Information Administration, U.S. Census Bureau, and U.S. Department of Commerce; totals may not add due to rounding
Demand for U.S. ethanol unlikely to recover to peak pre-COVID levels until at least 2022.
Record