Embed Size (px)
Citation preview

2018 Site Visit Presentation
February, 2018
Michael Carvill, Managing Director
Tony McCluskey, Finance Director
Ben Baxter, Chief Operating Officer
Jeremy Dibb, Corporate Development & Investor Relations

Disclaimer
2
This Presentation (the “Presentation”) hasbeen prepared and issued by KenmareResources plc (the “Company” or“Kenmare”). While this Presentation hasbeen prepared in good faith, the Companyand its respective officers, employees,agents and representatives expresslydisclaim any and all liability for the contentsof, or omissions from, this Presentation,and for any other written or oralcommunication transmitted or madeavailable to the recipient or any of itsofficers, employees, agents orrepresentatives.
No representations or warranties are or willbe expressed or are to be implied on thepart of the Company, or any of itsrespective officers, employees, agents orrepresentatives in or from this Presentationor any other written or oral communicationfrom the Company, or any of its respectiveofficers, employees, agents orrepresentatives concerning the Companyor any other factors relevant to anytransaction involving the Company or as tothe accuracy, completeness or fairness ofthis Presentation, the information or
opinions on which it is based, or any otherwritten or oral information made availablein connection with the Company.
This Presentation does not constitute orform part of, and should not be construedas, an offer, invitation or inducement topurchase or subscribe for any securities ofthe Company nor shall it or any part of itform the basis of, or be relied upon inconnection with, any contract or investmentdecision relating to such securities, nordoes it constitute a recommendationregarding the securities of the Company.
This Presentation is as of the date hereof.This Presentation includes certainstatements, estimates and projectionsprovided by the Company with respect tothe anticipated future performance of theCompany or the industry in which itoperates. Such statements, estimates andprojections reflect various assumptions andsubjective judgments by the Company’smanagement concerning anticipatedresults, certain of which assumptions andjudgments may be significant in the contextof the statements, estimates andprojections made. These assumptions and
judgments may or may not prove to becorrect and there can be no assurance thatany projected results are attainable or willbe realised. In particular, certainstatements in this Presentation relating tofuture financials, results, plans andexpectations regarding the Company’sbusiness, growth and profitability, as wellas the general economic conditions towhich the Company is exposed, areforward looking by nature and may beaffected by a variety of factors. TheCompany is under no obligation to updateor keep current the information containedin this Presentation, to correct anyinaccuracies which may become apparent,or to publicly announce the result of anyrevision to the statements made herein andany opinions expressed in the Presentationor in any related materials are subject tochange without notice.

Presentation overview
3
2017 highlights & company strategy
Simplified mining & processing flowsheets
Sustainable operating practices
Production & cost review
Outlook and guidance
Mine development

2017 Highlights
4
Production Cash costs(H1 2017)
EBITDA(H1 2017)
Ilmenite pricesNet debt(31 Dec 2017)
Zircon prices
US$131/t↓14% YoY
Ilmenite ~1,000,000t
US$30m↑US$41m YoY
Up strongly+ improving
↓toUS$34m
H1 ’17↑61% YoY + H2 increases
2017 production & cost guidance met

Company Strategy
5
Structured and disciplined approach to capital management
ST Short Term MT Medium Term
Maintain robust balance sheet and generate free cash flow
Increase utilisation rates and revenue capture
Continue to drive down cash costs
Optimise mining capacity for market conditions
Deliver shareholder returns
Balance sheet optimisation
Deliver safe operations

Operations schematic
6

Simplified mining flowsheet
7
Dredge 1 Dredge 2
Supplemental Dry Mining
Wet Concentrator
Plant A
Mining Pond A
Ore
Ore
Mining Pond B
Dredge 3
Wet Concentrator
Plant B
Supplemental Dry Mining
Ore
Ore
Heavy Mineral Concentrate
WCP A HMC Stockpile
WCP B HMC Stockpile
Ore
HMC HMC

Simplified processing flowsheet
8
Wet High Intensity Magnetic Separation
Plant (WHIMS)
WCP A HMC Stockpile
WCP B HMC Stockpile
HMC
Non‐magnetic
concentrate
Magneticconcentrate
Ilmenite Plant A
Ilmenite Plant B
Ilmenite
Wet circuit
Drycircuit
Rutile cleanercircuit
Product Storage
Wet zircon circuit
HMC Stockpile Mineral Separation Plant
Rutile
Zircon
Dry zircon circuit

400
425
450
475
500
Jan Feb Mar Apr May Jun Jul Aug Sep Oct Nov DecOpe
n Area
Decremen
t (Ha
)
Open Area (Actual vs Plan) Actual Open Area (Ha)Planned Open Area (Ha)
Sustainable operating practices
9
Safety performance Retained NOSA 5 star status YTD 9 x LTI’s, LTIFR 0.39 Deterioration in late 2017; focus on behaviours to
rectify performanceEnvironmental performance No significant environmental incidents Successful external environmental audit IFC (2012) action items completed
Malaria Prevention improved 11% in 2017 28% (2,000 day) reduction in work days lost
Rehabilitation performance: Big drive in 2017 to increase rehabilitation 292Ha rehabilitated v 171Ha opened up
0.000.05
0.10
0.150.20
0.25
0.300.35
0.400.45
0
1
2
3
4
5
Jan Feb Mar Apr May Jun Jul Aug Sep Oct Nov Dec
LTIFR
Lost Tim
e Injurie
s
Total Injuries and rolling 12 month LTIFR
No of LTI's 12 month rolling LTIFR Actual LTIFR Budget

Production profile
10
Ilmenite Production (000t) Zircon Production (000t)
2017 guidance met Record levels of production (and shipments) for all products 2018 production impacted by WCP B upgrade and lower HMC & intermediate stockpiles Shipment volumes expected to be maintained, subject to market conditions
* 2018 production range based on guidance given on 11 January 2018.
0
200
400
600
800
1,000
1,20020
13
2014
2015
2016
2017
2018
*0
10
20
30
40
50
60
70
80
2013
2014
2015
2016
2017
2018
*
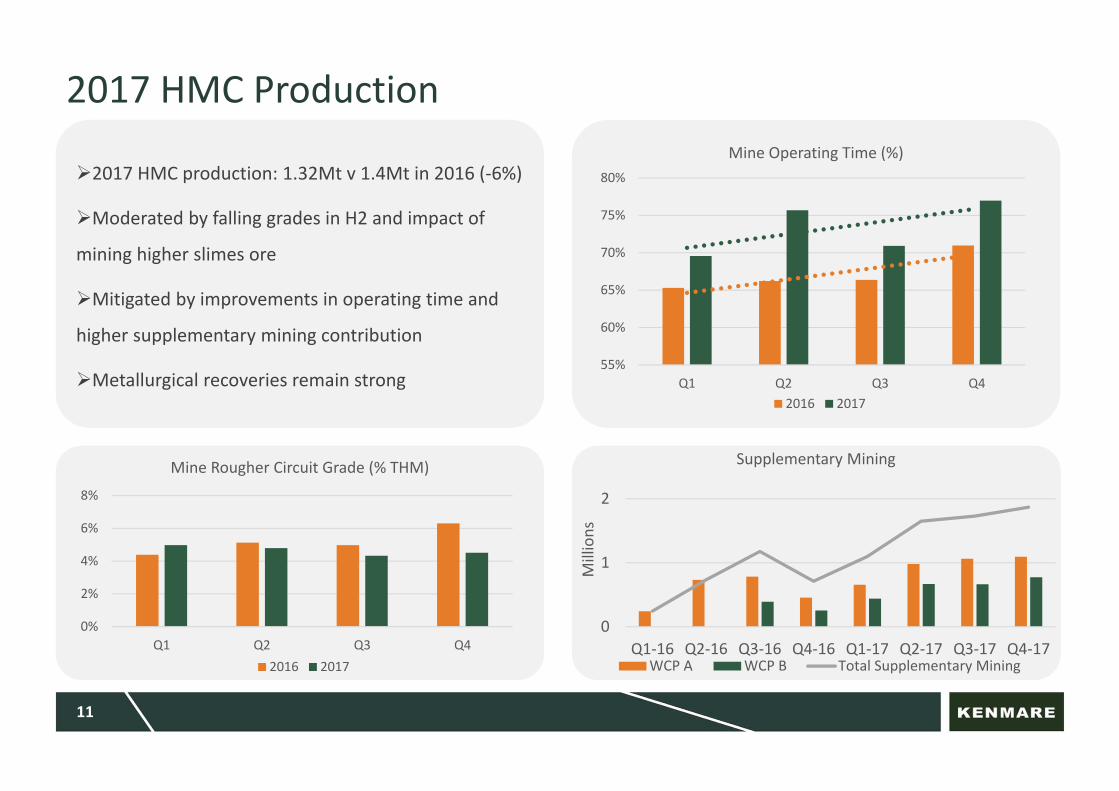
2017 HMC production: 1.32Mt v 1.4Mt in 2016 (‐6%)
Moderated by falling grades in H2 and impact of
mining higher slimes ore
Mitigated by improvements in operating time and
higher supplementary mining contribution
Metallurgical recoveries remain strong
2017 HMC Production
11
0%
2%
4%
6%
8%
Q1 Q2 Q3 Q4
Mine Rougher Circuit Grade (% THM)
2016 2017
55%
60%
65%
70%
75%
80%
Q1 Q2 Q3 Q4
Mine Operating Time (%)
2016 2017
0
1
2
Q1‐16 Q2‐16 Q3‐16 Q4‐16 Q1‐17 Q2‐17 Q3‐17 Q4‐17
Millions
Supplementary Mining
WCP A WCP B Total Supplementary Mining

2017 Production Ilmenite production 998kt (+11% on 2016) Record recoveries @ 91% Drawdown of HMC and intermediate inventories Consistent plant utilisation with improved
reliability
2018 Focus Consolidate higher levels of capacity Continue to improve quality
Ilmenite
12
0
100
200
300
Q1 Q2 Q3 Q4
Thou
sand
s
Quarterly Production
2016 2017
75%
80%
85%
90%
95%
100%
2016‐Q1
2016‐Q2
2016‐Q3
2016‐Q4
2017‐Q1
2017‐Q2
2017‐Q3
2017‐Q4
Ilmenite Recovery %
50%
60%
70%
80%
90%
100%
Q1 Q2 Q3 Q4
MSP Utilisation
2016 2017

2018 Focus Specific projects to maximise recoveries
Transition mineral from secondary to primary
zircon
Build capacity to consume intermediate zircon
stock
Implement new monazite concentrate product
2017 Production Zircon production 74.0kt (+8% on 2016) H2 impacted by lower HMC feed availability Non‐magnetic feed temporarily removed
Lower contamination & higher recoveries Phase 1 of improved process now
commissioned – time lag to process all stock Successfully moved material from secondary to
primary zircon (9% increase in Special grade)
Zircon
13
10
14
18
22
Q1 Q2 Q3 Q4
Thou
sand
s
Total Zircon Tonnes Produced
2016 2017
30%
40%
50%
60%
70%
80%
90%
Q1 Q2 Q3 Q4
Overall Zircon Recovery (Primary and Secondary)
2016 2017

2018 Focus
Continue to clean up product to make a pigment
grade rutile whilst maximising rutile revenue
2017 Production
Rutile production 9.1kt (+17% on 2016)
Improved recoveries in dry mill
Implemented revenue collection for zircon
concentrates (equivalent +33% TiO2 units)
Rutile
14
0.0
0.5
1.0
1.5
2.0
2.5
3.0
Q1 Q2 Q3 Q4
Thou
sand
s
Rutile Production
2016 2017
20%
40%
60%2016‐Q
1
2016‐Q2
2016‐Q3
2016‐Q4
2017‐Q1
2017‐Q2
2017‐Q3
2017‐Q4
Rutile Recovery %

Mine
Production impacted by higher slimes, low HMC
stock and slightly lower grades in 2018
Focus on volume of sand treatment to mitigate
Bolster supplementary mining contribution
Continue utilisation gains
Manage slimes closely
Maintain good recoveries
Develop WCPB upgrade on time within budget
Investigating further automation opportunities
for productivity improvement
Mine & MSP Outlook
15
MSP
Strategy: Maximise HMC feed and recoveries to
maximise final product production
Focus for product recoveries
Metallurgical control
Spillage management
Use Aggreko power in summer months
Deliver existing and develop further
recovery projects
Transition mineral to higher revenue products
Develop new monazite concentrate product

Cash operating costs
^ 2017 costs based on guidance given on 16 January 2017. Final numbers to be provided with FY17 Financial Results.* 2018 numbers based on guidance given on 11 January 2018.Total cash operating costs include all mine production, transhipment, taxes, royalties, and corporate costs.
2017 unit cash costs expected to be within guidance Labour cost savings moderating; Metical & Rand appreciation against the US$
2018 higher expected unit costs largely driven by lower expected production Cost control: strong focus will remain
Continued improvements in maintenance through year Focus on efficiencies in procurement and materials management commenced
500
750
1,000
1,250
$100
$120
$140
$160
$180
$200
$220
2012 2013 2014 2015 2016 2017^ 2018*
Volume (ktton
nes)
Costs (US$/t)
Final Production (RHS) Unit cash costs (LHS)

Guidance
17
2018 Guidance*
ProductionIlmenite kt 900,000‐1,000,000
Zircon kt 65,000‐72,000of which primary kt 42,000‐46,000
of which secondary kt 23,000‐25,000
Rutile kt 7,000‐8,000
CostsTotal cash operating costs US$m 133‐147Cash costs per tonne of finished product US$/t 130‐143
Production in 2018 is expected to moderate, mainly due to lower opening HMC inventories and slightly lower grades, although ilmenite shipment volumes are expected to be maintained as finished goods inventory is drawn down.
Impact of downtime for WCPB upgrade commissioning US$19 million approved for projects & studies in 2018 Sustaining capital costs in 2018 are expected to be approximately US$22 million.
* Guidance provided on 11 January 2018

1 Based on mineral resources and reserves as at 31/12/2016.
Moma is not one orebody
Differing ore zones:
Grades
Size
Mineral assemblage
Orebody knowledge works improved to understand mineability:
Water table
Slimes
Hardness
Provide alternative value enhancing options compared to current long term plan
Pilivili: Highest grade, free flowing sands, good co‐products
Congolone: high quality and good grades
100+ Year Life of Mine
18
Mineral Resources Zone Sand (Mt) % THM*
Congolone 276 3.4Marrua 54 4.1Mpitini 287 3.6Mualadi 327 3.2Namalope 515 3.5Nataka 6,206 2.8Pilivili 296 4.2Quinga North 71 3.5TOTAL RESOURCES 8,031 3.0

Sustaining Production – Near Term
19
Facing grade reduction as Namalope mining is concluded Additional mining capacity required to sustain production levels at around 1Mt ilmenite
per annum
WCPB Upgrade Modification of existing plant providing +20% throughputs (to 2400tph) Project underway using Hatch EPCM contractor Expected delivery H218 $16m capital, negligible impact on operating costs Supplementary mining being increased to deliver additional ore
Namalope Supplementary Mining Operation Small 500tph dredge and wet concentrator plant close to existing operations
Levers off existing mine infrastructure to minimise capital and operating costs Mines wet portion of WCPA dry mining area Approx 10 year life close to MSP Feasibility studies underway Targeting H219 commissioning

Mine Development – Medium Term
20
WCPB completes mining in Namalope at the end of 2020
requires a move to a new ore zone
already built into company plan
Prefeasibility studies show that relocation to Pilivili (rather than
Nataka) is preferred
HMC production will increase to meet MSP capacity
A large scale additional plant is therefore not required in medium
term
Environment Social and Health impact assessment (ESHIA)
underway, submission to MITADER mid 2018
Definitive Feasibility Study (DFS) completion Q1 2019

Mine Development – Long Term
21
WCPA completes mining in Namalope in 2025/26
requires a move to a new ore zone
already built into company plan
Current plan is to move to Nataka, however Congolone presents advantage of:
higher grades
lower slimes and
higher quality ilmenite
Feasibility studies underway to:
Assess optimal mining solution for Congolone
Understand the potential to relocate WCPA
Trade off studies to optimise mine plan

Summary of development
22
Maximising processing efficiency
Improving the higher value product mix for zircon and rutile
Increasing recovery of minerals such as through new monazite project with
negligible operating cost impacts
Strategic goal to increase ilmenite production in a capitally efficient manner
Fully utilise installed infrastructure and plant capacity
Optimised mineplan for grade
Reduces unit operating costs
Increases margins and cashflow stability through the cycle
Further studies underway to firm up the plan


![Page 2 Phone 087 2513126 • 087 2330398 Kenmare News News Feb 2013.pdf · Page 2 Phone 087 2513126 • 087 2330398 Kenmare News Dear Editor, ... wedding album; The wedding [book]](https://img.dokumen.tips/doc/110x75/5b78280a7f8b9a515a8e9ea6/page-2-phone-087-2513126-087-2330398-kenmare-news-feb-2013pdf-page-2-phone.jpg)