Embed Size (px)
Citation preview
Round_3
Master_version_2015 TRA Templates 26102015Bank Name Hellenic Bank Public Company Ltd
LEI Code CXUHEGU3MADZ2CEV7C11
Country Code CY
He
2018 EU-wide Transparency Exercise
201712 201806
(mln EUR, %)As of 31/12/2017 As of 30/06/2018 COREP CODE REGULATION
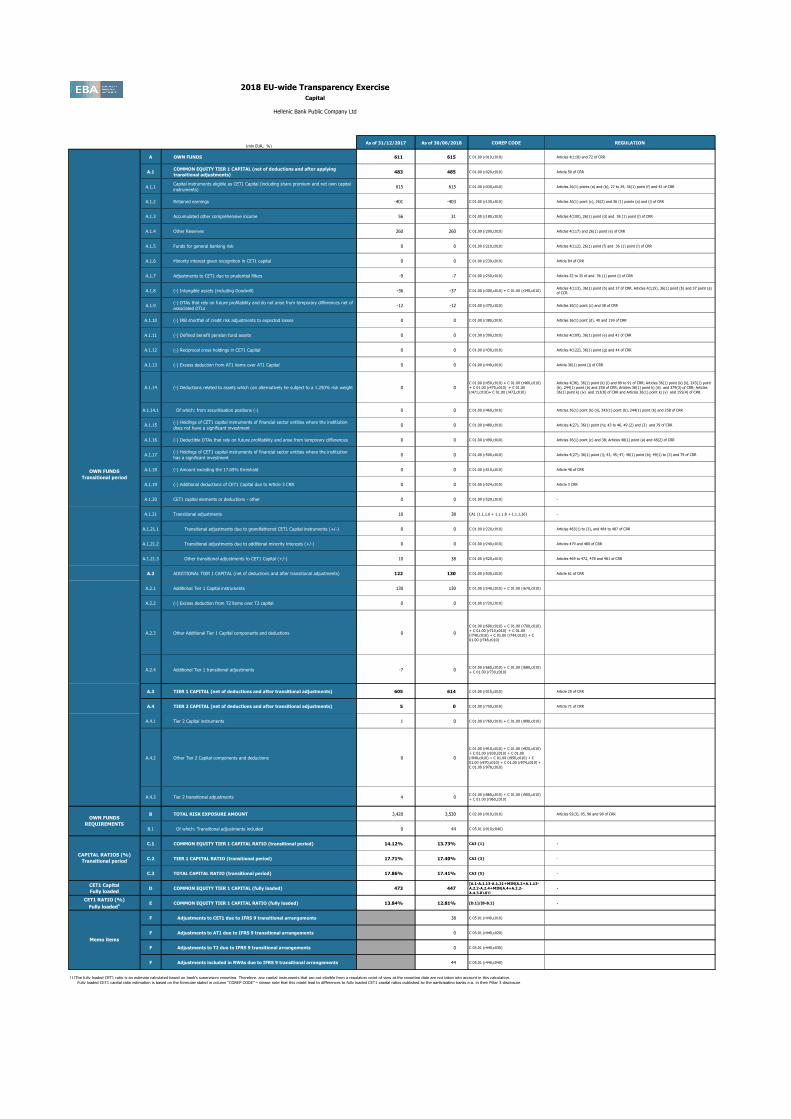
A OWN FUNDS 611 615 C 01.00 (r010,c010) Articles 4(118) and 72 of CRR
A.1COMMON EQUITY TIER 1 CAPITAL (net of deductions and after applying
transitional adjustments)483 485 C 01.00 (r020,c010) Article 50 of CRR
A.1.1Capital instruments eligible as CET1 Capital (including share premium and net own capital
instruments)615 615 C 01.00 (r030,c010) Articles 26(1) points (a) and (b), 27 to 29, 36(1) point (f) and 42 of CRR
A.1.2 Retained earnings -401 -403 C 01.00 (r130,c010) Articles 26(1) point (c), 26(2) and 36 (1) points (a) and (l) of CRR
A.1.3 Accumulated other comprehensive income 56 31 C 01.00 (r180,c010) Articles 4(100), 26(1) point (d) and 36 (1) point (l) of CRR
A.1.4 Other Reserves 260 260 C 01.00 (r200,c010) Articles 4(117) and 26(1) point (e) of CRR
A.1.5 Funds for general banking risk 0 0 C 01.00 (r210,c010) Articles 4(112), 26(1) point (f) and 36 (1) point (l) of CRR
A.1.6 Minority interest given recognition in CET1 capital 0 0 C 01.00 (r230,c010) Article 84 of CRR
A.1.7 Adjustments to CET1 due to prudential filters -9 -7 C 01.00 (r250,c010) Articles 32 to 35 of and 36 (1) point (l) of CRR
A.1.8 (-) Intangible assets (including Goodwill) -36 -37 C 01.00 (r300,c010) + C 01.00 (r340,c010) Articles 4(113), 36(1) point (b) and 37 of CRR. Articles 4(115), 36(1) point (b) and 37 point (a)
of CCR
A.1.9(-) DTAs that rely on future profitability and do not arise from temporary differences net of
associated DTLs -12 -12 C 01.00 (r370,c010) Articles 36(1) point (c) and 38 of CRR
A.1.10 (-) IRB shortfall of credit risk adjustments to expected losses 0 0 C 01.00 (r380,c010) Articles 36(1) point (d), 40 and 159 of CRR
A.1.11 (-) Defined benefit pension fund assets 0 0 C 01.00 (r390,c010) Articles 4(109), 36(1) point (e) and 41 of CRR
A.1.12 (-) Reciprocal cross holdings in CET1 Capital 0 0 C 01.00 (r430,c010) Articles 4(122), 36(1) point (g) and 44 of CRR
A.1.13 (-) Excess deduction from AT1 items over AT1 Capital 0 0 C 01.00 (r440,c010) Article 36(1) point (j) of CRR
A.1.14 (-) Deductions related to assets which can alternatively be subject to a 1.250% risk weight 0 0C 01.00 (r450,c010) + C 01.00 (r460,c010)
+ C 01.00 (r470,c010) + C 01.00
(r471,c010)+ C 01.00 (r472,c010)
Articles 4(36), 36(1) point (k) (i) and 89 to 91 of CRR; Articles 36(1) point (k) (ii), 243(1) point
(b), 244(1) point (b) and 258 of CRR; Articles 36(1) point k) (iii) and 379(3) of CRR; Articles
36(1) point k) (iv) and 153(8) of CRR and Articles 36(1) point k) (v) and 155(4) of CRR.
A.1.14.1 Of which: from securitisation positions (-) 0 0 C 01.00 (r460,c010) Articles 36(1) point (k) (ii), 243(1) point (b), 244(1) point (b) and 258 of CRR
A.1.15(-) Holdings of CET1 capital instruments of financial sector entities where the institiution
does not have a significant investment0 0 C 01.00 (r480,c010) Articles 4(27), 36(1) point (h); 43 to 46, 49 (2) and (3) and 79 of CRR
A.1.16 (-) Deductible DTAs that rely on future profitability and arise from temporary differences 0 0 C 01.00 (r490,c010) Articles 36(1) point (c) and 38; Articles 48(1) point (a) and 48(2) of CRR
A.1.17(-) Holdings of CET1 capital instruments of financial sector entities where the institiution
has a significant investment0 0 C 01.00 (r500,c010) Articles 4(27); 36(1) point (i); 43, 45; 47; 48(1) point (b); 49(1) to (3) and 79 of CRR
A.1.18 (-) Amount exceding the 17.65% threshold 0 0 C 01.00 (r510,c010) Article 48 of CRR
A.1.19 (-) Additional deductions of CET1 Capital due to Article 3 CRR 0 0 C 01.00 (r524,c010) Article 3 CRR
A.1.20 CET1 capital elements or deductions - other 0 0 C 01.00 (r529,c010) -
A.1.21 Transitional adjustments 10 38 CA1 {1.1.1.6 + 1.1.1.8 + 1.1.1.26} -
A.1.21.1 Transitional adjustments due to grandfathered CET1 Capital instruments (+/-) 0 0 C 01.00 (r220,c010) Articles 483(1) to (3), and 484 to 487 of CRR
A.1.21.2 Transitional adjustments due to additional minority interests (+/-) 0 0 C 01.00 (r240,c010) Articles 479 and 480 of CRR
A.1.21.3 Other transitional adjustments to CET1 Capital (+/-) 10 38 C 01.00 (r520,c010) Articles 469 to 472, 478 and 481 of CRR
A.2 ADDITIONAL TIER 1 CAPITAL (net of deductions and after transitional adjustments) 122 130 C 01.00 (r530,c010) Article 61 of CRR
A.2.1 Additional Tier 1 Capital instruments 130 130 C 01.00 (r540,c010) + C 01.00 (r670,c010)
A.2.2 (-) Excess deduction from T2 items over T2 capital 0 0 C 01.00 (r720,c010)
A.2.3 Other Additional Tier 1 Capital components and deductions 0 0
C 01.00 (r690,c010) + C 01.00 (r700,c010)
+ C 01.00 (r710,c010) + C 01.00
(r740,c010) + C 01.00 (r744,c010) + C
01.00 (r748,c010)
A.2.4 Additional Tier 1 transitional adjustments -7 0C 01.00 (r660,c010) + C 01.00 (r680,c010)
+ C 01.00 (r730,c010)
A.3 TIER 1 CAPITAL (net of deductions and after transitional adjustments) 605 614 C 01.00 (r015,c010) Article 25 of CRR
A.4 TIER 2 CAPITAL (net of deductions and after transitional adjustments) 5 0 C 01.00 (r750,c010) Article 71 of CRR
A.4.1 Tier 2 Capital instruments 1 0 C 01.00 (r760,c010) + C 01.00 (r890,c010)
A.4.2 Other Tier 2 Capital components and deductions 0 0
C 01.00 (r910,c010) + C 01.00 (r920,c010)
+ C 01.00 (r930,c010) + C 01.00
(r940,c010) + C 01.00 (r950,c010) + C
01.00 (r970,c010) + C 01.00 (r974,c010) +
C 01.00 (r978,c010)
A.4.3 Tier 2 transitional adjustments 4 0C 01.00 (r880,c010) + C 01.00 (r900,c010)
+ C 01.00 (r960,c010)
B TOTAL RISK EXPOSURE AMOUNT 3,420 3,530 C 02.00 (r010,c010) Articles 92(3), 95, 96 and 98 of CRR
B.1 Of which: Transitional adjustments included 0 44 C 05.01 (r010;c040)
C.1 COMMON EQUITY TIER 1 CAPITAL RATIO (transitional period) 14.12% 13.73% CA3 {1} -
C.2 TIER 1 CAPITAL RATIO (transitional period) 17.71% 17.40% CA3 {3} -
C.3 TOTAL CAPITAL RATIO (transitional period) 17.86% 17.41% CA3 {5} -
CET1 Capital
Fully loadedD COMMON EQUITY TIER 1 CAPITAL (fully loaded) 473 447
[A.1-A.1.13-A.1.21+MIN(A.2+A.1.13-
A.2.2-A.2.4+MIN(A.4+A.2.2-
A.4.3,0),0)]
-
CET1 RATIO (%)
Fully loaded1 E COMMON EQUITY TIER 1 CAPITAL RATIO (fully loaded) 13.84% 12.81% [D.1]/[B-B.1] -
F Adjustments to CET1 due to IFRS 9 transitional arrangements 38 C 05.01 (r440,c010)
F Adjustments to AT1 due to IFRS 9 transitional arrangements 0 C 05.01 (r440,c020)
F Adjustments to T2 due to IFRS 9 transitional arrangements 0 C 05.01 (r440,c030)
F Adjustments included in RWAs due to IFRS 9 transitional arrangements 44 C 05.01 (r440,c040)
(1)The fully loaded CET1 ratio is an estimate calculated based on bank’s supervisory reporting. Therefore, any capital instruments that are not eligible from a regulatory point of view at the reporting date are not taken into account in this calculation.
Fully loaded CET1 capital ratio estimation is based on the formulae stated in column “COREP CODE” – please note that this might lead to differences to fully loaded CET1 capital ratios published by the participating banks e.g. in their Pillar 3 disclosure
Memo items
2018 EU-wide Transparency Exercise
Capital
Hellenic Bank Public Company Ltd
OWN FUNDS
Transitional period
OWN FUNDS
REQUIREMENTS
CAPITAL RATIOS (%)
Transitional period
201712 201806
(mln EUR, %)
As of
31/12/2017
As of
30/06/2018COREP CODE REGULATION
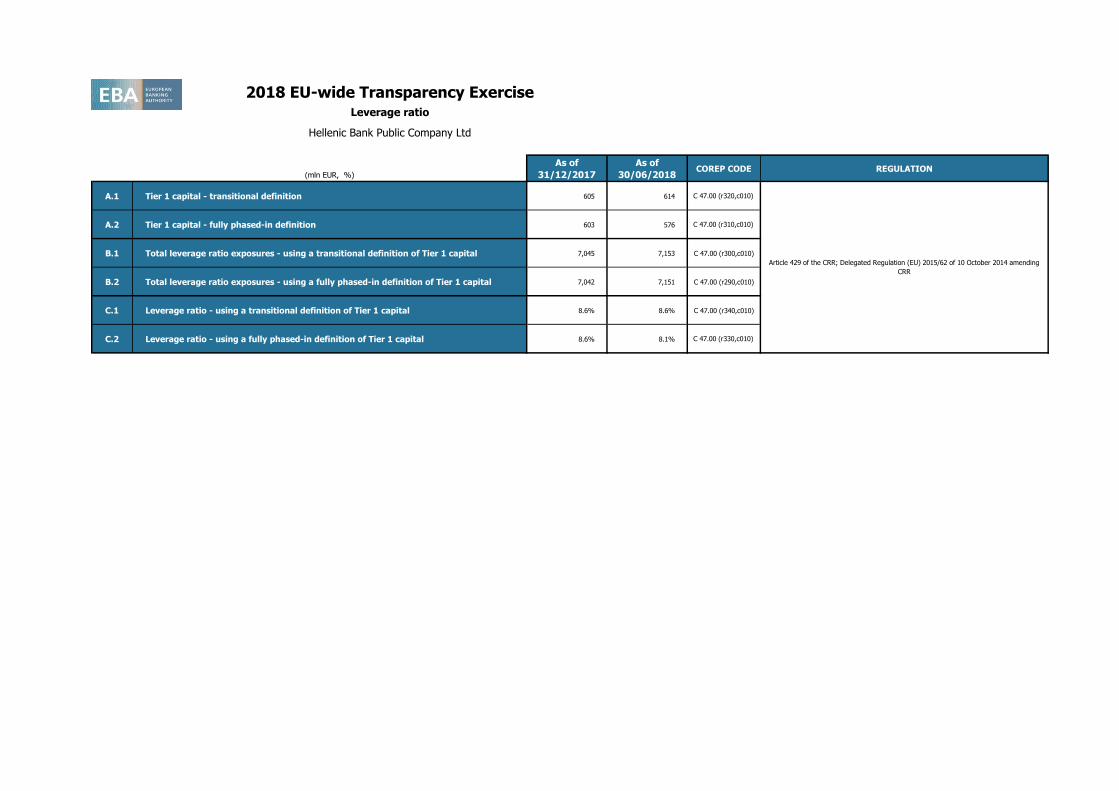
A.1 Tier 1 capital - transitional definition 605 614 C 47.00 (r320,c010)
A.2 Tier 1 capital - fully phased-in definition 603 576 C 47.00 (r310,c010)
B.1 Total leverage ratio exposures - using a transitional definition of Tier 1 capital 7,045 7,153 C 47.00 (r300,c010)
B.2 Total leverage ratio exposures - using a fully phased-in definition of Tier 1 capital 7,042 7,151 C 47.00 (r290,c010)
C.1 Leverage ratio - using a transitional definition of Tier 1 capital 8.6% 8.6% C 47.00 (r340,c010)
C.2 Leverage ratio - using a fully phased-in definition of Tier 1 capital 8.6% 8.1% C 47.00 (r330,c010)
2018 EU-wide Transparency ExerciseLeverage ratio
Hellenic Bank Public Company Ltd
Article 429 of the CRR; Delegated Regulation (EU) 2015/62 of 10 October 2014 amending
CRR
201712 201806
(mln EUR)
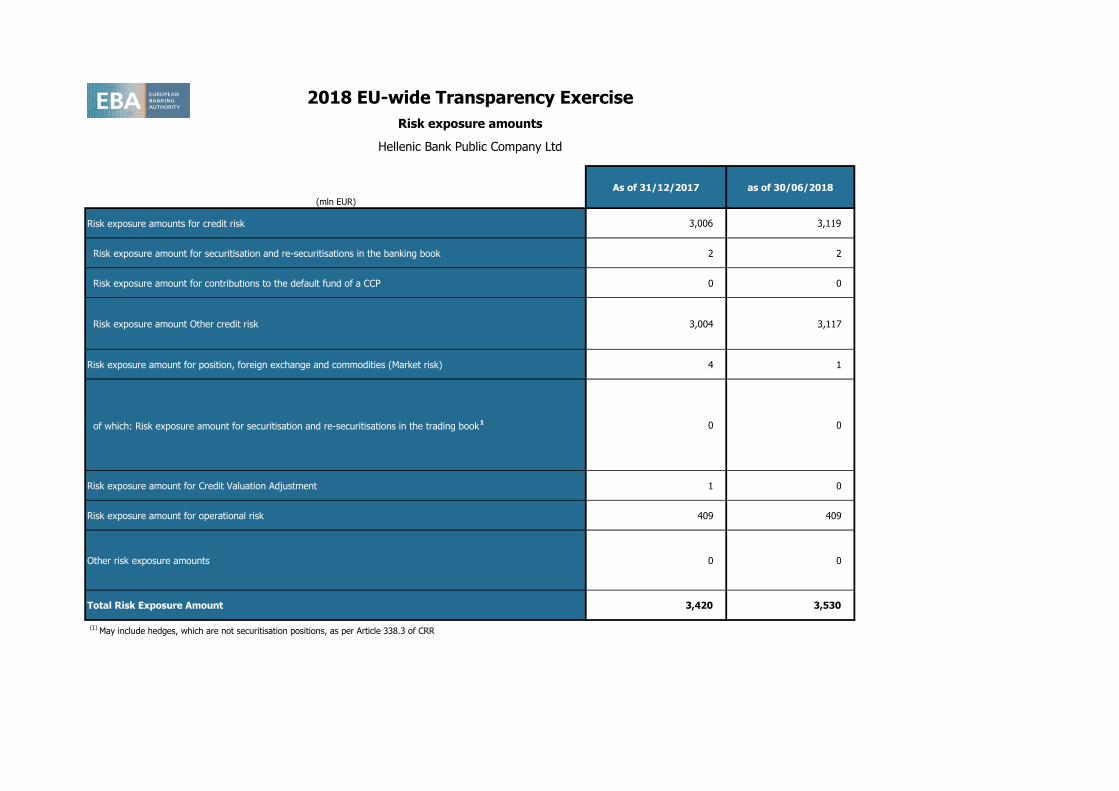
As of 31/12/2017 as of 30/06/2018
Risk exposure amounts for credit risk 3,006 3,119
Risk exposure amount for securitisation and re-securitisations in the banking book 2 2
Risk exposure amount for contributions to the default fund of a CCP 0 0
Risk exposure amount Other credit risk 3,004 3,117
Risk exposure amount for position, foreign exchange and commodities (Market risk) 4 1
of which: Risk exposure amount for securitisation and re-securitisations in the trading book1 0 0
Risk exposure amount for Credit Valuation Adjustment 1 0
Risk exposure amount for operational risk 409 409
Other risk exposure amounts 0 0
Total Risk Exposure Amount 3,420 3,530
(1)
May include hedges, which are not securitisation positions, as per Article 338.3 of CRR
2018 EU-wide Transparency Exercise
Risk exposure amounts
Hellenic Bank Public Company Ltd
201712 201806
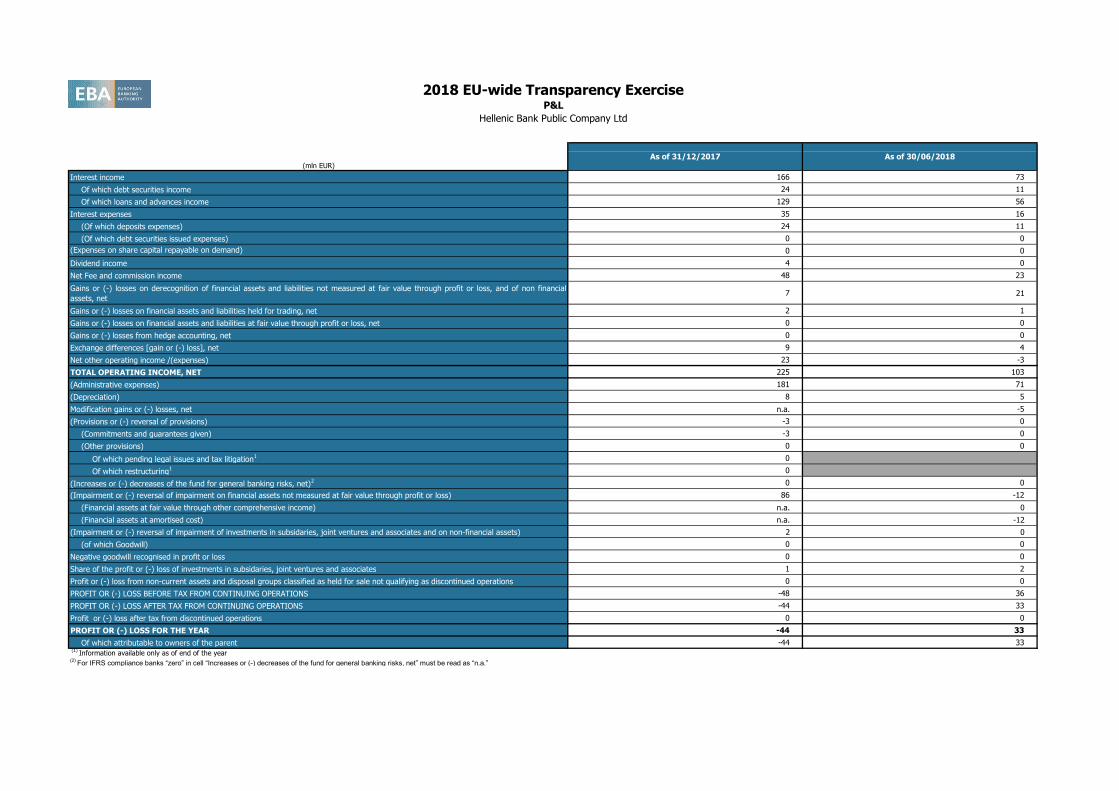
(mln EUR)
Interest income 166 73
Of which debt securities income 24 11
Of which loans and advances income 129 56
Interest expenses 35 16
(Of which deposits expenses) 24 11
(Of which debt securities issued expenses) 0 0
(Expenses on share capital repayable on demand) 0 0
Dividend income 4 0
Net Fee and commission income 48 23
Gains or (-) losses on derecognition of financial assets and liabilities not measured at fair value through profit or loss, and of non financial
assets, net7 21
Gains or (-) losses on financial assets and liabilities held for trading, net 2 1
Gains or (-) losses on financial assets and liabilities at fair value through profit or loss, net 0 0
Gains or (-) losses from hedge accounting, net 0 0
Exchange differences [gain or (-) loss], net 9 4
Net other operating income /(expenses) 23 -3
TOTAL OPERATING INCOME, NET 225 103
(Administrative expenses) 181 71
(Depreciation) 8 5
Modification gains or (-) losses, net n.a. -5
(Provisions or (-) reversal of provisions) -3 0
(Commitments and guarantees given) -3 0
(Other provisions) 0 0
Of which pending legal issues and tax litigation1 0
Of which restructuring1 0
(Increases or (-) decreases of the fund for general banking risks, net)2 0 0
(Impairment or (-) reversal of impairment on financial assets not measured at fair value through profit or loss) 86 -12
(Financial assets at fair value through other comprehensive income) n.a. 0
(Financial assets at amortised cost) n.a. -12
(Impairment or (-) reversal of impairment of investments in subsidaries, joint ventures and associates and on non-financial assets) 2 0
(of which Goodwill) 0 0
Negative goodwill recognised in profit or loss 0 0
Share of the profit or (-) loss of investments in subsidaries, joint ventures and associates 1 2
Profit or (-) loss from non-current assets and disposal groups classified as held for sale not qualifying as discontinued operations 0 0
PROFIT OR (-) LOSS BEFORE TAX FROM CONTINUING OPERATIONS -48 36
PROFIT OR (-) LOSS AFTER TAX FROM CONTINUING OPERATIONS -44 33
Profit or (-) loss after tax from discontinued operations 0 0
PROFIT OR (-) LOSS FOR THE YEAR -44 33
Of which attributable to owners of the parent -44 33 (1)
Information available only as of end of the year(2)
For IFRS compliance banks “zero” in cell “Increases or (-) decreases of the fund for general banking risks, net” must be read as “n.a.”
2018 EU-wide Transparency ExerciseP&L
Hellenic Bank Public Company Ltd
As of 31/12/2017 As of 30/06/2018
201712 201806 201712 201712 201712 201712 201712 201712 201712 201712 201712 201712 201806 201806 201806 201806 201806 201806 201806 201806 201806 201806
As of 31/12/2017 As of 30/06/2018
(mln EUR)
MULTIPLICATION
FACTOR (mc) x
AVERAGE OF
PREVIOUS 60
WORKING DAYS
(VaRavg)
PREVIOUS
DAY (VaRt-1)
MULTIPLICATION
FACTOR (ms) x
AVERAGE OF
PREVIOUS 60
WORKING DAYS
(SVaRavg)
LATEST AVAILABLE
(SVaRt-1)
12 WEEKS
AVERAGE
MEASURE
LAST MEASURE FLOOR
12 WEEKS
AVERAGE
MEASURE
LAST
MEASURE
MULTIPLICATION
FACTOR (mc) x
AVERAGE OF
PREVIOUS 60
WORKING DAYS
(VaRavg)
PREVIOUS DAY
(VaRt-1)
MULTIPLICATION
FACTOR (ms) x
AVERAGE OF
PREVIOUS 60
WORKING DAYS
(SVaRavg)
LATEST
AVAILABLE (SVaRt-
1)
12 WEEKS
AVERAGE
MEASURE
LAST
MEASUREFLOOR
12 WEEKS
AVERAGE
MEASURE
LAST
MEASURE
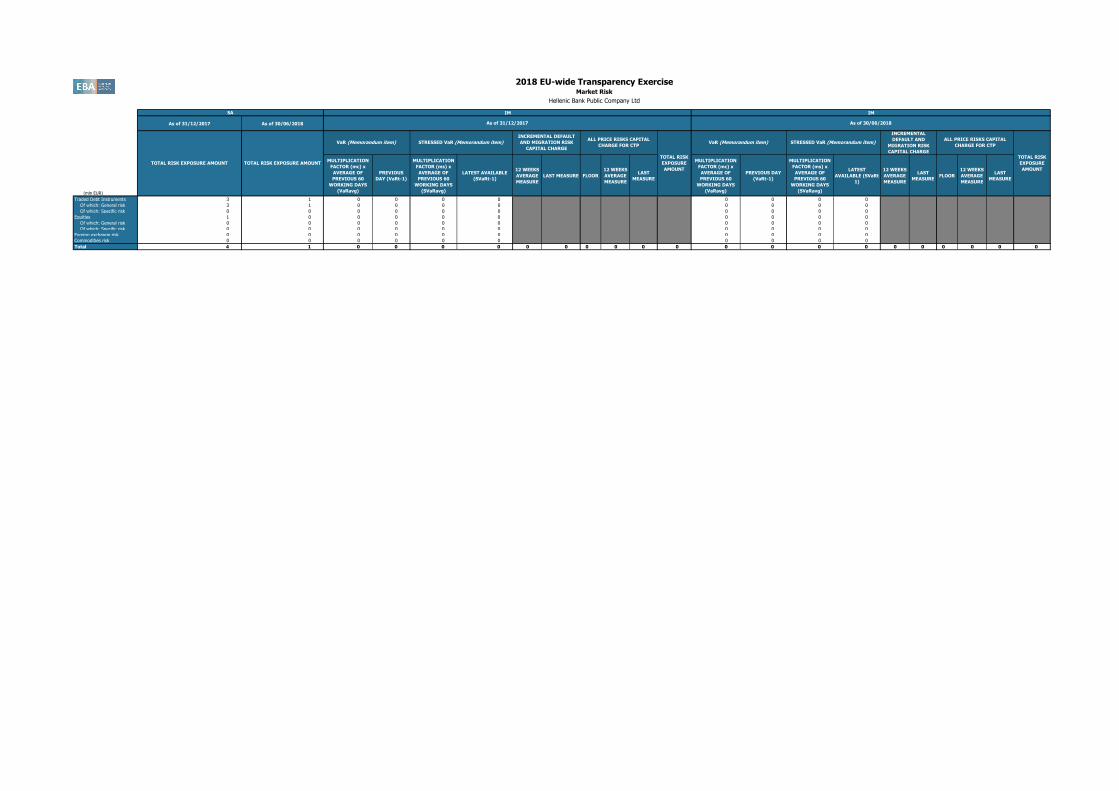
Traded Debt Instruments 3 1 0 0 0 0 0 0 0 0
Of which: General risk 3 1 0 0 0 0 0 0 0 0
Of which: Specific risk 0 0 0 0 0 0 0 0 0 0
Equities 1 0 0 0 0 0 0 0 0 0
Of which: General risk 0 0 0 0 0 0 0 0 0 0
Of which: Specific risk 0 0 0 0 0 0 0 0 0 0
Foreign exchange risk 0 0 0 0 0 0 0 0 0 0
Commodities risk 0 0 0 0 0 0 0 0 0 0
Total 4 1 0 0 0 0 0 0 0 0 0 0 0 0 0 0 0 0 0 0 0 0
2018 EU-wide Transparency ExerciseMarket Risk
Hellenic Bank Public Company Ltd
SA IM IM
TOTAL RISK EXPOSURE AMOUNT TOTAL RISK EXPOSURE AMOUNT
VaR (Memorandum item) STRESSED VaR (Memorandum item)
INCREMENTAL DEFAULT
AND MIGRATION RISK
CAPITAL CHARGE
STRESSED VaR (Memorandum item)
INCREMENTAL
DEFAULT AND
MIGRATION RISK
CAPITAL CHARGE
ALL PRICE RISKS CAPITAL
CHARGE FOR CTP
TOTAL RISK
EXPOSURE
AMOUNT
As of 31/12/2017 As of 30/06/2018
ALL PRICE RISKS CAPITAL
CHARGE FOR CTP
TOTAL RISK
EXPOSURE
AMOUNT
VaR (Memorandum item)
201712 201712 201712 201712 201806 201806 201806 201806
(mln EUR, %)
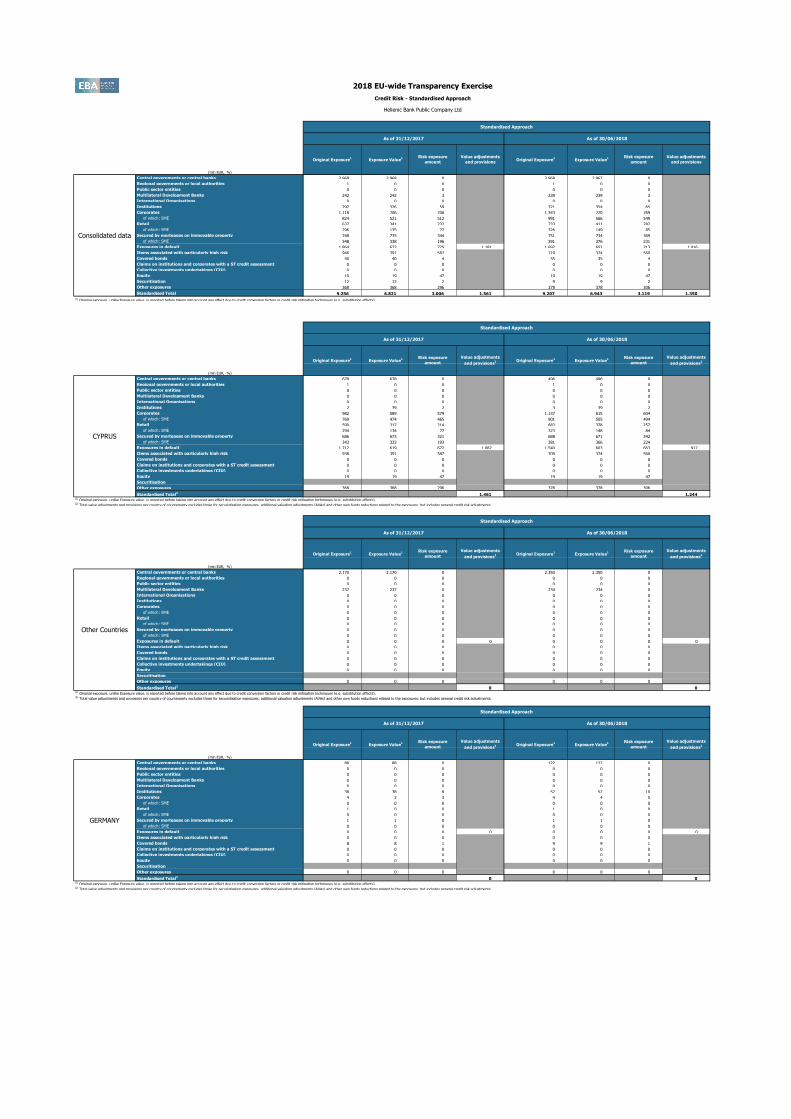
Central governments or central banks 2,968 2,968 0 2,968 2,967 0
Regional governments or local authorities 1 0 0 1 0 0
Public sector entities 0 0 0 0 0 0
Multilateral Development Banks 242 242 3 239 239 3
International Organisations 0 0 0 0 0 0
Institutions 292 326 59 321 354 65
Corporates 1,118 706 706 1,343 770 769
of which: SME 824 521 512 991 566 549
Retail 637 341 232 733 411 282
of which: SME 296 135 77 326 149 85
Secured by mortgages on immovable property 748 735 344 751 734 369
of which: SME 348 338 196 391 376 231
Exposures in default 1,864 672 725 1,181 1,692 652 713 1,016
Items associated with particularly high risk 946 391 587 719 374 560
Covered bonds 40 40 4 35 35 4
Claims on institutions and corporates with a ST credit assessment 0 0 0 0 0 0
Collective investments undertakings (CIU) 0 0 0 0 0 0
Equity 19 19 47 19 19 47
Securitisation 12 12 2 9 9 2
Other exposures 368 368 296 378 378 306
Standardised Total 9,256 6,821 3,006 1,561 9,207 6,943 3,119 1,350(1) Original exposure, unlike Exposure value, is reported before taking into account any effect due to credit conversion factors or credit risk mitigation techniques (e.g. substitution effects).
1 (mln EUR, %)
Central governments or central banks 678 678 0 496 496 0
Regional governments or local authorities 1 0 0 1 0 0
Public sector entities 0 0 0 0 0 0
Multilateral Development Banks 0 0 0 0 0 0
International Organisations 0 0 0 0 0 0
Institutions 2 39 2 3 39 2
Corporates 982 589 579 1,137 615 604
of which: SME 769 474 465 901 505 494
Retail 599 317 214 683 378 257
of which: SME 294 134 77 323 148 84
Secured by mortgages on immovable property 686 673 321 688 671 342
of which: SME 343 333 193 381 366 224
Exposures in default 1,712 619 672 1,082 1,540 603 663 912
Items associated with particularly high risk 938 391 587 709 374 560
Covered bonds 0 0 0 0 0 0
Claims on institutions and corporates with a ST credit assessment 0 0 0 0 0 0
Collective investments undertakings (CIU) 0 0 0 0 0 0
Equity 19 19 47 19 19 47
Securitisation
Other exposures 368 368 296 378 378 306
Standardised Total2
1,461 1,244(1) Original exposure, unlike Exposure value, is reported before taking into account any effect due to credit conversion factors or credit risk mitigation techniques (e.g. substitution effects). (2) Total value adjustments and provisions per country of counterparty excludes those for securistisation exposures, additional valuation adjustments (AVAs) and other own funds reductions related to the exposures, but includes general credit risk adjustments.
2 (mln EUR, %)
Central governments or central banks 2,170 2,170 0 2,350 2,350 0
Regional governments or local authorities 0 0 0 0 0 0
Public sector entities 0 0 0 0 0 0
Multilateral Development Banks 237 237 0 234 234 0
International Organisations 0 0 0 0 0 0
Institutions 0 0 0 0 0 0
Corporates 0 0 0 0 0 0
of which: SME 0 0 0 0 0 0
Retail 0 0 0 0 0 0
of which: SME 0 0 0 0 0 0
Secured by mortgages on immovable property 0 0 0 0 0 0
of which: SME 0 0 0 0 0 0
Exposures in default 0 0 0 0 0 0 0 0
Items associated with particularly high risk 0 0 0 0 0 0
Covered bonds 0 0 0 0 0 0
Claims on institutions and corporates with a ST credit assessment 0 0 0 0 0 0
Collective investments undertakings (CIU) 0 0 0 0 0 0
Equity 0 0 0 0 0 0
Securitisation
Other exposures 0 0 0 0 0 0
Standardised Total2
0 0(1) Original exposure, unlike Exposure value, is reported before taking into account any effect due to credit conversion factors or credit risk mitigation techniques (e.g. substitution effects). (2) Total value adjustments and provisions per country of counterparty excludes those for securistisation exposures, additional valuation adjustments (AVAs) and other own funds reductions related to the exposures, but includes general credit risk adjustments.
3 (mln EUR, %)
Central governments or central banks 88 88 0 122 122 0
Regional governments or local authorities 0 0 0 0 0 0
Public sector entities 0 0 0 0 0 0
Multilateral Development Banks 0 0 0 0 0 0
International Organisations 0 0 0 0 0 0
Institutions 38 38 8 52 52 10
Corporates 4 2 3 4 4 5
of which: SME 0 0 0 0 0 0
Retail 1 0 0 1 0 0
of which: SME 0 0 0 0 0 0
Secured by mortgages on immovable property 1 1 0 1 1 0
of which: SME 0 0 0 0 0 0
Exposures in default 0 0 0 0 0 0 0 0
Items associated with particularly high risk 0 0 0 0 0 0
Covered bonds 8 8 1 9 9 1
Claims on institutions and corporates with a ST credit assessment 0 0 0 0 0 0
Collective investments undertakings (CIU) 0 0 0 0 0 0
Equity 0 0 0 0 0 0
Securitisation
Other exposures 0 0 0 0 0 0
Standardised Total2
0 0(1) Original exposure, unlike Exposure value, is reported before taking into account any effect due to credit conversion factors or credit risk mitigation techniques (e.g. substitution effects). (2) Total value adjustments and provisions per country of counterparty excludes those for securistisation exposures, additional valuation adjustments (AVAs) and other own funds reductions related to the exposures, but includes general credit risk adjustments.
2018 EU-wide Transparency Exercise
Credit Risk - Standardised Approach
Hellenic Bank Public Company Ltd
Standardised Approach
As of 31/12/2017 As of 30/06/2018
Risk exposure
amount
Value adjustments
and provisions
Consolidated data
Standardised Approach
As of 31/12/2017 As of 30/06/2018
Original Exposure1
Exposure Value1 Risk exposure
amount
Value adjustments
and provisionsOriginal Exposure
1 Exposure Value
1
Risk exposure
amount
Value adjustments
and provisions2
CYPRUS
Standardised Approach
As of 31/12/2017 As of 30/06/2018
Original Exposure1
Exposure Value1 Risk exposure
amount
Value adjustments
and provisions2 Original Exposure
1 Exposure Value
1
Risk exposure
amount
Value adjustments
and provisions2
Other Countries
Standardised Approach
As of 31/12/2017 As of 30/06/2018
Original Exposure1
Exposure Value1 Risk exposure
amount
Value adjustments
and provisions2 Original Exposure
1 Exposure Value
1
Risk exposure
amount
Value adjustments
and provisions2
GERMANY
Original Exposure1
Exposure Value1 Risk exposure
amount
Value adjustments
and provisions2 Original Exposure
1 Exposure Value
1
201712 201712 201712 201712 201806 201806 201806 201806
2018 EU-wide Transparency Exercise
Credit Risk - Standardised Approach
Hellenic Bank Public Company Ltd
Standardised Approach
4 (mln EUR, %)
Central governments or central banks 0 0 0 0 0 0
Regional governments or local authorities 0 0 0 0 0 0
Public sector entities 0 0 0 0 0 0
Multilateral Development Banks 0 0 0 0 0 0
International Organisations 0 0 0 0 0 0
Institutions 6 6 1 8 8 2
Corporates 6 6 6 13 13 16
of which: SME 0 0 0 0 0 0
Retail 12 9 7 14 10 8
of which: SME 0 0 0 0 0 0
Secured by mortgages on immovable property 18 18 6 16 15 5
of which: SME 0 0 0 0 0 0
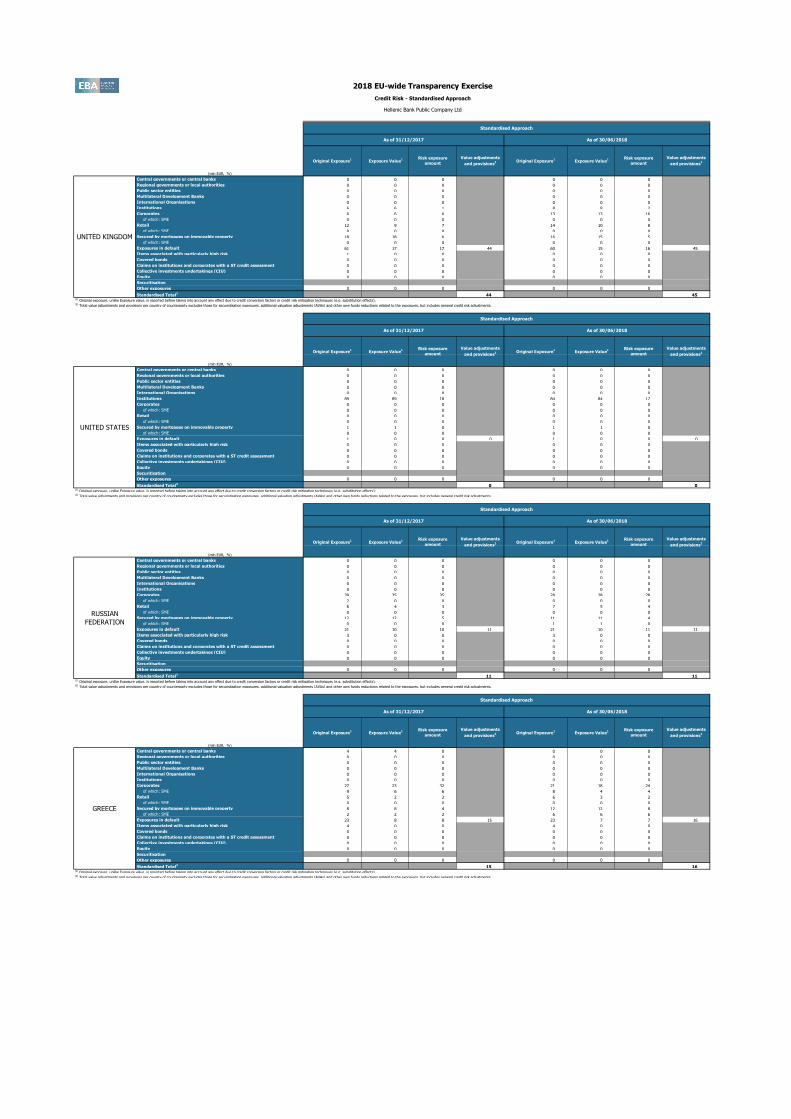
Exposures in default 61 17 17 44 60 15 16 45
Items associated with particularly high risk 1 0 0 0 0 0
Covered bonds 0 0 0 0 0 0
Claims on institutions and corporates with a ST credit assessment 0 0 0 0 0 0
Collective investments undertakings (CIU) 0 0 0 0 0 0
Equity 0 0 0 0 0 0
Securitisation
Other exposures 0 0 0 0 0 0
Standardised Total2
44 45(1) Original exposure, unlike Exposure value, is reported before taking into account any effect due to credit conversion factors or credit risk mitigation techniques (e.g. substitution effects). (2) Total value adjustments and provisions per country of counterparty excludes those for securistisation exposures, additional valuation adjustments (AVAs) and other own funds reductions related to the exposures, but includes general credit risk adjustments.
5 (mln EUR, %)
Central governments or central banks 0 0 0 0 0 0
Regional governments or local authorities 0 0 0 0 0 0
Public sector entities 0 0 0 0 0 0
Multilateral Development Banks 0 0 0 0 0 0
International Organisations 0 0 0 0 0 0
Institutions 89 89 18 84 84 17
Corporates 0 0 0 0 0 0
of which: SME 0 0 0 0 0 0
Retail 0 0 0 0 0 0
of which: SME 0 0 0 0 0 0
Secured by mortgages on immovable property 1 1 0 1 1 0
of which: SME 0 0 0 0 0 0
Exposures in default 1 0 0 0 1 0 0 0
Items associated with particularly high risk 0 0 0 0 0 0
Covered bonds 0 0 0 0 0 0
Claims on institutions and corporates with a ST credit assessment 0 0 0 0 0 0
Collective investments undertakings (CIU) 0 0 0 0 0 0
Equity 0 0 0 0 0 0
Securitisation
Other exposures 0 0 0 0 0 0
Standardised Total2
0 0(1) Original exposure, unlike Exposure value, is reported before taking into account any effect due to credit conversion factors or credit risk mitigation techniques (e.g. substitution effects). (2) Total value adjustments and provisions per country of counterparty excludes those for securistisation exposures, additional valuation adjustments (AVAs) and other own funds reductions related to the exposures, but includes general credit risk adjustments.
6 (mln EUR, %)
Central governments or central banks 0 0 0 0 0 0
Regional governments or local authorities 0 0 0 0 0 0
Public sector entities 0 0 0 0 0 0
Multilateral Development Banks 0 0 0 0 0 0
International Organisations 0 0 0 0 0 0
Institutions 0 0 0 0 0 0
Corporates 39 35 35 28 28 28
of which: SME 2 0 0 0 0 0
Retail 6 4 3 7 5 4
of which: SME 0 0 0 0 0 0
Secured by mortgages on immovable property 12 12 5 11 11 4
of which: SME 0 0 0 1 1 0
Exposures in default 21 10 10 11 21 10 11 11
Items associated with particularly high risk 3 0 0 3 0 0
Covered bonds 0 0 0 0 0 0
Claims on institutions and corporates with a ST credit assessment 0 0 0 0 0 0
Collective investments undertakings (CIU) 0 0 0 0 0 0
Equity 0 0 0 0 0 0
Securitisation
Other exposures 0 0 0 0 0 0
Standardised Total2
11 11(1) Original exposure, unlike Exposure value, is reported before taking into account any effect due to credit conversion factors or credit risk mitigation techniques (e.g. substitution effects). (2) Total value adjustments and provisions per country of counterparty excludes those for securistisation exposures, additional valuation adjustments (AVAs) and other own funds reductions related to the exposures, but includes general credit risk adjustments.
7 (mln EUR, %)
Central governments or central banks 4 4 0 0 0 0
Regional governments or local authorities 0 0 0 0 0 0
Public sector entities 0 0 0 0 0 0
Multilateral Development Banks 0 0 0 0 0 0
International Organisations 0 0 0 0 0 0
Institutions 0 0 0 0 0 0
Corporates 27 23 32 21 18 24
of which: SME 9 6 6 8 4 4
Retail 5 2 2 6 3 2
of which: SME 0 0 0 0 0 0
Secured by mortgages on immovable property 8 8 4 12 12 8
of which: SME 2 2 2 6 6 6
Exposures in default 23 8 8 15 23 7 7 16
Items associated with particularly high risk 4 0 0 4 0 0
Covered bonds 0 0 0 0 0 0
Claims on institutions and corporates with a ST credit assessment 0 0 0 0 0 0
Collective investments undertakings (CIU) 0 0 0 0 0 0
Equity 0 0 0 0 0 0
Securitisation
Other exposures 0 0 0 0 0 0
Standardised Total2
15 16(1) Original exposure, unlike Exposure value, is reported before taking into account any effect due to credit conversion factors or credit risk mitigation techniques (e.g. substitution effects). (2) Total value adjustments and provisions per country of counterparty excludes those for securistisation exposures, additional valuation adjustments (AVAs) and other own funds reductions related to the exposures, but includes general credit risk adjustments.
Standardised Approach
As of 31/12/2017 As of 30/06/2018
Risk exposure
amount
Value adjustments
and provisions2
UNITED KINGDOM
Standardised Approach
As of 31/12/2017 As of 30/06/2018
Original Exposure1
Exposure Value1 Risk exposure
amount
Value adjustments
and provisions2 Original Exposure
1 Exposure Value
1
Risk exposure
amount
Value adjustments
and provisions2
UNITED STATES
Standardised Approach
As of 31/12/2017 As of 30/06/2018
Original Exposure1
Exposure Value1 Risk exposure
amount
Value adjustments
and provisions2 Original Exposure
1 Exposure Value
1
Risk exposure
amount
Value adjustments
and provisions2
RUSSIAN
FEDERATION
Standardised Approach
As of 31/12/2017 As of 30/06/2018
Original Exposure1
Exposure Value1 Risk exposure
amount
Value adjustments
and provisions2 Original Exposure
1 Exposure Value
1
Risk exposure
amount
Value adjustments
and provisions2
GREECE
Original Exposure1
Exposure Value1 Risk exposure
amount
Value adjustments
and provisions2 Original Exposure
1 Exposure Value
1
201712 201712 201712 201712 201806 201806 201806 201806
2018 EU-wide Transparency Exercise
Credit Risk - Standardised Approach
Hellenic Bank Public Company Ltd
Standardised Approach
8 (mln EUR, %)
Central governments or central banks 0 0 0 0 0 0
Regional governments or local authorities 0 0 0 0 0 0
Public sector entities 0 0 0 0 0 0
Multilateral Development Banks 0 0 0 0 0 0
International Organisations 0 0 0 0 0 0
Institutions 0 0 0 0 0 0
Corporates 0 0 0 0 0 0
of which: SME 0 0 0 0 0 0
Retail 0 0 0 0 0 0
of which: SME 0 0 0 0 0 0
Secured by mortgages on immovable property 0 0 0 0 0 0
of which: SME 0 0 0 0 0 0
Exposures in default 0 0 0 0 0 0 0 0
Items associated with particularly high risk 0 0 0 0 0 0
Covered bonds 0 0 0 0 0 0
Claims on institutions and corporates with a ST credit assessment 0 0 0 0 0 0
Collective investments undertakings (CIU) 0 0 0 0 0 0
Equity 0 0 0 0 0 0
Securitisation
Other exposures 0 0 0 0 0 0
Standardised Total2
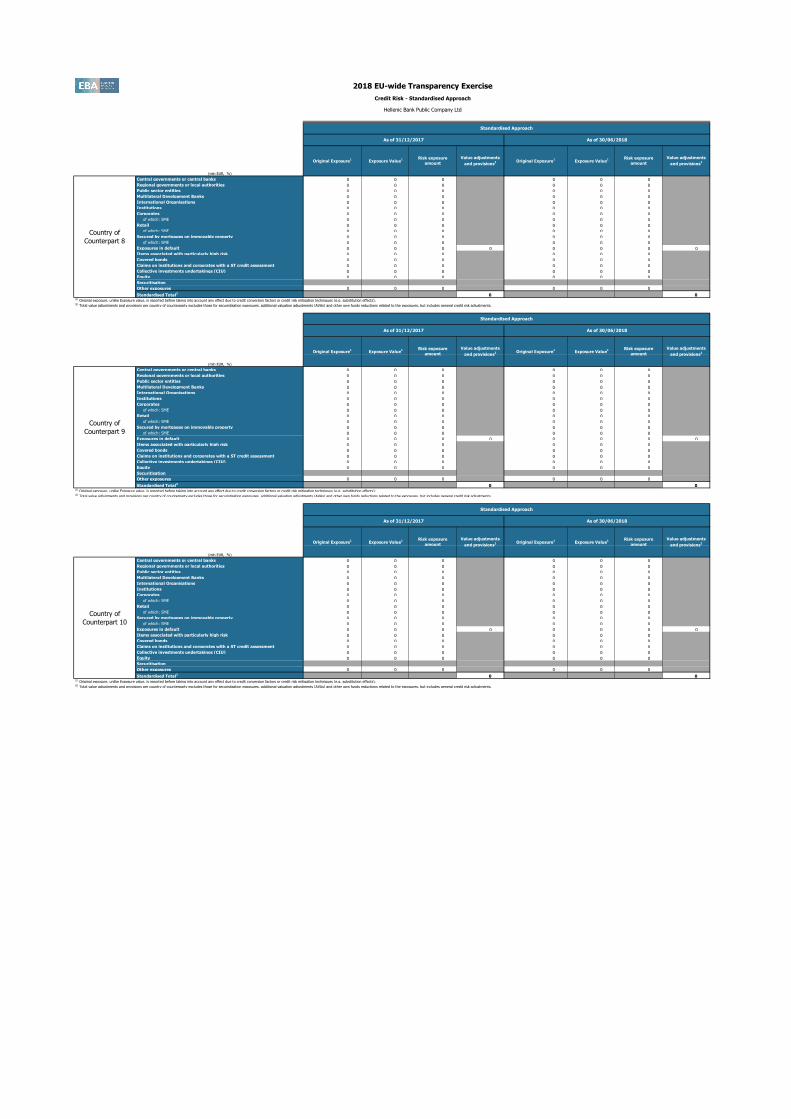
0 0(1) Original exposure, unlike Exposure value, is reported before taking into account any effect due to credit conversion factors or credit risk mitigation techniques (e.g. substitution effects). (2) Total value adjustments and provisions per country of counterparty excludes those for securistisation exposures, additional valuation adjustments (AVAs) and other own funds reductions related to the exposures, but includes general credit risk adjustments.
9 (mln EUR, %)
Central governments or central banks 0 0 0 0 0 0
Regional governments or local authorities 0 0 0 0 0 0
Public sector entities 0 0 0 0 0 0
Multilateral Development Banks 0 0 0 0 0 0
International Organisations 0 0 0 0 0 0
Institutions 0 0 0 0 0 0
Corporates 0 0 0 0 0 0
of which: SME 0 0 0 0 0 0
Retail 0 0 0 0 0 0
of which: SME 0 0 0 0 0 0
Secured by mortgages on immovable property 0 0 0 0 0 0
of which: SME 0 0 0 0 0 0
Exposures in default 0 0 0 0 0 0 0 0
Items associated with particularly high risk 0 0 0 0 0 0
Covered bonds 0 0 0 0 0 0
Claims on institutions and corporates with a ST credit assessment 0 0 0 0 0 0
Collective investments undertakings (CIU) 0 0 0 0 0 0
Equity 0 0 0 0 0 0
Securitisation
Other exposures 0 0 0 0 0 0
Standardised Total2
0 0(1) Original exposure, unlike Exposure value, is reported before taking into account any effect due to credit conversion factors or credit risk mitigation techniques (e.g. substitution effects). (2) Total value adjustments and provisions per country of counterparty excludes those for securistisation exposures, additional valuation adjustments (AVAs) and other own funds reductions related to the exposures, but includes general credit risk adjustments.
10 (mln EUR, %)
Central governments or central banks 0 0 0 0 0 0
Regional governments or local authorities 0 0 0 0 0 0
Public sector entities 0 0 0 0 0 0
Multilateral Development Banks 0 0 0 0 0 0
International Organisations 0 0 0 0 0 0
Institutions 0 0 0 0 0 0
Corporates 0 0 0 0 0 0
of which: SME 0 0 0 0 0 0
Retail 0 0 0 0 0 0
of which: SME 0 0 0 0 0 0
Secured by mortgages on immovable property 0 0 0 0 0 0
of which: SME 0 0 0 0 0 0
Exposures in default 0 0 0 0 0 0 0 0
Items associated with particularly high risk 0 0 0 0 0 0
Covered bonds 0 0 0 0 0 0
Claims on institutions and corporates with a ST credit assessment 0 0 0 0 0 0
Collective investments undertakings (CIU) 0 0 0 0 0 0
Equity 0 0 0 0 0 0
Securitisation
Other exposures 0 0 0 0 0 0
Standardised Total2
0 0(1) Original exposure, unlike Exposure value, is reported before taking into account any effect due to credit conversion factors or credit risk mitigation techniques (e.g. substitution effects). (2) Total value adjustments and provisions per country of counterparty excludes those for securistisation exposures, additional valuation adjustments (AVAs) and other own funds reductions related to the exposures, but includes general credit risk adjustments.
Standardised Approach
As of 31/12/2017 As of 30/06/2018
Risk exposure
amount
Value adjustments
and provisions2
Country of
Counterpart 8
Standardised Approach
As of 31/12/2017 As of 30/06/2018
Original Exposure1
Exposure Value1 Risk exposure
amount
Value adjustments
and provisions2 Original Exposure
1 Exposure Value
1
Risk exposure
amount
Value adjustments
and provisions2
Country of
Counterpart 9
Standardised Approach
As of 31/12/2017 As of 30/06/2018
Original Exposure1
Exposure Value1 Risk exposure
amount
Value adjustments
and provisions2 Original Exposure
1 Exposure Value
1
Risk exposure
amount
Value adjustments
and provisions2
Country of
Counterpart 10
Original Exposure1
Exposure Value1 Risk exposure
amount
Value adjustments
and provisions2 Original Exposure
1 Exposure Value
1
201712 201712 201712 201712 201712 201712 201806 201806 201806 201806 201806 201806
(mln EUR, %)
Of which:
defaulted
Of which:
defaulted
Of which:
defaulted
Of which:
defaulted
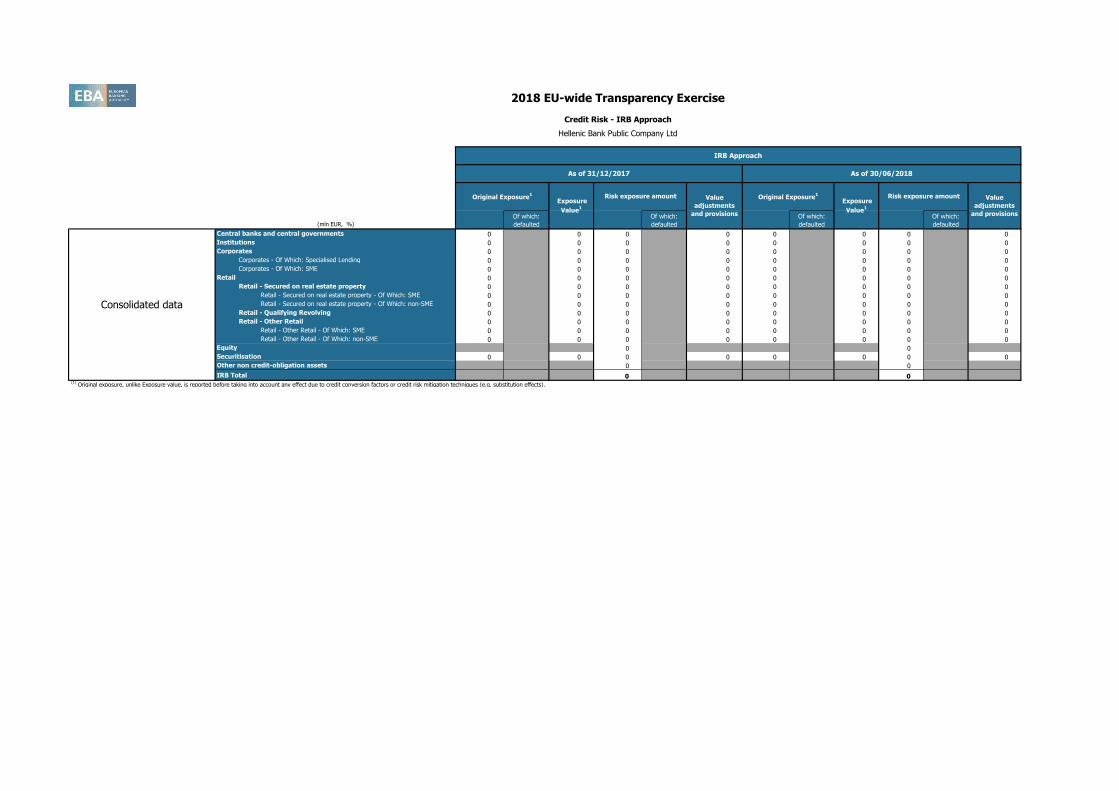
Central banks and central governments 0 0 0 0 0 0 0 0
Institutions 0 0 0 0 0 0 0 0
Corporates 0 0 0 0 0 0 0 0
Corporates - Of Which: Specialised Lending 0 0 0 0 0 0 0 0
Corporates - Of Which: SME 0 0 0 0 0 0 0 0
Retail 0 0 0 0 0 0 0 0
Retail - Secured on real estate property 0 0 0 0 0 0 0 0
Retail - Secured on real estate property - Of Which: SME 0 0 0 0 0 0 0 0
Retail - Secured on real estate property - Of Which: non-SME 0 0 0 0 0 0 0 0
Retail - Qualifying Revolving 0 0 0 0 0 0 0 0
Retail - Other Retail 0 0 0 0 0 0 0 0
Retail - Other Retail - Of Which: SME 0 0 0 0 0 0 0 0
Retail - Other Retail - Of Which: non-SME 0 0 0 0 0 0 0 0
Equity 0 0
Securitisation 0 0 0 0 0 0 0 0
Other non credit-obligation assets 0 0
IRB Total 0 0 (1)
Original exposure, unlike Exposure value, is reported before taking into account any effect due to credit conversion factors or credit risk mitigation techniques (e.g. substitution effects).
2018 EU-wide Transparency Exercise
Credit Risk - IRB Approach
Hellenic Bank Public Company Ltd
IRB Approach
As of 31/12/2017 As of 30/06/2018
Risk exposure amount Value
adjustments
and provisions
Consolidated data
Original Exposure1
Exposure
Value1
Risk exposure amount Value
adjustments
and provisions
Original Exposure1
Exposure
Value1
201712 201712 201712 201712 201712 201712 201712 201712 201712 201712 201712 201712 201712 201712 201712 201712 201712 201712
2018 EU-wide Transparency Exercise
Sovereign Exposure
Hellenic Bank Public Company Ltd
(mln EUR)
of which:
loans and
advances
of which:
debt
securities
of which:
Loans and
advances
of which:
Debt
securities
of which:
Loans and
advances
of which:
Debt
securities
of which:
Loans and
advances
of which:
Debt
securities
of which:
Loans and
advances
of which:
Debt
securities
of which:
Loans and
advances
of which:
Debt
securities
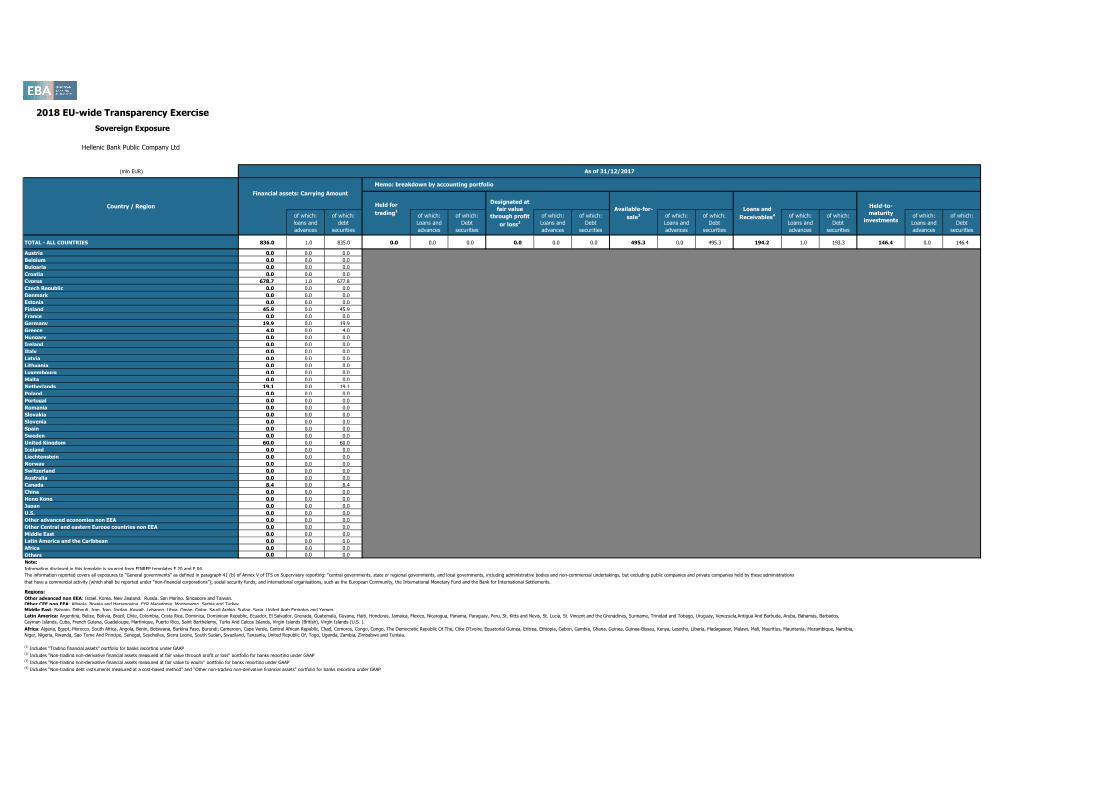
TOTAL - ALL COUNTRIES 836.0 1.0 835.0 0.0 0.0 0.0 0.0 0.0 0.0 495.3 0.0 495.3 194.2 1.0 193.3 146.4 0.0 146.4
Austria 0.0 0.0 0.0
Belgium 0.0 0.0 0.0
Bulgaria 0.0 0.0 0.0
Croatia 0.0 0.0 0.0
Cyprus 678.7 1.0 677.8
Czech Republic 0.0 0.0 0.0
Denmark 0.0 0.0 0.0
Estonia 0.0 0.0 0.0
Finland 45.9 0.0 45.9
France 0.0 0.0 0.0
Germany 19.9 0.0 19.9
Greece 4.0 0.0 4.0
Hungary 0.0 0.0 0.0
Ireland 0.0 0.0 0.0
Italy 0.0 0.0 0.0
Latvia 0.0 0.0 0.0
Lithuania 0.0 0.0 0.0
Luxembourg 0.0 0.0 0.0
Malta 0.0 0.0 0.0
Netherlands 19.1 0.0 19.1
Poland 0.0 0.0 0.0
Portugal 0.0 0.0 0.0
Romania 0.0 0.0 0.0
Slovakia 0.0 0.0 0.0
Slovenia 0.0 0.0 0.0
Spain 0.0 0.0 0.0
Sweden 0.0 0.0 0.0
United Kingdom 60.0 0.0 60.0
Iceland 0.0 0.0 0.0
Liechtenstein 0.0 0.0 0.0
Norway 0.0 0.0 0.0
Switzerland 0.0 0.0 0.0
Australia 0.0 0.0 0.0
Canada 8.4 0.0 8.4
China 0.0 0.0 0.0
Hong Kong 0.0 0.0 0.0
Japan 0.0 0.0 0.0
U.S. 0.0 0.0 0.0
Other advanced economies non EEA 0.0 0.0 0.0
Other Central and eastern Europe countries non EEA 0.0 0.0 0.0
Middle East 0.0 0.0 0.0
Latin America and the Caribbean 0.0 0.0 0.0
Africa 0.0 0.0 0.0
Others 0.0 0.0 0.0
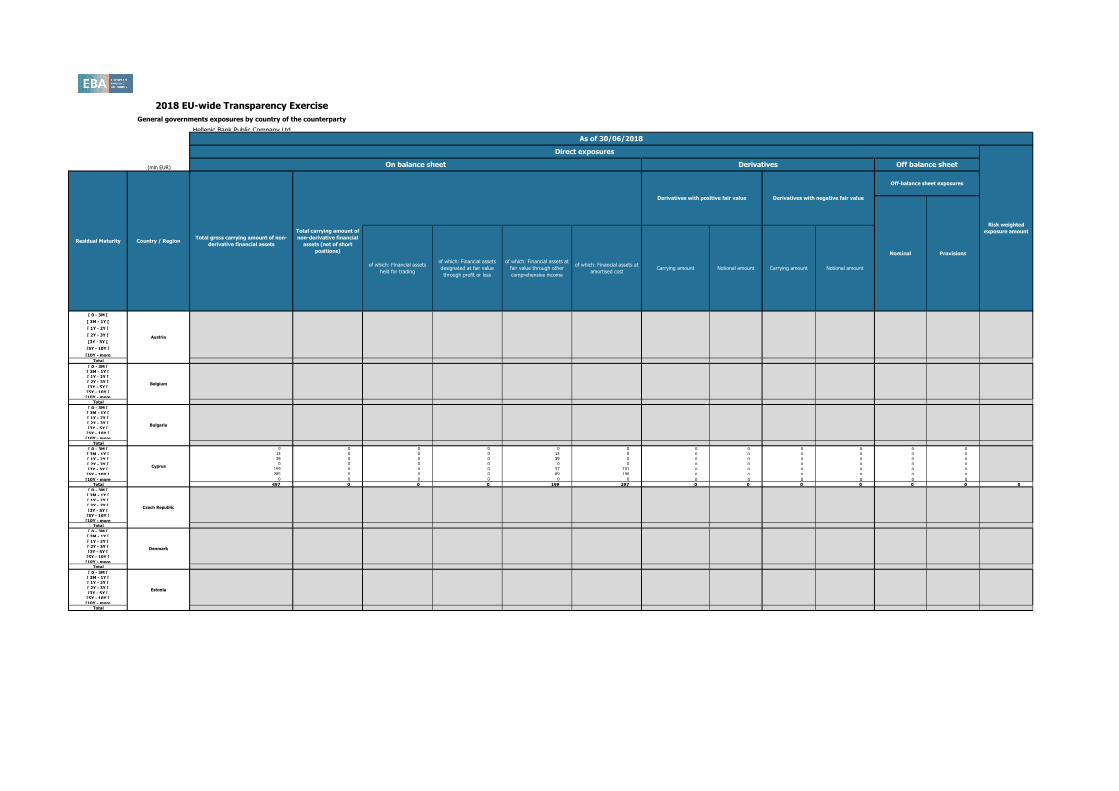
Note:
Information disclosed in this template is sourced from FINREP templates F 20 and F 04.
The information reported covers all exposures to “General governments” as defined in paragraph 41 (b) of Annex V of ITS on Supervisory reporting: “central governments, state or regional governments, and local governments, including administrative bodies and non-commercial undertakings, but excluding public companies and private companies held by these administrations
that have a commercial activity (which shall be reported under “non-financial corporations”); social security funds; and international organisations, such as the European Community, the International Monetary Fund and the Bank for International Settlements.
Regions:
Other advanced non EEA: Israel, Korea, New Zealand, Russia, San Marino, Singapore and Taiwan.
Other CEE non EEA: Albania, Bosnia and Herzegovina, FYR Macedonia, Montenegro, Serbia and Turkey.
Middle East: Bahrain, Djibouti, Iran, Iraq, Jordan, Kuwait, Lebanon, Libya, Oman, Qatar, Saudi Arabia, Sudan, Syria, United Arab Emirates and Yemen.
(1) Includes "Trading financial assets" portfolio for banks reporting under GAAP(2) Includes "Non-trading non-derivative financial assets measured at fair value through profit or loss" portfolio for banks reporting under GAAP(3) Includes "Non-trading non-derivative financial assets measured at fair value to equity" portfolio for banks reporting under GAAP(4) Includes "Non-trading debt instruments measured at a cost-based method" and "Other non-trading non-derivative financial assets" portfolio for banks reporting under GAAP
Latin America: Argentina, Belize, Bolivia, Brazil, Chile, Colombia, Costa Rica, Dominica, Dominican Republic, Ecuador, El Salvador, Grenada, Guatemala, Guyana, Haiti, Honduras, Jamaica, Mexico, Nicaragua, Panama, Paraguay, Peru, St. Kitts and Nevis, St. Lucia, St. Vincent and the Grenadines, Suriname, Trinidad and Tobago, Uruguay, Venezuela,Antigua And Barbuda, Aruba, Bahamas, Barbados,
Cayman Islands, Cuba, French Guiana, Guadeloupe, Martinique, Puerto Rico, Saint Barthélemy, Turks And Caicos Islands, Virgin Islands (British), Virgin Islands (U.S. ).
Africa: Algeria, Egypt, Morocco, South Africa, Angola, Benin, Botswana, Burkina Faso, Burundi, Cameroon, Cape Verde, Central African Republic, Chad, Comoros, Congo, Congo, The Democratic Republic Of The, Côte D'Ivoire, Equatorial Guinea, Eritrea, Ethiopia, Gabon, Gambia, Ghana, Guinea, Guinea-Bissau, Kenya, Lesotho, Liberia, Madagascar, Malawi, Mali, Mauritius, Mauritania, Mozambique, Namibia,
Niger, Nigeria, Rwanda, Sao Tome And Principe, Senegal, Seychelles, Sierra Leone, South Sudan, Swaziland, Tanzania, United Republic Of, Togo, Uganda, Zambia, Zimbabwe and Tunisia.
As of 31/12/2017
Country / Region
Financial assets: Carrying Amount
Memo: breakdown by accounting portfolio
Held for
trading1
Designated at
fair value
through profit
or loss2
Available-for-
sale3
Loans and
Receivables4
Held-to-
maturity
investments
201806 201806 201806 201806 201806 201806 201806 201806 201806 201806 201806 201806 201806
2018 EU-wide Transparency Exercise
General governments exposures by country of the counterparty
Hellenic Bank Public Company Ltd
(mln EUR)
[ 0 - 3M [ 0 0 0 0 0 0 0 0 0 0 0 0
[ 3M - 1Y [ 0 0 0 0 0 0 0 0 0 0 0 0
[ 1Y - 2Y [ 0 0 0 0 0 0 0 0 0 0 0 0
[ 2Y - 3Y [ 0 0 0 0 0 0 0 0 0 0 0 0
[3Y - 5Y [ 0 0 0 0 0 0 0 0 0 0 0 0
[5Y - 10Y [ 0 0 0 0 0 0 0 0 0 0 0 0
[10Y - more 0 0 0 0 0 0 0 0 0 0 0 0Total 0 0 0 0 0 0 0 0 0 0 0 0 0
[ 0 - 3M [ 0 0 0 0 0 0 0 0 0 0 0 0
[ 3M - 1Y [ 0 0 0 0 0 0 0 0 0 0 0 0
[ 1Y - 2Y [ 0 0 0 0 0 0 0 0 0 0 0 0
[ 2Y - 3Y [ 0 0 0 0 0 0 0 0 0 0 0 0
[3Y - 5Y [ 0 0 0 0 0 0 0 0 0 0 0 0
[5Y - 10Y [ 0 0 0 0 0 0 0 0 0 0 0 0
[10Y - more 0 0 0 0 0 0 0 0 0 0 0 0Total 0 0 0 0 0 0 0 0 0 0 0 0 0
[ 0 - 3M [ 0 0 0 0 0 0 0 0 0 0 0 0
[ 3M - 1Y [ 0 0 0 0 0 0 0 0 0 0 0 0
[ 1Y - 2Y [ 0 0 0 0 0 0 0 0 0 0 0 0
[ 2Y - 3Y [ 0 0 0 0 0 0 0 0 0 0 0 0
[3Y - 5Y [ 0 0 0 0 0 0 0 0 0 0 0 0
[5Y - 10Y [ 0 0 0 0 0 0 0 0 0 0 0 0
[10Y - more 0 0 0 0 0 0 0 0 0 0 0 0Total 0 0 0 0 0 0 0 0 0 0 0 0 0
[ 0 - 3M [ 0 0 0 0 0 0 0 0 0 0 0 0
[ 3M - 1Y [ 13 0 0 0 13 0 0 0 0 0 0 0
[ 1Y - 2Y [ 39 0 0 0 39 0 0 0 0 0 0 0
[ 2Y - 3Y [ 0 0 0 0 0 0 0 0 0 0 0 0
[3Y - 5Y [ 159 0 0 0 57 101 0 0 0 0 0 0
[5Y - 10Y [ 285 0 0 0 89 196 0 0 0 0 0 0
[10Y - more 0 0 0 0 0 0 0 0 0 0 0 0Total 497 0 0 0 199 297 0 0 0 0 0 0 0
[ 0 - 3M [ 0 0 0 0 0 0 0 0 0 0 0 0
[ 3M - 1Y [ 0 0 0 0 0 0 0 0 0 0 0 0
[ 1Y - 2Y [ 0 0 0 0 0 0 0 0 0 0 0 0
[ 2Y - 3Y [ 0 0 0 0 0 0 0 0 0 0 0 0
[3Y - 5Y [ 0 0 0 0 0 0 0 0 0 0 0 0
[5Y - 10Y [ 0 0 0 0 0 0 0 0 0 0 0 0
[10Y - more 0 0 0 0 0 0 0 0 0 0 0 0Total 0 0 0 0 0 0 0 0 0 0 0 0 0
[ 0 - 3M [ 0 0 0 0 0 0 0 0 0 0 0 0
[ 3M - 1Y [ 0 0 0 0 0 0 0 0 0 0 0 0
[ 1Y - 2Y [ 0 0 0 0 0 0 0 0 0 0 0 0
[ 2Y - 3Y [ 0 0 0 0 0 0 0 0 0 0 0 0
[3Y - 5Y [ 0 0 0 0 0 0 0 0 0 0 0 0
[5Y - 10Y [ 0 0 0 0 0 0 0 0 0 0 0 0
[10Y - more 0 0 0 0 0 0 0 0 0 0 0 0Total 0 0 0 0 0 0 0 0 0 0 0 0 0
[ 0 - 3M [ 0 0 0 0 0 0 0 0 0 0 0 0
[ 3M - 1Y [ 0 0 0 0 0 0 0 0 0 0 0 0
[ 1Y - 2Y [ 0 0 0 0 0 0 0 0 0 0 0 0
[ 2Y - 3Y [ 0 0 0 0 0 0 0 0 0 0 0 0
[3Y - 5Y [ 0 0 0 0 0 0 0 0 0 0 0 0
[5Y - 10Y [ 0 0 0 0 0 0 0 0 0 0 0 0
[10Y - more 0 0 0 0 0 0 0 0 0 0 0 0Total 0 0 0 0 0 0 0 0 0 0 0 0 0
As of 30/06/2018
Direct exposures
Risk weighted
exposure amount
On balance sheet Derivatives Off balance sheet
Off-balance sheet exposures
Nominal Provisions
Carrying amount
Derivatives with positive fair value Derivatives with negative fair value
of which: Financial assets
held for trading
of which: Financial assets
designated at fair value
through profit or loss
of which: Financial assets at
fair value through other
comprehensive income
of which: Financial assets at
amortised cost
Bulgaria
Residual Maturity Country / RegionTotal gross carrying amount of non-
derivative financial assets
Total carrying amount of
non-derivative financial
assets (net of short
positions)
Notional amount Carrying amount Notional amount
Austria
Belgium
Cyprus
Czech Republic
Denmark
Estonia

201806 201806 201806 201806 201806 201806 201806 201806 201806 201806 201806 201806 201806
2018 EU-wide Transparency Exercise
General governments exposures by country of the counterparty
Hellenic Bank Public Company Ltd
(mln EUR)
As of 30/06/2018
Direct exposures
Risk weighted
exposure amount
On balance sheet Derivatives Off balance sheet
Off-balance sheet exposures
Nominal Provisions
Carrying amount
Derivatives with positive fair value Derivatives with negative fair value
of which: Financial assets
held for trading
of which: Financial assets
designated at fair value
through profit or loss
of which: Financial assets at
fair value through other
comprehensive income
of which: Financial assets at
amortised cost
Residual Maturity Country / RegionTotal gross carrying amount of non-
derivative financial assets
Total carrying amount of
non-derivative financial
assets (net of short
positions)
Notional amount Carrying amount Notional amount
Austria
[ 0 - 3M [ 0 0 0 0 0 0 0 0 0 0 0 0
[ 3M - 1Y [ 0 0 0 0 0 0 0 0 0 0 0 0
[ 1Y - 2Y [ 0 0 0 0 0 0 0 0 0 0 0 0
[ 2Y - 3Y [ 0 0 0 0 0 0 0 0 0 0 0 0
[3Y - 5Y [ 0 0 0 0 0 0 0 0 0 0 0 0
[5Y - 10Y [ 0 0 0 0 0 0 0 0 0 0 0 0
[10Y - more 0 0 0 0 0 0 0 0 0 0 0 0Total 0 0 0 0 0 0 0 0 0 0 0 0 0
[ 0 - 3M [ 0 0 0 0 0 0 0 0 0 0 0 0
[ 3M - 1Y [ 0 0 0 0 0 0 0 0 0 0 0 0
[ 1Y - 2Y [ 0 0 0 0 0 0 0 0 0 0 0 0
[ 2Y - 3Y [ 0 0 0 0 0 0 0 0 0 0 0 0
[3Y - 5Y [ 0 0 0 0 0 0 0 0 0 0 0 0
[5Y - 10Y [ 0 0 0 0 0 0 0 0 0 0 0 0
[10Y - more 0 0 0 0 0 0 0 0 0 0 0 0Total 0 0 0 0 0 0 0 0 0 0 0 0 0
[ 0 - 3M [ 0 0 0 0 0 0 0 0 0 0 0 0
[ 3M - 1Y [ 0 0 0 0 0 0 0 0 0 0 0 0
[ 1Y - 2Y [ 13 0 0 0 13 0 0 0 0 0 0 0
[ 2Y - 3Y [ 0 0 0 0 0 0 0 0 0 0 0 0
[3Y - 5Y [ 0 0 0 0 0 0 0 0 0 0 0 0
[5Y - 10Y [ 0 0 0 0 0 0 0 0 0 0 0 0
[10Y - more 0 0 0 0 0 0 0 0 0 0 0 0Total 13 0 0 0 13 0 0 0 0 0 0 0 0
[ 0 - 3M [ 0 0 0 0 0 0 0 0 0 0 0 0
[ 3M - 1Y [ 0 0 0 0 0 0 0 0 0 0 0 0
[ 1Y - 2Y [ 0 0 0 0 0 0 0 0 0 0 0 0
[ 2Y - 3Y [ 0 0 0 0 0 0 0 0 0 0 0 0
[3Y - 5Y [ 0 0 0 0 0 0 0 0 0 0 0 0
[5Y - 10Y [ 0 0 0 0 0 0 0 0 0 0 0 0
[10Y - more 0 0 0 0 0 0 0 0 0 0 0 0Total 0 0 0 0 0 0 0 0 0 0 0 0 0
[ 0 - 3M [ 0 0 0 0 0 0 0 0 0 0 0 0
[ 3M - 1Y [ 0 0 0 0 0 0 0 0 0 0 0 0
[ 1Y - 2Y [ 0 0 0 0 0 0 0 0 0 0 0 0
[ 2Y - 3Y [ 0 0 0 0 0 0 0 0 0 0 0 0
[3Y - 5Y [ 0 0 0 0 0 0 0 0 0 0 0 0
[5Y - 10Y [ 0 0 0 0 0 0 0 0 0 0 0 0
[10Y - more 0 0 0 0 0 0 0 0 0 0 0 0Total 0 0 0 0 0 0 0 0 0 0 0 0 0
[ 0 - 3M [ 0 0 0 0 0 0 0 0 0 0 0 0
[ 3M - 1Y [ 0 0 0 0 0 0 0 0 0 0 0 0
[ 1Y - 2Y [ 0 0 0 0 0 0 0 0 0 0 0 0
[ 2Y - 3Y [ 0 0 0 0 0 0 0 0 0 0 0 0
[3Y - 5Y [ 0 0 0 0 0 0 0 0 0 0 0 0
[5Y - 10Y [ 0 0 0 0 0 0 0 0 0 0 0 0
[10Y - more 0 0 0 0 0 0 0 0 0 0 0 0Total 0 0 0 0 0 0 0 0 0 0 0 0 0
[ 0 - 3M [ 0 0 0 0 0 0 0 0 0 0 0 0
[ 3M - 1Y [ 0 0 0 0 0 0 0 0 0 0 0 0
[ 1Y - 2Y [ 0 0 0 0 0 0 0 0 0 0 0 0
[ 2Y - 3Y [ 0 0 0 0 0 0 0 0 0 0 0 0
[3Y - 5Y [ 0 0 0 0 0 0 0 0 0 0 0 0
[5Y - 10Y [ 0 0 0 0 0 0 0 0 0 0 0 0
[10Y - more 0 0 0 0 0 0 0 0 0 0 0 0Total 0 0 0 0 0 0 0 0 0 0 0 0 0
Finland
France
Germany
Croatia
Greece
Hungary
Ireland
201806 201806 201806 201806 201806 201806 201806 201806 201806 201806 201806 201806 201806
2018 EU-wide Transparency Exercise
General governments exposures by country of the counterparty
Hellenic Bank Public Company Ltd
(mln EUR)
As of 30/06/2018
Direct exposures
Risk weighted
exposure amount
On balance sheet Derivatives Off balance sheet
Off-balance sheet exposures
Nominal Provisions
Carrying amount
Derivatives with positive fair value Derivatives with negative fair value
of which: Financial assets
held for trading
of which: Financial assets
designated at fair value
through profit or loss
of which: Financial assets at
fair value through other
comprehensive income
of which: Financial assets at
amortised cost
Residual Maturity Country / RegionTotal gross carrying amount of non-
derivative financial assets
Total carrying amount of
non-derivative financial
assets (net of short
positions)
Notional amount Carrying amount Notional amount
Austria
[ 0 - 3M [ 0 0 0 0 0 0 0 0 0 0 0 0
[ 3M - 1Y [ 0 0 0 0 0 0 0 0 0 0 0 0
[ 1Y - 2Y [ 0 0 0 0 0 0 0 0 0 0 0 0
[ 2Y - 3Y [ 0 0 0 0 0 0 0 0 0 0 0 0
[3Y - 5Y [ 0 0 0 0 0 0 0 0 0 0 0 0
[5Y - 10Y [ 0 0 0 0 0 0 0 0 0 0 0 0
[10Y - more 0 0 0 0 0 0 0 0 0 0 0 0Total 0 0 0 0 0 0 0 0 0 0 0 0 0
[ 0 - 3M [ 0 0 0 0 0 0 0 0 0 0 0 0
[ 3M - 1Y [ 0 0 0 0 0 0 0 0 0 0 0 0
[ 1Y - 2Y [ 0 0 0 0 0 0 0 0 0 0 0 0
[ 2Y - 3Y [ 0 0 0 0 0 0 0 0 0 0 0 0
[3Y - 5Y [ 0 0 0 0 0 0 0 0 0 0 0 0
[5Y - 10Y [ 0 0 0 0 0 0 0 0 0 0 0 0
[10Y - more 0 0 0 0 0 0 0 0 0 0 0 0Total 0 0 0 0 0 0 0 0 0 0 0 0 0
[ 0 - 3M [ 0 0 0 0 0 0 0 0 0 0 0 0
[ 3M - 1Y [ 0 0 0 0 0 0 0 0 0 0 0 0
[ 1Y - 2Y [ 0 0 0 0 0 0 0 0 0 0 0 0
[ 2Y - 3Y [ 0 0 0 0 0 0 0 0 0 0 0 0
[3Y - 5Y [ 0 0 0 0 0 0 0 0 0 0 0 0
[5Y - 10Y [ 0 0 0 0 0 0 0 0 0 0 0 0
[10Y - more 0 0 0 0 0 0 0 0 0 0 0 0Total 0 0 0 0 0 0 0 0 0 0 0 0 0
[ 0 - 3M [ 0 0 0 0 0 0 0 0 0 0 0 0
[ 3M - 1Y [ 0 0 0 0 0 0 0 0 0 0 0 0
[ 1Y - 2Y [ 0 0 0 0 0 0 0 0 0 0 0 0
[ 2Y - 3Y [ 0 0 0 0 0 0 0 0 0 0 0 0
[3Y - 5Y [ 0 0 0 0 0 0 0 0 0 0 0 0
[5Y - 10Y [ 0 0 0 0 0 0 0 0 0 0 0 0
[10Y - more 0 0 0 0 0 0 0 0 0 0 0 0Total 0 0 0 0 0 0 0 0 0 0 0 0 0
[ 0 - 3M [ 0 0 0 0 0 0 0 0 0 0 0 0
[ 3M - 1Y [ 0 0 0 0 0 0 0 0 0 0 0 0
[ 1Y - 2Y [ 0 0 0 0 0 0 0 0 0 0 0 0
[ 2Y - 3Y [ 0 0 0 0 0 0 0 0 0 0 0 0
[3Y - 5Y [ 0 0 0 0 0 0 0 0 0 0 0 0
[5Y - 10Y [ 0 0 0 0 0 0 0 0 0 0 0 0
[10Y - more 0 0 0 0 0 0 0 0 0 0 0 0Total 0 0 0 0 0 0 0 0 0 0 0 0 0
[ 0 - 3M [ 0 0 0 0 0 0 0 0 0 0 0 0
[ 3M - 1Y [ 0 0 0 0 0 0 0 0 0 0 0 0
[ 1Y - 2Y [ 0 0 0 0 0 0 0 0 0 0 0 0
[ 2Y - 3Y [ 0 0 0 0 0 0 0 0 0 0 0 0
[3Y - 5Y [ 0 0 0 0 0 0 0 0 0 0 0 0
[5Y - 10Y [ 0 0 0 0 0 0 0 0 0 0 0 0
[10Y - more 0 0 0 0 0 0 0 0 0 0 0 0Total 0 0 0 0 0 0 0 0 0 0 0 0 0
[ 0 - 3M [ 0 0 0 0 0 0 0 0 0 0 0 0
[ 3M - 1Y [ 0 0 0 0 0 0 0 0 0 0 0 0
[ 1Y - 2Y [ 0 0 0 0 0 0 0 0 0 0 0 0
[ 2Y - 3Y [ 0 0 0 0 0 0 0 0 0 0 0 0
[3Y - 5Y [ 0 0 0 0 0 0 0 0 0 0 0 0
[5Y - 10Y [ 0 0 0 0 0 0 0 0 0 0 0 0
[10Y - more 0 0 0 0 0 0 0 0 0 0 0 0Total 0 0 0 0 0 0 0 0 0 0 0 0 0
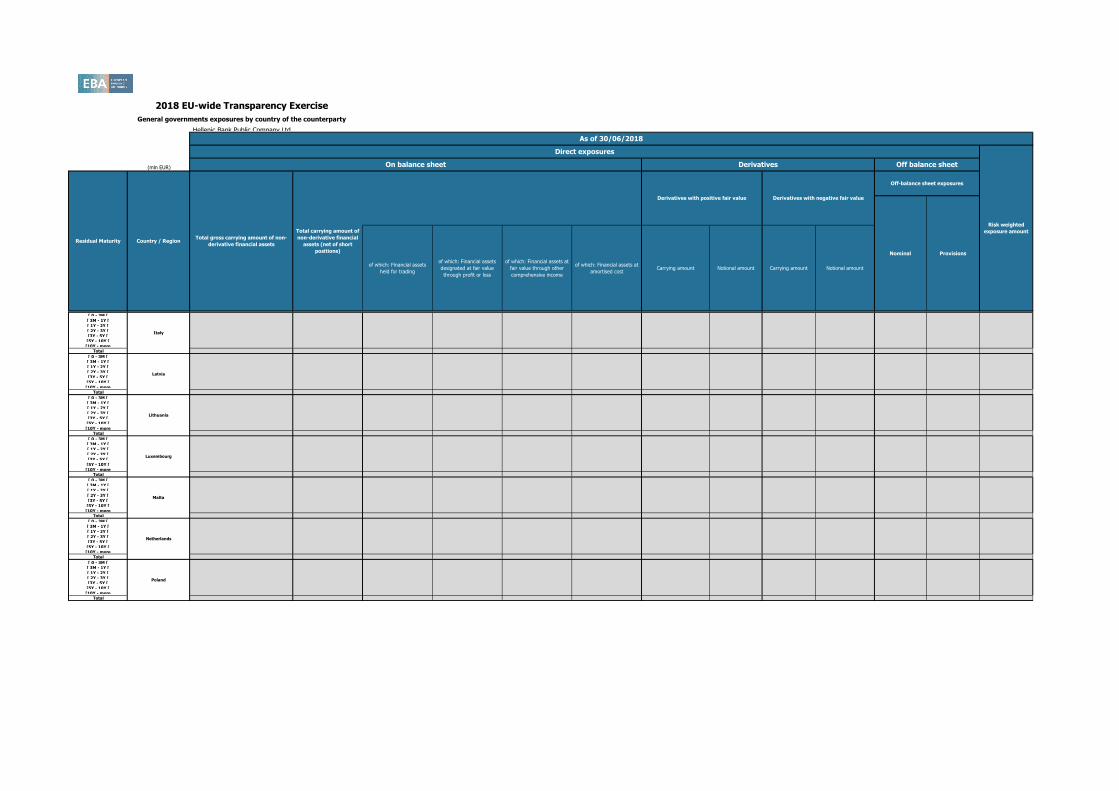
Italy
Latvia
Lithuania
Luxembourg
Malta
Netherlands
Poland

201806 201806 201806 201806 201806 201806 201806 201806 201806 201806 201806 201806 201806
2018 EU-wide Transparency Exercise
General governments exposures by country of the counterparty
Hellenic Bank Public Company Ltd
(mln EUR)
As of 30/06/2018
Direct exposures
Risk weighted
exposure amount
On balance sheet Derivatives Off balance sheet
Off-balance sheet exposures
Nominal Provisions
Carrying amount
Derivatives with positive fair value Derivatives with negative fair value
of which: Financial assets
held for trading
of which: Financial assets
designated at fair value
through profit or loss
of which: Financial assets at
fair value through other
comprehensive income
of which: Financial assets at
amortised cost
Residual Maturity Country / RegionTotal gross carrying amount of non-
derivative financial assets
Total carrying amount of
non-derivative financial
assets (net of short
positions)
Notional amount Carrying amount Notional amount
Austria
[ 0 - 3M [ 0 0 0 0 0 0 0 0 0 0 0 0
[ 3M - 1Y [ 0 0 0 0 0 0 0 0 0 0 0 0
[ 1Y - 2Y [ 0 0 0 0 0 0 0 0 0 0 0 0
[ 2Y - 3Y [ 0 0 0 0 0 0 0 0 0 0 0 0
[3Y - 5Y [ 0 0 0 0 0 0 0 0 0 0 0 0
[5Y - 10Y [ 0 0 0 0 0 0 0 0 0 0 0 0
[10Y - more 0 0 0 0 0 0 0 0 0 0 0 0Total 0 0 0 0 0 0 0 0 0 0 0 0 0
[ 0 - 3M [ 0 0 0 0 0 0 0 0 0 0 0 0
[ 3M - 1Y [ 0 0 0 0 0 0 0 0 0 0 0 0
[ 1Y - 2Y [ 0 0 0 0 0 0 0 0 0 0 0 0
[ 2Y - 3Y [ 0 0 0 0 0 0 0 0 0 0 0 0
[3Y - 5Y [ 0 0 0 0 0 0 0 0 0 0 0 0
[5Y - 10Y [ 0 0 0 0 0 0 0 0 0 0 0 0
[10Y - more 0 0 0 0 0 0 0 0 0 0 0 0Total 0 0 0 0 0 0 0 0 0 0 0 0 0
[ 0 - 3M [ 0 0 0 0 0 0 0 0 0 0 0 0
[ 3M - 1Y [ 0 0 0 0 0 0 0 0 0 0 0 0
[ 1Y - 2Y [ 0 0 0 0 0 0 0 0 0 0 0 0
[ 2Y - 3Y [ 0 0 0 0 0 0 0 0 0 0 0 0
[3Y - 5Y [ 0 0 0 0 0 0 0 0 0 0 0 0
[5Y - 10Y [ 0 0 0 0 0 0 0 0 0 0 0 0
[10Y - more 0 0 0 0 0 0 0 0 0 0 0 0Total 0 0 0 0 0 0 0 0 0 0 0 0 0
[ 0 - 3M [ 0 0 0 0 0 0 0 0 0 0 0 0
[ 3M - 1Y [ 0 0 0 0 0 0 0 0 0 0 0 0
[ 1Y - 2Y [ 0 0 0 0 0 0 0 0 0 0 0 0
[ 2Y - 3Y [ 0 0 0 0 0 0 0 0 0 0 0 0
[3Y - 5Y [ 0 0 0 0 0 0 0 0 0 0 0 0
[5Y - 10Y [ 0 0 0 0 0 0 0 0 0 0 0 0
[10Y - more 0 0 0 0 0 0 0 0 0 0 0 0Total 0 0 0 0 0 0 0 0 0 0 0 0 0
[ 0 - 3M [ 0 0 0 0 0 0 0 0 0 0 0 0
[ 3M - 1Y [ 0 0 0 0 0 0 0 0 0 0 0 0
[ 1Y - 2Y [ 0 0 0 0 0 0 0 0 0 0 0 0
[ 2Y - 3Y [ 0 0 0 0 0 0 0 0 0 0 0 0
[3Y - 5Y [ 0 0 0 0 0 0 0 0 0 0 0 0
[5Y - 10Y [ 0 0 0 0 0 0 0 0 0 0 0 0
[10Y - more 0 0 0 0 0 0 0 0 0 0 0 0Total 0 0 0 0 0 0 0 0 0 0 0 0 0
[ 0 - 3M [ 0 0 0 0 0 0 0 0 0 0 0 0
[ 3M - 1Y [ 0 0 0 0 0 0 0 0 0 0 0 0
[ 1Y - 2Y [ 0 0 0 0 0 0 0 0 0 0 0 0
[ 2Y - 3Y [ 0 0 0 0 0 0 0 0 0 0 0 0
[3Y - 5Y [ 0 0 0 0 0 0 0 0 0 0 0 0
[5Y - 10Y [ 0 0 0 0 0 0 0 0 0 0 0 0
[10Y - more 0 0 0 0 0 0 0 0 0 0 0 0Total 0 0 0 0 0 0 0 0 0 0 0 0 0
[ 0 - 3M [ 0 0 0 0 0 0 0 0 0 0 0 0
[ 3M - 1Y [ 0 0 0 0 0 0 0 0 0 0 0 0
[ 1Y - 2Y [ 0 0 0 0 0 0 0 0 0 0 0 0
[ 2Y - 3Y [ 0 0 0 0 0 0 0 0 0 0 0 0
[3Y - 5Y [ 0 0 0 0 0 0 0 0 0 0 0 0
[5Y - 10Y [ 0 0 0 0 0 0 0 0 0 0 0 0
[10Y - more 0 0 0 0 0 0 0 0 0 0 0 0Total 0 0 0 0 0 0 0 0 0 0 0 0 0
Sweden
Portugal
Romania
Slovakia
Slovenia
Spain
United Kingdom

201806 201806 201806 201806 201806 201806 201806 201806 201806 201806 201806 201806 201806
2018 EU-wide Transparency Exercise
General governments exposures by country of the counterparty
Hellenic Bank Public Company Ltd
(mln EUR)
As of 30/06/2018
Direct exposures
Risk weighted
exposure amount
On balance sheet Derivatives Off balance sheet
Off-balance sheet exposures
Nominal Provisions
Carrying amount
Derivatives with positive fair value Derivatives with negative fair value
of which: Financial assets
held for trading
of which: Financial assets
designated at fair value
through profit or loss
of which: Financial assets at
fair value through other
comprehensive income
of which: Financial assets at
amortised cost
Residual Maturity Country / RegionTotal gross carrying amount of non-
derivative financial assets
Total carrying amount of
non-derivative financial
assets (net of short
positions)
Notional amount Carrying amount Notional amount
Austria
[ 0 - 3M [ 0 0 0 0 0 0 0 0 0 0 0 0
[ 3M - 1Y [ 0 0 0 0 0 0 0 0 0 0 0 0
[ 1Y - 2Y [ 0 0 0 0 0 0 0 0 0 0 0 0
[ 2Y - 3Y [ 0 0 0 0 0 0 0 0 0 0 0 0
[3Y - 5Y [ 0 0 0 0 0 0 0 0 0 0 0 0
[5Y - 10Y [ 0 0 0 0 0 0 0 0 0 0 0 0
[10Y - more 0 0 0 0 0 0 0 0 0 0 0 0Total 0 0 0 0 0 0 0 0 0 0 0 0 0
[ 0 - 3M [ 0 0 0 0 0 0 0 0 0 0 0 0
[ 3M - 1Y [ 0 0 0 0 0 0 0 0 0 0 0 0
[ 1Y - 2Y [ 0 0 0 0 0 0 0 0 0 0 0 0
[ 2Y - 3Y [ 0 0 0 0 0 0 0 0 0 0 0 0
[3Y - 5Y [ 0 0 0 0 0 0 0 0 0 0 0 0
[5Y - 10Y [ 0 0 0 0 0 0 0 0 0 0 0 0
[10Y - more 0 0 0 0 0 0 0 0 0 0 0 0Total 0 0 0 0 0 0 0 0 0 0 0 0 0
[ 0 - 3M [ 0 0 0 0 0 0 0 0 0 0 0 0
[ 3M - 1Y [ 0 0 0 0 0 0 0 0 0 0 0 0
[ 1Y - 2Y [ 0 0 0 0 0 0 0 0 0 0 0 0
[ 2Y - 3Y [ 0 0 0 0 0 0 0 0 0 0 0 0
[3Y - 5Y [ 0 0 0 0 0 0 0 0 0 0 0 0
[5Y - 10Y [ 0 0 0 0 0 0 0 0 0 0 0 0
[10Y - more 0 0 0 0 0 0 0 0 0 0 0 0Total 0 0 0 0 0 0 0 0 0 0 0 0 0
[ 0 - 3M [ 0 0 0 0 0 0 0 0 0 0 0 0
[ 3M - 1Y [ 0 0 0 0 0 0 0 0 0 0 0 0
[ 1Y - 2Y [ 0 0 0 0 0 0 0 0 0 0 0 0
[ 2Y - 3Y [ 0 0 0 0 0 0 0 0 0 0 0 0
[3Y - 5Y [ 0 0 0 0 0 0 0 0 0 0 0 0
[5Y - 10Y [ 0 0 0 0 0 0 0 0 0 0 0 0
[10Y - more 0 0 0 0 0 0 0 0 0 0 0 0Total 0 0 0 0 0 0 0 0 0 0 0 0 0
[ 0 - 3M [ 0 0 0 0 0 0 0 0 0 0 0 0
[ 3M - 1Y [ 0 0 0 0 0 0 0 0 0 0 0 0
[ 1Y - 2Y [ 0 0 0 0 0 0 0 0 0 0 0 0
[ 2Y - 3Y [ 0 0 0 0 0 0 0 0 0 0 0 0
[3Y - 5Y [ 0 0 0 0 0 0 0 0 0 0 0 0
[5Y - 10Y [ 0 0 0 0 0 0 0 0 0 0 0 0
[10Y - more 0 0 0 0 0 0 0 0 0 0 0 0Total 0 0 0 0 0 0 0 0 0 0 0 0 0
[ 0 - 3M [ 0 0 0 0 0 0 0 0 0 0 0 0
[ 3M - 1Y [ 0 0 0 0 0 0 0 0 0 0 0 0
[ 1Y - 2Y [ 0 0 0 0 0 0 0 0 0 0 0 0
[ 2Y - 3Y [ 0 0 0 0 0 0 0 0 0 0 0 0
[3Y - 5Y [ 0 0 0 0 0 0 0 0 0 0 0 0
[5Y - 10Y [ 0 0 0 0 0 0 0 0 0 0 0 0
[10Y - more 0 0 0 0 0 0 0 0 0 0 0 0Total 0 0 0 0 0 0 0 0 0 0 0 0 0
[ 0 - 3M [ 0 0 0 0 0 0 0 0 0 0 0 0
[ 3M - 1Y [ 0 0 0 0 0 0 0 0 0 0 0 0
[ 1Y - 2Y [ 0 0 0 0 0 0 0 0 0 0 0 0
[ 2Y - 3Y [ 0 0 0 0 0 0 0 0 0 0 0 0
[3Y - 5Y [ 0 0 0 0 0 0 0 0 0 0 0 0
[5Y - 10Y [ 0 0 0 0 0 0 0 0 0 0 0 0
[10Y - more 0 0 0 0 0 0 0 0 0 0 0 0Total 0 0 0 0 0 0 0 0 0 0 0 0 0
Iceland
Liechtenstein
Norway
Australia
Canada
Hong Kong
Japan

201806 201806 201806 201806 201806 201806 201806 201806 201806 201806 201806 201806 201806
2018 EU-wide Transparency Exercise
General governments exposures by country of the counterparty
Hellenic Bank Public Company Ltd
(mln EUR)
As of 30/06/2018
Direct exposures
Risk weighted
exposure amount
On balance sheet Derivatives Off balance sheet
Off-balance sheet exposures
Nominal Provisions
Carrying amount
Derivatives with positive fair value Derivatives with negative fair value
of which: Financial assets
held for trading
of which: Financial assets
designated at fair value
through profit or loss
of which: Financial assets at
fair value through other
comprehensive income
of which: Financial assets at
amortised cost
Residual Maturity Country / RegionTotal gross carrying amount of non-
derivative financial assets
Total carrying amount of
non-derivative financial
assets (net of short
positions)
Notional amount Carrying amount Notional amount
Austria
[ 0 - 3M [ 0 0 0 0 0 0 0 0 0 0 0 0
[ 3M - 1Y [ 0 0 0 0 0 0 0 0 0 0 0 0
[ 1Y - 2Y [ 0 0 0 0 0 0 0 0 0 0 0 0
[ 2Y - 3Y [ 0 0 0 0 0 0 0 0 0 0 0 0
[3Y - 5Y [ 0 0 0 0 0 0 0 0 0 0 0 0
[5Y - 10Y [ 0 0 0 0 0 0 0 0 0 0 0 0
[10Y - more 0 0 0 0 0 0 0 0 0 0 0 0Total 0 0 0 0 0 0 0 0 0 0 0 0 0
[ 0 - 3M [ 0 0 0 0 0 0 0 0 0 0 0 0
[ 3M - 1Y [ 0 0 0 0 0 0 0 0 0 0 0 0
[ 1Y - 2Y [ 0 0 0 0 0 0 0 0 0 0 0 0
[ 2Y - 3Y [ 0 0 0 0 0 0 0 0 0 0 0 0
[3Y - 5Y [ 0 0 0 0 0 0 0 0 0 0 0 0
[5Y - 10Y [ 0 0 0 0 0 0 0 0 0 0 0 0
[10Y - more 0 0 0 0 0 0 0 0 0 0 0 0Total 0 0 0 0 0 0 0 0 0 0 0 0 0
[ 0 - 3M [ 0 0 0 0 0 0 0 0 0 0 0 0
[ 3M - 1Y [ 0 0 0 0 0 0 0 0 0 0 0 0
[ 1Y - 2Y [ 0 0 0 0 0 0 0 0 0 0 0 0
[ 2Y - 3Y [ 0 0 0 0 0 0 0 0 0 0 0 0
[3Y - 5Y [ 0 0 0 0 0 0 0 0 0 0 0 0
[5Y - 10Y [ 0 0 0 0 0 0 0 0 0 0 0 0
[10Y - more 0 0 0 0 0 0 0 0 0 0 0 0Total 0 0 0 0 0 0 0 0 0 0 0 0 0
[ 0 - 3M [ 0 0 0 0 0 0 0 0 0 0 0 0
[ 3M - 1Y [ 0 0 0 0 0 0 0 0 0 0 0 0
[ 1Y - 2Y [ 0 0 0 0 0 0 0 0 0 0 0 0
[ 2Y - 3Y [ 0 0 0 0 0 0 0 0 0 0 0 0
[3Y - 5Y [ 0 0 0 0 0 0 0 0 0 0 0 0
[5Y - 10Y [ 0 0 0 0 0 0 0 0 0 0 0 0
[10Y - more 0 0 0 0 0 0 0 0 0 0 0 0Total 0 0 0 0 0 0 0 0 0 0 0 0 0
[ 0 - 3M [ 0 0 0 0 0 0 0 0 0 0 0 0
[ 3M - 1Y [ 0 0 0 0 0 0 0 0 0 0 0 0
[ 1Y - 2Y [ 0 0 0 0 0 0 0 0 0 0 0 0
[ 2Y - 3Y [ 0 0 0 0 0 0 0 0 0 0 0 0
[3Y - 5Y [ 0 0 0 0 0 0 0 0 0 0 0 0
[5Y - 10Y [ 0 0 0 0 0 0 0 0 0 0 0 0
[10Y - more 0 0 0 0 0 0 0 0 0 0 0 0Total 0 0 0 0 0 0 0 0 0 0 0 0 0
[ 0 - 3M [ 0 0 0 0 0 0 0 0 0 0 0 0
[ 3M - 1Y [ 0 0 0 0 0 0 0 0 0 0 0 0
[ 1Y - 2Y [ 0 0 0 0 0 0 0 0 0 0 0 0
[ 2Y - 3Y [ 0 0 0 0 0 0 0 0 0 0 0 0
[3Y - 5Y [ 0 0 0 0 0 0 0 0 0 0 0 0
[5Y - 10Y [ 0 0 0 0 0 0 0 0 0 0 0 0
[10Y - more 0 0 0 0 0 0 0 0 0 0 0 0Total 0 0 0 0 0 0 0 0 0 0 0 0 0
[ 0 - 3M [ 0 0 0 0 0 0 0 0 0 0 0 0
[ 3M - 1Y [ 0 0 0 0 0 0 0 0 0 0 0 0
[ 1Y - 2Y [ 0 0 0 0 0 0 0 0 0 0 0 0
[ 2Y - 3Y [ 0 0 0 0 0 0 0 0 0 0 0 0
[3Y - 5Y [ 0 0 0 0 0 0 0 0 0 0 0 0
[5Y - 10Y [ 0 0 0 0 0 0 0 0 0 0 0 0
[10Y - more 0 0 0 0 0 0 0 0 0 0 0 0Total 0 0 0 0 0 0 0 0 0 0 0 0 0
Other advanced economies
non EEA
U.S.
China
Switzerland
Other Central and eastern
Europe countries non EEA
Middle East
Latin America and the
Caribbean
201806 201806 201806 201806 201806 201806 201806 201806 201806 201806 201806 201806 201806
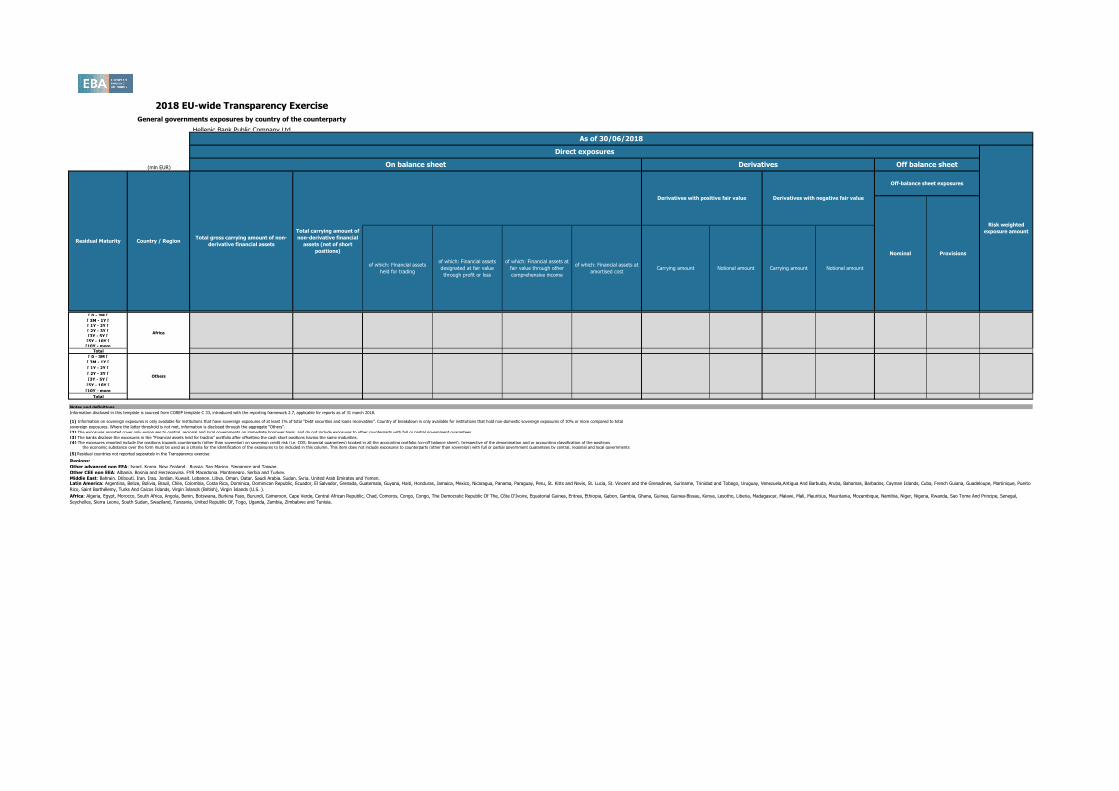
2018 EU-wide Transparency Exercise
General governments exposures by country of the counterparty
Hellenic Bank Public Company Ltd
(mln EUR)
As of 30/06/2018
Direct exposures
Risk weighted
exposure amount
On balance sheet Derivatives Off balance sheet
Off-balance sheet exposures
Nominal Provisions
Carrying amount
Derivatives with positive fair value Derivatives with negative fair value
of which: Financial assets
held for trading
of which: Financial assets
designated at fair value
through profit or loss
of which: Financial assets at
fair value through other
comprehensive income
of which: Financial assets at
amortised cost
Residual Maturity Country / RegionTotal gross carrying amount of non-
derivative financial assets
Total carrying amount of
non-derivative financial
assets (net of short
positions)
Notional amount Carrying amount Notional amount
Austria
[ 0 - 3M [ 0 0 0 0 0 0 0 0 0 0 0 0
[ 3M - 1Y [ 0 0 0 0 0 0 0 0 0 0 0 0
[ 1Y - 2Y [ 0 0 0 0 0 0 0 0 0 0 0 0
[ 2Y - 3Y [ 0 0 0 0 0 0 0 0 0 0 0 0
[3Y - 5Y [ 0 0 0 0 0 0 0 0 0 0 0 0
[5Y - 10Y [ 0 0 0 0 0 0 0 0 0 0 0 0
[10Y - more 0 0 0 0 0 0 0 0 0 0 0 0Total 0 0 0 0 0 0 0 0 0 0 0 0 0
[ 0 - 3M [ 0 0 0 0 0 0 0 0 0 0 0 0
[ 3M - 1Y [ 0 0 0 0 0 0 0 0 0 0 0 0
[ 1Y - 2Y [ 0 0 0 0 0 0 0 0 0 0 0 0
[ 2Y - 3Y [ 0 0 0 0 0 0 0 0 0 0 0 0
[3Y - 5Y [ 0 0 0 0 0 0 0 0 0 0 0 0
[5Y - 10Y [ 0 0 0 0 0 0 0 0 0 0 0 0
[10Y - more 0 0 0 0 0 0 0 0 0 0 0 0
Total 0 0 0 0 0 0 0 0 0 0 0 0 0
Notes and definitions
(2) The exposures reported cover only exposures to central, regional and local governments on immediate borrower basis, and do not include exposures to other counterparts with full or partial government guarantees
(3) The banks disclose the exposures in the "Financial assets held for trading" portfolio after offsetting the cash short positions having the same maturities.
(4) The exposures reported include the positions towards counterparts (other than sovereign) on sovereign credit risk (i.e. CDS, financial guarantees) booked in all the accounting portfolio (on-off balance sheet). Irrespective of the denomination and or accounting classification of the positions the economic substance over the form must be used as a criteria for the identification of the exposures to be included in this column. This item does not include exposures to counterparts (other than sovereign) with full or partial government guarantees by central, regional and local governments
Regions:
Other advanced non EEA: Israel, Korea, New Zealand, Russia, San Marino, Singapore and Taiwan.
Other CEE non EEA: Albania, Bosnia and Herzegovina, FYR Macedonia, Montenegro, Serbia and Turkey.
Middle East: Bahrain, Djibouti, Iran, Iraq, Jordan, Kuwait, Lebanon, Libya, Oman, Qatar, Saudi Arabia, Sudan, Syria, United Arab Emirates and Yemen.
(1) Information on sovereign exposures is only available for institutions that have sovereign exposures of at least 1% of total “Debt securities and loans receivables”. Country of breakdown is only available for institutions that hold non-domestic sovereign exposures of 10% or more compared to total
sovereign exposures. Where the latter threshold is not met, information is disclosed through the aggregate "Others".
(5) Residual countries not reported separately in the Transparency exercise
Latin America: Argentina, Belize, Bolivia, Brazil, Chile, Colombia, Costa Rica, Dominica, Dominican Republic, Ecuador, El Salvador, Grenada, Guatemala, Guyana, Haiti, Honduras, Jamaica, Mexico, Nicaragua, Panama, Paraguay, Peru, St. Kitts and Nevis, St. Lucia, St. Vincent and the Grenadines, Suriname, Trinidad and Tobago, Uruguay, Venezuela,Antigua And Barbuda, Aruba, Bahamas, Barbados, Cayman Islands, Cuba, French Guiana, Guadeloupe, Martinique, Puerto
Rico, Saint Barthélemy, Turks And Caicos Islands, Virgin Islands (British), Virgin Islands (U.S. ).
Africa: Algeria, Egypt, Morocco, South Africa, Angola, Benin, Botswana, Burkina Faso, Burundi, Cameroon, Cape Verde, Central African Republic, Chad, Comoros, Congo, Congo, The Democratic Republic Of The, Côte D'Ivoire, Equatorial Guinea, Eritrea, Ethiopia, Gabon, Gambia, Ghana, Guinea, Guinea-Bissau, Kenya, Lesotho, Liberia, Madagascar, Malawi, Mali, Mauritius, Mauritania, Mozambique, Namibia, Niger, Nigeria, Rwanda, Sao Tome And Principe, Senegal,
Seychelles, Sierra Leone, South Sudan, Swaziland, Tanzania, United Republic Of, Togo, Uganda, Zambia, Zimbabwe and Tunisia.
Africa
Others
Information disclosed in this template is sourced from COREP template C 33, introduced with the reporting framework 2.7, applicable for reports as of 31 march 2018.
201712 201712 201712 201712 201712 201712 201712 201806 201806 201806 201806 201806 201806 201806
(mln EUR)
Of which:
defaulted
Of which:
defaulted
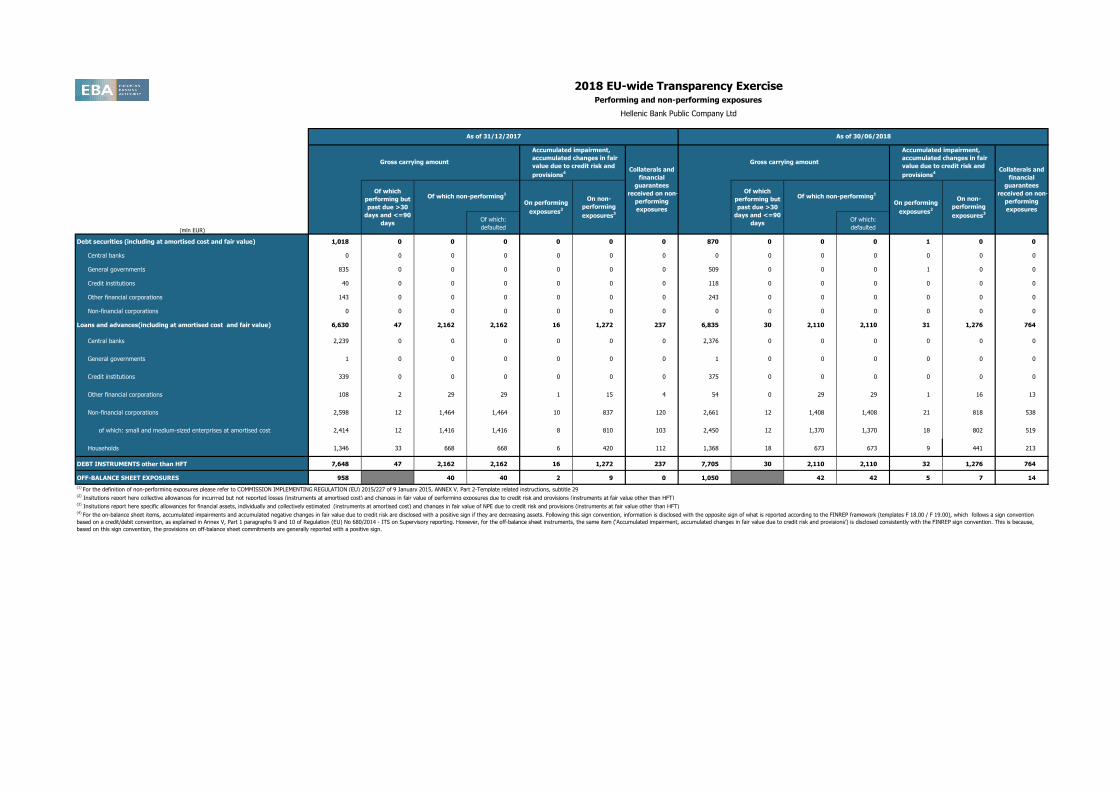
Debt securities (including at amortised cost and fair value) 1,018 0 0 0 0 0 0 870 0 0 0 1 0 0
Central banks 0 0 0 0 0 0 0 0 0 0 0 0 0 0
General governments 835 0 0 0 0 0 0 509 0 0 0 1 0 0
Credit institutions 40 0 0 0 0 0 0 118 0 0 0 0 0 0
Other financial corporations 143 0 0 0 0 0 0 243 0 0 0 0 0 0
Non-financial corporations 0 0 0 0 0 0 0 0 0 0 0 0 0 0
Loans and advances(including at amortised cost and fair value) 6,630 47 2,162 2,162 16 1,272 237 6,835 30 2,110 2,110 31 1,276 764
Central banks 2,239 0 0 0 0 0 0 2,376 0 0 0 0 0 0
General governments 1 0 0 0 0 0 0 1 0 0 0 0 0 0
Credit institutions 339 0 0 0 0 0 0 375 0 0 0 0 0 0
Other financial corporations 108 2 29 29 1 15 4 54 0 29 29 1 16 13
Non-financial corporations 2,598 12 1,464 1,464 10 837 120 2,661 12 1,408 1,408 21 818 538
of which: small and medium-sized enterprises at amortised cost 2,414 12 1,416 1,416 8 810 103 2,450 12 1,370 1,370 18 802 519
Households 1,346 33 668 668 6 420 112 1,368 18 673 673 9 441 213
DEBT INSTRUMENTS other than HFT 7,648 47 2,162 2,162 16 1,272 237 7,705 30 2,110 2,110 32 1,276 764
OFF-BALANCE SHEET EXPOSURES 958 40 40 2 9 0 1,050 42 42 5 7 14
(1) For the definition of non-performing exposures please refer to COMMISSION IMPLEMENTING REGULATION (EU) 2015/227 of 9 January 2015, ANNEX V, Part 2-Template related instructions, subtitle 29(2) Insitutions report here collective allowances for incurrred but not reported losses (instruments at amortised cost) and changes in fair value of performing exposures due to credit risk and provisions (instruments at fair value other than HFT)(3) Insitutions report here specific allowances for financial assets, individually and collectively estimated (instruments at amortised cost) and changes in fair value of NPE due to credit risk and provisions (instruments at fair value other than HFT)
Accumulated impairment,
accumulated changes in fair
value due to credit risk and
provisions4
2018 EU-wide Transparency ExercisePerforming and non-performing exposures
Hellenic Bank Public Company Ltd
As of 31/12/2017 As of 30/06/2018
On non-
performing
exposures3
(4) For the on-balance sheet items, accumulated impairments and accumulated negative changes in fair value due to credit risk are disclosed with a positive sign if they are decreasing assets. Following this sign convention, information is disclosed with the opposite sign of what is reported according to the FINREP framework (templates F 18.00 / F 19.00), which follows a sign convention
based on a credit/debit convention, as explained in Annex V, Part 1 paragraphs 9 and 10 of Regulation (EU) No 680/2014 - ITS on Supervisory reporting. However, for the off-balance sheet instruments, the same item (‘Accumulated impairment, accumulated changes in fair value due to credit risk and provisions’) is disclosed consistently with the FINREP sign convention. This is because,
based on this sign convention, the provisions on off-balance sheet commitments are generally reported with a positive sign.
Collaterals and
financial
guarantees
received on non-
performing
exposures
Of which
performing but
past due >30
days and <=90
days
Of which non-performing1
On performing
exposures2
On non-
performing
exposures3
Of which
performing but
past due >30
days and <=90
days
Of which non-performing1
On performing
exposures2
Gross carrying amount
Accumulated impairment,
accumulated changes in fair
value due to credit risk and
provisions4
Collaterals and
financial
guarantees
received on non-
performing
exposures
Gross carrying amount
201712 201712 201712 201712 201712 201806 201806 201806 201806 201806
(mln EUR)
Debt securities (including at amortised cost and fair value) 0 0 0 0 0 0 0 0 0 0
Central banks 0 0 0 0 0 0 0 0 0 0
General governments 0 0 0 0 0 0 0 0 0 0
Credit institutions 0 0 0 0 0 0 0 0 0 0
Other financial corporations 0 0 0 0 0 0 0 0 0 0
Non-financial corporations 0 0 0 0 0 0 0 0 0 0
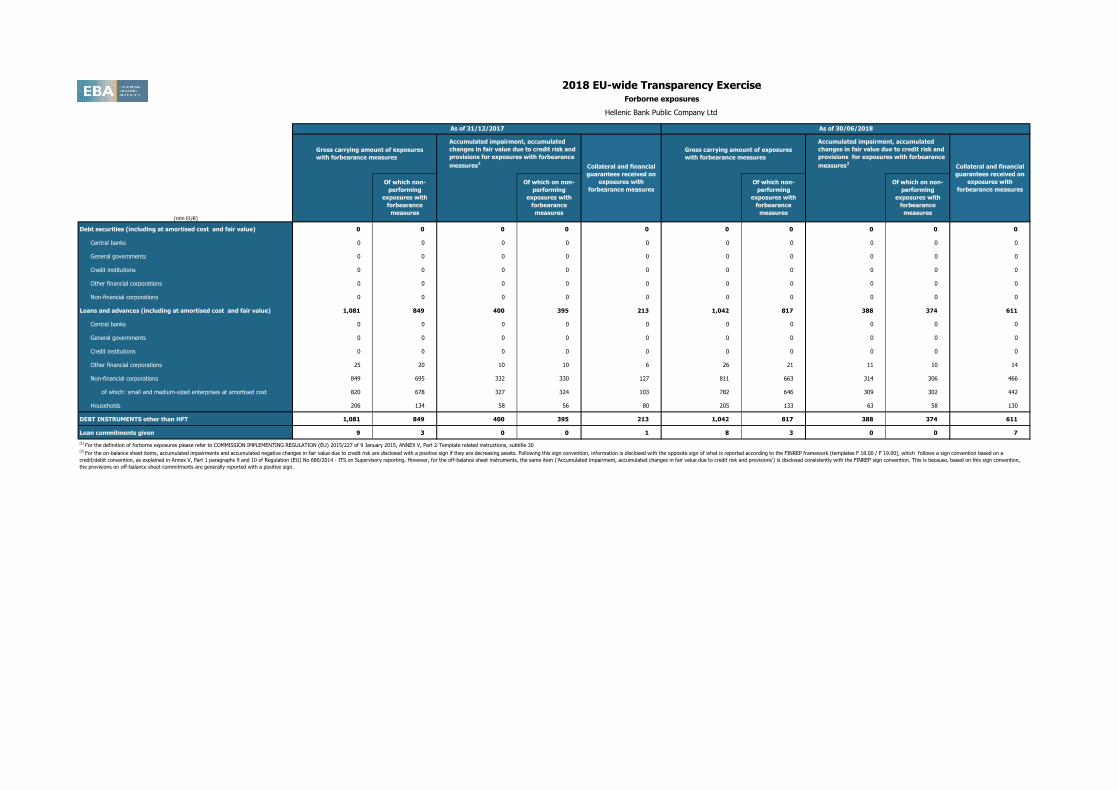
Loans and advances (including at amortised cost and fair value) 1,081 849 400 395 213 1,042 817 388 374 611
Central banks 0 0 0 0 0 0 0 0 0 0
General governments 0 0 0 0 0 0 0 0 0 0
Credit institutions 0 0 0 0 0 0 0 0 0 0
Other financial corporations 25 20 10 10 6 26 21 11 10 14
Non-financial corporations 849 695 332 330 127 811 663 314 306 466
of which: small and medium-sized enterprises at amortised cost 820 678 327 324 103 782 646 309 302 442
Households 206 134 58 56 80 205 133 63 58 130
DEBT INSTRUMENTS other than HFT 1,081 849 400 395 213 1,042 817 388 374 611
Loan commitments given 9 3 0 0 1 8 3 0 0 7
(1) For the definition of forborne exposures please refer to COMMISSION IMPLEMENTING REGULATION (EU) 2015/227 of 9 January 2015, ANNEX V, Part 2-Template related instructions, subtitle 30
2018 EU-wide Transparency ExerciseForborne exposures
Hellenic Bank Public Company Ltd
As of 31/12/2017 As of 30/06/2018
(2) For the on-balance sheet items, accumulated impairments and accumulated negative changes in fair value due to credit risk are disclosed with a positive sign if they are decreasing assets. Following this sign convention, information is disclosed with the opposite sign of what is reported according to the FINREP framework (templates F 18.00 / F 19.00), which follows a sign convention based on a
credit/debit convention, as explained in Annex V, Part 1 paragraphs 9 and 10 of Regulation (EU) No 680/2014 - ITS on Supervisory reporting. However, for the off-balance sheet instruments, the same item (‘Accumulated impairment, accumulated changes in fair value due to credit risk and provisions’) is disclosed consistently with the FINREP sign convention. This is because, based on this sign convention,
the provisions on off-balance sheet commitments are generally reported with a positive sign.
Collateral and financial
guarantees received on
exposures with
forbearance measures
Of which non-
performing
exposures with
forbearance
measures
Of which on non-
performing
exposures with
forbearance
measures
Of which non-
performing
exposures with
forbearance
measures
Of which on non-
performing
exposures with
forbearance
measures
Gross carrying amount of exposures
with forbearance measures
Accumulated impairment, accumulated
changes in fair value due to credit risk and
provisions for exposures with forbearance
measures2
Collateral and financial
guarantees received on
exposures with
forbearance measures
Gross carrying amount of exposures
with forbearance measures
Accumulated impairment, accumulated
changes in fair value due to credit risk and
provisions for exposures with forbearance
measures2