Embed Size (px)
Citation preview

2018 ANNUAL REPORT

2018 ANNUAL REPORT

2018
AN
NU
AL R
EPO
RT
2
*01
*01STATUTORY BODIESORGANISATION CHARTLEADING FINANCIAL INDICATORSJOINT MESSAGE
*02DIRECTOR’S REPORT
1. ECONOMIC BACKGROUND2. OVERVIEW OF SEMAPA GROUP OPERATIONS 3. PAPER AND PAPER PULP BUSINESS AREA 4. CEMENT AND OTHER BUILDING MATERIALS 5. ENVIRONMENT BUSINESS AREA 6. SEMAPA GROUP HUMAN RESOURCES 7. SOCIAL RESPONSIBILITY IN THE SEMAPA GROUP8. SEMAPA GROUP – FINANCIAL AREA 9. SUBSEQUENT EVENTS 10. OUTLOOK 11. PROPOSED ALLOCATION OF PROFITS
*03CORPORATE GOVERNANCE
PART I INFORMATION ON SHAREHOLDER STRUCTURE, ORGANISATION AND CORPORATE GOVERNANCEPART II ASSESSMENT OF CORPORATE GOVERNANCEANNEX I DISCLOSURES REQUIRED BY ARTICLES 447 OF THE COMPANIES CODE ANNEX II REMUNERATION POLICY STATEMENTANNEX III STATEMENT REQUIRED UNDER ARTICLE 245.1 C) OF THE SECURITIES CODE
*04CONSOLIDATED FINANCIAL STATEMENTS
CONSOLIDATED INCOME STATEMENTSTATEMENT OF CONSOLIDATED COMPREHENSIVE INCOMECONSOLIDATED STATEMENT OF FINANCIAL POSITIONCONSOLIDATED STATEMENT OF CHANGES IN EQUITY CONSOLIDATED CASH FLOW STATEMENTINDEX TO THE CONSOLIDATED FINANCIAL STATEMENTS
68910
1819233346495051545758
63103114116
123
126127128129130131
*CONTENTS

2018 ANN
UAL R
EPO
RT
3
*01
*05STATUTORY AUDIT REPORT
CONSOLIDATED FINANCIAL STATEMENTS
*06REPORT AND OPINION OF THE AUDIT BOARD
CONSOLIDATED FINANCIAL STATEMENTS
*07SEPARATE FINANCIAL STATEMENTS
SEPARATE INCOME STATEMENT BY NATURESEPARATE STATEMENT OF COMPREHENSIVE INCOME
SEPARATE STATEMENT OF FINANCIAL POSITIONSEPARATE STATEMENT OF CHANGES IN EQUITY
SEPARATE CASH FLOW STATEMENT INDEX OF THE NOTES TO THE SEPARATE FINANCIAL STATEMENTS
*08STATUTORY AUDIT REPORT SEPARATE FINANCIAL STATEMENTS
*09REPORT AND OPINION OF THE AUDIT BOARD
SEPARATE FINANCIAL STATEMENTS
250
258
318
324
262263264265266267
2018
AN
NU
AL R
EPO
RT
4
*01
“MORE IMPORTANT THAN WHAT WE DID IS HOW WE DID IT”
PEDRO QUEIROZ PEREIRA

2018 ANN
UAL R
EPO
RT
5
*01

2018
AN
NU
AL R
EPO
RT
6
*01
*STATUTORY BODIES
BOARD OF DIRECTORSCHAIRMANHEINZ-PETER ELSTRODT DIRECTORSJOÃO NUNO DE SOTTOMayOR PINTO DE CASTELLO BRANCOJOSÉ MIGUEL PEREIRA GENS PAREDESPAULO MIGUEL GARCÊS VENTURARICARDO MIGUEL DOS SANTOS PACHECO PIRESANTÓNIO PEDRO DE CARVALHO VIANA BAPTISTACARLOS EDUARDO COELHO ALVESFILIPA MENDES DE ALMEIDA DE QUEIROZ PEREIRAFRANCISCO JOSÉ MELO E CASTRO GUEDESJOSÉ ANTÔNIO DO PRADO FAYLUA MÓNICA MENDES DE ALMEIDA DE QUEIROZ PEREIRAMAFALDA MENDES DE ALMEIDA DE QUEIROZ PEREIRAVÍTOR MANUEL GALVÃO ROCHA NOVAIS GONÇALVESVÍTOR PAULO PARANHOS PEREIRA EXECUTIVE COMMITTEECHAIRMANJOÃO NUNO DE SOTTOMayOR PINTO DE CASTELLO BRANCO MEMBERSJOSÉ MIGUEL PEREIRA GENS PAREDESPAULO MIGUEL GARCÊS VENTURARICARDO MIGUEL DOS SANTOS PACHECO PIRES REMUNERATION COMMITTEEFREDERICO JOSÉ DA CUNHA MENDONÇA E MENESESJOÃO RODRIGO APPLETON MOREIRA RATOJOSÉ GONÇALO FERREIRA MAURY GENERAL MEETINGCHAIRMANFRANCISCO XAVIER ZEA MANTERO SECRETARYLUÍS NUNO PESSOA FERREIRA GASPAR
AUDIT BOARDCHAIRMAN
JOSÉ MANUEL DE OLIVEIRA VITORINO
FULL MEMBERSGONÇALO NUNO PALHA GAIO PICÃO CALDEIRA
MARIA DA GRAÇA TORRES FERREIRA DA CUNHA GONÇALVES
ALTERNATE MEMBERANA ISABEL MORAES NOBRE DE AMARAL MARQUES
OFFICIAL AUDITOR
FULL MEMBERKPMG & ASSOCIADOS – SOCIEDADE DE REVISORES
OFICIAIS DE CONTAS, S.A., REPRESENTED BYPAULO ALEXANDRE MARTINS QUINTAS PAIXÃO
ALTERNATE
VÍTOR MANUEL DA CUNHA RIBEIRINHO
COMPANY SECRETARYFULL MEMBER
RUI TIAGO TRINDADE RAMOS GOUVEIA
ALTERNATEJOANA ESPERANÇA FERNANDES LOPES LUÍS
HEINZ-PETER ELSTRODT CHAIRMAN OF THE BOARD OF DIRECTORS
JOÃO CASTELLO BRANCOCEO

2018 ANN
UAL R
EPO
RT
7
*01
*BOARD OF DIRECTORS
JOSÉ MIGUEL PAREDES MIGUEL VENTURA RICARDO PIRES
ANTÓNIO VIANA BAPTISTA CARLOS ALVES FILIPA QUEIROZ PEREIRA
FRANCISCO GUEDES JOSÉ FAY LUA QUEIROZ PEREIRA
MAFALDA QUEIROZ PEREIRA VÍTOR NOVAIS GONÇALVES VÍTOR PARANHOS PEREIRA
2018
AN
NU
AL R
EPO
RT
8
*01
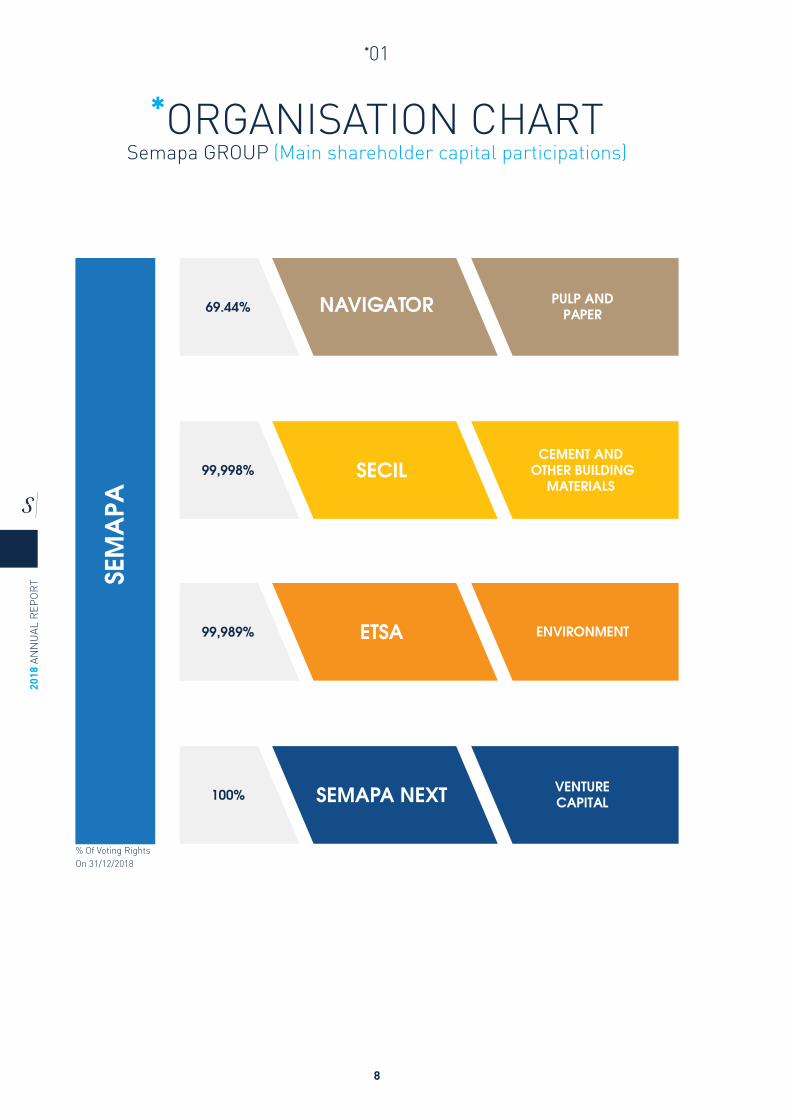
*ORGANISATION CHARTSemapa GROUP (Main shareholder capital participations)
SEM
APA
69.44% PULP ANDPAPERNAVIGATOR
99,998%CEMENT AND
OTHER BUILDINGMATERIALS
SECIL
100% VENTURECAPITALSEMAPA NEXT
99,989% ETSA ENVIRONMENT
On 31/12/2018% Of Voting Rights

2018 ANN
UAL R
EPO
RT
9
*01
*LEADINGFINANCIAL INDICATORS
REVENUE
2017
2018
MIL
LIO
N E
UR
OS
PULP AND PAPER
3.3%
1,638.8 1,691.2
CEMENT
-3.4%
482.1498.9
ENVIRONMENT
-14.9%
29.0 24.6
CONSOLIDATED
1.5%
2,164.7 2,198.0
EBITDA
0.4
403.8455.2
88.8 88.7
500.7548.5
7.7 5.4 -0.7
MIL
LIO
N E
UR
OS
PULP AND PAPER
12.7%
CEMENT
-0.1%
CONSOLIDATED
9.5%
ENVIRONMENT
-30,4%
HOLDINGS
-283%
2017
2018
NET PROFIT
-14.6
136.5 148.6
-1.1 -2.6
124.1 132.6
3.2 2.0 -15.4
MIL
LIO
N E
UR
OS
PULP AND PAPER
8.8%
CEMENT
-144.6%
CONSOLIDATED
6.8%
ENVIRONMENT
-38.0%
HOLDINGS
-5.5%
2017
2018
NET DEBT
552.1
692.7 683.0
414.0 386.4
1,673.71,551.6
14.8 11.0
471.3
MIL
LIO
N E
UR
OS
PULP AND PAPER
-9.8%
CEMENT
-27.7%
SEMAPA
-122.0%
ENVIRONMENT
-3.8%
HOLDINGS
-80.8%
2017
2018

2018
AN
NU
AL R
EPO
RT
10
*01
Dear Shareholders,
In our balance of 2018, sadly, we are bound to make a special reference to the passing of Pedro Queiroz Pereira, the founder, main shareholder and Chairman of the Board of Directors of the Semapa Group, to whom we wish to pay due tribute in recognition of this great man.
Pedro Queiroz Pereira was a good man, gifted with extraordinary human qualities and a genuine concern for social and environmental issues. The employees of the Group were always a priority for him, and he always saw to it that he provided them with attractive and motivating projects.
As a businessman, Pedro Queiroz Pereira was an entrepreneur of unique dimension. His exemplary strategic vision and unusual capacity to assess risks enabled him to reestablish and build up, in an ambitious, and at the same time, sustainable manner, a solid Portuguese Group, with a high reputation and international projection, contributing to the national value added, exports and job creation.
Due to the legacy of Pedro Queiroz Pereira, the Semapa Group today is equipped with the resources and talents needed to continue to be one of the largest Portuguese industrial Groups and to make a positive contribution to a better society. It is, then, with these goals in mind, and with great enthusiasm and determination that we commit to continue the work Pedro Queiroz Pereira left us and in which we take such pride, convinced that this is the greatest tribute we can offer him.
In macroeconomic terms, 2018 closed with world growth in line with that registered in the previous year and which, we point out, was the highest since 2011. Nonetheless, Europe and Asia’s economies had a poor performance and recent signs hint at a slowdown that will likely continue in 2019. The challenging environment still remains, and volatility has increased, with some level of growing uncertainty and tension. Trade disputes between the USA and other trade partners and the lack of an agreement on Brexit are examples of this. In Portugal, the expected slowdown of the economy reflects that which also occurs in its main economic partners.
HEINZ-PETER ELSTRODT CHAIRMAN OF THE BOARD OF DIRECTORS
JOÃO CASTELLO BRANCOCEO
*JOIN MESSAGE

2018 ANN
UAL R
EPO
RT
11
*01
In this context, 2018 was marked by the continued trajectory of positive results, which demonstrated the Group’s ability to navigate through challenging and demanding circumstances, the main indicators comparing favourably with 2017. Revenue increased 1.5% compared to the previous year, amounting to 2,198 million euros, EBITDA increased to 549 million euros, reflecting an increase of 9.5% year on year, and net profit totalled 133 million euros, 6.8% higher than the figure for 2017. The operating cash flow of the Group was 436 million euros, a growth of 3.3% year on year. Consolidated net debt fell to 1,552 million euros, with special emphasis on the holding, result of the strategy of reducing the level of indebtedness which has been implemented in recent years, with the goal of reinforcing the solidity and low-risk profile of the Group, and with the certainty that we will therefore be better prepared to face the future. In the pulp and paper segment, the results progressed positively, 2018 being marked by the favourable variation in prices of BEKP pulp, UWF paper and tissue, which compensated for the lower volume of BEKP pulp and UWF paper available for sale. In pulp, the favourable evolution in market conditions and the improvement of the sales mix allowed the selling price to go up by 25% over the previous year, fully compensating the significant drop in sales volumes (- 19%), a reflection of the planned and unplanned stoppages in the plants, like the one following Hurricane Leslie. In the paper business, there were also production variances (-3.6%) arising from unplanned stoppages. However, the various price increases implemented throughout the year and the improved products mix culminated
in a price increase higher than the reference index in Europe (+8.5%), allowing a 4.0% increase in revenue at year-end. An additional note for the tissue business, which recorded a 22.5% increase in revenue, due to the increase in prices and sales volumes, resulting from the growth in installed capacity, and to the energy business, which grew 3.5%, benefitting from the increase in the price of Brent Crude.
In this context, the revenue of Navigator grew 3.3% year on year, to 1,692 million euros, and EBITDA reached 455 million euros, 13% over that of the previous year. All this in a challenging framework at operating level, with plant performance below customary values and an unfavourable impact of some production costs, such as chemicals and fibres. At the same time, the programme for cost reduction and operational excellency continued, with a significant positive impact that is determinant for maintaining competitiveness and retaining strategic flexibility in a world that is increasingly more demanding and competitive.
The year just ended was also marked by the conclusion of important investments in the Navigator industrial plants. In May, an investment of 80 million euros for the modernisation of the Figueira da Foz Industrial Complex was completed, which resulted in the increased production capacity of pulp by 70 thousand tonnes, and in a significant improvement in environmental impact. In Q3, the new tissue production plant was completed in Aveiro, a total investment of 120 million euros that transformed Navigator into the main player in Portugal and no. 3 on the Iberian Peninsula. In Setúbal, an 8 million euro investment was made in the

2018
AN
NU
AL R
EPO
RT
12
*01
reconversion of PM3 for the production of heavyweights paper, increasing the range of products offered by the company and improving the value proposition for our customers. We add a note regarding the divestment of the pellets business, a decision made in 2017 and which produced a positive impact of 13 million euros on the 2018 EBITDA.
In the cement segment, Secil continued to show resilience, considering the adverse settings it faced in most of the locations where it is operating. Except for the Portuguese domestic market, which once again recorded favourable growth in cement consumption, due to the dynamic activity of the construction sector, the operations Secil carries on in foreign markets continued to be marked by declines in the consumption of cement, political instability, and in some situations, heavy pressure from competition.
In this framework, Secil’s revenue was 484 million euros, 3.2% lower than in the previous year, reflecting the negative impact of currency devaluation against the Euro, of the currencies of the different countries where Secil operates. Were it not for this effect, Secil would have grown its revenues by 19 million euros compared to 2017. EBITDA, although also penalised by the foreign exchange effect (-5.3 million euros), was in line with that of the previous year and totalled 89 million euros. The margin, in turn, grew 0.6 p.p. to 18.3%. Except for the
business unit in Lebanon, which fell 27%, essentially due to the introduction of a new tax on the production of cement which took effect in 2017 Q4, and Angola, with a residual negative impact, all the geographic locations registered notable growth – Portugal (+12.5%), Tunisia (+17%) and Brazil (+90%). Also, in terms of the operating performance, we underscore the negative impact of the increased costs for thermal fuels (petcoke), common to all the geographical regions. On the other hand, the implementation of the Return Project, an ambitious programme for improving operational and commercial efficiency, went forward at a good pace and has already had substantial positive impacts, which would be more visible, were it not for some restructuring costs associated with its execution. The environment segment faced a challenging year in 2018. Revenue was 25 million euros, 15% lower than that recorded in the preceding year, due to the lower selling prices of the main finished products. The increase in stocks in Europe due to difficulties in exporting to Asia, the lower selling price of soybean oil, and the stoppage of the biodiesel plants in Europe are some of the main reasons for the experienced drop in prices. EBITDA, in turn, decreased 30% to 5 million euros, in which we highlight the reduction achieved in costs in the acquisition of thermal fuels and raw materials, and the margin reached 22%.

2018 ANN
UAL R
EPO
RT
13
*01
In 2018, important steps were also taken in Semapa Next, the venture capital arm of the Group, with the conclusion of a partnership with the North American company Techstars, one of the largest start-up accelerators in the world. Through this partnership, Semapa Next will develop an acceleration programme in Lisbon with the goal of supporting and investing in start-ups with a global spirit. Aside from the investment component, with this partnership, the Group intends to increase its competitiveness as a whole, through contact with the culture, dynamism, and energy of the world of start-ups.
In Semapa Group, we believe that financial performance cannot be dissociated from performance in other dimensions also critical to our mission and which are fully explained in our Sustainability Report. In the environmental dimension, we have continued to implement proactive strategies, which have earned international recognition. An example of this is the distinction received by The Navigator Company as a global leader in the fight against climate change, having been honoured with a prominent place on the “A” List of the Carbon Disclosure Project. Secil, in turn, carried on with its purpose to increase the ratio of use of alternative fuels, determinant in the reduction of its carbon footprint, which are now being used in its plants in Brazil and Tunisia, following investments made in those countries. In the area of human capital,
we improved our levels of safety on a path where we have set ambitious goals, and we continue to pursue our focus on and investment in people in various programmes, in the subsidiary companies and at the Group level. As for our impact on the communities, the Group and its subsidiaries put forth significant efforts to aid and support various entities and organisations.
Before closing, we underscore the importance of all those who contributed so much to the results presented here - our employees, customers, suppliers, financial institutions, regulatory and supervisory authorities, the Group’s governing bodies and our shareholders - to all, our sincere appreciation and acknowledgment.
The climate of geopolitical and economic uncertainty in which we live will continue on into the times that await us. We operate in a world in rapid change dictated by the advances in technology, with impacts both on the industrial production side and on consumers, and by an ever-increasing spirit of fierce competition. We are fully aware of this, but we are also conscious of our capacity as a Group to remain competitive and overcome the demanding challenges we have ahead of us. For all of this we look to the future with confidence and determination, and we will continue to follow the paths leading to the Group’s development and growth.


*02 DIRECTOR’S REPORT

2018
AN
NU
AL R
EPO
RT
16
*01
*CONTENTS
*01 MACROECONOMIC FRAMEWORK 18*02 OVERVIEW OF SEMAPA GROUP OPERATIONS 19*03 PAPER AND PULP BUSINESS AREA 23 3.1 LEADING BUSINESS INDICATORS 23 3.2 LEADING OPERATING INDICATORS 25 3.3 OVERVIEW OF PAPER AND PULP 25 3.4 BUSINESS REVIEW 27 3.4.1 PULP 27 3.4.2 PAPER 27 3.4.3 TISSUE 28 3.5 DEVELOPMENT 29 3.6 RESOURCES AND SUPPORTING FUNCTIONS 30 3.6.1 SUSTAINABILITY 30 3.6.2 FORESTRY AND WOOD SUPPLY 30 3.6.3 ENERGY 32 3.6.4 INNOVATION, RESEARCH AND DEVELOPMENT 32*04 CEMENT AND OTHER BUILDING MATERIALS BUSINESS UNIT 33 4.1 LEADING BUSINESS INDICATORS 35 4.2 LEADING OPERATING INDICATORS 35 4.3 OVERVIEW OF OPERATION OF CEMENT AND OTHER BUILDING MATERIALS 36 4.4 BUSINESS REVIEW 37 4.4.1 PORTUGAL 37 4.4.2 LEBANON 39 4.4.3 BRAZIL 40 4.4.4 TUNISIA 42 4.4.5 ANGOLA AND OTHERS 43 4.5 RESOURCES AND SUPPORTING FUNCTIONS 45 4.5.1 SUSTAINABILITY AND THE ENVIRONMENT 45

2018 ANN
UAL R
EPO
RT
17
*01
*05 ENVIRONMENT BUSINESS AREA 46 5.1 LEADING BUSINESS INDICATORS 46
5.2 LEADING OPERATING INDICATORS 47 5.3 OVERVIEW OF THE ENVIRONMENT ACTIVITY 47 5.4 RESOURCES AND SUPPORTING FUNCTIONS 48 5.4.1 SUSTAINABILITY AND THE ENVIRONMENT 48 5.4.2 INNOVATION, RESEARCH AND DEVELOPMENT 48*06 HUMAN RESOURCES OF THE SEMAPA GROUP 49*07 SOCIAL RESPONSIBILITY IN THE SEMAPA GROUP 50*08 SEMAPA GROUP – FINANCIAL AREA 51 8.1 INDEBTEDNESS 51 8.2 FINANCIAL RESULTS 51
8.3 RISK MANAGEMENT 51 8.4 LISTED SHARE PRICE 52 8.5 DIVIDENDS 53 8.6 NET PROFIT 53*09 OUTLOOK 54*10 ACKNOWLEDGEMENTS 57*11 PROPOSED ALLOCATION OF PROFITS 58

2018
AN
NU
AL R
EPO
RT
18
*02
1 MACROECONOMIC FRAMEWORK
According to the IMF the global economy continued to grow in 2018, expectedly at 3.7% vs. 3.8% in 2017 (World Economic Outlook Update, IMF, January 2019). Europe and Asia had a poor performance and recent signs hint at a slowdown that should continue in 2019.
The economy of the Euro zone is estimated to have grown 1.8% in 2018, less than the 2.4% growth achieved in 2017 (World Economic Outlook Update, IMF, January 2019), with particular reference to the slowdown in Germany (apathetic private consumption, weak industrial production and moderate external demand), Italy (weak dynamics of domestic demand and high debt costs with sovereign debt sustaining high levels) and France (due to the negative impact of street protests and actions in the industry).
The monetary and financial conditions in the Euro area remained accommodative, in spite of a slight tightening in the year. The ECB reinforced its intention to end net purchases under the extended asset purchase programme in the end of 2018 and continue reinvesting, in full, the principal payments from maturing securities purchased under the asset purchase programme for an extended period of time.
In 2018, the pace of growth of the North-American economy accelerated, to 2.9% in 2018 vs. 2.2% in 2017 (World Economic Outlook Update, IMF, January 2019). The US economy sustained its dynamics, driven by the fiscal plan implemented by the Trump administration, with the Federal Reserve (FED) having increased the reference policy rate 4 times in the year.
Concerning the Portuguese economy, after a 2.8% growth in GDP in 2017, GDP is estimated to have increased by 2.1% in 2018 (INE - Quarterly National Accounts and Annual Preliminary Accounts, February 2019). The GDP of Portugal returned to 2008 levels (at 2011 prices), regaining lost ground after the international financial crisis 10 years ago and the sovereign debt crisis in the Euro area. This progress is in line with the more mature phase of the current economic cycle of the country, and reflects the effects of economic slowdown of the main trade partners.
In the foreign exchange market, the Euro exchange rates in 2018 evolved mostly driven by the appreciation of the currencies of the most advanced economies, especially the North-American Dollar, and the depreciation of the currencies of the emerging market economies, with the exception of the Chinese currency. In this context, the Euro depreciated around 5% against the USD and appreciated vis-a-vis the BRL by around 13%.
Volatility was on the spotlight for commodities, as observed on the oil (Brent) price in 2018, which grew in the first 9 months of the year, up to 86 USD per barrel in October. The year-end price closed at circa 55 USD as a result of a high inventory levels and downward review of global economic growth forecasts.

2018 ANN
UAL R
EPO
RT
19
*02
2 OVERVIEW OF SEMAPA GROUP OPERATIONS
LEADING BUSINESS INDICATORSIFRS - accrued amounts (million euros) 2018 2017 Var.
Revenue 2 198.0 2 164.7 1.5%
EBITDA 548.5 500.7 9.5%
EBITDA margin (%) 25.0% 23.1% 1.8 p.p.
Depreciation, amortisation and impairment losses (215.9) (224.2) 3.7%
Provisions (19.0) (4.2) -348.3%
EBIT 313.7 272.3 15.2%
EBIT margin (%) 14.3% 12.6% 1.7 p.p.
Net financial results (68.8) (63.9) -7.8%
Profit before taxes 244.8 208.4 17.5%
Income taxes (43.7) (14.8) -195.0%
Net profit for the period 201.2 193.6 3.9%
Attributable to Semapa shareholders 132.6 124.1 6.8%
Attributable to non-controlling interests (NCI) 68.6 69.5 -1.3%
Cash-flow 436.0 422.1 3.3%
31/12/2018 31/12/2017Dec18
vs. Dec17
Equity (before NCI) 890.4 843.4 5.6%
Net debt 1 551.6 1 673.7 -7.3%
Net Debt / EBITDA LTM 2.83 x 3.34 x -0.5 x
Notes: • EBITDA = EBIT + Depreciation, amortisation and impairment losses + Provisions • EBITDA LTM = EBITDA in the last twelve months• Cash-flow = Net profit for the period + Depreciation, amortisation and impairment losses + Provisions• Net debt = Non-current interest bearing debt (net of loan issue charges) + Current interest-bearing debt (including debts to shareholders) – Cash
and cash equivalents
REVENUEIn 2018 the Semapa Group recorded consolidated revenue of 2,198.0 million euros, up by 1.5% from the same period in the previous year. Exports and foreign sales amounted to 1,664.9 million euros, representing 75.8% of revenue.
2017
2018
MIL
LIO
N E
UR
OS
PULP AND PAPER
3.3%
1,638.8 1,691.2
CEMENT
-3.4%
482.1498.9
ENVIRONMENT
-14.9%
29.0 24.6
CONSOLIDATED
1.5%
2,164.7 2,198.0
Pulp and paper: 1,691.2 million euros 3.3%Revenue in the Paper and Pulp business area in 2018 stood at 1,691.2 million euros, up by 3.3% year on year. In the period, there was a favourable change in UWF paper, BEKP pulp and tissue prices, but less pulp and paper volume available for sale due to production stoppages in the year.

2018
AN
NU
AL R
EPO
RT
20
*02
Cement: 482.1 million euros 3.4%Revenue of the Cement business in 2018 decreased 3.4% compared to 2017, totalling 482.1 million euros. This de-crease was due to the negative impact of approximately 34.9 million euros due to the devaluation against the Euro of the currencies of the different countries where Secil operates. If the depreciation had not occurred, revenue would have been higher than that of 2018 by about 19 million euros.
Environment: 24.6 million euros 14.9%The revenue of the Environment business area was approximately 24.6 million euros in 2018, down by 14.9% on 2017.
EBITDAIn 2018, EBITDA increased 9.5% in relation to the previous year, standing at 548.5 million euros. The consolidated margin stood at 25.0%, 1.8 p.p. higher than in 2017.
0.4
403.8455.2
88.8 88.7
500.7548.5
7.7 5.4 -0.7
MIL
LIO
N E
UR
OS
PULP AND PAPER
12.7%
CEMENT
-0.1%
CONSOLIDATED
9.5%
ENVIRONMENT
-30,4%
HOLDINGS
-283%
2017
2018
Pulp and paper: 455.2 million euros 12.7%In 2018 the EBITDA of the pulp and paper business totalled 455.2 million euros, 12.7% up on the figure recorded in the previous year, reflecting an EBITDA margin of 26.9%.
Cement: 88.7 million euros 0.1%EBITDA in the cement business area stood at 88.7 million euros in 2018, in line with the figure in the previous year. The EBITDA margin increased from 17.8% to 18.3%. This indicator, as in the case of revenue, was influenced by the currency devaluation against the Euro of the currencies of the different countries where Secil operates, with a negative impact of around 5.3 million euros. In spite of the depreciation of the currency, EBITDA grew significantly across all geographies, excluding Lebanon.
Environment: 5.4 million euros 30.4%The EBITDA for environment business area totalled approximately 5.4 million euros in 2018, representing a decrease of about 30.4% in comparison with 2017. The EBITDA margin stood at 21.8%, down by around 4.8 p.p. on the margin in 2017.
NET PROFIT ATTRIBUTABLE TO SEMAPA SHAREHOLDERSProfit before taxes increased 17.5% and net profit attributable to Semapa shareholders stood at 132.6 million euros, up by 6.8% in relation to the previous year.
-14.6
136.5 148.6
-1.1 -2.6
124.1 132.6
3.2 2.0 -15.4
MIL
LIO
N E
UR
OS
PULP AND PAPER
8.8%
CEMENT
-144.6%
CONSOLIDATED
6.8%
ENVIRONMENT
-38.0%
HOLDINGS
-5.5%
2017
2018

2018 ANN
UAL R
EPO
RT
21
*02
Pulp and paper: 148.6 million euros 8.8%Profit before taxes amounted to 265.4 million euros (vs. 232.1 million euros in the previous year), with income taxes in the period negatively impacted by the establishment of a series of tax provisions and an increase in the state surtax rate. Net profit attributable to shareholders of Semapa in the pulp and paper area was 148.6 million euros, which represented an increase of 8.8% against 2017 (136.5 million euros).
Cement: -2.6 million euros 144.6%Net profit attributable to Semapa shareholders of the cement area was -2.6 million euros, below the -1.1 million euros in 2017.
Environment: 2.0 million euros 38.0%Net profit attributable to Semapa shareholders of the environment area totalled approximately 2.0 million euros in 2018, representing a decrease of about 38.0% in comparison with 2017.
NET DEBT
552.1
692.7 683.0
414.0 386.4
1,673.71,551.6
14.8 11.0
471.3
MIL
LIO
N E
UR
OS
PULP AND PAPER
-9.8%
CEMENT
-27.7%
SEMAPA
-122.0%
ENVIRONMENT
-3.8%
HOLDINGS
-80.8%
2017
2018
On 31 December 2018, consolidated net debt stood at 1,551.6 million euros, representing a reduction of around 122.0 million euros over the figure in the previous year, having decreased in all areas. The consolidated Net Debt/EBITDA ratio was 2.83X, an improvement of 0.5X compared with 31 December 2017.
2018
AN
NU
AL R
EPO
RT
22
*02
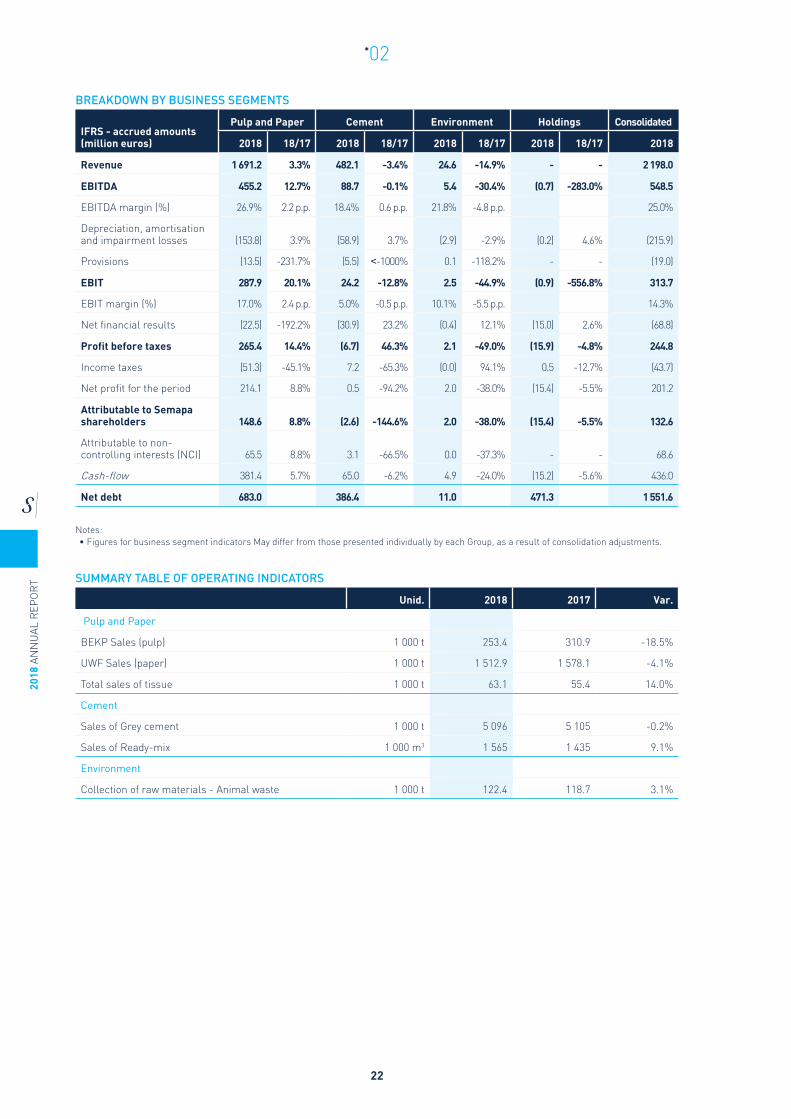
BREAKDOWN BY BUSINESS SEGMENTS
IFRS - accrued amounts (million euros)
Pulp and Paper Cement Environment Holdings Consolidated
2018 18/17 2018 18/17 2018 18/17 2018 18/17 2018
Revenue 1 691.2 3.3% 482.1 -3.4% 24.6 -14.9% - - 2 198.0
EBITDA 455.2 12.7% 88.7 -0.1% 5.4 -30.4% (0.7) -283.0% 548.5
EBITDA margin (%) 26.9% 2.2 p.p. 18.4% 0.6 p.p. 21.8% -4.8 p.p. 25.0%
Depreciation, amortisation and impairment losses (153.8) 3.9% (58.9) 3.7% (2.9) -2.9% (0.2) 4.6% (215.9)
Provisions (13.5) -231.7% (5.5) <-1000% 0.1 -118.2% - - (19.0)
EBIT 287.9 20.1% 24.2 -12.8% 2.5 -44.9% (0.9) -556.8% 313.7
EBIT margin (%) 17.0% 2.4 p.p. 5.0% -0.5 p.p. 10.1% -5.5 p.p. 14.3%
Net financial results (22.5) -192.2% (30.9) 23.2% (0.4) 12.1% (15.0) 2.6% (68.8)
Profit before taxes 265.4 14.4% (6.7) 46.3% 2.1 -49.0% (15.9) -4.8% 244.8
Income taxes (51.3) -45.1% 7.2 -65.3% (0.0) 94.1% 0.5 -12.7% (43.7)
Net profit for the period 214.1 8.8% 0.5 -94.2% 2.0 -38.0% (15.4) -5.5% 201.2
Attributable to Semapa shareholders 148.6 8.8% (2.6) -144.6% 2.0 -38.0% (15.4) -5.5% 132.6
Attributable to non-controlling interests (NCI) 65.5 8.8% 3.1 -66.5% 0.0 -37.3% - - 68.6
Cash-flow 381.4 5.7% 65.0 -6.2% 4.9 -24.0% (15.2) -5.6% 436.0
Net debt 683.0 386.4 11.0 471.3 1 551.6
Notes: • Figures for business segment indicators May differ from those presented individually by each Group, as a result of consolidation adjustments.
SUMMARY TABLE OF OPERATING INDICATORS
Unid. 2018 2017 Var.
Pulp and Paper
BEKP Sales (pulp) 1 000 t 253.4 310.9 -18.5%
UWF Sales (paper) 1 000 t 1 512.9 1 578.1 -4.1%
Total sales of tissue 1 000 t 63.1 55.4 14.0%
Cement
Sales of Grey cement 1 000 t 5 096 5 105 -0.2%
Sales of Ready-mix 1 000 m3 1 565 1 435 9.1%
Environment
Collection of raw materials - Animal waste 1 000 t 122.4 118.7 3.1%

2018 ANN
UAL R
EPO
RT
23
*02
3 PAPER AND PULP BUSINESS AREA3.1 LEADING BUSINESS INDICATORS
REVENUE2018
77%% OF CONSOLIDATED TOTAL
EBITDA2018
83%% OF CONSOLIDATED TOTAL
HIGHLIGHTS IN 2018 (VS. 2017)
• In 2018, revenue amounted to 1,691.6 million euros, 3.3% higher year on year.
1,636,.8 1,691.6
MIL
LIO
N E
UR
OS
REVENUE
3.3%
2017
2018
REVENUE BREAKDOWN BY SEGMENT
MIL
LIO
N E
UR
OS
1,247.7
UWF PAPER
+4.0%
1,199.6
167.0
BEKP PULP
+1.7%
164.3
91.1
TISSUE
+22.5%
74.4
172.5
ENERGY
+3.5%
166.7
13.3
OTHERS AND ELIMINATIONS
-58.2%
31.9
1,691.6
2018
+3.3%
1,636.82017
%18/17
2018
AN
NU
AL R
EPO
RT
24
*02
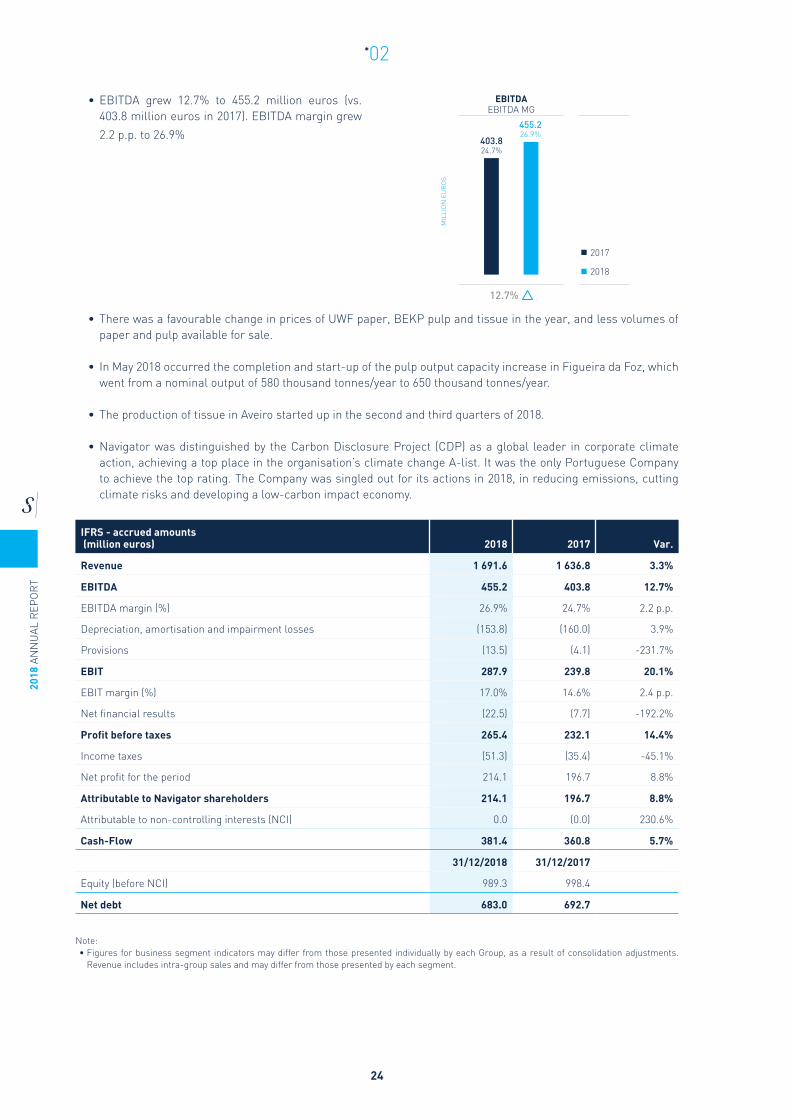
• There was a favourable change in prices of UWF paper, BEKP pulp and tissue in the year, and less volumes of paper and pulp available for sale.
• In May 2018 occurred the completion and start-up of the pulp output capacity increase in Figueira da Foz, which went from a nominal output of 580 thousand tonnes/year to 650 thousand tonnes/year.
• The production of tissue in Aveiro started up in the second and third quarters of 2018.
• Navigator was distinguished by the Carbon Disclosure Project (CDP) as a global leader in corporate climate action, achieving a top place in the organisation’s climate change A-list. It was the only Portuguese Company to achieve the top rating. The Company was singled out for its actions in 2018, in reducing emissions, cutting climate risks and developing a low-carbon impact economy.
IFRS - accrued amounts (million euros) 2018 2017 Var.
Revenue 1 691.6 1 636.8 3.3%
EBITDA 455.2 403.8 12.7%
EBITDA margin (%) 26.9% 24.7% 2.2 p.p.
Depreciation, amortisation and impairment losses (153.8) (160.0) 3.9%
Provisions (13.5) (4.1) -231.7%
EBIT 287.9 239.8 20.1%
EBIT margin (%) 17.0% 14.6% 2.4 p.p.
Net financial results (22.5) (7.7) -192.2%
Profit before taxes 265.4 232.1 14.4%
Income taxes (51.3) (35.4) -45.1%
Net profit for the period 214.1 196.7 8.8%
Attributable to Navigator shareholders 214.1 196.7 8.8%
Attributable to non-controlling interests (NCI) 0.0 (0.0) 230.6%
Cash-Flow 381.4 360.8 5.7%
31/12/2018 31/12/2017
Equity (before NCI) 989.3 998.4
Net debt 683.0 692.7
Note: • Figures for business segment indicators may differ from those presented individually by each Group, as a result of consolidation adjustments.
Revenue includes intra-group sales and may differ from those presented by each segment.
• EBITDA grew 12.7% to 455.2 million euros (vs. 403.8 million euros in 2017). EBITDA margin grew
2.2 p.p. to 26.9% 403.824.7%
MIL
LIO
N E
UR
OS
EBITDAEBITDA MG
12.7%
2017
2018
455.226.9%
2018 ANN
UAL R
EPO
RT
25
*02
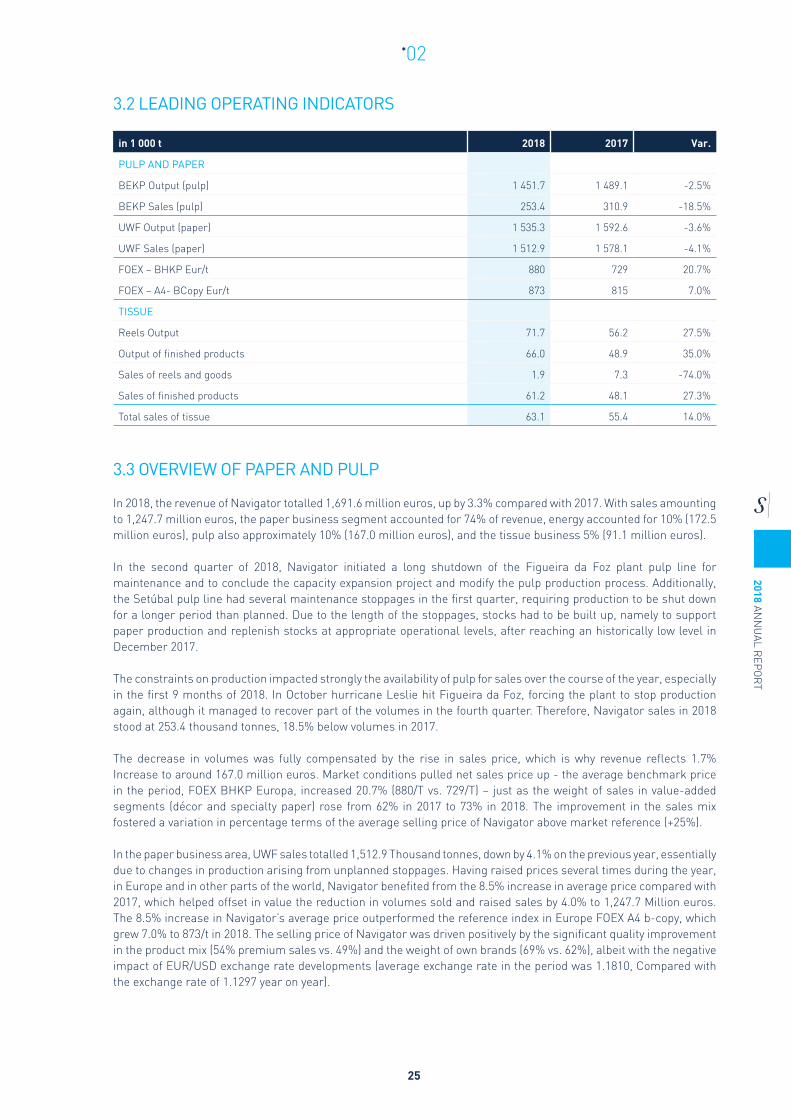
3.2 LEADING OPERATING INDICATORS
in 1 000 t 2018 2017 Var.
PULP AND PAPER
BEKP Output (pulp) 1 451.7 1 489.1 -2.5%
BEKP Sales (pulp) 253.4 310.9 -18.5%
UWF Output (paper) 1 535.3 1 592.6 -3.6%
UWF Sales (paper) 1 512.9 1 578.1 -4.1%
FOEX – BHKP Eur/t 880 729 20.7%
FOEX – A4- BCopy Eur/t 873 815 7.0%
TISSUE
Reels Output 71.7 56.2 27.5%
Output of finished products 66.0 48.9 35.0%
Sales of reels and goods 1.9 7.3 -74.0%
Sales of finished products 61.2 48.1 27.3%
Total sales of tissue 63.1 55.4 14.0%
3.3 OVERVIEW OF PAPER AND PULP
In 2018, the revenue of Navigator totalled 1,691.6 million euros, up by 3.3% compared with 2017. With sales amounting to 1,247.7 million euros, the paper business segment accounted for 74% of revenue, energy accounted for 10% (172.5 million euros), pulp also approximately 10% (167.0 million euros), and the tissue business 5% (91.1 million euros).
In the second quarter of 2018, Navigator initiated a long shutdown of the Figueira da Foz plant pulp line for maintenance and to conclude the capacity expansion project and modify the pulp production process. Additionally, the Setúbal pulp line had several maintenance stoppages in the first quarter, requiring production to be shut down for a longer period than planned. Due to the length of the stoppages, stocks had to be built up, namely to support paper production and replenish stocks at appropriate operational levels, after reaching an historically low level in December 2017.
The constraints on production impacted strongly the availability of pulp for sales over the course of the year, especially in the first 9 months of 2018. In October hurricane Leslie hit Figueira da Foz, forcing the plant to stop production again, although it managed to recover part of the volumes in the fourth quarter. Therefore, Navigator sales in 2018 stood at 253.4 thousand tonnes, 18.5% below volumes in 2017.
The decrease in volumes was fully compensated by the rise in sales price, which is why revenue reflects 1.7% Increase to around 167.0 million euros. Market conditions pulled net sales price up - the average benchmark price in the period, FOEX BHKP Europa, increased 20.7% (880/T vs. 729/T) – just as the weight of sales in value-added segments (décor and specialty paper) rose from 62% in 2017 to 73% in 2018. The improvement in the sales mix fostered a variation in percentage terms of the average selling price of Navigator above market reference (+25%).
In the paper business area, UWF sales totalled 1,512.9 Thousand tonnes, down by 4.1% on the previous year, essentially due to changes in production arising from unplanned stoppages. Having raised prices several times during the year, in Europe and in other parts of the world, Navigator benefited from the 8.5% increase in average price compared with 2017, which helped offset in value the reduction in volumes sold and raised sales by 4.0% to 1,247.7 Million euros. The 8.5% increase in Navigator’s average price outperformed the reference index in Europe FOEX A4 b-copy, which grew 7.0% to 873/t in 2018. The selling price of Navigator was driven positively by the significant quality improvement in the product mix (54% premium sales vs. 49%) and the weight of own brands (69% vs. 62%), albeit with the negative impact of EUR/USD exchange rate developments (average exchange rate in the period was 1.1810, Compared with the exchange rate of 1.1297 year on year).

2018
AN
NU
AL R
EPO
RT
26
*02
The tissue business featured an upward adjustment of the average sales price (+7.5%) compared with 2017, as a result of the improvement in the product mix, with reels representing a smaller proportion and finished products a higher proportion, and also due to the price rises implemented. Sales stood at 91.1 million euros, 22.5% above that of 2017, including sale of finished products from the new Aveiro plant. However, the increase in average tissue prices was not sufficient to absorb higher input costs by approximately 30%, in particular the price of hardwood pulp (which impacted the Vila Velha de Ródão plant) and of softwood pulp as well, and of some chemicals.
In this context, EBITDA stood at 455.2 million euros, which compares to 403.8 million euros in 2017, representing an increase of 12.7% and EBITDA margin of 26.9% (Vs. 24.7%). EBITDA in this period includes the positive impact of the sale of the us pellets business (which, excluding costs and adjustments, amounted to approximately 13.3 million euros) and the negative effect of the anti-dumping duty (around 18 million euros). EBITDA in 2018, without such impacts, would have been 460 million euros (+14%) and EBITDA margin of 27.2%.
The impact on the accounts of the anti-dumping duty brought EBITDA down by 18 million euros, and includes recognition of 3.6 million euros relating to retroactive application of the rate of 1.75% on sales in the first period of review, from August 2015 to February 2017. The total impact of the anti-dumping duty also includes an additional sum of approximately 14 million euros relating to application of a new duty estimated for the second and third periods of review, that Navigator prudently decided to reflect in its accounts.
Production costs are still negatively impacted by unfavourable developments in chemicals (in a global amount of 10 million euros), which impacted variable unitary production costs of pulp, paper and tissue. Also, fibre costs increased approximately 14 million euros, essentially due to the acquisition of hardwood fibre for the tissue operations at Vila Velha de Ródão, as well as the purchase of softwood pulp. In fixed costs, payroll costs registered the most significant increase (+9.2 million euros) as a result of the increase in the performance bonuses estimated as acknowledgement of the Navigator’s strong results, the workforce expansion due to the new tissue project in Aveiro and the rejuvenation programme under way. Navigator, on the other hand, continued with the m2 operational excellence programme, having reached a positive impact of approximately 20.8 million euros in EBITDA year on year.
The financial results amounted to a loss of 22.5 million euros (vs. a loss of 7.7 million euros). In spite of the improvement in Navigator borrowing costs, several factors impacted the development of financial results negatively, including (i) a drop of 10 million euros in gains on currency hedges taken out by the company, (ii) a reduction of 3.3 million euros in results from investment of surplus liquidity, in a context of overall fall in financial markets, and (iii) recognition at the end of the first quarter of a negative amount of approximately 1.5 million euros resulting from the difference between the nominal value and the current value of the amount to be received for the sale of the pellets business (USD 45 million).
Profit before taxes amounted to 265.4 million euros (vs. 232.1 million euros). Income taxes in the financial year were negatively impacted by higher profit before taxes (which includes profit from the sale of the pellets business), the establishment of a series of tax provisions and an increase in the state surtax rate.
Therefore, Navigator’s net profit in 2018 amounted to 214.1 million euros, up by 8.8% compared with 2017 (196.7 million euros).

2018 ANN
UAL R
EPO
RT
27
*02
3.4 BUSINESS REVIEW
3.4.1 PULP3.4.1.1 MARKET BACKGROUND
Global market conditions for chemical pulp were positive in the first nine months of 2018, with demand for pulp for market exceeding 2% according to data from the Pulp and Paper Products Council (PPPC). This trend was reversed in the last quarter of the year, with demand shrinking around 2% year-over-year (December 2018 estimate)
Global demand for BEKP pulp grew by more than 5%, particularly in china (around 14%), driven in particular by new investment in tissue capacity estimated at 1.3 million tonnes in 2018.
On the supply side, there were some constraints (planned and unplanned shutdowns) that took away from the market an estimated 1.9 million tonnes of hardwood pulp and 1.0 million tonnes of softwood pulp.
3.4.1.2 OPERATIONAL PERFORMANCE
in 1 000 t 2018 2017 Var.
BEKP Output 1 452 1 489 -2.5%
Aveiro 358 354
Figueira da Foz 575 593
Setúbal 519 542
BEKP Sales 253 311 -18.5%
Foex – BHKP Eur/t 880 729 20.7%
In 2018, the pulp market for Navigator decreased 18.5% in sales volumes (equivalent to 58 thousand tonnes).
During the year, Navigator had production stoppages in pulp lines in different plants, not only due to maintenance, but also due to the completion of the project to increase installed capacity, and to hurricane Leslie that forced to a halt of the Figueira da Foz plant. As a result of the length of the stoppages, stocks had to be built up again, namely to support paper production and replenish stocks at appropriate levels for production, after reaching an historically low level in December 2017.
The decrease in volume was fully offset by the rise in net sales price due to market conditions - the average benchmark price in the period, FOEX BHKP Europe, increased 20.7% (880/T vs. 729/T) – just as the weight of sales in value-added segments (décor and specialty paper) rose from 62% in 2017 to 73% in 2018.
3.4.2 PAPER
3.4.2.1 MARKET BACKGROUND
In 2018, UWF world demand fell slightly year-on-year - around 1% -, due to the negative performance of European and US demand, which decreased by 4.3% and 1.9%, respectively, but with the benefit of about 1% growth in demand in emerging markets. In view of the high price of paper pulp in the first three quarters of the year, prices increased in all regions of the world in the same period, with a drop in Asia in the last months of the year.
On the supply side, there was significant divestment in the us, particularly in the 2nd quarter, with the end of UWF production at the Georgia Pacific Camas plant and subsequent announcement of the complete withdrawal of the UWF business in 2019. Conversely, two paper machines began operating in Chenming, China, in the summer of 2018, totalling 1 million tonnes of annual capacity.

2018
AN
NU
AL R
EPO
RT
28
*02
Europe continues to be Navigator’s main market, where 58% of sales in 2018 were registered in the premium segment, although, in pursuit of the goal of diversifying customers and geographies, the Company has channelled more than 40% of its sales to markets outside Europe in 2018, in which the premium segment accounted for 49% of all sales. Globally, Navigator has sold paper in more than 130 countries or autonomous territories.
Ongoing commitment to product innovation had Navigator invest in the expansion of its range of in-house produced weights by upgrading paper machine 3 in Setúbal for the production of heavyweights that occurred at the end of the year.
3.4.2.2 OPERATIONAL PERFORMANCE
in 1 000 t 2018 2017 Var.
UWF Output 1 535 1 593 -3.6%
Figueira da Foz 744 771
Setúbal 791 822
UWF Sales 1 513 1 578 -4.1%
FOEX – A4- BCopy Eur/t 873 815 7.0%
Navigator’s sales in volumes in 2018 amounted to 1,513 thousand tonnes, 4.1% below the figure in the previous year, despite an improvement to the product mix, in terms of quality (54% premium sales vs. 49%) and the weight of own brands (69% vs. 62%).
The progressive improvement in market conditions led to positive developments in the reference price indicator for Europe - PIX A4, a growth of 7.0% over the previous year.
3.4.3 TISSUE3.4.3.1 MARKET BACKGROUND
The European tissue market is among the most mature markets, growing at the CAGR rate of 1% in line with GDP.
The installed capacity of the production of tissue reels in the Iberian Peninsula increased by around 300 thousand tonnes in the last two years (82 thousand tonnes in 2017 and 218 thousand tonnes in 2018), for three end uses: reduce dependence on the reel converting outsourcing (raw material outsourcing); increased capacity and efficiency of converting for the Iberian sales and increased reel export capacity (mainly to the United Kingdom).
The higher sales volume has resulted in growth in several markets, particularly international markets such as France and Spain, the latter up 30% in 2018 and accounting for 35% of Navigator’s tissue sales. In the Portuguese market, the Company achieved a 20% growth, representing a weight of 50% of sales (down from 60% in 2017).
In terms of segments, Navigator grew in two major channels - at home and away from home -, with 71% growth in the at home consumer channel, accounting for 40% of sales.
3.4.3.2 OPERATIONAL PERFORMANCE
in 1 000 t 2018 2017 Var.
Reels Output 72 56 27.5%
Output of finished products 66 49 35.0%
Sales of reels and goods 2 7 -74.0%
Sales of finished products 61 48 27.3%
Total sales of tissue 63 55 14.0%

2018 ANN
UAL R
EPO
RT
29
*02
Considering the increase in capacity already achieved in 2018, Navigator posted a 14.0% growth in tissue sales volume (tonnes) compared to the previous year, showing an improvement in the product mix, with the lower weight of reels and a higher percentage of finished product.
3.5 DEVELOPMENT
Navigator recorded an overall investment value of 216.5 million euros. In cumulative terms, Aveiro’s tissue project accounted for 83.4 million euros, Figueira da Foz’s capacity increase was around 37.3 million euros and recurring investment in the pulp and paper business totalled 95.8 million euros. The latter includes the value of the reconversion of PM3 in Setúbal (8.2 million euros) and the capitalization of some costs related to production stoppages and the damage caused by hurricane Leslie to the Figueira da Foz plant.
TISSUEThe completion of the new tissue plant project in Aveiro marks an important step in the strategic development outlined by the Group in 2015, since it positions Navigator as the third largest tissue producer in the Iberian peninsula, with total production capacity of 130 thousand tonnes of reels and 120 thousand tonnes of converting (finished product). The new plant, equipped with large scale and sophisticated industrial assets, benefits from upstream integration of pulp, which gives it competitive advantages in terms of production costs, the use of high quality eucalyptus pulp produced in Aveiro, and location by the port of Aveiro, convenient for selling its products in more distant markets. The transformation lines began operating in the second and third quarters; the domestic line started in May and the napkins and industrial lines began in July. Reels production started in September, and is still in the ramp-up stage.
PULPThe year 2018 was marked by the completion and start-up of the PO3 project (optimisation project 3) for increasing pulp output capacity of Figueira da Foz, which went from a nominal output of 580 thousand tonnes/year to 650 thousand tonnes/year. The project also included a set of important environmental improvements that produced a significant overall impact on the Figueira da Foz manufacturing complex. One of the goals was to improve the efficiency of the pulp production process, by reducing specific wood and chemical consumption, and to implement best environmental practices, namely by introducing oxygen delignification and subsequently reducing waste water production, and also investing in non-condensable gas burners in the recovery boiler for reducing smells to lower and almost imperceptible levels.
HEAVYWEIGHTS PAPERIn q4 the project for the conversion of paper machine 3 in the Setúbal industrial complex was completed, equipping it to produce paper grammages between 135 and 300 g/m2, with a total investment of 11.8 million euros. Converting the paper machine to produce heavyweights entailed adding new equipment and modifying existing equipment, to ensure that Navigator will produce papers that can position themselves at the top of the quality range in the heavyweights market.
The heavyweights segment complements the 60-120 g/m2 grammages, in particular in the graphics segment, representing one third of folio UWF consumption in Europe, and about 7% of total UWF. Own production of heavyweights paper will enable Navigator to explore more business opportunities and it is one way of complementing the current portfolio with quality heavyweights, helping Navigator to develop its commercial presence in a market niche with good growth prospects. The goal is to ensure own production of about 35 thousand tonnes at cruise speed.
MOZAMBIQUEPortucel Moçambique and the government of Mozambique signed a memorandum of understanding (MOU) related to the restructuring of the investment project, which will be implemented in two stages. Initially, a 40 thousand hectare forest base will be created for ensuring supply to a eucalyptus woodchip production and export operation plant (to be built) that will supply 1 million tonnes a year, a total investment estimated at 140 million us dollars.

2018
AN
NU
AL R
EPO
RT
30
*02
A joint Portucel Moçambique and government team was set up to ensure the necessary conditions mentioned abovehave been met for proceeding with the investment, which includes setting up the necessary logistics infrastructure for exporting woodchip. Consequently, the first stage of the project depends on the fulfilment of the requirements laid down in the memorandum of understanding which has been signed with the government of Mozambique, but no breakthrough has been observed until the end of the year 2018.
Given that there is no active market for eucalyptus wood in Mozambique and the conditions for the construction of a chip plant are not yet in place, the Company decided to record an impairment related to the fair value of the biological assets implanted in Zambezia, in the amount of 6.7 million euros.
Although the MOU entered into by the Mozambican Government mentioned above provides for a “best efforts” commitment to creating these conditions by 31 December last, this could not be achieved, and both parties continue to work towards this goal. In view of the current conditions, in addition to the respective impairments, Navigator prudently decided to record an additional provision of 12 million euros in its accounts at the end of 2018 in order to cope with the current project development scenario.
3.6 RESOURCES AND SUPPORTING FUNCTIONS
3.6.1 SUSTAINABILITY
Without prejudice of the sustainability report which will be published, it should be underscored that sustainability is a fundamental pillar of Navigator’s operations.
In the beginning of 2019, the prestigious international organisation CDP (Carbon Disclosure Project) distinguished Navigator as a global leader in corporate sustainable action (“a” list company), in recognition for its highly valuable contribution to fighting climate change. The Company was singled out for its actions in 2018 in reducing emissions, cutting climate risks and developing a low-carbon impact economy. It was the only Portuguese Company to achieve the top rating.
3.6.2 FORESTRY AND WOOD SUPPLY
SUSTAINABLE MANAGEMENT The forest and the sustainability of the forestry sector are a central strategic priority for Navigator, where the Company aims to promote best forestry and forest exploration practices, both in the area it manages and in other Portuguese forests.
The commitment to sustainable development, embraced by the simultaneous pursuit of economic prosperity of both Navigator and the neighbouring rural communities, environmental responsibility and social equity are the corner stones of the company’s strategy.
Navigator plays a crucial role in promoting wealth in the regions where it is located, managing more than 110,000 hectares of forest from the north to the south of the country (55% owned and 45% leased). In this way the promotion of the rural economy is a determining reality, promoting the management and enhancement of the rural spaces, in particular those managed by it, while fostering the regional activity through planting, management and exploration activities in these areas.
In 2018, Navigator invested around 28 million euros directly in this value chain in the 18 districts of continental Portugal where it is located, with approximately 61% of all investment funnelled to the hinterland.
In relation to the approximately 50,000 hectares leased, the rural economy is fostered through the compensation paid for the forest land used, and the work carried out by a Group of local companies, which Navigator subcontracts to provide forestry and farming services. Except where there are no local providers, all services used by the Company in managing own and leased properties are subcontracted to local companies, thus also helping develop a forestry service sector, which May in time provide services to Navigators and third parties.

2018 ANN
UAL R
EPO
RT
31
*02
While Navigator internally ensures a set of good practices in terms of the genetic improvement of eucalyptus globulus, which contribute to the success of the eucalyptus plantations, 2018 was a turning point in this area, as the Company invested significantly in sharing this knowledge with its external partners.
The production of forest and ornamental plants by Navigator’s Viveiros Aliança is an important lever in terms of the productivity in the forests managed by the company, since they present excellent growth levels and good performance on the ground. The quality of the clones, product of 30 years of research and experimentation conducted by RAIZ, were not enough for market needs. In 2018 the Company invested in increasing the capacity of its nurseries, from 6 million eucalyptus clone plants to 8.5 million per year.
Consequently, the resulting increase in production will be directed at the market, improving the genetic material available for planting. On the other hand, Navigator also sought to develop partnerships with other nurseries and implement collaborative programs that allow them to have access to better genetic material and improved plant production techniques.
WOOD SUPPLIERS Navigator is the largest private forestry producer in Portugal, efficiently and responsibly managing more than 110 000 hectares of owned and leased forested areas. With its own forestry policy and code of best forest practices, the Company demonstrates its concern for preserving forest spaces, which lie at the very heart of its business.
The industrial complexes are supplied with wood from its own forests on the national territory, and wood from leased forests in Portugal (the Company is currently extending these areas to the Spanish territory), a source of supply that the Company intends to expand. In this case, it involves leasing new forests from landowners who choose not to manage their land themselves. By leasing more and more land, Navigator also ensures a significant increase in its presence on the national territory.
A second source of supply, which accounts for more than 50% of the total wood supplied to the industrial complexes, is the domestic market, but through the thousands of independent producers who sell Eucalyptus globulus to Navigator. Followed by the Spanish market (namely Galicia and Andalusia) and, finally, the market outside the Iberian Peninsula, in particular Latin America.
The domestic purchase is an example of the significant impact on the rural economy, since two thirds of the raw material consumed by the Company are domestically supplied, and only 12% is wood coming from the areas it manages.
Forest certification is still one of the priorities of Navigator, whose forest management model is certified since 2007, for all assets it manages in Portugal, a commitment that is renewed annually. Forest management at Navigator is certified by two world reference programmes: the forest stewardship council® (FSC®) and the programme for the endorsement of Forest Certification Schemes™ (PEFC™).
In parallel, Navigator helps promote certified forest management in areas that are not managed directly by the company. This programme that aims at encouraging the adoption of FSC and PEFC Forest Certification Systems, which began some time ago in areas not managed directly by the company, seeks to enhance the adoption of forest management best practices as recognised through the certification. In 2018 the Company reinforced its focus on this area by increasing the consumption of wood from certified management, which went up from 27% in 2017 to 42% in 2018.
This is a journey travelled with partners. It is essential to reach out to forest producers, which has been possible with the help of intermediaries who purchase the wood, including the implementation of specific trade incentives, and the signing of protocols of collaboration with forestry producer organisations and certification Groups, among other entities. Thus, together it is possible to fund a variety of dissemination actions, to promote the improvement of technical services and train human resources, carried out by associations through capillary action with forest producers, while promoting the local economy and ensuring greater stability for the local communities.

2018
AN
NU
AL R
EPO
RT
32
*02
Forest management plays a leading role in fire prevention, which requires careful and continuous management of forests. Scientific research and practice on the ground show that poorly managed forests build up fuel and react to fire in a very similar way, regardless of the species that populate it.
In areas lacking care, more fires are sparked, while in areas with professional management of eucalyptus trees, fires occur less frequently and cause less damage. Less than 1% of all professionally managed plantations, namely properties of industrial eucalyptus companies, has burnt. Active management, i.e. human effort to clean and care for the forest, significantly reduces fire hazards. With this goal in mind, in 2018 Navigator put more than 3.3 million euros into preventing and controlling forest fires.
3.6.3 ENERGY
In the energy business, the hike in Navigator power sales prices was of 3.5%, to 172.5 million euros, reflecting mostly the increase in sales price, since power sales from the operation of the natural gas combined-cycle power stations benefited from the sharp hike in Brent prices (roughly 32%), which directly influences the index to which prices are linked. In spite of the increase, total gross production of electric power by Navigator in 2018 decreased 1.6% year on year, as a result of the unplanned stoppages, nonetheless reaching 2.19 Twh in total production value.
In 2018, the solar power plant of Herdade de Espirra, composed of approximately 350 solar power panels, began producing for self-consumption with an installed capacity of 112.6 Kw.
3.6.4 INNOVATION, RESEARCH AND DEVELOPMENT
2018 Was a year of great importance for RAIZ which, after becoming a member of the European Business Network (EBN) in August 2018, saw its work acknowledged with the European Business Innovation Centre certification.
This is the only innovation certification granted by the European Commission, which honours organisations that implement innovation procedures, processes and best innovation practices. It has positioned RAIZ at a level of excellence in the areas of Entrepreneurship, Innovation, Technology and Knowledge, as it became part of a Group of global elite organisations whose mission - acknowledged by the European Commission - is to foster regional and national innovation ecosystems in the field of Forestry and Bioeconomics.
Recognized as an entity of the National Scientific and Technological System and as an Interface Centre - Centre for the Development and Transfer of Technology, the RAIZ Institute has devoted part of its research work to the study on the impact of Eucalyptus plantations on water resources, soil and biodiversity and in parallel to IDI (Research, Development and Innovation) in Bioeconomics. Navigator funnels much of its investment to research and development in the pulp and paper industry from eucalyptus through RAIZ, consistently strengthening the bridges between academia and the industry.
In 2018, RAIZ also implemented several measures for improving and optimising its work, decision-making processes and the evaluation of the impact of innovation and Technological Research Programmes on Organisations.

2018 ANN
UAL R
EPO
RT
33
*02
4 CEMENT AND OTHER BUILDING MATERIALS BUSINESS UNIT
REVENUE2018
22%% OF CONSOLIDATED TOTAL
EBITDA2018
16%% OF CONSOLIDATED TOTAL
HIGHLIGHTS IN 2018 (VS. 2017)
• Secil’s revenue at 31 December 2018 amounted to 483.6 million euros, 3.2% lower than in the previous year, reflecting a decrease of 15.9 million euros. This decrease was mainly due to the negative impact of currency devaluation against the Euro, of the currencies of the different countries where Secil operates, of around 34.9 million euros.
• If the adverse exchange rate effect had not occurred, revenue would have been approximately 19 million euros higher than in 2017.
499.5 483.6
MIL
LIO
N E
UR
OS
REVENUE
-3.2%
2017
2018
REVENUE BREAKDOWN BY COUNTRY
2017
%18/17
MIL
LIO
N E
UR
OS
262.3
PORTUGAL
+1.6%
258.1
82.0
LEBANON
-11.0%
92.2
78.1
BRAZIL
-9.1%
85.9
46.9
TUNISIA
+10.2%
42.6
14.3
OTHERS
-30.8%
20.7
483.6
2018
+3.2%
499.5
Note: others includes Angola and others.

2018
AN
NU
AL R
EPO
RT
34
*02
EBITDA reached 88.7 million euros, in line with the previous year. The EBITDA margin increased from 17.8% to 18.3%. This indicator, as in the case of revenue, was influenced by the currency devaluation against the Euro of the currencies of the different countries where Secil operates, with a negative impact of around 5.3 million euros. Despite the exchange rate devaluation, EBITDA increased significantly in all geographies except for Lebanon.
88.817.8%
MIL
LIO
N E
UR
OS
EBITDAEBITDA MG
-0.1%
2017
2018
88.718.3%
EBITDA BREAKDOWN BY COUNTRY
2017
%18/17
MIL
LIO
N E
UR
OS
41.0
PORTUGAL
+12.5%
36.4
26.2
LEBANON
-26.9%
35.9
8.3
BRAZIL
+89.7%
4.4
10.5
TUNISIA
+17.3%
8.9
2.7
OTHERS
-14.9%
3.1
88.7
2018
-0.1%
88.8
Note: others includes Angola and others.
• Net financial results improved to -30.9 million euros, against -40.3 million euros in 2017. The positive difference in comparison with the same period in the previous year is mostly due to less financial debt in Brazil and the reduction in the cost of debt in Brazil and Portugal.
• Income taxes in 2018 are positively impacted by the reversal of tax provisions.
• Net debt dropped from 414.0 million euros to 386.4 million euros.

2018 ANN
UAL R
EPO
RT
35
*02
4.1 LEADING BUSINESS INDICATORS
IFRS - accrued amounts (million euros) 2018 2017 Var.
Revenue 483.6 499.5 -3.2%
EBITDA 88.7 88.8 -0.1%
EBITDA Margin (%) 18.3% 17.8% 0.6 p.p.
Depreciation, amortisation and impairment losses (58.9) (61.2) 3.7%
Provisions (5.5) 0.2 <-1000%
EBIT 24.2 27.7 -12.8%
EBIT Margin (%) 5.0% 5.6% -0.6 p.p.
Net financial results (30.9) (40.3) 23.2%
Profit before taxes (6.7) (12.5) 46.3%
Income taxes 7.2 20.8 -65.3%
Net profit for the period 0.5 8.2 -94.2%
Attributable to Secil shareholders (2.6) (1.1) -144.6%
Attributable to non-controlling interests (NCI) 3.1 9.3 -66.5%
Cash-flow 65.0 69.3 -6.2%
31/12/2018 31/12/2017
Equity (before NCI) 354.7 385.2
Net debt 386.4 414.0
Note: • Figures for business segment indicators May differ from those presented individually by each Group, as a result of consolidation adjustments.
Revenue includes intra-group sales and May differ from those presented by each segment.
4.2 LEADING OPERATING INDICATORS
in 1 000 t 2018 2017 Var.
Annual cement production capacity 9 750 9 750 0.0%
Production
Clinker 4 688 4 934 -5.0%
Cement 5 271 5 143 2.5%
Sales
Grey cement 5 096 5 105 -0.2%
White cement 91 86 5.1%
Clinker 438 659 -33.5%
Aggregates 3 110 3 019 3.0%
Precast 122 128 -4.6%
Mortars 154 128 20.5%
Hydraulic lime 25 26 -3.4%
Mortar fixative 19 18 4.6%
in 1 000 m3
Ready-mix 1 565 1 435 9.1%
Note: volumes excluding inter-segment sales.

2018
AN
NU
AL R
EPO
RT
36
*02
4.3 OVERVIEW OF OPERATION OF CEMENT AND OTHER BUILDING MATERIALS
REVENUE BREAKDOWN BY SEGMENT
2017
%18/17
M IL
LIO
N E
UR
OS 355.0
CEMENT AND CLINKER
-5.0%
373.5
90.1
READY-MIX
+2.4%
88.0
15.7
AGGREGATES
-5.9%
16.6
15.4
MORTARS
+14.2%
13.5
7.5
OTHERS
-5.3%
7.9
483.6
2018
-3.2%
499.5
Note: others includes precast and others.
Analysing by segment, the cement and clinker revenue dropped 5.0% compared with the previous year, representing a smaller share of total operations (73.4% in 2018 vs. 74.8% in 2017). This decrease is the result of less volumes sold and the depreciation of the local currencies vis-a-vis the euro.
Ready-mix concrete volumes sold increased 9.1%, which resulted in a growth in revenue of 2.4%.
EBITDA BREAKDOWN BY SEGMENT
2017
%18/17
M IL
LIO
N E
UR
OS
76.3
CEMENT AND CLINKER
-1.4%
77.4
4.7
READY-MIX
+24.7%
3.7
2.9
AGGREGATES
-2.5%
3.0
4.1
MORTARS
+20.2%
3.4
0.7
OTHERS
-46.2%
1.2
88.7
2018
-0.1%
88.8
Note: others includes precast and others.
In 2018, EBITDA from cement and clinker was down by 1.4% compared with the previous year, standing at 76.3 million euros. Ready-mix concrete EBITDA increased by 24.7% year on year.

2018 ANN
UAL R
EPO
RT
37
*02
4.4 BUSINESS REVIEW
4.4.1 PORTUGAL4.4.1.1 MARKET BACKGROUND
Economic growth in 2018 was 2.1% according to INE – National Statistical Office (quarterly national accounts and annual preliminary accounts, February 2019). This development was supported by rising exports and domestic demand pick up.
The activity of the construction sector remained positive throughout 2018, and its annual production is estimated to have increased 3.5% in real terms compared to the previous year. The civil engineering segment had possibly the most moderate performance compared to other sector activities (+2%). The building segment developed more positively, +4.9%, with an increase of 7.0% in the construction of residential buildings and a growth of 2.8% in the construction of non-residential buildings.
Consumption of cement in Portugal was marked by negative monthly variations in March and April 2018 due to the rain, but by positive variations in all other months of the year, since there are no other factors impacting the market negatively, there are construction works and there is dynamics in the players. It is estimated that the market grew around 5% in 2018, year on year.
4.4.1.2 DESCRIPTION OF THE ACTIVITY
258.1 262.3
M IL
LIO
N E
UR
OS
REVENUE
1.6%
2017
2018
36.414.1%
M IL
LIO
N E
UR
OS
EBITDAEBITDA MG
12.5%
2017
2018
41.015.6%
Revenue in Portugal was up by 1.6% compared with 2017, totalling 262.3 million euros.
The cement business unit in Portugal recorded revenue of 156.5 million euros, down by 2.1% over the figure recorded in 2017, due to less cement volumes sold.
In the domestic market, volumes sold increased 0.8% although the volumes sold excluding inter-segment sales dropped. The rise in average sales price helped mitigate the effect.
In the foreign market, surplus supply in Europe and the Mediterranean continued to drive high level of competition, with a negative effect on volumes and selling prices (which remained low notwithstanding the increase in production costs due to the rise in fuel costs).
Total export volumes sold, excluding inter-segment sales, decreased by approximately 14.7%. This was due to a 33% decrease in clinker sales (resulting from the increase in CO2 cost, which peaked at 25 euros in September) and 9% less cement sales to markets outside of the Group. On the other hand, Secil terminal sales rose around 20%, in particular in the Netherlands and Spain (the latter joined the Group only in April 2017).
The more favourable mix of cement vs. Clinker sales impacted revenue positively due to the price effect, while the decrease in volumes brought export revenue down by about 2.1%.

2018
AN
NU
AL R
EPO
RT
38
*02
In the other business segments with operations based in Portugal (ready-mix concrete, aggregates, mortars and precast), accrued revenue in December 2018 amounted to 105.8 million euros, up by 7.6% compared with the previous year.
The increase took place in almost all areas of building materials, benefiting from greater building dynamics. The concrete business unit recorded a 18.4% increase in volumes sold in the Portuguese market, and also positively influenced by sales in Spain.
EBITDA of Portuguese operations grew 12.5%, standing at 41.0 million euros vs. 36.4 million euros in the previous year.
The cement business unit had an EBITDA of 29.9 million euros, higher than the EBITDA recorded year on year (+14.0%). In spite of the increase in variable costs, as a result of the rise in fossil fuel prices and the decrease in export sales, higher sales price in the domestic market and the sale of surplus CO2 licenses (9.8 million euros vs. 2.8 million euros in 2017) led to EBITDA above 2017 levels.
The EBITDA of the building material business units amounted to 11.0 million euros, which compares to 10.1 million euros accrued in December 2017, despite the pressure on sales prices of ready-mix concrete and higher variable costs of concrete production.
4.4.1.3 OPERATIONAL PERFORMANCE
Unit 2018 2017 Var.
Clinker Production 1 000 t 1 821 1 962 -7.2%
Cement Production 1 000 t 1 700 1 605 5.9%
Cement and Clinker Sales
Internal Market 1 000 t 1 163 1 154 0.8%
Exports** 1 000 t 1 016 1 235 -17.7%
Total 1 000 t 2 180 2 413 -9.7%
Ready-mix Sales* 1 000 m3 1 107 984 12.5%
Aggregates Sales* 1 000 t 3 775 3 949 -4.4%
Mortars Sales* 1 000 t 200 173 15.4%
Precast Sales* 1 000 t 115 119 -2.9%
Note: • * - Sales volumes concern total sales of each business unit, do not exclude intragroup values.• ** - Includes terminal sales in the netherlands, cape verde and Spain.
Secil in Portugal experienced improvement in the domestic market, both in the cement and in some materials businesses.
Cement sales in the domestic market amounted to 1.2 million tonnes, 0.8% above the figure in 2017. These positive developments were due to good weather conditions and the increase in private projects (touristic and residential). Concrete and mortars sales growth stand out. This trend was driven by the reinforcement of products whose features are suitable for the segments, which resulted in the sale of technically more complex products.
In the foreign market, surplus supply in Europe and higher CO2 price had a negative effect on volumes sold.
INVESTMENT Investment in tangible fixed assets in Portugal amounted to 7.1 million euros. The majority of investments were made in the cement business area.

2018 ANN
UAL R
EPO
RT
39
*02
4.4.2 LEBANON 4.4.2.1 MARKET BACKGROUND
According to the latest figures published by the IMF, the Lebanese estimated economic growth is 1% in 2018 (World Economic Outlook, IMF, October 2018).
The economic and political situation of Lebanon is still unstable. Parliamentary elections were held in May 2018. However, no new government has yet been formed, which has had a negative effect on the country’s economic and financial situation. Possible developments in the Syrian conflict and the situation of Syrian refugees in Lebanon will produce a macroeconomic and market effect, which cannot be anticipated at this stage.
Cement consumption in 2018 totalled 4.7 million tonnes, 8.4% less than in the same period in the previous year, influenced by a long rainy season (q1 and q4) and a declining market trend.
4.4.2.2 DESCRIPTION OF THE ACTIVITY
92.282.0
M IL
LIO
N E
UR
OS
REVENUE
-11.0%
2017
2018
35.939.0%
M IL
LIO
N E
UR
OS
EBITDAEBITDA MG
-26.9%
2017
2018
26.232.0%
Revenue in Lebanon decreased year on year, amounting to 82.0 million euros. This amount was negatively affected by the depreciation on average of the USD against the euro by about 3.7 million euros.
Cement sales totalled 1.1 million tonnes, less than in the previous year, impacted by the drop in the cement market. Sales prices in the local currency stood at similar levels to that in 2017. Cement revenue decreased 11.3% year on year, mainly due to the reduction in volumes sold.
Due to a competitive environment, concrete revenue decreased 7.2% compared with 2017 to 5.7 million euros, as a result of the reduction by 1.8% in volumes sold and 1% in local currency prices.
In 2018, total EBITDA in Lebanon was 26.2 million euros, down by 26.9% in relation to the previous year. EBITDA in 2018 was negatively affected by the depreciation on average of the USD against the euro by about 1.2 million euros. Without this effect, EBITDA in 2018 would have stood at 27.4 million euros.
The cement unit recorded EBITDA of 26.2 million euros, 26.1% below the figure in 2017. The decrease resulted from less volumes sold and, in particular, from the rise in production costs. These costs were higher in 2018, namely due to the impact of higher solid fuel prices (of approximately 2.8 million euros) and the implementation in the fourth quarter of 2017 of a new special tax on cement production with an impact of 2.9 million euros.
As concrete revenue dropped and production costs rose (due to the rise in raw material and fuel prices), the respective EBITDA decreased to 14 thousand euros.

2018
AN
NU
AL R
EPO
RT
40
*02
4.4.2.3 OPERATIONAL PERFORMANCE
Unit 2018 2017 Var.
Clinker Production 1 000 t 929 950 -2.2%
Cement Production 1 000 t 1 121 1 199 -6.5%
Cement and Clinker Sales
Internal Market 1 000 t 1 110 1 181 -6.0%
Ready-mix Sales* 1 000 m3 97 99 -1.8%
Precast Sales* 1 000 t 46 59 -22.2%
Note:
• * - Sales volumes concern total sales of each business unit, do not exclude intragroup values.
Cement sales totalled 1.1 million tonnes, 6% less than in the previous year, impacted by the drop in the cement market. Sales prices stood at similar levels to those in 2017.
Concrete activities performed worse than in 2017, as volumes sold decreased 1.8%. The highly competitive environment of the ready-mix concrete market persisted in Secil’s operational areas, and prices dropped by 1%.
INVESTMENTInvestments in Lebanon totalled 3.5 million euros, most of which involved investments in replacements and health and safety.
4.4.3 BRAZIL4.4.3.1 MARKET BACKGROUND
The IMF foresees a 1.3% growth of the Brazilian economy for 2018 (world economic outlook update, IMF January 2019).
The fragile situation of the government that failed to implement the structural reforms needed to balance the public accounts, alongside the disastrous truck drivers’ strike and a highly polarized electoral process, influenced the economic year of Brazil negatively.
The fact that the government did not take action to improve the situation of the public accounts also had investors moving out of Brazil, which resulted in the depreciation of the currency of about 16.3%, down by almost 24% at the end of August. In a weakened, low-growth economy, and with a government lacking the financial capacity to launch a public investment programme, a few auctions were held for infrastructure development, which still did not produce practical effects, continuing to penalise the construction sector.
In this context, the construction industry was naturally affected, with impact on cement consumption. Cement sales in the domestic market decreased around 1.2%, strongly impacted by the drivers’ strike in May (when the market dropped around 20%). The market in southern Brazil behaved slightly better, as consumption was in line with the previous years.

2018 ANN
UAL R
EPO
RT
41
*02
4.4.3.2 DESCRIPTION OF THE ACTIVITY
85.978.1
M IL
LIO
N E
UR
OS
REVENUE
-9.1%
2017
2018
4.45.1%
M IL
LIO
N E
UR
OS
EBITDAEBITDA MG
89.7%
2017
2018
8.310.6%
Revenue totalled 78.1 million euros vs. 85.9 million euros in the previous year, representing a decrease of 9.1% year on year. The decrease was affected by the depreciation of the real against the euro by about 15.2 million euros. If the currency had not depreciated, revenue would have been 93.3 million euros, 9% above the figure in the previous year.
Cement sold amounted to 1.33 million tonnes, 4.6% up over the volumes recorded in the previous year. On the positive end, the net selling price in the local currency also rose.
Concrete sales volumes decreased around 9.3%, standing at 244 thousand m3, with the market also being impacted negatively by the context and the lack of infrastructure works. Sales price in the local currency rose around 3% in comparison with the same period in the last year.
EBITDA in Brazil totalled 8.3 million euros which compares with the 4.4 million euros recorded in December 2017. The increase was due to growing sales and decreasing fixed costs. Excluding the exchange rate effect, EBITDA would have totalled 9.9 million euros.
Variable production costs were up 2% due to the rise in transportation costs of materials (due to the truck drivers’ strike), the rise in the purchase cost of petcoke (impacted by international market prices and currency depreciation). The pressure of these costs was particularly high in the last quarter of the year. The increases were partially offset by strict cost control and technical improvement in operations, which helped reduce specific thermal and electrical power consumption and reduce clinker consumption. The organisational restructuring in 2017 and 2018 helped reduce industrial and structural fixed costs, albeit maintaining the commercial strategy of growth with the opening of two new distribution centres.
4.4.3.3 OPERATIONAL PERFORMANCE
Unit 2018 2017 Var.
Clinker Production 1 000 t 1 018 1 067 -4.6%
Cement Production 1 000 t 1 342 1 292 3.9%
Cement and Clinker Sales
Internal Market 1 000 t 1 330 1 272 4.6%
Exports 1 000 t 10 16 -34.2%
Total 1 000 t 1 340 1 288 4.1%
Ready-mix Sales* 1 000 m3 244 269 -9.3%
Note: • * - Sales volumes concern total sales of each business unit, do not exclude intragroup values.

2018
AN
NU
AL R
EPO
RT
42
*02
Cement sales in Brazil reached 1.33 million tonnes, representing an increase of 4.6% Against 2017, when 1.28 million tonnes were sold. This was achieved in spite of the market context and it reflected a commercial strategy of growth with the opening of two new distribution centres.
Concrete sales decreased around 9.0%, Standing at 244 thousand m3, in a market also being impacted negatively by the context and the lack of infrastructure works. The real estate construction sector seems to be hinting at improvement, albeit with very shy signs.
INVESTMENTInvestments in Brazil totalled 11.2 million euros in the year in question, which included some ongoing strategic projects, such as the installation of the new crusher and conveyor belt in Adrianópolis, the alternative fuel project and the second bagging line.
4.4.4 TUNISIA 4.4.4.1 MARKET BACKGROUND
According to the latest figures published by the IMF, the Tunisian economy is expected to grow 2.4% in 2018, more than the 2.0% figure recorded in 2017 (world economic outlook, IMF October 2018).
Tunisia is still facing significant challenges, including high foreign and tax deficits, rising debt and insufficient growth to reduce unemployment. Some social unrest and pressure from union claims continue. Government deficit is reflected in public works and the real estate sector faces challenges due to difficulties in obtaining funding (due to the fragility of the banking sector), which impacts construction output.
In this context, it is estimated that the domestic cement market decreased 0.3% year on year. The cement market is still subject to strong competition, due to excess production capacity. However, in 2018 sales prices increased, mainly driven by the fact that several players entered into clinker export agreements (which helped to reduce substantially pressure on the Tunisian market) and by the overall increase in purchase prices of materials with a significant weight in the cost structure of cement manufacturers.
Constraints on the Libyan border and in obtaining foreign currency in the Libyan financial market continued to impact the cement export market.
4.4.4.2 DESCRIPTION OF THE ACTIVITY
42.646.9
M IL
LIO
N E
UR
OS
REVENUE
10.2%
2017
2018
8.921.0%
M IL
LIO
N E
UR
OS
EBITDAEBITDA MG
17.3%
2017
2018
10.522.4%
Revenue in Tunisia stood at approximately 46.9 million euros, up by 10.2% on a year-on-year basis. In the absence of the negative effect of the depreciation of the Tunisian dinar against the euro, there would have been a 28.0% increase.
The cement business unit in Tunisia recorded revenue of 42.4 million euros, up by approximately 14.4%. Domestic market sales volumes, excluding inter-segment sales, grew 5.8%, in spite of the slight market decrease. Most competitors increased sales prices by about 23%. The increase in fuel prices and electrical power, and the overall rise in prices in Tunisia justified an increase in cement prices by the local producers.The cement export constraints mentioned before influenced cement prices, which remained below 2017 levels, due

2018 ANN
UAL R
EPO
RT
43
*02
to competition and the fact that there were no exports to Algeria (where prices are higher). In spite of the difficulties, the proximity of the plant to the Libyan market and trade efforts drove cement exports upwards in a market that had decreased against 2017. Around 136 thousand tonnes of clinker were exported, taking advantage of production capacity.
The revenue of the ready-mix concrete business unit dropped about 17.1%, standing at 4.4 million euros, arising from the decrease in sales volumes by around 10.7% due to a shrinking market.
In 2018, EBITDA of activities in Tunisia stood at 10.5 million euros, representing an increase of 17.3% in relation to 2017. This amount was negatively affected by the depreciation of the dinar against the euro by about 1.5 million euros.
The increase in EBITDA is due to the rise in sales volumes and sales prices in the domestic market, which more than offset the negative effects of increase in thermal power costs (resulting from the increase in fuel prices and with a negative impact of approximately 2 million euros), packaging and raw material expenses (overall rise in prices in Tunisia).
4.4.4.3 OPERATIONAL PERFORMANCE
Unit 2018 2017 Var.
Cinker Production 1 000 t 908 955 -4.9%
Cement and Lime Production 1 000 t 975 889 9.7%
Cement and Clinker Sales
Internal Market 1 000 t 846 806 5.0%
Exports 1 000 t 259 292 -11.6%
Total 1 000 t 1 105 1 099 0.6%
Ready-mix Sales* 1 000 m3 118 132 -10.7%
Note: • * - Sales volumes concern total sales of each business unit, do not exclude intragroup values.
The domestic market performed better than in 2017, as sales volumes increased 5.0%, in spite of the slight market slow down. Around 259 thousand tonnes of cement and clinker were exported, taking advantage of production capacity.
The ready-mix concrete activities performed worse than in 2017. Sales volumes decreased 10.7%, with less 14 thousand m3 sold. The drop resulted from the lack of new, public and private, projects in the different markets, as a consequence of the economic crisis that the country and the sector are experiencing and that has lead to more aggressive competition.
INVESTMENTInvestment amounted to 2.6 million euros, above the figure in 2017, channelled to the launch of essential investments for the development of the company, in particular addressing energy efficiency (alternative fuels), monitoring of kiln operations and efficient maintenance management.
4.4.5 ANGOLA AND OTHERS4.4.5.1 MARKET BACKGROUND
The IMF expects the Angolan Economy to decrease around 0.1% in 2018 (world economic outlook, IMF October 2018).
Angola is still going through a tough financial and economic situation. Notwithstanding higher oil prices and the implementation of some reforms, the economy is still stagnant, the banking sector is fragile and there is still big shortage of foreign currency, creating difficulties for many companies. To address the situation, the Angolan government implemented tough cost reduction measures and launched several programs for the diversification of

2018
AN
NU
AL R
EPO
RT
44
*02
the economy which, however, do not produce immediate results, as there are not many foreign investors investing in the Angolan Economy and the government is faced with financial issues. The year 2018 featured the sharp depreciation of the kwanza and the IMF’s funding programme.
According to the available data, the Angolan cement market presented values very similar to those of 2017.
These economic and financial difficulties, especially the foreign currency shortage, had a strong impact on maintaining the sustainability of the activity of the national cement producers. During the course of 2018, three of the five producers were forced to stop their activity for various reasons, namely difficulties in the purchase of fuel and paper bags, financial problems and problems acquiring fuels and clinker.
4.4.5.2 DESCRIPTION OF THE ACTIVITY
According to the latest figures available, the Angolan cement market was up by 0.6%, compared to 2017.
Cement volumes sold decreased 15.6% in comparison to 2017, amounting to 127 thousand tonnes of cement sold. In a context of strong inflation and significant depreciation of the kwanza vis-à-vis the euro, Secil Lobito has been implementing a strict price policy that can help it tackle significant increase in costs in the national currency and those arising from imports made to guarantee its operations. Accordingly, cement prices increased around 31% in comparison with 2017.
Consequently, revenue totalled 14.3 million euros, below the level in 2017 due to currency depreciation, which produced a negative effect of 8.4 million euros. Had the exchange rate effect not occurred, revenue would have been 22.7 million euros, 9.8% up over the previous year. Accumulated EBITDA in December 2018 stood at 2.7 million euros, slightly below that in the same period in the previous year, which was also negatively impacted by 900 thousand euros in currency depreciation.
Expenses were substantially affected by the depreciation of the kwanza vis-à-vis the euro. Variable costs rose 32.7%, Mostly due to the increase in acquisition costs of clinker in the international market. On the other hand, fixed costs remained at levels rather similar to those seen in the corresponding period in 2017 which, considering the inflation in angola and the acquisition of some conservation materials that are strongly pegged to the exchange rate, illustrate clearly the efforts to control costs.
4.4.5.3 OPERATIONAL PERFORMANCE
Unit 2018 2017 Var.
Cement Production 1 000 t 122 158 -22.8%
Cement and Clinker Sales 1 000 t 127 151 -15.6%
Note:
• * - Sales volumes concern total sales of each business unit, do not exclude intragroup values.
Cement sales volumes in 2018 were down by 15.6%, to 127 thousand tonnes.
The first half of the year featured positive developments in volumes (as a result of the financial and/or operational difficulties faced by some cement producers in the beginning of 2018), whereas in the second half of the year sales were below the figure in the same period in 2017. This decrease is due to the fact that sales in the 3rd quarter of 2017 were higher arising from the difficulties experienced by other producers.
In a context of strong inflation and significant depreciation of the kwanza vis-à-vis the euro, Secil has been implementing a strict price policy that can help it tackle significant increase in costs in the national currency and those arising from necessary imports. Accordingly, cement prices increased around 31% in comparison with 2017.

2018 ANN
UAL R
EPO
RT
45
*02
In terms of sales mix, grade 42.5 R cement, a product with higher added value, increased its weight in the mix by 9.3%, to 53.1% of total sales, thus reinforcing Secil’s position in the production of differentiated high resistance cements.
INVESTMENTInvestments totalled 0.3 million euros in 2018.
4.5 RESOURCES AND SUPPORTING FUNCTIONS
4.5.1 SUSTAINABILITY AND THE ENVIRONMENT
Without prejudice of the sustainability report which will be published, it is worth noting that Secil integrates sustainability into all levels of management, aligning its industrial activities with environmental protection and social responsibility.
Secil leads the Cembureau European Cement Association and is member of other organisations in Portugal, such as ATIC – Associação Técnica da Indústria do Cimento, GRACE – Grupo de Ação e Reflexão para Cidadania Empresarial and BCSD Portugal.
In October 2018, Secil joined an international association founded in 2018, GCCA – Global Cement and Concrete Association, composed of the main global cement players. This association will continue the work that was being carried out under the CSI-Cement Sustainable Initiative, which in the meantime was terminated on 31 December 2018.
In this context, Secil has contributed actively to drafting and reviewing the reflection and opinion papers on sustainability, and has taken part in sectoral working groups.
Aware of the need to reduce the carbon intensity of its activity and to incorporate circular economy into its business model, it has been investing in innovative equipment and technologies and in research and development of innovative solutions for the use of concrete.
Efficient management of natural resources, improved energy efficiency, replacement of fossil fuels by alternative fuels, incorporating secondary raw materials into its production process, and promoting biodiversity in the environmental recovery of quarries where it operates are some of the of the best practices that the Company has been consistently pursuing over the years on the road to sustainability.
The social responsibility of its actions is felt primarily by the communities around its main manufacturing units, through community programmes and institutional relationships, which stakeholders appreciate for their soundness and persistence.
Training and development of human capital, and the adoption of a supply chain that favours local suppliers are other dimensions of sustainability pursued in a systematic manner.

2018
AN
NU
AL R
EPO
RT
46
*02
5 ENVIRONMENT BUSINESS AREA5.1 LEADING BUSINESS INDICATORS
REVENUE 2018
1%% OF CONSOLIDATED TOTAL
EBITDA2018
1%% OF CONSOLIDATED TOTAL
HIGHLIGHTS IN 2018 (VS. 2017)
• ETSA recorded revenue of approximately 24.6 million euros, down by around 14.9% against the previous year.
29.0
24.6M
ILLI
ON
EU
RO
S
REVENUE
-14.9%
2017
2018
• The EBITDA for ETSA totalled approximately 5.4 million euros in 2018, representing a decrease of about 30.4% in comparison with the previous year.
7.726.6%
MIL
LIO
N E
UR
OS
EBITDAEBITDA MG
-30.4%
2017
2018
5.421.8%

2018 ANN
UAL R
EPO
RT
47
*02
• Financial results improved by about 12.1% in relation to previous year, mostly due to the reduction in average debt.
IFRS - accrued amounts (million euros) 2018 2017 Var.
Revenue 24.6 29.0 -14.9%
EBITDA 5.4 7.7 -30.4%
EBITDA margin (%) 21.8% 26.6% -4.8 p.p.
Depreciation, amortisation and impairment losses (2.9) (2.8) -2.9%
Provisions 0.1 (0.3) 118.2%
EBIT 2.5 4.5 -44.9%
EBIT margin (%) 10.1% 15.7% -5.5 p.p.
Net financial results (0.4) (0.5) 12.1%
Profit before taxes 2.1 4.0 -49.0%
Income taxes (0.0) (0.8) 94.1%
Net profit for the period 2.0 3.2 -38.0%
Attributable to ETSA shareholders 2.0 3.2 -38.0%
Attributable to non-controlling interests (NCI) - - -
Cash-Flow 4.9 6.4 -24.0%
31/12/2018 31/12/2017
Equity (before NCI) 70.7 68.7
Net debt 11.0 14.8
Note: • Figures for business segment indicators May differ from those presented individually by each Group, as a result of consolidation adjustments.
5.2 LEADING OPERATING INDICATORS
The following table sets out the main operating indicators for the ETSA Group in the financial year of 2018 and 2017:
Unid. 2018 2017 Var.
Collection of raw materials - Animal waste (categories 1, 2 and 3) 1 000 t 122.4 118.7 3.1%
Sales - Animal fats and used food oil 1 000 t 12.6 14.9 -15.4%
Sales - Meal 1 000 t 23.3 21.9 6.4%
5.3 OVERVIEW OF THE ENVIRONMENT ACTIVITY
In the ETSA markets, the price of meat and bone meal (category 3) dropped, due to problems faced by European players, in particular spanish, in exporting to asia, thus building up stocks that caused prices in Europe to deteriorate. On the other hand, fat prices reduced due to the double effect of the shut-down of biodiesel plants in Europe, related to biodiesel imports from latin america, and to the reduction in prices of substitute products like soy oil. Tariff barriers which the eu introduced on 28 February 2019 are expected to gradually recover levels of biodiesel production in Europe, subsequently raising fat demand.
In this context, ETSA recorded revenue of approximately 24.6 million euros in 2018, down by around 14.9% against the previous year. This development was essentially caused by (i) a decrease in volumes sold of animal fat (category 3) by about 11.5% compared with the previous year, (ii) a decrease in the respective average sales price by around 22.7%, and a decrease in the average price in the same category meal by approximately 23.3%, and iii) a decrease of

2018
AN
NU
AL R
EPO
RT
48
*02
around 0.7% in the consolidated services rendered, resulting from less volumes of animals collected under the sirca agreement, resulting in a decrease in billing by about 8.3%.
The EBITDA for ETSA totalled approximately 5.4 million euros in 2018, representing a decrease of about 30.4% in comparison with the previous year, essentially due to less volumes sold and lower sales price, although partially offset by lower cost of thermal fuels due to the pursuit and use of new fuels in the process of industrial conversion. The EBITDA margin stood at 21.8%, down by around 4.8 p.p. from the margin in 2017.
Financial results improved by about 12.1% in relation to previous year, mostly due to the reduction in average debt.
The combined impact of these factors resulted in net profit attributable to ETSA shareholders in 2018 of approximately 2.0 million euros, down by around 38.0% against the previous year.
5.4 RESOURCES AND SUPPORTING FUNCTIONS
5.4.1 SUSTAINABILITY AND THE ENVIRONMENT
Without prejudice of the sustainability report which will be published, it should be noted that ETSA’s operations focus on the recycling of food industry by-products, thus avoiding having to deposit them in a landfill and contributing to circular economy (food loss and waste control). These activities are conducted with state-of-the-art technologies to ensure that the environment is protected, using biomass as thermal fuel replacing fossil fuels. Several of the companies of the Group hold the iscc certification (the certification that guarantees sustainability and the reduction of greenhouse gas emissions in the biodiesel production process).
Furthermore, ETSA has entered into cooperation protocols with quercus – associação nacional de conservação da natureza and zero – associação sistema terrestre sustentável for environmental protection and sustainability.
5.4.2 INNOVATION, RESEARCH AND DEVELOPMENT
In 2018, ETSA materialised its commitment to research and development through the development of several internal research lines and through partnerships with higher education institutions linked to chemical technology, biotechnology and agri-food. It also continued to develop the joint project started in 2017 under the Portugal 2020 program (its, sebol and ucp-universidade católica do porto), aimed at obtaining new products and new business opportunities for improving the Group’s competitiveness. To be completed by the end of 2019, the project resulted in the development of an innovative product which is undergoing detailed technical study and industrial testing, and a financial feasibility study. In 2018, ETSA also continued to develop a mobilising project - under Portugal 2020 as well -, which involves its, sebol and several private and public entities from the agri-food industry in Portugal that aims to create networks and interactions between several national players in this sector. These r&d lines aim, among other objectives, to reinforce the sustainability character of ETSA by optimising the use of natural resources and minimizing the negative impacts on the environment.

2018 ANN
UAL R
EPO
RT
49
*02
6 HUMAN RESOURCES OF THE SEMAPA GROUPThe Semapa Group’s human resource policy is founded on the professional and personal development and growth of its employees, which translates into continuous improvement in productivity and motivation of employees.
The commitment to developing employee skills and expertise, namely through adequate training activities and the development of forums for discussion and sharing of knowledge, are a key strategical and structural feature of Semapa’s human resources policy.
With sustainable and streamlined human resource management as a priority, Semapa has implemented several talent management programmes underway in the Group, with strong training and career management components, in order to maximise Group synergies.
The total number of employees of the Semapa Group stabilised slightly above 6,000 employees, at 6,054 at the end of December 2018, as shown in the following table:
31/12/2018 31/12/2017 Var.
Pulp and Paper 3 282 3 197 85
Cement 2 470 2 556 -86
Environment 270 270 0
Holdings 32 28 4
Total 6 054 6 051 3

2018
AN
NU
AL R
EPO
RT
50
*02
7 SOCIAL RESPONSIBILITY IN THE SEMAPA GROUPHelping to sustainably develop its local communities is one of the guiding strategic principles of the Semapa Group. The Group has been aware at all times that sustainable growth depends on the well-being of its employees, and on the support and ties it builds with the communities around its production units and commercial premises.
The Group is accordingly involved in a wide array of initiatives designed in the last instance to improve the quality of life of the communities around its plants and facilities, and to preserve the environment.
Donations by the Semapa Group to social responsibility activities totalled approximately 2.2 million euros in 2018.
The following were some of the numerous initiatives and projects supported by the Group:
• Fundação Nossa Senhora do Bom Sucesso: foundation dedicated to human health and development since 1951, with special focus on children and women’s health, delivering excellence services independently of the social and economic status of users;
• Associação Salvador: an association dedicated to defend the interests and rights of persons with reduced mobility, especially individuals with physical disability;
• Liga para a Proteção da Natureza;
• Establishing support and incentive protocols signed with institutions working in the fields of social inclusion, sports and culture, with programs in the local communities around the Group’s facilities;
• MDV Projeto Família: a pioneering project in Portugal seeking to work with families with children at risk. The aim is to keep the family together through intensive, immediate and individualized support.

2018 ANN
UAL R
EPO
RT
51
*02
8 SEMAPA GROUP – FINANCIAL AREA8.1 INDEBTEDNESS
NET DEBT
552.1
692.7 683.0
414.0 386.4
1,673.71,551.6
14.8 11.0
471.3
MIL
LIO
N E
UR
OS
PULP AND PAPER
-9.8%
CEMENT
-27.7%
SEMAPA
-122.0%
ENVIRONMENT
-3.8%
HOLDINGS
-80.8%
2017
2018
On 31 December 2018, consolidated net debt stood at 1,551.6 million euros, representing a decrease of 122.0 million euros over the figure recorded at year-end 2017, positively influenced by the generation of operating cash flow and:
• Pulp and paper: -9.8 million euros, including investments of about 216.5 million euros, the initial proceeds from the sale of the pellets business of 67.6 million euros and the payment of dividends of 200 million euros;
• Cement: -27.7 million euros, which includes, among others, investments of 29.2 million euros and net working capital variation;
• Environment: -3.8 million euros; and
• Holdings: -80.8 million euros, resulting essentially from dividends received from Navigator (139 million euros), the payment of dividends (41.3 million euros) and of financial liabilities.
8.2 FINANCIAL RESULTS
In 2018 financial results amounted to a negative figure of 68.8 million euros, representing a deterioration by 7.8% in relation to the figure recorded in the previous year. In spite of the improvement in Group borrowing costs, several factors impacted financial results negatively, in particular:
• The unfavourable evolution of 9.4 million euros in financial instruments (hedging) as compared with 2017;
• The negative impact of 3.3 million euros of the results of surplus liquidity transactions, in the context of an over-all downturn in the financial markets;
• The recognition, at the end of the first quarter, of around -1,5 million euros from the difference between the nominal value and present value of the pending receivable from the sale of the pellet business (45 million USD).
8.3 RISK MANAGEMENT
Details of risk management May be consulted in the relevant section of the notes to the consolidated financial statements of the Semapa Group.

2018
AN
NU
AL R
EPO
RT
52
*02
8.4 PERFORMANCE OF SEMAPA SHARES
The financial context of 2018 featured volatility, in contrast with the previous years, with some level of growing uncertainty and tension. In addition to trade disputes between the USA and other trade partners, in particular China, no agreement has been reached on the withdrawal of the United Kingdom from the EU and there is increasing probability of a Hard Brexit as we draw closer to 29 March, while tensions around Italian fiscal policy grow. Not to mention the withdrawal of monetary policy incentives, as the Federal Reserve (FED) raised interest rates 4 times in 2018 and the ECB confirmed the end of Quantitative Easing.
The first months of 2018 did not hint at the falls that intensified in the month of December, with most stock exchanges recording the worst year ever since 2008.
Therefore, European markets overall recorded losses over 10%. Following a good performance during the year compared with the European landscape, the USA experienced a very negative month of December, with s&p 500 recording the worst month of December since 1931. The shutdown of the Trump Administration has certainly not helped the economic atmosphere and the level of risk aversion. It is worth highlighting the positive performance of the Brazilian market, as Bovespa enjoyed a hike of 15%. Psi20, on the other hand, depreciated 12.2%, wiping out all of the gains achieved in the first semester, more markedly in December, as was the case for its counterparts.
In this context, Semapa shares fell sharply in mid-July, offsetting the significant gains accumulated, especially in the second quarter of the year (+23.9%). Semapa shares closed 2018 with a 26.4% depreciation, above the psi20 (-12.2%) and the Euronext Family Business Index (-21.0%). Semapa’s closing price reached a maximum of 24.2 Euros on 13 June, a new record in terms of closing quotes, and a minimum of 12.66 Euros on 18 December.
dec-17
25.00 800,000
700,000
600,000
500,000
400,000
300,000
200,000
100,000
0
SHARE PRICE VOLUME
17.00
15.00
23.00
21.00
13.00
19.00
11.00
9.00
jan-18 feb-18 apr-18 May-18 jun-18 jul-18 aug-18 sep-18 oct-18 nov-18 dec-18mar-18
VAR. PERIOD SEMAPA-26.4%
Max = 13-jun: eur 24.2Min = 18-dec: eur 12.66
SHARE PRICE02-jan: eur 17.8629-dec: eur 13.1
AVERAGE DAILY VOLUME42,383
Presentation of 2017 results
Presentation of results:1st quarter 2018
Announcement of payment of dividends in 2017
Ex-dividend date
Presentation of results:1st half 2018
Presentation of results of the first 9 months of 2018

2018 ANN
UAL R
EPO
RT
53
*02
VAR. PERIOD SEMAPA-26.4%
VAR. PERIOD PSI20-12.2%
VAR. PERIOD EFB-21.0%
dec-17 jan-18 feb-18 apr-18 May-18 jun-18 jul-18 aug-18 sep-18 oct-18 nov-18 dec-18mar-18
Bas
is 1
00: 2
9/12
/201
7
EFB – Euronext Family Business Index Note: Closing prices
8.5 DIVIDENDS
In June 2018 Semapa distributed dividends with a total value of 41.3 million euros, corresponding to 0.512 Euros per share.
In June 2018, Navigator paid dividends and reserves totalling 200.0 million euros, corresponding to 0.27894 Euros per share.
8.6 NET PROFIT
Consolidated net profit in 2018 attributable to Semapa shareholders was 132.6 million euros, which represents an improvement of 6.8% compared to the previous year. Net profit per outstanding share stood at 1.643 Euros/share. The evolution in net profit is explained essentially by the combined effect of the following factors, in comparison with the previous year:
• An increase in total EBITDA of approximately 47.8 million euros;
• An increase in depreciation, amortisation, impairment losses and provisions of 6.4 million euros;
• A deterioration in net financial results by about 5.0 million euros;
• An increase in income taxes of approximately 28.9 million euros.
2018
AN
NU
AL R
EPO
RT
54
*02
9 OUTLOOKGlobal economic forecasts point to a slowdown in growth in the next two years, the IMF having reviewed its projections downwards from October, estimating a 3.5% growth for 2019 (World Economic Outlook update, IMF, January 2019). The review is partly based on the negative impact of trade tariffs between the USA and China. On the other hand, the German economy has shown signs of slowing down and domestic demand in Italy has been hit by the concerns over the sovereign and financial risks.
A variety of geopolitical, commercial, political and strategic risk factors continue to influence economic growth developments. On the European end, there is uncertainty as to the outcome of Brexit and the increased risk of a disorganised exit, with political uncertainties remaining in both Italy and France. In the USA there is still uncertainty concerning the duration of the growth cycle and the US’s real capacity to continue growing as tax incentives reduce. The slowdown in china’s economic growth, on the other hand, May be more pronounced than initially anticipated due to the difficulties in accessing credit and the impact of the USA-China trade war.
It is also worth mentioning the uncertainty regarding the direction that commodity prices will take given the recent volatility observed in these markets, since the impact of the recent exchange devaluations and deterioration of credit conditions in certain emerging markets is unknown.
PULP AND PAPER With no prospects of new significant increases in pulp production capacity in the market in the next three years and leveraged on potential growth in pulp demand, in particular from china and the expansion of capacity in tissue, capacity utilisation rates are expected to increase, sustaining the level of hardwood pulp price at historically high levels. In the short term, global demand is expected to pick up after the Chinese new year which, combined with the constraints in supply arising from the planned maintenance stoppages which typically take place in the first half of the year, will help prices recover progressively to levels equivalent to those in mid-2018.
Demand for UWF paper in Europe in 2019 should revitalise in the early months of the year, in particular in the centre, south and east European markets. In Europe, producers have been successfully raising the price of UWF from 4 to 8% since the beginning of January. In the USA, a possible drop in UWF demand will be more than offset by the closure of 550 thousand tonnes of capacity in March, as announced by a large US producer, which will push up market prices. In the beginning of February, Navigator announced to its customers that it would be raising prices on the north-american market by 66 USD/t beginning on 1 March, in line with other US paper producers.
In the tissue market, producers continue to feel strong pressure coming from rising pulp prices, chemical and electricity costs. Navigator implemented the increase in prices it had announced in November for most of its products. At the same time, the company’s new tissue plant in Aveiro began producing reels in September. The strong commercial effort in 2018 allows to anticipate a successful placement of the new output with customers as Navigator is committed to growing its market share above average market growth.
However, this overall positive context for 2019 may suffer from additional costs, especially in relation to energy, in addition to existing concerns about the developments in exchange rates, in particular the EUR/USD and EUR/GBP. The international context features pro-protectionism policies, whose collateral effects May generate additional factors of uncertainty.

2018 ANN
UAL R
EPO
RT
55
*02
CEMENT AND OTHER BUILDING MATERIALS Expectations for 2019 are positive for Portugal. Macroeconomic indicators point to growth, although public investment levels, limited by deficit management, are a restricting factor. The Bank of Portugal has a positive outlook for the Portuguese economy, estimating a 1.8% GDP growth in 2019, alongside a positive performance of the labour market, with growth in employment and reduction in the unemployment rate. On the other hand, the fact that the programme Portugal 2020 is well under way makes it possible to anticipate a pick-up in investment, consequently benefiting the performance of the construction sector.
Following production growth in the construction sector in 2018 of 3.5%, forecasts point to a slight increase in the pace of production, estimating a real increase of 4.0% in sector activity in 2019.
In Lebanon, cement demand should decrease compared to 2018, considering last year’s trend. The entry into office of the new government is expected to improve the country’s economic stance. New taxes implemented in the last quarter of 2017 will continue to have a negative impact on the results of cement companies in the country. Possible developments in the Syrian conflict and the situation of Syrian refugees in Lebanon will produce a macroeconomic and market effect which cannot be anticipated at this stage. The current challenging competitive environment is expected to continue throughout the rest of the year.
Brazil is expected to grow 2.5% in 2019 (World Economic Outlook Update, IMF January 2019), above expected growth of 1.3% in 2018, which hints at the improvement of conditions. The formation of the new government creates an expectation of stronger pick-up in the economy. There are also high expectations on the government’s infrastructure and privatisation programme, which may give a strong impulse to the construction sector. Therefore, the construction sector is expected to benefit from this programme in the second half of the year, which will largely be based on Public-Private Partnerships.
The National Cement Industry Union (SNIC) expects a growth in the cement market of around 3%, which will represent the first positive development in over 4 years. Domestically, the organisational restructuring process will continue, with the implementation of operating efficiency enhancement and cost reduction projects, while maintaining sustained growth in sales in view of improving operating margins.
The level of competition in Tunisia should remain strong, due to the excess supply in the country. However, the increase in sales prices seen in 2018 makes it possible to expect positive trends in 2019. Tunisia is in a difficult financial situation, and social instability May worsen as a result of reforms that the government is forced to implement to reduce the current and fiscal deficits.
The outlook for 2019 for Angola is positive. The Macroeconomic Stabilisation Programme, alongside the National Development Plan and, more recently, the Extended Fund Facility signed by the Government of Angola and the IMF, together with the upward trend of oil prices on the international markets hold out the prospect of economic recovery in 2019, which will inevitably drive cement consumption up to an estimated 8%.
ENVIRONMENT Considering the current framework of the sector operated by ETSA, improvement in the current conditions is expected, on the one hand due to larger outflow of proteins produced in Europe onto the Asian Market and, on the other hand, to the upturn in business of European biodiesel producing companies.
Concerning the import of biodiesel from Argentina, the EU implemented tariff barriers by the end of February 2019. Such measures are expected to restore biodiesel production levels in the EU and, consequently, the level of demand of these raw materials.

2018
AN
NU
AL R
EPO
RT
56
*02
ETSA’s prime objectives in the short term include (i) concentrating on the horizontal expansion of its production and destination markets (exports accounted for around 56.5% of total accumulate sales on 31 December 2018), (ii) identifying new opportunities for vertical growth, channelling its investments to improving operational efficiency, extracting maximum value from the channels operated and retaining the loyalty of the main conventional and alternative collection centres, (iii) the gradual and progressive recovery of balanced sales margins in the market, and (iv) focus on sustained innovation and research and development addressed at ensuring new profit thresholds for the business.
VENTURE CAPITALSemapa, through its subsidiary Semapa next, the venture capital business unit of the Group, and US-Based Techstars have entered into a partnership to support and accelerate global start-ups from lisbon. The acceleration program is expected to accelerate 30 start-ups in three years. In the first year, the program will invest and accelerate international and Portuguese start-ups on the Industrial and Environmental Tech, Smart Transportation, and Travel & Leisure Tech verticals.
Through its subsidiary Semapa next, sa also, the Group is committed to invest 12 million USD in a venture capital fund, Alter Venture Partners Fund I. The fund intends to co-invest in start-ups, alongside some prominent Silicon Valley Funds. The fund’s investment strategy includes investing in technological companies with applications in Artificial Intelligence and Machine Learning in the technological, communication and digital sectors, focusing on B2B.

2018 ANN
UAL R
EPO
RT
57
*02
10 ACKNOWLEDGEMENTSA very special mention to Pedro Queiroz Pereira, the Group’s main shareholder and Chairman of the Board of Directors, who passed away unexpectedly in August.
Pedro Queiroz Pereira was an icon of the Portuguese industrial environment, gifted with rare human and professional qualities and a remarkable entrepreneurship spirit with which he fostered the reestablishment of the Economic Group of which this Company is part. He exercised leadership in a unique style, marked by strict management that allowed the Group to expand and internationalise in a sustainable manner. More than heritage, Pedro Queiroz Pereira leaves strength and values. The sustained development of the Semapa Group will continue anchored in this strong legacy.
***
As part of the Group’s performance, in a global context of geopolitical and economic uncertainty, 2018 represented for Semapa a year of Group consolidation and the end of a successful investment cycle, which reinforced the Semapa Group as one of the largest Portuguese Groups focused on industry.
We wish to express our thanks to the following, for their important contribution to our results:
• Our Shareholders, who have accompanied our progress and whose trust we believe we continue to deserve;
• Our Employees, whose efforts and dedication have made possible the Company’s dynamism and development;
• The support and understanding of our Customers and Suppliers, who have acted as partners in our project;
• The cooperation of the Financial Institutions, and the Regulatory and Supervisory authorities;
• The collaboration of the Audit Board, the General Meeting and the Governing Committees that exist within the Company.

2018
AN
NU
AL R
EPO
RT
58
*02
11 PROPOSED ALLOCATION OF RESULTSConsidering that the Company needs to maintain a financial structure compatible with the sustained growth of the Group it manages in the various Business Areas in which it operates,
Considering that the Company’s independence from the financial sector involves preserving consolidated levels of short, medium and long-term debt which allow it to maintain sound solvency indicators, and
Considering that the Company’s Remuneration Committee and the Executive Board have taken a stance on the amounts which, in their view, may be paid to the members of the Board of Directors and the Company’s Employees, respectively, for the financial year 2018, the total approximate amount of which is known,
It is proposed that:
1. The Net Profit for the period in the individual accounts, determined under the IFRS rules, in the amount of 132,554,336.91 Euros (one hundred thirty-two million, five hundred and fifty-four thousand, three hundred and thirty-six euros and ninety-one cents) be allocated as follows:
Dividends on outstanding shares.......................................................................................... 41,267,947.52 euros* (0.512 Euros per share)
Free reserves ........................................................................................................................ 87,286,389.39 euros
Participation of Employees and Directors in the annual profits up to.................................. 4,000,000.00 euros
* Excluding own treasury shares held; 668,540 own shares were considered; on the payment date, if this amount is changed, the total dividends payable May be adjusted, while the amount payable per share will remain unchanged.
2. That the individual distribution of the share in profits be made by the Executive Board in the part which relates to the Employees and by the Remuneration Committee in the part which relates to the Directors and that, if this amount is not totally distributed, the remaining shall be allocated to Free Reserves.
3. That the amount regarding the participation of Employees and Directors in the annual profits which, in accord-ance with applicable accounting standards, has been accrued in personnel costs is reversed by crediting the
respective amount in Free Reserves.
Lisbon, 13 March 2019

2018 ANN
UAL R
EPO
RT
59
*02
BOARD OF DIRECTORS
CHAIRMANHEINZ-PETER ELSTRODT
MEMBERSJOÃO NUNO DE SOTTOMayOR PINTO DE CASTELLO BRANCO
JOSÉ MIGUEL PEREIRA GENS PAREDES
PAULO MIGUEL GARCÊS VENTURA
RICARDO MIGUEL DOS SANTOS PACHECO PIRES
ANTÓNIO PEDRO DE CARVALHO VIANA BAPTISTA
CARLOS EDUARDO COELHO ALVES
FILIPA MENDES DE ALMEIDA DE QUEIROZ PEREIRA
FRANCISCO JOSÉ MELO E CASTRO GUEDES
JOSÉ ANTÔNIO DO PRADO FAY
LUA MÓNICA MENDES DE ALMEIDA DE QUEIROZ PEREIRA
MAFALDA MENDES DE ALMEIDA DE QUEIROZ PEREIRA
VÍTOR MANUEL GALVÃO ROCHA NOVAIS GONÇALVES
VÍTOR PAULO PARANHOS PEREIRA


*03 CORPORATE GOVERNANCE

2018
AN
NU
AL R
EPO
RT
62
*03
*CONTENTS
PART I INFORMATION ON CAPITAL STRUCTURE, ORGANIZATION AND CORPORATE GOVERNANCE
A. CAPITAL STRUCTUREI. CAPITAL STRUCTURE 63II. HOLDINGS OF SHARES AND BONDS 64
B. CORPORATE BOARDS AND COMMITTEESI. GENERAL MEETING 65II. MANAGEMENT AND SUPERVISION 66III. AUDITING 84IV. STATUTORY AUDITOR 89V. EXTERNAL AUDITOR 89
C. INTERNAL ORGANIZATIONI. ARTICLES OF ASSOCIATION 91II. NOTIFICATION OF IRREGULARITIES (WHISTLEBLOWING) 91III. INTERNAL CONTROL AND RISK MANAGEMENT 92IV. INVESTOR SUPPORT 94
V. WEBSITE (59 TO 65) 94
D. REMUNERATIONI. POWERS TO DETERMINE REMUNERATION 95II. THE REMUNERATION COMMITTEE 95III. REMUNERATION STRUCTURE 96IV. DISCLOSURE OF REMUNERATION 98V. AGREEMENTS WITH REMUNERATION IMPLICATIONS 99VI. STOCK OR STOCK OPTION PLANS 100
E. RELATED PARTY TRANSACTIONS CONFLICTS OF INTERESTI. CONTROL MECHANISMS AND PROCEDURES 100II. DETAILS OF TRANSACTIONS 102
PART II ASSESSMENT OF CORPORATE GOVERNANCE1. IDENTIFICATION OF THE CORPORATE GOVERNANCE CODE ADOPTED 1032. ANALYSIS OF COMPLIANCE WITH THE ADOPTED CORPORATE 1033. ADDITIONAL INFORMATION 113
ANNEX I DISCLOSURES REQUIRED BY ARTICLE 447 OF THE COMPANIES CODE 114
ANNEX II REMUNERATION POLICY STATEMENT 116
ANNEX III DECLARATION REQUIRED UNDER ARTICLE 245.1 C) OF THE SECURITIES CODE 123

2018 ANN
UAL R
EPO
RT
63
*03
PART I PART I INFORMATION ON CAPITAL STRUCTURE, ORGANIZATION AND CORPORATE GOVERNANCE
A. CAPITAL STRUCTURE
I. CAPITAL STRUCTURE
1 Capital structure (share capital, number of shares, distribution of capital between shareholders, etc.), including indication of shares not admitted to trading, different classes of shares, the rights and obligations attaching to
these and the percentage of share capital that they represent (Article 245-A.1 a)).
Semapa has a share capital of 81,270,000 Euros, represented by a total of 81,270,000 shares without nominal value. All shares are ordinary shares and have the same rights and obligations attached to them, and are admitted for trading.
A breakdown of the capital structure, indicating shareholders with qualifying holdings, is provided in the table in item 7 below.
2 Any restrictions on the transfer of shares, such as clauses on consent for disposal, or limits on the ownership
of shares (Article 245-A.1 b)).
Semapa has no restrictions of any kind on the transferability or ownership of its shares.
3 Number of own shares, corresponding percentage of share capital and percentage of voting rights which would
correspond to own shares (Article 245-A.1 a)).
On 31 December 2018, Semapa held 640,666 own shares, corresponding to 0.788% of its share capital. If the voting
rights were not suspended, the percentage of voting rights would be the same as the percentage of the total capital.
4 Significant agreements to which the company is party and which take effect, are amended or terminate in the event of a change in the control of the company as a result of a takeover bid, together with the respective effects, unless, due to its nature, disclosure of such agreements would be seriously detrimental to the company, except if the company is specifically required to disclose such information by other mandatory provision of law (Article
245-A.1 j)).
Semapa is not a party to any important loan agreement, debt instruments or other to which the company is a party and which take effect, alter or terminate upon a change of control of the company as a result of a takeover bid.
5 Rules applicable to the renewal or revocation of defensive measures, in particular those providing for limits on the number of votes which can be held or cast by a single shareholder individually or in a concerted manner
with other shareholders.
There are no defensive measures in place in the company, namely any limiting shareholder’s exercisable voting rights.
6 Shareholders’ Agreements known to the company or which might lead to restrictions on the transfer of
securities or voting rights (Article 245-A.1 g)).
The Company is only aware of the ongoing and open coordination of the exercise of voting rights mentioned in item 7 below, resulting in the allocation to Sodim, SGPS, S.A. on 31 December 2018 of 71.983% of non-suspended voting rights, above the 71.186% arising from the direct and indirect holdings.

2018
AN
NU
AL R
EPO
RT
64
*03
II HOLDINGS OF SHARES AND BONDS
7 Identification of persons and organizations who, directly or indirectly, own qualifying holdings (Article 245-A.1 c) and d) and Article 16), detailing the percentage of the share capital and votes imputable and the respective grounds.
The owners of qualifying holdings in Semapa on 31 December 2018 are identified in the following table:
EntityNumber of
Shares
% share capital and voting
rights
% non-suspended
voting rights
A Sodim, SGPS, S.A. 15,252,726 18.768% 18.917%
Directors of SodimFilipa Mendes de Almeida de Queiroz Pereira Mafalda Mendes de Almeida de Queiroz Pereira Lua Mendes de Almeida de Queiroz Pereira
5,4885,8885,888
0.007%0.007%0.007%
0.007%0.007%0.007%
Cimigest, SGPS, S.A. 3,185,019 3.919% 3.950%
Cimo - Gestão de Participações, SGPS, S.A. 38,959,431 47.938% 48.319%
Sociedade Agrícola da Quinta da Vialonga, S.A. 625,199 0.769% 0.775%
Total: 58,039,639 71.416% 71.983%
B Bestinver Gestión, S.A., S.G.I.I.C. - - -
Bestinver Empleo, F.P. 13,930 0.017% 0.017%
Bestinver Bolsa, F.I.M. 2,319,127 2.854% 2.876%
Bestinfond Ahorro Fondo de Pensiones 198,347 0.244% 0.246%
Bestinver Empleo III Fondo de Pensiones 2,221 0.003% 0.003%
Bestinver Hedge Value Fund, FIL 1,503,046 1.849% 1.864%
Bestinver Global F.P. 405,052 0.498% 0.502%
Bestinver Mixto, F.I.M. 195,019 0.240% 0.242%
Bestvalue F.I. 519,214 0.639% 0.644%
Bestinver Prevision, F.P. 38,849 0.048% 0.048%
Divalsa de Inversiones SICAV 13,543 0.017% 0.017%
Bestinver SICAV – Bestinfund 79,928 0.098% 0.099%
Bestinver Empleo II, F.P. 3,571 0.004% 0.004%
Bestinver Futuro EPSV 6,607 0.008% 0.008%
Bestinver SICAV Iberian 229,426 0.282% 0.285%
Bestinver Renta F.I.M. 177,186 0.218% 0.220%
Bestinver Consolidacion EPSV 1,975 0.002% 0.002%
Bestinfond, F.I.M. 1,459,715 1.796% 1.810%
Soma: 7,166,756 8.818% 8.889%
C Norges Bank (The Central Bank of Norway) 1,699,613 2.091% 2.108%
The voting rights relating to the companies in group A are allocated on the basis of (i) direct ownership of the shares; (ii) the open coordination of the exercise of voting rights, which means that the voting rights held by these companies taken together in Semapa are allocated to each of them, as explained next, and (iii) the existence of, direct and indi-rect, controlling relationships of Sodim, SGPS, S.A. also described ahead.
The allocation to Sodim by virtue of the open coordination of the exercise of voting rights, under the terms in which they have been announced, according to Article 20. 1 c) and h) of the Securities Code, matches the part identified by the letter A in the table above.

2018 ANN
UAL R
EPO
RT
65
*03
The allocation to Sodim by virtue of the controlling relationship, in accordance with Article 20. 1 b) of the Securities Code, was on 31 December 2018 as follows:
Entity Allocation No. shares
% share capital and voting
rights
% non-suspended
voting rights
Sodim, SGPS, S.A. 15,252,726 18.768% 18.917%
Cimigest, SGPS, S.A. 100% owned by Sodim 3,185,019 3.919% 3.950%
Cimo - Gestão de Participações, SGPS, S.A. 100% owned by Cimigest 38,959,431 47.938% 48.319%
Total: 57,397,176 70.625% 71.186%
In relation to the companies in groups B and C, voting rights are allocated on the basis of direct and indirect owner-ship of shares, by virtue of domain relations.
8 Indication of the number of shares and bonds held by members of the management and supervisory bodies.
This information is provided in Annex I to this Report..
9 Special powers of the management board, in particular concerning resolutions to increase capital (Article 245-A.1 i)), indicating, with regard to these, the date on which they were granted, the period during which such powers may be exercised, the upper limit for the increase in share capital, shares already issued under the
powers granted and the form taken by these powers.
In the terms of the Articles of Association, the Board of Directors has no powers to resolve on increases to the share capital.
10 Information on the existence of significant dealings of a commercial nature between qualifying shareholders
and the company.
All transactions taking place in 2018 between the company and qualifying shareholders are described in Note 35 of the annex to the consolidated accounts and Note 25 of the annex to the individual financial statements. In the period from 1 January to 31 October, on the basis of the criteria set out in item 91 below, and in the period from 1 November to 31 December, on the basis of the regulation of conflicts of interests and related party transactions, items 89 and following of this report, there were no significant dealings of a commercial nature between qualifying shareholders and the company.
B. CORPORATE BOARDS AND COMMITTEES
I. GENERAL MEETING
A) COMPOSITION OF THE GENERAL MEETING
11 Officers of the General Meeting and their term of office (starting and ending dates).
The officers of the General Meeting are:
CHAIRMAN: Francisco Xavier Zea Mantero (term of office from 24/05/2018 to 31/12/2021)
SECRETARY: Luís Nuno Pessoa Ferreira Gaspar (term of office from 24/05/2018 to 31/12/2021)
Until the Annual General Meeting of 24 May 2018, the office of secretary of the General Meeting was held by Rita Maria Pinheiro Ferreira Soares de Oliveira.

2018
AN
NU
AL R
EPO
RT
66
*03
B) EXERCISE OF VOTING RIGHTS
12 Any restrictions on voting rights, such as limitations on the exercise of voting rights based on the ownership of a given number or percentage of shares, time limits for exercising voting rights or systems for detaching voting
rights from ownership rights (Article 245-A.1 f));
Under Semapa’s Articles of Association, each share in the Company carries one vote.
Despite the existence of time limits established in Semapa’s Articles of Association for attendance of the General Meeting, the mandatory legal rules on this matter apply, such as Article 23-C of the Securities Code. The time limit established by the Articles of Association for exercise of postal rights is the day prior to the General Meeting.
The Articles of Association make no provision for electronic voting. Nevertheless, the Board of Directors might regulate on alternative ways to vote besides paper format, as long as authenticity and confidentiality of the votes are also guaranteed until the moment of the voting. Although the Board of Directors never used this capacity, the Chairman of the General Meeting accepts electronic votes which are received under comparable conditions as the vote by mail, in what regards the deadline, comprehensibility, the guarantee of authenticity, confidentiality and other formal issues. Signature acknowledgement shall be replaced by the digital signature and closed and separate envelopes for each item in the agenda by separate annexes to the email.
There are no systems for detaching voting rights from ownership rights.
13 Indication of the maximum percentage of the voting rights which can be exercised by a single shareholder or
by shareholders connected in any of the forms envisaged in Article 20.1
There are no rules in the Articles of Association which lay down that voting rights are not counted if in excess of a given number, when cast by a single shareholder or shareholders related to him.
14 Identification of shareholder resolutions which, under the Articles of Association, can only be adopted with a
qualified majority, in addition to those provided for in law, and details of the majorities required.
The Company has established no quorums for constituting meetings or adopting resolutions different from those
provided for on a supplementary basis in law.
II MANAGEMENT AND SUPERVISION
A) COMPOSITION
15 Identification of the governance model adopted.
The company has adopted the governance model provided for in Article 278.1 a) of the Companies Code (Board of Directors and Audit Board) and in Article 413.1 b) (Audit Board and Statutory Auditor), of the same code.
16 Rules in the Articles of Association on procedural and material requirements applicable to the appointment and substitution of members, as the case may be, of the Board of Directors, the Executive Board of Directors and
the General and Supervisory Board (Article 245-A.1 h)). Policy of diversification.
Semapa’s Articles of Association set no special rules on the appointment and replacement of directors, and the general supplementary rules contained in the Companies Code therefore apply here, i.e. shareholders have the power to appoint the directors (and the supervisory body).
Concerning the development of a policy of diversification, Semapa chose to not formally adopt such policy, on the grounds of a set of legal and operational circumstances and not based on the belief that diversification in the relevant governing bodies is not positive.
In effect, while it does not have a policy of diversification, nor formally adopted requirements and criteria for the profile of the new members of the governing bodies, which suit the duties performed, the company acknowledges

2018 ANN
UAL R
EPO
RT
67
*03
that individual features, such as competence, independence, integrity, availability and expertise, and diversity requirements help improve the performance of the governing bodies.
Analysing the diversity of the governing bodies of Semapa, it should be noted that there is a fairly reasonable level of diversity. As highlighted in the following table:
Diversification Factor Parameter %
AGE
<50 29,41%
50-65 41,17%
>65 29,41%
GENDER
Female 23,53%
Male 76,47%
EDUCATION
Econ./Manag. 47,06%
Engineering 17,65%
Law 11,76%
Other 5,88%
Non graduate 17,65%
PROFESSIONAL BACKGROUND
Professional experience abroad 35,29%
Different sectors of the group 88,24%
According to the Portuguese legal system that holds shareholders responsible for deciding on the composition of the governing bodies and the nature itself of the Group of which Semapa is a part, family-owned and with concentration in the shareholding and members of the joint boards of directors to several related companies, the Directors find that the shareholders shall have the power to decide on the composition of the governing bodies.
This is the vision that justifies the fact that the company chose to explain and not implement the recommendations for the setting up of an Appointments Committee and the criteria applied by it.
Accordingly, the existence of a policy of diversification must be regarded in line with the existence or not of the Appointments Committee and, properly, it is not very relevant outside of the context of a company’s body empowered to propose the election of people to the governing bodies in the framework of such policy of diversification.
In addition, as explained above, the reality of the facts reveals that it was largely possible to meet the goals without having formally approved the policy in question.
17 Composition, as the case may be, of the Board of Directors, the Executive Board of Directors and the General and Supervisory Board, detailing the provisions of the Articles of Association concerning the minimum and maximum number of directors, duration of term of office, number of full members, the date when first appointed and the end of their terms of office for each member.
The Company’s Articles of Association (Article 11.1) stipulate that the Board of Directors comprises three to fifteen directors appointed each for a four-year term.

2018
AN
NU
AL R
EPO
RT
68
*03
We indicate below the date of first appointment of each member, together with the date on which their term of office expires:
Members of the Board of Directors Date of first appointment and end date of term of office
Pedro Mendonça de Queiroz Pereira 1991-2018
João Nuno de Sottomayor Pinto de Castello Branco 2015-2021
José Miguel Pereira Gens Paredes 2006-2021
Paulo Miguel Garcês Ventura 2006-2021
Ricardo Miguel dos Santos Pacheco Pires 2014-2021
António Pedro de Carvalho Viana-Baptista 2010-2021
Carlos Eduardo Coelho Alves1 2015-2021
Filipa Mendes de Almeida de Queiroz Pereira 2018-2021
José Antônio do Prado Fay 2018-2021
Lua Mónica Mendes de Almeida de Queiroz Pereira 2018-2021
Francisco José Melo e Castro Guedes 2002-2021
Mafalda Mendes de Almeida de Queiroz Pereira 2018-2021
Manuel Custódio de Oliveira 2014-2018
Vítor Manuel Galvão Rocha Novais Gonçalves 2010-2021
Vítor Paulo Paranhos Pereira 2014-2021
Pedro Mendonça de Queiroz Pereira ceased the performance of duties as Chairman of the Board of Directors after passing away on 19 August 2018.
Filipa Mendes de Almeida de Queiroz Pereira, José Antônio do Prado Fay, Lua Mónica Mendes de Almeida de Queiroz Pereira and Mafalda Mendes de Almeida de Queiroz Pereira were appointed directors for the 2018/2021 term, at the Annual General Meeting held on 24 May 2018.
Manuel Custódio de Oliveira was not reappointed director at the mentioned Annual General Meeting, and ceased these duties on 24 May 2018.
On 31 October 2018, it was decided at the meeting of the Board of Directors to co-opt Heinz-Peter Elstrodt as Chairman of the Board of Directors of the company, starting the exercise of duties on 1 January 2019. Consequently, considering that this appointment only entered into effect in the financial year of 2019, it was not taken into account in the drafting of this report.
18 Distinction between executive and non-executive members of the Board of Directors and, in relation to non-executive directors, identification of those who can be regarded as independent or, if applicable, identification of the independent members of the General and Supervisory Board.
The executive members of the Board of Directors are those who belong to the Executive Board, as per paragraph 28 below, the others being non-executive.
Nevertheless, Pedro Mendonça de Queiroz Pereira, Chairman of the Board of Directors of the company, up to the time of his passing away on 19 August 2018, was closely involved in the daily company management decisions.
In 2018, the Board of Directors of the company was composed of (i) eleven members until 24 may, (ii) fourteen members from then until 19 August, and (iii) thirteen members from then and until 31 December, of which four members in all of these periods integrated the Executive Board, resulting, after the annual General Meeting, in an increase in the number of non-executive directors compared with the previous term, but the same number of executive directors. We therefore consider that the company has an adequate number of non-executive directors, in what regards the company’s dimension and complexity of the risks inherent to its activity and sufficient to efficiently
ensure the functions assigned to them.
1 Held office from 1991 to 2009, and was appointed again in 2015.

2018 ANN
UAL R
EPO
RT
69
*03
On the basis of the criteria laid down by the corporate governance code adopted, the following non-executive direc-tors may be classified as independent: António Pedro de Carvalho Viana-Baptista and Carlos Eduardo Coelho Alves, as they are not associated with any specific group of interests in the Company, nor are they under any circumstance likely to affect an exempt analysis or decision.
On the other hand, the Directors Pedro Mendonça de Queiroz Pereira, Filipa Mendes de Almeida Queiroz Pereira, Francisco José Melo e Castro Guedes, Lua Mónica Mendes de Almeida de Queiroz Pereira, Mafalda Mendes de Almeida de Queiroz Pereira, Manuel Custódio de Oliveira and Vítor Paulo Paranhos Pereira were not classified as independent in the light of the criteria referred, since they were also members of the Board of Directors of compa-nies owning qualified holdings in Semapa during 2018. José Antônio do Prado Fay and Vitor Manuel Galvão Rocha Novais Gonçalves may not be classified as independent in the light of the applicable criteria, since they are directors of companies controlled by or controlling Semapa, and receive remuneration for their duties.
Thus, in the course of the 2018 financial year, the Board included between 1/4 (one fourth) and 1/5 (one fifth) of non-executive directors who fulfilled the independence requirements, which the company finds adequate and con-sistent with a fully independent performance of the Board of Directors and sufficient to guarantee the effective ca-pacity to supervise, assess and monitor the activity of the other members of the Board of Directors. Considering the profile, age, history and professional experience and integrity of the members of this body, that proportion is perfectly adjusted to the nature and size of the company, namely considering that it is a family-owned company, with a stable capital structure and taking into account the complex risks inherent to its activity.
19 Professional qualifications and other relevant biographical details of each of the members, as the case may
be, of the Board of Directors, the General and Supervisory Board and the Executive Board of Directors.
PEDRO MENDONÇA DE QUEIROZ PEREIRA
Pedro Queiroz Pereira attended General High School studies in Lisbon and Instituto Superior de Administração. He lived in Brazil from 1975 to 1987, where he held directorship positions in several companies in the industry, trade, tourism and agriculture areas. After returning to Portugal, he continued to work as Director for several companies belonging to the Queiroz Pereira family. In 1995, when the scope of activities of the Queiroz Pereira family expanded to the concrete industry, he was elected Chairman of the Board of Directors of Secil and Semapa, and also CEO of the latter, having resigned as Chairman of the Executive Board of Semapa in July 2015. Since 2004, Pedro Queiroz Pereira also held the office of Chairman of the Board of Directors of The Navigator Company.
JOÃO NUNO DE SOTTOMAYOR PINTO DE CASTELLO BRANCO
João Castello Branco is a graduate in mechanical engineering by Instituto Superior Técnico and holds a master degree in management by INSEAD. He holds office, since July 2015, as Chairman of the Executive Board of Semapa, and up to that date was Partner-Director of McKinsey & Company at the Iberian Office. He joined McKinsey in 1991, where he practised in several fields, at the service of some of the leading institutions in Portugal and Spain. He also worked in this sectors in Europe, Latin America and the USA. He led teams at McKinsey working in competitiveness, productivity and innovation in Portugal and Spain. Before joining McKinsey, he worked at the engine development centre of Renault, in France. In 2017 he was elected member of the General Board of AEM – Associação de Empresas Emitentes de Valores Cotados em Mercado. Since 2015, he has been Director of The Navigator Company and Secil, having been appointed Chairman of both companies by the end of 2018.

2018
AN
NU
AL R
EPO
RT
70
*03
JOSÉ MIGUEL PEREIRA GENS PAREDES
José Miguel Paredes holds a degree in Economics from Universidade Católica Portuguesa and initiated his professional activity in 1985, at Direcção Geral de Concorrência e Preços (Portuguese Competition Authority). In the following years, he worked at the Rodoviária Nacional (Portuguese state-owned bus transportation company), Trader Interbiz, Cosec (Credit Insurance Company) in the External Credit Department, Generale Bank in the Commercial Department and Treasury / Foreign Exchange Trading Room, in Portugal, and United Distillers in the Financial Department in Portugal. In 1994, he became Financial Director of Semapa and some of the other related companies in the group. He was Executive Director of Enersis, a renewable energy company owned by the Semapa Group. From 2004 to 2018 he was Semapa’s investor relations officer and he has held office as Executive Director of Semapa since 2006. In 2008 José Miguel Paredes was appointed Director of ETSA and he is Chairman of the Board of Directors since 2010. He also became Director of The Navigator Company and Secil in 2011 and 2012, respectively. In 2018 he was appointed Director of Sonagi.
PAULO MIGUEL GARCÊS VENTURA
Miguel Ventura has a degree in Law and completed the INSEAD IEP ‘08Jul and COL ‘15Dec Governance Programmes in 2018. He also holds a certificate of Corporate Governance of INSEAD of 2018. He began practising Law in 1995. In 1997 he became an officer of the General Assemblies in several subsidiaries of Cimigest, Sodim and Semapa and was appointed Company Secretary of Semapa. From 2005 to 2007 he was a member of the Lisbon District Council of the Bar Association. He has held office as Executive Director of Semapa and other related companies since 2006. In 2007 Miguel Ventura was appointed Vice-President of the General Meeting of REN (until the end of 2014) and of Infraestruturas de Portugal. He also became Director of The Navigator Company and Secil in 2011 and 2012, respectively. In 2014 he was elected member of the General Board of AEM – Associação de Empresas Emitentes de Valores Cotados em Mercado, and remained in office until the end of 2016. In 2017 he was appointed member of the Board of that association. In 2018 he was appointed Director of Sonagi.
RICARDO MIGUEL DOS SANTOS PACHECO PIRES
Ricardo Pires holds a degree in Business Administration and Management from Universidade Católica Portuguesa, and is specialised in Corporate Finance from ISCTE. He also has an MBA in Corporate Management from Universidade Nova de Lisboa. He began his career in the field of management consulting, from 1999 to 2002 for BDO Binder and later for GTE Consultores. From 2002 to 2008 he held several positions in the Corporate Finance Board at ES Investment, where he developed different M&A and capital market projects in the Energy, Paper and Pulp and Food & Beverages sectors. He has worked for Semapa since 2008, first as Director of Strategic Planning and New Business and afterwards, from 2011, as Chief of Staff of the Chairman of the Board of Directors. In 2014 he was appointed Executive Director of Semapa, and he also holds positions in other related companies. Since 2015, he has held
positions in the board of The Navigator Company and Secil. He is, since 2017, the CEO of Semapa Next.
ANTÓNIO PEDRO DE CARVALHO VIANA-BAPTISTA
António Viana Baptista has a degree in Economy, a post-graduate degree in European Economy and holds an MBA (INSEAD). From 1984 to 1991, he was Principal Partner of Mckinsey & Co. Between 1991 and 1998, he was Director of Banco Português de Investimento. Between 1998 and 2008, he held positions at Telefonica S.A., as Chairman of Telefonica Internacional from 1998 to 2002, Chairman of Telefonica Moviles S.A. from 2002 to 2006, and Chairman of Telefonica España from 2006 to 2008, and he was also Director of Telefonica S.A. and Portugal Telecom, representing Telefonica. From 2011 to 2016 he was CEO of Crédit Suisse AG for Spain and Portugal. He held office as non-Executive Director of Jasper Inc, California until 2016 and of Abertis, S.A. from 2017 to 2018. At present, he is non-executive Director of Jerónimo Martins, S.A. (where he also acted as member of the Audit Committee from 2010 to 2015) and of Atento S.A., in addition to performing duties as Director of Alter Venture Partners G.P., SARL. He has been non-
executive Director of Semapa since 2010.
CARLOS EDUARDO COELHO ALVES
Carlos Alves has a degree in mechanical engineering from Instituto Superior Técnico and he is an Expert Industrial Manager by the Portuguese Association of Engineers. He began working as lecturer of Machine Components I and II at Instituto Superior Técnico and he was a Trainee Expert of the Works Monitoring Division at Laboratório Nacional

2018 ANN
UAL R
EPO
RT
71
*03
de Engenharia Civil in Lisbon. He was an engineer of technical services at Cometna – Companhia Metalúrgica Nacional, SARL, and later director in charge of manufacturing and managing director of Cobrascom S.A. (In Rio de Janeiro, Brazil). From 1989 to 2009 he was director of Semapa and Secil, where he held office as CEO from 1994 to 2008, of Portucel (currently The Navigator Company) and Enersis. He has been non-executive director of Semapa since November 2015.
FRANCISCO JOSÉ MELO E CASTRO GUEDES
Francisco Guedes has a degree in Economic and Financial Sciences and holds an MBA from INSEAD. He initiated his professional career in 1971 at the Companhia União Fabril. He performed military service from 1972 to 1975. In the following years, in 1976 he was Financial Director of Companhia Rio Moju and from 1977 to 1987 at the Anglo American Corporation (in Brazil), holding office as Executive Director, the Holding’s Financial Director, Director in charge of all (non-gold) mining and industrial companies in Brazil and Financial Director of Mineração Morro Velho. Between 1988 and 1989 Francisco Guedes he was in charge of the Ricardo Schedel brokerage. In 1990, he was manager of the Aroeira project at Formentur, and in the following years he was director and manager at Anglo American Corporation Portugal, Nacional – C.I.T.C., Nutrinveste and Sociedade Ponto Verde. Between 2009 and 2015 he was Director of The Navigator Company. He has occupied, since 2001, management positions at Secil, having carried out executive functions in Semapa and other group companies from 2006 to 2013.
MANUEL CUSTÓDIO DE OLIVEIRA
Manuel Oliveira has a degree in Economy. In 1977, he began working as Director of the Lagoalva Groups, and he still holds this position today. In 1978 he worked for Thomson Maclinctock, and in 1979 for Glaxo Farmacêutica. In 1980, he took office as Director of Sodim and became Financial Director of Cimianto. In the 90s still, he was Chairman of AIPA (Associação das Indústrias de Produtos de Amianto) and negotiator in Brussels for the Asbestos dossier. In the following years, he was Chairman of the Board of Directors of Antasobral S.A., Director of Sousa Campilho S.A. and of Esforço S.A and manager of Zona de Caça e Pesca da Herdade Sobral e Mergulhoas, Lda. From 2013 to 2018, he held office as Chairman of the Board of Directors of Cimilonga, Longavia, Refundos and Sonagi Imobiliária, and as Director of Cimigest and Sodim, and he was appointed Chairman of the Board of Directors of the Sonagi in 2014. From 2014 to 2018, he held office as non-executive Director of Semapa, company for which he had previously worked as a consultant.
VÍTOR MANUEL GALVÃO ROCHA NOVAIS GONÇALVES
Vítor Novais Gonçalves has a Business and Administration Degree by ISC-HEC, in Brussels, and more than 30 years of professional experience with senior positions in Consumer Goods, Telecom and Financial sectors. He began his professional activity in 1984 at Unilever as Management Trainee and later as Product Manager and Market Manager. Between 1989 and 1992, he was Business Manager in the Venture Capital Area at Citibank Portugal and later he was Corporate Finance Head and member of the Management Committee. Between 1992 and 2000, in the financial area of Group José de Mello, he held board positions in several companies and, among others, was General Manager of Companhia de Seguros Império. Between 2001 and 2009, at SGC Group he was Director of SGC Comunicações, being responsible for International Business Development. He is presently Director of Zoom Investment, Semapa and The Navigator Company, among others.
VÍTOR PAULO PARANHOS PEREIRA
Vitor Paranhos Pereira holds a degree in Economics by Universidade Católica Portuguesa and attended AESE (Universidade de Navarra). He began working in 1982 at the company Gaspar Marques Campos Correia & Cª. Lda. as Financial Director until 1987. From 1987 to 1989 he was Deputy Financial Director of the Instituto do Comércio Externo de Portugal (ICEP). Vítor Pereira joined the group in 1989 as Financial Director of Sodim, and in 2009 he became member of the Board of Directors of that company and did not leave until May 2018. He also holds directorships in several companies related to Sodim, namely Hotel Ritz since 1998. From 2001 to 2016, he was Director of the Hotel Villa Magna. He has held office as Director of Sonagi since 1995. From 2006 to 2015 he was appointed Chairman of the Audit Board of the Associação da Hotelaria de Portugal (AHP). From 2007 to 2016 he has been Chairman of the General Meeting of the Associação Portuguesa de Fundos de Investimento, Pensões e Patrimónios (APPFIPP). He has served as member of the Audit Board of Eurovida – Companhia de Seguros, S.A. and Popular Seguros –

2018
AN
NU
AL R
EPO
RT
72
*03
Companhia de Seguros, S.A. from 2009 to 2018. In 2014 he was appointed member of the Board of Directors of Semapa and Cimigest, having held positions in the latter until May 2018. He was appointed director of Refundos in 2005, where he has served as Chairman of the Board of Directors since 2018.
FILIPA MENDES DE ALMEIDA DE QUEIROZ PEREIRA
Filipa Queiroz Pereira has a degree in Applied Mathematics from Universidade Lusíada and a post-graduate degree in Information Systems from Harvard Extension School. She completed executive programmes at INSEAD, at London Business School, at Harvard Business School and at Singularity University and she has been involved in IT consultancy and real estate activities. She has been a director of Sodim (the controlling company of Semapa) since 2014, also integrating, since 2018, the Board of Directors of Semapa and Hotel Ritz.
MAFALDA MENDES DE ALMEIDA DE QUEIROZ PEREIRA
Mafalda Queiroz Pereira completed Secondary Education, together with technical courses in Wood Carving and Carpentry by Fundação Ricardo Espírito Santo and in Interior Architecture by SENAI (Brazil). She completed executive programmes at Insead, at London Business School and at Harvard Business School and she has been involved in the development of projects in real estate. She has been a director of Sodim (the controlling company of Semapa) since 2014, also integrating, since 2018, the Board of Directors of Semapa and Sonagi, company dedicated to the real estate management and operation.
LUA MÓNICA MENDES DE ALMEIDA DE QUEIROZ PEREIRA
Lua Queiroz Pereira after completing Secondary Education, attended several schools of management, namely Insead, where she obtained a certificate in Global Management, London Business School, Singularity University and Harvard Business School, where she completed courses for executives. In the past she was a business manager linked to equestrianism. She has been a director of Sodim (the controlling company of Semapa) since 2014, also integrating, since 2018, the Board of Directors of Semapa and Semapa Next, a venture capital company of the Group.
JOSÉ ANTÔNIO DO PRADO FAY
José Antônio do Prado Fay has a degree in Mechanical Engineering from Universidade Federal do Rio de Janeiro and he attended a specific post-graduate course in Industrial Engineering from Coppe (Coordenação de Pós-Graduação e Pesquisa de Engenharia). He initiated his professional activity at Copesul in 1978, where he was engineering supervisor until 1986. From 1986 to 1988 he was chief of the Engineering and Maintenance Division at Petroquímica Triunfo, S.A. and until 2000 he performed several management functions at Bounge Group, in the areas of Engineering and Consumption Goods Business. He was in charge of the Commercial and Marketing department at Electrolux from 2000 to 2003 and from 2003 to 2007 he served as chairman of Batavo, S.A., which was incorporated in Perdigão, S.A. in 2006, acting as Chairman of that company in 2008. He was chairman of Brasil Foods S.A. From 2007 to 2013. Since 2014, he is member of several Boards of Directors, namely Camil, S.A., S.A. and Supremo Cimentos (Secil), S.A. He is Senior advisor at Mckinzey & Co. and of the Warburg Pincus fund.
20 Habitual and significant family, professional or business ties between members, as the case may be, of the Board of Directors, the General and Supervisory Board and the Executive Board of Directors with shareholders to whom a qualifying holding greater than 2% of the voting rights may be allocated.
Besides the directorships held by several Directors in companies which own qualifying holdings in Semapa, namely Sodim and subsidiaries, as described in paragraph 26 below, and the direct and indirect shareholdings of Filipa Mendes de Almeida de Queiroz Pereira, Mafalda Mendes de Almeida de Queiroz Pereira and Lua Mónica Mendes de Almeida de Queiroz Pereira, as heirs to the undivided estate of Pedro Mendonça Queiroz Pereira in Sodim and Vialonga, there are no habitual or significant family, professional or business ties between members of the Board of Directors and shareholders in Semapa which own qualifying holdings.

2018 ANN
UAL R
EPO
RT
73
*03
21 Organizational or functional charts showing the division of powers between the different corporate boards, committees and/or company departments, including information on delegated powers, in particular with regard to delegation of the day-to-day management of the company.
The following simplified chart shows the organization of Semapa’s different bodies, committees and departments:
GENERALMEETING
AUDIT BOARD
STATUTORY AUDITOR/
INDEPENDENTAUDITOR
BOARD OF DIRECTORS
EXECUTIVE BOARD
REMUNERATION COMMITTEE
CONTROL AND RISK COMMITTEE
CORPORATE GOVERNANCE COMMITTEE
INVESTOR RELATIONS OFFICE/MARKET RELATIONS OFFICER
COMPANY SECRETARY
LEGAL DEPARTMENT
FINANCIAL DEPARTMENT
ACCOUNTS AND TAX DEPARTMENT
NEW BUSINESS DEPARTMENT
TAX DEPARTMENT
The management of the company is centred on the relationship between the Board of Directors and the Executive Board.
The two bodies were coordinated and kept in contact through the close cooperation between the Chairman of the Board and the executive team and, in particular with the CEO, Pedro Mendonça de Queiroz Pereira, through the availability of the members of the Executive Board to convey all relevant or urgent or requested information on the day-to-day management of the Company, to the non-executive directors, in order to keep them abreast of the Company’s life at all times. In addition, meetings of the Board of Directors are called for all strategic decisions regarded as especially important, even if they fall within the scope of the general powers delegated, and the Chairman of the Board attending some of the meetings of the Company’s Executive Board.
Information requested by the other members of corporate boards is also provided in good time and in an appropriate form by the members of the Executive Board.
In order to assure that information is communicated on a regular basis, the Chief Executive Officer also provides the notices and minutes of meetings of the Executive Board to the Chairman of the Audit Board. The remaining committees and corporate governing bodies also ensure information flows in a timely and appropriate manner and in accordance with their respective operating regulations, by delivering notices and minutes in the necessary and appropriate terms for the other bodies and committees to exercise their legal and statutory powers.
Although duties and responsibilities are not rigidly compartmentalised within the Board of Directors, four main areas may be distinguished in the way responsibilities are shared:
1nd Strategic planning and investment policy, which are the responsibility of the CEO, João Nuno de Sottomayor Pinto de Castello Branco.
2nd Financial, accounting and audit, which are the responsibility of the director José Miguel Pereira Gens Paredes.3nd Legal, corporate governance and IT issues, which are the responsibility of the director Paulo Miguel Garcês
Ventura.4nd New Business Areas, which are the responsibility of the director Ricardo Miguel dos Santos Pacheco Pires.

2018
AN
NU
AL R
EPO
RT
74
*03
Regarding strategic planning and Investments Policy, and without prejudice to the mentioned office, this is an area that naturally entails more intervention on behalf of the non-executive members and that counts on the substantial involvement of the Chairman of the Board. Non-executive directors should participate in the definition, by the managing body, of the strategy, main policies, business structure and decisions that should be deemed strategic for the company due to their amount or risk, as well as in the assessment of the accomplishment of these actions.
The Executive Board has been granted broad management powers, largely detailed in the respective act of delegation, and only limited with regard to the matters indicated in article 407.4 of the Companies Code. Powers are specifically delegated for the following:
a) To negotiate and resolve to enter into any commercial or civil contract, by public or private act, on the terms and
conditions it deems most appropriate, and to take all decisions it sees fit in the performance of these contracts;b) To resolve to issue, sign, draw, accept, endorse, guarantee, protest or carry out any other act in connection with
the use of bills or credit instruments;c) To resolve on all routine banking operations, with Portuguese or foreign financial institutions, namely opening,
consulting and establishing the form of effecting movements in bank accounts, in all the legally admissible forms;
d) To negotiate and resolve to contract and amend loan agreements, with financial institutions or other entities, including the provision of the respective guarantees in cases where the law permits such delegation, all on the terms it sees fit;
e) To resolve to acquire, dispose of and encumber assets of all kinds, on the terms and conditions it sees fit, nego-tiating and resolving on the conclusion for such purposes, by public or private document, of any contractual in-strument, and carrying out any accessory or complementary acts which may be necessary for the performance of these contracts;
f) To take all decisions and carry out all acts in connection with the exercise by the company of its position as shareholder, namely by appointing its representatives at the General Meetings of companies in which it has holdings and adopting unanimous resolutions in writing;
g) To draft the company reports, balance sheets, financial statements and proposals for allocation of profits;h) To take all steps necessary or appropriate in connection with the company’s industrial relations with its em-
ployees, namely contracting, dismissing, transferring, defining terms of employment and pay, and revising and amending the same;
i) To resolve on representation of the company before any court or mediation or arbitration body, taking all deci-sions as may be necessary or appropriate in connection with any proceedings pending before the same or to bring the same, and namely to desist, confess or settle;
j) To appoint attorneys for the company within the powers delegated to it;k) To take all steps necessary or appropriate in connection with existing or planned issues of bonds and commer-
cial paper, including the actual decision to issue; andl) In general, to carry out all acts of day-to-day management in the company, except for those which cannot be
delegated under Article 407.4 of the Companies Code.
The Executive Board is barred from resolving on the following:
i) Selection of the Chairman of the Board of Directors;ii) Co-opting of directors;iii) Call a General Meeting;iv) Annual reports and financial statements;v) Provision of bonds and personal or real guarantees by the company;vi) Change in registered offices and increases in share capital; and
vii) Plans to merge, break-up or change the company.
At the end of 2015 financial year, some of the Company’s regular practices were standardised, in order to guarantee intervention by the Board of Directors in strategic decisions involving large amounts of money, high risk or special characteristics.
At the end of 2018, the new internal regulations of the Board of Directors and Audit Board, and of the internal committees identified below, which lay down rules governing the functioning, duties and collaboration between these bodies and committees, were revised, approved and published. According to these regulations and other applicable rules, these governing bodies and committees draw up complete minutes of their meetings.

2018 ANN
UAL R
EPO
RT
75
*03
In the case of the Audit Board, which has the powers established in law, there are no delegated powers or special areas of responsibility for individual members.
The main purpose of the Control and Risk Committee (CRC) is to detect and control all relevant risks in the Company’s affairs, and the Committee enjoys full powers to pursue this aim, as set out in item 29 of this Report.
The CRC replaced the former Internal Control Committee. The Board of Directors decided on 31 October 2018 to change its composition by appointing new members, mentioned in item 29 below.
The Corporate Governance Committee (CGC) exists to monitor, on a permanent basis, compliance by the company with corporate governance requirements established in law, regulation and the Articles of Association, and to exercise the other powers detailed in item 29 of this Report.
The CGC replaced the Corporate Governance Supervisory Committee. The Board of Directors decided on 31 October 2018 to change its composition by appointing new members, mentioned in item 29 below.
The functions of the Investor Support Office are detailed in item 56 of this report.
The Company Secretary is appointed by the Board of Directors and has the powers defined in law.
The Remuneration Committee draws up an annual statement on remuneration policy for members of the Board of Directors and audit board, and conducts analyses and sets the remuneration of directors.
The Legal Department provides the company with legal advice and is in charge of legal compliance in order to assure that procedures and proceedings comply with the relevant legislation. The Financial Division is primarily engaged in financial management and planning. The Accounts and Tax Department is mainly responsible for rendering the Company’s accounts and complying with its tax obligations. As for the New Business directorate, it is in charge of identifying and researching new business opportunities towards their implementation. The Tax directorate, on the other hand, provides tax advice, ensuring compliance with the applicable legislation and preventing unlawful fiscal planning.
The governing bodies and internal committees mentioned above are required to exchange between them, in accordance with the legal statutory requirements, all necessary information and documents for the exercise of legal and statutory duties of such bodies and committees, the respective directorates and services helping with drawing up, processing and disseminating such information in an appropriate, strict and timely manner.
The regulations of the Board of Directors and the audit body also establish, in particular, mechanisms that ensure, within the limits of the legislation and applicable regulations, access of members to employees of the company and all information that is necessary for assessing the Company’s performance, status and development prospects, including without limitation, minutes, documentation supporting the decisions taken, notices and files of the meetings of the Board of Directors and its Executive Board, without prejudice to having access to other documents or persons to request clarifications.
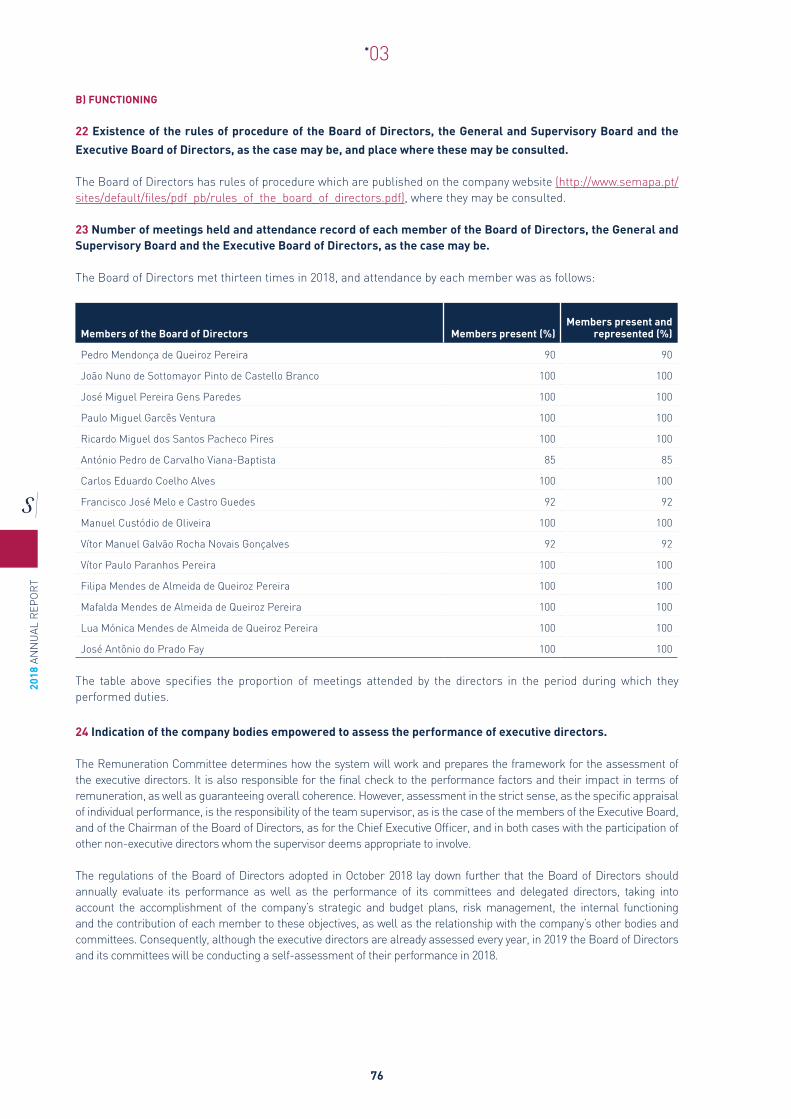
2018
AN
NU
AL R
EPO
RT
76
*03
B) FUNCTIONING
22 Existence of the rules of procedure of the Board of Directors, the General and Supervisory Board and the
Executive Board of Directors, as the case may be, and place where these may be consulted.
The Board of Directors has rules of procedure which are published on the company website (http://www.semapa.pt/sites/default/files/pdf_pb/rules_of_the_board_of_directors.pdf), where they may be consulted.
23 Number of meetings held and attendance record of each member of the Board of Directors, the General and Supervisory Board and the Executive Board of Directors, as the case may be.
The Board of Directors met thirteen times in 2018, and attendance by each member was as follows:
Members of the Board of Directors Members present (%)Members present and
represented (%)
Pedro Mendonça de Queiroz Pereira 90 90
João Nuno de Sottomayor Pinto de Castello Branco 100 100
José Miguel Pereira Gens Paredes 100 100
Paulo Miguel Garcês Ventura 100 100
Ricardo Miguel dos Santos Pacheco Pires 100 100
António Pedro de Carvalho Viana-Baptista 85 85
Carlos Eduardo Coelho Alves 100 100
Francisco José Melo e Castro Guedes 92 92
Manuel Custódio de Oliveira 100 100
Vítor Manuel Galvão Rocha Novais Gonçalves 92 92
Vítor Paulo Paranhos Pereira 100 100
Filipa Mendes de Almeida de Queiroz Pereira 100 100
Mafalda Mendes de Almeida de Queiroz Pereira 100 100
Lua Mónica Mendes de Almeida de Queiroz Pereira 100 100
José Antônio do Prado Fay 100 100
The table above specifies the proportion of meetings attended by the directors in the period during which they performed duties.
24 Indication of the company bodies empowered to assess the performance of executive directors.
The Remuneration Committee determines how the system will work and prepares the framework for the assessment of the executive directors. It is also responsible for the final check to the performance factors and their impact in terms of remuneration, as well as guaranteeing overall coherence. However, assessment in the strict sense, as the specific appraisal of individual performance, is the responsibility of the team supervisor, as is the case of the members of the Executive Board, and of the Chairman of the Board of Directors, as for the Chief Executive Officer, and in both cases with the participation of other non-executive directors whom the supervisor deems appropriate to involve.
The regulations of the Board of Directors adopted in October 2018 lay down further that the Board of Directors should annually evaluate its performance as well as the performance of its committees and delegated directors, taking into account the accomplishment of the company’s strategic and budget plans, risk management, the internal functioning and the contribution of each member to these objectives, as well as the relationship with the company’s other bodies and committees. Consequently, although the executive directors are already assessed every year, in 2019 the Board of Directors and its committees will be conducting a self-assessment of their performance in 2018.

2018 ANN
UAL R
EPO
RT
77
*03
25 Predetermined criteria for assessing the performance of executive directors.
The criteria for assessing the performance of executive directors are the criteria defined in item 2 of chapter VI of the Remuneration Policy Statement for setting the variable remuneration component. Such criteria are met through a system of KPIs, which include quantitative and qualitative, individual and collective, components. EBITDA, net earnings and cash flow are the quantitative elements jointly considered.
26 Availability of each of the members of the Board of Directors, the General and Supervisory Board and the Executive Board of Directors, as the case may be, indicating office held simultaneously in other companies, inside and outside the group, and other relevant activities carried on by the members of these bodies during the
period.
The members of the Board of Directors have the appropriate time available to perform the duties entrusted to them, and the other activities carried on by the executive members during the period, outside the business group to which Semapa belongs, are negligible when compared to performance of their duties in the companies and other companies in the same business group.
Besides the activities mentioned under item 19, the members of the Board of Directors occupy the positions detailed below:
JOÃO NUNO DE SOTTOMAYOR PINTO DE CASTELLO BRANCO
OFFICE HELD IN OTHER COMPANIES BELONGING TO THE SAME GROUP AS SEMAPA: APHELION, S.A. Chairman of the Board of Directors
OFFICE HELD IN OTHER COMPANIES: AEM - Ass. de Emp. Emitentes de Valores Cotados em Mercado Member of the General Board CIMIGEST, SGPS, S.A. Director CIMIPAR – Sociedade Gestora de Participações Sociais, S.A. Chairman of the Board of Directors2 LONGAPAR, SGPS, S.A. Chairman of the Board of Directors3
THE NAVIGATOR COMPANY, S.A. Chairman of the Board of Directors4
SECIL - Companhia Geral de Cal e Cimento, S.A. Chairman of the Board of Directors5
SEINPART – Participações, SGPS, S.A. Chairman of the Board of Directors6
SEMAPA NEXT, S.A. Chairman of the Board of Directors SODIM, SGPS, S.A. Director
JOSÉ MIGUEL PEREIRA GENS PAREDESOFFICE HELD IN OTHER COMPANIES BELONGING TO THE SAME GROUP AS SEMAPA: ABAPOR - Comércio e Indústria de Carnes, S.A. Chairman of the Board of Directors APHELION, S.A. Director Aprovechamiento Integral de Subprodutos Ibéricos, S.A. Director BIOLOGICAL - Gestão de Resíduos Industriais, Lda. Manager CELCIMO, S.L. Director ETSA - Investimentos, SGPS, S.A. Chairman of the Board of Directors ETSA LOG, S.A. Chairman of the Board of Directors I.T.S. - Indústria Transformadora de Subprodutos, S.A. Chairman of the Board of Directors SEBOL - Comércio e Indústria de Sebo, S.A. Chairman of the Board of Directors SEINPART - Participações, SGPS, S.A. Director7
SEMAPA NEXT, S.A. Director SEMINV - Investimentos, SGPS, S.A. Director8
2 Company incorporated in Cimigest, SGPS, S.A. on 27 December 2018.3 Company incorporated in Cimo – Gestão de Participações, SGPS, S.A. on 27 December 2018.4 Served as Vice-Chairman of the Board of Directors until 29 October 2018, having taken office as Chairman after that date..5 Served as Vice-Chairman of the Board of Directors until 29 October 2018, having taken office as Chairman after that date.6 Company dissolved on 30 November 2018.7 Company dissolved on 30 November 2018..8 Company dissolved on 28 September 2018.

2018
AN
NU
AL R
EPO
RT
78
*03
OFFICE HELD IN OTHER COMPANIES: CIMIGEST, SGPS, S.A. Director CIMIPAR – Sociedade Gestora de Participações Sociais, S.A. Director9
CIMO – Gestão de Participações, SGPS S.A. Chairman of the Board of Directors HOTEL RITZ, S.A. Director10
LONGAPAR, SGPS, S.A. Chairman of the Board of Directors11 12
MOR ON-LINE – Gestão de Plataformas de Negociação de Resíduos On-Line, S.A. Director13
SECIL - Companhia Geral de Cal e Cimento, S.A. Director SODIM, SGPS, S.A. Director SONAGI, SGPS, S.A. Director THE NAVIGATOR COMPANY, S.A. Director
PAULO MIGUEL GARCÊS VENTURAOFFICE HELD IN OTHER COMPANIES BELONGING TO THE SAME GROUP AS SEMAPA: ABAPOR - Comércio e Indústria de Carnes, S.A. Director APHELION, S.A. Director Aprovechamiento Integral de Subprodutos Ibéricos, S.A. Director BIOLOGICAL - Gestão de Resíduos Industriais, Lda. Manager CELCIMO, S.L. Director ETSA - Investimentos, SGPS, S.A. Director ETSA LOG, S.A. Director I.T.S. - Indústria Transformadora de Subprodutos, S.A. Director SEBOL - Comércio e Indústria de Sebo, S.A. Director SEINPART - Participações, SGPS, S.A. Director14
SEMAPA Inversiones, S.L. Director SEMAPA NEXT, S.A. Director SEMINV - Investimentos, SGPS, S.A Director15
OFFICE HELD IN OTHER COMPANIES: AEM - Ass. de Emp. Emitentes de Valores Cotados em Mercado Member of the General Board CIMIGEST, SGPS, S.A. Director CIMIPAR – Sociedade Gestora de Participações Sociais, S.A Chairman of the Board of Directors16 17
FUNDAÇÃO NOSSA SENHORA DO BOM SUCESSO Member of the General Board HOTEL RITZ, S.A. Director LONGAPAR, SGPS, S.A. Director18
SECIL - Companhia Geral de Cal e Cimento, S.A. Director SODIM, SGPS, S.A. Director SONAGI, SGPS, S.A. Director THE NAVIGATOR COMPANY, S.A. Director ANTASOBRAL - Sociedade Agropecuária, S.A. Chairman of the General Meeting BEIRA-RIO – Sociedade Construtora de Armazéns, S.A. Chairman of the General Meeting GALERIAS RITZ – Imobiliária, S.A. Chairman of the General Meeting INFRAESTRUTURAS DE PORTUGAL, S.A. Vice-Chairman of the General Meeting
9 Company incorporated in Cimigest, SGPS, S.A. on 27 December 2018.10 In office until 23 March 2018.11Served as Chairman of the Board of Directors until 28 May 2018.12 Company incorporated in Cimo – Gestão de Participações, SGPS, S.A. on 27 December 2018.13 In office until 27 June 2018.14 Company dissolved on 30 November 2018.15 Company dissolved on 28 September 2018.16 In office until 28 May 2018.17 Company incorporated in Cimigest, SGPS, S.A. on 27 December 2018.18 Company incorporated in Cimo – Gestão de Participações, SGPS, S.A. on 27 December 2018..

2018 ANN
UAL R
EPO
RT
79
*03
LONGAVIA – Imobiliária, S.A. Chairman of the General Meeting19
PARQUE RITZ – Imobiliária, S.A. Chairman of the General Meeting REFUNDOS – Sociedade Gestora de Fundos de Investimento Imobiliário, S.A. Chairman of the General Meeting SOCIEDADE AGRÍCOLA DA QUINTA DA VIALONGA, S.A. Chairman of the General Meeting SONAGI – Imobiliária, S.A. (Anteriormente
designada Cimilonga – Imobiliária, S.A.) Chairman of the General Meeting 20
SONAGI – Imobiliária, S.A. Chairman of the General Meeting21
SONAGI, SGPS, S.A. Chairman of the General Meeting22
VÉRTICE – Gestão de Participações, SGPS, S.A. Chairman of the General Meeting
RICARDO MIGUEL DOS SANTOS PACHECO PIRESOFFICE HELD IN OTHER COMPANIES BELONGING TO THE SAME GROUP AS SEMAPA: APHELION, S.A. Director SEINPART - Participações, SGPS, S.A. Director23
SEMAPA NEXT, S.A. Director SEMINV - Investimentos, SGPS, S.A. Director24
OFFICE HELD IN OTHER COMPANIES: CIMIGEST, SGPS, S.A. Director CIMIPAR – Sociedade Gestora de Participações Sociais, S.A. Director25
CIMO – Gestão de Participações, SGPS, S.A. Director HOTEL RITZ, S.A. Director26
LONGAPAR, SGPS, S.A. Director27
PYRUS AGRICULTURAL LLC Director PYRUS INVESTMENTS LLC Director PYRUS REAL ESTATE LLC Director SECIL - Companhia Geral de Cal e Cimento, S.A. Director SODIM, SGPS, S.A. Director THE NAVIGATOR COMPANY, S.A. Director UPSIS, S.A. Director
ANTÓNIO PEDRO DE CARVALHO VIANA-BAPTISTAOFFICE HELD IN OTHER COMPANIES BELONGING TO THE SAME GROUP AS SEMAPA:No office held in other companies belonging to the same group as Semapa.
OFFICE HELD IN OTHER COMPANIES: ABERTIS, S.A. Director28 ALTER VENTURE PARTNERS G.P., SARL Director ATENTO, S.A. Director JERÓNIMO MARTINS SGPS, S.A. Director
19 Company incorporated in Cimilonga – Imobiliária, S.A. on 2 August 2018 that changed its name to Sonagi - Imobiliária, S.A.20 In office until 28 September 2018.21 Company incorporated in Cimilonga – Imobiliária, S.A. on 2 August 2018 that changed its name to Sonagi - Imobiliária, S.A.22 In office until 30 May 2018.23 Company dissolved on 30 November 2018..24 Company dissolved on 28 September 2018.25 Company incorporated in Cimigest, SGPS, S.A. on 27 December 2018.26 In office until 23 March 2018.27 Company incorporated in Cimo – Gestão de Participações, SGPS, S.A. on 27 December 2018..28 In office until 18 May 2018.

2018
AN
NU
AL R
EPO
RT
80
*03
CARLOS EDUARDO COELHO ALVESOFFICE HELD IN OTHER COMPANIES BELONGING TO THE SAME GROUP AS SEMAPA:No office held in other companies belonging to the same group as Semapa.
OFFICE HELD IN OTHER COMPANIES: No office held in other companies.
FRANCISCO JOSÉ MELO E CASTRO GUEDESOFFICE HELD IN OTHER COMPANIES BELONGING TO THE SAME GROUP AS SEMAPA: CELCIMO, S.L. Director SEMAPA Inversiones, S.L. Chairman of the Board of Directors
OFFICE HELD IN OTHER COMPANIES: CIMENTS DE SIBLINE S.A.L. Director CIMIGEST, SGPS, S.A. Director29
SECIL – Companhia Geral de Cal e Cimento, S.A. Director SODIM, SGPS, S.A. Director 30
VÍTOR MANUEL GALVÃO ROCHA NOVAIS GONÇALVESOFFICE HELD IN OTHER COMPANIES BELONGING TO THE SAME GROUP AS SEMAPA:No office held in other companies belonging to the same group as Semapa.
OFFICE HELD IN OTHER COMPANIES: BELDEVELOPMENT, S.A. Director EXTRASEARCH, SGPS, S.A. Director MAGALHÃES e GONÇALVES – Consultoria e Gestão, Lda. Manager QUALQUER PONTO – SOCIEDADE IMOBILIÁRIA, S.A. Director QUALQUER PRUMO – Sociedade Imobiliária, Lda. Manager THE NAVIGATOR COMPANY, S.A. Director VANGUARDINTEGRAL, Lda. Manager VRES – Vision Real Estate Solutions, S.A. Director ZOOM INVESTMENT, SGPS, S.A. Director ZOOM INVESTMENT TURISMO, S.A. Director 2FOR VENTURE, SGPS, S.A. Director
VÍTOR PAULO PARANHOS PEREIRAOFFICE HELD IN OTHER COMPANIES BELONGING TO THE SAME GROUP AS SEMAPA:No office held in other companies belonging to the same group as Semapa.
OFFICE HELD IN OTHER COMPANIES: ANTASOBRAL – Sociedade Agropecuária, S.A. Director CAPITAL HOTELS BV Director CIMIGEST, SGPS, S.A. Director31
EUROVIDA – COMPANHIA DE SEGUROS DE VIDA, S.A. Member of the Audit Board32
GALERIAS RITZ, S.A. Chairman of the Board of Directors HOTEL RITZ, S.A. Director LONGAVIA – Imobiliária, S.A. Director33
PARQUE RITZ, S.A. Chairman of the Board of Directors POPULAR SEGUROS – COMPANHIA DE SEGUROS, S.A. Member of the Audit Board34
29 In office until 28 May 2018.30 In office until 29 May 201831 In office until 28 May 2018.32 In office until 1 October 2018.33 Company incorporated in Cimilonga – Imobiliária, S.A.on 01 August 2018 that changed its name to Sonagi - Imobiliária, S.A.34 In office until 29 March 2018.

2018 ANN
UAL R
EPO
RT
81
*03
REFUNDOS – Sociedade Gestora de Fundos de Investimento Imobiliário, S.A. Chairman of the Board of Directors SOCIEDADE AGRÍCOLA da HERDADE dos FIDALGOS, Unip., Lda Manager SODIM, SGPS, S.A. Director35
SODIMPARQUE – Parqueamento e Garagens, Lda. Manager36
SONAGI, SGPS, S.A. Director SONAGI – Imobiliária, S.A. (Anteriormente
designada Cimilonga – Imobiliária, S.A.) Chairman of the Board of Directors37
SONAGI – Imobiliária, S.A. Director 38
FILIPA MENDES DE ALMEIDA DE QUEIROZ PEREIRAOFFICE HELD IN OTHER COMPANIES BELONGING TO THE SAME GROUP AS SEMAPA:No office held in other companies belonging to the same group as Semapa.
OFFICE HELD IN OTHER COMPANIES: ABSTRACTREASON, LDA. Manager BESTWEB, LDA. Manager CIMIGEST, SGPS, S.A. Director ESPAÇO TREZENTOS E QUARENTA, S.A. Director FUNDAÇÃO NOSSA SENHORA DO BOM SUCESSO President of the General Council HOTEL RITZ, S.A. Director LAGUM, LDA Manager SODIM, SGPS, S.A. Director REPRESENTAÇÕES CARVALHAL, S.A. Director
MAFALDA MENDES DE ALMEIDA DE QUEIROZ PEREIRAOFFICE HELD IN OTHER COMPANIES BELONGING TO THE SAME GROUP AS SEMAPA:No office held in other companies belonging to the same group as Semapa.
OFFICE HELD IN OTHER COMPANIES: ESPAÇO TREZENTOS E QUARENTA, S.A. Director CIMIGEST, SGPS, S.A. Director SODIM, SGPS, S.A. Director SONAGI, SGPS, S.A. Director REPRESENTAÇÕES CARVALHAL, S.A. Director
LUA MÓNICA MENDES DE ALMEIDA DE QUEIROZ PEREIRAOFFICE HELD IN OTHER COMPANIES BELONGING TO THE SAME GROUP AS SEMAPA: SEMAPA NEXT, S.A Director
OFFICE HELD IN OTHER COMPANIES: CIMIGEST, SGPS, S.A. Director ECOLUA, LDA. Manager ESPAÇO TREZENTOS E QUARENTA, S.A. Director SODIM, SGPS, S.A. Director REPRESENTAÇÕES CARVALHAL, S.A. Director
35 In office until 29 May 2018.36 Company dissolved on 31 October 2018.37 Served as Director until 28 September 2018.38 Company incorporated in Cimilonga – Imobiliária, S.A. on 1 August 2018 that changed its name to Sonagi - Imobiliária, S.A.
2018
AN
NU
AL R
EPO
RT
82
*03
JOSÉ ANTÔNIO DO PRADO FAY OFFICE HELD IN OTHER COMPANIES BELONGING TO THE SAME GROUP AS SEMAPA:No office held in other companies belonging to the same group as Semapa.
OFFICE HELD IN OTHER COMPANIES: CAMIL ALIMENTOS, S.A. Director SUPREMO CIMENTOS, S.A. Director
According to the regulation of the Board of Directors adopted in October 2018, the directors of the Executive Board may not perform executive functions in entities outside of the Company’s group, unless if the activity of such entities is found to be ancillary or complementary to the group’s activity or is not very time-consuming, the executive directors not being able to perform duties in other companies that do not fulfil the aforementioned criteria.
The same regulation provides that the directors who are not part of the Executive Board may perform management functions (either executive or not) in entities outside of the company’s group, where such companies do not carry out activities that compete with that of the company or of directly or indirectly participated companies, and the Chairman of the Board of Directors must be notified before the start of such functions. The non-executive directors of the company do not perform duties in other companies which do not meet the requirements mentioned above.
C) COMMITTEES BELONGING TO THE MANAGEMENT OR SUPERVISORY BODIES AND MANAGING DIRECTORS
27 Identification of committees set up by the Board of Directors, the General and Supervisory Board and the Executive Board of Directors, as the case may be, and place where the rules of procedure may be consulted
The following committees exist in the company within the Board of Directors: Executive Board, Control and Risk Committee (CRC) and Corporate Governance Committee (CGC).
The CRC and the CGC committees have rules of procedure, which are published on the company website (http://www.semapa.pt/en/rules-corporate-members), where they may be looked up.
Given its nature, composition and origin from the Board of Directors, which has its own regulation on autonomous functioning and specific rules on the organisation and functioning of its Executive Board, the CGC does not have an autonomous regulation. Consequently, the following operating rules provided by said regulation and the act delegating power shall apply:
a) The Executive Board shall meet when convened by the Chairman or any other two members;b) The members of the Executive Board may be represented by another member, and each person may not repre-
sent more than one member;c) The Chairman of the Executive Board has a casting vote;d) Absent members may cast written votes, ande) The Chairman of the Executive Board is particularly responsible for reporting and communicating with the
Board of Directors.
28 Composition, if applicable, of the executive board and/or identification of the managing director(s).
The following are the current members of the Executive Board, who were appointed by resolution of the Board of Directors on 5 June 2018:
• João Nuno de Sottomayor Pinto de Castello Branco, who chairs the board; • José Miguel Pereira Gens Paredes;• Paulo Miguel Garcês Ventura, and• Ricardo Miguel dos Santos Pacheco Pires
2018 ANN
UAL R
EPO
RT
83
*03
29 Indication of the powers of each of the committees created and summary of the activities carried on the exercise of these responsibilities.
Executive Committee:
The powers of the Executive Board are described in item 21 of this report.
The Executive Board is the company’s executive body, which has performed its duties in the scope of the powers entrusted to it by the Board of Directors. The Board meets on a regular basis and whenever necessary in the light of ongoing business and monitoring of the company’s activity. In 2018 it held fifty-one meetings. These meetings are attended by the members of the Executive Board, as well as the Company Secretary, Rui Gouveia. When the matters to be discussed so require, non-executive directors, directors of the group’s companies and some of the Company’s managers may also take part in the meetings.
Control and Risk Committee:
In view of implementing its purpose to detect and control all relevant risks in the company’s affairs, in particular financial risks, the CRC has the following responsibilities and powers:
a) To monitor the Company’s business affairs, with integrated and permanent analysis of the risks associated with these affairs;
b) To propose and follow through the implementation of specific measures and procedures relating to the control and reduction of the Company’s business risks, with a view to perfecting the internal risk control and manage-ment system;
c) To check implementation of the adjustments to the internal control and risk management system proposed by the Audit Board;
d) To propose the discussion, alteration and introduction of new procedures to improve the detection, control and management of risks inherent to the Company’s operations.
The CRC shall prepare for approval by the Board of Directors the Company’s risk policy for each fiscal year, which
shall identify, without limiting:
a) The main risks to which the Company is subject in the development of its activities and the levels of risk consid-ered acceptable to the Company;
b) The likelihood of such risks and their impact on the Company’s operations;c) The necessary tools and measures for the mitigation of the risks identified as relevant for the Company’s activ-
ities.
The CRC met four times in the financial year 2018.
Considering the recomposition of the CRC as decided by the Board of Directors on 31 October 2018, the former members of the CRC (appointed by the Internal Control Committee) Joaquim Martins Ferreira do Amaral, Jaime Alberto Marques Sennfelt Fernandes Falcão and Margarida Isabel Feijão Antunes Rebocho, were replaced on that date by Carlos Eduardo Coelho Alves, Chairman, José Miguel Pereira Gens Paredes and Gonçalo de Castro Salazar Leite, Members, being Carlos Alves and José Miguel Paredes directors of the company as well.
This committee conducted the activities, ensured the monitoring and made all the verifications corresponding to its duties, and held joint meetings with the members of the Audit Board, and with the support of the Financial Department and the Accounts and Tax Department.
Corporate Governance Committee:
The CGC monitors on a continuous basis the Company’s compliance with the provisions of the law, regulations and articles of association applicable to corporate governance and it is responsible for critical analysis of the company’s practices and procedures in the field of corporate governance and for proposing for debate, altering and introducing new procedures designed to improve the structure and governance of the Company. The CGC is also required to assess annually corporate governance and submit to the Board of Directors any proposals as it sees fit.

2018
AN
NU
AL R
EPO
RT
84
*03
The CGC met twice in the financial year of 2018.
Considering the recomposition of the CGC as decided by the Board of Directors on 31 October 2018, the former members of the CGC (known as the Corporate Governance Supervisory Committee) Jorge Manuel de Mira Amaral, Gonçalo Allen Serras Pereira and the director Francisco José Melo e Castro Guedes, were replaced on that date by Francisco José Melo and Castro Guedes, Chairman, Paulo Miguel Garcês Ventura and Rui Tiago Trindade Ramos Gouveia, Members, company directors and secretary, respectively.
The CGC conducted its oversight and corporate governance assessment activities throughout the financial year. It also participated actively in the drafting of the Annual Report on Corporate Governance, for which it obtained the necessary information, particularly by keeping in touch and attending the meetings with the Executive Director, Miguel Ventura, and a member of the Legal Department.
III AUDITING
A) COMPOSITION
30 Identification of the supervisory body corresponding to the model adopted.
The Company’s affairs are supervised by the Audit Board and the Statutory Auditor, in accordance with Article 413.1 b) of the Companies Code.
31 Composition, as applicable, of the Audit Board, the Audit Committee, the General and Supervisory Board or the Committee for Financial Affairs, indicating the minimum and maximum numbers of members and duration of their term of office, as established in the Articles of Association, number of full members, date of first appointment and end date of the term of office of each member; reference may be made to the item in the report where this information is contained in accordance with paragraph 17.
As established in the Articles of Association, the Audit Board consists of three to five full members, one of whom serves as Chairman with a casting vote, and of one or two alternate members, depending on whether there are three or more full members, all holding office for four year terms.
Members of the Audit Board Date of first appointment and end date of term of office
Miguel Camargo de Sousa Eiró 39
(Chairman)2006-2018
José Manuel Oliveira Vitorino(Chairman) 40
2014-2021
Gonçalo Nuno Palha Gaio Picão Caldeira(Full member)
2006-2021
Maria da Graça Torres Ferreira da Cunha Gonçalves(Full member)
2018-2021
Ana Isabel Moraes Nobre de Amaral Marques(Alternate member)
2016-2021
The Company considers that it has a sufficient number of members of the Audit Board for its size and the complexity of the risks inherent in its activity, thus ensuring the efficient performance of its duties.
39 Held office as Chairman of the Audit Board until 24 May 2018.40 Serves as Chairman of the Audit Board as decided by the General Meeting on 24 May 2018, whereas from 20 April 2016 to that date he was a full member of the Audit Board.

2018 ANN
UAL R
EPO
RT
85
*03
32 Identification, as applicable, of the members of the Audit Board, the Audit Committee, the General and Supervisory Board or the Committee for Financial Affairs who are deemed independent, in accordance with Article 414.5 of the Companies Code; reference may be made to the item in the report where this information is contained in accordance with paragraph 18.
The members of the Audit Board,, José Manuel Oliveira Vitorino (Chairman) and Maria da Graça Torres Ferreira da Cunha Gonçalves are deemed independent by Semapa, in accordance with criteria laid down in Article 414.5 of the Companies Code. The former is currently in his second term and the latter in her first term in office.
Following the appointment of Gonçalo Nuno Palha Gaio Picão Caldeira by the Annual General Meeting on 24 May 2018 for a fourth term as member of the Audit Board, he became a non-independent member of this governing body, in accordance with Article 414 (5b) of the Portuguese Commercial Companies Code.
Miguel Camargo de Sousa Eiró, while serving as Chairman of the Audit Board, was deemed independent, in accordance with the provisions of the law.
33 Professional qualifications, as applicable, of each of the members of the Audit Board, the Audit Committee, the General and Supervisory Board or the Committee for Financial Affairs and other relevant biographical details; reference may be made to the item in the report where this information is contained in accordance with paragraph 21.
MIGUEL CAMARGO DE SOUSA EIRÓ
Miguel Eiró graduated in Law from Universidade de Lisboa in 1971. He joined the Portuguese Bar Association on 28 June 1973, and he was a member of its Lisbon District Committee between 1982/1984 and member of the General Committee between 1999/2002 and 2002/2004. He is an Intellectual Property Agent and attended a course in Mediation. He has been practising Law since his graduation in 1971, and is currently partner and director at Correia Moniz & Associados – Sociedade de Advogados, R.L. law firm. Between 1972 and 1975 Miguel Eiró performed military service in the Portuguese navy as a Law Expert. He was member of the Board of the Centre for Arbitrage of the Portuguese Bar Association between 1997/1999. In 2004 he was arbitrator at the Centre for Automobile Conflict Resolution and served as arbitrator in several more arbitration cases. Between 1975 and 1980 he was Director of Brisa – Auto Estradas de Portugal, S.A., and of other companies during his working life. He was member of the Audit Board of Semapa from 2006 to 2018 and of The Navigator Company from 2007 to 2018, serving as Chairman of these audit bodies since 2010 and 2011, respectively. He was also Chairman of the Audit Board of Secil from 2013 to 2018.
JOSÉ MANUEL OLIVEIRA VITORINO
José Manuel Vitorino has a degree in Corporate Organisation and Management by Instituto Superior de Economia of Lisbon University. He is a qualified Statutory Auditor and certified by the executive training programme of Universidade Nova de Lisboa. He was an Assistant Professor at the School of Economics of Coimbra University until 1980, after which he joined PricewaterhouseCoopers and performed functions in auditing and financial consultancy, in national and foreign companies and groups, and in projects by taking part in international teams. He had performed Partner duties for several years when he left PricewaterhouseCoopers in 2013, after reaching the default retirement age. He was the Chairman of the Audit Board of Novo Banco, S.A. until 2017 and currently is member of the Audit Board of ANA – Aeroportos de Portugal, S.A. He is a member of the Audit Board of The Navigator Company since 2015, and of Semapa and Secil since 2016, and became Chairman of these supervisory bodies in 2018.
GONÇALO NUNO PALHA GAIO PICÃO CALDEIRA
Gonçalo Picão Caldeira has a degree in Law and joined the Portuguese Bar Association in 1991, after completing a legal internship. He holds an MBA from Universidade Nova de Lisboa and attended a course in real estate management and evaluation from ISEG. Gonçalo Caldeira has performed management and property development functions in family-owned companies since 2004. He collaborated previously with BCP Group (1992-1998) and Sorel Group (October 1998 to March 2002). He also worked for Semapa from April 2002 to February 2004. He has been a member of the Audit Board of Semapa since 2006, and of The Navigator Company and Secil since 2007 and 2013, respectively.
2018
AN
NU
AL R
EPO
RT
86
*03
MARIA DA GRAÇA TORRES FERREIRA DA CUNHA GONÇALVES
Maria da Graça da Cunha Gonçalves holds a Degree in Business Organisation and Management from Instituto de Ciências do Trabalho e da Empresa (ISCTE), obtained in 1978. She is a qualified Statutory Auditor. She performed duties in General and Cost Accounting and Planning and Financial Analysis at Magnetic Peripherals Inc. Portugal (Control Data Corporation) until 1985, and Financial Analyst at Shell Portuguesa, S.A. from 1985 to 1989. She served as CFO, from 1989 to 1995 at United Distillers Comp. Velha, Lda. and at ITT Automotive Europe GmbH. She was Back Office Director at Pernod Ricard Portugal from 1995 to 2015. She is a member of the Audit Board of Semapa, The Navigator Company and Secil since 2018.
B) FUNCTIONING
34 Existence and place where the rules of procedure may be consulted for the Audit Board, the Audit Committee, the General and Supervisory Board or the Committee for Financial Affairs, as the case may be; reference may be made to the item in the report where this information is contained in accordance with paragraph 22.
The Audit Board has rules of procedure which are published on the company website (http://www.semapa.pt/sites/default/files/pdf_pb/rules_of_the_audit_board.pdf), where they may be consulted.
35 Number of meetings held and rate of attendance at meetings of the Audit Board, the Audit Committee, the General and Supervisory Board or the Committee for Financial Affairs, as the case may be; reference may be made to the item in the report where this information is contained in accordance with paragraph 23.
In the financial year 2018, the Audit Board met 20 times, with members present at all meetings (physical presence) for the period during which they performed duties..
36 Availability of each of the members of the Audit Board, the Audit Committee, the General and Supervisory Board or the Committee for Financial Affairs, as the case may be, indicating office held simultaneously in other companies, inside and outside the group, and other relevant activities carried on by the members of these bodies during the period; reference may be made to the item in the report where this information is contained in accordance with paragraph 26.
The members of the Audit Board have the appropriate time available to perform the duties entrusted to them.
Besides the activities mentioned under item 33, the members of the Audit Board perform the duties detailed below:
JOSÉ MANUEL OLIVEIRA VITORINO
OFFICE HELD IN OTHER COMPANIES BELONGING TO THE SAME GROUP AS SEMAPA: No office held in other companies belonging to the same group as Semapa
OFFICE HELD IN OTHER COMPANIES: ANA Aeroportos de Portugal, S.A. Member of the Audit Board SECIL – Companhia Geral de Cal e Cimento, S.A. Chairman of the Audit Board 41
THE NAVIGATOR COMPANY, S.A. Chairman of the Audit Board42
41 Became Chairman of the Audit Board of Secil on 18 June 2018. 42 Became Chairman of the Audit Board of The Navigator Company on 23 May 2018..

2018 ANN
UAL R
EPO
RT
87
*03
GONÇALO NUNO PALHA GAIO PICÃO CALDEIRA
OFFICE HELD IN OTHER COMPANIES BELONGING TO THE SAME GROUP AS SEMAPA: No office held in other companies belonging to the same group as Semapa
OFFICE HELD IN OTHER COMPANIES: LINHA DO HORIZONTE – Investimentos Imobiliários, Lda. Manager LOFTMANIA – Gestão Imobiliária, Lda. Manager SECIL – Companhia Geral de Cal e Cimento, S.A. Member of the Audit Board THE NAVIGATOR COMPANY, S.A. Member of the Audit Board
MARIA DA GRAÇA TORRES FERREIRA DA CUNHA GONÇALVES
OFFICE HELD IN OTHER COMPANIES BELONGING TO THE SAME GROUP AS SEMAPA: No office held in other companies belonging to the same group as Semapa
OFFICE HELD IN OTHER COMPANIES: SECIL – Companhia Geral de Cal e Cimento, S.A. Member of the Audit Board THE NAVIGATOR COMPANY, S.A. Member of the Audit Board
C) POWERS AND RESPONSIBILITIES
37 Description of the procedures and criteria applicable to the work of the supervisory body for the purposes of contracting additional services from the external auditor.
The Audit Board analyses the additional services and proposals submitted by the external auditor and the Statutory Auditor for provision of the same as transmitted to them by the directors, seeking to safeguard, essentially, that the independence and impartiality of the external auditor and the Statutory Auditor needed for the provision of audit services is not undermined and that the additional services are provided to a high standard of quality and independence.
Note that such analysis by the Audit Board is conducted following the rules laid down in the new Regulation of the Register of Auditors, as adopted by Law no. 140/2015 of 7 September, which entered into force on 1 January 2016, and the internal procedures established to guarantee that the new legal provisions are fulfilled.
38 Other duties of the supervisory bodies and, if applicable, of the Committee for Financial Affairs.
As stated above, the Audit Board has the duties established in law, in particular those stated in Article 420 of the Companies Code, as well as those indicated in the Rules of Procedure of the Audit Board, which are:
• To oversee the management of the Company, including, hereunder, annual assessment of compliance with the Company’s strategic plan and budget, risk management, the internal functioning of the Board of Directors and its committees, and the relation between Company bodies and committees;
• To ensure compliance with the law and the articles of association;• To check that books, accounting records and the respective supporting documents are in order;• To check, as and when it sees fit, the state of cash and inventories of any type of goods or valuables belonging to
the company or received by the same as security, deposit or on another basis;• To check the accuracy of financial reporting;• To check that the accounting policies and valuation criteria adopted by the Company lead to a correct valuation
of the company’s assets and profits or loss;• To draw up an annual report on its audit activities and to issue its opinion on the report, accounts and motions
submitted by the Directors;• To call the General Meeting, when the respective Chairman fails to do so;• Monitor, evaluate and decide on the strategic lines and the risk policy laid down by the Board of Directors;• To monitor the effectiveness of the risk management system, the internal control system and internal audit
system, if applicable, proposing any necessary adjustments; • To decide on the work plans and resources allocated to the internal audit services, including ensuring compli-
ance with the rules applicable to the Company and internal audit;• To receive reports of irregularities (whistleblowing) submitted by shareholders, Company employees or others;
2018
AN
NU
AL R
EPO
RT
88
*03
• To contract the provision of services by experts who assist one or more of its members in the exercise of their duties, which experts shall be contracted and remunerated in line with the importance of the matters entrusted to them and the economic situation of the company;
• To perform any other duties established in law or the articles of association;• To oversee the suitability of the financial information preparation and disclosure procedure by the Board of Di-
rectors, including the adequacy of the accounting policies, estimates, evaluations, relevant disclosure and the coherent implementation thereof from year to year, that shall be fully documented and communicated;
• To propose to the general meeting the appointment of the statutory auditor and its remuneration, highlighting the criteria on which the appointment of the statutory auditor was based and describing the auditor’s appoint-ment procedure it followed;
• To propose to the general meeting the dismissal of the statutory auditor or the termination of the service provi-sion agreement whenever justifiable grounds are present;
• To monitor and oversee the preparation and disclosure of the financial information and submit proposals or recommendations to ensure their integrity;
• To choose the statutory auditor to be submitted to the approval and election by the General Meeting and to pres-ent the grounds for such choice;
• To oversee the legal auditing of the individual and consolidated annual accounts, namely the implementation thereof, based on possible remarks and conclusions of the Securities Market Commission;
• To oversee the auditing of the Company’s financial statements and reports;• To confirm if the corporate governance’s structure and practices report disclosed includes the information listed
in the Article 245-A of the Portuguese Securities Market Code;• To monitor the independence of the Statutory Auditor, namely with regard to the provision of additional services,
and assess every year the work conducted by the Statutory Auditor and compliance with the tasks assigned to it;• To issue a previous and binding opinion on the Regulation of Conflicts of interests and related party transactions
to be written and adopted by the Board of Directors or, in the absence of such Regulation, a Board opinion on the type, scope and minimum amount, separate or aggregate, of related party transactions which (i) must be approved previously by the Board of Directors and (ii) the transactions that, involving higher amounts, are also subject to prior approval by the Audit Board;
• To issue prior opinion on all business with related parties submitted to its approval, including on those which, according to the terms in the end of the previous paragraph, require the Board’s prior approval.
It should be highlighted that the External Auditor and the Statutory Auditor are appointed according to the criteria and procedures set by the Audit Board, according to its internal regulation, as described above. The applicable criteria and the terms of the selection procedures are as decided by the Audit Board and according to each process arising, as was the case of the last selection process of the current External Auditor and Statutory Auditor of the company.
The Audit Board is also the prime point of contact with the External Auditor and the Statutory Auditor, with direct access to and knowledge of his work. The company believes that this direct supervision by the Audit Board is possible, without interference from the Board of Directors, in relation to the work carried on by the External Auditor and the Statutory Auditor, provided that it does not undermine a prompt and adequate information of the management body, which has ultimate responsibility for the company’s affairs and financial statements. Complying with this principle, the External Auditor and Statutory Auditor’s reports are addressed to the Audit Board and discussed at joint meetings of this board with a member of the Board of Directors, whom the Audit Board informs about the findings of the accounts audit, and the Audit Board ensures that the necessary conditions are in place in the Company for the provision of audit services. The Audit Board is further in charge of suggesting and monitoring, with the support of the Company’s internal services, the External Auditor and Statutory Auditor’s pay.

2018 ANN
UAL R
EPO
RT
89
*03
The Statutory Auditor also cooperates with the Audit Board to provide, immediately and in accordance with applicable legal and regulatory terms, information on irregularities relevant to the performance of the Audit Board’s duties that it has detected, as well as any difficulties arising from the performance of his duties.
Within the framework of the rules of procedure of the Audit Board, this body is in charge of looking into the appropriateness and approving the provision of other services and relevant terms, in addition to auditing services by the Statutory Auditor to the Company and other entities of the group of the Company, as laid down in the Regulation of the Register of Auditors, as adopted by Law no. 140/2015 of 7 September.
IV STATUTORY AUDITOR
39 Identification of the statutory audit firm and the partner and statutory auditor representing the same.
Statutory Auditor
FULL: KPMG & Associados-Sociedade de Revisores Oficiais de Contas, S.A. representada pelo Senhor Dr. Paulo Alexandre Martins Quintas Paixão (ROC)
ALTERNATE: Senhor Dr. Vitor Manuel da Cunha Ribeirinho (ROC)
40 Indication of the consecutive number of years for which the statutory audit firm has held office in the company and/or group.
KPMG & Associados - Sociedade de Revisores Oficiais de Contas, S.A. has held office with the company since 2018.
41 Description of other services provided by the statutory auditor to the company.
In addition to legal auditing services, KPMG & Associados - Sociedade de Revisores Oficiais de Contas, S.A. has provided the Company with other authorised services.
V. EXTERNAL AUDITOR
42 Identification of the external auditor appointed for the purposes of Article 8 and the partner and statutory auditor representing such firm in the discharge of these duties, together with their respective registration
number with the Securities Market Commission.
The company’s external auditor and its representative are indicated in item 39, and KPMG & Associados - Sociedade de Revisores Oficiais de Contas, S.A. is registered with the Securities Market Commission under number 20161489.
43 Indication of the consecutive number of years for which the external auditor and the respective partner and statutory auditor representing the same in the discharge of these duties has held office in the company and/or group.
The external auditor is the statutory auditor KPMG & Associados - Sociedade de Revisores Oficiais de Contas, S.A., represented by its partner Paulo Alexandre Martins Quintas Paixão (ROC), both having held office with the Company since 2018.
44 Policy on rotation of the external auditor and the respective partner and statutory auditor representing the same in the carrying out of these duties, and the respective frequency of rotation.
The Regulation of the Register of Auditors, as adopted by Law no. 140/2015 of 7 September, entered into force on 1 January 2016, and governs the new applicable laws that require the rotation of the auditors in companies of interest for society, like Semapa, while, previously, the company had no policy that required the rotation of the External Auditor, the Statutory Auditor or their representative.
2018
AN
NU
AL R
EPO
RT
90
*03
In compliance with the new legal framework, and considering that PricewaterhouseCoopers & Associados – SROC, Lda. reached the maximum time limit of its functions as statutory auditors, in 2017 the Audit Board carried out, with the support of the administrations and services of the Semapa group companies involved, the process of selection of the statutory auditors for the 2018-2021 term, which was open to several entities. The bids submitted were analysed and assessed by the Audit Board according to the criteria laid down in the selection process.
As a result of the selection process, the Audit Board recommended and put forward to the shareholders the selection of KPMG & Associados – Sociedade de Revisores Oficiais de Contas, S.A. as external auditor, and the proposal was adopted by the shareholders at the General Meeting.
45 Indication of the body responsible for assessing the external auditor and the intervals at which this assessment is conducted.
As part of its supervisory work and auditing of the Company’s accounts, the Audit Board assesses the external auditor and the Statutory Auditor on an ongoing basis, particularly under the preparation of its Report and Opinion on the annual accounts.
46 Identification of work, other than audit work, carried out by the external auditor for the company and/or companies in a controlling relationship with it, and indication of the internal procedures for approval of the contracting of these services and indication of the reasons for contracting them.
The services delivered by the external auditor and the Statutory Auditor other than audit work have always been approved by the Audit Board, in compliance with the applicable laws and internal procedures set up for this purpose.
These services consist essentially of support services to safeguard compliance with legal or contractual obligations laid down in the new legal framework provided by the new Regulation of the Register of Auditors in force in Portugal and abroad, and are approved by the Audit Board. The Board of Directors and the Audit Board consider that the occasional contracting of these services is justified by the External Auditor and Statutory Auditor’s accrued experience in the sectors in which the company operates and by the quality of their work, in addition to the careful definition of the scope of services required at the contracting stage, and to the fact that the Audit Board is supported by the analysis and internal opinions of the services.
In the framework of the provision of tax consultancy services and services other than auditing, our auditors have set strict internal rules to guarantee their independence, and these rules have been adopted in the provision of these services and monitored by the Company, in particular by the Audit Board and the Internal Control Committee.
47 Indication of the annual remuneration paid by the company and/or controlled, controlling or group entities to the auditor and other individuals or organizations belonging to the same network, specifying the percentage relating to the following services:
Services
CompanyGroup entities
(including the company itself)
Amount Percentage Amount Percentage
Value of auditing services 12,731.00 74% 235,701.00 87%
Value of reliability assurance services 4,500.00 26% 11,363.00 4%
Value of tax consultancy services - - - -
Value of other services other than auditing services - - 25,000.00 9%
Total: 17,231.00 100.00% 277,814.00 100.00%
NOTE: Amounts in Euros
In 2018, services other than audit services contracted by the Company or controlling entities from the External Auditor or the Statutory Auditor, including by entities belonging to the same corporate group or service network, represented 13% of the total services provided.

2018 ANN
UAL R
EPO
RT
91
*03
In addition to these amounts, the company or entities that maintained a controlling relationship with the former external auditor, PricewaterhouseCoopers, were invoiced 576,553.00 Euros, related to the 2017 financial year, regarding account auditing and auditing services.
C INTERNAL ORGANIZATION
I. ARTICLES OF ASSOCIATION
48 Rules applicable to amendment of the articles of association (Article 245-A.1 h)).
There are no specific rules at Semapa on the amendment of the Articles of Association, and the general supplementary rules contained in the Companies Code therefore apply here.
II. NOTIFICATION OF IRREGULARITIES (WHISTLEBLOWING)
49 Whistleblowing - procedures and policy
The company has a set of Regulations on Notification of Irregularities, which govern the Company’s procedures that employees can use to report irregularities allegedly taking place within the Company.
These regulations lay down the general duty to report alleged irregularities, requiring that such reports are made to the Audit Board, and also provide for an alternative solution in the event of conflicts of interests on the part of the Audit Board regarding to the report in question.
The Audit Board, which may be assisted for these purposes by the Control and Risk Committee, shall investigate all facts necessary for assessment of the alleged irregularity. We further note that, in the event of conflict of interest regarding an irregularity committed by a member of the Audit Board, a copy of the Report must also be sent to the Chairman of the Board of Directors.
This process ends with the report being filed or submitted to the Board of Directors or the Executive Board, depending on whether a Company officer is implicated or not, a proposal for application of the measures most appropriate in light of the irregularity in question.
The regulations also contain other provisions designed to safeguard the confidentiality of the disclosure and non-prejudicial treatment of the employee reporting the irregularity, as well as rules on providing information on the regulations throughout the Company.
The internal regulations of the company’s bodies and committees also provide for the adoption and compliance with that regulation.
Access to the Regulations on Notification of Irregularities is reserved.
The Company also has a set of Principles of Professional Conduct, approved by the Board of Directors on 30 December 2002. This document establishes ethical principles and rules applicable to Company staff and officers.
In particular, this document establishes the duty of diligence, requiring professionalism, zeal and responsibility, the duty of loyalty, which in relation to the principles of honesty and integrity is especially geared to safeguard conflict of interest situations, and the duty of confidentiality, in relation to the treatment of relevant information.
The document also establishes duties of corporate social responsibility, namely of environmental conservation and protection of all shareholders, ensuring that information is fairly disclosed, and all shareholders treated equally and fairly.
The Ethical Principles were changed in late 2018 to include expressly the commitment to respect and promote the Human Rights, and combat money laundering and corruption.

2018
AN
NU
AL R
EPO
RT
92
*03
With the entering into force of Law no. 73/2017, of 16 August, amending Article 127 of the Labour Code, which set forth the employer’s duty to adopt good conduct codes to prevent and combat sexual harassment at work in companies with seven or more employees, on 1 October 2017 Semapa adopted a Good Conduct Code that contains specific rules aimed at reinforcing the prevention and combat against any type of harassment at work, without prejudice to any other regulations applicable.
III. INTERNAL CONTROL AND RISK MANAGEMENT
50 People, bodies or committees responsible for internal audits and/or implementation of internal control systems.
Although the Company has no specific independent structure for internal audits, the internal control and risk management are conducted by the Board of Directors and through an organisational unit with special responsibilities in this area - the CRC -, the Audit Board and the External and Statutory Auditors being responsible for oversight and monitoring, including of the efficiency of these systems. These bodies and the CRC shall also identify and propose all necessary changes. The Audit Board has the knowledge and the chance to deliver an opinion on the activities performed by the Control and Risk Committee and Semapa’s departments in this framework, on the resources allocated to the departments that also perform compliance duties, and is the recipient, where available, of the reports and opinions made by these services when they concern matters related to financial reporting, identification or resolution of conflicts of interest and detection of potential illegalities and irregularities.
Additionally, the corporate universe represented by most of the group’s workers, and which concerns the holding’s main subsidiaries, The Navigator Company and Secil, is covered by separate auditing systems with organisational units having special auditing responsibilities. The company thus considers that these risk management systems and of internal control, implemented by the bodies and Committee mentioned before, are suitable for the company’s specificities and size and the complexity of the risks from its activity.
Thus, the decision not to have a special department in this area is due to Semapa’s simplified administrative structure as a holding company and the way risk control is carried out in the company’s group.
51 Description of the lines of command in this area in relation to other bodies or committees; an organizational chart may be used to provide this information
The lines of command are shown in the organisational chart in item 21 of this Report, and the responsibilities of the bodies and committees involved are better described in item 54.
52 Existence of other departments with responsibilities in the field of risk control.
Non-existence of other departments with responsibilities in the field of risk control.
53 Identification of the main risks (economic, financial and legal) to which the company is exposed in the course of its business.
Chapter 2 of the notes to the consolidated financial statements provides a detailed analysis of all legal, financial and operational risks, including foreign exchange risk, interest rate risk, credit risk, liquidity risk, price risk, raw material supplies risk, sales price risk, risk of product demand, risk of competition, risk of environmental legislation, human resources risk, energy cost risk and economic and market risks in general.
54 Description of the process of identification, assessment, monitoring, control and risk management.
The main purpose of the Control and Risk Committee (CGC) is to detect and control all relevant risks in the Company’s affairs, in particular financial and legal risks, and the Committee is vested with the powers set out in items 21 and 29 of this Report.

2018 ANN
UAL R
EPO
RT
93
*03
In addition to the important role played by the Audit Board in this field, internal procedures for risk control are also particularly important in each of the Company’s main subsidiaries. The nature of the risks and the degree of exposure vary from company to company, and each subsidiary therefore has its own independent system for controlling the risks which it is subject to.
The external audit to Semapa and the companies controlled by it was conducted by KPMG & Associados - Sociedade de Revisores Oficiais de Contas, S.A. until the end of the year 2018. The company’s External and Statutory Auditor checks, in particular, the application of remuneration policies and systems, and the effectiveness and workings of internal control procedures through the information and documents provided by the Company, and in particular by the Remuneration Committee and the CRC. The respective conclusions are reported by the External and Statutory Auditor to the Audit Board, which then reports the shortcomings detected, if any.
The implemented internal control and risk management systems have proven to be effective, and no situations have so far arisen which have not been anticipated, duly guarded against or expressly accepted in advance as controlled risks. As stated above, in addition to its own powers in this field and in order to safeguard against the acceptance of excessive risks by the Company, the Board of Directors created the CRC which, in accordance with the responsibilities defined by the Board of Directors, is responsible for assuring internal control and risk management. The Audit Board is responsible for overseeing the effectiveness of the risk management system and the internal control system, proposing adjustments to the existing system whenever necessary, and being the CRC responsible for implementing these adjustments. Finally, it should be noted that these systems are monitored and overseen at all times by the Board of Directors, which has ultimate responsibility for the Company’s internal activities.
The company approved strategic guidelines at a meeting of the Board of Directors held in early 2018, and in the last quarter of 2018 it deeply revised the company’s risk policy, with the direct involvement of the executive board and of the financial and accounting departments, the Control and Risk Committee, the relevant departments of the company’s main subsidiaries and external consultants hired. This work has been completed and was approved by the Board of Directors in 2019.
The Audit Board, which plays a particularly important role in this field, with all the powers and responsibilities assigned to it directly by law and by the Rules of Procedure of the Audit Board, looked into, assessed and gave its opinion on these strategic guidelines and the risk policy, the latter in 2019. In this context, the Audit Board, in conjunction with the CRC and the administration services, is implementing periodic, in house, control mechanisms and procedures to ensure that the real risks of the company are consistent with the objectives set by the Board, since some of these procedures already exist in the company, such as regular meetings with other governing bodies and committees with competence in this matter and requesting tests whenever necessary and appropriate.
55 Main elements of the internal control and risk management systems implemented in the company with regard to the process of disclosure of financial information (Article 245-A.1 m)).
The disclosure of financial information is the responsibility of the market relations officer and, where applicable, it falls to the Audit Board, the Internal Control Committee and the External and Statutory Auditor to assess the quality, reliability and completeness of the financial information approved by the Company’s Board of Directors and drawn up by the Financial and Accounts and Tax departments.
The process of preparing financial information is subject to an internal control system and to rules, which are designed to assure that the accounting policies adopted by the company are properly and consistently applied and that the estimates and judgements used in preparing this information are reasonable.
With regard to internal control procedures for the process of disclosing financial information, the Company has implemented rules, which are intended to assure that disclosures are made in good time and to mitigate the risk of unevenness in the information provided to the market.

2018
AN
NU
AL R
EPO
RT
94
*03
IV. INVESTOR SUPPORT
56 Office responsible for investor support, composition, functions, information provided and contact details
The investor support service is provided by an office reporting to the Financial Director of the Company, Susana Coutinho. This office is adequately staffed and enjoys swift access to all bodies, committees and departments of the Company, and where necessary and according to the procedures laid down and the limits provided by law, of the Group’s companies, in order to ensure an effective response to requests, and also to produce, process and transmit relevant information to shareholders, investors and other stakeholders, as well as to financial analysts and to the market in general, in due time and without any inequality, pursuant to applicable legal and regulatory terms.
Susana Coutinho can be contacted through the email address [email protected] or on the company’s general telephone numbers (+351 21 318 47 00). All public information regarding the company can be accessed by these means. It should be noted, in any case, that the information most frequently requested by investors is available at the Company’s website at www.semapa.pt/en/home, and it generally concerns information about the Semapa group, the Company’s business, corporate governance and financial information.
57 Market relations officer.
The market relations officer is Susana Coutinho.
58 Information on the number of enquiries received in the period or pending from previous periods, and enquiry response times.
Semapa receives various types of enquiries, which are normally answered within 24 hours of receipt, although some enquiries, because of their breadth, scope or complexity, necessarily take longer to process. There are also specific times of the year when Semapa receives more enquiries, in particular in the run-up to General Meetings and the payment of dividends, when response times may sometimes be longer. There are no enquiries pending from previous
years.
V. WEBSITE (59 TO 65)
Description Internet address
59 Semapa Website http://www.semapa.pt/en/home
60 Address where information is provided on the company’s name, public company status, registered office and other data required by Article 171 of the Companies Code.
http://www.semapa.pt/en/location
61 Address where the articles of association and rules of procedures of company boards and/or committees can be consulted.
http://www.semapa.pt/sites/default/files/pdf_pb/articles_of_association.pdfhttp://www.semapa.pt/en/rules-corporate-members
62 Address where information is provided on the identity of company officers, market relations officer, the Investor Support Office or equivalent structure, respective powers and responsibilities and contact details.
http://www.semapa.pt/en/company-officershttp://www.semapa.pt/en/investor-support-office

2018 ANN
UAL R
EPO
RT
95
*03
Description Internet address
63 Address for consultation of financial statements and reports, which must be accessible for no less than five years, together with the six-monthly corporate diary, disclosed at the start of each semester, including, amongst other things, General Meetings, disclosure of annual, half-yearly and, if applicable, quarterly accounts.
http://www.semapa.pt/en/demonstracoes-financeirashttp://www.semapa.pt/en/eventos
64 Address where notice of general meetings is posted, together with all preparatory information and subsequent information related to meetings.
http://www.semapa.pt/en/general-meeting-may-24-2018
65 Address for consultation of historical archives, with resolutions adopted at the company’s General Meetings, the share capital represented and the results of votes, for the past three years.
http://www.semapa.pt/en/ag-arquivo
D REMUNERATION
I. POWERS TO DETERMINE REMUNERATION
66 Indication of powers to set the remuneration of company officers, members of the executive board or managing director and the company managers.
Powers to determine the remuneration of the Board of Directors and the Audit Board lie with the Remuneration Committee.
Powers to determine the remuneration of company managers lie with the Board of Directors.
II. THE REMUNERATION COMMITTEE
67 Composition of the remuneration committee, including identification of individuals or organizations contracted to provide support, and declaration regarding the independence of each member and adviser.
The Remuneration Committee comprises José Gonçalo Ferreira Maury, Frederico José da Cunha Mendonça e Meneses and João Rodrigo Appleton Moreira Rato and does not subcontract auxiliary staff. The company may decide freely to hire the services it deems necessary or appropriate, within budget parameters, a right that has been exercised in the past, in which case it must ensure that the services are provided independently and that the respective providers do not provide other services to the company, or to others in controlling or group relationship, without the express authorization of the committee.
The company considers the Remuneration Committee to be independent of the Board, since all of its members are independent, although the Securities Market Commission, according to its recommendation in the Corporate Governance Code of the Portuguese Securities Market Commission, has a different understanding in relation to Frederico da Cunha. With regards to this member, the following needs to be said:
First, he is linked to Semapa due to the fact that until 2005 he was non-executive Director for the Company and currently earns a retirement pension as a result of the duties performed. However, Semapa considers that, since non-executive duties were performed, by virtue of the elapsed time and the right to a pension being an acquired right, independent from the will of Semapa’s directors, the impartiality of analysis and decision is not impaired. Secondly, he exercised administrative duties from June 2013 to May 2014 in Sodim, a company to which approximately 72% of the non-suspended voting rights of Semapa are now allocated, according to item 7 above. The Company considers that this does not affect his unbiased analysis and decision. In effect, and considering that what is at stake here is the independence from the executive members of the Board of Directors, Semapa considers that this committee member exercises his duties in the Remuneration Committee independently.

2018
AN
NU
AL R
EPO
RT
96
*03
José Maury resigned in 2014 from office at Egon Zehnder, an HR services company which over the years supported Semapa and other related companies in procurement procedures. The aforementioned resignation in our view has not undermined the independence of this member of the Committee.
The Remuneration Committee provides all information or clarifications to the shareholders of the company in the respective Annual General Meetings or in any other general meeting if its agenda includes a matter related to the remuneration of the members of the corporate bodies and committees or if the shareholders require its presence, through the presence of at least one of its members. That was the case at the annual General Meeting of 24 May 2018, which was attended by all members.
68 Expertise and experience of the members of the remuneration committee in the field of remuneration policy.
One of the members of the Remuneration Committee, José Maury, has vast knowledge and experience in matters of remuneration policy and he was a partner of the company Egon Zehnder for a number of years, which is a leading recruitment company, involving thorough knowledge of assessment procedures and criteria and related remuneration packages.
III. REMUNERATION STRUCTURE
69 Description of the remuneration policy for members of the management and supervisory bodies as referred to in Article 2 of Law no. 28/2009, of 19 June.
The remuneration policy for members of the management and supervisory bodies is set out in the Remuneration Policy Statement issued by the Remuneration Committee, approved at the beginning of each term and confirmed annually, corresponding to Annex II of this Report, and there is no deviation from the procedures for the application of the approved remuneration policy.
70 Information on how remuneration is structured in order to align the interests of members of the management body with the long term interests of the company, and on how it is based on performance assessment and discourages excessive risk-taking.
The way in which remuneration is structured and how it is based on the directors’ performance follows clearly the Remuneration Policy Statement of the Remuneration Committee, specifically items 1 and 6 of chapter VI, to which we make reference.
Following such principles, to determine precisely the variable remuneration component, a set of KPIs are applied, for which EBITDA, net earnings and cash flow are the quantitative elements considered, as mentioned in item 25 above.
The effect of the alignment of the interests in the long-term results, to some extent, from the fact that one of the KPIs of EBITDA is linked to the medium term plan, albeit in a form that is more limited than that arising from Semapa’s de facto situation in relation to the significant stability of the Executive Board’s members. Such stability is naturally linked to longer time lines, including in the wage component, as future results influence future remunerations for which expectations exist.
The same is true for excessive risk-taking. The company has no separate remuneration mechanism aimed specifically at that. Risk is an intrinsic characteristic of any act of management and, as such, it is unavoidably and continuously considered in all management decisions. A quantitative or qualitative assessment of risk as good or bad cannot be made autonomously, but only in the light of its impact on Company’s performance over the time. It is thus confused with long-term interests, and consequently benefits from the aforementioned incentives to overall alignment over time.

2018 ANN
UAL R
EPO
RT
97
*03
71 Reference, if applicable to the existence of a variable remuneration component and information on any impact on this from performance assessments.
The remuneration of executive directors includes a variable component, which depends on a performance assessment, as described in the Remuneration Policy Statement, in particular in item 2 of chapter VI.
The performance assessment under the variable remuneration, in its individual and qualitative component, accounts for approximately 50% of that remuneration component. In the case of non-executive directors, it should be noted that although it is only a fixed part, it can be differentiated according to the accumulation of increased responsibilities.
There are no upper limits to remuneration, notwithstanding the limit set by the articles of association on directors’ participation in the profits for the year and no mechanism is in place to allow the company to request the reimbursement of variable remuneration paid.
The remuneration of the members of the Audit Board includes no variable component.
72 Deferred payment of the variable component of remuneration, indicating the deferral period.
Payment of the variable component of remuneration is not deferred at Semapa, notwithstanding the existence of a specific indicator - one of the components of EBITDA is not measured in relation to the exercise, rather than a theoretical EBITDA determined by reference to the medium-term plan - which assesses sustainable performance in the medium term.
73 Criteria applied in allocating variable remuneration in shares and on the continued holding by executive directors of these shares, on any contracts concluded with regard to these shares, specifically hedging or transferring risk, the respective limits and the respective proportion represented of total annual remuneration.
At Semapa, the variable remuneration has no component consisting of shares.
74 Criteria applied in allocating variable remuneration on options and indication of the deferral period and the price for exercising options.
At Semapa, the variable remuneration has no component consisting of options.
75 Main parameters and grounds for any annual bonus system and any other non-cash benefits.
The criteria for setting annual bonuses are those related to the variable remuneration, as described in item 2 of chapter VI of the Remuneration Policy Statement, and in item 25 above, and no other non-cash benefits are allocated.
76 Main features of complementary or early retirement schemes for directors and the date of approval by the General Meeting, on an individual basis.
There are no complementary or early retirement schemes for directors currently in place in the company. Nevertheless, Frederico José da Cunha Mendonça e Meneses receives a monthly pension, because he exercised an option under the expiry of a past pension scheme for directors.
At present, this is the only pension which Semapa pays. It is a lifetime monthly pension paid 12 months per year, for which the following is provided: (i) the transferability of half of its value to the surviving spouse or minor or disabled children and (ii) mandatory deduction from this pension either the value of remunerated services later delivered to Semapa or controlled companies, or the value of pensions that the beneficiary is entitled to receive from the national Social Insurance scheme related to the same period of service. Semapa’s liability with this pension is as mentioned in Note 29 to the Consolidated Financial Statements and Note 26 to the Individual Financial Statements.

2018
AN
NU
AL R
EPO
RT
98
*03
IV. DISCLOSURE OF REMUNERATION
77 Indication of the annual remuneration earned from the company, on an aggregate and individual basis, by the members of the company’s management body, including fixed and variable remuneration and, in relation to the latter, reference to the different components.
Below we indicate the remuneration earned in 2018, paid by Semapa to the members of the Company’s management body, distinguishing between fixed and variable remuneration, though the variable remuneration was paid in 2018 but refers to the performance of 2017, but without a breakdown of the different components of the latter, insofar as it is set as a whole, taking into account the factors described in the Remuneration Policy Statement issued by the Remuneration Committee, without identifying components.
Board of Directors
Remuneration Fixed Remuneration Variable
AmountRelative
percentage AmountRelative
percentage
António Pedro de Carvalho Viana-Baptista 128,305.13 100% - -
Carlos Eduardo Coelho Alves 77,825.00 100% - -
Filipa Mendes de Almeida de Queiroz Pereira 47,466.66 100% - -
Francisco José de Melo e Castro Guedes 77,825.00 100% - -
João Nuno de Sottomayor Pinto de Castello Branco 761,199.25 53.47% 662,411.00 46.53%
José Miguel Pereira Gens Paredes 315,969.50 35.89% 564,464.00 64.11%
José Antônio do Prado Fay 78,259.58 100% - -
Lua Mónica Mendes de Almeida de Queiroz Pereira 47,466.66 100% - -
Mafalda Mendes de Almeida de Queiroz Pereira 47.466.66 100% - -
Manuel Custódio de Oliveira 45,337.50 100% - -
Paulo Miguel Garcês Ventura 315,969.50 36.84% 541,667.00 63.16%
Pedro Mendonça de Queiroz Pereira 344.576.14 27.19% 922,866.00 72.81%
Ricardo Miguel dos Santos Pacheco Pires 295,381.25 35.55% 535,403.00 64.45%
Vítor Manuel Galvão Rocha Novais Gonçalves 77,825.00 100% - -
Vítor Paulo Paranhos Pereira 128,305.13 100% - -
TOTAL 2,789,177.96 - 3,226,811.00 -
NOTE: Amounts in Euros
This information already appears in the proposal for the Remuneration Policy Statement of the Remuneration Committee to be presented at the Annual General Meeting of the company to be held this year.
78 Amounts paid on any basis by other controlled, controlling or group companies or companies under common control.
It should be clarified that the amounts referred to in this item do not relate only to companies controlled by Semapa. They also include amounts over which Semapa and its officers have no control, as they are the concern of its shareholders, the shareholders of shareholders and other companies controlled by shareholders, where a controlling relationship is involved.
The following directors earned remunerations in other controlling companies or companies under common control: Pedro Mendonça de Queiroz Pereira (3,343,997.10 Euros), Francisco José de Melo e Castro Guedes (80,828.80 Euros), Vítor Manuel Galvão Rocha Novais Gonçalves (98,000.00 Euros), Vítor Paulo Paranhos Pereira (174,900.00 Euros), Filipa Mendes de Almeida de Queiroz Pereira (70,750.00 Euros), Mafalda Mendes de Almeida de Queiroz Pereira (70,750.00 Euros) and Lua Mónica Mendes de Almeida de Queiroz Pereira (70,750.00 Euros). It should be noted that the members of the Board of Directors did not receive remuneration in other companies in a group relationship, and this information is already included in the proposal for a Remuneration Policy Statement of the Remuneration Committee to be presented at the Annual General Meeting of the company to be held this year.

2018 ANN
UAL R
EPO
RT
99
*03
79 Remuneration paid in the form of profit sharing and/or payment of bonuses, and the grounds on which these bonuses and/or profit sharing were granted.
The amount of the remuneration paid by Semapa in the form of profit-sharing and/or payment of bonuses corresponds to the variable remuneration referred to in item 77 of this report, which amounts were determined by the Remuneration Committee based on the actual application of the criteria described in item 2 of chapter VI of the Remuneration Policy Statement.
80 Compensation paid or owing to former executive directors in relation to termination of their directorships during the period.
No compensation was paid or is due to former executive directors for termination of their directorships.
81 Indication of the annual remuneration earned, on an aggregate and individual basis, by the members of the company’s supervisory body, for the purposes of Law 28/2009, of 19 June.
Audit Board
Remuneration Fixed Remuneration Variable
AmountRelative
percentage AmountRelative
percentage
José Manuel Oliveira Vitorino 20,303.88 100% - -
Miguel Camargo de Sousa Eiró 13,369,21 100% - -
Gonçalo Nuno Palha Gaio Picão Caldeira 15,999.97 100% - -
Maria da Graça Torres Ferreira da Cunha 9,758.63 100% - -
TOTAL 59,431.69 - -
NOTE: Amounts in Euro
The table before specifies the annual amount paid to the members of the Audit Board during the performance of their duties.
This information already appears in the proposal for the Remuneration Policy Statement of the Remuneration Committee to be presented at the Annual General Meeting of the company to be held this year.
82 Indication of remuneration earned in the reporting period by the Chairman of the General Meeting.
In 2018, the Chairman of the General Meeting earned a fixed remuneration of 3,000 euros.
This information already appears in the proposal for the Remuneration Policy Statement of the Remuneration Committee to be presented at the Annual General Meeting of the company to be held this year.
V. AGREEMENTS WITH REMUNERATION IMPLICATIONS
83 Contractual limits for compensation payable for the unfair dismissal of directors and the respective relationship with the variable remuneration component;
Semapa has no contract with directors limiting or otherwise altering the supplementary legal rules on fair or unfair termination. Dismissal before the expiry of the mandate does not entitle the director, either directly or indirectly, to compensation beyond the statutory amounts.

2018
AN
NU
AL R
EPO
RT
100
*03
84 Reference to the existence and description of agreements between the company and directors or managers, as defined by article 248-B.3 of the Securities Code, which provide for compensation in the event of resignation, dismissal without due cause or termination of employment contract as a result of a change of control of the company, indicating the amounts involved (article 245.-A.1 l)).
There are also no agreements between the company and the company officers or managers providing for compensation in the event of resignation, unfair dismissal or redundancy as the result of a takeover.
VI. STOCK OR STOCK OPTION PLANS
85 Identification of plan and beneficiaries.
The company has no stock or stock option plans.
86 Description of plan (terms of allocation, non-transfer of share clauses, criteria on the price of shares and the price of exercising options, the period during which the options may be exercised, the characteristics of the shares to be distributed, the existence of incentives to purchase shares and/or exercise options)
Not applicable.
87 Stock option rights allocated to company employees and staff.
Not applicable.
88 Control mechanisms in an employee ownership scheme insofar as voting rights are not directly exercised by employees (Article 245-A.1 e)).
There is no employee ownership scheme in Semapa.
E RELATED PARTY TRANSACTIONS CONFLICTS OF INTEREST
I CONTROL MECHANISMS AND PROCEDURES
89 Procedures implemented by the company for controlling related party transactions (reference is made for this purpose to the concept deriving from IAS 24) and Conflicts of Interest.
On 31 October 2018, the company adopted, with the favourable opinion of the Audit Board, a Regulation of Conflicts of interests and related party transactions, which establishes the rules that govern conflicts of interest and related party transactions to which the company is a party, in addition to the internal mechanisms that the Company has in place to ensure compliance with the international accounting standard (IAS) 24 (Related Party Disclosures). It is applicable without prejudice to the Company’s obligations and of its Directors, concerning Inside Information, the legal framework of company business with executive directors and the internal Regulation on the Reporting of Irregularities and other relevant legislation.
This regulation is available on the company’s website.

2018 ANN
UAL R
EPO
RT
101
*03
According to the Regulation on Conflicts of interests and related party transactions, the transactions between the company and related parties, qualified as such in accordance with the IAS 24 international accounting standards, are subject to the following approval procedures:
Significant Transactions are Related Party Transactions which:
a) a Are carried out with companies controlled by the Company and that have consolidated accounts with the latter that (i) individually amount to 1% or more of the consolidated turnover of the last consolidated accounts of the Company adopted by the shareholders or (ii) amounting, in relation to the same related party and the same fiscal year, to a total amount equal to or above double the amount resulting from the application of the criterion mentioned above;
b) Are carried out with entities outside of the Group of companies mentioned in the previous paragraph, with amounts that individually or in accumulated terms are equal to or more than one fifth of the amounts mentioned in the previous paragraph.
All other Related party transactions which are not mentioned in the previous paragraphs are considered Transactions that are not significant, so transactions with Related Parties may be carried out only in full respect of the justified interest of the Company.
Significant Transactions must be approved by the Board of Directors, subject to the prior approval of the Audit Board. Non-significant Transactions are not subject to the approval of the Audit Board and are approved by the Board of Directors or the Executive Committee if their amounts do not exceed two hundred and fifty thousand euros, individually or in accumulated terms.
The Board of Directors and the Audit Board must be informed every six months of the decisions concerning related party transactions in which they were not a party to. The Directors of the Company who take part in the conclusion of related party transactions must ensure that the transactions are submitted to the approvals provided in the regulation. The Executive Board is responsible for overseeing the formalisation and the implementation of decisions concerning Related Party Transactions.
Until the date of approval of said regulation, on 31 October 2018, the rules and criteria which, in the last corporate governance reports were described in item 91 below, were applicable to the business with holders of qualifying holdings, namely the following procedures:
The Board of Directors was required to subject to review and prior opinion of the Audit Board the transactions between the company and qualifying shareholders or entities in any way related to these shareholders, as defined in Article 20 of the Securities Code, whenever one of the following criteria was met with regard to each period:
a) When such transactions had a value greater than or equal to 1% of the company’s consolidated turnover in the previous year;
b) When the accrued value, with regard to the same qualifying shareholder, or entity related to the same in any way, as defined in Article 20 of the Securities Code, was greater than or equal to double the amount resulting from application of the criteria referred to in the preceding sub-paragraph.
Concerning the procedures applicable to conflicts of interest, the regulation provides for a conflict situation where the decision-maker or someone taking part in a decision (Director) is in a position that, in objective terms, may compromise his independence and influence in his judgement interests distinct from the Company’s interests, either financial or other, own or other, and for the appropriate prevention, identification and resolution, the Director must:
a) Report the existence of, real or potential, conflict of interest to their superiors, or, in the case of a member of a collegial body, to the body in question in the terms of the relevant rules of procedure; and
2018
AN
NU
AL R
EPO
RT
102
*03
b) Refrain from interfering or participating in a decision whenever there is a situation of conflict of interest, and have noted such impediment in the minutes or other written document where the decision is laid down, without prejudice to the duty to provide all information and clarification which the relevant company body and its mem-bers may request.
Furthermore, all rules of procedures of the governing bodies and internal committees include provisions on conflicts of interest aligned with the rules described before.
This is considered a major alteration compared with procedures previously applied to related party transactions, with the extension of the transactions covered and of the intervention of the company bodies with competence in this matter, and the approval of a new framework to provide control over emerging conflicts of interest between members of the governing bodies and their committees and the company.
90 Indication of transactions subject to control during reporting period
By 31 October 2018, there had been no transactions subject to control, pursuant to the criteria referred to in item 89 above and applicable up to that date, namely the company and qualifying shareholders, or entities in any way related to such shareholders, had not conducted any business which, under the terms of Art. 20 of the Securities Code, required prior approval of the Audit Board according to the rules defined and in force in that period.
After that date there were related party transactions that have been identified in the information on related party transactions in Note 35 of the Annex to the consolidated accounts and Note 25 of the Annex to the individual financial statements, which were analysed and approved in line with the new Regulation on Conflicts of interests and related party transactions, there being no transactions that required prior approval of the Audit Board. The Board of Directors informed the Audit Board about the approval of related party transactions made in the context of that regulation.
We also inform that in the second half of last year, Semapa’s subsidiary, Semapa Next, S.A., subscribed shares, resulting in total shareholding of twelve million dollars in the company “Alter Venture Partners Fund I”. Whereas the director António Viana-Baptista is an executive member of that company and took part in the presentation of this investment, it was decided that, regardless of the legal duty, this transaction should be approved by the Board of Directors and receive the approval of the Audit Board, hereby fulfilling all requirements laid down in Article 397 (2) of the Companies Code, as was the case.
91 Description of the procedures and criteria applicable to intervention by the supervisory body for the purposes of prior assessment of transactions to be carried out between the company and qualifying shareholders or related entities, under Article 20 of the Securities Code.
The procedures and criteria are as described in items 89 to 90 before.
II DETAILS OF TRANSACTIONS
92 Indication of the place in the financial reports and account where information is available on related party transactions, in accordance with IAS 24, or, alternatively, reproduction of this information.
Information on related party transactions is contained in Note 35 of the Annex to the consolidated financial statements and Note 25 of the Annex to the individual financial statements.
2018 ANN
UAL R
EPO
RT
103
*03
PART II ASSESSMENT OF CORPORATE GOVERNANCE
1 IDENTIFICATION OF THE CORPORATE GOVERNANCE CODE ADOPTED
Semapa adopted the Corporate Governance Code of the Portuguese Corporate Governance Institute (IPCG) taking into account the repeal of the Corporate Governance Code of the Portuguese Securities Market Commission (CMVM Regulation no. 4/2013), which Semapa had been following since 2010.
The Code adopted is disclosed by the IPCG and may be consulted on the website.
2 ANALYSIS OF COMPLIANCE WITH THE ADOPTED CORPORATE
The following table indicates the recommendations adopted and not adopted. For the recommendations adopted, we indicate only the place in the report where detailed information is contained. For recommendations not adopted, information is provided below the table on the respective grounds for non-adoption and any alternative measures taken.
# Adoption Text Reference
I. GENERAL PROVISIONS
General PrincipleCorporate Governance should promote and enhance the performance of companies, as well as of the capital markets, and strengthen the trust of investors, employees and the general public in the quality and transparency of management and supervision, as well as in the sustained development of the companies.
I.1 Company’s relationship with investors and disclosure
Principle:Companies, in particular its directors, should treat shareholders and other investors equitably, namely by ensuring mechanisms and procedures are in place for the suitable management and disclosure of information.
I.1.1 Adopted The Company should establish mechanisms to ensure, in a suitable and rigorous form, the production, management and timely disclosure of information to its governing bodies, shareholders, investors and other stakeholders, financial analysts, and to the markets in general.
Part I, item 21
I.2 Diversity in the composition and functioning of the company’s governing bodies
Principle:I.2.A - Companies ensure diversity in the composition of its governing bodies, and the adoption of requirements based on individual merit, in the appointment procedures that are exclusively within the powers of the shareholders.I.2.B - Companies should be provided with clear and transparent decision structures and ensure a maximum effectiveness of the functioning of their governing bodies and commissions.
I.2.1 Not adopted Companies should establish standards and requirements regarding the profile of new members of their governing bodies, which are suitable according to the roles to be carried out. Besides individual attributes (such as competence, independence, integrity, availability, and experience), these profiles should take into consideration general diversity requirements, with particular attention to gender diversity, which may contribute to a better performance of the governing body and to the balance of its composition.
Explanation of recommendations not adopted below
I.2.2 Adopted The company’s managing and supervisory boards, as well as their committees, should have internal regulations — namely regulating the performance of their duties, their Chairmanship, periodicity of meetings, their functioning and the duties of their members —, and detailed minutes of the meetings of each of these bodies should be carried out.
Part I, items 21, 22, 27 and 34
I.2.3 Adopted The internal regulations of the governing bodies — the managing body, the supervisory body and their respective committees — should be disclosed, in full, on the company’s website.
Part I, items 22, 34 and 61
I.2.4 Adopted The composition, the number of annual meetings of the managing and supervisory bodies, as well as of their committees, should be disclosed on the company’s website.
Part I, items 23, 29 and 35

2018
AN
NU
AL R
EPO
RT
104
*03
# Adoption Text Reference
I.2.5 Adopted The company’s internal regulations should provide for the existence and ensure the functioning of mechanisms to detect and prevent irregularities, as well as the adoption of a policy for the communication of irregularities (whistleblowing) that guarantees the suitable means of communication and treatment of those irregularities, but safeguarding the confidentiality of the information transmitted and the identity of its provider, whenever such confidentiality requested.
Part I, item 49
I.3 Relationships between the company bodies
Principle:Members of the company’s boards, especially directors, should create, considering the duties of each of the boards, the appropriate conditions to ensure balanced and efficient measures to allow for the different governing bodies of the company to act in a harmonious and coordinated way, in possession of the suitable amount of information in order to carry out their respective duties.
I.3.1 Adopted The bylaws, or other equivalent means adopted by the company, should establish mechanisms that, within the limits of applicable laws, permanently ensure the members of the managing and supervisory boards are provided with access to all the information and company’s collaborators, in order to appraise the performance, current situation and perspectives for further developments of the company, namely including minutes, documents supporting decisions that have been taken, calls for meetings, and the archive of the meetings of the managing board, without impairing the access to any other documents or people that may be requested for information.
Part I, item 21
I.3.2 Adopted Each of the company’s boards and committees should ensure the timely and suitable flow of information, especially regarding the respective calls for meetings and minutes, necessary for the exercise of the competences, determined by law and the bylaws, of each of the remaining boards and committees.
Part I, item 21
I.4 Conflicts of interest
Principle:The existence of current or potential conflicts of interest, between members of the company’s boards or committees and the company, should be prevented. The non-interference of the conflicted member in the decision process should be guaranteed.
I.4.1 Adopted The duty should be imposed, to the members of the company’s boards and committees, of promptly informing the respective board or committee of facts that could constitute or give rise to a conflict between their interests and the company’s interest.
Part I, item 89
I.4.2 Adopted Procedures should be adopted to guarantee that the member in conflict does not interfere in the decision-making process, without prejudice to the duty to provide information and other clarifications that the board, the committee or their respective members may request.
Part I, item 89
I.5 Related party transactions
Principle:Due to the potential risks that they may hold, transactions with related parties should be justified by the interest of the company and carried out under market conditions, subject to principles of transparency and adequate supervision.
I.5.1 Adopted The managing body should define, in accordance with a previous favourable and binding opinion of the supervisory body, the type, the scope and the minimum individual or aggregate value of related party transactions that: (i) require the previous authorization of the managing board, and (ii) due to their increased value require an additional favourable report of the supervisory body.
Part I, items 38, 89 to 91

2018 ANN
UAL R
EPO
RT
105
*03
# Adoption Text Reference
I.5.2 Adopted The managing body should report all the transactions contained in Recommendation 1.5.1. to the supervisory body, at least every six months.
Part I, items 89 to 91
II. SHAREHOLDERS AND GENERAL MEETINGS
Principles:II.A - As an instrument for the efficient functioning of the company and the fulfilment of the corporate purpose of the company, the suitable involvement of the shareholders in matters of corporate governance is a positive factor for the company’s governance.II.B - The company should stimulate the personal participation of shareholders in general meetings, which is a space for communication by the shareholders with the company’s boards and committees and also of reflection about the company itself.II.C - The company should also allow the participation of its shareholders in the general meeting through digital means, postal votes and, especially, electronic votes, unless this is deemed to be disproportionate, namely taking into account the associated costs.
II.1 Adopted The company should not set an excessively high number of shares to confer voting rights, and it should make its choice clear in the corporate governance report every time its choice entails a diversion from the general rule: that each share has a corresponding vote.
Part I, items 12 and 13
II.2 Adopted The company should not adopt mechanisms that make decision making by its shareholders (resolutions) more difficult, specifically, by setting a quorum higher than that established by law.
Part I, item 14
II.3 Adopted The company should implement adequate means for the exercise of voting rights through postal votes, including by electronic means.
Part I, item 12
II.4 Not adopted The company should implement adequate means in order for its shareholders to be able to digitally participate in general meetings.
Explanation of recommendations not adopted below
II.5 Not applicable The bylaws, which specify the limitation of the number of votes that can be held or exercised by a sole shareholder, individually or in coordination with other shareholders, should equally provide that, at least every 5 years, the amendment or maintenance of this rule will be subject to a shareholder resolution — without increased quorum in comparison to the legally established — and in that resolution, all votes cast will be counted without observation of the imposed limits.
Part I, items 5 and 13
II.6 Adopted The company should not adopt mechanisms that imply payments or assumption of fees in the case of the transfer of control or the change in the composition of the managing body, and which are likely to harm the free transferability of shares and a shareholder assessment of the performance of the members of the managing body.
Part I, item 4
III. NON-EXECUTIVE MANAGEMENT, MONITORING AND SUPERVISION
Principles:III.A - The members of governing bodies who possess non-executive management duties or monitoring and supervisory duties should, in an effective and judicious manner, carry out monitoring duties and incentivise executive management for the full accomplishment of the corporate purpose, and such performance should be complemented by committees for areas that are central to corporate governance.III.B - The composition of the supervisory body and the non-executive directors should provide the company with a balanced and suitable diversity of skills, knowledge, and professional experience.III.C - The supervisory body should carry out a permanent oversight of the company’s managing body, also in a preventive perspective, following the company’s activity and, in particular, the decisions of fundamental importance.
III.1 Not adopted Without prejudice to question the legal powers of the chair of the managing body, if he or she is not independent, the independent directors should appoint a coordinator (lead independent director), from amongst them, namely, to: (i) act, when necessary, as an interlocutor near the chair of the board of directors and other directors, (ii) make sure there are the necessary conditions and means to carry out their functions, and (iii) coordinate the independent directors in the assessment of the performance of the managing body, as established in recommendation V.1.1.
Explanation of recommendations not adopted below
III.2 Adopted The number of non-executive members in the managing body, as well as the number of members of the supervisory body and the number of the members of the committee for financial matters should be suitable for the size of the company and the complexity of the risks intrinsic to its activity, but sufficient to ensure, with efficiency, the duties which they have been attributed.
Part I, items 18 and 31
III.3 Adopted In any case, the number of non-executive directors should be higher than the number of executive directors.
Part I, item 18

2018
AN
NU
AL R
EPO
RT
106
*03
# Adoption Text Reference
III.4 Not adopted Each company should include a number of non-executive directors that corresponds to no less than one third, but always plural, who satisfy the legal requirements of independence. For the purposes of this recommendation, an independent person is one who is not associated with any specific group of interest of the company, nor under any circumstance likely to affect his/her impartiality of analysis or decision, namely due to:i. having carried out functions in any of the company’s bodies for more than twelve years, either on a consecutive or non-consecutive basis;ii. having been a prior staff member of the company or of a company which is considered to be in a controlling or group relationship with the company in the last three years;iii. having, in the last three years, provided services or established a significant business relationship with the company or a company which is considered to be in a controlling or group relationship, either directly or as a shareholder, director, manager or officer of the legal person;iv. having been a beneficiary of remuneration paid by the company or by a company which is considered to be in a controlling or group relationship other than the remuneration resulting from the exercise of a director’s duties;v. having lived in a non-marital partnership or having been the spouse, relative or any first degree next of kin up to and including the third degree of collateral affinity of company directors or of natural persons with direct or indirect qualifying holdings;vi. having been a qualified holder or representative of a shareholder of qualifying holding.
Explanation of recommendations not adopted below
III.5 Not applicable The provisions of (i) of recommendation III.4 does not inhibit the qualification of a new director as independent if, between the termination of his/her functions in any of the company’s bodies and the new appointment, a period of 3 years has elapsed (cooling-off period).
Part I, item 18
III.6 Adopted Non-executive directors should participate in the definition, by the managing body, of the strategy, main policies, business structure and decisions that should be deemed strategic for the company due to their amount or risk, as well as in the assessment of the fulfilment thereof.
Part I, item 21
III.7 Not applicable The supervisory body should, within its legal and statutory competences, collaborate with the managing body in defining the strategy, main policies, business structure and decisions that should be deemed strategic for the company due to their amount or risk, as well as in the assessment of the accomplishment of these actions.
Part I, item 15
III.8 Adopted The supervisory body, in observance of the powers conferred to it by law, should, in particular, monitor, evaluate, and pronounce itself on the strategic lines and the risk policy defined by the managing body.
Part I, item 54
III.9 Partially adopted
Companies should create specialised internal committees that are adequate to their dimension and complexity, separately or cumulatively covering matters of corporate governance, remuneration, performance assessment, and appointments.
Part I, items 16,21 and 27 andexplanation of recommendations not adoptedbelow
III.10 Adopted Risk management systems, internal control and internal audit systems should be structured in terms adequate to the dimension of the company and the complexity of the inherent risks of the company’s activity.
Part I, item 50
III.11 Adopted The supervisory body and the committee for financial affairs should supervise the effectiveness of the systems of risk management, internal control and internal audit, and propose adjustments where they are deemed to be necessary.
Part I, items 38, 50 and 54
III.12 Not applicable The supervisory body should provide its view on the work plans and resources of the internal auditing service, including the control of compliance with the rules applied to the company (compliance services) and of internal audit, and should be the recipient of the reports prepared by these services, at least regarding matters related with approval of accounts, the identification and resolution of conflicts of interest, and the detection of potential irregularities.
Part I, item 50

2018 ANN
UAL R
EPO
RT
107
*03
# Adoption Text Reference
IV. EXECUTIVE MANAGEMENT
Principles:IV.A - As way of increasing the efficiency and the quality of the managing body’s performance and the suitable flow of information in the board, the daily management of the company should be carried out by directors with qualifications, powers and experience suitable for the role. The executive board is responsible for the management of the company, pursuing the company’s objectives and aiming to contribute towards the company’s sustainable development.IV.B - In determining the number of executive directors, it should be taken into account, besides the costs and the desirable agility in the functioning of the executive board, the size of the company, the complexity of its activity, and its geographical spread.
IV.1 Adopted The managing body should approve, by internal regulation or equivalent, the rules regarding the action of the executive directors and how these are to carry out their executive functions in entities outside of the group.
Part I, item 26
IV.2 Adopted The managing body should ensure that the company acts consistently with its objects and does not delegate powers, namely, in what regards:i) the definition of the strategy and main policies of the company; ii) the organisation and coordination of the business structure; iii) matters that should be considered strategic in virtue of the amounts involved, the risk, or special characteristics.
Part I, item 21
IV.3 Adopted In matters of risk assumption, the managing body should set objectives and look after their accomplishment.
Part I, items 50 to 55
IV.4 Adopted The supervisory board should be internally organised, implementing mechanisms and procedures of periodic control that seek to guarantee that risks which are effectively incurred by the company are consistent with the company’s objectives, as set by the managing body.
Part I, item 54
V. EVALUATION OF PERFORMANCE, REMUNERATION AND APPOINTMENT
V.1 Annual evaluation of performance
Principle:The company should promote the assessment of performance of the executive board and of its members individually, and also the assessment of the overall performance of the managing body and its specialized committees.
V.1.1 Partially adopted
The managing body should annually evaluate its performance as well as the performance of its committees and delegated directors, taking into account the accomplishment of the company’s strategic plans and budget plans, the risk management, the internal functioning and the contribution of each member of the body to these objectives, as well as the relationship with the company’s other bodies and committees.
Part I, items 24 and 25 and explanation of recommendations not adopted below
V.1.2 Adopted The supervisory body should supervise the company’s management, especially, by annually assessing the accomplishment of the company’s strategic plans and of the budget, the risk management, the internal functioning and the contribution of each member of the body to these objectives, as well as the relationship with the company’s other bodies and committees.
Part I, items 24 and 25
V.2 Remuneration
Principle:The remuneration policy of the members of the managing and supervisory boards should allow the company to attract qualified professionals at an economically justifiable cost in relation to its financial situation, induce the alignment of the member’s interests with those of the company’s shareholders — taking into account the wealth effectively created by the company, its financial situation and the market’s — and constitute a factor of development of a culture of professionalisation, promotion of merit and transparency within the company.
V.2.1 Adopted The remuneration should be set by a committee, the composition of which should ensure its independence from management.
Part I, items 66 and 67
V.2.2 Partially adopted
The remuneration committee should approve, at the start of each term of office, execute, and annually confirm the company’s remuneration policy for the members of its boards and committees, including the respective fixed components. As to executive directors or directors periodically invested with executive duties, in the case of the existence of a variable component of remuneration, the committee should also approve, execute, and confirm the respective criteria of attribution and measurement, the limitation mechanisms, the mechanisms for deferral of payment, and the remuneration mechanisms based on the allocation of options and shares of the company.
Part I, items 69 to 75, Annex II and Explanation of recommendations not adopted below

2018
AN
NU
AL R
EPO
RT
108
*03
# Adoption Text Reference
V.2.3 Adopted The statement on the remuneration policy of the managing and supervisory bodies, pursuant to article 2 of Law no. 28/2009, 19th June, should additionally contain the following:i. the total remuneration amount itemised by each of its components, the relative proportion of fixed and variable remuneration, an explanation of how the total remuneration complies with the company’s remuneration policy, including how it contributes to the company’s performance in the long run, and information about how the performance requirements were applied;
Part I items 77, 81 and 82
Not applicable ii. remunerations from companies that belong to the same group as the company;
Part I item 78
Not applicable iii. the number of shares and options on shares granted or offered, and the main conditions for the exercise of those rights, including the price and the exercise date;
Annex II
Adopted iv. information on the possibility to request the reimbursement of variable remuneration;
Part I item 71
Adopted v. information on any deviation from the procedures for the application of the approved remuneration policies, including an explanation of the nature of the exceptional circumstances and the indication of the specific elements subject to derogation;
Part I n.º 69
Adopted vi. information on the enforceability or non-enforceability of payments claimed in regard to the termination of office by directors.
Annex II
V.2.4 Not Adopted For each term of office, the remuneration committee should also approve the directors’ pension benefit policies, when provided for in the bylaws, and the maximum amount of all compensations payable to any member of a board or committee of the company due to the respective termination of office.
Explanation of recommendations not adopted below
V.2.5 Adopted In order to provide information or clarifications to shareholders, the chair or, in case of his/her impediment, another member of the remuneration committee should be present at the annual general meeting, as well as at any other, whenever the respective agenda includes a matter linked with the remuneration of the members of the company’s boards and ommittees or, if such presence has been requested by the shareholders.
Part I, item 67
V.2.6 Adopted Within the company’s budgetary limitations, the remuneration committee should be able to decide, freely, on the hiring, by the company, of necessary or convenient consulting services to carry out the committee’s duties. The remuneration committee should ensure that the services are provided independently and that the respective providers do not provide other services to the company, or to others in controlling or group relationship, without the express authorization of the committee.
Part I, item 67
V.3 Director remuneration
Principle:Directors should receive compensation:
i) that suitably remunerates the responsibility taken, the availability and the competences placed at the disposal of the company;
ii) that guarantees a performance aligned with the long-term interests of the shareholders, as well as others expressly defined by them; and
iii) that rewards performance.
V.3.1 Adopted Taking into account the alignment of interests between the company and the executive directors, a part of their remuneration should be of a variable nature, reflecting the sustained performance of the company, and not stimulating the assumption of excessive risks.
Part I, items 70 and 71
V.3.2 Not Adopted A significant part of the variable component should be partially deferred in time, for a period of no less than three years, thereby connecting it to the confirmation of the sustainability of the performance, in the terms defined by a company’s internal regulation.
Explanation of recommendations not adopted below
V.3.4 Not applicable When variable remuneration includes the allocation of options or other instruments directly or indirectly dependent on the value of shares, the start of the exercise period should be deferred in time for a period of no less than three years.
Part I, items 73 and 74
V.3.5 Adopted The remuneration of non-executive directors should not include components dependent on the performance of the company or on its value.
Part I, item 71

2018 ANN
UAL R
EPO
RT
109
*03
# Adoption Text Reference
V.3.6 Adopted The company should be provided with suitable legal instruments so that the termination of a director’s time in office before its term does not result, directly or indirectly, in the payment to such director of any amounts beyond those foreseen by law, and the company should explain the legal mechanisms adopted for such purpose in its governance report.
Part I, items 83 and 84
V.4 Appointments
Principle:Regardless of the manner of appointment, the profile, the knowledge, and the curriculum of the members of the company’s governing bodies, and of the executive staff, should be suited to the functions carried out.
V.4.1 Not adopted The company should, in terms that it considers suitable, but in a demonstrable form, promote that proposals for the appointment of the members of the company’s governing bodies are accompanied by a justification in regard to the suitability of the profile, the skills and the curriculum vitae to the duties to be carried out.
Explanation of recommendations not adopted below
V.4.2 Adopted The overview and support to the appointment of members of senior management should be attributed to a nomination committee, unless this is not justified by the company’s size.
Part I, item 16
V.4.3 Not adopted This nomination committee includes a majority of non-executive, independent members.
Explanation of recommendations not adopted below
V.4.4 Not adopted The nomination committee should make its terms of reference available, and should foster, to the extent of its powers, transparent selection processes that include effective mechanisms of identification of potential candidates, and that those chosen for proposal are those who present a higher degree of merit, who are best suited to the demands of the functions to be carried out, and who will best promote, within the organisation, a suitable diversity, including gender diversity.
Explanation of recommendations not adopted below
VI. RISK MANAGEMENT
Principle:Based on its mid and long-term strategies, the company should establish a system of risk management and control, and of internal audit, which allow for the anticipation and minimization of risks inherent to the company’s activity.
VI.1 Adopted The managing body should debate and approve the company’s strategic plan and risk policy, which should include a definition of the levels of risk considered acceptable.
Part I, item 54
VI.2 Adopted Based on its risk policy, the company should establish a system of risk management, identifying (i) the main risks it is subject to in carrying out its activity; (ii) the probability of occurrence of those risks and their respective impact; (iii) the devices and measures to adopt towards their mitigation; (iv) the monitoring procedures, aiming at their accompaniment; and (v) the procedure for control, periodic evaluation and adjustment of the system.
Part I, item 54
VI.3 Not adopted The company should annually evaluate the level of internal compliance and the performance of the risk management system, as well as future perspectives for amendments of the structures of risk previously defined.
Explanation of recommendations not adopted below
VII. FINANCIAL STATEMENTS AND ACCOUNTING
VII.1 Financial information
Principles:VII.A - The supervisory body should, with independence and in a diligent manner, ensure that the managing body complies with its duties when choosing appropriate accounting policies and standards for the company, and when establishing suitable systems of financial reporting, risk management, internal control, and internal audit.VII.B - The supervisory body should promote an adequate coordination between the internal audit and the statutory audit of accounts.
VII.1.1 Adopted The supervisory body’s internal regulation should impose the obligation to supervise the suitability of the preparation process and the disclosure of financial information by the managing body, including suitable accounting policies, estimates, judgements, relevant disclosure and its consistent application between financial years, in a duly documented and communicated form.
Part I, item 38

2018
AN
NU
AL R
EPO
RT
110
*03
# Adoption Text Reference
VII.2 Statutory audit of accounts and supervision
Principle:The supervisory body should establish and monitor clear and transparent formal procedures on the form of selection of the company’s statutory auditor and on their relationship with the company, as well as on the supervision of compliance, by the auditor with rules regarding independence imposed by law and professional regulations.
VII.2.1 Adopted Through the use of internal regulations, the supervisory body should define:i. the criteria and the process of selection of the statutory auditor;
Part I, item 38
Adopted ii. the methodology of communication between the company and the statutory auditor;
Part I, item 38
Adopted iii. the monitoring procedures destined to ensure the independence of the statutory auditor;
Part I, items 37 and 38
Adopted iv. the services, besides those of accounting, which may not be Part I, item 38
VII.2.2 Adopted The supervisory body should be the main interlocutor of the statutory auditor in the company and the first recipient of the respective reports, having the powers, namely, to propose the respective remuneration and to ensure that adequate conditions for the provision of services are ensured within the company.
Part I, item 38
VII.2.3 Adopted The supervisory body should annually assess the services provided by the statutory auditor, their independence and their suitability in carrying out their functions, and propose their dismissal or the termination of their service contract by the competent body when this is justified for due cause.
Part I, item 38
VII.2.4 Adopted The statutory auditor should, within their powers, verify the application of policies and systems of remuneration of governing bodies, the effectiveness and the functioning of the mechanisms of internal control, and report any irregularities to the supervisory body.
Part I, item 54
VII.2.5 Adopted The statutory auditor should collaborate with the supervisory body, immediately providing information on the detection of any relevant irregularities as to the accomplishment of the duties of the supervisory body, as well as any difficulties encountered whilst carrying out their duties.
Part I, item 38
EXPLANATION OF RECOMMENDATIONS NOT ADOPTED BELOW
Recommendation I.2.1.
This recommendation states that “Companies should establish standards and requirements regarding the profile of new members of their governing bodies, which are suitable according to the roles to be carried out. Besides individual attributes (such as competence, independence, integrity, availability, and experience), these profiles should take into consideration general diversity requirements, with particular attention to gender diversity, which may contribute to a better performance of the governing body and to the balance of its composition.”
Concerning this recommendation that was not adopted, the explanation arises from item 16 of Part I above, to which reference should be made.
Recommendation II.4.
This recommendation states that “The company should implement adequate means in order for its shareholders to be able to digitally participate in general meetings.”
Whereas until now no shareholders requested or showed interest in the implementation of systems that allow participation in general meetings by telematic means and since the means that allow the vote by electronic correspondence are available and, on the other hand, these meetings benefit from extended disclosure deadlines and flexible participation requirements - each share corresponding to one vote and the deadlines for providing proof of shareholder quality and the appointment of representatives being short - the company finds that shareholder right to attend the general meetings is already fully guaranteed in very flexible conditions.

2018 ANN
UAL R
EPO
RT
111
*03
For all of the above reasons, the company believes that the adoption of this recommendation is not justified currently, since its underlying purpose is met and the uncertain outcomes of such a system do not justify the administrative burdening of the company with the installation of one more system.
Recommendation III.1.
This recommendation states that “Without prejudice to question the legal powers of the chair of the managing body, if he or she is not independent, the independent directors should appoint a coordinator (lead independent director), from amongst them, namely, to: (i) act, when necessary, as an interlocutor near the chair of the board of directors and other directors, (ii) make sure there are the necessary conditions and means to carry out their functions; and (iii) coordinate the independent directors in the assessment of the performance of the managing body, as established in recommendation V.1.1.”
Given the size and specificities of the company, namely its family nature and concentration of its capital structure, and the total number of non-executive directors and, among them, independent directors, as well as the characteristics and current position of the Chairman of the Board of Directors, the company considers that the appointment of a lead independent director would be inappropriate and would only aim at the mere formal fulfilment of this recommendation, which the company would not adhere to.
In effect, as has been highlighted in this report, the company has several rules and procedures that provide for close and regular contact between members of the Board of Directors, namely between the chairman and the directors, and provides the conditions and necessary means for the performance of their functions.
This recommendation has therefore not been adopted by the company, although all of its objectives have been met.
Recommendation III.4.
This recommendation states that “Each company should include a number of non-executive directors that corresponds to no less than one third, but always plural, who satisfy the legal requirements of independence. (…)”.
In the course of the 2018 financial year, the Board of Directors included between one fourth and one fifth of non-executive directors who fulfilled the independence requirements. Consequently, the recommended threshold of one third was not met and recommendation III.4 was not complied with.
However, the company finds that the proportion of independent directors mentioned is adequate and consistent with a fully independent performance of the Board of Directors considering, on the one hand, the family nature of the company and the shareholder structure and the stability thereof and, on the other hand, the history and professional experience and integrity of the members of this body, who ensure real independence of the board, thus meeting the objectives proposed by this recommendation.
Recommendation III.9.
This recommendation states that “Companies should create specialised internal committees that are adequate to their dimension and complexity, separately or cumulatively covering matters of corporate governance, remuneration, performance assessment, and appointments.”
Among all committees foreseen in this recommendation, only the Appointment Committee requirement is not met for the reasons provided in the previous item 16 of Part I.

2018
AN
NU
AL R
EPO
RT
112
*03
Recommendation V.1.1.
This recommendation states that “The managing body should annually evaluate its performance as well as the performance of its committees and delegated directors, taking into account the accomplishment of the company’s strategic plans and budget plans, the risk management, the internal functioning and the contribution of each member of the body to these objectives, as well as the relationship with the company’s other bodies and committees.”
Although the executive directors are already assessed every year, in 2019 the Board of Directors and its committees will be conducting a self-assessment of their performance in 2018, which is expected to be along the lines provided by the version of the Regulation of the Board of Directors approved in 2018.
Recommendation V.2.2.
This recommendation states that “The remuneration committee should approve, at the start of each term of office, execute, and annually confirm the company’s remuneration policy for the members of its boards and committees, including the respective fixed components. As to executive directors or directors periodically invested with executive duties, in the case of the existence of a variable component of remuneration, the committee should also approve, execute, and confirm the respective criteria of attribution and measurement, the limitation mechanisms, the mechanisms for deferral of payment, and the remuneration mechanisms based on the allocation of options and shares of the company.”
All aspects of the applicable part of this recommendation are met, except one concerning the setting of the amounts of the fixed part of remunerations. This choice is due to the fact that it is found that on this matter shareholders shall adopt the principles only, leaving it to the committee the setting of the concrete amounts. It should be noted that this is a totally transparent matter, since the fixed amounts are disclosed every year.
Recommendation V.2.4.
This recommendation states that “For each term of office, the remuneration committee should also approve the directors’ pension benefit policies, when provided for in the bylaws, and the maximum amount of all compensations payable to any member of a board or committee of the company due to the respective termination of office. ”
This recommendation is only fulfilled in respect of the indication of the exact amounts on the grounds referred to above of the maximum amount of any compensation to be paid to the member of any body or committee of the company by virtue of his or her termination of service, not being fulfilled in what regards the directors’ pensions regime.
This is a matter on which, and to this day, the Remuneration Committee has never felt the need to create a self-limitation. The specific circumstance to which this limitation relates is not a common one, and when it happens, sensitivity and specificity are always so vast that it cannot fail to impose a case-by-case evaluation, even if it is integrated into the general remuneratory and historically weighted scheme. It is in any case a matter that, in view of the nature of the existing Recommendation, will still be re-evaluated in order to adopt or maintain the current situation of non-adoption.
Recommendation V.3.2.
This recommendation states that “A significant part of the variable component should be partially deferred in time, for a period of no less than three years, thereby connecting it to the confirmation of the sustainability of the performance, in the terms defined by a company’s internal regulation.”
The justification for not adopting this recommendation can be found in the remuneration policy statement in force, Annex II hereto, which states in particular that:
“Specialists in this field have drawn attention to significant advantages in deferring payment of the variable component
of remuneration to a date when the entire period corresponding to the term of office can in some way be appraised.
We accept this principle as theoretically sound, but it appears to us to offer few advantages in the specific case of Semapa and other similar companies.

2018 ANN
UAL R
EPO
RT
113
*03
One of the main arguments supporting this system is that directo.rs should be committed to achieving sustainable medium-term results, and that the remuneration system should support this, avoiding a situation where remuneration is related simply to one financial year, which may not be representative, and which may present higher profits at the cost of worse results in subsequent years.
However, whilst this danger is real and is worth safeguarding against by means of systems such as this in companies where the capital is completely dispersed and the directors may be tempted to take a short term view, maximizing quick results by sacrificing long term potential, this does not correspond to the situation in a company such as Semapa, with a stable shareholder structure and management, where these concerns are inherently less of an issue.”
Therefore, this recommendation is not adopted by the company, without prejudice to the underlying substance, which is guarantee to a greater extent than if such recommendation were implemented.
It should also be noted that the consolidated result of the Semapa exercise has always been repeatedly and consistently very positive, evidencing the sustainability of performance that the Recommendation seeks to caution. It follows from this background that the possible partial deferral, for a period of not less than three years, of the variable remuneration component, would not have had an impact on the right to the variable component by the directors of Semapa.
Recommendations V.4.1., V.4.3.. and V.4.4.
Recommendation V.4.1 states that “The company should, in terms that it considers suitable, but in a demonstrable form, promote that proposals for the appointment of the members of the company’s governing bodies are accompanied by a justification in regard to the suitability of the profile, the skills and the curriculum vitae to the duties to be carried out.”
Recommendation V.4.3 states that “This nomination committee includes a majority of non-executive, independent members” and Recommendation V.4.4. States that “The nomination committee should make its terms of reference available, and should foster, to the extent of its powers, transparent selection processes that include effective mechanisms of identification of potential candidates, and that those chosen for proposal are those who present a higher degree of merit, who are best suited to the demands of the functions to be carried out, and who will best promote, within the organisation, a suitable diversity, including gender diversity.”
The company has not set up an internal committee for the assessment of the performance, as it is not warranted by its size and complexity.
In these recommendations regarding the appointments committee – V.4.1 to V.4.4 – we must distinguish “internal competences” of holders of management positions and “external competences” that concern the governing bodies.
From the internal perspective, Semapa must be regarded individually as a holding company with a simplified administrative structure, which is why the size of the company does not justify the appointment of a committee for monitoring and supporting the appointment of holders of management positions (V.4.2).
From an external perspective, concerning the governing bodies, the reason provided in item 16 of Part I applies, and accordingly recommendations (V.4.1., V.4.3 and V.4.4) are not adopted.
Recommendation VI.3.
This recommendation states that “The company should annually evaluate the level of internal compliance and the performance of the risk management system, as well as future perspectives for amendments of the structures of risk previously defined.”
In addition to the reason provided in item 54 of Part I, the procedure in question is provided explicitly by the company’s risk policy and, therefore, will be implemented during the present year.
3 ADDITIONAL INFORMATION
There are no other disclosures or additional information which would be relevant to an understanding to the governance model and practices adopted.

2018
AN
NU
AL R
EPO
RT
114
*03
ANNEX I
TO THE CORPORATE GOVERNANCE REPORT
Disclosures required by Article 447 of the Companies Code(with regard to the financial year of 2018)
1 SECURITIES ISSUED BY THE COMPANY AND HELD BY COMPANY OFFICERS, IN THE SENSE DEFINED IN PARAGRAPHS 1 AND 2 OF ARTICLE 447 OF THE COMPANIES CODE (*):
• José Miguel Pereira Gens Paredes – 70 “Obrigações SEMAPA 2014/2019”;• Filipa Mendes de Almeida de Queiroz Pereira - 5,488 company shares;• Mafalda Mendes de Almeida de Queiroz Pereira - 5,888 company shares, and• Lua Mónica Mendes de Almeida de Queiroz Pereira - 5,888 company shares.
(*) The bonds issued by Semapa with the name “Obrigações SEMAPA 2014/2019” correspond to bonds with a variable 6-month EURIBOR rate, on the next working day TARGET immediately preceding the first day of each interest period, plus 3.25% a year, expiring in 2019.
2 SECURITIES ISSUED BY COMPANIES CONTROLLED BY OR BELONGING TO THE SAME GROUP AS SEMAPA HELD BY COMPANY OFFICERS, IN THE SENSE DEFINED IN PARAGRAPHS 1 AND 2 OF ARTICLE 447 OF THE COMPANIES CODE:
• Undivided estate of Maria Rita de Carvalhosa Mendes de Almeida de Queiroz Pereira, with company directors Filipa Mendes de Almeida de Queiroz Pereira, Mafalda Mendes de Almeida de Queiroz Pereira and Lua Mónica Mendes de Almeida de Queiroz Pereira as parties concerned - 1,000 shares in The Navigator Company, S.A.
• Filipa Mendes de Almeida de Queiroz Pereira - 139,800 shares in Sodim, SGPS, S.A.• Mafalda Mendes de Almeida de Queiroz Pereira - 139,800 shares in Sodim, SGPS, S.A. • Lua Mónica Mendes de Almeida de Queiroz Pereira - 139,800 shares in Sodim, SGPS, S.A.• Undivided estate of Pedro Mendonça de Queiroz Pereira, with company directors Filipa Mendes de Almeida de
Queiroz Pereira, Mafalda Mendes de Almeida de Queiroz Pereira and Lua Mónica Mendes de Almeida de Queiroz Pereira as parties concerned - 134,422 shares in Sodim, SGPS, S.A.
3 SECURITIES ISSUED BY THE COMPANY AND CONTROLLED COMPANIES HELD BY COMPANIES IN WHICH DIRECTORS AND AUDITORS HOLD CORPORATE OFFICE:
• Cimigest, SGPS, S.A. - 3,185,019 shares in the company • Cimo - Gestão de Participações, SGPS, S.A. – 38,959,431 shares in the company, 1,000 shares in Secil – Com-
panhia Geral de Cal e Cimento, S.A. and 5,000 shares in ETSA – Investimentos, SGPS, S.A.• Sodim, SGPS, S.A. - 15.252.726 shares in the company
4 ACQUISITION, DISPOSAL, ENCUMBRANCE OR PLEDGE OF SECURITIES ISSUED BY THE COMPANY, CONTROLLED COMPANIES OR COMPANIES IN THE SAME GROUP BY COMPANY OFFICERS AND THE COMPANIES REFERRED TO IN 3:
• On 20 June 2018, Director Carlos Eduardo Coelho Alves sold 100,000 shares in The Navigator Company, S.A. at 5.25 euros average price per share, and 152,350 shares in The Navigator Company, S.A., at 5.23 euros average price per share, and on 21 June 2018, 325,959 shares in The Navigator Company, S.A., at 5.07 euros average price per share, no longer holding shares in The Navigator Company, S.A.
• On 21 June 2018, Director Mafalda Mendes de Almeida de Queiroz Pereira sold 50,000 shares in The Navigator Company, S.A., at 4.98 euros average price per share, no longer holding shares in The Navigator Company, S.A.
• On 20 June 2018, Director Lua Mónica Mendes de Almeida de Queiroz Pereira sold 71,000 shares in The Naviga-tor Company, S.A., at 5.21 euros average price per share, and on 21 June 2018, 50,000 shares in The Navigator Company, S.A., at 4.98 euros average price per share, no longer holding shares in The Navigator Company, S.A.

2018 ANN
UAL R
EPO
RT
115
*03
• Cimo - Gestão de Participações, SGPS, S.A. (“Cimo”) and Longapar, SGPS, S.A. (“Longapar”) carried out a merger by acquisition, with effect from 27 December 2018, under which Longapar was acquired by Cimo and 480,000,000 shares representing the share capital of Longapar were transferred to Cimo. As a result of that op-eration, 22,225,400 shares in the company, 1,000 shares in Secil – Companhia Geral de Cal e Cimento, S.A. and 5,000 shares in ETSA – Investimentos, SGPS, S.A. owned by Longapar were transferred to Cimo.
• Cimigest, SGPS, S.A. (“Cimigest”) and CIMIPAR – Sociedade Gestora de Participações Sociais, S.A. (“Cimipar”), carried out a merger by acquisition, with effect from 27 December 2018, under which Cimipar was acquired by Cimigest and 200,000 shares representing the share capital of Cimipar were transferred to Cimigest.
5 TRANSACTIONS IN OWN SHARES:
In 2018 Semapa acquired the following shares in its own capital:
i. 1,750 shares, at the average price of 13.07 euros, on 11 December;ii. 2,000 shares, at the average price of 13.19 euros, on 12 December;iii. 9,000 shares, at the average price of 13.36 euros, on 13 December; iv. 7,000 shares, at the average price of 13.06 euros, on 14 December;v. 3,950 shares, at the average price of 12.83 euros, on 17 December;
vi. 8,600 shares, at the average price of 12.75 euros, on 18 December;vii. 2,900 shares, at the average price of 12.77 euros, on 19 December;viii. 4,000 shares, at the average price of 12.74 euros, on 20 December;ix. 3,200 shares, at the average price of 12.75 euros, on 21 December;x. 4,000 shares, at the average price of 12.92 euros, on 27 December andxi. 7,937 shares, at the average price of 12.88 euros, on 28 December.
The purchase of the shares identified before left Semapa owning 640,666 own shares, corresponding to 0.788% of its share capital.
In 2018 Semapa did not dispose of any shares in its own capital.

2018
AN
NU
AL R
EPO
RT
116
*03
ANNEX IITO THE CORPORATE GOVERNANCE REPORT
Remuneration policy statement
Law 28/2009, of 19 June, requires the Remuneration Committee to submit each year for the approval of the General Meeting of shareholders a statement on the remuneration policy for members of the management supervisory bodies. A draft document was accordingly submitted to shareholders in 2018, resulting in approval of a remuneration policy statement as transcribed below:
“REMUNERATION POLICY STATEMENT - SEMAPA DIRECTORS AND AUDITORS
I. INTRODUCTION
Semapa’s Remuneration Committee drew up a remuneration policy statement for the first time in early 2007, successfully submitting it for approval by the company’s general meeting that year. This statement was drafted at that time in line with a recommendation issued on this matter by the Securities Market Commission (Comissão de Mercado de Valores Mobiliários).
The Remunerations Committee declared at this time that it felt that the options set out in the statement should be maintained until the end of the term of office of the company’s officers then underway. This term ran from 2006 to 2009.
The statement was due for review in 2010, not only because a fresh term of office had started, but also because of the entry into force of Law 28/2009, of 19 June, requiring remuneration committees to submit a remuneration policy statement annually for the approval of the general meeting.
This Committee continues to believe that a remuneration policy statement, due to its nature as a set of principles, should be mostly stable during an entire term of office, which is why the content of this year’s statement will remain unchanged.
There is a significant divide between the two most common systems for setting the remuneration of company officers. The first is for such remuneration to be set by the general meeting; this solution is rarely adopted, being rather impractical for a variety of reasons. The second is for remuneration to be set by a Committee, which decides in keeping with criteria on which the shareholders have not had the opportunity to pronounce..
The solution now before us amounts to an intermediate system whereby the shareholders can appraise a remuneration policy to be followed by the Committee. This seeks to draw on the best features of both theoretical systems, as we propose to do in this document, reasserting the position we have previously defended whilst also including the contribution from the additional experience and expertise acquired by the company, and complying with the legal requirements in this field as referred to above.
II. LEGAL FRAMEWORK AND RECOMMENDATIONS
This statement is issued in the legal framework formed by Law 28/2009, of 19 June (as referred to above), and the recommendations of the Securities Market Commission (2013).
In addition to rules on the frequency with which the statement must be issued and approved and on disclosure of its content, this law also stipulates that this content should include information on:
a) Arrangements for aligning the interests of members of the management body with those of the company;
b) Criteria for setting the variable component of remuneration;
c) The existence of share or share option pay schemes for members of the management and supervisory bodies;

2018 ANN
UAL R
EPO
RT
117
*03
d) The possibility of the variable component of remuneration, if any, being paid, wholly or in part, after the accounts have been finalized for the entire term of office;
e) Rules limiting variable limitation in the event of the company’s results revealing significant deterioration in the company’s performance in the last period for which accounts are closed or when such deterioration may be expected in the period underway.
The current recommendations of the Securities Market Commission make the following requirements:
II.3.3. The statement on the remuneration policy for the management and supervisory bodies referred to in Article 2 of Law No. 28/2009 of 19 June, shall also contain the following:
a) Identification and details of the criteria for determining the remuneration paid to the company officers;
b) Information regarding the maximum potential amount, in individual terms, and the maximum potential amount, in aggregate form, to be paid to members of corporate bodies, and identify the circumstances in which these maximum amounts may be payable;
c) Information on whether payments are due for the dismissal or termination of appointment of board members.
III. RULES DERIVING FROM LAW AND THE ARTICLES OF ASSOCIATION
Any system for setting remuneration will inevitably have to consider the legal rules, as well as any private rules which may be established in the articles of association.
The legal rules for the directors are basically established in Article 399 of the Companies Code, from which it follows that:
• Powers to fix the remuneration lie with the general meeting of shareholders of a committee appointed by the same.
• The remuneration is to be fixed in accordance with the duties performed and the company’s state of affairs.
• Remuneration may be fixed, or may consist in part of a percentage of the profits for the period, but the maximum percentage to be allocated to the directors must be authorized by a clause in the articles of association, and shall not apply to distribution of reserves or any part of the profits for the period which could not, under the law, be distributed to shareholders.
For the members of the Audit Board and the officers of the General Meeting, the law lays down that the remuneration shall consist of a fixed sum, which shall be determined in the same way by the general meeting of shareholders or by a committee appointed by the same, taking into account the duties performed and the state of the company’s affairs.
Semapa’s articles of association contain a specific clause, number seventeen, dealing only with the directors and governing also retirement provision. We transcribe the relevant passages:
“2 – The remuneration of the directors […] is fixed by a Remuneration Committee comprising an uneven number of members, elected by the General Meeting.
3 –The remuneration may consist of a fixed part and a variable part, which shall include a share in profits, which share in profits shall not exceed five per cent of the net profits of the previous period, for the directors as a whole.”
This is the formal framework to be observed in defining remuneration policy.

2018
AN
NU
AL R
EPO
RT
118
*03
IV. HISTORICAL BACKGROUND
Since the incorporation of Semapa and up to 2002, all directors of Semapa received remuneration comprising a fixed component, paid fourteen times a year, and fixed by the Remuneration Committee, then called the Comissão de Fixação de Vencimentos.
In 2003, the resolution on the distribution of profits from 2002 included, for the first time, a part of the profits to be directly paid as remuneration to the directors, divided between the directors as decided by the Remuneration Committee.
This procedure was repeated through to 2005, with regard to the profits from 2004.
In 2006, the allocation of profits from 2005 did not provide for any amount for directors’ remuneration. The variable component of the remuneration was fixed in 2006 by the Remuneration Committee, also with reference to the profits, in accordance with the articles of association.
This is the procedure which has stayed in place through to 2014, although since 2007 this has taken place within the terms of a remuneration policy statement approved by the company’s General Meeting. In 2015 we addressed again the benefits of returning to the previous procedure of having the shareholders decide directly at the General Meeting the total amount to be paid, according to the year’s results and as proposed by the Remunerations Committee, which would be in charge of the individual distributions. The procedure was welcomed and has been implemented since 2015.
It should be noted that the allocation of a percentage of profits is not applied directly, but rather as an indicator, and also as a limit, in line with the articles of association, on amounts which are determined in a more involving process, taking into account the factors set out in the remuneration policy statement in force and the KPIs mentioned below.
There has therefore been a constant procedure since 2003, with the directors’ remuneration comprising a fixed component and a variable component.
Since the incorporation of the company, members of the Audit Board have received fixed monthly remuneration. In the case of the officers of the General Meeting, since remuneration for these officers was first instituted it has been set on the basis of the number of meetings actually held.
V. GENERAL PRINCIPLES
The general principles to be observed when setting the remuneration of the company officers are essentially those which in very general terms derive from the law: on the one hand, the duties performed and on the other the state of the company’s affairs. If we add to these the general market terms for similar situations, we find that these appear to be the three main general principles:
a) Duties performed.
It is necessary to consider the duties performed by each company officer not only in the formal sense, but also in the broader sense of the work carried out and the associated responsibilities. Not all the executive directors are in the same position, and the same is also true, for example, for the members of the audit board. Duties have to be assessed in the broadest sense, taking into account criteria as varied as, for example, responsibility, time dedicated, or the added value to the company resulting from a given type of intervention or representation of a given institution.
The fact that time is spent by the officer on duties in other controlled companies also cannot be taken out of the equation, due, on the one hand, to the added responsibility this represents, and, on the other hand, to the existence of another source of income.
It should be noted that Semapa’s experience has shown that the directors of this company, contrary to what is often observed in other companies of the same type, have not always been neatly split into executive and non-executive. There are a number of directors with delegated powers and who are generally referred to as executive directors, but some of the directors without delegated powers have been closely involved in the life

2018 ANN
UAL R
EPO
RT
119
*03
of the company in a variety of ways. Namely regarding the allocation of variable remuneration, the position of the Chairman of the Board is especially relevant here; although he is not member of the Executive Board, he is closely involved in the decisions taken regarding the company’s day-to-day business.
b) The state of the company’s affairs.
This criterion must also be understood and interpreted with caution. The size of the company and the inevitable complexity of the associated management responsibilities, is clearly one of the relevant aspects of the state of affairs, understood in the broadest sense. There are implications here for the need to remunerate a responsibility which is greater in larger companies with complex business models and for the capacity to remunerate management duties appropriately.
c) Market criteria.
It is unavoidably necessary to match supply to demand when setting any level of payment, and the officers of a corporation are no exception. Only respect for market practices makes it possible to retain professionals of a calibre required for the complexity of the duties performed and the responsibilities shouldered, thereby assuring not only their own interests but essentially those of the company, and the generation of value of all its shareholders. In the case of Semapa, in view of its characteristics and size, the market criteria to be considered are those prevailing internationally, as well as those to be observed in Portugal.
VI. COMPLIANCE WITH LEGAL REQUIREMENTS AND RECOMMENDATIONS
Having described the historical background and the general principles adopted, we shall now consider the issue of compliance by these principles with the relevant legal requirements.
1. Article 2 a) of Law 28/2009. Alignment of interests.
The first requirement that Law 28/2009 regards as essential in terms of the information in this statement is for a description of the procedures which assure that the directors’ interests are aligned with those of the company.
We believe that the remuneration system adopted in Semapa is successful in assuring such alignment. Firstly, because the remuneration sets out to be fair and equitable in the light of the principles set out, and secondly because it links the directors to results by means of a variable remuneration component which is set primarily in the light of these results.
2. Article 2 b) of Law 28/2009. Criteria for the variable component.
The second requirement established by the law is for information on the criteria used to determine the variable component.
The variable remuneration it set based on the target amount applied to each director and is paid according to the individual’s performance and performance of the company that correspond to the expectations and the criteria defined before hand. The target amount is weighted by the aforementioned principles - market, specific functions, state of the company -, in particular comparable market circumstances in positions equivalent in function. Another important factor taken into account when setting the variable component is Semapa’s option not to provide any share or option plans.
Actual performance compared to the expectations and goals, which determine target variations is weighted against a set of quantitative and qualitative KPIs of the company’s performance and of the relevant director, which include in particular EBITDA, net income and cash flow.

2018
AN
NU
AL R
EPO
RT
120
*03
3. Article 2 c) of Law 28/2009. Share or option plans.
The decision whether or not to provide share or option plans is structural in nature. The existence of such a plan is not a simple add-on to an existing remuneration system, but rather an underlying to change to the existing system, at least in terms of the variable remuneration.
Although a remuneration system of this type is not incompatible with the company’s articles of association, we feel that the wording of the relevant provisions in the articles and the historical background to the existing system argue in favour of maintaining a remuneration system without any share or option component.
This is not to say that we see no merits in including a share or option component in directors’ remuneration, nor that we would not be receptive to restructuring directors’ remuneration to incorporate such a plan. However, such a component is not essential in order to promote the principles we defend and, as we have said, we do not believe that this was the fundamental intention of the company’s shareholders.
4. Article 2 d) of Law 28/2009. Date of payment of variable remuneration.
Specialists in this field have drawn attention to significant advantages in deferring payment of the variable component of remuneration to a date when the entire period corresponding to the term of office can in some way be appraised.
We accept this principle as theoretically sound, but it appears to us to offer few advantages in the specific case of Semapa and other similar companies.
One of the main arguments supporting this system is that directors should be committed to achieving sustainable medium-term results, and that the remuneration system should support this, avoiding a situation where remuneration is related simply to one financial year, which may not be representative, and which may present higher profits at the cost of worse results in subsequent years.
However, whilst this danger is real and is worth safeguarding against by means of systems such as this in companies where the capital is completely dispersed and the directors may be tempted to take a short term view, maximizing quick results by sacrificing long term potential, this does not correspond to the situation in a company such as Semapa, with a stable shareholder structure and management, where these concerns are inherently less of an issue.
5. Article 2 e) of Law 28/2009. Procedures limiting variable remuneration.
Procedures of this kind are designed to limit variable remuneration in the event of the results showing a significant deterioration in the company’s performance in the last reporting period or when such deterioration may be expected in the period underway.
This type of provision also reflects a concern that good performance in the short term, which may boost directors’ remuneration, could be achieved at the cost of future performance.
For obvious reasons, the arguments presented above also apply here. It should also be noted that a system of this kind would have little practical effect if not combined with significant deferral of remuneration, which is not proposed for Semapa.
6. Recommendation II.3.3 a). Criteria for determining the remuneration paid.
The criteria for determining the remuneration paid to the company officers is that which is drawn from the principles listed in chapter V above and that described in item 2 of chapter VI above, concerning the variable component of the directors’ remuneration.
Besides these, there are no predetermined mandatory criteria at Semapa for setting the remuneration.

2018 ANN
UAL R
EPO
RT
121
*03
7. Recommendation II.3.3 b). Maximum potential, individual and aggregate remuneration.
Semapa’s Articles of Association only lay down the maximum potential aggregate amount of variable remuneration payable to directors which, according to clause 17.3, corresponds to a share in profits not exceeding five per cent of the net profits of the previous period. Without prejudice to the fact that this Committee agrees with the meaning of the recommendation concerning the fixing of maximum potential amounts, in Semapa’s case in our view, where a statutory provision on this matter already exists, no complementary rules limiting amounts are required, without prejudice to setting such limits for controlled companies. The maximum amount can be reached whenever performance criteria have been fulfilled completely.
8. Recommendation II.3.3. c). Payments for the dismissal or termination of duties.
There are no agreements, and no such provisions have been defined by this Committee, on payments by Semapa relating to dismissal or termination of Directors’ duties.
This fact is the natural result of the particular situations existing in the company, and not a position of principle taken by this Committee against the existence of agreements of this nature.
The supplementary legal rule in this matter apply here.
VII SPECIFIC OPTIONS
The specific options for the remuneration policy we propose may therefore be summarized as follows:
1. The remuneration of the executive members of the Board of Directors and the Chairman, as mentioned in par-agraph a) of Chapter V, shall comprise a fixed and variable component.
2. The remuneration of non-executive directors shall comprise only a fixed component that may be complemented according to the piling on of added responsibilities.
3. The remuneration of the members of the Audit Board and the officers of the General Meeting shall comprise a fixed component only.
4. The fixed component of the remuneration of directors shall consist of a monthly amount payable fourteen times a year or of a predetermined amount for each meeting of the Board of Directors attended.
5. A monthly rate shall be set for the fixed component of the remuneration of directors for all those who are mem-bers of the Executive Board and those who, although not members of such Board, perform duties or carry out specific work of a repeated or ongoing nature.
6. The predetermined amount for participation in meetings by members of the Board of Directors shall be fixed for those who have duties which are essentially advisory and supervisory.
7. The fixed remuneration of the members of the Audit Board shall consist in all cases of a predetermined amount paid fourteen times a year.
8. The fixed remuneration of the officers of the General Meeting shall consist in all cases of a predetermined amount for each meeting, the remuneration for second and subsequent meetings being lower than that for the first general meeting of the year.

2018
AN
NU
AL R
EPO
RT
122
*03
9. The procedure for assigning variable remuneration to the executive members of the Board of Directors shall comply with the criteria proposed by the Remuneration Committee, and such remuneration shall not exceed five per cent of the consolidated net profits (IFRS format).
10. In setting all remuneration, including in particular the distribution of the total amount allocated to the variable remuneration of the Board of Directors, the general principles established above shall be observed: the duties performed, the state of the company’s affairs and market criteria.
Lisbon, 24 April 2018
THE REMUNERATION COMMITTEE
José Gonçalo Ferreira Maury
Frederico José da Cunha Mendonça e Meneses
João Rodrigo Appleton Moreira Rato”

2018 ANN
UAL R
EPO
RT
123
*03
ANNEX IIITO THE CORPORATE GOVERNANCE REPORT
Declaration required under Article 245.1 c) of the Securities Code
Article 246.1 c) of the Securities Code requires that each of the persons responsible for issuers make a number of statements, as described in this article. In the case of Semapa, a standard statement has been adopted, worded as
follows:
I hereby declare, under the terms and for the purposes of Article 245.1 c) of the Securities Code that, to the best of my knowledge, the management report, annual accounts, legal accounts certificate and other financial statements of Semapa – Sociedade de Investimento e Gestão, SGPS, S.A., for the financial year of 2018, were drawn up in accordance with the relevant accounting rules, and provide a true and fair view of the assets and liabilities, financial affairs and profit or loss of said company and other companies included in the consolidated accounts, and that the management report contains a faithful account of the business, performance and position of said company and other companies included in the consolidated accounts, describing the main risks and uncertainties which they face.
Considering that the members of the Audit Board and the Statutory Auditor sign an equivalent declaration in relation to the documents for which they are responsible, a separate declaration with the above text was signed by the directors only, as it was deemed that only the Company officers fall within the concept of “persons responsible for the issuer”. As required by this rule, we provide below a list of the names of the people signing the declaration and their functions in the company:
Name Function
Heinz-Peter Elstrodt Chairman of the Board of Directors
João Nuno de Sottomayor Pinto de Castello Branco Member of the Board of Directors
José Miguel Pereira Gens Paredes Member of the Board of Directors
Paulo Miguel Garcês Ventura Member of the Board of Directors
Ricardo Miguel dos Santos Pacheco Pires Member of the Board of Directors
António Pedro de Carvalho Viana-Baptista Member of the Board of Directors
Carlos Eduardo Coelho Alves Member of the Board of Directors
Francisco José Melo e Castro Guedes Member of the Board of Directors
Vítor Manuel Galvão Rocha Novais Gonçalves Member of the Board of Directors
Vítor Paulo Paranhos Pereira Member of the Board of Directors
Filipa Mendes de Almeida de Queiroz Pereira Member of the Board of Directors
Mafalda Mendes de Almeida de Queiroz Pereira Member of the Board of Directors
Lua Mónica Mendes de Almeida de Queiroz Pereira Member of the Board of Directors
José Antônio do Prado Fay Member of the Board of Directors


*04 FINANCIAL STATEMENTSCONSOLIDATED

2018
AN
NU
AL R
EPO
RT
126
*04
CONSOLIDATED INCOME STATEMENTFOR THE YEARS 2018 AND 2017
Amounts in Euro Notes 2018 2017 4th Q 2018 4th Q 2017
Unaudited Unaudited
Revenues
Sales 4 2 173 912 298 2 137 820 694 555 079 491 546 098 776
Services rendered 4 24 055 603 26 832 584 6 334 388 8 943 255
Other income
Gains on disposal of non-current assets 5 19 759 725 4 044 932 930 112 2 319 573
Other operating income 5 66 450 211 58 574 591 27 042 078 25 471 217
Change in fair value of biological assets 18 (9 782 369) 3 783 988 (11 339 515) 597 982
Cost, expenses and losses
Cost of inventories sold and consumed 6 (856 669 130) (807 146 735) (217 248 372) (198 108 784)
Variation in production 6 45 308 827 (25 954 418) 15 210 234 (20 830 572)
Cost of services and materials consumed 6 (592 401 403) (590 592 977) (154 690 244) (153 027 599)
Payroll costs 6 (257 155 181) (260 340 347) (60 080 840) (71 289 439)
Other costs and losses 6 (64 969 455) (46 295 410) (23 343 362) (15 102 888)
Provisions 6 (19 007 250) (4 240 123) (17 326 129) (461 742)
Depreciation, amortisation and impairment losses 8 (215 850 957) (224 224 765) (65 683 708) (62 243 963)
Operating results 313 650 919 272 262 014 54 884 133 62 365 816
Group share of (loss) / gains of associated companies and joint ventures 9 1 182 762 1 047 842 429 533 129 931
Net financial results 10 (70 012 323) (64 911 379) (11 726 784) (14 616 839)
Profit before tax 244 821 358 208 398 477 43 586 882 47 878 908
Income tax expense 11 (43 650 193) (14 798 847) 5 540 743 17 800 963
Net profit for the year 201 171 165 193 599 630 49 127 625 65 679 871
Net profit for the year
Attributable to Semapa's Shareholders 132 554 337 124 093 467 35 028 504 45 992 700
Attributable to non - controlling interests 13 68 616 828 69 506 163 14 099 121 19 687 171
Earnings per share
Basic earnings per share, Eur 12 1.643 1.538 0.434 0.570
Diluted earnings per share, Eur 12 1.643 1.538 0.434 0.570
These notes are an integral part of these consolidated Financial Statements

2018 ANN
UAL R
EPO
RT
127
*04
CONSOLIDATED STATEMENT OF COMPREHENSIVE INCOMEFOR THE YEARS 2018 AND 2017
Amounts in Euros Notes 2018 2017 4th Q 2018 4th Q 2017
Unaudited Unaudited
Net profit for the year without non - controlling interests 201 171 165 193 599 630 49 127 625 65 679 871
Items that may subsequently be reclassified to the income statement
Derivative financial instruments
Fair value changes 34 (3 717 385) 7 970 630 (1 170 868) (1 436 787)
Tax on items above 28 1 022 281 (2 615 810) 933 270 (288 645)
Currency translation differences 27 (27 146 399) (81 305 715) 2 880 558 (27 562 048)
Other comprehensive income (216 779) 1 505 075 (4 628 677) (3 620 669)
Items that may not subsequently be reclassified to the income statement
Remeasurements of post-employment benefits
Remeasurements 29 (13 696 791) 2 657 177 (8 856 862) 1 898 586
Tax on items above 29 221 743 14 981 170 847 26 978
Other comprehensive income (net of taxes) (43 316 553) (71 773 662) (10 454 955) (30 982 585)
Total comprehensive income for the year 157 854 612 121 825 968 38 672 670 34 697 286
Attributable to:
Semapa's Shareholders 91 568 807 62 700 822 28 878 586 20 552 660
Non - controlling interests 66 285 805 59 125 146 9 794 084 14 144 626
157 854 612 121 825 968 38 672 670 34 697 286
These notes are an integral part of these consolidated Financial Statements

2018
AN
NU
AL R
EPO
RT
128
*04
CONSOLIDATED STATEMENT OF FINANCIAL POSITIONAS OF 31 DECEMBER 2018 AND 2017
Amounts in Euros Notes 31-12-2018 31-12-2017
ASSETS
Non - currents assets
Goodwill 15 346 170 987 352 024 516
Other intangible assets 16 292 846 882 290 065 457
Property. plant and equipment 17 2 043 753 765 2 064 604 211
Biological assets 18 119 614 567 129 396 936
Investment in associates and joint ventures 19 4 714 744 4 099 421
Investment properties 20 383 513 385 927
Financial assets at fair value through profit or loss 21 - 44 508
Available-for-sale financial assets 21 - 424 428
Equity instruments 21 1 450 919 -
Other non-current assets 21 67 645 781 6 244 448
Deferred tax assets 28 108 061 925 80 075 383
2 984 643 083 2 927 365 235
Current assets
Inventories 23 313 911 463 280 756 346
Receivables and other current assets 24 404 133 382 334 867 086
State and other public entities 25 96 709 240 111 820 465
Income tax 25 1 091 659 788 673
Non-current Assets held for sale 33 8 534 209 88 202 005
Cash and cash equivalents 2.1.3 and 31 183 248 977 243 187 261
1 007 628 930 1 059 621 836
Total assets 3 992 272 013 3 986 987 071
EQUITY AND LIABILITIES
Capital and reserves
Share capital 26 81 270 000 81 270 000
Treasury shares 26 (6 740 954) (6 036 401)
Translation reserve 27 (129 296 945) (99 805 648)
Fair value reserves 27 (2 713 976) (2 100 174)
Other reserves 27 796 784 857 717 616 946
Retained earnings 27 18 496 568 28 359 635
Profit for the year 132 554 337 124 093 467
Equity attributable to Semapa's shareholders 890 353 887 843 397 825
Non - controlling interests 13 367 236 794 378 547 431
Total equity 1 257 590 681 1 221 945 256
Non - current liabilities
Deferred tax liabilities 28 235 715 323 265 510 481
Pensions and other post-employment benefits 29 10 777 902 8 123 335
Provisions 30 78 479 404 55 674 021
Interest-bearing liabilities 31 1 401 009 210 1 653 480 805
Other non-current liabilities 32 82 324 405 25 728 280
1 808 306 244 2 008 516 922
Current liabilities
Interest-bearing liabilities 31 333 875 411 263 390 200
Payables and other current liabilities 32 460 568 255 385 598 640
State and other public entities 25 95 094 042 93 052 535
Income tax 25 36 837 380 14 419 036
Non-current Liabilities held for sale 33 - 64 482
926 375 088 756 524 893
Total liabilities 2 734 681 332 2 765 041 815
Total equity and liabilities 3 992 272 013 3 986 987 071
These notes are an integral part of these consolidated Financial Statements

2018 ANN
UAL R
EPO
RT
129
*04
CO
NSO
LID
ATE
D S
TATE
MEN
T O
F C
HA
NG
ES IN
EQ
UIT
YFO
R T
HE
PER
IOD
BET
WEE
N 1
JA
NU
AR
Y 20
18 A
ND
31
DEC
EMB
ER 2
018
AN
D 1
JA
NU
AR
Y 20
17 A
ND
31
DEC
EMB
ER 2
017
Am
ount
s in
Eur
os
Not
es
Shar
e C
apit
alTr
easu
ry
Shar
esFa
ir V
alue
R
eser
ves
Oth
er
Res
erve
sTr
ansl
atio
n R
eser
veR
etai
ned
Earn
ings
Pro
fit f
or th
e ye
arTo
tal
Non
-co
ntro
llin
g in
tere
sts
Tota
l
Equi
ty a
s of
31
Dec
embe
r 20
17
81
270
000
(6
036
401
)(2
100
174
)71
7 61
6 94
6 (9
9 80
5 64
8)28
359
635
12
4 09
3 46
7 84
3 39
7 82
5 37
8 54
7 43
1 1
221
945
256
Impa
cts
from
the
IFR
S 9
adop
tion
- -
- -
- (2
677
546
)-
(2 6
77 5
46)
(121
248
)(2
798
794
)
Appl
icat
ion
of 2
017
profi
t for
the
year
:
- T
rans
fer
to o
ther
res
erve
s -
- -
79 1
67 9
11
- -
(79
167
911)
- -
-
- D
ivid
ends
Pai
d 14
and
27
- -
- -
- -
(41
310
040)
(41
310
040)
- (4
1 31
0 04
0)
- B
onus
to e
mpl
oyee
s 14
-
- -
- -
- (3
615
516
)(3
615
516
)-
(3 6
15 5
16)
Acqu
isiti
on o
f tre
asur
y sh
ares
26
and
27
- (7
04 5
53)
- -
- -
- (7
04 5
53)
- (7
04 5
53)
Div
iden
ds p
aid
by s
ubsi
diar
ies
to n
on-c
ontr
ollin
g in
tere
sts
13
- -
- -
- -
- -
(71
378
025)
(71
378
025)
Oth
er c
ompr
ehen
sive
inco
me
for
the
year
* -
- (1
895
544
)-
(29
491
297)
(9 5
98 6
87)
- (4
0 98
5 52
8)(2
331
025
)(4
3 31
6 55
3)
Acqu
isiti
ons/
Dis
posa
ls to
non
-con
trol
ling
inte
rest
s 13
-
- -
- -
62 0
89
- 62
089
(5
889
974
)(5
827
885
)
Oth
er m
ovem
ents
-
- 1
281
742
- -
2 35
1 07
7 -
3 63
2 81
9 (2
07 1
93)
3 42
5 62
6
Net
pro
fit fo
r th
e ye
ar
- -
- -
- -
132
554
337
132
554
337
68 6
16 8
28
201
171
165
Equi
ty a
s of
31
Dec
embe
r 20
18
81
270
000
(6
740
954
)(2
713
976
)79
6 78
4 85
7 (1
29 2
96 9
45)
18 4
96 5
68
132
554
337
890
353
887
367
236
794
1 25
7 59
0 68
1
Am
ount
s in
Eur
os
Not
es
Shar
e C
apit
alTr
easu
ry
Shar
esFa
ir V
alue
R
eser
ves
Oth
er
Res
erve
sTr
ansl
atio
n R
eser
veR
etai
ned
Earn
ings
Pro
fit f
or th
e ye
arTo
tal
Non
-co
ntro
llin
g in
tere
sts
Tota
l
Equi
ty a
s of
1 J
anua
ry 2
017
81 2
70 0
00
(6 0
36 4
01)
(6 0
62 5
13)
717
616
946
(31
600
075)
(52
720
971)
114
862
812
817
329
798
409
754
207
1 22
7 08
4 00
5
Appl
icat
ion
of 2
016
profi
t for
the
year
:
- T
rans
fer
to o
ther
res
erve
s -
- -
- -
75 0
45 1
82
(75
045
182)
- -
-
- D
ivid
ends
Pai
d/R
eser
ves
Pai
d 14
and
27
- -
- -
- -
(36
307
652)
(36
307
652)
- (3
6 30
7 65
2)
- B
onus
to e
mpl
oyee
s 14
-
- -
- -
- (3
509
978
)(3
509
978
)-
(3 5
09 9
78)
Div
iden
ds p
aid
by s
ubsi
diar
ies
to n
on-c
ontr
ollin
g in
tere
sts
13
- -
- -
- -
- -
(88
167
877)
(88
167
877)
Oth
er c
ompr
ehen
sive
inco
me
for
the
year
* -
- 3
962
339
- (6
8 20
5 57
5)2
850
592
- (6
1 39
2 64
4)(1
0 38
1 01
8)(7
1 77
3 66
2)
Acqu
isiti
ons/
Dis
posa
ls to
non
-con
trol
ling
inte
rest
s -
- -
- -
(200
)-
(200
)-
(200
)
Shar
e ca
pita
l red
uctio
n -
- -
- -
- -
- (3
14 3
67)
(314
367
)
Oth
er m
ovem
ents
-
- -
- 2
3 18
5 03
2 -
3 18
5 03
4 (1
849
677
)1
335
357
Net
pro
fit fo
r th
e ye
ar
- -
- -
- -
124
093
467
124
093
467
69 5
06 1
63
193
599
630
Equi
ty a
s of
31
Dec
embe
r 20
17
81
270
000
(6
036
401
)(2
100
174
)71
7 61
6 94
6 (9
9 80
5 64
8)28
359
635
12
4 09
3 46
7 84
3 39
7 82
5 37
8 54
7 43
1 1
221
945
256
* N
et o
f def
erre
d ta
xes
The
se n
otes
are
an
inte
gral
par
t of t
hese
con
solid
ated
Fin
anci
al S
tate
men
ts

2018
AN
NU
AL R
EPO
RT
130
*04
CONSOLIDATED CASH FLOW STATEMENTFOR THE YEARS 2018 AND 2017
Amounts in Euros Notes 2018 2017 4th Q 2018 4th Q 2017
(Unaudited) (Unaudited)
OPERATING ACTIVITIES
Receipts from customers 2 326 828 252 2 320 039 541 676 924 579 587 780 996
Payments to suppliers (1 658 645 314) (1 652 905 797) (393 399 621) (395 902 358)
Payments to employees (197 037 956) (198 821 555) (45 543 632) (55 179 485)
Cash flow from operations 471 144 982 468 312 189 237 981 326 136 699 153
Income tax received / (paid) (34 909 071) (55 300 627) (1 682 331) (15 958 258)
Other receipts / (payments) relating to operating activities 8 453 794 16 443 423 (99 839 638) (2 305 140)
Cash flow from operating activities (1) 444 689 705 429 454 985 136 459 357 118 435 755
INVESTING ACTIVITIES
Inflows
Property. plant and equipment 2 704 115 3 317 685 1 915 762 1 582 353
Investment subsidies 727 005 - - -
Interest and similar income - 2 131 538 - 269 894
Dividends 19 867 174 833 509 (1) -
Other assets 74 420 121 - 5 393 963 -
78 718 415 6 282 732 7 309 724 1 852 247
Outflows
Financial investments (7 470 989) (25 806 534) (2 370 989) 93 536
Cash and cash equivalents - changes in consolidation perimeter (78 058) - (78 058) -
Property. plant and equipment (231 509 868) (140 663 335) (60 931 573) (41 368 087)
Other assets (24 625) (493 425) (24 625) 6 934
(239 083 540) (166 963 294) (63 405 245) (41 267 617)
Cash flow from investing activities (2) (160 365 125) (160 680 562) (56 095 521) (39 415 370)
FINANCING ACTIVITIES
Inflows
Borrowings 2 464 467 735 4 472 035 089 389 202 825 974 129 081
2 464 467 735 4 472 035 089 389 202 825 974 129 081
Outflows
Borrowings (2 636 390 562) (4 489 643 932) (460 890 077) (1 011 505 371)
Amortisation of lease contracts (917 234) (855 373) (281 117) (334 285)
Interest and similar expenses (53 158 959) (61 369 235) (17 205 503) (16 140 015)
Dividends 13 (115 495 619) (119 558 249) (3 495 666) (402 298)
Treasury shares acquisitions 26 (704 553) - (704 553) -
(2 806 666 927) (4 671 426 789) (482 576 916) (1 028 381 969)
Cash flow from financing activities (3) (342 199 192) (199 391 700) (93 374 091) (54 252 888)
CHANGE IN CASH AND CASH EQUIVALENTS (1)+(2)+(3) (57 874 612) 69 382 723 (13 010 255) 24 767 497
FOREIGN EXCHANGE GAINS / (LOSSES) (1 088 606) (10 296 736) (189 381) (2 299 690)
CASH AND CASH EQUIVALENTS AT THE BEGINNING OF THE YEAR 31 243 187 261 184 101 274 194 492 796 220 719 454
IMPAIRMENT FROM THE IFRS 9 ADOPTION 31 (1 983 066) - 1 105 817 -
EFFECT OF ASSETS HELD FOR SALE 1 008 000 - 850 000 -
CASH AND CASH EQUIVALENTS AT THE END OF THE YEAR 31 183 248 977 243 187 261 183 248 977 243 187 261
These notes are an integral part of these consolidated Financial Statements

2018 ANN
UAL R
EPO
RT
131
*04
*CONTENTSTO THE CONSOLIDATED FINANCIAL STATEMENTS
*01 SUMMARY OF THE MAIN ACCOUNTING POLICIES 133 1.1 BASIS FOR PREPARATION 133 1.2 ADDITIONAL DISCLOSURES 134 1.3 BASIS FOR CONSOLIDATION 134 1.3.1 SUBSIDIARIES 134 1.3.2 ASSOCIATES 135 1.3.3 JOINT VENTURES 136 1.4 SEGMENTAL REPORTING 136 1.5 FOREIGN CURRENCY TRANSLATION 137 1.5.1 FUNCTIONAL AND REPORTING CURRENCY 137 1.5.2 BALANCES AND TRANSACTIONS EXPRESSED IN FOREIGN CURRENCIES 137 1.5.3 GROUP COMPANIES 137 1.6 INTANGIBLE ASSETS 138 1.6.1 CO2 EMISSION RIGHTS 138 1.6.2 BRANDS 138 1.7 GOODWILL 138 1.8 PROPERTY. PLANT AND EQUIPMENT 138 1.9 INVESTMENT PROPERTIES 139 1.10 IMPAIRMENT OF NON-CURRENT ASSETS 140 1.11 BIOLOGICAL ASSETS 140 1.12 FINANCIAL ASSETS 141 1.13 DERIVATIVE FINANCIAL INSTRUMENTS AND HEDGE ACCOUNTING 141 1.14 CORPORATE INCOME TAX 143 1.15 INVENTORY 143 1.16 RECEIVABLES AND OTHER CURRENT ASSETS 144 1.17 CASH AND CASH EQUIVALENTS 144 1.18 SHARE CAPITAL AND TREASURY SHARES 144 1.19 INTEREST-BEARING LIABILITIES 144 1.20 BORROWING COSTS 145 1.21 PROVISIONS 145 1.22 PENSIONS AND OTHER POST-EMPLOYMENT BENEFITS 146 1.22.1 PENSIONS OBLIGATIONS – DEFINED BENEFIT PLANS 146 1.22.2 PENSION OBLIGATIONS – DEFINED CONTRIBUTION PLANS 146 1.22.3 HOLIDAY PAY. ALLOWANCES AND BONUSES 147 1.23 PAYABLES AND OTHER CURRENT LIABILITIES 147 1.24 NON-CURRENT ASSETS HELD FOR SALE AND DISCONTINUED OPERATIONS 147 1.25 GOVERNMENT GRANTS 147 1.26 LEASES 148 1.27 DIVIDENDS DISTRIBUTION 148 1.28 REVENUE 148 1.29 ACCRUAL ACCOUNTING PRINCIPLE 148 1.30 CONTINGENT ASSETS AND LIABILITIES 148 1.31 FAIR VALUE 149 1.32 EARNINGS PER SHARE 149 1.33 SUBSEQUENT EVENTS 149 1.34 NEW STANDARDS. CHANGES AND INTERPRETATION TO THE EXISTING STANDARDS 150*02 RISK MANAGEMENT 153 2.1 FINANCIAL RISK FACTORS 153 2.1.1 CURRENCY RISK 154 2.1.2 INTEREST RATE RISK 156 2.1.3 CREDIT RISK 158 2.1.4 LIQUIDITY RISK 160 2.1.5 CAPITAL RISK 161

2018
AN
NU
AL R
EPO
RT
132
*04
2.2 OPERATIONAL RISK FACTORS 161 2.2.1 RISKS RELATING TO THE PULP AND PAPER SEGMENTS 161 2.2.2 RISKS RELATING TO THE CEMENT AND DERIVATIVES SEGMENT 169 2.2.3 RISKS RELATING TO THE ENVIRONMENT SEGMENT 171 2.2.4 RISKS RELATING TO THE GROUP IN GENERAL 172 2.2.5 CONTEXT RISKS 173*03 RELEVANT ACCOUNTING ESTIMATES AND JUDGEMENTS 173 3.1 RECOVERABILITY OF GOODWILL AND BRANDS 173 3.2 INCOME TAX 174 3.3 ACTUARIAL ASSUMPTIONS 174 3.4 FAIR VALUE OF BIOLOGICAL ASSETS 174 3.5 RECOGNITION OF PROVISIONS AND ADJUSTMENTS 174 3.6 TANGIBLE ASSETS 174*04 SEGMENT REPORTING 175*05 OTHER INCOME 178*06 COST. EXPENSES AND LOSSES 179*07 REMUNERATION OF STATUTORY BODIES 180*08 DEPRECIATION. AMORTISATION AND IMPAIRMENT LOSSES 181*09 GROUP SHARE OF (LOSS)/GAINS OF ASSOCIATED COMPANIES AND JOINT VENTURES 182*010 NET FINANCIAL RESULTS 182*011 INCOME TAX 183*012 EARNINGS PER SHARE 185*013 NON-CONTROLLING INTERESTS 185*014 APPLICATION OF PREVIOUS YEAR’S PROFIT 187*015 GOODWILL 187*016 OTHER INTANGIBLE ASSETS 191*017 PROPERTY. PLANT AND EQUIPMENT 194*018 BIOLOGICAL ASSETS 195*019 INVESTMENT IN ASSOCIATES AND JOINT VENTURES 197*020 INVESTMENT PROPERTIES 198*021 EQUITY INSTRUMENTS AND OTHER NON-CURRENT ASSETS 199*022 IMPAIRMENT IN NON-CURRENT AND CURRENT ASSETS 200*023 INVENTORIES 201*024 RECEIVABLES AND OTHER CURRENT ASSETS 202*025 STATE AND OTHER PUBLIC ENTITIES 203*026 SHARE CAPITAL AND TREASURY SHARES 205*027 RESERVES AND RETAINED EARNINGS 205*028 DEFERRED TAXES 207*029 PENSIONS AND OTHER POST-EMPLOYMENT BENEFITS 210*030 PROVISIONS 217*031 INTEREST-BEARING LIABILITIES 218*032 PAYABLES AND OTHER LIABILITIES 225*033 ASSETS AND LIABILITIES HELD FOR SALE 227*034 FINANCIAL ASSETS AND LIABILITIES 227*035 BALANCES AND TRANSACTIONS WITH RELATED PARTIES 232*036 ENVIRONMENTAL EXPENDITURES 234*037 AUDIT FEES 235*038 NUMBER OF EMPLOYEES 236*039 COMMITMENTS AND CONTINGENCIES 236*040 OTHER COMMITMENTS OF THE GROUP 237*041 CONTINGENT ASSETS 238*042 EXCHANGE RATES 240*043 COMPANIES INCLUDED IN THE CONSOLIDATION PERIMETER 241*044 SUBSEQUENT EVENTS 246*045 NOTE ADDED FOR TRANSLATION 246

2018 ANN
UAL R
EPO
RT
133
*04
NOTES TO THE CONSOLIDATED FINANCIAL STATEMENTSFOR THE YEARS 2018 AND 2017
(Translation of a report originally issued in Portuguese)
The SEMAPA Group (Group) comprises Semapa — Sociedade de Investimento e Gestão, SGPS, S.A. (“Semapa”) and its subsidiaries. Semapa was incorporated on 21 June 1991 and has as its main business object the management of financial investments in other companies as an indirect form of carrying out economic activity. It has been listed on NYSE Euronext Lisbon since 1995 with ISIN PTSEM0AM0004.
HEAD OFFICE: Av. Fontes Pereira de Melo. 14. 10º Piso. Lisboa
SHARE CAPITAL: Euros 81.270.000
CORPORATE BODY NO.: 502 593 130
These notes are expressed in Euro since this is the main functional currency of Semapa.
Semapa leads an Enterprise Group with activities in three distinct business segments: pulp and paper, cement and derivatives, and environment, developed respectively through its subsidiaries The Navigator Company (former Portucel, S.A. named in the present document as Navigator or Navigator Group), Secil — Companhia Geral de Cal e Cimento, S.A. (Secil or Secil Group) and ETSA — Investimentos, SGPS, S.A. (ETSA or ETSA Group).
During 2018, Semapa launched a new venture capital business unit through its subsidiary Semapa Next, S.A.,whose objective is to promote investments in startups and venture capital funds with high growth potential.
Semapa is included in the consolidation perimeter of Sodim — SGPS, S.A., which is its parent company and the final controlling entity.
These consolidated financial statements were approved by the Board of Directors on 13 March 2019. However, they are still subject to approval by the General Shareholders’ Meeting, in accordance with the Portuguese commercial legislation.
The Group’s senior management, which are the members of the Board of Directors who sign this report, declare that, to the best of their knowledge, the information contained herein was prepared in conformity with the applicable accounting standards, providing a true and fair view of the assets and liabilities, the financial position and results of the companies included in the Group’s consolidation scope.
1 SUMMARY OF THE MAIN ACCOUNTING POLICIESThe main accounting policies applied in the preparation of these consolidated financial statements are described below.
1.1 BASIS FOR PREPARATION
The Group’s consolidated financial statements for the years ended 31 December 2018 have been prepared in accordance with the International Financial Reporting Standards adopted by the European Union (IFRS), formerly referred to as the International Accounting Standards (IAS), issued by the International Accounting Standards Board (IASB) and the interpretations issued by the International Financial Reporting Interpretations Committee (IFRIC) or by the former Standing Interpretations Committee (SIC), in force as at 1 January 2018.
The accompanying consolidated financial statements were prepared on the going concern basis from the accounting books and records of the companies included in the consolidation (Note 43), and under the historic cost convention, except for: biological assets, financial assets at fair value through profit and loss, available-for-sale financial assets, derivative financial instruments, which are recorded at fair value (Notes 18, 20, 21 and 34). Tangible assets acquired until 1 January 2004 have been recorded at revaluated cost.

2018
AN
NU
AL R
EPO
RT
134
*04
The preparation of the financial statements requires the use of important estimates and judgments in the application of the Group’s accounting policies. The main statements, which involve a greater degree of judgment or complexity, or the most significant assumptions and estimates used in the preparation of the aforesaid financial statements are disclosed in Note 3.
1.2 ADDITIONAL DISCLOSURES
COMPARABILITYAs of 1 January 2018, the accounting standards IFRS 9 - Financial Instruments and IFRS 15 – Revenue from Contracts with Customers entered into force and were adopted by the Group in the preparation of the 2018 consolidated financial statements, These standards have dictated a number of changes to the Group’s accounting policies (Notes 1.12 and 1.28) and to the classification and measurement of financial assets as described in Note 1.34.
1.3 BASIS FOR CONSOLIDATION
1.3.1 SUBSIDIARIES
Subsidiaries are all the entities (including structured entities) over which the Company has control. The Company controls an entity when it is exposed to, or has rights to, the variable returns generated as a result of its involvement with the entity, and has the ability to affect those variable returns through the power it exercises over the entity’s relevant activities.
Shareholders equity and net profit/(loss) of these companies, corresponding to the third-party investment in such companies, are presented under the caption Non-controlling interests, respectively in the Consolidated Statement of Financial Position, in a separate component of shareholders’ equity, and in the Consolidated Income Statement. Companies included in the consolidated financial statements are detailed in Note 43.
The purchase method is used in recording the acquisition of subsidiaries. The cost of an acquisition is measured by the fair value of the assets transferred, the equity instruments issued and liabilities incurred or assumed on the acquisition date.
The identifiable assets acquired and the liabilities and contingent liabilities assumed in a business combination are initially measured at fair value on the acquisition date, regardless of the existence of non-controlling interests. The excess of the acquisition cost, regarding the fair value of the Group’s share of the identifiable assets and liabilities acquired, is recorded as Goodwill when the Group acquires control, as described in Note 15.
Subsidiaries are consolidated using the full consolidation method with effect from the date that control is transferred to the Group. In the acquisition of additional share capital of controlled entities, the excess between the proportion of acquired net assets and respective acquisition cost is directly recognised in Equity under the caption Retained earnings (Note 27).
When, at the date of acquisition of the control, the Group already holds a previously acquired interest, the fair value of such participation contributes to the determination of goodwill or badwill.
When the control acquired is less than 100%, in the application of the purchase method, non-controlling interests can be measured at fair value or at the ratio of the fair value of the assets and liabilities acquired, being that option defined according to each transaction.
In the case of disposals of interests, resulting in a loss of control over a subsidiary, any remaining interest is revalued to the market value at the date of sale, and the gain or loss resulting from such revaluation, is recorded against income, as well as the gain or loss resulting from such disposal.

2018 ANN
UAL R
EPO
RT
135
*04
Subsequent transactions in the disposal or acquisition of non-controlling interests, which do not imply a change in control, do not result in the recognition of gains, losses or Goodwill. Any difference between the transaction value and the book value is recognized in Equity, in other equity instruments.
The acquisition cost is subsequently adjusted when the acquisition/attribution price is contingent upon the occurrence of specific events agreed with the seller/shareholder (e.g. fair value of acquired assets).
Any contingent payments to be transferred by the Group are recognized at fair value at the acquisition date. If the assumed obligation constitutes a financial liability, subsequent changes in fair value are recognized in profit or loss. If the assumed obligation constitutes an equity instrument, there is no change in the initial estimation.
The negative profits generated in each period by subsidiaries with non-controlling interests are allocated to the percentage held by them, regardless of whether they assume a negative balance.
If the acquisition cost is less than the fair value of the net assets of the subsidiary acquired (negative Goodwill), the difference is recognised directly in the Income statement, under the caption Other operating income. Transaction costs directly attributable are immediately expensed.
Intercompany transactions, balances, unrealised gains on transactions and dividends distributed between Group companies are eliminated. Unrealised losses are also eliminated, except where the transaction displays evidence of impairment of a transferred asset.
Subsidiaries’ accounting policies have been changed whenever necessary so as to ensure consistency with the policies adopted by the Group.
1.3.2 ASSOCIATES
Associates are all the entities in which the group has significant influence but does not have control, generally ap-plied in the case of investments representing between 20% and 50% of the voting rights. Investments in associates are equity accounted.
In accordance with the equity accounting method, financial investments are recorded at their acquisition cost, adjust-ed by the amount corresponding to the Group’s share of changes in the associates’ shareholders’ equity (including net income/loss) and by dividends received.
The difference between the acquisition cost and the fair value of the associate’s identifiable assets, liabilities and contingent liabilities on the acquisition date, if positive, are recognised as Goodwill and recorded under the caption Investments in associates. If these differences are negative, they are recorded as income for the year under the caption Group share of (loss)/gains of associated companies. Transaction costs directly attributable are immediately expensed.
An evaluation of investments occurs when there are signs that the asset could be impaired, and any identified impair-ment losses are recorded under the same caption. When the impairment losses recognised in prior years no longer exist, they are reversed.
When the Group’s share in the associate’s losses is equal to or exceeds its investment in the associate, the Group ceases to recognise additional losses, except where it has assumed liability or made payments in the associate’s name. Unrealised gains on transactions with associates are eliminated to the extent of the Group’s share in the asso-ciate. Unrealised losses are also eliminated, except if the transaction reveals evidence of impairment of a transferred asset.
Associate’s accounting policies have been changed whenever necessary so, as to ensure consistency with the poli-cies adopted by the Group. Investments in associated companies are disclosed in Note 19.

2018
AN
NU
AL R
EPO
RT
136
*04
1.3.3 JOINT VENTURES
Joint agreements are classified as joint operations or joint ventures, depending on the contractual rights and obligations of each investor. Joint ventures are accounted and measured using the equity method.
Joint operations are accounted in the Group’s consolidated financial statements, based on the share of jointly held assets and liabilities, as well as the income from the joint operation, and expenses incurred jointly. Assets, liabilities, income and expenses should be accounted for in accordance with the applicable IFRS.
A jointly-controlled entity is a joint venture involving the establishment of a company, partnership or other entity in which the Group has an interest.
Jointly-controlled entities are included in the consolidated financial statements under the equity method, according to which financial investments are recorded at cost, adjusted by the amount corresponding to the Group’s interest in changes in shareholders’ equity (including net income) and dividends received.
When the share of losses attributable to the Group is equivalent to or exceeds the value of the financial holding in joint ventures, the Group recognizes additional losses if it has assumed obligations or if it has made payments for the joint ventures.
Unrealised gains and losses between the Group and its joint ventures are eliminated in proportion to the Group’s interest in joint ventures. Unrealised losses are also eliminated, unless the transaction gives additional evidence of impairment of the transferred asset.
The accounting policies of joint ventures are amended, when necessary, to ensure that they are applied consistently with those of the Group.
1.4 SEGMENTAL REPORTING
An operating segment is a component of an entity:
i) that engages in business activities that may earn revenues and incur in expenses (including revenues and ex-
penses relating to transactions with other components of the same entity);
ii) whose operating results are regularly reviewed by the chief operating decision maker of the entity for the pur-
poses of making decisions about allocating resources to the segment and assessing its performance; and
iii) for which separate financial information is available.
Operating segments are consistently disclosed with the internal model of management information provided to the people responsible for the Group’s operational decision-making. These people are responsible for allocating resources to the segment and assess its performance, as well as for the strategic decision making.
Three operating segments have been identified: Pulp and Paper, Cement and Derivatives and Environment.
PULP AND PAPERThe Navigator Company, S.A., is the subsidiary, acquired in 2004, that leads the Enterprise Group dedicated to the production and sales in Portugal, Germany, Spain, France, Italy, United Kingdom, Netherlands, Austria, Belgium, Switzerland, Morocco, Poland, Turkey, the United States of America and Mozambique, among others, of cellulose pulp and paper and its related products, purchase of wood, forest and agricultural production, cutting timber and sale of pulp and paper.

2018 ANN
UAL R
EPO
RT
137
*04
CEMENT AND DERIVATIVESSecil — Companhia Geral de Cal e Cimento, S.A., leads the Enterprise Group of cements and related products and operates in Portugal, Brazil, Lebanon, Tunisia, Angola, Netherlands, France and Cape Verde, with cement production taking place at the Maceira, Pataias, Outão, Adrianópolis (Brazil), Gabés (Tunisia), Beirut (Lebanon) and Lobito (Angola) plants, and the production and sale of precast concrete, aggregates and the operations of quarries facilities through its subsidiaries.
ENVIRONMENTETSA — Investimentos, SGPS, S.A. leads the Enterprise Group of environment which operates in Portugal.
Geographical segment is an individual area committed to supplying products or services in a particular economic environment and which is subjected to risks and benefits different than those arising from segments which operate in other economic environments. The geographical segment is based on the destination country of the goods and services sold by the Group.
The segment reporting accounting policies are those consistently used in the Group. All the inter-segment sales and services are performed at market prices and eliminated on consolidation. The segment reporting is presented in Note 4.
1.5 FOREIGN CURRENCY TRANSLATION
1.5.1 FUNCTIONAL AND REPORTING CURRENCY
The items included in the financial statements of each of the Group’s entities are measured using the currency of the economic environment in which the entity operates (functional currency).
The consolidated financial statements are presented in Euro, which is the Group’s functional and reporting currency.
1.5.2 BALANCES AND TRANSACTIONS EXPRESSED IN FOREIGN CURRENCIES
All the Group’s assets and liabilities denominated in foreign currencies. were converted into Euro using the exchange rates ruling at the statement of financial position date.
The currency differences, favourable and unfavourable, arising from the differences between the exchange rates ruling at the transaction date and those ruling on collection, payment or statement of financial position dates, were recorded as income and costs in the consolidated income statement for the year.
1.5.3 GROUP COMPANIES
The results and financial position of all Group entities that have a functional currency different from the Group’s reporting currency are translated into the presentation currency as follows:
i) The assets and liabilities of each statement of financial position are translated at the exchange rate ruling at the date of financial statements;
ii) The resulting exchange rate differences are recognised as a separate component of shareholders’ equity, under the caption Translation reserve.
iii) The income and expenses of each Income statement are translated using the average exchange rate of the reporting period, except where the average exchange rate is not a reasonable approximation of the cumulative effect of the rates ruling on the transaction dates, in which case the income and expenses are converted at the
exchange rate ruling on the transaction dates.
Whenever a foreign entity is disposed of, the accumulated exchange difference is recognized in the consolidated income statement, as part of the gain or loss on sale.

2018
AN
NU
AL R
EPO
RT
138
*04
Goodwill and fair value adjustments, arising from the acquisition of a foreign entity, are treated as assets and liabilities of the foreign entity and converted at the closing exchange rate. The corresponding exchange rate differences are recognised in other comprehensive income.
1.6 INTANGIBLE ASSETS
Intangible assets are stated at cost of acquisition, deducted of accumulated amortisation and impairment losses. Depreciation is calculated using the straight-line method, over a period between 3 to 5 years and annually for CO2 emission rights.
1.6.1 CO2 EMISSION RIGHTS
The CO2 emission rights attributed to the Group at no cost, within the PNALE (National Plan for the Assignment of CO2 Emission Rights), are recognised at fair value under the caption Intangible assets on the assignment date, with a corresponding liability being recorded under Deferred income — Grants, for the same amount.
The Group records as an operating cost with a corresponding liability and an operating income as a result of the recognition of the proportion of the corresponding grant relating to the Group’s CO2 emissions.
Sales of emission rights give rise to a gain or loss, being the difference between the amount realised and the respective initial recognition cost, net of the corresponding Government grant.
At the date of the consolidated Statement of financial position, CO2 emission rights’ portfolio is valued at the lower of the assumed acquisition cost or their market value. On the other hand, liabilities due for those emissions are valued at market value at the same date.
1.6.2 BRANDS
Whenever brands are identified in a business combination, the Group records them separately in the consolidated financial statements as an asset at historical cost, which represents their fair value on the acquisition date.
On subsequent measurement, brands are stated in the Group’s consolidated financial statements at cost less impairment losses.
1.7 GOODWILL
Goodwill represents the excess of the cost of acquisition over the fair value of the identifiable assets, liabilities and contingent liabilities of the subsidiaries included in the consolidation, by the full method on the acquisition date and is allocated to each Cash Generating Unit (CGU) or to the lower group of CGUs to which it belongs.
Goodwill is not amortised and is subject to impairment tests, at least once a year. Impairment losses relating to Goodwil cannot be reversed. Gains or losses arising from the sale of an entity, include the amount of the corresponding goodwill.
As mentioned in Note 1.5.3, Goodwill generated on the acquisition of a foreign entity is recorded in the functional currency of that entity and converted into the reporting currency of the Group (Euro), at the exchange rate prevailing at the balance sheet date. Exchange differences generated in this conversion are recorded in the Currency translation reserve as other comprehensive income.
1.8 PROPERTY. PLANT AND EQUIPMENT
Property, plant and equipment acquired up to 1 January 2004 (date of transition to IFRS) are recorded at acquisition cost, or acquisition cost revaluated in accordance with accounting principles generally accepted in Portugal, up to that date, less depreciation and accumulated impairment losses.

2018 ANN
UAL R
EPO
RT
139
*04
Property, plant and equipment acquired after transition date are recorded at acquisition cost, less depreciation and impairment losses. Acquisition cost includes all the expenses directly attributable to the acquisition of the assets and their availability on site and intended operating conditions.
Subsequent costs are included in acquisition cost of the asset or recognised as separate assets, as appropriate, only when it is probable that future economic benefits will flow to the company and the respective cost can be reliably measured.
Expenses with scheduled maintenance are considered as a component of the acquisition cost of property, plant and equipment, and are fully depreciated up to the expected maintenance date or if they occur after the date of acquisition, capitalized if the useful life exceeds 12 months.
Other expenses with repairs and maintenance are recognized as an expense in the period in which they are incurred.
The spare parts are recognised in accordance with IAS 16. Thus, parts considered strategic, the use of which is not intended for consumption in the production process and the use of which is expected to extend over more than two financial years, and maintenance parts considered as “critical replacement parts”, are recognised in non-current assets as Tangible Fixed Assets. Respecting this classification, spare parts are depreciated from the moment they become available for use and are assigned a useful life that follows the nature of the equipment, where they are expected to be integrated, not exceeding the remaining useful life of these.
Maintenance parts of amounts considered intangible, and whose intended use is for less than two years, are classified as inventories.
Depreciation is calculated over the acquisition cost, using the straight-line method since the asset is available for use and using the rates that best reflect their estimated useful life, as follows:
Average useful life
Land 14
Buildings and other constructions 12 – 30
Machinery and Equipment 6 - 25
Transportation equipment 4 - 9
Tools 2 - 8
Administrative equipment 4 - 8
Returnable containers 6
Other property. plant and equipment 4 - 10
The depreciation of exploration lands results from the estimated average useful life of the land, taking into account the period of extraction of raw material.
The residual values of the assets and respective useful lives are reviewed and adjusted when necessary at the statement of financial position date. When the carrying amount of the asset exceeds its realisable value, the asset is written down to the estimated recoverable amount, and an impairment charge is booked (Note 1.10).
Gains or losses arising on the write off or disposal represent the difference between the proceeds received on disposal less costs to sell and the asset’s carrying amount. and are recognised in the income statement as other operating income or expenses.
1.9 INVESTMENT PROPERTIES
Investment properties are valued at acquisition cost, net of depreciation and impairment losses, being the cost of those acquired up to 1 January 2004 (date of transition to IFRS) the historical acquisition cost, or the revalue cost in accordance with generally accepted accounting principles in Portugal, up to that date.

2018
AN
NU
AL R
EPO
RT
140
*04
Investment property consists essentially of property held for rental or capital appreciation (or both), and is not intended for use in the production or supply of goods or services or for administrative purposes or for sale in the ordinary course of its business.
1.10 IMPAIRMENT OF NON-CURRENT ASSETS
Non-current assets, which do not have a defined useful life are not subject to depreciation, but are subject to annual impairment tests. Assets subject to depreciation are reviewed for impairment whenever events or changes in circumstances indicate that the carrying amount may not be recoverable.
Impairment losses are recognised as the amount of the excess of the asset’s carrying value over its recoverable amount. The recoverable amount is the higher of the fair value less cost to sell amount and the value in use.
For the purpose of conducting impairment tests, the assets are grouped at the lowest level for which cash flows can be identified separately (cash generating units that the assets belong to), when it is not possible to do so individually for each asset.
The reversal of impairment losses, recognised in previous years. is recorded when it can be concluded that the recognised impairment losses no longer exist or have decreased (with the exception of impairment losses relating to Goodwill — see Note 1.7).
The reversal of impairment losses is recognised in the income statement as other operating income, under the same item where it was initially recorded, unless the asset has been revalued, in which case the reversal corresponds to an additional revaluation. However, the reversal of the impairment loss is reversed only up to the limit of the amount that would have been recognised (net of amortisation or depreciation), had the impairment loss not been recorded in previous years.
1.11 BIOLOGICAL ASSETS
Biological assets are measured at fair value (Note 18) deducted by the estimated costs at the point of harvest. The Group’s biological assets mainly comprise the forests held for the production of timber, suitable for incorporating in the production process of BEKP, including among other species like pine and cork.
When calculating the fair value of the forests, the Group used the discounted cash flows method, based on a model developed in house that is subject to periodical reviews by external and independent experts, which considers assumptions about the nature of the assets being valued, namely, the expected yield of the forests, the timber selling price deducted by costs relating to harvest and transportation, the rents of the woodlands (own and rented) and also plantation costs, maintenance costs, the inherent cost of the rented forests and a discount rate.
All costs incurred in land preparation for first forestation are considered as a tangible asset, depreciated over their estimated useful life, which coincides with the concession period in the case of assets deployed in concession areas.
The discount rate corresponds to a market rate without inflation, determined on the basis of the Group’s expected rate of return on its forests, see Note 3.4.
Changes in estimates of growth, harvest period, price, cost and other assumptions are recognised as changes in fair value of biological assets.
At the time of harvest, wood is recognised at fair value less estimated costs, since that point until the point of sale, which is the initial cost of the inventory.

2018 ANN
UAL R
EPO
RT
141
*04
1.12 FINANCIAL ASSETS
IFRS 9 establishes new requirements for the classification and measurement of financial assets, replacing the requirements established in IAS 39.
This classification is based on the business model used in the management of the financial assets and on the characteristics of the cash flows defined in the contract, being determined at the time of the initial recognition and reassessed at each reporting date.
All acquisitions and disposals of these investments are recognised at the date of the respective purchase and sale contracts, irrespective of the financial settlement date.
DEBT INSTRUMENTSA financial asset is measured at amortised cost if (i) it is held to collect contractual cash flows; and (ii) the asset’s underlying contractual cash flows represent solely the payment of principal and interest. Assets classified in this category are initially recognized at fair value and subsequently measured at amortized cost.
A financial asset is measured at fair value through other comprehensive income if (i) the inherent objective of the business model used is achieved, either by collecting contractual cash flows or selling financial assets; and (ii) the underlying contractual cash flows only represent the payment of principal and interest. Assets classified under this category are initially and subsequently measured at their fair value, and changes in their carrying amount are recorded against other comprehensive income, except for recognition of impairment losses, interest and foreign exchange gains and losses which are recognised against the income statement. When the financial asset is derecognised, the gain or loss accumulated in other comprehensive income is reclassified to the income statement.
Financial assets that do not meet the requirements for classification in the situations referred to above are classified and measured at fair value through profit or loss, residual category in accordance with IFRS 9.
EQUITY INSTRUMENTS Equity instruments are measured at fair value. Equity instruments held for trading purposes are measured at fair value through profit or loss. Changes in fair value for the remaining equity instruments are recognised in other comprehensive income. See Note 21.
IMPAIRMENTIFRS 9 establishes a new model for the recognition of impairment, replacing the concept of “incurred losses” (IAS 39) with the concept of “expected losses”. This model is applicable to financial instruments measured at amortized cost or at fair value through other comprehensive income (including loans, bank deposits, accounts receivable and debt securities). See Note 22.
DERECOGNITION OF FINANCIAL ASSETSThe Group derecognises financial assets only when the contractual rights to its cash flows expire, or when it transfers the financial assets and all significant risks and benefits associated with their possession to another entity. The transferred financial assets are derecognised for which the Group has retained significant risks and benefits, provided that control over them has been assigned. The Group derecognises financial liabilities only when the corresponding obligation is settled, cancelled or expired.
1.13 DERIVATIVE FINANCIAL INSTRUMENTS AND HEDGE ACCOUNTING
DERIVATIVE FINANCIAL INSTRUMENTSThe Group uses derivative financial instruments to manage the financial risks to which it is exposed.
Although the derivative financial instruments contracted represent effective economic hedging instruments, not all of them qualify as hedging instruments, in accordance with the applicable rules and requirements. Derivative financial instruments, which do not qualify as hedging instruments, are stated on the consolidated statement of financial position at fair value and changes in fair value are recognised in Gains and losses in financial instruments (Note 10).

2018
AN
NU
AL R
EPO
RT
142
*04
Whenever possible, the fair value of derivatives is estimated, based on quoted instruments, In the absence of market prices, the fair value of derivatives is estimated based on the discounted cash flow method and option valuation models, in accordance with the assumptions generally used in the market. The fair value of derivative financial instruments is mainly included in the captions Receivables and other-current assets and Payables and other-current liabilities.
The derivative financial instruments, used for hedging purposes, may be classified as hedge instruments if they fulfil all of the following conditions:
i) At acquisition date, there is formal designation and documentation of the hedging relationship, namely regard-ing the hedged item, the hedging instrument and the company’s evaluation of the hedging effectiveness;
ii) There is an expectation that the hedge will be highly effective, at the inception of the hedging relation and along its duration;
iii) The effectiveness of the hedge may be measured at the beginning of the operation and while it is running;
iv) For cash flow hedges, the realization of the cash flows must be highly probable.
Whenever expectations of changes in interest or exchange rates justify it, the Group seeks to hedge against adverse movements through derivative instruments, such as interest rate swaps (IRS), exchange interest rate collars, ex-change forwards, among others.
In the selection of derivative financial instruments, it is their economic aspects that are the main focus of assess-ment, The management also evaluates the impact of each additional derivative financial instruments to its portfolio, namely in earnings’ volatility.
CASH-FLOW HEDGE (INTEREST RATE AND EXCHANGE RATE RISKS)In order to manage the risk of interest and exchange rates, the Group enters into cash flow hedge.
Those transactions are recorded in the statement of financial position at their fair value and, to the extent that they are considered effective hedging, changes in fair value are initially recorded in the statement of comprehensive income for the year. If hedging transactions are deemed to be ineffective, the gain or loss arising therefrom is recorded directly in profit or loss.
Accumulate amounts recognised in equity are transferred to profit and loss when, the hedged item affects the income statement (for example, when the hedged future sale materialises). The gain or loss corresponding to the effective component of interest rate swaps that are hedging variable rate financing is recognised under the caption Financial results, However, when the future hedged transaction results in the recognition of a non-financial asset (e.g. inventories or tangible fixed assets), the previously gains and losses deferred in equity are included in the initial measurement of the cost of the asset.
When a hedging instrument matures or is sold, or when it no longer meets the criteria required to be recognized as a hedge, the cumulative gains and losses on equity are recycled to the income statement, except when the hedged item is a future transaction with related cumulative gains and losses included in equity at that date remain in equity. In such case, they will only be recycled to the income statement when the transaction is recognised in the income statement.
According to IFRS 9, the Group chose to continue to apply the hedge accounting requirements of IAS 39 until there is greater visibility of the current Dynamic Risk Management (macro hedging) project, in order to avoid partial application of the hedge accounting of the new accounting standards.
2018 ANN
UAL R
EPO
RT
143
*04
NET INVESTMENT HEDGING (EXCHANGE RATE RISK)In order to manage the exposure of its investments in foreign subsidiaries to fluctuations in the exchange rate (net investment), the group enters into exchange rate forwards, which are register at fair value in the consolidated Statement of financial position.
Those exchange rate forwards, hired for investments in foreign operations, are recorded in a similar way to the cash flow hedg-es. Gains and losses on the hedging instrument related to its effective hedging component are recognized in the comprehensive income for the year. Gains and losses related to the ineffective hedging component are recognized in the income statement. The accumulated gains and losses on equity are included in the income statement if and when the foreign subsidiaries are disposed.
1.14 CORPORATE INCOME TAX
Corporate income tax includes current and deferred tax.
CURRENT TAXCurrent income tax is calculated based on net profit, adjusted in conformity with tax legislation in force at the statement of financial position date.
DEFERRED TAXDeferred tax is calculated using the liability method, based on the temporary differences between the book values of the assets and liabilities and their respective tax base. The income tax rate expected to be in force in the period in which the temporary differences will reverse is used in calculating deferred tax.
Deferred tax assets are recognised whenever there is a reasonable likelihood that future taxable profits will be generated against which they can be offset. Deferred tax assets are revised periodically and decreased, whenever it is likely that tax losses will not be used.
Deferred taxes are recorded as an income or expense for the year, except where they result from amounts recorded directly under shareholders’ equity, situation in which deferred tax is also recorded under the same caption. Tax benefits attributed to the Group regarding its investment projects are recognised through the income statement as there is sufficient taxable income to allow its use.
TAX BUSINESS GROUPGroup Semapa is subject to the special tax regime for groups of companies, comprising companies in which the shareholding is equal to or more than 75% and which meet the conditions laid down in articles 69, and following of the Corporate Income Tax Code (CIT Code).
Companies included within the consolidation scope of the group of companies subject to this regime, calculate and recognise corporate income tax (CIT) as though they were taxed on an individual basis (Note 11). Liabilities are recognised as due to the dominant entity of the tax business Group, currently Semapa, SGPS, S.A., which is responsible for the Group’s overall clearance and payment of the corporate income tax. Where there are gains on the use of this regime, these are recorded in the dominant entity financial statements.
1.15 INVENTORY
Inventories are valued in accordance with the following criteria:
Goods and raw materials
Goods and raw materials, subsidiary and consumable materials are valued at the lower of their purchase cost or their net realisable value. The purchase cost includes ancillary costs, and it is determined using the weighted average cost as the valuation method.

2018
AN
NU
AL R
EPO
RT
144
*04
Finished products and work in progress
Finished and intermediate products and work in progress are valued at the lower of their production cost (which includes incorporated raw materials, labour and general manufacturing costs, based on a normal production capacity level) or their net realisable value.
The net realisable value corresponds to the estimated selling price, after deducting estimated completion and selling costs. Differences between costs and net realisable value, if lower, are recorded under the caption Inventories consumed and sold.
1.16 RECEIVABLES AND OTHER CURRENT ASSETS
Debtors’ balances and other current assets are initially recorded at fair value and are subsequently measured at their amortised cost, net of impairment losses, so as to state them at their expected net realisable value (Note 24).
Impairment losses are recorded based on the simplified model established in IFRS 9, recognizing the expected losses up to maturity. The expected losses are determined on the basis of the experience of historical actual losses over a statistically significant period and representative of the specific characteristics of the underlying credit risk.
1.17 CASH AND CASH EQUIVALENTS
Cash and cash equivalents includes cash. bank accounts and other short-term investments with an initial maturity of up to 3 months, which can be mobilised immediately without any significant risk in value fluctuations. For cash flow statement purposes, this caption also includes bank overdrafts, which are presented in the statement of financial position as a current liability, under the caption Interest-bearing liabilities.
1.18 SHARE CAPITAL AND TREASURY SHARES
Ordinary shares are classified in shareholder’s equity (Note 26).
Costs directly attributable to the issue of new shares or other equity instruments are reported as a deduction, net of taxes, from the proceeds of the issue.
The cost directly attributable to the issue of new shares options for a business acquisition are included in the acquisition cost, as part of the purchase price.
Treasury shares are recorded at their acquisition amount as a decrease in shareholders’ equity, in the caption Treasury shares, while the gains or losses inherent in their disposal are recorded under Other reserves.
When any Group company acquires shares of the parent company (treasury shares), the payment, which includes directly-attributable incremental costs, is deducted from the shareholders’ equity attributable to the holders of the parent company’s capital until the shares are cancelled, redeemed or sold.
When such shares are subsequently sold or repurchased, any proceeds, net of the directly attributable transaction costs and taxes, is reflected in the shareholders’ equity of the company’s shareholders, under Other reserves.
The extinction of treasury shares is reflected in the consolidated financial statements, as a reduction of share capital and in the caption Treasury shares at its nominal and acquisition cost, respectively. The differential between those amounts is recorded in Other reserves.
1.19 INTEREST-BEARING LIABILITIES
Interest-bearing liabilities are initially recognised at fair value, net of the transaction costs incurred, and are subsequently stated at their amortised cost. Any difference between the amounts received (net of transaction costs) and the repayment amount is recognised in the income statement over the term of the debt, using the effective interest rate method.

2018 ANN
UAL R
EPO
RT
145
*04
Interest-bearing debt is classified as a current liability, except where the Group has an unconditional right to defer the settlement of the liability for at least 12 months after the consolidated statement of financial position date (Note 31).
1.20 BORROWING COSTS
Borrowing costs relating to loans are generally recognised as financial costs, in accordance with the accrual accounting principle (Note 10).
Borrowing costs directly related to the acquisition, construction or production of fixed assets are capitalised when their construction period exceeds one year, and form part of the asset’s cost.
Capitalisation of these charges commences after the start of the asset’s preparation or development activities and ceases when substantially all the activities necessary to prepare the qualifying assets for their intended use or sale are completed, or when the relevant project is suspended or substantially concluded.
Any financial income directly related to a specific investment is deducted from the borrowing costs of the referred asset.
1.21 PROVISIONS
Provisions are recognised whenever the Group has a legal or constructive obligation, as a result of past events, in which it is probable that an outflow of resources will be required to settle the obligation and the amount has been reliably estimated.
Provisions for future operating losses are not recognised. Provisions are reviewed on statement of financial position date and are adjusted so as to reflect the best estimate at that date (Note 30).
The Group incurs expenditure and assumes liabilities of an environmental nature. Accordingly, expenditures on equipment and operating techniques that ensure compliance with applicable legislation and regulations (as well as on the reduction of environmental impacts, to levels that do not exceed those representing a viable application of the best available technologies, on those related to minimizing energy consumption, atmospheric emissions, the production of residues and noise), are capitalised when they are intended to serve the Group’s business in a durable way, as well as those associated with future economic benefits and which serve to prolong life expectancy, increase capacity or improve the safety or efficiency of other assets owned by the Group (Notes 30 and 36).
In addition, under the applicable legislation, some of the companies of the Group are responsible for the environmental and landscape recovery of the quarries affected by the exploration. Rehabilitation works mainly include cleaning and regularisation of areas for reclamation, modelling and preparation of the land, transport and spreading of rejected materials for landfill, fertilisation, execution of the general plan of coating with hydros and plantation, and maintenance and conservation of the areas recovered after implantation.
The extent of the work required and the costs to be incurred were determined based on the quarrying plans and studies prepared by independent entities, and the total liability was measured by the expected value of the future cash flows, discounted to present value.
Value judgments and estimates are involved in the formation of expectations about future activities and the amount and period of time of the associated cash flows. These perspectives are based on the existing environment and current regulations.
2018
AN
NU
AL R
EPO
RT
146
*04
The value of the provision for landscape recovery was initially recognised against the caption Property, plant and equipment and is subsequently increased due to the time effect of the cash, as a contra entry to Interest and similar expenses incurred and consumed by the expenses incurred by each of the Group companies with the recovery, as of the date they occur.
Quarries whose reconstitution is only possible at the closure of operations, the Group has requested independent and specialised entities to quantify those obligations, having for this purpose recognised a provision under the caption Provisions (Note 30).
1.22 PENSIONS AND OTHER POST-EMPLOYMENT BENEFITS
1.22.1 PENSIONS OBLIGATIONS – DEFINED BENEFIT PLANS
Some of the Group’s subsidiaries have assumed the commitment to make payments to their Employees in the form of complementary retirement pensions, disability, early retirement and survivors’ pensions, having constituted defined-benefit plans.
As referred to in Note 29, the Group constituted autonomous Pension Funds as a means of funding a part of the commitments for such payments. According to IAS 19, companies with pension plans recognise the costs with the granting of these benefits as and when the services are rendered by the beneficiary Employees. In this manner, the Group’s total liability is estimated at least every six months at the date of the interim and annual financial statements, for each plan separately by an independent and specialised entity in conformity with the projected unit credit method.
The costs relating to past liabilities, which result from the implementation of a new plan or additional benefits granted, are recognised immediately. The calculated liability is presented in the Consolidated Statement of financial position, after deducting the market value of the funds constituted, under the caption Pensions and other post-employment benefits included in non-current liabilities.
Re-measurement gains and losses resulting from differences between the assumptions used for purposes of calculating the liabilities and what effectively occurred (as well as from changes made thereto and from the difference between the expected amount of the return on the funds’ assets and the actual return) are recognised when incurred directly in the statement of comprehensive income (Note 27).
The net interest corresponds to the application of the discount rate to the value of net responsibilities (value of the responsibilities deducted of fund asset’s fair value) and is recognised under the caption Personnel costs.
The gains and losses generated by a curtailment or settlement of a defined-benefit plan are recognised in the income statement when the curtailment or settlement occurs. A curtailment occurs when there is a material reduction in the number of Employees, or the plan is altered in such a way that the benefits awarded are reduced with a material impact.
1.22.2 PENSION OBLIGATIONS – DEFINED CONTRIBUTION PLANS
Some of the Group’s subsidiaries have assumed commitments, regarding contributing to a defined contribution plan with a percentage of the beneficiaries’ salary, in order to provide retirement, disability and survivors’ pensions.
In order to capitalise those contributions, pension funds were set up, for which Employees can make additional voluntary contributions.
Therefore, the responsibility with these plans corresponds to the contribution made to the funds, based on the percentage of the Employees’ salaries, defined in the respective agreements. These contributions are recognized as a cost in the income statement in the period to which they refer, regardless of the date of the settlement of the liability.

2018 ANN
UAL R
EPO
RT
147
*04
1.22.3 HOLIDAY PAY. ALLOWANCES AND BONUSES
Under the terms of the prevailing legislation, Employees are entitled annually, if hired until 2003, to 25 working days leave (22 days if hired after 2003), as well as to a month’s holiday allowance, entitlement to which is acquired in the year preceding its payment.
According to the current Performance Management System (Sistema de Gestão de Desempenho), Employees have the right to a bonus, based on annually-defined objectives. The entitlement of this bonus is usually acquired in the year preceding its payment.
These liabilities are recorded in the year in which the Employees acquire the respective right, irrespective of the date of payment, whilst the balance payable at the date of the consolidated statement of financial position is shown under the caption Payables and other current liabilities.
The benefits arising from termination of employment are recognised when the Group can no longer withdraw the offer of such benefits or in which the Group recognises the cost of restructuring under the provisions recording. Benefits due over 12 months after the end of the reporting period are discounted to their present value.
1.23 PAYABLES AND OTHER CURRENT LIABILITIES
Trade creditors and current accounts payable are initially recorded at their fair value and subsequently at amortised cost using the effective interest rate method (Note 32).
1.24 NON-CURRENT ASSETS HELD FOR SALE AND DISCONTINUED OPERATIONS
Non-current assets (or discontinued operations) are classified as held for sale, if its value is realisable through a sale transaction rather than through its continuing use.
It is considered that this situation exists only when: (i) the sale is highly probable and the asset is available for immediate sale in its present condition, (ii) the Group has assumed a commitment to sell, and (iii) it is expected that the sale will take place within a period of 12 months. In this case, non-current assets are valued at lower between carrying value and fair value less costs to sell, from the date of classification as held for sale, until the date on which the sale is performed.
From the moment that certain tangible assets are considered as held for sale, depreciation ceases, and the assets are classified as non-current assets held for sale.
Gains or losses on disposals of tangible assets, determined as the difference between the sale price and its net book value, are recorded under the caption Gains and losses on disposals of assets.
1.25 GOVERNMENT GRANTS
Government grants are recognised at their fair value and only when there is a reasonable assurance that the grant will be received and the group will comply with all required conditions. Government grants related to operating costs are deferred and recognised in the income statement over the period that matches the costs with the compensating grants.
Grants related to biological assets carried at fair value, in accordance with IAS 41, are recognised in the income statement when the terms and conditions of the grant are met.
Government grants that the Group receives to compensate its capital expenditures are reported under the caption Payables and other current liabilities and are recognised in the income statement, during the estimated useful life of the granted asset, by deducting the value of its amortisation.

2018
AN
NU
AL R
EPO
RT
148
*04
1.26 LEASES
Property, plant and equipment acquired under leasing contracts, as well as the corresponding liabilities, are recorded using the financial method. According to this method, the asset’s cost is recorded in property, plant and equipment and the corresponding liability is recognized, under the caption Interest — bearing liabilities — financial leases, while the interest included in the instalments and the asset’s depreciation, calculated as described in Note 1.8, are recorded as costs in the income statement of the period to which they relate.
Leases, under which a significant part of the risks and benefits of the property is assumed by the lessor, with the Group being the lessee, are classified as operating leases. Payments made under operating leases, net of any incentives received by the lessee, are recorded in the income statement during the period of the lease (Note 39).
LEASES INCLUDED IN CONTRACTS ACCORDING TO IFRIC 4The Group recognises an operating or financial lease, whenever it enters into an agreement, encompassing a transaction or a series of related transactions which, even if not in the legal form of a lease, transfers a right to use an asset in return for a payment or a series of payments (Note 17).
1.27 DIVIDENDS DISTRIBUTION
The distribution of dividends to shareholders is recognised as a liability in the Group’s financial statements in the year in which the dividends are approved by the shareholders and up until the time of their payment.
1.28 REVENUE
Income derived from sales of goods or services rendered is recognized in the statement of consolidated income in accordance with the principles established by IFRS 15. Revenue shall reflect the transfer of goods and services contracted to customers, for the amount corresponding that the entity expects to receive as consideration for the delivery of those goods or services, based on a model that includes 5 phases: (i) identification of a contract with a customer; (ii) identification of performance obligations; (iii) determination of a transaction price; (iv) transaction price allocation and (v) revenue recognition.
1.29 ACCRUAL ACCOUNTING PRINCIPLE
Interest received is recognised in accordance with the principle of accrual accounting, taking into consideration the amount of debt and the effective rate of interest, during the period to maturity.
The Group companies record their costs and income in accordance with the accrual accounting principle, in terms of which costs and income are recognised as and when generated, regardless of the moment in which they are received or paid. The differences between the amounts received and paid and the respective costs and income are recognised in the Receivables and other current assets and Payables and other current liabilities headings (Notes 24 and 32, respectively).
1.30 CONTINGENT ASSETS AND LIABILITIES
Contingent liabilities where the probability of an outflow of funds affecting future economic benefits is only probable, are not recognised in the consolidated financial statements, and are disclosed in the notes, unless the probability of the outflow of funds affecting future economic benefits is remote, in which case they are not disclosed.
Provisions are recognised for liabilities which meet the conditions described in Note 1.21.
Contingent assets are not recognised in the consolidated financial statements but are disclosed in the notes when it is probable that a future economic benefit will arise from them (Note 41).

2018 ANN
UAL R
EPO
RT
149
*04
1.31 FAIR VALUE
Financial Assets and Liabilities measured at fair value are classified according to the following levels of fair value hierarchy:
• Level 1: fair value of financial assets and liabilities based on active markets quotations, at the reference date of the consolidated financial position;
• Level 2: the fair value of financial assets and liabilities is not determined based on active market quotations, but rather using valuation models. The main inputs of the models used are observable in the market; and
• Level 3: the fair value of financial assets and liabilities is not determined based on active market quotations, but rather using valuation models, whose main inputs are not observable in the market.
1.32 EARNINGS PER SHARE
The basic earnings per share are determined based on the division of profits or losses attributable to the ordinary shareholders of the Company/Group by the weighted average number of common shares outstanding during the period.
For the purpose of calculating diluted earnings per share, the Company/Group adjusts the profits or losses attributable to ordinary equity holders, as well as the weighted average number of outstanding shares for the purposes of all potential dilutive common shares.
1.33 SUBSEQUENT EVENTS
Events occurring after the date of the consolidated statement of financial position, which provide additional information on conditions prevailing at the date of the statement of financial position are reflected in the consolidated financial statements.
Subsequent events, which provide information about conditions, which occur after the consolidated statement of financial position date are disclosed in the notes to the consolidated financial statements, if material (Note 44).

2018
AN
NU
AL R
EPO
RT
150
*04
1.34 NEW STANDARDS. CHANGES AND INTERPRETATION TO THE EXISTING STANDARDS
There are new standards and changes and interpretations to existing standards, whose application is only mandatory for annual periods, beginning on or after 1 January 2018, These changes and interpretations are detailed as follows:
Description Changes Effective Date*
1. Standards (new and amended) and interpretations that become effective on or after 1 January 2019. already endorsed by the EU
1.1 STANDARDS
IFRS 16 - Leases New lease definition. New accounting of lease agreements for lessees. There are no changes to the accounting of rentals by lessors. 1 January 2019
IFRS 9 – Financial Instruments Accounting treatment options for financial assets with negative compensation. 1 January 2019
1.2 - INTERPRETATIONS
IFRIC 23 – Uncertainties about treatment of income tax
Clarification on the application of the principles of recognition and measurement of IAS 12 when there is uncertainty about the tax treatment of a transaction, concerning income tax. 1 January 2019
2. Standards (new and amended) and interpretations that become effective on or after 1 January 2019. not yet endorsed by the EU
IAS 28 – Investments in associate and joint ventures
Clarification regarding long-term investments in associates and joint ventures that are not being measured using the equity method. 1 January 2019
Improvement to standards 2015 – 2017 Several clarifications: IAS 23, IAS 12, IFRS 3 and IFRS 11 1 January 2019
IFRS 17 – Insurance Contracts New accounting for insurance contracts, reinsurance contracts and investment contracts with discretionary participation characteristics. 1 January 2021
* Periods beginning on or after
The Group will adopt the new standards in the years in which they become of effective implementation. Up to the date of issuing this report, the Group is still assessing the effects on the consolidated financial statements arising from the adoption of these standards.
With regard to the adoption of IFRS 9 and IFRS 15. effective for periods beginning on or after 1 January 2018, the expected impacts were as follows:
IFRS 9 IFRS 9, adopted via Commission Regulation (EU) No, 2067/2016 of 22 November 2016, includes three distinct areas: classification and measurement of financial instruments, impairment of financial assets and hedge accounting.These areas can be detailed as follows:
(a) Classification and measurement
IFRS 9 states that the classification and measurement of financial assets is based on the business model adopted for managing the assets and on the characteristics of the contractual cash flows. To this effect, financial assets are measured at amortised cost if held to collect contractual cash flows. Other financial assets are measured at fair value through other comprehensive income (if there is also an intention to sell the assets) or through profit or loss (if not inserted in any previous business model, for example, if managed based on their fair value).
The classification and measurement of financial liabilities, considering that the changes introduced in relation to the provisions of IAS 39 are not significant, there were no significant impacts on the financial position or equity arising from the application of the classification and measurement requirements of IFRS 9. The Group continues measuring at fair value almost all financial assets previously measured at fair value.

2018 ANN
UAL R
EPO
RT
151
*04
(b) Impairment
IFRS 9 establishes a new asset impairment model based on “expected credit losses”, which replaces the current “incurred losses” model followed in IAS 39. Consequently, it will no longer be necessary for a loss event to occur in order for impairment to be recognised, The new model accelerates the recognition of impairment losses in debt instruments measured at amortised cost or fair value through other comprehensive income (including loans, bank deposits, receivables and debt securities). In case the credit risk of a financial asset has not significantly increased since its initial recognition, accumulated impairment losses equal to the losses expected to occur over the following 12 months must be recognised.
In case credit risk has increased significantly, accumulated impairment losses must be recognised in the amount of expected losses until asset maturity. Once a loss event (objective evidence of impairment) has taken place, accumulated impairment losses are directly allocated to the asset, being the accounting treatment similar to that of IAS 39, including the treatment of interest.
The Standard also allows the application of a simplified approach for financial assets that meet the specified requirements. In this case, impairment loss is measured at initial recognition for an amount matching the expected losses during the entire life of the asset.
(c) Hedge accounting
IFRS 9 introduced new requirements for hedge accounting, more aligned with the principles of risk management. The new requirements also establish a more principle-based approach to hedge accounting, solving some issues in the IAS 39 hedging model. According to IFRS 9, the Group chose to continue to apply the hedge accounting requirements of IAS 39 until there is greater visibility of the current macro-hedging project.
IFRS 9 is applicable in periods beginning on or after 1 January 2018. Except for hedge accounting, retrospective application is mandatory, although without the need for disclosure of comparative information. For hedge accounting, requirements are generally applied prospectively, with some exceptions.
The Group adopted this Standard on 1 January 2018 and did not restate comparative information, as permitted by the Standard. In general, the adoption of this Standard did not have any significant impacts on the consolidated Statement of financial position. The changes introduced by the standard are described below:
a) Classification and measurement – Financial assets at fair value through profit or loss and available-for-sale financial assets are now designated Equity instruments, without changes in their measurement;
b) Impairment – With the application of the new impairment model, Cash and cash equivalents register a negative adjustment related to the transition, in the amount of EUR 2,053,515 (Note 31);
c) Impairment - With the application of the new impairment model, Receivables and other current assets register a negative adjustment related to the transition, in the amount of EUR 961,724 (Note 22).
IFRS 15The International Accounting Standards Board (IASB) issued IFRS 15 – Revenue from Contracts with Customers on 28 May 2014. The Standard was amended in April 2016 (in accordance with European Commission Regulation No. 1905/2016 of 22 September 2016). This standard replaces the previous requirements for recognition of revenue and has become mandatory for periods beginning on or after 1 January 2018.
The Group adopted IFRS 15 using the modified retrospective approach. through which the cumulative effect of adopting the Standard is recognised at the initial application date (1 January 2018). Accordingly, the qualitative changes are disclosed in the accounting policies, as referred to in Notes 1.16 and 1.28.

2018
AN
NU
AL R
EPO
RT
152
*04
IFRS 16Regarding the adoption of IFRS 16. which is effective for periods beginning on 1 January 2019, the expected impacts are as follows:
i) Nature of the changeIn January 2016, the International Accounting Standards Board (IASB) issued IFRS 16 – Leases. which is effective for annual reporting periods beginning on or after 1 January 2019.
IFRS 16 defines the principles for recognising, measuring and presenting leases, replacing IAS 17 – Leases and its interpretative guidance. The main objective is to ensure that lessors and lessees report useful information to the users of the financial statements, especially regarding the effect that leases have on financial positions, financial performance and cash flows.
The main aspects covered by IFRS 16 are:
• Addition of some considerations in order to distinguish leases from service agreements, based on the existence of control over an asset at the time it becomes available for use;
• Introduction of a unique accounting model that requires the lessee to recognise the assets and liabilities for all leases with a duration longer than 12 months (except for leases of assets with a limited amount). The lessee shall recognise the right to use the respective asset and the liability associated with the payments to be made, and also recognise the financial costs and the depreciation separately; and
• Difference between the total amount paid between capital and interest (presented as financing activities) in the consolidated statement of cash flows.
In accordance with IFRS 16, rights-of-use assets will be tested for impairment in accordance with IAS 36 - Impairment of Assets. This treatment will replace the previous requirement for recognition of a provision for onerous lease contracts.
ii) ImpactSemapa has already performed the inventory of existing leases, considering the provisions of IFRS 16. The standard will mainly affect the accounting of the Group’s operating leases.
The Group has assessed the practical case of the transition to IFRS 16 from not reassessing whether a contract is or contains a lease, having made an overall assessment of the new definition and evaluating the totality of contracts it has executed or modified before 1 January 2019.
The change in the lease definition essentially concerns the concept of control. IFRS 16 distinguishes lease services on based of whether or not there is control over the customer’s use of an identifiable asset. Control is considered to exist if the customer has, cumulatively:
• The right to obtain substantially all economic benefits from the use of a specific identified asset; and
• The right to direct the use of this specific asset.
The Group shall apply the lease definition established in IFRS 16 and its applicable guidance to all lease agreements in which has entered into as lessor or lessee, including all agreements on or after 1 January 2019.
The Group has developed an implementation project in the preparation for the first application of IFRS 16. The project has demonstrated that the new lease definition will not significantly change the scope of contracts that meet the lease definition for the Group.

2018 ANN
UAL R
EPO
RT
153
*04
At the balance sheet date, the Semapa Group has non-cancellable operating lease commitments in the amount of EUR 74 million. From these commitments, approximately EUR 4.5 million correspond to short-term leases and EUR 106 thousand to low value leases, which will both be recognized on a straight-line basis as expenses in the income statement.
For the remaining lease commitments, as at 1 January 2019. the Company expects to recognise assets under right of use of approximately EUR 70 million and a corresponding lease liability in the same amount.
The Company’s activities as lessor are not material and, therefore, the Company does not expect significant impacts on its financial statements.
iii) Adoption date
Semapa will apply the standard from the date of mandatory adoption on 1 January 2019. The Company intends to apply the simplified transition approach set forth in its paragraphs (IFRS 16: C3(b). C7 and C8) and will not restate the comparative amounts for the period prior to the first adoption. Assets under right of use will be measured by the amount of the lease liability on the date of adoption of the standard.
2 RISK MANAGEMENTAs an economic agent, Semapa is exposed to risks inherent to its activity, which can have a decisive impact on the value of its assets. The performance of Semapa as a holding company is also closely linked to the results of its subsidiaries.
Notwithstanding the objectives and levels of results defined, Semapa promotes autonomy and accountability among its subsidiaries. This combination of demand and autonomy is reflected in the exposure to a set of risks that impact not only each of its subsidiaries, but can also spread to the Holding and other companies in the group.
Regarding risk management, during 2018, Semapa undertook a restructuring of its risk management and control systems based on best practices and methodological references such as COSO, ISO 31000 and follow-up to the recommendations of the Code of Corporate Governance (Código de Governo das Sociedades) issued by the Instituto Português de Corporate Governance (IPCG) and the Portuguese Securities Market Commission (CMVM).
2.1 FINANCIAL RISK FACTORS
Semapa, as a holding company develops direct and indirect managing activities over its subsidiaries. Therefore the fulfilment of the assumed obligations depends on the cash flow generated by its subsidiaries. Thus, the company depends on the eventual dividends distribution by subsidiaries, interests’ payment, loans reimbursement and other cash-flows generated by those companies.
The ability of Semapa subsidiaries to make funds available will depend, partly, of their ability to generate positive cash flows and, on the other hand, of the respective earnings, available reserves and financial structure.
The Semapa group has a risk-management program, which focuses its analysis on the financial markets with a view to mitigate the potential adverse effects on the Semapa Group’s financial performance. Risk management is undertaken by Financial Management of the holding and main subsidiaries, in accordance with the policies approved by the Board of Directors and monitored by the Risks and Control Commission.

2018
AN
NU
AL R
EPO
RT
154
*04
2.1.1 CURRENCY RISK
Variations in the euro’s exchange rate against other currencies can affect the Group’s revenue in a number of ways.
Regarding the Pulp and Paper segment, a significant portion of its sales is denominated in currencies other than Euro. Thus, its development could have a significant impact on future sales of the Group, mainly regarding USD exposure. Also sales in Sterling Pound (GBP), Polish Zloty (PLN) and Swiss Franc (CHF) have some expression, as sales in other currencies are less significant.
Purchases of certain raw materials are made in USD, particularly the share of imports of wood pulp and softwood; therefore variations in this currency may have an impact on acquisition values.
Furthermore, once a sale is made in a currency other than in Euro, the Group takes on an exchange risk up to the time it receives the proceeds of that sale, if no hedging instruments are in place. Therefore, the Group is permanently exposed to currency risk trough a significant amount of receivables and albeit with lesser significance payables. This segment also includes subsidiaries located in Poland, Mozambique and the USA, though the currency variation in these countries may impact the consolidated Statement of financial position of Semapa.
The currency risk inherent to the segment of Cement and derivatives is mainly due to the current investments held in Brazil and to the purchases of fuel and freight ships, both paid in USD. This segment continued its policy of maximizing the potential of covering their foreign exchange exposure, through compensating the exchange flows internally. This segment also comprises assets located in Tunisia, Angola and Lebanon, therefore any change in these countries’ exchange rates could have an impact on Semapa’s consolidated statement of financial position.
For the flows that are not compensated naturally, the risk has been assessed and covered by contracting structures of exchange options, which set the limit for the amount to pay, while it benefits from a favourable evolution in the exchange rate.
Occasionally, when considered appropriate, the Group manages foreign exchange risks through the use of derivative financial instruments, in accordance with a policy that is subject to periodic review, the prime purpose of which is to limit the exchange risk associated with future sales and purchases and accounts receivable and payables, which are denominated in currencies other than the Euro.

2018 ANN
UAL R
EPO
RT
155
*04
The Group’s exposure to foreign exchange rate risk as of 31 December 2018 and 2017, based on the financial assets and liabilities included in the consolidated Statement of financial position, converted at the exchange rate as of that date (Note 42), and respective sensitivity analysis to positive and negative changes of 10% in the reference interest rate, is detailed as follows:
Amounts in Foreign Currency American
Dollar Sterling
Pound Polish
Zloti Swedish
Krone Turkish
Lira Swiss Franc
DanishKrone
BrazilianReal
As of 31 December 2018
Assets
Cash and cash equivalents 77 050 559 203 115 150 629 - 72 972 3 113 - 45 545 321
Receivables 99 611 030 12 485 563 4 433 932 - - 1 710 970 - 32 476 239
Other assets 1 667 314 - - - - - - 5 576 406
Total financial assets 178 328 903 12 688 678 4 584 561 - 72 972 1 714 083 - 83 597 966
Liabilities
Interest-bearing liabilities (18 374 811) - - - - - - (454 212 549)
Payables (23 711 106) (77 901) - (25 040) - (45 617) - (4 984 966)
Total financial liabilities (42 085 917) (77 901) - (25 040) - (45 617) - (459 197 515)
Net financial position in foreign currency 136 242 986 12 610 777 4 584 561 (25 040) 72 972 1 668 466 - (375 599 549)
Net financial position in EUR 118 989 507 14 097 657 1 065 830 (2 442) 12 044 1 480 580 - (84 626 895)
Impact of +10% in the foreign exchange rate (10 817 228) (1 281 605) (96 894) 222 (1 095) (134 598) - 7 693 354
Impact of -10% in the foreign exchange rate 13 221 056 1 566 406 118 426 (271) 1 338 164 509 - (9 402 988)
As of 31 December 2017
Total financial assets 170 427 450 259 897 6 861 583 686 323 46 713 1 668 259 144 607 54 221 762
Total financial liabilities (31 486 412) - (4 044) (39 246) (2 808) (66 538) - (474 802 822)
Net financial position in foreign currency 138 941 037 259 897 6 857 538 647 077 43 904 1 601 721 144 607 (420 581 060)
Net financial position in EUR 115 851 778 292 931 1 641 738 65 734 9 657 1 368 758 19 424 (105 985 198)
Impact of +10% in the foreign exchange rate (10 531 980) (26 630) (149 249) (5 976) (878) (124 433) (1 766) 9 635 018
Impact of -10% in the foreign exchange rate 12 872 420 32 548 182 415 7 304 1 073 152 084 2 158 (11 776 133)
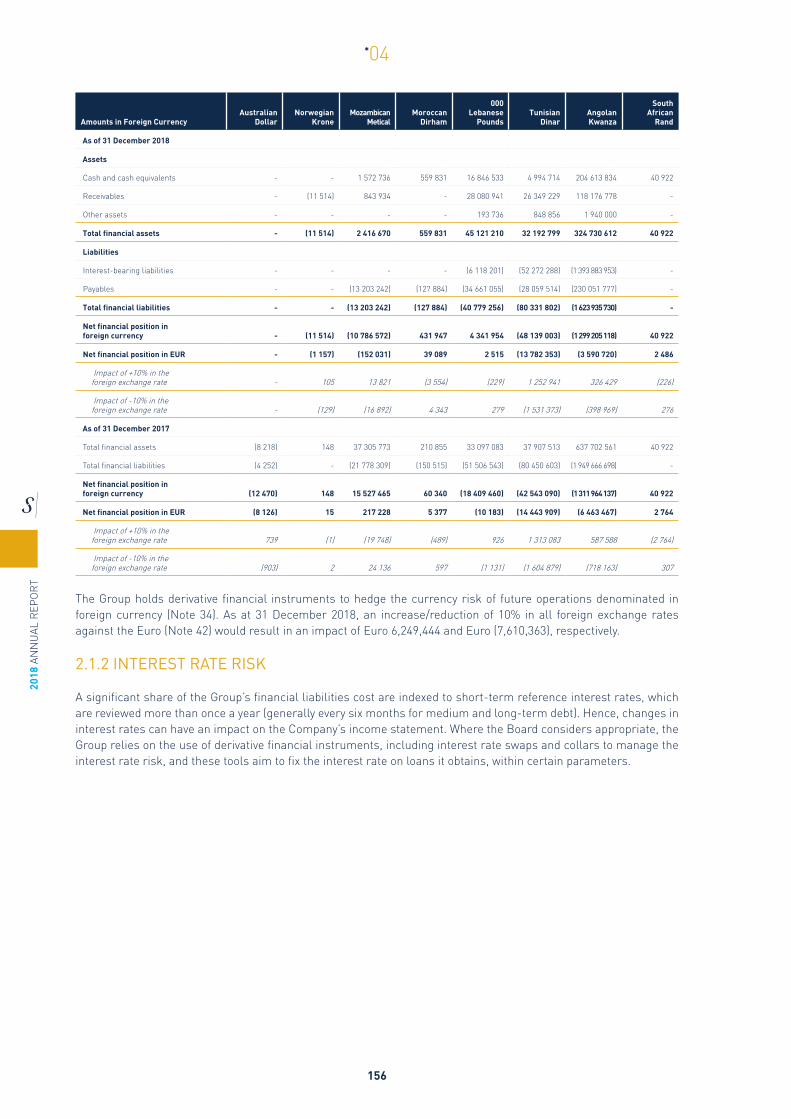
2018
AN
NU
AL R
EPO
RT
156
*04
Amounts in Foreign Currency Australian
Dollar Norwegian
Krone Mozambican
Metical Moroccan
Dirham
000 Lebanese
Pounds Tunisian
Dinar Angolan Kwanza
South African
Rand
As of 31 December 2018
Assets
Cash and cash equivalents - - 1 572 736 559 831 16 846 533 4 994 714 204 613 834 40 922
Receivables - (11 514) 843 934 - 28 080 941 26 349 229 118 176 778 -
Other assets - - - - 193 736 848 856 1 940 000 -
Total financial assets - (11 514) 2 416 670 559 831 45 121 210 32 192 799 324 730 612 40 922
Liabilities
Interest-bearing liabilities - - - - (6 118 201) (52 272 288) (1 393 883 953) -
Payables - - (13 203 242) (127 884) (34 661 055) (28 059 514) (230 051 777) -
Total financial liabilities - - (13 203 242) (127 884) (40 779 256) (80 331 802) (1 623 935 730) -
Net financial position in foreign currency - (11 514) (10 786 572) 431 947 4 341 954 (48 139 003) (1 299 205 118) 40 922
Net financial position in EUR - (1 157) (152 031) 39 089 2 515 (13 782 353) (3 590 720) 2 486
Impact of +10% in the foreign exchange rate - 105 13 821 (3 554) (229) 1 252 941 326 429 (226)
Impact of -10% in the foreign exchange rate - (129) (16 892) 4 343 279 (1 531 373) (398 969) 276
As of 31 December 2017
Total financial assets (8 218) 148 37 305 773 210 855 33 097 083 37 907 513 637 702 561 40 922
Total financial liabilities (4 252) - (21 778 309) (150 515) (51 506 543) (80 450 603) (1 949 666 698) -
Net financial position in foreign currency (12 470) 148 15 527 465 60 340 (18 409 460) (42 543 090) (1 311 964 137) 40 922
Net financial position in EUR (8 126) 15 217 228 5 377 (10 183) (14 443 909) (6 463 467) 2 764
Impact of +10% in the foreign exchange rate 739 (1) (19 748) (489) 926 1 313 083 587 588 (2 764)
Impact of -10% in the foreign exchange rate (903) 2 24 136 597 (1 131) (1 604 879) (718 163) 307
The Group holds derivative financial instruments to hedge the currency risk of future operations denominated in foreign currency (Note 34). As at 31 December 2018, an increase/reduction of 10% in all foreign exchange rates against the Euro (Note 42) would result in an impact of Euro 6,249,444 and Euro (7,610,363), respectively.
2.1.2 INTEREST RATE RISK
A significant share of the Group’s financial liabilities cost are indexed to short-term reference interest rates, which are reviewed more than once a year (generally every six months for medium and long-term debt). Hence, changes in interest rates can have an impact on the Company’s income statement. Where the Board considers appropriate, the Group relies on the use of derivative financial instruments, including interest rate swaps and collars to manage the interest rate risk, and these tools aim to fix the interest rate on loans it obtains, within certain parameters.

2018 ANN
UAL R
EPO
RT
157
*04
As of 31 December 2018 and 2017, the development of the financial assets and liabilities with interest rate exposure, taking in consideration the maturities and the next repricing date was as follows:
Amounts in Euro Up to 1 month 1-3 months 3-12 months 1-5 years + 5 years Total
As of 31 December 2018
Assets
Non-current
Other non-current assets - - - - - -
Current
Cash equivalents 153 017 689 30 032 472 1 686 845 495 037 - 185 232 043
Total financial assets 153 017 689 30 032 472 1 686 845 495 037 - 185 232 043
Liabilities
Non-current
Interest bearing liabilities 130 300 000 - 80 000 000 1 169 597 228 26 914 730 1 406 811 958
Other liabilities - - - - - -
Current
Interest bearing liabilities 59 045 215 106 054 000 170 131 124 - - 335 230 339
Total financial liabilities 189 345 215 106 054 000 250 131 124 1 169 597 228 26 914 730 1 742 042 297
Difference (36 327 526) (76 021 528) (248 444 279) (1 169 102 191) (26 914 730) (1 556 810 254)
Amounts in Euro Up to 1 month 1-3 months 3-12 months 1-5 years + 5 years Total
As of 31 December 2017
Assets
Non-current
Other non-current assets - - - - - -
Current
Cash equivalents 169 567 627 31 181 859 41 463 697 974 078 - 243 187 261
Total financial assets 169 567 627 31 181 859 41 463 697 974 078 - 243 187 261
Liabilities
Non-current
Interest bearing liabilities 320 823 366 32 092 653 237 038 398 705 999 367 365 447 356 1 661 401 140
Other liabilities - - - - - -
Current
Interest bearing liabilities 61 697 118 52 909 963 135 424 442 14 773 859 - 264 805 382
Total financial liabilities 382 520 484 85 002 616 372 462 840 720 773 226 365 447 356 1 926 206 522
Difference (212 952 857) (53 820 757) (330 999 143) (719 799 148) (365 447 356) (1 683 019 261)
Semapa uses the sensibility analysis technique to measure impacts on the income statement and equity of increase or decrease on interest rates maintaining the other variables constant. This analysis is only for theoretical reasons, since changes in interest rates rarely occur in isolation from changes in other market factors.
The sensitivity analysis is based on the following assumptions:
i) Changes in market interest rates affect interest income and expenses arising from financial instruments subject
to floating rates;
ii) Changes in market interest rates only lead to interest income and expenses regarding fixed rate financial instru-
ments if those are measured at their fair value;
iii) Changes in market interest rates affect the fair value of derivative financial instruments as well as other finan-
cial assets or liabilities;
iv) Changes in fair value of derivative financial instruments and other financial assets and liabilities are measured
using the discounted cash flows method, with market interest rates at year end.

2018
AN
NU
AL R
EPO
RT
158
*04
A 0.50% increase in market interest rates for all currencies on which interest on loans are calculated and for derivative financial instruments, as at 31 December 2018, would have an impact on its profit before tax of approximately Euro 5,095,274 and an increase in equity (before tax) of Euro 192,144.
2.1.3 CREDIT RISK
The Group is exposed to credit risk in the credit it grants to its customers and, accordingly, it has adopted a policy of managing such risk within present limits, by serving insurance policies with a specialised independent company. The deterioration in global economic conditions or adverse situations, which only affect economies at the local level, could give rise to situations in which customers are unable to meet their commitments.
Until 31 December 2017, impairment of accounts receivable was assessed based on the incurred loss model. Amounts receivable considered uncollectible were considered immediately impaired. Other receivables were evaluated collectively in order to determine whether there was objective evidence that a loss in value could occur, with estimated impairment losses being recorded for these losses.
From 1 January 2018, the Group assesses, on a prospective basis, the expected credit losses associated with its financial assets measured at amortised cost and at fair value through other comprehensive income, in accordance with IFRS 9.
On this basis, the Group recognises expected credit losses throughout the lifetime of financial instruments that have been subject to significant increases in credit risk since its initial recognition, assessed either individually or collectively, considering all reasonable and sustainable information, including available prospective information.
If, at the reporting date, the credit risk associated with a financial instrument has not increased significantly since its initial recognition, the Group measures the impairment of that financial instrument by an amount equivalent to the expected credit losses within 12 months.
IFRS 9 provides that for the calculation of these impairments, one of two models is used: the 3-step method or the use of a matrix, the distinguishing component being the existence or not of a significant financing component. For the Group’s financial assets, since it is not a financial institution and there are no assets that have a significant financing component, the use of a matrix was chosen.
The model adopted for the impairment assessment in accordance with IFRS 9 is as follows:
i) Calculate the total credit sales made by the Group over the last 12 months, as well as the total amount of bad debts relating to them;
ii) Determine the customers’ payment profile, by setting buckets of receipt frequency;
iii) Based on 1 and 2 above, estimate the probability of default (i.e., the amount of bad debts calculated at 1 com-pared to the balance of outstanding sales in each bucket calculated at 2);
iv) Adjust the percentages of future projections obtained in 3;
v) Apply the default percentages as calculated in 4 to the balances of customers still outstanding at the reporting
date.
It is considered as default the payments after a delay of 180 days or more, resulting from the experience of actual historical losses over the period considered statistically relevant.
Additionally, the model considers any deductibles paid by the Group’s companies in the event of an accident in contracted credit insurers.
Therefore, and as of 31 December 2018, the total amount of receivables on which there is a risk of recoverability In accordance with IFRS 9 amounts to EUR 1,464,328 (Note 22).

2018 ANN
UAL R
EPO
RT
159
*04
The Group recognizes impairment on a case-by-case basis, based on specific balances and specific past events, considering the historical information of the counterparties, their risk profile and other observable data in order to assess whether there are objective indicators of impairment for these financial assets.
As of 31 December 2018 and 2017, Trade receivables showed the following ageing structure, considering the due dates for the open balances, before impairment charges:
Amounts in Euro Pulp and
paperCement and derivatives Environment
Total
31/12/2018 31/12/2017
Not overdue 198 560 226 38 893 401 3 313 409 240 767 036 208 062 684
1 to 90 days 26 801 894 17 512 128 3 060 458 47 374 480 29 360 563
91 to 180 days 355 819 2 448 184 662 651 3 466 654 5 736 334
181 to 360 days 73 170 2 185 702 368 624 2 627 496 2 730 143
361 to 540 days 3 926 1 281 346 403 262 1 688 534 1 086 074
541 to 720 days 4 589 754 136 114 227 872 952 718 479
more than 721 days 3 500 10 334 841 627 598 10 965 939 12 851 866
225 803 124 73 409 738 8 550 229 307 763 091 260 546 143
Litigation - doubtful debts 1 242 062 12 085 959 - 13 328 021 15 314 232
Impairments (Note 22) (1 242 062) (25 802 328) (210 960) (27 255 350) (29 984 062)
Trade receivables balance (Note 24) 225 803 124 59 693 369 8 339 269 293 835 762 245 876 313
The amounts shown above correspond to the amounts outstanding according to the contracted due dates. Despite some delays in the settlement of those amounts, that does not result, in accordance with the available information, in the identification of impairment losses other than the ones considered through the respective losses.
The ageing analysis of receivables already overdue is as follows:
Amounts in Euro
31/12/2018 31/12/2017
Gross amount
Fair value of credit
insurance Gross
amount
Fair value of credit
insurance
Accounts receivables overdue but not impaired
Overdue - less than 3 months 47 305 101 26 900 406 29 360 021 14 096 427
Overdue - more than 3 months 5 821 361 578 947 8 619 462 626 183
53 126 462 27 479 353 37 979 483 14 722 610
Accounts receivable overdue and impaired
Overdue - less than 3 months 69 378 - 166 396 -
Overdue - more than 3 months 27 185 972 - 29 817 666 -
27 255 350 - 29 984 062 -
In accordance with the above-mentioned, it should be noted that the Group adopted a policy of credit insurance for a significant part of the accounts receivable from costumers. Thus, it is considered that the effective Group’s exposure to the credit risk has been mitigated and is within acceptable levels.

2018
AN
NU
AL R
EPO
RT
160
*04
The table below represents the quality of the Group’s credit risk, as of 31 December 2018 and 2017, for financial assets (Cash and cash equivalents and Derivative financial instruments), whose counterparts are financial institutions:
Amounts in Euro 31/12/2018 31/12/2017
AA 180 402 -
AA- 20 182 842 25 902 715
A+ 151 506 -
A 24 997 663 1 353 238
A- 1 206 540 31 198 487
BBB+ 30 450 379 697 593
BBB 2 786 31 480
BBB- 3 951 222 66 307 520
BB+ 2 085 911 18 791
BB 4 222 692 355 203
BB- 10 262 679 12 176 062
B+ 5 471 937
B 601 805 -
B- 32 025 283 41 408 720
CCC+ 14 766 244 -
Other 37 966 485 63 092 165
183 059 910 242 542 911
The caption Others comprise short-term investments in Angola and Mozambique financial institutions, relatively to which it was not possible to obtain the ratings with reference to the presented dates.
The maximum exposure to the credit risk as at 31 December 2018 and 2017 is detailed in the following schedule:
Amounts in Euro 31/12/2018 31/12/2017
Non-current
Equity instruments (Note 21) 1 450 919 424 428
Other non-current assets 67 645 781 6 244 448
Current
Receivables and other current assets (Note 24) 389 281 591 317 627 212
Derivative financial instruments (Note 24) 1 722 253 4 571 589
Cash and cash equivalents 183 059 910 242 542 911
643 160 454 571 410 588
2.1.4 LIQUIDITY RISK
The Group manages liquidity risk in two ways: ensuring that its interest-bearing debt has a large medium and long-term component with maturities in harmony with the characteristics of the industry in which it operates, and having access to credit facilities available at any moment, assuring the adequate liquidity.

2018 ANN
UAL R
EPO
RT
161
*04
The liquidity of the agreed financial liabilities will generate the following undiscounted cash flows, including interests until maturity as of the consolidated statement of financial position date:
Amounts in Euro Below 1
month 1 to 3 months 3 to 12 months 1 to 5 years
Above 5 years Total
As of 31 December 2018
Liabilities
Interest-bearing liabilities
Bond loans 689 000 2 295 379 166 837 270 797 311 135 - 967 132 784
Commercial paper 104 840 100 738 966 4 987 287 469 178 954 - 575 010 047
Bank loans 10 397 187 7 645 833 69 263 984 185 964 987 20 364 621 293 636 613
Financial leases 13 073 26 149 482 884 2 790 595 460 328 3 773 029
Other liabilities 4 132 787 - - - - 4 132 787
Derivatives financial instruments - 851 996 1 391 026 7 124 649 - 9 367 671
Accounts payable and other liabilities 158 996 057 16 888 775 24 753 635 26 485 697 - 227 124 164
Total liabilities 174 332 944 128 447 098 267 716 087 1 488 856 017 20 824 949 2 080 177 095
As of 31 December 2017
Liabilities
Interest-bearing liabilities
Bond loans 689 000 3 411 500 19 093 526 639 747 072 315 407 966 978 349 064
Commercial paper 204 083 1 399 545 63 159 081 537 352 127 20 227 444 622 342 280
Bank loans 16 122 523 63 240 447 137 762 340 195 178 741 57 222 339 469 526 390
Financial leases 69 144 138 291 787 874 1 208 226 721 174 2 924 709
Other liabilities - - - - - -
Derivatives financial instruments - 487 034 181 284 - - 668 318
Accounts payable and other liabilities 122 876 427 44 052 687 - 5 590 834 - 172 519 948
Total liabilities 139 961 177 112 729 504 220 984 104 1 379 077 000 393 578 923 2 246 330 709
As of 31 December 2018 and 2017, bank loans granted and not withdrawn amount to EUR 666,794,998 and EUR 708,232,606 respectively.
2.1.5 CAPITAL RISK
The objectives of Semapa Group, when managing capital, are to safeguard the Group´s ability to continue as a going concern and value creation for shareholders, through a conservative dividend policy based on principles of financial strength. The aim has been to maintain a financial structure compatible with the Group´s sustained growth and different business areas, whilst maintaining sound solvency and financial autonomy indicators. Accordingly, capital for the purposes of capital management corresponds to the shareholders equity and it is not considered any financial liability as an integral part thereof.
2.2 OPERATIONAL RISK FACTORS
2.2.1 RISKS RELATING TO THE PULP AND PAPER SEGMENTS
RISK RELATED TO THE FORESTRY SECTOROn 31 December 2018, the Navigator Group managed approximately 110 thousand hectares distributed in mainland Portugal and the Azores in about 1,300 Management Units in 165 municipalities, in accordance with the principles stated in its Forestry Policy. Eucalyptus and areas under ongoing afforestation with these sort of species occupy 75% of this area, namely the Eucalyptus globulus species, deemed to have the perfect fibre for high-quality papers. For the remainder and in addition to conservation areas that account for about 10% of the total area under management, pine and cork oak forests are among the largest privately owned national producers.

2018
AN
NU
AL R
EPO
RT
162
*04
The Group was allocated with 356,210 hectares located in Mozambique, in the provinces of Manica and Zambezia, made available under an Investment Agreement signed with the Mozambican Government, of which approximately 13,6 thousand hectares are planted. The agreement also provides for the construction of an industrial BEKP production unit meant for the production of BEKP pulp and generation of electric energy in that country. In July 2018, the Mozambican Government and Portucel Mozambique signed a Memorandum of Understanding through which they agreed on a set of preceding requirements necessary for the progress of the investment, which will be developed in two phases. At first, a forestry base of approximately 40,000 hectares will be created, which will guarantee the supply of a unit (to be built) for the production of eucalyptus wood chips for export (approximately 1 million tons per year), in an estimated global investment of USD 140 million.
The main forestry areas under the Group’s management are certified by FSC® (Forest Stewardship Council) and by PEFC (Programme for the Endorsement of Forest Certification schemes), ensuring an environmental, economic and socially responsible forestry management that follows a strict and internationally recognised criteria.
The main risk factor threatening the eucalyptus forests lies in the low productivity of Portuguese forest and in the worldwide demand for certified products, considering that only a small proportion of the forests are certified. It is expected that this competitive pressure will remain in the future. As an example, the forestry area managed by the Navigator Group represents nearly 3% of Portugal’s total forested area, 41% of all certified Portuguese forests according with PEFC standards and 26% of all certified Portuguese forests according with FSC® standards.
In order to address these issues, the Group initiated in 2016 a project aiming to promote forest certification in areas owned by private owners, seeking to guarantee that, by 2020, eucalyptus wood processed by the Group will be provided by partners with a certified activity. In 2018, 42% of wood from national sources, excluding self-sufficiency, already came from properties that had their forest management certified (2017: 27%).
In 2018, this increase allowed, for the first time in the Group’s history, to record more than 50% of the total wood acquired by the Group to be from certificated management forest properties. It should also be noted that, within this initiative, the Group has seen a significant increase in the number of wood supplier chain of custody certification, representing a step further on the development of a supplier’s portfolio with certificated management forest properties.
In addition, the Group is working to proactively promote good forest management practices to help improve the productivity of third-party forest areas. This effort, which has been developed through CELPA (Associação da Indústria Papeleira, representing the main industrial groups in the industry) with the Best Eucalyptus Program was reinforced in 2018 with additional supporting measures, in addition to the technical support already provided.
The main risks related with the industry are the ones related to the production capacity of the plantations, the risk of wildfires and plant health as well as the regulatory risk, given the entry into force on 1 January 2018, of Law No. 77/2017, of 17 August, which makes the first amendment to the legal regime applicable to afforestation and reforestation with the use of forest species (RJAAR), approved by Decree-Law No. 96/2013, dated 19 July.
The combination of all these factors, in recent years without any strategic measures of the State in the industry, has forced the import of raw material, a process conditioning the profitability of the industry.
The Navigator Group’s activity is exposed to risks related to forest fires, including:
i. Destruction of current and future wood inventory, belonging to the Navigator Group as well as to third parties;
ii. Increasing costs of forestry and subsequent land preparation for plantation.
In this respect, the manner in which the Group manages its woodlands is the front line for mitigating this risk.

2018 ANN
UAL R
EPO
RT
163
*04
Among the different management measures undertaken by the Group, the strict compliance with biodiversity rules, a proper planning of the forest facilities to be implemented and the construction and maintenance of roads and access roads to each of the areas under development are particularly relevant in mitigating the fire risk.
In addition, the Group has a share in the Afocelca grouping – an economic interest grouping between the Navigator Group and the ALTRI Group, whose mission is to provide assistance in the fight against forest fires at the grouped companies’ properties, in strict coordination and collaboration with the National Civil Protection Authority (Autoridade Nacional de Protecção Civil – ANPC). This grouping manages an annual budget of about Euro 3 million, without public funds, and has created an efficient and flexible structure which implements practices aimed at reducing protection costs and minimizing the damage caused by forest fires to the ACE companies, which own and manage more than 200 thousand hectares of forests in Portugal.
In order to maximize the production capacity of the operated areas, the Group has developed and uses Forestry Management models which contribute to the maintenance and ongoing improvement of the economic, ecological and social functions of the forestry areas, not only regarding the population but also from the forestry landscape perspective, namely:
i. Increase the productivity of its woodlands through the use of the best agro-forestry practices adjusted to local
conditions and compatible with the environment and the demand for biodiversity;
ii. Establish and improve the network of forestry infrastructures to enable the required accessibility for manage-
ment, whilst making them compatible with the forestry protection measures against wildfires;
iii. Ensure compliance with the water-cycle functions, promoting, whenever possible, the rehabilitation and quali-
tative protection of water resources.
The Group has also a research institute, RAIZ, whose activity is focused on 3 main areas: Applied Research, Consulting and Training. In the forestry research area, RAIZ seeks:
i. To improve the productivity of eucalyptus forests;
ii. To enhance the quality of the fibre produced from that wood;
iii. To implement a sustained forestry management program from an economic, environmental and social perspec-
tives;
iv. To foster practices and processes aimed at reducing wood production costs.
RISKS RELATING TO THE PRODUCTION AND SALE OF BEKP (BLEACHED EUCALYPTUS KRAFT PULP) UWF PAPER (UNCOATED FINE PAPERS FOR PRINTING AND WRITING) AND TISSUE PAPER
SUPPLY OF RAW MATERIALSThe self-supply of BEKP pulp production represents less than 15% of the Group’s needs, meaning that the Navigator Group needs to buy wood in the market since the national market is insufficient to cover their needs. Therefore, imports from the Spanish and non-Iberian markets are made structurally.
The supply of wood, namely eucalyptus, is subject to price and exchange rate fluctuations and possible difficulties encountered in the supply of raw materials that could have a significant impact on the production costs of companies producing BEKP (Bleached Eucalyptus Kraft Pulp). Also relevant is (mostly in imports) the volatility of wood transportation costs to the factories, which floats depending on oil prices and sea freight costs.

2018
AN
NU
AL R
EPO
RT
164
*04
The planting of new forest plantations is subject to the authorization of the relevant entities which may limit the national productive potential, despite the initiatives taken to increase the productivity of existing areas and consequently the availability of raw materials.
In the event of insufficient domestic production, in quantity and quality terms, namely of certified wood, the Navigator Group may have to increase the quantity of imported wood, both from Spain and outside Iberia, for which the Group is also taking initiatives that ensure the supply in the short- and medium-term.
Regarding imports of wood, there is a risk underlying its shipment from the place of origin to the harbours supplying the Group’s plants. This transportation risk is mitigated by the purchasing conditions agreed with non-Iberian suppliers and the ownership of raw materials is transferred at the port of arrival. In addition, an insurance is taken to cover any supplying losses arising from any transportation accident that may affect the supplying of wood.
The Group seeks to maximize the added value of its products, particularly through increased integration of certified wood in these products which is supported by ongoing initiatives in the national market that aim to increase the certified area and consequently the certified wood supply. These initiatives aim to respond to the growing demand for products – paper and pulp – certified by the various markets where the Group operates.
On 31 December 2018, a 10% decrease in the cost per m3 of eucalyptus wood consumed in BEKP pulp production would have had a negative impact in the Group’s operating results of approximately Euro 29,900,000 (31 December 2017: Euro 30,500,000).
For other raw materials, including chemicals, the main risk identified is the scarcity of products under the growing demand for these products in emerging markets, particularly in Asia and markets supplying them, which can create occasional imbalances of supply and demand.
In this regard, the Navigator Group, together with the Altri Group, established in 2018 a Complementary Grouping of Companies - Pulp Chem, ACE – intended for the joint acquisition of chemical products, benefiting from economies of scale and thus mitigating this risk.
The Group seeks to mitigate these risks through proactive sourcing, by identifying sources of supply geographically dispersed, whilst seeking to secure long-term supply contracts that ensure volume, price and quality levels consistent with its requirements.
Finally, another resource required for the production process is water. The concern with the use of this resource that the Group assumes as finite is significant. Over the past few years, investments have been made aimed at reducing the use of water in the process, which, in fact, decreased more than 20% between 2005 and 2018. In addition, effluent treatment efficiency is also relevant, with effluent volumes reduced by 24% between 2005 and 2018.
MARKET PRICE FOR UWF PAPER, BEKP PULP AND TISSUE PAPERThe increase in competition, caused by an imbalance of supply and demand in the BEKP pulp, UWF or Tissue paper markets may have a significant impact on prices and, as a consequence, in the Navigator Group’s performance. The market prices of BEKP pulp, UWF and Tissue paper are defined in the world global market in perfect competition and have a significant impact on the Group’s revenues and on its profitability. Cyclical fluctuations in BEKP pulp, Tissue paper and UWF Paper prices mainly arise from both changes in the world supply and demand and the financial situ-ation of each of the international market players (producers, traders, distributors, clients, etc.), creating successive changes in equilibrium prices and raising the global market’s volatility.
The BEKP pulp and UWF paper markets are highly competitive. Significant variations in existing production ca-pacities could have a strong influence on world market prices. These factors have encourage the Group to follow a defined marketing and branding strategy and to invest in relevant capital expenditure to increase productivity and generate high-quality products. It should be noticed that currently the pulp used to produce Tissue paper was mainly acquired to third parties until the end of 2018.

2018 ANN
UAL R
EPO
RT
165
*04
On 31 December 2018, a 10% drop in the price per ton of BEKP pulp and of 5% in the price per ton of UWF paper and Tissue paper sold by the Group in the period, would have represented an impact on its operating results of approxi-mately Euro 16,700,000 and Euro 66,900,000, respectively (31 December 2017: Euro 16,400,000 and Euro 63,700,000, respectively).
DEMAND FOR THE GROUP’S PRODUCTSNotwithstanding the references below to the concentration of the portfolio of the Group’s customers, any decrease in demand for BEKP, UWF and tissue paper in the European and the United States markets could have a significant impact on the Group’s turnover. The demand for BEKP produced by the Group also depends on the evolution of the capacity for paper production in the world, since the Group’s major customers are themselves paper producers.
The demand for uncoated printing and writing paper has been historically related with macroeconomic factors (e.g., GDP growth, employment, particularly in white collar jobs, confidence indices), technological (e.g., penetration of information technology and hardware / software, and demographic (e.g., population, average level of education, age structure of society). The evolution of these factors drives the demand for paper positively or negatively, and in the recent past, the trend of paper consumption is negative in the more developed countries and positive or stable in the emerging / developing countries. Naturally, the performance of the Navigator Group also depends on the evolution of demand in the various markets in which it operates.
Regarding the demand for eucalyptus market pulp, this is largely dependent on the production progress in the non-integrated producers of printing and writing paper, tissue and specialty papers. Chinese demand for this type of pulp represents more than 1/3 of the world’s demand, making China one of the most breakthrough drivers of demand.
Regarding Tissue segment, the key variables affecting the demand are:
• Expected future economic growth;
• Population growth and other demographic changes;
• Product penetration levels;
• Developments in the quality of Tissue paper and product specifications; and
• Substitution effects.
Tissue paper consumption is not very sensitive to cyclical economic changes, although it tends to grow faster with higher economic growth.
The importance of economic growth for the consumption of Tissue is more obvious in developing countries. When the level of the income per capita is very low, the consumption of Tissue tends to be low. There is a threshold after which consumption accelerates. Economic growth allows greater penetration of the product, which is one of the main driv-ers of demand for such paper in the population with lower incomes. The Tissue paper is a product that does not face major threats of substitution by other materials, and there are no expected changes at this level.
Consumer preferences may have an impact on global paper demand or in certain particular types of paper, such as the demand for recycled products or products with certified virgin fibre.
Regarding this matter, and in the particular case of UWF and Tissue paper, the Navigator Group believes that the marketing strategy and branding that has been followed, combined with the significant investments made to improve productivity and produce high quality products, allow it to deliver its products in market segments that are less sen-sitive to variations in demand, resulting in a lower exposure to this risk.

2018
AN
NU
AL R
EPO
RT
166
*04
ENERGYThe pulp and paper production process is dependent on the constant supply of electric and steam energy. The Group has several cogeneration units, which provide this supply, and redundancies have been planned between the various units in order to mitigate the risk of any unplanned shut-downs.
Part of the electricity production is sold to the supplier of last resort at regulated tariffs, based on a legal framework that lays down the special regime production from renewable resources and cogeneration. The remuneratory legal framework provides for a progressive tariff reduction over the applicable time period, implying that the central banks will tend to operate in a self-consumption regime. This fact can be proven by both the reduction shown in revenues associated with the electric power generation activity in recent years and by the reduction of electric energy and natural gas consumption.
COUNTRY RISK – MOZAMBIQUEDue to the investment in the Mozambican project, the Navigator Group is exposed to the specific risk in this country. This means that the planning of investments, in terms of timing, choice of suppliers / partners and geographic location is made considering this effect. The Group monitors the achievement of each step by reasonably assuming, that there will be no effects arising from that risk conditioning them.
At this moment, the Mozambique project is essentially a forestry project, with an option to develop an industrial project. The planned investment will be implemented in two phases, the first being a woodchip production project and a second phase the construction of a large-scale pulp mill. The Group is, however, prepared to move forward with the forestry plan foreseen, once the necessary conditions - most of which are under discussion with the Mozambican authorities - are met.
Until 31 December 2018, the expenditure with this project amounted to Euro 98,6 million (31 December 2017: Euro 90 million), mainly related to plantation, land preparation and forest maintenance, to the social development program and the construction of what is now one of Africa’s largest forest nurseries.
Nevertheless, the Group’s more conservative approach led to the record of several impairments against the investment in Mozambique. Moreover, a provision in the amount of Euro 12 million was also recorded in the period, in the 2018 financial statements in order to reflect the stage of development of the project.
COUNTRY RISK – USAThe US market has a significant weight in the total turnover of UWF paper, increasing the exposure to the country’s specific risk.
This exposure requires a careful evaluation of the impacts resulting, for example, from changes in regulations and taxes, or even from their application and interpretation by governmental entities and tax authorities.
Concerning UWF paper imports, together with producers from other countries (Australia, Brazil, China and Indo-nesia), the Group has been subject to Anti-dumping measures imposed by the US Department of Commerce since 2015. Last September, Navigator Group was notified by the United States Department of Commerce that the final anti-dumping duty to be applied retroactively on sales of US the period from August 2015 to February 2017 (the “first period of review”) was downgraded to 1.75%, which became applicable through the deposit of the fee corresponding to all exports to the US by the Group after the release date of that decision. The second period of review is still being reviewed, from March 2017 to February 2018, and the third period of review, between March 2018 and February 2019 is still running.
COMPETITIONIncreased competition in the paper and pulp markets may have a significant impact in price and consequently, in the Group’s profitability.

2018 ANN
UAL R
EPO
RT
167
*04
As paper and pulp markets are highly competitive, new capacities may have a relevant impact in prices worldwide.
BEKP producers from the southern hemisphere (namely from Brazil, Chile, Uruguay and Indonesia), with significantly lower production costs, have been gaining weight in the market, undermining the competitive position of European pulp producers.
These factors have forced the Group to make significant investments in order to keep production costs competitive and produce high-quality products as it is likely that this competitive pressure will remain strong in the future.
Other highlight is the divestment in the papermaker sector in the USA, with announcements by some UWF producers of closure/conversion of installed capacity to take place by 2020, in a clear attempt to adjust supply according to the negative evolution of demand. On the contrary, investments in new UWF capacity in the Middle East and in China and in the short- and medium-term are expected.
The Group has been adjusting its commercial strategy to the evolution of regional consumption patterns. Therefore, in 2018, the Group UWF sales in the USA, Africa, Latin America and Asia / Oceania markets increased compared to last year. The Group has a significant presence in the US, accounting for about half of European producer sales to this market. The turnover intended to the European markets represented 60% (2017: 62%), achieving particularly strong market shares in Western European countries and relevant market shares in the other main European markets.
CONCENTRATION OF CUSTOMERS’ PORTFOLIOAs at 31 December 2018, the Group’s 10 main BEKP customer groups accounted for 14% of the period’s production of BEKP pulp (2017: 16%) and 81% of external sales of BEKP pulp (2016: 78%). This asymmetry is a result of the strategy pursued by the Navigator Group, consisting of a growing integration of the BEKP pulp produced into the UWF paper produced and sold. Nevertheless, the Group believes there is little exposure to risks of customer concentration in the marketing of BEKP pulp.
In 2018, the Navigator Group’s 10 main customer groups for UWF paper represented 48% of this product’s sales during the period (2017: 50%), although the group’s 10 main individual customers did not exceed 25% of the UWF paper sales (2017: 26%). The Navigator Group registered 91 new customers with sales in 2018. Also, regarding UWF paper, the Group follows a risk mitigation strategy for its customer concentration. The Navigator Group sells UWF paper to more than 130 countries and to more than 1,000 individual customers, thereby allowing a dispersion of the risk of sales concentration in a reduced number of markets and/or customers.
Tissue sales amounted to Euro 91.1 million in 2018 (2017: Euro 74.3 million). Its commercial activity is mainly focused in the Iberian markets, representing 98 % of its sales. The 10 main customers represent about 45% of total sales (2017: 45%).
With the new production equipment in place, given the investment in the second Tissue paper machine made in 2015, the Group believes it will be able to expand its business activity to external markets, namely to Spain and the rest of Western Europe, which is expected to strengthen with the entry into operation in 2018 of the third Tissue paper machine in Cacia.
ENVIRONMENTAL LEGISLATIONIn recent years, environmental legislation in the EU has become increasingly restrictive regarding the control of effluents. The companies of the Navigator Group comply with the prevailing legislation, in its various parameters (VLEs).
On September 2014, the Commission’s implementing decision 2014/687/EU approved the BREF (Best Available Technologies Reference Documents) – Conclusions on Best Available Techniques of the Reference Paper – for the paper and pulp sectors containing the new limits and requirements for these sectors. The companies have four years to promote the required adjustments to its practices and equipment. Furthermore, the technical discussion on the Large Combustion Facilities Reference Document was finalized and published. This document has an impact on the Navigator Group’s equipment, particularly in boilers and combustion facilities, which will be covered by the new legislation, therefore requiring new investments, such as particle filters for biomass boilers.
2018
AN
NU
AL R
EPO
RT
168
*04
As such, the Group has been following the technical development of this matter, trying to anticipate and plan the necessary improvements to their equipment so to comply with the limits to be published. There is a possibility that the Group may need to perform additional investments in this area in order to comply with any changes in limits and environmental regulations which may be approved.
To date, the legislative changes that are known relate to the evolution of the Scheme for Greenhouse Gas Emission allowance trading of CO2 emission rights (CELE), established by Directive 2003/87/CE, and amended by Directive 2009/29/CE, which outlines the legal framework of the CELE for the period 2013-2020 and which was transposed into the national law by Decree-Law 38/2013 of 15 March.
Recently, EU Directive 2018/410 of 14 March amending Directive 2003/87/EC was also approved aiming to increase the cost-effectiveness of emission reductions and investment in low-carbon technologies, EU 2018/410 Directive sets out, among other things, the new CELE period to be in force between 2021-2030, which will show a reduction in the amount of CO2 emission allowances allocated free of charge.
This development will bring increased costs for the transformation industry in general and in particular for the paper and pulp industry, without any compensation for the CO2 that, annually, is absorbed by the forests of this industry.
In order to mitigate the impact of this change, the Group has long undertaken a series of environmental investments that, among other advantages, have allowed the continuous reduction of CO2 emissions, despite the fact that, in recent years, there has been a steady increase in production volumes. In addition, the group has a Carbon Neutral Company Program that aims to implement, by 2035, changes in its production processes in order to minimize the use of fossil fuels and consequently reduce their CO2 emissions.
In 2015, an environmental strategic plan was analysed and established, aiming to adapt Navigator Group to a set of new and future requirements in the environmental area, namely to the reference document for the sector (Conclusions on Best Available Techniques of the Reference Document for the sector - BREF - Commission Implementing Decision 2014/687/EU) and for Large Combustion Facilities. The reference documents correspond to the implementation of Directive 2010/75/EU on industrial emissions. Projects are underway to implement the appropriate technological changes, as well as a new version of the Environmental Master Plan, which incorporates new environmental challenges that have arisen in the meantime.
The Environmental Strategic Plan aimed for areas other than the environmental covered by this document. It was possible to confirm that Navigator Group is broadly in compliance with this future referential and to identify some areas for improvement as well as technological solutions such as atmosphere emissions from biomass boilers.
On the other hand, under the terms set in Decree-Law 147/2008, dated 29 June that transposed directive 2004/35/CE to the national law, the Navigator Group secured the environmental insurances demanded by that law, thus guaranteeing compliance and reducing exposure to environmental risks.
RISKS ASSOCIATED WITH THE PRODUCTION OF ENERGYEnergy is an activity of growing importance in the Group allowing the use of endogenous renewable resource which is the biomass generated in the BEKP production. The energy generation assets also allow the Group’s wood suppliers to generate additional income from the sale of biomass and contributing to the reduction of the risk of fires in the country.
As a way of boosting the use of forest residual biomass made available by the forestry sector, two biomass thermoelectric plants to produce renewable electric energy were built by the Group in 2009 and are fully operational.
The Group has played a pioneering role and has been developing a market for the sale of biomass for supplying its renewable cogeneration power stations and biomass power plants. The fostering of this market in a phase prior to the start-up of the new power-generating units has enabled it to secure a sustained raw-material supply network.

2018 ANN
UAL R
EPO
RT
169
*04
The Group has been making the Government and public opinion aware of the need to guarantee that biomass is managed in a sustainable manner, avoiding the use of eucalyptus wood for biomass, as an alternative of its use in the production of tradable goods. The incentives in place in Portugal only consider the use of residual forest biomass, rather than the use of wood to produce electrical power.
In addition, and despite the legal provisions.
i. Decree-Law 23/2010 and Act 140/2012, revised by Act 325-A/2012, applicable to the ERP system – Special Re-
gime in cogeneration;
ii. For units powered through residual forestry biomass (CTB), dedicated to the production of electricity, the legal framework is provided by Decree-Law 33-A/2005, revised by Decree-Law 225/2007, that extends from 15 to 25 years the guaranteed tariffs under the PRE (Special Regime Production), which enables some revenue stability to be planned for the near future, there is a risk that the change in energy prices for sale of energy produced from renewable resources will penalize the products produced by the Navigator Group (already occurring, with specific measures over the energy price and the introduction of an Extraordinary Contribution to the Energy Sec-tor affecting cogenerating units with a capacity of more than 20MW). The constant search for the optimization of production costs and efficiency of the generating units is the way the Group seeks to mitigate this risk.
As a result of the measures taken under the Financial Adjustment Program to which Portugal was subject, the entire remuneration system of the national electricity sector was revised, being the major impact in the electricity produced from cogeneration, recognised as an energy efficiency measure already which represents one of the most efficient forms of energy production.
The Group represents a significant part of the energy produced in Portugal. The units owned and operated by the Group under the Cogeneration regime, supported by a review of the electric energy sales prices, over a period that began temporarily in 2012 and which will end progressively between 2025-2030.
The progressive tariff reduction associated with the sale of electricity in special regime, affects the economic sustainability of the sale to the electricity grid, therefore after the applicable legal periods, the cogenerations tended to operate on a self-consumption basis, i.e. directly supplying the units which has already occurred at the natural gas cogeneration plant at Figueira da Foz since February 2016.
RISKS ASSOCIATED TO TRANSPORT AND LOGISTICSThe Navigator Group exports over 95% of its production of UWF paper and approximately 44% of its production of Tissue paper. As a consequence, transportation and logistics costs are materially relevant. A continuous increase in transport costs may have a significant impact in the Group’s performance.
2.2.2 RISKS RELATING TO THE CEMENT AND DERIVATIVES SEGMENT
SUPPLY OF RAW MATERIALSRegarding the segment of Cement and derivatives, the main raw materials in the manufacturing process of cement are limestone and clay or marl, the extraction of which is carried out in its own quarries, located within the factory, with reserves that ensure the Group sustained operation in the coming years.
SALE PRICEThe Cement and derivatives segment develops its activity in diverse geographically markets and therefore prices depend essentially on the economic situation of each country.
DEMAND FOR GROUP’S PRODUCTSThe segment of Cement and derivatives’ turnover is dependent on the level of activity in the building sector in each one of the geographic markets in which it operates. The construction sector tends to be cyclical, in particular in mature economies, and depends on the level of residential and commercial building, as well as on the level of investments in infrastructures.

2018
AN
NU
AL R
EPO
RT
170
*04
The construction sector is sensitive to factors such as interest rates and therefore a downturn in economic activity in any specific economy may lead to a recession in this industry.
Despite the Group considering that its geographical diversification is the best means to stabilise earnings, its business, financial situation and operating profit can be negatively affected by a downswing in the construction sector, in any of the significant markets in which it operates.
COMPETITIONThe companies of the segment of Cement and derivatives develop its activity in a strong competitive environment. In the Portuguese market, and in the current context, which has led to a strong decline in the sector, any excess capacity of national operators together with imports, may affect the performance of this segment.
The same tendency happens in Brazil, a country under recession and currently with excess installed capacity that has negatively impacted prices. In Tunisia, oversupply has also pushed down prices.
ENERGY COSTSA significant part of the Group’s costs relates to energy costs. Energy is a cost factor with a substantial weight on the business carried on by Secil and its subsidiaries. The Group performs hedges, to a certain degree, against the energy price risk through the usage of alternative fuels at its factories and long-term electric power supply contracts for certain of its energy requirements. However, significant fluctuations in electricity and fuel costs can have a negative impact on the Group’s business, financial situation and operating profit.
COUNTRY RISK – BRAZIL, TUNISIA, LEBANON AND ANGOLASecil is exposed to the country risk of Brazil, Tunisia, Lebanon and Angola, where the Group holds investments in production units.
ENVIRONMENTAL LEGISLATIONIn recent years, EU environmental legislation has become more restrictive with regard to the control of environmental emissions. It is an integral part of the Integrated Policy of the Secil Group, the strict compliance with the legal requirements on the Environment that apply to it, as well as the continuous improvement of its performance.
In 2013, the BREF (Best Available Technologies Reference Documents) — Conclusions on Best Available Techniques of the Reference Document — for the cement, lime and magnesium oxide sectors containing, the new limits and requirements for these sectors was approved, with companies being limited to four years, regarding the promotion of the necessary adaptations to their practices and equipment. Such requirements were set out in the Environmental Licenses that regulate the activity of quarrying and cement production.
As such, the Secil Group has been following the technical development of this matter, seeking to anticipate and plan the necessary improvements in its equipment to make them comply with the limits to be published, thus allowing the Group to make additional investments in this area if needed, in order to comply with any changes in the limits and environmental rules that may be approved.
To date, the known legislative changes are also related to the evolution of the European Greenhouse Gas Emission Trading Scheme, established by Directive 2003/87/EC, as amended by Directive 2009/29/EC (new CELE Directive). This scheme presents the legal framework of the CELE for the period 2013-2020 and was transposed into the national legal order by Decree-Law 38/2013 of 15 March, which resulted in reducing the scope of free allocation of CO2 emission allowances. The revision of this latter directive has been under discussion at the European Community level to frame the post-2020 period, i.e. the period from 2021 to 2030.
Recently, EU Directive 2018/410 of 14 March amending Directive 2003/87/EC was also approved aiming to increase the cost-effectiveness of emission reductions and investment in low-carbon technologies, EU 2018/410 Directive sets out, among other things, the new CELE period to be in force between 2021-2030, which will show a reduction in the amount of CO2 emission allowances allocated free of charge.
2018 ANN
UAL R
EPO
RT
171
*04
This evolution will bring new challenges for the cement industry. In order to mitigate the effects resulting from successive revisions of this legislation, the Group has long undertaken a series of environmental investments that, among other advantages, have allowed the continuous reduction of CO2 emissions, with emphasis on the investment in equipment that enables energy valorisation of alternative fuels, cements with less clinker incorporation, and the investment in equipment of lower energy consumption.
Existing technologies are not expected to reduce emissions to ensure current production capacities through free emissions, undermining the competitiveness of clinker and cement exports. Several research projects are under way to capture, store and reuse CO2, none of which has been confirmed to be economically feasible, despite the existence of solutions that will be introduced for new types of cement. We believe that the solutions will only be implemented in 2020 after the disclosure of the CO2 licenses that will be attributed to the installations for the period between 2021 and 2030. In Portugal, a collaborative laboratory will be created between companies, universities and research cen-tres, with the objective of ensuring the development of lines of research to reduce CO2 emissions.
Aware that the exploitation of quarries has significant impacts on the landscape, alteration of relief, removal of soil and vegetation cover and reduction of refuges/food for fauna, the Group assumes the minimisation of these impacts and acceleration of the process of natural colonisation, not only through programs to recover the composition and structure of the plant and animal communities, but also the recovery of the functions and natural processes of the ecosystem.
On the other hand, complying with Decree-Law No. 147/2008 of 29 June, which transposed Directive 2004/35/EC into national legislation, the Group ensured the environmental insurance required by that legislation, ensuring compli-ance with the regulations in force, and mitigating the environmental risks to which it is exposed.
2.2.3 RISKS RELATING TO THE ENVIRONMENT SEGMENT
SUPPLY OF RAW MATERIALSThe supply of raw materials for the segment of Environment, developed by the subgroup ETSA, is conditioned by the availability of animal carcasses and waste from the food industry, particularly in slaughterhouses. This market is relatively vulnerable to the deterioration of the economic situation, as well as changes in consumption habits and ease of substitution between food products, which could limit the activity of this subgroup.
SALE PRICEGiven its nature, ETSA’s business is exposed to volatility in prices of soft commodities on international markets (cereals and cereal products), since these are substitute products to those transacted by ETSA.
The correlation between ETSA’s selling prices and movements in prices of soft commodities on international markets is an additional risk factor for the activity.
DEMAND OF GROUP’S PRODUCTSA decrease in demand or diminished level of activity in animal feed industry, agriculture exploitations, pet food and biodiesel may have a significant impact on group ETSA’s turnover.
COMPETITIONSub-group ETSA develops its activity in a market where it competes with other companies operating in the collection and recovery of animal by-products and other companies that produce substitutes for these products such as industries related to the production of cereals and edible oils. In this framework, any increase or decrease in competition will be reflected in the levels of profitability of the Group.
2018
AN
NU
AL R
EPO
RT
172
*04
OTHER RISKSThe ITS subsidiary has a service contract with the Portuguese State regarding SIRCA, which in the year of 2017 represented approximately 22.5% of the consolidated turnover of the ETSA Group. This contract has a limited term and its continuity depends not only on competitive factors, since it is promoted by public tender, but also on regulatory factors, since its existence and regime depend on strategic options of the Portuguese State.
2.2.4 RISKS RELATING TO THE GROUP IN GENERAL
HUMAN RESOURCESSuccessful organisations have the right talent, in the right place, at all levels — people who look beyond the obvious and take the business into the future. The shortage of talent is now a structural problem of companies. With the technological advance and the constant need for innovation, intellectual capital has become crucial for the survival and expansion of companies.
In this sense, the Group’s ability to successfully implement the strategies outlined depends on its ability to attract the best talent, recruit and retain the most qualified and competent Employees in each role. The high average age of a share of the Group’s active population is a risk factor.
Although human resources and talent management policies are geared to these objectives, limitations and relevant investment need may arise concerning this area in the future. The Group has been carrying out various actions aimed at disseminating its culture and values as well as enhancing the talent of its human resources.
LEGAL RISKSWith regard to legal risks, it is crucial to mention that they are essentially the result of fiscal and regulatory risks, which are covered by the analysis of risks that have an operational nature, and specific risks of general liability or risks associated with the negotiation and conclusion of contractual instruments.
These risks are controlled through legal advisors established both at Semapa as a holding company and its subsidiaries, and through the use of external lawyers whenever the specialty of the matter, its value or other factors of the concrete case, are considered to be relevant.
INFORMATION SYSTEMS RISKSThe Group’s information systems, some of which rely on services rendered by third parties, play key role in the operation of its business. Given the strong reliance placed on information technologies in the several geographies and business areas in which the Group operates, it is important to highlight the risk inherent to systems failures resulting from intentional actions such as computer attacks or accidental actions.
Despite the procedures designed and implemented to mitigate the mentioned risks, the Group is aware that, in the absence of inviolable information systems, it cannot be guaranteed that these efforts will be sufficient to prevent such system failures, as well as the related repercussion on reputation, litigation, inefficiencies or even in allocating operating margins.
OTHER RISKSThe Group’s manufacturing facilities are subject to risks inherent to any industrial activity, such as accidents, breakdowns or natural disasters that may cause losses in the Group’s assets or temporary interruptions in the production process.
Likewise, these risks may also affect the Group’s main customers and suppliers, which would have a significant impact on the levels of the Group’s profitability, should it not be possible to find new customers to ensure sales levels and new suppliers that would enable the Group to maintain its current cost structure.

2018 ANN
UAL R
EPO
RT
173
*04
2.2.5 CONTEXT RISKS
The lack of efficiency in the Portuguese economy continues to be accompanied by management, as it may have a negative effect on the Group’s ability to be competitive. This is more so, but not exclusively, in the following areas: i) ports and railroads; ii) roads; iii) rules regarding territory management and forest fires; iv) low productivity of the country’s forests; v) the lack of certification of part of the Portuguese forest, and vi) volatility of fiscal policies.
3 RELEVANT ACCOUNTING ESTIMATES AND JUDGEMENTSThe preparation of consolidated financial statements requires that the Group’s management make judgments and estimates that affect the amount of revenue, costs, assets, liabilities and disclosures at the date of the consolidated statement of financial position.
These estimates are influenced by the Group’s management’s judgments, based on:
(i) the best information and knowledge of present events and in certain cases on the reports of independent ex-perts; and
(ii) the actions that the Group considers it may have to take in the future. However, on the date on which the oper-
ations are realised, the outcome could differ from those estimates.
The estimates and assumptions which present a significant risk of generating a material adjustment to the book value of assets and liabilities in the following financial year are presented below:
3.1 RECOVERABILITY OF GOODWILL AND BRANDS
The Group annually tests Goodwill (Note 1.7) and brands (Note 1.6.2) for impairment purposes, and recognises it in its consolidated financial position, in accordance with the accounting policy referred in Note 1.10.
With respect to goodwill, recoverable amounts of cash flow units are determined, based on the calculation of usage values and fair value less cost of sale. These calculations require the use of estimates and assumptions that, in case of change, may have an impact on the estimated recoverable amount (Note 15).
A sensitivity analysis was performed, as of 31 December 2018, to the key assumptions (independently for each assumption) identified as follows:
1) Increase of 50 basis points in the discount rate used (WACC) in the base scenario; and
2) Reduction of free cash flow by 5% over that used in the base scenario.
As a result of these tests, it was concluded that a 50 base points increase in the discount rates used (WACC) for the impairment tests of Goodwill would imply a devaluation of: i) 8% in the valuation value of CGU Pulp and Paper; ii) 12% in the valuation value of the CGU Cement and Derivatives; and iii) 11% in the valuation value of the CGU Environment, in any of the cases without resulting in any impairment loss.
It was also concluded that a reduction of free cash flow by 5% would imply a devaluation of i) 6% in the valuation value of CGU Pulp and Paper, ii) 8% in the valuation value of CGU Cement and Derivatives, and iii) 6% in the valuation value of CGU Environment, in any of the cases without resulting in any impairment loss.
Regarding brands, annual assessments are prepared by an independent entity, based on a post-tax cash-flow discount model, called the “income-split method”, associated with the influence of the brand (difference between the net mark margin, minus marketing and the net margin of the associated white label) discounted at the time of valuation based on a specific discount rate.
These calculations also require the use of estimates and assumptions that, in case of change, may have an impact on the estimated recoverable amount. The analysis of sensitivity to the value of the brands is disclosed in Note 16.

2018
AN
NU
AL R
EPO
RT
174
*04
3.2 INCOME TAX
The Group recognises liabilities for additional settlements that may result from tax authorities’ revisions. When the final result of these situations is different from the amounts initially recorded, the differences will have an impact on income tax and tax provisions in the period in which they occur.
In Portugal, annual income statements are subject to review and possible adjustment by the tax authorities for a period of 4 years. However, if tax losses are presented they may be subject to review by the tax authorities for a period of 6 years. In other countries in which the Group operates, these periods are different, usually higher.
The Board of Directors considers that any corrections to those declarations as a result of reviews/inspections by the tax authorities will not have a significant impact in the consolidated financial statements as at 31 December 2018, although the years up to and including 2014 have already been reviewed.
3.3 ACTUARIAL ASSUMPTIONS
Liabilities relating to defined-benefit plans are calculated, based on actuarial assumptions (Note 29). Changes to those assumptions can have a material impact on the previously mentioned liabilities.
As of 31 December 2018, a decrease of 0.5% in the technical discount rate used (2%), variable and identified as the most significant, would imply an overall increase of liabilities amounting to approximately EUR 12.1 million (2017: EUR 10.8 million).
3.4 FAIR VALUE OF BIOLOGICAL ASSETS
In determining the fair value of biological assets the Group used the discounted cash flows method, considering assumptions related to the nature of the assets being valued (Note 1.11). Changes in these assumptions may have an impact in the value of those assets (Note 18).
As of December 2018, a 0.5% increase in the discount rate used in Portugal of 5.01% at nominal values (31 December 2017: 5.35%) variable identified as more significant, would imply a devaluation of this asset by EUR 4.5 million (2017: EUR 4.9 million).
As of 31 December 2017, a 3% decrease in forward price would imply a devaluation on Portugal forestry asset by approximately EUR 8.9 million (31 December 2017: EUR 8.7 million).
3.5 RECOGNITION OF PROVISIONS AND ADJUSTMENTS
The Group is involved in several lawsuits, for which, based on the opinion of its legal counsel, it makes a judgment to determine whether a provision for these contingencies should be recorded (Note 30).
Adjustments to accounts receivable are mainly calculated based on the seniority of the accounts receivable, the risk profile of the customers and their financial situation (Note 22).
3.6 TANGIBLE ASSETS
The recoverability of tangible assets requires the definition of estimates and assumptions by the Management, in particular, when applicable, with respect to the determination of the value in use to be considered in the impairment tests to the Group’s cash generating units.
Additionally, property, plant and equipment represent the most significant component of the Group’s total assets (Note 17). These assets are subject to systematic depreciation for the period that is determined to be their economic useful life. The determination of the useful lives of the assets as well as the depreciation method to be applied is essential to determine the amount of depreciation to be recognized in the consolidated statement of comprehensive income for each period.

2018 ANN
UAL R
EPO
RT
175
*04
The useful life of an asset is the period during which it is expected to be available for use and should be reviewed at least at the end of each financial year. If the estimates differ from the previous ones, the change should only have effects in the future, changing the depreciation/amortisation quotas, so that the asset is fully and linearly depreciated/amortized up to the end of its useful life.
These two parameters are defined according to the best judgment of the Board of Directors for the assets and businesses in question, also considering the practices adopted by companies of the sector at the international level.
Given the relevance of this estimate, the Group makes regular use of external and independent experts to assess the adequacy of the estimates used.
4 SEGMENT REPORTINGSegmental information is presented in relation to the business segments identified, namely Pulp and Paper, Cement and Derivatives, Environment and Holdings. The earnings, assets and liabilities for each segment correspond to those which are directly attributed to them, as well as those which can be imputed to them on a reasonable basis.
OPERATING SEGMENTSIn accordance with the approach defined by IFRS 8, the operating segments should be identified on the basis of how the internal financial information is organised and reported to the management. An operating segment is defined by IFRS 8 as a component of the Group:
i) developing business activities that can generate revenues and incur expenses;
ii) the operational results of which are regularly reviewed by the Group’s chief operating decision-maker, for the
purpose of making decisions about allocating resources to the segment and evaluating its performance; and
iii) for which different information is available.
The Executive Committee of Semapa and its subsidiaries are primarily responsible for making operational decisions, periodically analysing reports with operational information on the segments, using them to monitor the operational performance of their business, and to decide on the best allocation of resources.
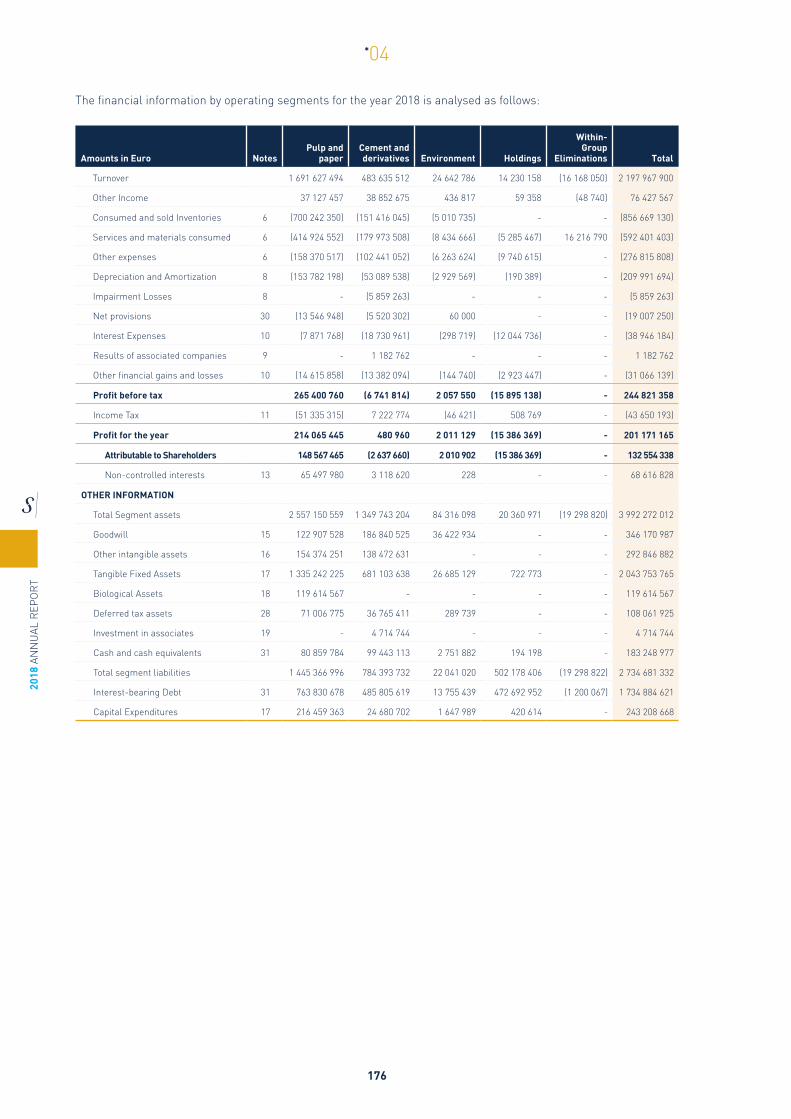
2018
AN
NU
AL R
EPO
RT
176
*04
The financial information by operating segments for the year 2018 is analysed as follows:
Amounts in Euro NotesPulp and
paperCement and derivatives Environment Holdings
Within-Group
Eliminations Total
Turnover 1 691 627 494 483 635 512 24 642 786 14 230 158 (16 168 050) 2 197 967 900
Other Income 37 127 457 38 852 675 436 817 59 358 (48 740) 76 427 567
Consumed and sold Inventories 6 (700 242 350) (151 416 045) (5 010 735) - - (856 669 130)
Services and materials consumed 6 (414 924 552) (179 973 508) (8 434 666) (5 285 467) 16 216 790 (592 401 403)
Other expenses 6 (158 370 517) (102 441 052) (6 263 624) (9 740 615) - (276 815 808)
Depreciation and Amortization 8 (153 782 198) (53 089 538) (2 929 569) (190 389) - (209 991 694)
Impairment Losses 8 - (5 859 263) - - - (5 859 263)
Net provisions 30 (13 546 948) (5 520 302) 60 000 - - (19 007 250)
Interest Expenses 10 (7 871 768) (18 730 961) (298 719) (12 044 736) - (38 946 184)
Results of associated companies 9 - 1 182 762 - - - 1 182 762
Other financial gains and losses 10 (14 615 858) (13 382 094) (144 740) (2 923 447) - (31 066 139)
Profit before tax 265 400 760 (6 741 814) 2 057 550 (15 895 138) - 244 821 358
Income Tax 11 (51 335 315) 7 222 774 (46 421) 508 769 - (43 650 193)
Profit for the year 214 065 445 480 960 2 011 129 (15 386 369) - 201 171 165
Attributable to Shareholders 148 567 465 (2 637 660) 2 010 902 (15 386 369) - 132 554 338
Non-controlled interests 13 65 497 980 3 118 620 228 - - 68 616 828
OTHER INFORMATION
Total Segment assets 2 557 150 559 1 349 743 204 84 316 098 20 360 971 (19 298 820) 3 992 272 012
Goodwill 15 122 907 528 186 840 525 36 422 934 - - 346 170 987
Other intangible assets 16 154 374 251 138 472 631 - - - 292 846 882
Tangible Fixed Assets 17 1 335 242 225 681 103 638 26 685 129 722 773 - 2 043 753 765
Biological Assets 18 119 614 567 - - - - 119 614 567
Deferred tax assets 28 71 006 775 36 765 411 289 739 - - 108 061 925
Investment in associates 19 - 4 714 744 - - - 4 714 744
Cash and cash equivalents 31 80 859 784 99 443 113 2 751 882 194 198 - 183 248 977
Total segment liabilities 1 445 366 996 784 393 732 22 041 020 502 178 406 (19 298 822) 2 734 681 332
Interest-bearing Debt 31 763 830 678 485 805 619 13 755 439 472 692 952 (1 200 067) 1 734 884 621
Capital Expenditures 17 216 459 363 24 680 702 1 647 989 420 614 - 243 208 668

2018 ANN
UAL R
EPO
RT
177
*04
The financial information by operating segments for the year of 2017 is analysed as follows:
Amounts in Euro NotesPulp and
paperCement and derivatives Environment Holdings
Within-Group
Eliminations Total
Turnover 1 636 834 437 499 527 306 28 968 519 13 037 095 (13 714 078) 2 164 653 279
Other Income 33 810 518 32 042 166 226 099 354 131 (29 404) 66 403 510
Consumed and sold Inventories 6 (652 186 373) (149 546 440) (5 413 922) - - (807 146 735)
Services and materials consumed 6 (407 745 075) (185 012 808) (8 430 121) (3 148 455) 13 743 482 (590 592 977)
Other expenses 6 (206 875 417) (108 238 496) (7 636 064) (9 840 198) - (332 590 175)
Depreciation and Amortisation 8 (153 936 000) (58 409 303) (2 847 978) (199 656) - (215 392 937)
Impairment Losses 8 (6 039 449) (2 792 379) - - - (8 831 828)
Net provisions 30 (4 084 555) 174 732 (330 300) - - (4 240 123)
Interest Expenses 10 (10 374 291) (26 251 128) (345 233) (12 630 211) - (49 600 863)
Results of associated companies 9 - 1 047 842 - - - 1 047 842
Other financial gains and losses 10 2 677 321 (15 087 846) (159 197) (2 740 794) - (15 310 516)
Profit before tax 232 081 116 (12 546 354) 4 031 803 (15 168 088) - 208 398 477
Income Tax 11 (35 383 851) 20 789 036 (786 792) 582 760 - (14 798 847)
Profit for the year 196 697 265 8 242 682 3 245 011 (14 585 328) - 193 599 630
Attributable to Shareholders 136 512 306 (1 078 160) 3 244 649 (14 585 328) - 124 093 467
Non-controlled interests 13 60 184 959 9 320 842 362 - - 69 506 163
OTHER INFORMATION
Total Segment Assets 2 447 696 399 1 456 792 210 83 516 756 12 674 713 (13 693 007) 3 986 987 071
Goodwill 15 122 907 528 192 694 053 36 422 935 - - 352 024 516
Other intangible assets 16 155 366 245 134 699 212 - - - 290 065 457
Tangible Fixed Assets 17 1 282 630 094 753 450 196 28 031 373 492 548 - 2 064 604 211
Biological Assets 18 129 396 936 - - - - 129 396 936
Deferred tax assets 28 44 727 571 35 159 298 188 514 - - 80 075 383
Investment in associates 19 - 4 099 421 - - - 4 099 421
Cash and cash equivalents 31 125 331 036 117 406 144 320 261 129 820 - 243 187 261
Total segment liabilities 1 326 578 733 849 513 859 23 252 806 579 389 424 (13 693 007) 2 765 041 815
Interest-bearing Debt 31 818 057 471 531 447 555 15 640 144 552 415 433 (689 598) 1 916 871 005
Capital Expenditures 17 114 714 693 26 309 929 2 948 918 33 309 - 144 006 849

2018
AN
NU
AL R
EPO
RT
178
*04
GEOGRAPHICAL SEGMENTS
2018Pulp and
paperCement and derivatives Environment Total Amount Total %
Sales and services rendered
Portugal 315 702 850 199 671 051 17 727 099 533 101 000 24.25%
Rest of Europe 851 819 056 34 470 188 6 321 042 892 610 286 40.61%
America 209 484 174 83 397 253 - 292 881 427 13.33%
Africa 194 465 681 81 694 890 46 264 276 206 835 12.57%
Asia 118 938 598 82 905 362 548 382 202 392 342 9.21%
Overseas 776 011 - - 776 011 0.04%
1 691 186 370 482 138 744 24 642 787 2 197 967 901 100.00%
2017Pulp and
paperCement and derivatives Environment Total Amount Total %
Sales and services rendered
Portugal 315 790 653 195 436 926 20 224 284 531 451 863 24.55%
Rest of Europe 853 381 478 29 671 996 8 541 813 891 595 287 41.19%
America 152 624 556 90 343 915 - 242 968 471 11.22%
Africa 166 149 105 90 507 056 202 423 256 858 584 11.87%
Asia 145 996 402 92 890 428 - 238 886 830 11.04%
Overseas 2 892 243 - - 2 892 243 0.13%
1 636 834 437 498 850 321 28 968 520 2 164 653 278 100.00%
The revenue presented in different business and geographical segments corresponds to revenue generated with external customers based on the final destiny of the products and services commercialised by the Group, not representing any of them, individually, 10% or more of the overall revenue of the Group.
5 OTHER INCOMEAs of 31 December 2018 and 2017, the caption Other Income comprises:
Amounts in Euro 2018 2017
Grants - CO2 emission allowances 15 800 680 10 610 550
Gains on disposal of non-current assets 19 759 725 4 044 932
Power interruption - REN 3 438 724 3 654 883
Reversal of impairment in current assets (Note 22) 5 000 665 2 132 351
Disposal of emission allowances 9 824 690 2 809 348
Recovery of uncollectibles 9 772 225 3 878 787
Supplementary income 4 546 709 1 403 952
Operating subsidies 3 858 882 1 183 874
Inventory Gains 950 005 1 708 695
Own work capitalised 906 566 11 125 321
Income from waste treatment 479 792 758 520
Other compensation received 263 013 238 366
Compensation Interest 156 985 1 442 121
Real Estate Income 127 062 655 815
Compensation for insurance against damage 112 716 9 585 889
Scrap sales 1 144 730 1 141 956
Other operating income 10 066 767 6 244 163
86 209 936 62 619 523
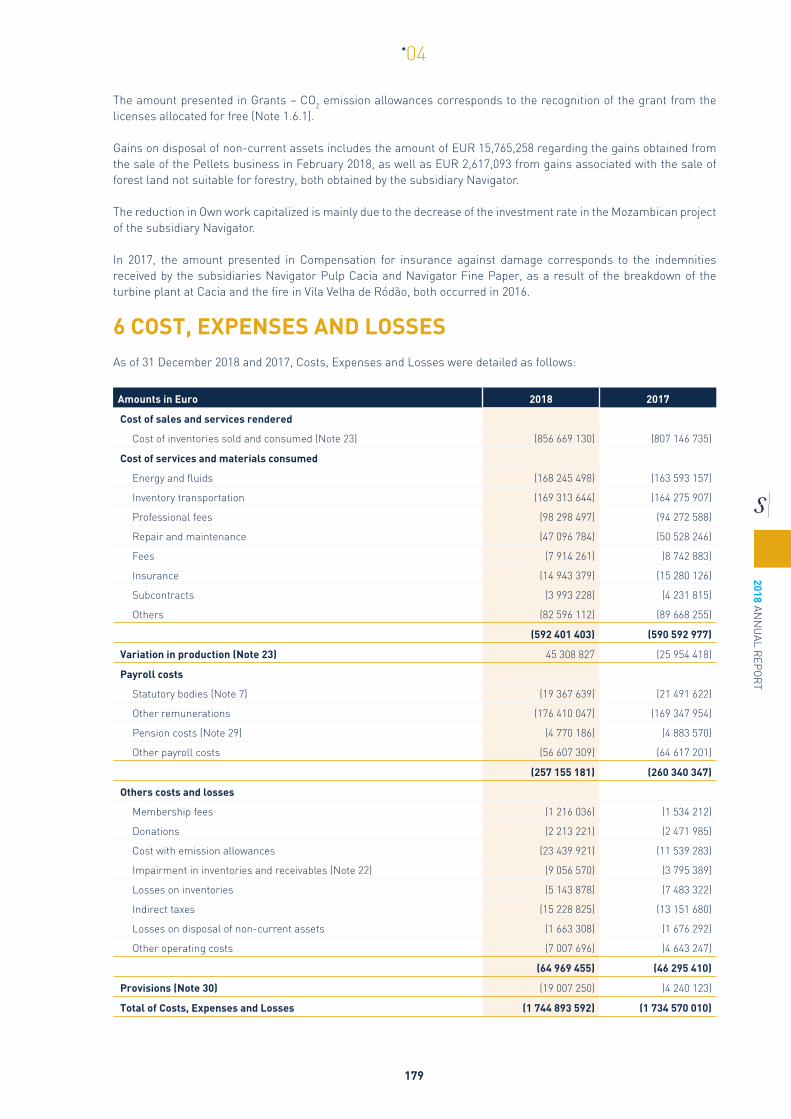
2018 ANN
UAL R
EPO
RT
179
*04
The amount presented in Grants – CO2 emission allowances corresponds to the recognition of the grant from the licenses allocated for free (Note 1.6.1).
Gains on disposal of non-current assets includes the amount of EUR 15,765,258 regarding the gains obtained from the sale of the Pellets business in February 2018, as well as EUR 2,617,093 from gains associated with the sale of forest land not suitable for forestry, both obtained by the subsidiary Navigator.
The reduction in Own work capitalized is mainly due to the decrease of the investment rate in the Mozambican project of the subsidiary Navigator.
In 2017, the amount presented in Compensation for insurance against damage corresponds to the indemnities received by the subsidiaries Navigator Pulp Cacia and Navigator Fine Paper, as a result of the breakdown of the turbine plant at Cacia and the fire in Vila Velha de Ródão, both occurred in 2016.
6 COST, EXPENSES AND LOSSESAs of 31 December 2018 and 2017, Costs, Expenses and Losses were detailed as follows:
Amounts in Euro 2018 2017
Cost of sales and services rendered
Cost of inventories sold and consumed (Note 23) (856 669 130) (807 146 735)
Cost of services and materials consumed
Energy and fluids (168 245 498) (163 593 157)
Inventory transportation (169 313 644) (164 275 907)
Professional fees (98 298 497) (94 272 588)
Repair and maintenance (47 096 784) (50 528 246)
Fees (7 914 261) (8 742 883)
Insurance (14 943 379) (15 280 126)
Subcontracts (3 993 228) (4 231 815)
Others (82 596 112) (89 668 255)
(592 401 403) (590 592 977)
Variation in production (Note 23) 45 308 827 (25 954 418)
Payroll costs
Statutory bodies (Note 7) (19 367 639) (21 491 622)
Other remunerations (176 410 047) (169 347 954)
Pension costs (Note 29) (4 770 186) (4 883 570)
Other payroll costs (56 607 309) (64 617 201)
(257 155 181) (260 340 347)
Others costs and losses
Membership fees (1 216 036) (1 534 212)
Donations (2 213 221) (2 471 985)
Cost with emission allowances (23 439 921) (11 539 283)
Impairment in inventories and receivables (Note 22) (9 056 570) (3 795 389)
Losses on inventories (5 143 878) (7 483 322)
Indirect taxes (15 228 825) (13 151 680)
Losses on disposal of non-current assets (1 663 308) (1 676 292)
Other operating costs (7 007 696) (4 643 247)
(64 969 455) (46 295 410)
Provisions (Note 30) (19 007 250) (4 240 123)
Total of Costs, Expenses and Losses (1 744 893 592) (1 734 570 010)

2018
AN
NU
AL R
EPO
RT
180
*04
The increase in Payroll costs – Other remunerations in 2018 is mainly explained by the increase verified in the number of employees associated with the new industrial unit of Tissue, in Cacia (from subsidiary Navigator) and by the increase in in the estimated amounts of bonuses payable to Group employees.
In 2017, the amount presented on Losses on Inventories mainly include the losses arising from the beginning of the activity of the Pellets plant of the subsidiary Navigator, whose initial problems resulted in inventory losses in the amount of EUR 3,563,754 as well as a loss in the nursery in Mozambique in the amount of EUR 2,791,786. In 2018, this caption includes an amount of EUR 2,200,000 relating to adjustments to the stock of UWF paper.
Indirect taxes includes, in 2018, an amount of EUR 9,240,720 related to costs associated to the anti-dumping process, of which EUR 3,565,971 refers to the retroactive application of the 1.75% rate in the sales of the first review period between August 2015 and February 2017. The remainder concerns the application of a new estimated rate for the second review period, begun in March 2017, which the Group prudently decided to reflect on its results.
The caption Other payroll costs, in 2018 and 2017, was detailed as follows:
Amounts in Euro 2018 2017
Other payroll cost
Social security costs (37 816 156) (37 532 563)
Insurance (4 891 730) (4 826 533)
Social welfare expenses (6 606 781) (7 366 922)
Other payroll cost (7 292 642) (14 891 183)
(56 607 309) (64 617 201)
7 REMUNERATION OF STATUTORY BODIESAs of 31 December 2018 and 2017, the caption Remuneration of statutory bodies (Note 35) was detailed as follows:
Amounts in Euro 2018 2017
Semapa's Company Officers
Board of Directors 9 087 933 9 387 979
Audit Board 58 735 54 000
Remuneration Committee 12 000 12 000
General Meeting Board 4 000 7 000
Board of Directors of other Group companies
Board of Directors of other Group companies 10 204 971 12 030 643
19 367 639 21 491 622
For the year ended as of 31 December 2018 and 2017, liabilities for past services relating to one non-executive Director of the subsidiary Navigator was also recognized, as described in Notes 29 and 35.
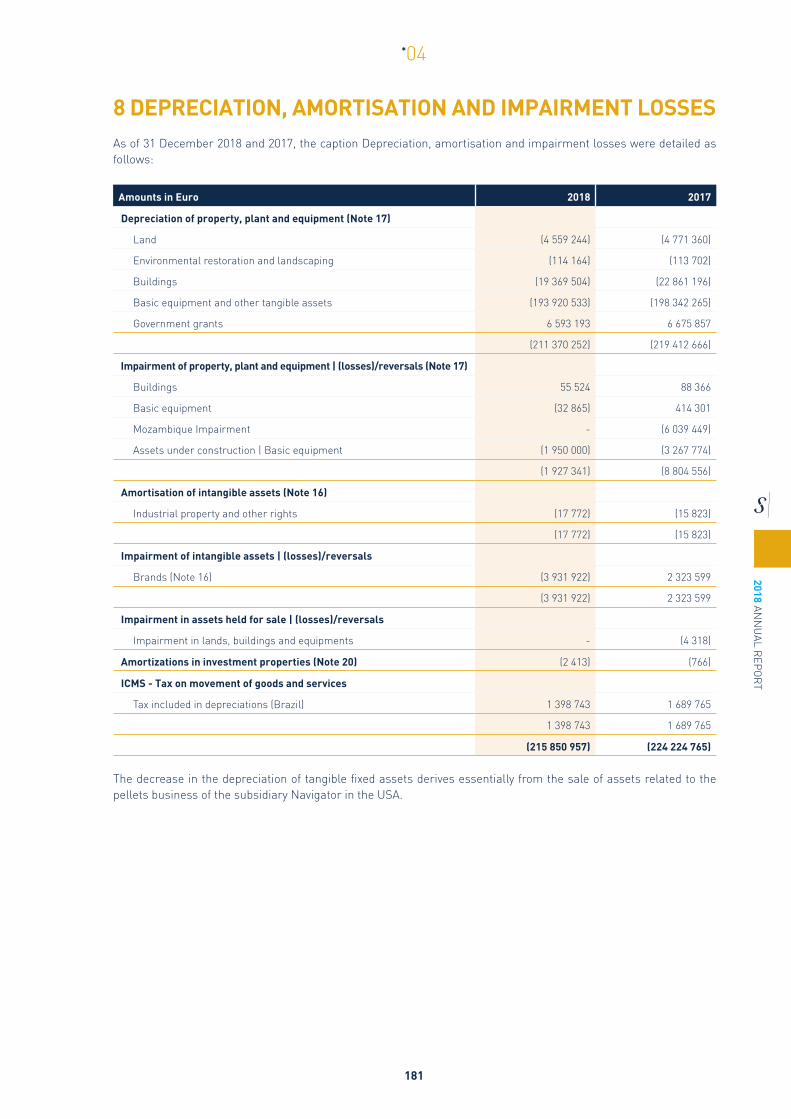
2018 ANN
UAL R
EPO
RT
181
*04
8 DEPRECIATION, AMORTISATION AND IMPAIRMENT LOSSESAs of 31 December 2018 and 2017, the caption Depreciation, amortisation and impairment losses were detailed as follows:
Amounts in Euro 2018 2017
Depreciation of property, plant and equipment (Note 17)
Land (4 559 244) (4 771 360)
Environmental restoration and landscaping (114 164) (113 702)
Buildings (19 369 504) (22 861 196)
Basic equipment and other tangible assets (193 920 533) (198 342 265)
Government grants 6 593 193 6 675 857
(211 370 252) (219 412 666)
Impairment of property, plant and equipment | (losses)/reversals (Note 17)
Buildings 55 524 88 366
Basic equipment (32 865) 414 301
Mozambique Impairment - (6 039 449)
Assets under construction | Basic equipment (1 950 000) (3 267 774)
(1 927 341) (8 804 556)
Amortisation of intangible assets (Note 16)
Industrial property and other rights (17 772) (15 823)
(17 772) (15 823)
Impairment of intangible assets | (losses)/reversals
Brands (Note 16) (3 931 922) 2 323 599
(3 931 922) 2 323 599
Impairment in assets held for sale | (losses)/reversals
Impairment in lands, buildings and equipments - (4 318)
Amortizations in investment properties (Note 20) (2 413) (766)
ICMS - Tax on movement of goods and services
Tax included in depreciations (Brazil) 1 398 743 1 689 765
1 398 743 1 689 765
(215 850 957) (224 224 765)
The decrease in the depreciation of tangible fixed assets derives essentially from the sale of assets related to the pellets business of the subsidiary Navigator in the USA.

2018
AN
NU
AL R
EPO
RT
182
*04
9 GROUP SHARE OF (LOSS)/GAINS OF ASSOCIATED COMPANIES AND JOINT VENTURESIn 2018 and 2017, the Group recorded its share of the net income/(loss) of associated companies and joint ventures as follows:
Amounts in Euro 2018 2017
Associated companies
Setefrete, SGPS, S.A. 778 733 955 652
J.M.J. - Henriques, Lda. (1 781) (1 736)
Ave-Gestão Ambiental e Val, Energética, S.A. 163 935 93 926
Utis - Ultimate Technology To Industrial Savings, Lda 241 875 -
1 182 762 1 047 842
The company does not recognise deferred tax liabilities on these amounts, when positive, as the provisions of article 51 of the CIT code apply.
10 NET FINANCIAL RESULTSAs of 31 December 2018 and 2017, Net financial results comprise:
Amounts in Euro 2018 2017
Interest paid on other borrowings (38 946 184) (50 858 129)
Interest paid on loans from shareholders (Note 35) (16 835) (32 103)
Interest paid on loans from associated companies and joint ventures (Note 35) (334) (5 144)
Other interest earned 3 401 143 4 106 957
Financial assets at fair value through profit and loss - (2 750)
Gains / (losses) on financial instruments - hedging (Note 34) (6 526 185) 2 919 727
Gains / (losses) on financial instruments - trading (Note 34) 140 363 1 085 318
Foreign exchange gains / (losses) (12 727 099) (12 872 406)
Expenses with loans and other commissions (9 585 650) (9 735 510)
Environment and landscape recovery (Note 30) (309 709) (283 585)
(Losses)/gains with compensatory interest (733 475) 1 548 234
Other financial expenses (4 717 578) (804 256)
Other financial income 9 220 22 268
(70 012 323) (64 911 379)
The captions Gains/(losses) on trading and hedging financial instruments comprise the changes in fair value registered in the year with the instruments described in Note 34.
In 2018, Other financial expenses includes the amount of EUR 2,404,116 resulting from the recognition of the difference between the nominal value and the present value of the amount receivable from the sale of the pellets business (USD 45 million). The nominal interest receivable shall bear interest at the rate of 2.5%. This amount is reflected in Other interest earned (EUR 866,218).
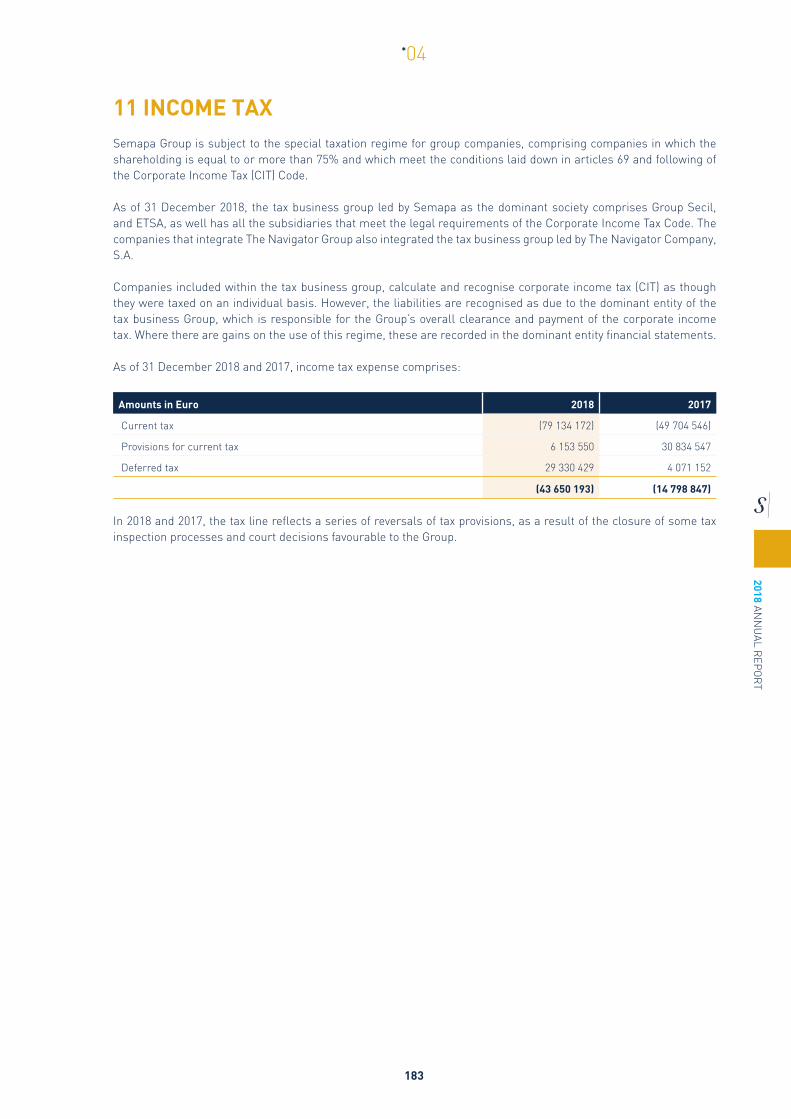
2018 ANN
UAL R
EPO
RT
183
*04
11 INCOME TAXSemapa Group is subject to the special taxation regime for group companies, comprising companies in which the shareholding is equal to or more than 75% and which meet the conditions laid down in articles 69 and following of the Corporate Income Tax (CIT) Code.
As of 31 December 2018, the tax business group led by Semapa as the dominant society comprises Group Secil, and ETSA, as well has all the subsidiaries that meet the legal requirements of the Corporate Income Tax Code. The companies that integrate The Navigator Group also integrated the tax business group led by The Navigator Company, S.A.
Companies included within the tax business group, calculate and recognise corporate income tax (CIT) as though they were taxed on an individual basis. However, the liabilities are recognised as due to the dominant entity of the tax business Group, which is responsible for the Group’s overall clearance and payment of the corporate income tax. Where there are gains on the use of this regime, these are recorded in the dominant entity financial statements.
As of 31 December 2018 and 2017, income tax expense comprises:
Amounts in Euro 2018 2017
Current tax (79 134 172) (49 704 546)
Provisions for current tax 6 153 550 30 834 547
Deferred tax 29 330 429 4 071 152
(43 650 193) (14 798 847)
In 2018 and 2017, the tax line reflects a series of reversals of tax provisions, as a result of the closure of some tax inspection processes and court decisions favourable to the Group.
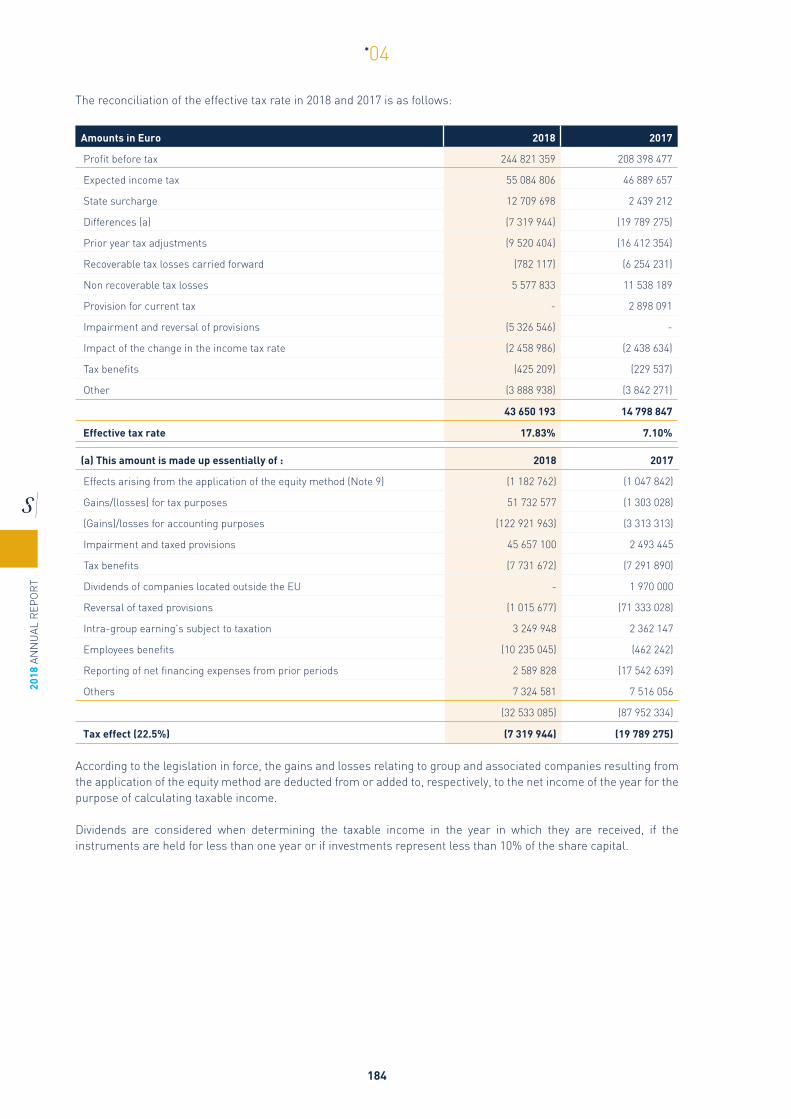
2018
AN
NU
AL R
EPO
RT
184
*04
The reconciliation of the effective tax rate in 2018 and 2017 is as follows:
Amounts in Euro 2018 2017
Profit before tax 244 821 359 208 398 477
Expected income tax 55 084 806 46 889 657
State surcharge 12 709 698 2 439 212
Differences (a) (7 319 944) (19 789 275)
Prior year tax adjustments (9 520 404) (16 412 354)
Recoverable tax losses carried forward (782 117) (6 254 231)
Non recoverable tax losses 5 577 833 11 538 189
Provision for current tax - 2 898 091
Impairment and reversal of provisions (5 326 546) -
Impact of the change in the income tax rate (2 458 986) (2 438 634)
Tax benefits (425 209) (229 537)
Other (3 888 938) (3 842 271)
43 650 193 14 798 847
Effective tax rate 17.83% 7.10%
(a) This amount is made up essentially of : 2018 2017
Effects arising from the application of the equity method (Note 9) (1 182 762) (1 047 842)
Gains/(losses) for tax purposes 51 732 577 (1 303 028)
(Gains)/losses for accounting purposes (122 921 963) (3 313 313)
Impairment and taxed provisions 45 657 100 2 493 445
Tax benefits (7 731 672) (7 291 890)
Dividends of companies located outside the EU - 1 970 000
Reversal of taxed provisions (1 015 677) (71 333 028)
Intra-group earning's subject to taxation 3 249 948 2 362 147
Employees benefits (10 235 045) (462 242)
Reporting of net financing expenses from prior periods 2 589 828 (17 542 639)
Others 7 324 581 7 516 056
(32 533 085) (87 952 334)
Tax effect (22.5%) (7 319 944) (19 789 275)
According to the legislation in force, the gains and losses relating to group and associated companies resulting from the application of the equity method are deducted from or added to, respectively, to the net income of the year for the purpose of calculating taxable income.
Dividends are considered when determining the taxable income in the year in which they are received, if the instruments are held for less than one year or if investments represent less than 10% of the share capital.

2018 ANN
UAL R
EPO
RT
185
*04
12 EARNINGS PER SHAREThere are no convertible financial instruments over Semapa’s shares, so there is no dilution of earnings.
Earnings per share, in 2018 and 217, are detailed as follows:
Amounts in Euro 2018 2017
Profit attributable to Semapa's shareholders 132 554 338 124 093 467
Total number of shares issued 81 270 000 81 270 000
Average number of treasury shares in the portfolio (588 174) (586 329)
Weighted average number of ordinary shares 80 681 826 80 683 671
Total number of treasury shares in the portfolio as of 31-12 640 666 586 329
Basic earnings per share 1.643 1.538
Diluted earnings per share 1.643 1.538
As of 31 December 2018 and 2017, Semapa - Sociedade de Investimento e Gestão, SGPS, S.A., held 640,666 and 586,329 treasury shares, respectively (Note 26).
13 NON-CONTROLLING INTERESTSAs of 31 December 2018 and 2017, non-controlling interests shown in the Income statement are detailed as follows:
Amounts in Euro
%
held
Income
2018 2017
The Navigator Company, S.A. 30.56% 65 496 065 60 186 426
Raiz - Instituto de Investigação da Floresta e Papel 3.00% 1 915 (1 467)
Société des Ciments de Gabés 1.28% 28 981 (26 309)
IRP - Indústria de Rebocos de Portugal, S.A. 25.00% 174 318 102 726
Secil - Companhia de Cimento do Lobito, S.A. 49.00% (1 041 672) (914 802)
Ciments de Sibline, S.A.L. 48.95% 3 871 491 10 085 830
Grupo Cimentos Madeira 0.00% (933) 203
ETSA - Investimentos, SGPS, S.A. 0.01% 225 362
Others 86 438 73 194
68 616 828 69 506 163

2018
AN
NU
AL R
EPO
RT
186
*04
As of 31 December 2018 and 2017, non-controlling interests in the Consolidated Statement of financial position are detailed as follows:
Amounts in Euro
%
held
Equity
31/12/2018 31/12/2017
The Navigator Company, S.A. 30.56% 302 336 582 305 484 936
Raiz - Instituto de Investigação da Floresta e Papel 3.00% 204 263 420 277
Société des Ciments de Gabés 1.28% 681 172 803 206
IRP - Indústria de Rebocos de Portugal, S.A. 25.00% 388 213 438 895
Secil - Companhia de Cimento do Lobito, S.A. 49.00% (2 025 265) (2 030 796)
Ciments de Sibline, S.A.L. 48.95% 64 252 394 67 023 056
Grupo Cimentos Madeira 0.00% 64 152 5 182 101
ETSA - Investimentos, SGPS, S.A. 0.01% 7 905 7 679
Others 1 327 378 1 218 077
367 236 794 378 547 431
In 2014, The Navigator Group signed agreements with IFC - International Finance Corporation for the entry of this institution into the capital of the subsidiary Portucel Moçambique, S.A., thus ensuring the construction phase of the Group’s forestry project in Mozambique. In 2015, this firm originated a capital increase of MZN 1,000, to MZN 1,680,798 million, in which IFC subscribed MZN 332,798 million, corresponding to 19.8% of the capital at that date, although it has not yet realised the entire counter value in Euros of that capital increase, and therefore the unrealised amount has been reclassified to equity of the parent company’s shareholders.
As of 31 December 2018, there are no rights of protection of non-controlling interests that significantly restrict the entity’s ability to access or use assets and settle liabilities of the Group.
The movement in the non-controlling interests, by operating segments, in the years ended as at 31 December 2018 and 2017 is as follows:
Amounts in Euro Pulp and
paperCement
and derivatives
Environment Total
Balance as of 1 January 2017 325 385 020 84 361 871 7 316 409 754 207
Capital decrease - (314 367) - (314 367)
Dividends (76 497 856) (11 670 021) - (88 167 877)
Currency translation reserve (4 035 157) (9 064 982) - (13 100 139)
Financial instruments 1 392 464 16 - 1 392 480
Actuarial gains and losses 1 326 576 65 - 1 326 641
Other movements in equity (1 850 792) 1 115 - (1 849 677)
Profit for the year 60 184 959 9 320 842 362 69 506 163
Balance as of 31 December 2017 305 905 214 72 634 539 7 678 378 547 431
Acquisitions / (Disposals) (760 918) (5 250 304) - (6 011 222)
Dividends (61 197 407) (10 180 618) - (71 378 025)
Currency translation reserve (2 021 055) 4 365 953 - 2 344 898
Financial instruments (799 559) (3) - (799 562)
Actuarial gains and losses (3 876 220) (141) - (3 876 361)
Other movements in equity (207 190) (3) - (207 193)
Profit for the year 65 497 980 3 118 621 227 68 616 828
Balance as of 31 December 2018 302 540 845 64 688 044 7 905 367 236 794

2018 ANN
UAL R
EPO
RT
187
*04
During 2018, the subsidiary Secil acquired the remaining % of the capital of Cimentos Madeira (47%) for an amount of EUR 4,500,000. The negative difference between the acquisition value and the fair value of the non-controlling interests acquired, in the amount of Euros 617,015, was recorded directly in shareholders’ equity as defined in the applicable accounting policy.
14 APPLICATION OF PREVIOUS YEAR’S PROFITIn accordance with the resolutions of the Annual General Shareholders’ Meeting regarding the financial statements approval, the profit of both 2017 and 2016 were applied as follows:
Amounts in Euro
Application of net profit
2017 2016
Dividends distribution 41 310 040 36 307 652
Profit-sharing bonuses 3 615 516 3 509 978
Other reserves 79 167 911 75 045 182
Profit for the year 124 093 467 114 862 812
Dividends per share 0.512 0.450
The legal reserve is constituted by its maximum amount.
Following the approval at Semapa’s Annual General Shareholders’ Meeting of 24 May 2018, it was approved to pay dividends related to the net results of 2017 obtained in individual basis in accordance with IFRS and amounting to approximately EUR 41.3 million (51.2 cents per share in circulation) as well as the payment of balance bonuses to its employees up to a maximum of 4.4 million euros.
15 GOODWILLThe movement in Goodwill in 2018 and 2017 were as follows:
Amounts in Euro 31/12/2018 31/12/2017
Balance at the beginning of the year 352 024 516 352 812 897
Acquisitions - 7 739 608
Exchange rate adjustments (5 853 529) (8 527 989)
Final balance 346 170 987 352 024 516
Note: The amounts presented are net of impairment losses
Goodwill is attributed to the Group’s cash generating units (CGU’s) that correspond to the operating segments identified in Note 4, as follows:
Amounts in Euro 31/12/2018 31/12/2017
Cement and derivatives 186 840 525 192 694 054
Pulp and paper 122 907 528 122 907 528
Environment 36 422 934 36 422 934
346 170 987 352 024 516
CHANGES IN PERIMETERIn March 2017, the subsidiary Secil completed the acquisition of a business unit comprising a cement terminal, two quarries and thirteen ready-mixed plants located in the Spanish regions of Asturias, Galicia and Castile and León, to the LafargeHolcim group. There are no contingent liabilities identified as a result of this acquisition. From this acquisition resulted a Goodwill in the amount of EUR 7,739,608.

2018
AN
NU
AL R
EPO
RT
188
*04
IMPAIRMENT TESTSAs recommended by IAS 36, Goodwill is subject to impairment tests carried out on a minimum annual basis or when there is evidence of impairment, in accordance with the accounting policy described in Note 1.7.
For impairment tests of CGUs, the recoverable amount was determined based on the value in use, according to the discounted cash flow method. The recoverable amount of CGUs is derived from assumptions related to the activity, namely sales volumes, average selling prices and variable costs, that in the projection periods result from a combination of economic forecasts for the regions and markets where the Group operates, industry forecasts, including changes in the markets derived from changes in installed capacity for each operational activity, internal management projections and historical performance.
These projections result from budgets for the following year and estimates of cash flows for a subsequent period of four years, reflected in the approved Medium/Long-Term Plans.
Cash flows are discounted at WACC (Weighted Average Cost of Capital) rates based on CAPM (Capital Asset Pricing Model) and based on weighted average debt and equity costs, estimated according to the segments where CGUs are inserted. The risk-free interest rate and the Country Risk Premium considered are the result of market information on medium-term sovereign debt. The beta and industry leverage are based on information from a broad range of comparable companies, subject to annual review. All this information is collected from international and independent sources, among others, through Reuters and rating agencies (S&P, Moody’s and Fitch).
The growth rate in perpetuity reflects the medium-term management’s view of the different CGUs, taking into account the inflation targets of the respective Central Banks, future inflation rate estimates, macroeconomic outlooks, as well as the foreseeable evolution of the Markets where the Group operates. The sources of macroeconomic forecasts are the IMF and the Bank of Portugal (Banco de Portugal).
The assumptions that were the basis of the business plans are detailed as follows:
Assumptions (CAGR 2019-2023)
Pulp and paper
Cement and Derivatives
Environment Portugal Tunisia Lebanon Brazil Angola*
Sales in quantity (kt)
Reference UWF Paper Cement and Clinker Fat [3.5]
CAGR Sales in quantity (kt) 0.4% -1.2% 0.5% -2.9% 6.3% 5.4% -0.3%
Average selling price LC/t
Reference UWF Paper Grey Cement in the Domestic Market Fat [3.5]
CAGR Average Selling Price LC/t 0.0% 1.6% 2.8% 1.0% 7.4% 8.9% 6.4%
Total Cash Costs LC
CAGR Total Cash Costs LC -0.1% 2.3% 1.1% -2.4% 6.4% 7.8% 1.2%
LC: Local Currency
*In Angola, the CAGR of the Average Selling Price has AOA currency but the CAGR of the Total Cash Costs has USD currency.

2018 ANN
UAL R
EPO
RT
189
*04
Assumptions (CAGR 2018-2022)
Pulp and paper
Cement and Derivatives
Environment Portugal Tunisia Lebanon Brazil Angola*
Sales in quantity (kt)
Reference UWF Paper Cement and Clinker Fat [3.5]
CAGR Sales in quantity (kt) 0.5% -3.4% 0.5% -1.7% 7.2% 2.9% -0.1%
Average selling price LC/t
Reference UWF Paper Grey Cement in the Domestic Market Fat [3.5]
CAGR Average Selling Price LC/t 0.1% 1.0% 5.0% 1.4% 8.0% 8.3% 2.1%
Total Cash Costs LC
CAGR Total Cash Costs LC 0.9% 4.1% 0.3% -1.6% 5.5% 1.0% 1.7%
LC: Local Currency
*In Angola, the CAGR of the Average Selling Price has AOA currency but the CAGR of the Total Cash Costs has USD currency.
Macroeconomic assumptions
31/12/2018 31/12/2017
2019 2020 2021 2022 2023 2018 2019 2020 2021 2022
Pulp and paper
Portugal
GDP growth rate 1.9% 1.7% 1.4% 1.4% 1.4% 2.0% 1.8% 1.5% 1.2% 1.2%
Inflation EUR 1.5% 1.4% 1.9% 2.1% 2.1% 1.4% 1.5% 2.2% 2.3% 2.4%
Cement and other building materials
Portugal
GDP growth rate 1.9% 1.7% 1.4% 1.4% 1.4% 2.0% 1.8% 1.5% 1.2% 1.2%
Inflation EUR 1.5% 1.4% 1.9% 2.1% 2.1% 1.4% 1.5% 2.2% 2.3% 2.4%
Tunisia
GDP growth rate 2.9% 3.4% 3.6% 4.0% 4.2% 3.1% 3.5% 4.1% 4.3% 4.3%
Inflation TND 6.1% 5.9% 4.9% 4.3% 4.0% 4.4% 4.0% 3.8% 3.6% 3.5%
Lebanon
GDP growth rate 1.4% 2.0% 2.4% 2.9% 2.9% 2.5% 2.5% 2.5% 3.0% 3.0%
Inflation LBP 3.0% 2.4% 2.4% 2.4% 2.4% 2.5% 2.0% 2.0% 2.0% 2.0%
Brazil
GDP growth rate 2.4% 2.3% 2.2% 2.2% 2.2% 2.0% 2.0% 2.0% 2.0% 2.0%
Inflation BRL 4.1% 4.1% 4.0% 4.0% 4.0% 4.0% 4.1% 4.1% 4.0% 4.0%
Angola
GDP growth rate 3.1% 3.2% 3.2% 3.7% 3.8% 1.5% 1.4% 1.5% 1.4% 1.4%
Inflation USD 2.1% 2.3% 2.2% 2.2% 2.2% 2.1% 2.6% 2.4% 2.2% 2.3%
Inflation AOA 17.0% 10.9% 8.9% 7.5% 6.5% 20.6% 14.0% 13.3% 10.9% 9.5%
Environment
Portugal
GDP growth rate 1.9% 1.7% 1.4% 1.4% 1.4% 2.0% 1.8% 1.5% 1.2% 1.2%
Inflation EUR 1.5% 1.4% 1.9% 2.1% 2.1% 1.4% 1.5% 2.2% 2.3% 2.4%

2018
AN
NU
AL R
EPO
RT
190
*04
The main assumptions of a financial nature used in the impairment tests are detailed as follows:
Financial Assumptions
31/12/2018 31/12/2017
Risk Free
Interest rate *
WACC Rate EUR
Perp. Growth
Rate EUR Tax rate
Risk Free
Interest rate *
WACC Rate EUR
Perp. Growth
Rate EUR Tax rate
Pulp and paper
Portugal
Explicit Planning Period 1.83% 6.59% - 27.50% 2.34% 6.83% - 27.50%
Perpetuity 1.83% 6.59% 0.00% 27.50% 2.34% 6.83% 0.00% 27.50%
Cement and derivatives
Portugal
Explicit Planning Period 1.83% 6.43% - 27.50% 2.34% 6.93% - 27.50%
Perpetuity 1.83% 6.43% 1.35% 27.50% 2.34% 6.93% 2.00% 27.50%
Environment
Portugal
Explicit Planning Period 1.83% 5.97% - 27.50% 2.34% 5.55% - 27.50%
Perpetuity 1.83% 5.97% 1.25% 27.50% 2.34% 5.55% 1.25% 27.50%
Note: Cement and derivatives also considered the WACC rates in Euros between 7.6% and 11.2% for Brazil, Tunisia, Lebanon and Angola
* Country Risk Premium Included
As a result of the impairment tests performed in 2018 and 2017, no impairment loss was identified in Goodwill.
In addition, sensitivity analyses (see Note 3.1) were made to the fundamental assumptions considered in the impairment tests performed for each of the identified Cash Generating Units, as follows:
• Reduction of free cash flow by 5% compared to the base scenario. This sensitivity analysis performed independently for this assumption did not determine any impairment of Goodwill allocated to each CGU; and
• Increase of 50 base points in the discount rate used (WACC) in the base scenario. This sensitivity analysis performed independently for this assumption did not determine any impairment of Goodwill allocated to each CGU.
Derived from the current tax legislation in Portugal, it is not expected that Goodwill generated and recognized in the Consolidated Statement of Financial Position as of 31 December 2018 will be tax deductible.

2018 ANN
UAL R
EPO
RT
191
*04
16 OTHER INTANGIBLE ASSETSDuring 2018 and 2017, changes under the caption Other intangible assets, as well as amortisations and impairment losses, were as follows:
Amounts in Euro Brands
Expenditures on research and
development
Industrial properties and
other rightsCO2 emission
allowancesAssets under construction Total
Gross Amount
Balance as of 1 January 2017 289 119 833 11 737 259 211 18 358 391 4 558 307 753 730
Change of perimeter 1 803 911 - - 13 618 - 1 817 529
Acquisition / attributions - - 1 870 11 595 839 28 666 11 626 375
Disposals - - - (2 497 667) - (2 497 667)
Adjustments, transfers and write-offs (1 915 517) - (254 811) (10 164 101) (21 723) (12 356 152)
Exchange rate adjustment (8 789 006) - - (13 618) - (8 802 624)
Balance as of 31 December 2017 280 219 221 11 737 6 270 17 292 462 11 501 297 541 191
Change of perimeter - - - - - -
Acquisition / attributions - - 165 26 554 702 3 512 26 558 379
Disposals - - - (4 035 273) - (4 035 273)
Adjustments, transfers and write-offs - - 8 201 (13 150 999) (11 501) (13 154 299)
Exchange rate adjustment (2 251 900) - - - - (2 251 900)
Balance as of 31 December 2018 277 967 321 11 737 14 636 26 660 892 3 512 304 658 098
Accumulated amortisation and impairment losses
Balance as of 1 January 2017 (10 884 837) (10 844) (236 444) (1) - (11 132 126)
Change of perimeter - - - - - -
Amortisation and impairment losses 2 308 220 - (444) - - 2 307 776
Disposals - - (56 665) - - (56 665)
Adjustments , transfers and write-offs 155 103 - 289 703 - - 444 806
Exchange rate adjustment 960 475 - - - - 960 475
Balance as of 31 December 2017 (7 461 039) (10 844) (3 850) (1) - (7 475 734)
Change of perimeter - - - - - -
Amortisation and impairment losses (3 948 929) - (765) - - (3 949 694)
Disposals - - - - - -
Adjustments , transfers and write-offs - - 3 098 - - 3 098
Exchange rate adjustment (388 886) - - - - (388 886)
Balance as of 31 December 2018 (11 798 854) (10 844) (1 517) (1) - (11 811 216)
Net book value as of 1 January 2017 278 234 996 893 22 767 18 358 390 4 558 296 621 604
Net book value as of 31 December 2017 272 758 182 893 2 420 17 292 461 11 501 290 065 457
Net book value as of 31 December 2018 266 168 467 893 13 119 26 660 891 3 512 292 846 882
The amount shown under the caption Brands comprises:
• Pulp and Paper segment: EUR 151,487,000, corresponding to Navigator and Soporset brands.
• Cement and derivatives segment: EUR 114,681,467, corresponding to Secil Portugal (EUR 69,700,000), Sibline (Lebanon – EUR 18,423,035), Gabès (Tunisia – EUR 5,783,326), and Supremo (Brazil – EUR 20,756,925) brands. It should be noted that the amount corresponding to Sibline, Gabès and Supremo brands is subject to exchange rate update, in accordance with the accounting policy described in Note 1.5.
The referred amounts are not subjected to amortisation as their useful life is undefined (Note 1.6). For valuation purposes, it is considered that brands have an undefined useful life, because it is assumed that it is not possible to determine with an acceptable degree of reliability a time limit for their continuity in the market.

2018
AN
NU
AL R
EPO
RT
192
*04
The Group annually tests these intangible assets for impairment purposes, as recommended by IAS 36, using valuations made by a specialised and independent entity, and the recoverable value is determined based on the value in use, according to the discounted cash flow method.
The main assumptions used in the valuation of brands of Pulp and Paper segment in 2018 and 2017, for the purposes of impairment testing, were as follows:
2018 Brand Markets
Risk-free interest rate* Discount rate Tax rate
Navigator
Europe 1.05% 6.59% 27.5%
USA 2.89% 6.59% 27.5%
World 6.00% 6.59% 27.5%
Soporset
Europe 1.05% 6.59% 27.5%
EUA 2.89% 6.59% 27.5%
World 6.00% 6.59% 27.5%
* Country Risk Included
2017Brand Markets
Risk-free interest rate* Discount rate Tax rate
Navigator
Europe 0.98% 6.83% 27.5%
USA 2.35% 6.83% 27.5%
World 6.50% 6.83% 27.5%
Soporset
Europe 0.98% 6.83% 27.5%
EUA 2.35% 6.83% 27.5%
World 6.50% 6.83% 27.5%
* Country Risk Included

2018 ANN
UAL R
EPO
RT
193
*04
Os principais pressupostos utilizados nas avaliações efetuadas no exercício de 2018 e 2017 às marcas do segmento do Cimento e Derivados. para efeitos de testes de imparidade. detalham-se como segue:
2018 Brand Markets
Risk-free interest rate *
Discount rate ** Tax rate
Secil Portugal Portugal 1.83% 6.43% 27.5%
Ciments de Sibline Lebanon 7.96% 11.63% 17.0%
Supremo Cimentos Brazil 5.44% 10.44% 34.0%
Société des Ciments de Gabés Tunisia 9.70% 13.44% 25.0%
* Country Risk Included
** Local Currency
2017 Brand Markets
Risk-free interest rate *
Discount rate ** Tax rate
Secil Portugal Portugal 2.34% 6.93% 27.5%
Ciments de Sibline Lebanon 8.32% 11.86% 17.0%
Supremo Cimentos Brazil 5.27% 10.42% 34.0%
Société des Ciments de Gabés Tunisia 7.84% 11.81% 25.0%
* Country Risk Included
** Local Currency
As previously mentioned, the brands were valued by an independent entity, based on the post-tax discounted cash flow method denominated “income split method” associated to the influence of the brand (difference between the net margin of the brand less investments in marketing and the net margin of the associated brand), discounted to the evaluation period based on a specific discount rate.
As a result of the evaluations performed in 2018, it was identified and recorded an impairment loss on the Ciments de Sibline (Lebanon) brand, in the amount of EUR 3,931,922 (in 2017 there was an impairment registered for this brand in the amount of EUR 1,115,678). See Notes 8 and 22.
In addition, sensitivity analyses were performed on the fundamental assumptions considered in the evaluations performed, namely: 1) reduction of the EVA indicator by 5%, compared to the base scenario; and 2) a 50 base point increase in the WACC rate in Euros used in the scenario base. These sensitivity analyses were performed independently for each assumption.
If these assumptions had been adopted, the Sibline brand would have an impairment of 5% and 8% of its book value in euros, respectively in scenarios 1) and 2). For the remaining brands, this sensitivity analysis would not determine any impairment loss.
As of 31 December 2018, the Group held 2,951,742 CO2 licenses (31 December 2017: 3,199,335 CO2 licenses) registered in accordance with the policy described in Note 1.6.1.

2018
AN
NU
AL R
EPO
RT
194
*04
17 PROPERTY, PLANT AND EQUIPMENTThe following movements were registered in the years ended as of 31 December 2018 and 2017 under the caption Property, plant and equipment, as well as on the respective depreciation and impairment losses accounts:
Amounts in Euro Land
Buildings and other
constructions
Equipments and other tangibles
Assets under construction Total
Acquisition Cost
Balance as of 1 January 2017 443 352 555 1 144 411 151 5 359 019 311 111 098 763 7 057 881 780
Change of perimeter 101 635 855 684 1 927 500 - 2 884 819
Acquisition 5 025 610 334 545 4 200 804 134 445 890 144 006 849
Disposals (3 909 506) (3 445 215) (6 455 507) (761 500) (14 571 728)
Adjustments, transfers and write-offs 4 762 923 9 273 845 42 490 915 (57 572 224) (1 044 541)
Exchange rate adjustment (20 241 660) (24 944 987) (73 621 817) (1 603 560) (120 412 024)
Assets held for sale (1 609 029) (28 388 030) (54 512 455) (924 392) (85 433 906)
Balance as of 31 December 2017 427 482 528 1 098 096 993 5 273 048 751 184 682 977 6 983 311 249
Change of perimeter - - - - -
Acquisition 819 863 220 679 13 225 958 228 942 168 243 208 668
Disposals (3 661 595) (1 128 772) (6 342 591) - (11 132 958)
Adjustments, transfers and write-offs 1 808 890 29 231 593 230 637 654 (273 387 181) (11 709 044)
Exchange rate adjustment (11 645 264) (11 763 100) (33 818 103) (2 830 373) (60 056 840)
Assets held for sale (Note 33) - - - - -
Balance as of 31 December 2018 414 804 422 1 114 657 393 5 476 751 669 137 407 591 7 143 621 075
Accumulated depreciations and impairment losses
Balance as of 1 January 2017 (64 858 788) (683 635 699) (3 940 830 251) (55 066 728) (4 744 391 466)
Change of perimeter - - - - -
Depreciation and impairment losses (4 771 360) (22 886 532) (197 161 832) - (224 819 724)
Disposals 5 685 2 480 044 5 390 442 - 7 876 171
Impairment Losses (5 004 528) - - (4 302 695) (9 307 223)
Adjustments, transfers and write-offs 29 813 1 986 693 1 039 663 1 829 286 4 885 455
Exchange rate adjustment 3 471 034 7 547 391 35 674 474 356 850 47 049 749
Balance as of 31 December 2017 (71 128 144) (694 508 103) (4 095 887 504) (57 183 287) (4 918 707 038)
Depreciation and impairment losses (4 559 244) (19 063 714) (194 317 828) 974 095 (216 966 691)
Disposals - 707 921 4 067 910 - 4 775 831
Impairment Losses - - - (1 950 000) (1 950 000)
Adjustments, transfers and write-offs 216 556 586 749 1 351 102 9 759 089 11 913 496
Exchange rate adjustment 2 263 725 2 879 477 14 760 443 1 163 447 21 067 092
Balance as of 31 December 2018 (73 207 107) (709 397 670) (4 270 025 877) (47 236 656) (5 099 867 310)
Net book value as of 1 January 2017 378 493 767 460 775 452 1 418 189 060 56 032 035 2 313 490 314
Net book value as of 31 December 2017 356 354 384 403 588 890 1 177 161 247 127 499 690 2 064 604 211
Net book value as of 31 December 2018 341 597 315 405 259 723 1 206 725 792 90 170 935 2 043 753 765
Commitments related to Property, plant and equipment acquisitions are detailed in Note 39.
As of 31 December 2018, assets under construction included EUR 2,332,970 (31 December 2017: EUR 20,936,800) related to advances on property, plant and equipment performed within the scope of the investment projects currently development in the Group.
Assets under construction include mainly the PM3 reconversion project for heavier paper in Setúbal, from the subsidiary Navigator, as well as environmental plans in Cacia and Setúbal also of this subsidiary and investments associated with improvements in production processes in the several plants of the Group.

2018 ANN
UAL R
EPO
RT
195
*04
In 2018 and 2017, Adjustments, transfers and write-offs refer essentially to the transfer of investments in progress to the remaining items of tangible fixed assets, made effective at the time they were available for the intended use. In 2018, the amount of transfers is essentially composed of the investment assets held by the subsidiary The Navigator Company in the new Tissue plant, in Cacia, which became operational in that year.
During the years of 2018 and 2017 no financial charges for loans directly related to the acquisition, construction or production of fixed assets were capitalised.
The breakdown of tangible fixed assets by geographical location, as of 31 December 2018 and 2017, is detailed as follows:
Amounts in Euro 31/12/2018 31/12/2017
Portugal 1 637 093 035 80.1% 1 609 280 024 77.9%
Rest of Europe 9 371 891 0.5% 10 299 965 0.5%
America 248 239 818 12.1% 278 948 329 13.5%
Africa 63 041 160 3.1% 80 232 752 3.9%
Asia 86 007 861 4.2% 85 843 141 4.2%
2 043 753 765 100.0% 2 064 604 211 100.0%
18 BIOLOGICAL ASSETSThe biological assets of the Group correspond essentially to forests held for the production of wood susceptible to incorporation in the pulp manufacturing process (BEKP), including other species such as pine and cork oak.
As described in Notes 1.11 and 3.4, the fair value method of discounted cash flows was used in determining the fair value of biological assets (Note 34), in which a number of assumptions were considered, namely forest productivity, sale of timber, cutting costs, rental costs of own and leased forest lands, costs of loading and transport, planting and maintenance costs, and the discount rate. The rate used in 2018 was 5.01% (2017: 5.35%).
Biological assets as of 31 December 2018 and 2017 are as follows:
Amounts in Euro 31/12/2018 31/12/2017
Eucalyptus (Portugal) 112 935 412 115 198 626
Pine (Portugal) 4 590 452 5 136 610
Cork (Portugal) 1 848 841 2 167 541
Other species (Portugal) 239 862 225 939
Eucalyptus (Mozambique) - 6 668 220
119 614 567 129 396 936

2018
AN
NU
AL R
EPO
RT
196
*04
As of 31 December 2018 and 2017, changes in biological assets were as follows:
Amounts in Euro 31/12/2018 31/12/2017
Balance at the beginning of the year 129 396 936 125 612 948
Changes
Logging in the year (20 580 687) (21 192 882)
Growth 14 030 666 12 358 248
New plantations 2 948 334 2 682 277
Other changes in fair value (6 180 682) 9 936 345
Total changes (9 782 369) 3 783 988
119 614 567 129 396 936
The amounts presented under Other changes in fair value correspond essentially to the forest management costs foreseen and incurred in the year (forestry costs, structure and rents) as well as to the impact arising from changes in expectations incorporated in the model for determining the fair value and are detailed as follows:
Amounts in Euro 31/12/2018 31/12/2017
Costs of asset management
Forestry 3 648 331 3 278 191
Structure 4 431 804 4 451 938
Fixed and variable rents 10 765 078 10 391 180
Impairment in the Mozambican project (6 969 492) -
11 875 721 18 121 309
Changes in expectations
Wood price (4 849 200) (683 000)
Cost of capital rate 3 568 300 6 012 590
Variations in other species (850 935) 5 709 283
Impact of fires (1 793 848) (6 996 837)
Other changes in expectations (14 130 720) (12 227 000)
(18 056 403) (8 184 964)
(6 180 682) 9 936 345
Given that there is no active market for eucalyptus wood in Mozambique and the conditions for the beginning of construction of a chip factory have not yet been created, the Navigator Group decided to record an impairment related to the fair value of the biological assets implanted in Zambezia, in the amount of Euros 6,969,492.
These values, calculated in accordance with the expected extraction of their productions, correspond to the following future production expectations:
Amounts in Euro 31/12/2018 31/12/2017
Eucalyptus (Portugal) - Potential future of wood extraction k m3ssc 9 571 9 943
Pine (Portugal) - Potential future of wood extraction k ton 389 413
Pine (Portugal) - Potential future of pine extraction k ton n/a n/a
Cork (Portugal) - Potential future of cork extraction k @ 611 644
Concerning Eucalyptus in Portugal, the most relevant biological asset in the financial statements for the year ended 31 December 2018 and 2017, the Group extracted 596,777 m3ssc and 577,526 m3ssc of wood from its owned and explored forests, respectively.

2018 ANN
UAL R
EPO
RT
197
*04
In addition, as of 31 December 2018 and 2017, i) there are no amounts of biological assets held and/or pledged as collateral for liabilities, or non-reversible commitments relating to the acquisition of biological assets, and ii) there are no government related subsidies with biological assets recognised in the Group’s consolidated financial statements.
A sensitivity analysis was performed on the assumption considered key, the discount rate used, the conclusions of which are presented in Note 3.4.
19 INVESTMENT IN ASSOCIATES AND JOINT VENTURESThe following movements were registered in this caption during the years ended as of 31 December 2018 and 2017:
Amounts in Euro 31/12/2018 31/12/2017
Opening balance 4 099 421 3 885 458
Acquisitions 300 000 -
Group share of (loss) / gain of associated companies
and joint ventures (Note 9) 1 182 762 1 047 842
Dividends received (867 174) (833 509)
Exchange rate adjustments (265) (370)
Closing balance 4 714 744 4 099 421
As of 31 December 2018 and 2017, the caption Investments in associates and joint ventures presented in the consolidated statement of financial position, including goodwill, comprises:
Entities
Book Value
% held 31/12/2018 % held 31/12/2017
Associated companies
Setefrete. SGPS. S.A. 25.00% 3 625 350 25.00% 3 577 867
MC - Materiaux de Construction 49.36% 1 432 49.36% 1 698
J.M.J. - Henriques. Lda. 50.00% 373 235 50.00% 375 017
Ave. S.A. 35.00% 172 850 35.00% 144 839
Utis - Ultimate Technology To Industrial Savings. Lda 50.00% 541 877 0.00% -
4 714 744 4 099 421
The value of the investment in the associate Setefrete, SGPS, S.A. includes an amount of EUR 2,227,750 of Goodwill.

2018
AN
NU
AL R
EPO
RT
198
*04
As of 31 December 2018 and 2017, Goodwill included in carrying amount of these investments is detailed as follows:
Amounts in Euro
31 December 2018
Total
Assets Total
Liabilities Equity Net Profit Revenue
Ave-Gestão Ambiental e Valorização Energética. S.A. b) 4 566 607 4 072 738 493 869 432 898 9 023 866
MC- Materiaux de Construction a) 796 503 769 644 26 859 166 619 2 188 447
J.M.J. - Henriques. Lda. a) 1 081 992 335 521 746 471 (3 563) -
Setefrete. SGPS. S.A. c) 6 056 720 466 322 5 590 398 2 741 254 94 328
Utis - Ultimate Technology To Industrial Savings. Lda a) 3 158 738 2 074 987 1 083 751 483 751 1 909 071
a) 31.12.2018 figuresb) 30.11.2018 figuresc) 30.11.2018 figures - adjusted individual accounts
Amounts in Euro
31 December 2017
Total
Assets Total
Liabilities Equity Net Profit Revenue
Ave-Gestão Ambiental e Valorização Energética. S.A. b) 2 959 114 2 545 287 413 827 352 867 9 305 007
MC- Materiaux de Construction a) 835 026 820 232 14 794 (78 587) 2 626 184
J.M.J. - Henriques. Lda. a) 1 081 249 331 215 750 034 (3 472) -
Setefrete. SGPS. S.A. c) 5 868 752 468 285 5 400 467 2 829 484 4 336 624
a) 31.12.2017 figuresb) 30.11.2017 figuresc) 30.11.2017 figures - adjusted individual accounts
20 INVESTMENT PROPERTIESAs of 31 December 2018 and 2017, Investment properties mainly includes land and buildings held for rental and/or valuation of capital, in accordance with the policy described in Note 1.9. Changes occurred in 2018 and 2017 were as follows:
Amounts in Euro Lands Buildings Total
Gross amount
Balance as of 1 January 2017 843 094 990 031 1 833 125
Disposals (162 606) (901 263) (1 063 870)
Balance as of 31 December 2017 680 487 88 768 769 255
Adjustments, transfers and write-offs - 31 843 31 843
Balance as of 31 December 2018 680 487 120 611 801 098
Accumulated amortisation and impairment losses
Balance as of 1 January 2017 (76 718) (799 941) (876 659)
Change of perimeter - - -
Amortisation and impairment losses (324 372) (2 412) (326 784)
Disposals - 820 114 820 114
Balance as of 31 December 2017 (401 090) 17 761 (383 329)
Amortisation and impairment losses - (2 413) (2 413)
Adjustments, transfers and write-offs - (31 843) (31 843)
Balance as of 31 December 2018 (401 090) (16 495) (417 585)
Net book value as of 1 January 2017 766 375 190 091 956 466
Net book value as of 31 December 2017 279 397 106 529 385 927
Net book value as of 31 December 2018 279 397 104 116 383 514
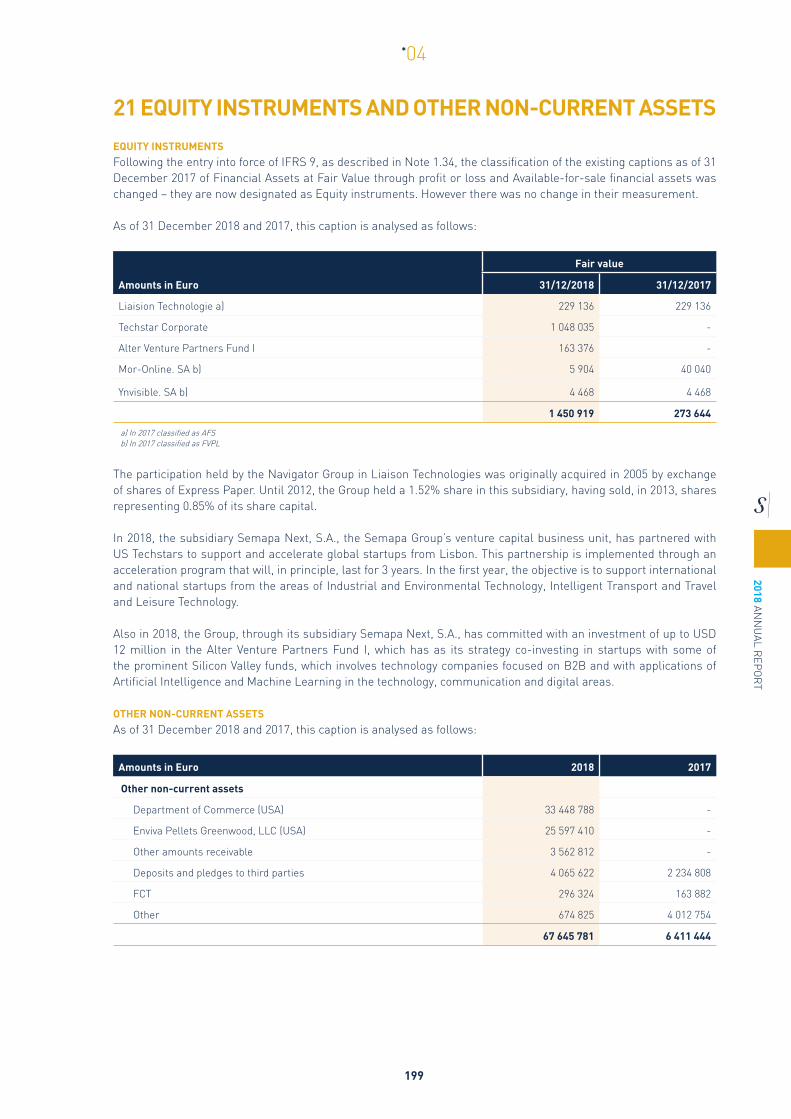
2018 ANN
UAL R
EPO
RT
199
*04
21 EQUITY INSTRUMENTS AND OTHER NON-CURRENT ASSETS
EQUITY INSTRUMENTS Following the entry into force of IFRS 9, as described in Note 1.34, the classification of the existing captions as of 31 December 2017 of Financial Assets at Fair Value through profit or loss and Available-for-sale financial assets was changed – they are now designated as Equity instruments. However there was no change in their measurement.
As of 31 December 2018 and 2017, this caption is analysed as follows:
Amounts in Euro
Fair value
31/12/2018 31/12/2017
Liaision Technologie a) 229 136 229 136
Techstar Corporate 1 048 035 -
Alter Venture Partners Fund I 163 376 -
Mor-Online. SA b) 5 904 40 040
Ynvisible. SA b) 4 468 4 468
1 450 919 273 644
a) In 2017 classified as AFS b) In 2017 classified as FVPL
The participation held by the Navigator Group in Liaison Technologies was originally acquired in 2005 by exchange of shares of Express Paper. Until 2012, the Group held a 1.52% share in this subsidiary, having sold, in 2013, shares representing 0.85% of its share capital.
In 2018, the subsidiary Semapa Next, S.A., the Semapa Group’s venture capital business unit, has partnered with US Techstars to support and accelerate global startups from Lisbon. This partnership is implemented through an acceleration program that will, in principle, last for 3 years. In the first year, the objective is to support international and national startups from the areas of Industrial and Environmental Technology, Intelligent Transport and Travel and Leisure Technology.
Also in 2018, the Group, through its subsidiary Semapa Next, S.A., has committed with an investment of up to USD 12 million in the Alter Venture Partners Fund I, which has as its strategy co-investing in startups with some of the prominent Silicon Valley funds, which involves technology companies focused on B2B and with applications of Artificial Intelligence and Machine Learning in the technology, communication and digital areas. OTHER NON-CURRENT ASSETSAs of 31 December 2018 and 2017, this caption is analysed as follows:
Amounts in Euro 2018 2017
Other non-current assets
Department of Commerce (USA) 33 448 788 -
Enviva Pellets Greenwood, LLC (USA) 25 597 410 -
Other amounts receivable 3 562 812 -
Deposits and pledges to third parties 4 065 622 2 234 808
FCT 296 324 163 882
Other 674 825 4 012 754
67 645 781 6 411 444

2018
AN
NU
AL R
EPO
RT
200
*04
The amount reflected in the Department of Commerce (USA) item corresponds to the amount receivable from this entity following the investigation of alleged dumping of UWF paper exports to the United States of America by the subsidiary Navigator and a definitive rate of 1.75% has been applied in October last for the review period between August 2015 and February 2017. The Group is entitled to a refund in the amount of EUR 25,597,410 due to the imposition of higher penalties for the same period of 29.53% and 7.8%, respectively. Since the complainants did not agree with the 1.75% rate, it is expected that the repayment will occur in more than 12 months from the balance sheet date, which is why this amount was reclassified, in the period, to non-current assets (see Note 24).
Enviva reflects the present value of the amount receivable from the sale of the pellets business (USD 45 million) by the subsidiary Navigator. The nominal receivable shall bear interest at the rate of 2.5%.
22 IMPAIRMENT IN NON-CURRENT AND CURRENT ASSETSIn the years ended as at 31 December 2018 and 2017, the following movements were registered on impairments in non-current assets:
Amounts in Euro Goodwill Brands
Other non-current
assets
Property, plant and
equipment Investments in associates Total
As of 1 January 2017 5 961 236 9 996 760 1 855 975 102 292 16 252 17 932 515
Change of perimeter - - - - - -
Increases (Notes 8 and 16) - 3 115 678 - - - 3 115 678
Reversals - (5 439 278) - - - (5 439 278)
As of 31 December 2017 5 961 236 7 673 160 1 855 975 102 292 16 252 15 608 915
Increases (Notes 8, 15 and 16) - - - - - -
Reversals (Notes 8 and 16) - 3 931 922 - - - 3 931 922
As of 31 December 2018 5 961 236 11 605 082 1 855 975 102 292 16 252 19 540 837
During the year ended as of 31 December 2018 and 2017, the following movements were registered on impairments in current assets:
Amounts in Euro InventoriesTrade
ReceivablesOther
ReceivablesCash and cash
equivalents Total
As of 1 January 2017 14 711 216 30 388 724 6 263 823 - 51 363 763
Increases (Note 6) 1 700 810 1 810 800 283 779 - 3 795 389
Reversals (Note 5) (982 411) (1 124 025) (25 915) - (2 132 351)
Charge-off (7 892) (409 293) - - (417 185)
Adjustments and transfers (1 367 839) (682 144) (30 608) - (2 080 591)
As of 31 December 2017 14 053 884 29 984 062 6 491 079 2 053 515 50 529 025
Exchange adjustment (544 265) (713 209) (44 776) - (1 302 250)
Increases (Note 6) 7 094 403 1 922 627 39 540 - 9 056 570
Reversals (Note 5) (3 690 730) (1 263 075) (46 860) - (5 000 665)
Charge-off (4 334) (3 644 573) (154 946) (70 450) (3 874 303)
Adjustments and transfers 26 240 969 518 (104 310) - 891 448
As of 31 December 2018 16 935 199 27 255 350 6 179 727 1 983 065 50 299 826
As mentioned in Note 1.34, IFRS 9 established a new impairment model based on “expected losses”, which replaces the previous “incurred losses” model under IAS 39. It is therefore no longer necessary for the loss event occurs in order to recognize an impairment.

2018 ANN
UAL R
EPO
RT
201
*04
In 2018, the impacts from the adoption of this standard were as follows:
Amounts in Euro 01-01-2018* 2018 31/12/2018
Impairments of Cash and cash equivalents (Note 31) (2 053 515) 70 450 (1 983 065)
Impairments in current receivables | Trade receivables (961 724) (502 604) (1 464 328)
Deferred tax assets (Note 28) 216 445 55 545 271 990
(2 798 794) (376 609) (3 175 403)
* Impact on transition recorded in Equity
23 INVENTORIESAs of 31 December 2018 and 2017, the caption Inventories comprised:
Amounts in Euro 31/12/2018 31/12/2017
Raw Materials 167 943 676 177 126 495
Finished and intermediate products 126 392 069 71 705 124
Work in progress 5 679 756 19 728 115
Goods 9 188 733 6 906 245
Sub-products and waste 4 688 357 5 287 251
Advance payments 18 872 3 116
313 911 463 280 756 346
Note: Values are presented net of impairment losses (Note 22)
The increase in Finished and intermediate product, mainly occurred in the Navigator subsidiary, resulted, on the one hand, from increases in production capacity at the Cacia and Figueira da Foz units and, on the other hand, from the need to rebuild stocks due to the high number of shut-down days of pulp mills, namely to support the production of paper and to restore inventories to appropriate levels of operation, after the historical lowest level reached in December 2017.
During the years of 2018 and 2017, movements in Raw materials, Goods, Sub-products and Advance payments were as follows:
Amounts in Euro 31/12/2018 31/12/2017
Opening balance 189 323 107 191 463 696
Acquisitions 849 185 661 805 006 146
Closing balance (181 839 638) (189 323 107)
Cost of inventories sold and consumed (Note 6) 856 669 130 807 146 735
During the financial years of 2018 and 2017, the movements in Finished Products and Products and Work in Progress were as follows:
Amounts in Euro 31/12/2018 31/12/2017
Opening balance 91 433 239 117 253 999
Regularisations (4 670 241) 133 658
Closing balance (132 071 825) (91 433 239)
Production Changes (Note 6) (45 308 827) 25 954 418

2018
AN
NU
AL R
EPO
RT
202
*04
As of 31 December 2018 and 2017, location of inventories by geographical segment were as follows:
Amounts in Euro 31/12/2018 % 31/12/2017 %
Portugal 242 171 708 77,1% 207 642 193 74,0%
Rest of Europe 12 305 531 3,9% 8 576 945 3,1%
America 19 979 706 6,4% 19 488 258 6,9%
Africa 18 518 660 5,9% 23 860 961 8,5%
Asia 20 935 858 6,7% 21 187 989 7,5%
313 911 463 100,0% 280 756 346 100,0%
The amounts presented are deducted from the respective adjustments, in accordance with the policy described in Note 1.15 and detailed in Note 22. The amounts for Portugal include EUR 14,857,665 (31 December 2017: EUR 14,229,243) relating to stocks of The Navigator Group whose invoices have already been issued but the transfer of risks and rewards to customers has not yet occurred, which is why the corresponding revenue was not recognised at the date of the consolidated statement of financial position.
As of 31 December 2018 and 2017, there are no inventories in which ownership is restricted and/or pledged as collateral for liabilities.
24 RECEIVABLES AND OTHER CURRENT ASSETSAs of 31 December 2018 and 2017, the caption Receivables and other current assets comprised:
Amounts in Euro 31/12/2018 31/12/2017
Trade receivables 293 835 762 245 876 313
Accounts receivable - related parties (Note 35) 559 493 526 632
Derivative financial instruments (Note 34) 1 722 253 4 571 589
Other receivables 74 003 177 50 873 035
Accrued income 20 883 159 20 351 232
Deferred costs 13 129 538 12 668 285
404 133 382 334 867 086
Note: The presented amounts are net of impairment losses.
As of 31 December 2018 and 2017, Other receivables comprised:
Amounts in Euro 31/12/2018 31/12/2017
Other receivables
Advance payments to suppliers 1 955 401 1 905 594
Advance payments to personnel 1 092 367 1 590 991
Price adjustment | Acquisition of Supremo Cimentos 1 350 588 1 856 983
Financial incentives to be received 51 271 101 42 105
Collateral provided to other parties 5 571 124 4 632 589
Department of Commerce (EUA) (Note 21) - 29 846 612
Others 12 762 596 10 998 161
74 003 177 50 873 035
The amount shown in Price adjustment | Acquisition of Supremo Cimentos, in 2016, concerns the price adjustment established between the parties under the purchase agreement of this subsidiary signed in 2015.

2018 ANN
UAL R
EPO
RT
203
*04
Changes occurred in 2018 and 2017 in Financial incentives to be received were as follows:
Amounts in Euro 31/12/2018 31/12/2017
Amounts as of 1 January 42 105 58 870
Receivables (401 100) (16 765)
Attributions 50 930 086 -
Increase / (Regularization) 700 010 -
51 271 101 42 105
From the amount as of 31 December 2018, referring to financial incentives, we highlight the financial incentive negotiated by the subsidiary Navigator with AICEP - Agency for Investment and Foreign Trade of Portugal, for the construction of the new Tissue plant in Cacia. This incentive, in the form of a reimbursable incentive, includes a grace period of two years, without payment of interest, up to the maximum amount of EUR 42,166,636, corresponding to 35% of the amount of expenses considered as eligible.
As of 31 December 2018, the balance of financial incentives to be received also includes the granting of financial incentives under several research and development projects, namely the Inpactus project (EUR 5,585,300) and others (EUR 3,519,165). The Group expects that all the conditions precedent to its receipt are guaranteed.
As of 31 December 2018 and 2017, the items of Accrued income and Deferred costs are detailed as follows:
Amounts in Euro 31/12/2018 31/12/2017
Accrued income
Interest receivable 2 481 626 1 548 286
Energy Sales 15 981 121 15 320 310
Others 2 420 412 3 482 636
20 883 159 20 351 232
Deferred costs
Insurance 2 749 436 2 001 295
Rents and leases 4 312 477 3 722 992
Others 6 067 626 6 943 998
13 129 539 12 668 285
34 012 698 33 019 517
25 STATE AND OTHER PUBLIC ENTITIESAs of 31 December 2018 and 2017, there were no arrears debts to the State and other public entities.
As mentioned in Note 11, the tax Group dominated by Semapa, SGPS, S.A., comprises the Portuguese entities (that comply with the conditions established in Article 69 of the CIT Code) of Groups Secil and ETSA, the same criteria applying to the Navigator Group. Thus, although those companies ascertain and record the income tax as if they were taxed on an individual basis, the overall corporate income tax, as well as the overall clearance/payment, is performed by the parent Company.

2018
AN
NU
AL R
EPO
RT
204
*04
The balances relating to these entities were as follows:
CURRENT ASSETS
Amounts in Euro 31/12/2018 31/12/2017
Corporate Income Tax - CIT 1 091 659 788 673
Personnel Income Tax - withheld on salaries 30 798 724 018
Value added tax to be recovered 15 393 473 20 047 677
Value added tax - refund requested 49 431 654 59 436 715
Tax over Merchandise and Services Circulation (ICMS) 1 782 332 3 066 066
Tax on Industrialized Products (TIP) 1 291 667 941 465
Contributions for Social Security financing 147 084 128 786
PIS and COFINS credit on fixed assets 11 981 064 14 633 336
Other taxes 112 722 122 344
Amounts pending of reimbursement (tax proceedings in favor of the group) 16 538 446 12 720 058
97 800 899 112 609 138
CURRENT LIABILITIES
Amounts in Euro 31/12/2018 31/12/2017
Corporate Income Tax - CIT 36 837 380 14 419 036
Personnel Income Tax - withheld on salaries 3 895 681 3 498 938
Value added tax 46 099 282 48 932 097
Contributions for Social Security financing 4 185 240 4 542 187
Tax over Merchandise and Services Circulation (ICMS) 488 428 525 815
Programa de Desenvolvimento da Empresa Catarinense (PRODEC) 1 299 679 2 412 382
Programa Paraná Competitivo 13 109 455 10 664 028
Contribution to the Social Integration Plan (COFINS) 34 474 44 129
Corporate Income Tax - additional liabilities 24 938 625 20 145 343
Other taxes 1 043 178 2 287 616
131 931 422 107 471 571
As of 31 December 2018 and 2017, the caption Corporate Income tax - CIT comprise (net amount between current assets and current liabilities) is detailed as follows:
Amounts in Euro 31/12/2018 31/12/2017
Corporate income tax for the year 81 632 415 57 420 038
Exchange rate differences (60 000) (342 405)
Payments on account and additional payments on account (44 176 994) (46 769 853)
Income tax - Decree-Law No. 66/2016 (Revaluation Regime) - 5 235 601
Withholding tax (383 799) (1 059 968)
Prior years corporate income tax (1 265 901) (853 050)
35 745 721 13 630 363

2018 ANN
UAL R
EPO
RT
205
*04
26 SHARE CAPITAL AND TREASURY SHARESAs of 31 December 2018 and 2017, Semapa’s share capital was fully subscribed and paid up, represented by 81,270,000 shares with no nominal value. The legal persons that held relevant positions in the Company’s share capital are detailed as follows:
Name
31/12/2018 31/12/2017
Number of shares %
Number of shares %
Cimo - Gestão de Participações, SGPS, S.A. 38 959 431 47.94 16 734 031 20.59
Longapar, SGPS, S.A. - - 22 225 400 27.35
Sodim, SGPS, S.A. 15 252 726 18.77 15 252 726 18.77
Bestinver Gestión, SGIIC, S.A. 7 166 756 8.82 7 166 756 8.82
Cimigest, SGPS, S.A. 3 185 019 3.92 3 185 019 3.92
Santander Asset Management España, S.A. 1 981 216 2.44 1 981 216 2.44
Norges Bank (the Central Bank of Norway) 1 699 613 2.09 - -
Sociedade Agrícola da Quinta da Vialonga, S.A. 625 199 0.77 625 199 0.77
Treasury shares 640 666 0.79 586 329 0.72
Other shareholders with less than 2% participation 11 759 374 14.47 13 513 324 16.63
81 270 000 100.00 81 270 000 100.00
During 2018, Semapa – Sociedade de Investimento e Gestão, SGPS, S.A. acquired 54,337 treasury shares in the amount of EUR 704,553 and, as of 31 December 2018, had 640,666 treasury shares (31 December 2017: 586,329 treasury shares), with a global acquisition amount of EUR 6,740,954.
27 RESERVES AND RETAINED EARNINGSAs of 31 December 2018 and 2017 the captions Fair value reserve, Translation reserve and Other reserves comprised:
Amounts in Euro 31/12/2018 31/12/2017
Fair value of financial instruments (2 713 976) (818 432)
Other fair value reserves - (1 281 742)
Fair value reserve (2 713 976) (2 100 174)
Translation reserve (129 296 945) (99 805 648)
Legal reserve 16 695 625 16 695 625
Other reserves 780 089 232 700 921 321
Other reserves 796 784 857 717 616 946
Reserves 664 773 936 615 711 124
FAIR VALUE OF FINANCIAL INSTRUMENTSThe amount presented under the heading Fair value of financial instruments (net of deferred taxes), corresponds to the change in the fair value of financial instruments classified as hedges, described in Note 34, and accounted for in accordance with the policy described in Note 1.13.
TRANSLATION RESERVEThe exchange translation reserve corresponds to the cumulative amount related to the Group’s appropriation of exchange rate differences resulting from the translation of the financial statements of the subsidiaries operating outside the Euro zone, mainly in Brazil, Tunisia, Lebanon, Angola, Mozambique, the United States of America, Switzerland and United Kingdom.

2018
AN
NU
AL R
EPO
RT
206
*04
During 2018, the variation occurred in this reserve was mainly due to the exchange rate devaluation against the Euro in the Brazilian Real (negative impact of EUR 20,886,260. 2017: EUR 34,771,554), Tunisian Dinar (negative impact of EUR 9,774,118. 2017: EUR 14,062,226), Lebanese Pound (positive impact of EUR 3,181,810. 2017: negative impact of EUR 10,080,069) and US Dollar (negative impact of EUR 2,857,933. 2017: EUR 7,504,767). See Note 42.
LEGAL RESERVE Commercial Company law prescribes that at least 5% of annual net profit must be transferred to the legal reserve, until this is equal to at least 20% of the issued capital, which is verified as of 31 December 2018. This reserve cannot be distributed, unless in the event of the Company’s winding up. However, it may be used to absorb losses after the other reserves have been exhausted or it can be incorporated into the issued capital.
OTHER RESERVESThis heading corresponds to reserves available for distribution to shareholders that were constituted through the appropriation of prior year’s earnings.
RETAINED EARNINGS — INCREASE/DECREASE IN THE INTEREST RATE HELD IN SUBSIDIARIES WITHOUT LOSS OF CONTROLThe Group records in this caption the differences between the group share of net assets acquired/disposed of and the acquisition/disposal price to non-controlling interest of already controlled entities.
RETAINED EARNINGS - REMEASUREMENTS (ACTUARIAL GAINS AND LOSSES)The remeasures (actuarial deviations) resulting from the differences between the assumptions used to calculate post-employment benefit liabilities and what actually occurred are equally recorded under this caption (as well as changes made in them and the difference between the expected value of the profitability of the assets of the funds and the actual profitability) according to the policy described in Note 1.22.1. Additionally see Note 29.
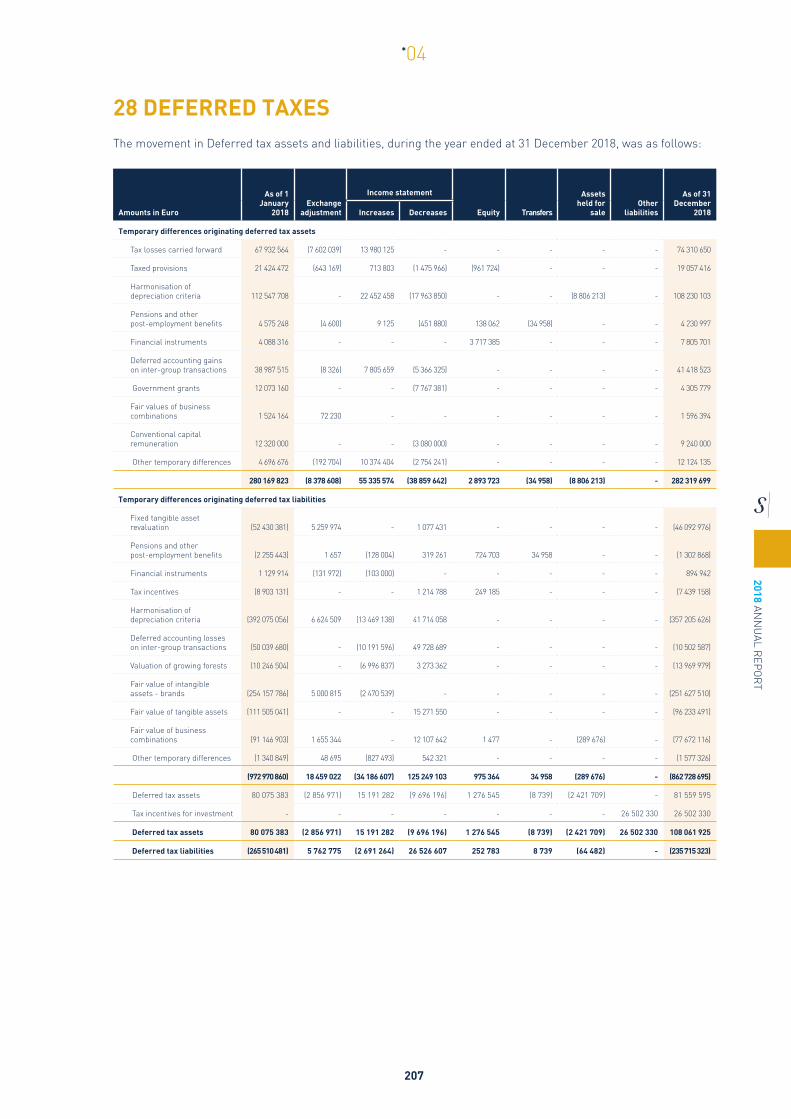
2018 ANN
UAL R
EPO
RT
207
*04
28 DEFERRED TAXESThe movement in Deferred tax assets and liabilities, during the year ended at 31 December 2018, was as follows:
Amounts in Euro
As of 1 January
2018 Exchange
adjustment
Income statement
Equity Transfers
Assets held for
sale Other
liabilities
As of 31 December
2018 Increases Decreases
Temporary differences originating deferred tax assets
Tax losses carried forward 67 932 564 (7 602 039) 13 980 125 - - - - - 74 310 650
Taxed provisions 21 424 472 (643 169) 713 803 (1 475 966) (961 724) - - - 19 057 416
Harmonisation ofdepreciation criteria 112 547 708 - 22 452 458 (17 963 850) - - (8 806 213) - 108 230 103
Pensions and otherpost-employment benefits 4 575 248 (4 600) 9 125 (451 880) 138 062 (34 958) - - 4 230 997
Financial instruments 4 088 316 - - - 3 717 385 - - - 7 805 701
Deferred accounting gainson inter-group transactions 38 987 515 (8 326) 7 805 659 (5 366 325) - - - - 41 418 523
Government grants 12 073 160 - - (7 767 381) - - - - 4 305 779
Fair values of business combinations 1 524 164 72 230 - - - - - - 1 596 394
Conventional capital remuneration 12 320 000 - - (3 080 000) - - - - 9 240 000
Other temporary differences 4 696 676 (192 704) 10 374 404 (2 754 241) - - - - 12 124 135
280 169 823 (8 378 608) 55 335 574 (38 859 642) 2 893 723 (34 958) (8 806 213) - 282 319 699
Temporary differences originating deferred tax liabilities
Fixed tangible asset revaluation (52 430 381) 5 259 974 - 1 077 431 - - - - (46 092 976)
Pensions and other post-employment benefits (2 255 443) 1 657 (128 004) 319 261 724 703 34 958 - - (1 302 868)
Financial instruments 1 129 914 (131 972) (103 000) - - - - - 894 942
Tax incentives (8 903 131) - - 1 214 788 249 185 - - - (7 439 158)
Harmonisation of depreciation criteria (392 075 056) 6 624 509 (13 469 138) 41 714 058 - - - - (357 205 626)
Deferred accounting losses on inter-group transactions (50 039 680) - (10 191 596) 49 728 689 - - - - (10 502 587)
Valuation of growing forests (10 246 504) - (6 996 837) 3 273 362 - - - - (13 969 979)
Fair value of intangible assets - brands (254 157 786) 5 000 815 (2 470 539) - - - - - (251 627 510)
Fair value of tangible assets (111 505 041) - - 15 271 550 - - - - (96 233 491)
Fair value of business combinations (91 146 903) 1 655 344 - 12 107 642 1 477 - (289 676) - (77 672 116)
Other temporary differences (1 340 849) 48 695 (827 493) 542 321 - - - - (1 577 326)
(972 970 860) 18 459 022 (34 186 607) 125 249 103 975 364 34 958 (289 676) - (862 728 695)
Deferred tax assets 80 075 383 (2 856 971) 15 191 282 (9 696 196) 1 276 545 (8 739) (2 421 709) - 81 559 595
Tax incentives for investment - - - - - - - 26 502 330 26 502 330
Deferred tax assets 80 075 383 (2 856 971) 15 191 282 (9 696 196) 1 276 545 (8 739) (2 421 709) 26 502 330 108 061 925
Deferred tax liabilities (265 510 481) 5 762 775 (2 691 264) 26 526 607 252 783 8 739 (64 482) - (235 715 323)

2018
AN
NU
AL R
EPO
RT
208
*04
The movement in Deferred tax assets and liabilities, during the year ended at 31 December 2017, was as follows:
Amounts in Euro
As of 1 January
2017 Exchange
adjustment
Income statement Retained Earnings Transfers
Assets held for
sale
As of 31 December
2017 Increases Decreases
Temporary differences originating deferred tax assets
Tax losses carried forward 57 504 185 (9 494 338) 19 922 717 - - - - 67 932 564
Taxed provisions 30 560 249 (1 597 590) 526 881 (8 065 068) - - - 21 424 472
Harmonisation of depreciation criteria 116 353 989 - 2 958 334 (9 964 615) - 3 500 000 (300 000) 112 547 708
Pensions and other post-employment benefits 5 156 848 (15 190) 7 599 (644 075) 70 066 - - 4 575 248
Financial instruments 10 398 848 - - (228 022) (6 082 510) - - 4 088 316
Deferred accounting gains on inter-group transactions 33 270 651 (11 515) 10 064 988 (4 336 609) - - - 38 987 515
Government grants 14 174 165 - - (2 101 005) - - - 12 073 160
Fair value of business combinations 1 734 023 (209 859) - - - - - 1 524 164
Conventional capital remuneration - - - (3 080 000) 15 400 000 - - 12 320 000
Other temporary differences 8 690 053 (524 813) 543 045 (2 302 146) 12 868 (1 722 331) - 4 696 676
277 843 011 (11 853 305) 34 023 564 (30 721 540) 9 400 424 1 777 669 (300 000) 280 169 823
Temporary differences originating deferred tax liabilities
Fixed tangible asset revaluation (60 835 881) 7 705 627 - 694 230 - 5 643 - (52 430 381)
Pensions and other post-employment (2 121 065) - (104 494) (428) (29 455) - - (2 255 443)
Derivative financial instruments 1 769 836 (217 562) (422 360) - - - - 1 129 914
Tax incentives (1 270 679) - (7 881 690) - 249 237 - - (8 903 131)
Harmonisation of depreciation criteria (388 205 374) 9 031 945 (33 943 123) 21 041 495 - - - (392 075 056)
Deferred accounting losses on inter-group transactions (3 250 619) - (49 680 286) 2 891 226 - - - (50 039 680)
Valuation of growing forests (3 979 927) - (6 266 577) - - - - (10 246 504)
Fair value of intangible assets - brands (257 146 542) 5 207 337 (2 218 581) - - - - (254 157 786)
Fair value of tangible assets (126 776 591) - - 15 271 550 - - - (111 505 041)
Fair value of business combinations (180 076 742) 13 210 709 - 75 755 085 - (5 643) (30 312) (91 146 903)
Other temporary differences (2 027 027) 90 226 (219 502) 815 454 - - - (1 340 849)
(1 023 920 611) 35 028 282 (100 736 613) 116 468 612 219 782 - (30 312) (972 970 860)
Deferred tax assets 78 652 223 (3 806 350) 7 952 214 (5 224 343) 2 584 144 (5) (82 500) 80 075 383
Deferred tax liabilities (276 468 649) 9 557 171 (4 265 000) 5 608 281 64 464 - (6 748) (265 510 481)
The Group has operations in several geographies with legal/tax frameworks that are necessarily different from each other and subject to different nominal rates of income tax. Currently, the income tax rates in the main geographies where the Group operates are: i) 22.5% in Portugal (including municipal leverage plus state leverage), ii) 34% in Brazil, iii) 25% in Tunisia, iv) 17% in Lebanon and v) 30% in Angola.
The deferred tax assets recorded in the consolidated financial statements for reportable tax losses with respect to 31 December 2018 and 2017, are fully related to the subsidiary Margem Companhia de Mineração, S.A., a subsidiary of the Group headquartered in Brazil that owns the new Cement plant built by the Group in Adrianópolis, State of Paraná, which came into operation in the second half of 2015.
As the current Brazilian tax legislation does not impose any time limit for its use against future taxable profits, management is convinced that, in accordance with the medium-term business plan, the project will generate taxable profits that will be offset by the tax losses accumulated in these first years of start-up. Additionally, it should be noted that the tax depreciation of Margem Companhia de Mineração, S.A., is more accelerated than the economic depreciation, generating a significant negative impact on the fiscal result of said subsidiary.

2018 ANN
UAL R
EPO
RT
209
*04
As of 31 December 2018, the amount of tax losses to be used, in respect of which no deferred tax assets were recognized in these consolidated financial statements, is detailed as follows:
Entity Total 2019 2020 2021 2022 20232024 and
beyond
Tax losses of the Semapa Tax Group (RETGS)
Tax losses of companies outside of Semapa RETGS 337 514 599 - - - - - 337 514 599
ALLMA, Lda. 152 523 - - - 300 20 401 131 822
Florimar, SGPS, Lda. 231 529 59 579 - - - - 171 950
I3 Participações e Serviços, Ltda.
Madebritas, Lda. 10 013 - - - - - 10 013
Pedra Regional. S.A.
Secil Angola, SARL 1 143 631 586 068 557 563 - - - -
Secil Prébetão, S.A. 8 121 614 3 545 712 - - - 239 218 4 336 684
SPB, SGPS, Lda. (former Secil Unicon) 28 687 - - - 6 268 4 743 17 676
Secil Lobito 1 872 976 706 623 144 576 1 021 777 - - -
Secil Cement, B.V. (former Seciment Investments, B.V.) 390 279 - - - - - 390 279
Silonor, S.A. 14 259 257 - - - - - 14 259 257
Soime, S.A.L. 511 887 376 630 106 056 29 201 - - -
Zarzis Béton 58 311 - - - - - 58 311
Sociedade de Inertes 369 544 76 586 53 638 27 507 211 813 - -
Secil Brasil Participações, S.A. 7 917 965 - - - - - 7 917 965
Supremo Cimentos, SA 44 741 825 - - - - - 44 741 825
Finlholding
Seinpar BV 366 985 46 661 - 62 692 30 177 53 334 174 121
Semapa Inversiones SL 13 423 439 - - - - - 13 423 439
Colombo Energy - - - - - - -
Portucel Moçambique 17 679 441 - - - 335 658 10 211 577 7 132 205
Raíz 389 442 - - - - 126 708 262 734
Navigator North America Inc. 21 895 - - - - - 21 895
AISIB 365 868 93 880 18 789 89 540 88 711 54 904 20 044
Tax losses carried forward without deferred tax 449 571 710 5 491 739 880 622 1 230 717 672 927 10 710 886 430 584 819

2018
AN
NU
AL R
EPO
RT
210
*04
29 PENSIONS AND OTHER POST-EMPLOYMENT BENEFITSAs referred to in Note 1.22, the Group grants various post-employment benefits to its Employees and their families.
The following is a breakdown of the obligations, assumed and reflected in the Consolidated Statement of financial position as at 31 December 2018 and 2017:
31 December 2018
Pulp and Paper Cement and derivatives Holdings Total
No Benef. Amount No Benef. Amount No Benef. Amount No Benef. Amount
Group liabilities for past services
Active 506 57 373 503 72 124 756 - - 578 57 498 259
Former employees 125 21 042 206 - - - - 125 21 042 206
Retired employees 506 76 040 531 672 20 809 676 1 1 115 990 1 179 97 966 197
Market value of the pension funds - (147 131 961) - (18 476 437) - - - (165 608 398)
Equity - - - 142 667 - - - 142 667
Insurance policies - - - (173 804) - - - (173 804)
Reserve account* - - - (608 096) - - - (608 096)
Unfunded pensions liabilities 1 137 7 324 279 744 1 818 762 1 1 115 990 1 882 10 259 031
Other unfunded liabilities
Healthcare assistance - - - 43 164 - - - 43 164
Retirement and death liabilities - - - 89 851 - - - 89 851
Long-service award liabilities - - - 385 856 - - - 385 856
Total net liabilities 7 324 279 2 337 633 1 115 990 10 777 902
* overfunding due to the change to a defined contribution plan
31 December 2017
Pulp and Paper Cement and derivatives Holdings Total
No Benef. Amount No Benef. Amount No Benef. Amount No Benef. Amount
Group liabilities for past services
Active 529 57 986 022 88 85 451 - - 617 58 071 473
Former employees 125 20 527 177 - - - - 125 20 527 177
Retired employees 492 72 686 536 719 22 867 756 1 1 239 645 1 212 96 793 937
Market value of the Pension Fund - (146 109 493) - (20 990 314) - - - (167 099 807)
Equity - - - 184 050 - - - 184 050
Insurance policies - - - (149 093) - - - (149 093)
Reserve account* - - - (646 286) - - - (646 286)
Unfunded pensions liabilities 1 146 5 090 242 807 1 351 564 1 1 239 645 1 954 7 681 451
Other unfunded liabilities
Healthcare assistance - - - 45 450 - - - 45 450
Retirement and death liabilities - - - 93 068 - - - 93 068
Long-service award liabilities - - - 303 366 - - - 303 366
Total net liabilities 5 090 242 1 793 448 1 239 645 8 123 335
* overfunding due to the change to a defined contribution plan
SUB-GROUP NAVIGATOR
RETIREMENT AND PENSION SUPPLEMENTS
Until 2013, several retirement and survivor plans, together with retirement bonus, coexisted within the Group. For certain categories of active Employees, in addition to the plans described below, additional plans also existed, financed through independent funds assigned to cover those additional responsibilities.

2018 ANN
UAL R
EPO
RT
211
*04
Under the prevailing Social Benefits Regulation, permanent Employees of Navigator that chose not to move to the defined contribution plan, together with the retired Employees as of the transition date (1 January 2009) and from 1 January 2014, the former Employees of Navigator Paper Figueira (former Soporcel), Navigator Forest Portugal (former PortucelSoporcel Florestal), RAIZ, Empremédia, and Navigator Lusa (former PortucelSoporcel Lusa), are entitled, after retirement or in case of disability, to a monthly retirement pension or disability supplement. This is calculated according to a formula, which considers the beneficiary’s gross monthly remuneration updated to the work category at the date of retirement and the number of years of service, up to a limit of 30 (limit of 25 to Navigator Paper Figueira, Navigator Forest Portugal, Empremédia, Navigator Lusa and RAIZ), including a survivor pension to the spouse and direct descendants.
To cover this liability, externally managed pension funds were set up, and the funds’ assets are apportioned between each of the companies.
In 2010 and 2013, respectively, the Group completed the necessary procedures to convert the defined benefit plans of its subsidiaries The Navigator Company, Navigator Paper Figueira, Navigator Forest Portugal, Raiz, Empremédia, and Navigator Lusa to defined contribution plans for the current Employees, keeping the acquired benefits as of transition date. The acquired rights attributable to former Employees and retirees, in case they leave the company or in case of a job change or retirement, will remain unchanged.
Notwithstanding, following a negotiation process with its Employees as a result of the aforementioned changes to the pension plans, Navigator Paper Figueira allowed its active Employees as of 1 January 2014 to choose, until 16 January 2015, between the following alternatives:
i) Alternative A: Benefit safeguard plan, or
ii) Alternative B: Pure defined contribution plan.
The option granted to the employees in early 2015 was based on the situation occurred as at 31 December 2013, which means that aimed to bypass the changes that had been made to the Navigator Paper Figueira pension plan, by simulating that the option had been granted as of 1 January 2014, by the time of the conversion of the defined benefit plan into a defined contribution plan.
ALTERNATIVE A Benefits Safeguard Plan
In general terms, Employees who opted for Alternative A maintain the option, at the date of retirement, for the defined benefit plan that was in force until 31 December 2013, based on the seniority at that date, and also after that date, to benefit from a defined contribution plan, up to 25 years in the Company.
From a practical point of view, the option for this alternative guarantees Employees the possibility of benefiting from two autonomous accounts:
• Account 1: which includes an initial contribution that corresponds to the amounts paid to the pension fund, under the previous defined benefit plan in the amount of past service liabilities calculated as of 31 December 2013, as well as the monthly contributions made by the Company during the 2014 fiscal year for the defined contribution plan; and,
• Account 2: which covers the Company’s future monthly contributions, corresponding to 2% of the pensionable salary, to be made until the Employees have completed 25 years of seniority in the Navigator Paper Figueira.
The balance of Account 1 will affect the coverage of liabilities associated with a defined benefit (which translates into the receipt of a pension, corresponding to the liabilities in the previous defined benefit plan, calculated on 31 December 2013), if Employees covered by Alternative A trigger the Safeguard Clause.

2018
AN
NU
AL R
EPO
RT
212
*04
Employees who choose to exercise the Safeguard Clause will also benefit from a life annuity that will be acquired from an insurance company, using the balance accumulated in Account 2.
In case Employees do not opt for the Safeguard Clause exercise, the benefit they will receive will correspond to that, resulting from the annuity acquired from an insurance entity, through the delivery of the amounts accumulated in Account 1 and Account 2.
That is, the benefits obtained by Employees who do not opt for the Safeguard Clause will correspond to those that would result in a defined contribution plan, the value of contributions being the sum of contributions deposited in Account 1 and Account 2 (with no actuarial adjustment/actualisation).
ALTERNATIVE B Pure defined contribution plan
Employees who have opted for Alternative B will have access to a defined contribution plan, under which the Company will make monthly contributions, corresponding to 4% of their respective pensionable salary, maintaining these contributions until the retirement or termination of the employment contract, without limitation.
Thus, under this alternative, Employees will benefit from a single account, which will be made up of the accumulated balance of the following contributions:
• Initial contribution, corresponding to liabilities for past services, calculated with reference to 31 December 2013 under the previous defined benefit plan, with a premium of 25%;
• Contributions made by Navigator Paper Figueira during the 2014 fiscal year; and
• Future contributions to be made by Navigator Paper Figueira at the rate of 4%.
The benefit that will be earned by Employees who, by 16 January 2015, have opted for this alternative, will correspond to the value of the annuity that can be purchased from an insurer, using the total contributions accumulated in each Employee’s account at the date of the retirement.
As of 31 December 2018, two defined contribution plans were in force, covering 1,116 employees, in addition to the employees who chose to maintain a safeguard clause.
In order to cover a larger universe of employees, the Navigator Group proposed the creation of a new plan. On 28 December 2018, the Supervisory Authority (ASF) authorized the creation of a new defined contribution plan, whose objective is to cover employees of the Group who did not have access to pension funds – more than 1,500 employees. This new plan has retroactive effects at 1 January 2017, or 1 January 2018, according to the associate. The expected cost of accumulated liabilities amounts to EUR 393,222.
As at 31 December 2018, the amount of liabilities related to post-employment benefit plans, related to an administrator of the Navigator Group, amounted to EUR 1,025,289 (31 December 2017: EUR 1,701,096 regarding two administrators).
SUB-GROUP SECIL
DEFINED CONTRIBUTION PENSIONS PLANS
There are currently several defined contribution pension plans managed by the Pension Fund of the Secil Group, in which the members make monthly contributions corresponding to 3.75% of the pensionable salary of each participant and which simultaneously allow the possibility of financing by part of them, which are characterised as follows:
• Secil and CMP Plans include all workers who, as of 31 December 2009, had an open-ended employment contract (and who were covered by the defined benefits plan in force in the companies) and who have opted for the transition to these Plans and all the workers admitted under an agreement without term, as of 1 January 2010, also being applicable to the Company Officers;
2018 ANN
UAL R
EPO
RT
213
*04
• Unibetão and Britobetão Plans include all workers who, as of 31 December 2009, had an unlimited contract of employment, executed under the CTE between APEB and FETESE, and all workers admitted under a contract without term, as of 1 January 2010, with the exception of Unibetão Employees who are covered by the CCT entered into between APEB and FEVICCOM, who continue to benefit from the defined benefit Plan, and also apply to members of the Company Officers;
• Beto Madeira Plan includes all workers who as of 31 December 2010 had an open-ended employment contract and were covered by the CCT between APEB — Portuguese Association of Concrete Ready Companies and FETESE — Federation of Workers’ Unions of Services and others;
• Secil Britas Plan includes all workers who, as of 31 December 2009, had an open-ended contract of employment and all workers admitted under a permanent contract, as of 1 January 2010, and are also applicable to the members of the Company Officers;
• Plano Cimentos Madeira includes all Employees who, as of 1 January 2012, had an open-ended employment contract (and who were covered by the defined benefits plan in force in the company) and all Employees admitted under a contract without expiration, from that date, and shall also apply to the members of the Company Officers;
• Brimade Plan includes all workers who had as of 1 July 2012 an unlimited contract of employment and all workers who will be admitted to service after that date.
DEFINED-BENEFITS PENSIONS PLANS
(i) Defined-benefits plans with funds managed by third parties
LIABILITIES FOR COMPLEMENTARY RETIREMENT AND SURVIVOR’S PENSIONSSecil and its subsidiaries CMP — Cimentos Maceira e Pataias, S.A., Unibetão — Indústrias de Betão Preparado, S.A., Cimentos Madeira, Lda., Betomadeira, S.A. and Societé des Ciments de Gabès have assumed the commitment to pay their Employees amounts by way of complementary old age, disability, early retirement and survivor’s pensions and a retirement subsidy.
The liabilities arising from these plans are guaranteed by independent funds, administered by third parties, or covered by insurance policies.
These plans are valued every six months, at the dates of closing of the interim and annual financial statements, by specialised and independent entities, using the projected unit credit method.
(ii) Defined-benefits plans managed by the group
LIABILITIES FOR COMPLEMENTARY RETIREMENT AND SURVIVOR’S PENSIONSThe responsibilities of Secil’s retired employees in 31 December 1987 (date of incorporation of the Pension Fund) are guaranteed directly by Secil. Similarly, the liability assumed by Secil Martingança, S.A.,are guaranteed directly by this entity.
Since 26 June 2012, the responsibilities of Cimentos Madeira, Lda and Betomadeira — Betões e Britas da Madeira, S.A. related to all retirees and pensioners that were receiving a pension, were transferred to Cimentos Madeira defined benefit pension plan, incorporated in Secil’s Pension fund.
These plans are also valued every six months by specialised and independent entities, using the method for calculating capital coverage corresponding to single premiums of the immediate life annuities in the valuation of the liabilities to current pensioners and the projected unit credit method for valuing liabilities relating to current Employees.

2018
AN
NU
AL R
EPO
RT
214
*04
LIABILITIES FOR HEALTHCAREThe subsidiary Cimentos Madeira, Lda. provides to their Employees a healthcare scheme which supplements the official health services and which is available to their families, pre-retired and retired staff and widows, through an insurance contract.
LIABILITIES FOR RETIREMENT AND DEATH BENEFITSThe subsidiary Societé des Ciments de Gabès (Tunisia) assumed the commitment to its Employees to pay an old-age retirement and disability subsidy, according to the terms of the General Labour Agreement, Article No. 52, representing: (i) 2 months of the last salary if the worker has less than 30 years’ service to the company, and (ii) 3 months of the last salary, if the worker has 30 years or more service to the company.
Secil and CMP — Cimentos Maceira e Pataias, S.A., assumed the commitment to its Employees to pay a subsidy on death of current Employee, equal to one month’s last salary earned.
LIABILITIES FOR LONG-SERVICE AWARDSSecil and its subsidiaries CMP — Cimentos Maceira e Pataias, S.A., have assumed the commitment to pay their Employees bonuses to those who attain 25 years of service, which are paid in the year that the Employee reaches the number of years of service within the company.
ASSUMPTIONS USED IN THE VALUATION OF LIABILITIESThe actuarial assumptions considered for the purpose of calculating the liabilities for past services, are as follows:
31/12/2018 31/12/2017
Social Security Benefits formula Decree-Law no. 187/2007
of May 10 Decree-Law no. 187/2007
of May 10
Disability table EKV 80 EKV 80
Mortality table TV 88/90 TV 88/90
Wage growth rate 1.00% 1.00%
Technical interest rate 2.00% 2.00%
Pensions growth rate - cement segment 0.45% 0.45%
Pensions growth rate - other segments 0.75% 0.75%
Semapa pensions reversability rate 50.00% 50.00%
Number of Semapa's complement annual payments 12 12
The following table presents five-year historical information on the present value of liabilities, funds’ market value, non-financed liabilities and net actuarial gains/ (losses). Information related to the last five years were as follows:
Amounts in Euro 2014 2015 2016 2017 2018
Present value of liabilities 100 073 116 168 798 865 175 766 292 176 018 521 177 168 200
Fair value of plan assets and reserve account 99 038 106 167 886 448 165 680 869 167 895 186 166 390 298
Surplus / (deficit) (1 035 010) (912 417) (10 085 423) (8 123 335) (10 777 902)
Net actuarial gains / (losses) 343 040 (10 421 772) (11 626 310) 2 657 177 (13 696 791)

2018 ANN
UAL R
EPO
RT
215
*04
FUNDS LINKED TO DEFINED BENEFIT PENSION PLANS During 2018 and 2017, funds’ assets registered the following movements:
Amounts in Euro
31/12/2018 31/12/2017
Autonomous fund Covered capital
Autonomous fund Covered capital
Opening balance 167 099 808 149 093 164 851 307 173 075
Exchange rate adjustment - (29 026) - (31 276)
Contribution for the period 11 495 219 95 389 2 500 400 31 690
Expected return 2 926 308 6 090 3 530 151 8 416
Differences between actual and expected returns (9 065 603) - 3 564 578 -
Pensions paid (7 094 944) - (6 945 645) -
Retirements paid - (47 742) - (32 812)
Other 247 610 - (400 983) -
Closing balance 165 608 398 173 804 167 099 808 149 093
During 2018 and 2017, the contributions to the defined benefit plans, presented above were fully realised by the Group’s subsidiaries and no contributions were made by the participants.
The expected contributions for the next reporting period are, among other factors, dependent on the profitability of the assets of the funds.
As at 31 December 2018 and 2017, funds’ assets for these plans were detailed as follows:
Amounts in Euro 31/12/2018 % 31/12/2017 %
Bonds 99 732 383 60.2% 110 194 349 65.9%
Shares 37 541 990 22.7% 48 752 382 29.2%
Liquidity 5 211 671 3.1% 2 940 755 1.8%
Public Debt 10 308 827 6.2% 3 022 605 1.8%
Real Estate 18 993 0.0% 114 895 0.1%
Other Applications 12 794 534 7.7% 2 074 822 1.2%
165 608 398 100.0% 167 099 808 100.0%
The amounts evidenced in the Bonds, Shares and Public Debt categories correspond to the fair values of these assets, fully determined based on observable prices in active net (regulated) markets at the reference date of the Consolidated Statement of Financial Position.
FUNDS LINKED TO DEFINED CONTRIBUTION PENSION PLANSAs at 31 December 2018 and 2017, funds’ assets for these plans were detailed as follows:
Amounts in Euro 31/12/2018 % 31/12/2017 %
Defensive Sub-Fund 9 298 880 15.1% 10 027 040 14.5%
Conservative Sub-fund 29 307 186 47.7% 34 722 615 50.3%
Dynamic Sub-fund 18 459 793 30.0% 19 418 718 28.1%
Aggressive Sub-fund 4 416 753 7.2% 4 835 586 7.0%
61 482 612 100.0% 69 003 959 100.0%
Total number of beneficiaries 1 733 1 834

2018
AN
NU
AL R
EPO
RT
216
*04
EVOLUTION OF LIABILITIES WITH PENSIONS AND OTHER POST-EMPLOYMENT BENEFITS IN THE CONSOLIDATED FINANCIAL POSITIONThe evolution of these liabilities, as reflected in the consolidated financial position in 2018, is as follows:
Amounts in Euro Opening balance
Exchange rate
adjustments Income and
expenses
Actuarial gains and
losses Payments Closing balance
Post-employment benefits
Assumed by the group 5 329 710 - 98 812 140 410 (755 018) 4 813 914
Autonomous fund 170 062 877 - 5 149 271 3 575 545 (7 094 945) 171 692 748
Insurance policy 184 050 (27 368) 17 462 16 265 (47 742) 142 667
Retirement and death 93 068 (4 534) 9 136 (7 819) - 89 851
Healthcare assistance 45 450 - 881 (470) (2 697) 43 164
Long service award 303 366 - 149 111 - (66 621) 385 856
176 018 521 (31 902) 5 424 673 3 723 931 (7 967 023) 177 168 200
A sensitivity analysis was made to the actuarial assumption considered as the most significant, the technical interest rate, and its result is described in Note 3.3.
EXPENDITURE WITH PENSIONS AND OTHER POST-EMPLOYMENT BENEFITSRegarding the expenses incurred in 2018 and 2017 with pensions and other post-employment benefits, the detail is as follows:
Amounts in Euro
31/12/2018
CurrentServices
Interest expenses
Curtailments and
settlements Other
expenses Period
contributions
Impact in the profit for
the year
Post-employment benefits
Assumed by the group - 98 812 - - - 98 812
Autonomous fund 1 960 845 3 188 426 (3 325 258) - - 1 824 013
Insurance policy 5 530 11 932 (9 626) - - 7 836
Retirement and death 6 020 3 599 - - - 9 619
Healthcare assistance - 881 - (483) - 398
Long service award 23 334 5 868 - 119 909 - 149 111
Contributions to defined contribution plans - - - - 2 680 397 2 680 397
1 995 729 3 309 518 (3 334 884) 119 426 2 680 397 4 770 186
Amounts in Euro
31/12/2017
CurrentServices
Interest expenses
Curtailments and
settlements Other
expenses Period
contributions
Impact in the profit for
the year
Post-employment benefits
Assumed by the group - 108 535 - - - 108 535
Autonomous fund 2 139 305 (43 862) 36 394 - - 2 131 837
Insurance policy 6 199 2 984 - - - 9 183
Retirement and death 6 105 4 077 - - - 10 182
Healthcare assistance - 1 092 (24 145) - - (23 053)
Long service award 24 078 5 723 - 72 969 - 102 770
Contributions to defined contribution plans - - - - 2 544 116 2 544 116
2 175 687 78 549 12 249 72 969 2 544 116 4 883 570

2018 ANN
UAL R
EPO
RT
217
*04
ACTUARIAL GAINS/ (LOSSES) IN THE STATEMENT OF COMPREHENSIVE INCOMEActuarial gains and losses recognised in 2018, in the statement of comprehensive income, are detailed as follows:
Amounts in Euro Gains and
losses
Real vs expected plan
assets Gross Value Deferred
taxes Impact on
Equity
Post-employment benefits
Assumed by the group (140 410) - (140 410) 38 580 (101 830)
Autonomous fund (3 591 803) (9 972 867) (13 564 670) 184 943 (13 379 727)
Retirement and death 7 819 - 7 819 (1 681) 6 138
Healthcare assistance 470 - 470 (99) 371
(3 723 924) (9 972 867) (13 696 791) 221 743 (13 475 048)
30 PROVISIONSDuring the years ended 31 December 2018 and 2017, the movements in Provisions are analysed as follows:
Amounts in Euro Legal claims Tax claims
Environmental
restauration Others Total
As of 1 January 2017 2 221 766 27 605 389 7 258 993 37 485 627 74 571 775
Increases 1 887 989 649 264 12 357 7 512 140 10 061 750
Reversals - - (157 590) (5 664 037) (5 821 627)
Charge-off - - (5 310) (6 743 671) (6 748 981)
Exchange rate adjustments - - (1 146) (1 209 928) (1 211 074)
Unwinding - - 283 585 - 283 585
Transfers and adjustments 49 402 (1 624 463) 135 310 (14 021 656) (15 461 407)
As of 31 December 2017 4 159 157 26 630 190 7 526 199 17 358 475 55 674 021
Increases (Note 6) 1 111 546 - 515 24 839 520 25 951 581
Reversals (Note 6) (453 074) (673 509) (157 298) (5 660 450) (6 944 331)
Charge-off - - (95 140) (6 627 543) (6 722 683)
Exchange rate adjustments - - (800) (73 924) (74 724)
Unwinding (Note 10) - - 309 709 - 309 709
Transfers and adjustments (31 654) 10 013 530 - 303 955 10 285 831
As of 31 December 2018 4 785 975 35 970 211 7 583 185 30 140 033 78 479 404
Provisions for Legal claims were established according to the risk assessments carried out internally by the Group with the support of its legal counsels, based on the probability of the decision being favourable or unfavourable to the Group.
The amount of the provisions for tax proceedings arises from an assessment made by the Group, with reference to the date of the Statement of Financial Position, regarding potential differences of understanding with the Tax Authorities, considering the developments in tax matters. The amounts included in Transfers and adjustments include approximately EUR 10 million related to the constitution of provisions in 2018, which were recorded against income tax expense.
As mentioned in Note 1.21, some of the Secil Group subsidiaries are responsible for the environmental and landscape recovery of the quarries affected by the exploration. As of 31 December 2018, the amount presented in the Environmental recovery item includes EUR 1,166,762 (31 December 2017: EUR 1,165,929), corresponding to quarries with “continuous and progressive reconstruction of the freed spaces” and refers to quarries exploited by the Secil company in Outão.

2018
AN
NU
AL R
EPO
RT
218
*04
The amount presented under Other includes provisions to cover risks related to events of a different nature, the resolution of which may result in outflows of cash, in particular organisational reorganisation processes, complements to the Lebanese social security national fund, risks of contractual positions assumed in investments, among others.
The increases recorded in Other provisions include the amount of EUR 12 million related to the Mozambican project of the subsidiary Navigator. Although the Memorandum of Understanding (MoU) signed with the Mozambican Government in July 2018 provided for a “best effort” commitment to create the necessary conditions to advance investment until 31 December, this was not the case, the parties continuing to work towards this goal. In this context, and in light of current conditions, the subsidiary Navigator prudently decided, in addition to the impairments already registered in previous years, to record this additional provision to cover the possibility of failure to create the conditions for investment in a chip factory and in the medium term in a pulp mill in Mozambique.
In addition, it should be noted that the Semapa Group, in relation to the measurement of uncertain tax positions, considers the provisions of IFRIC 23, namely the measurement of risks and uncertainties in the definition of the best estimate of the expense required to settle the obligation, by weighing all the possible results that are controlled by them and their associated probabilities.
According to the management’s understanding, the amount recognized in each of the provisions corresponds to the most reliable estimate of the amount required to settle the obligation, the amount recognised being equivalent to the maximum amount of loss that the Group considers may be incurred.
31 INTEREST-BEARING LIABILITIESAs of 31 December 2018 and 2017, the Group’s interest-bearing net debt was as follows:
Amounts in Euro 31/12/2018 31/12/2017
Interest-bearing liabilities
Non-current 1 401 009 210 1 653 480 805
Current 333 875 411 263 390 200
1 734 884 621 1 916 871 005
Cash and cash equivalents
Cash 189 067 644 350
Short term bank deposits 142 505 960 188 419 369
Other short term applications 42 537 016 54 123 542
Impairments from the application of IFRS 9 (Note 22) (1 983 066) -
183 248 977 243 187 261
Interest-bearing net debt 1 551 635 644 1 673 683 744
The amount presented under Other short terms applications, as at 31 December 2018 and 2017, corresponds to amounts invested by the subsidiary Navigator in a portfolio of Financial Assets with appropriate rating.
Additionally, as of 31 December 2018 and 2017, there are no significant cash balances and their equivalents that are not available for Group´s use.
NON-CURRENT INTEREST-BEARING LIABILITIESThe fair value of the bond loans, considering the date and respective contractual conditions, determined according to level 2 of the fair value hierarchy, does not differ substantially from the reported book value.

2018 ANN
UAL R
EPO
RT
219
*04
As of 31 December 2018 and 2017, non-current interest-bearing liabilities were as follows:
Amounts in Euro 31/12/2018 31/12/2017
Non-current
Bond loans 761 000 000 891 000 000
Commercial paper 460 300 000 540 250 000
Bank loans 182 551 889 223 730 194
Expenses with loans issuing (5 802 745) (7 920 335)
Interest-bearing bank debt 1 398 049 144 1 647 059 859
Financial leases 2 501 723 1 724 907
Other loans - 4 237 695
Other interest-bearing debts 458 343 458 344
Other interest-bearing debts 2 960 066 6 420 946
Total non-current interest-bearing liabilities 1 401 009 210 1 653 480 805
BOND LOANSAs of 31 December 2018 and 2017, current and non-current bond loans were as follows:
Amounts in Euro 31/12/2018 31/12/2017 Maturity Interest rate Pricing 31-12-2018
Portucel 2015 / 2023 200 000 000 200 000 000 September 2023 Variable rate indexed
to Euribor n.a.
Portucel 2016 / 2021 100 000 000 100 000 000 April 2021 Fixed rate n.a.
Portucel 2016 / 2021 45 000 000 45 000 000 August 2021 Variable rate indexed
to Euribor n.a.
Semapa 2016 / 2023 100 000 000 100 000 000 June 2023 Fixed rate n.a.
Semapa 2014 / 2019 | Current 150 000 000 150 000 000 April 2019 Variable rate indexed
to Euribor 100.20
Semapa 2014 / 2020 80 000 000 80 000 000 November 2020 Variable rate indexed
to Euribor 102.50
Secil 2015 / 2020 60 000 000 60 000 000 June 2020 Fixed rate n.a.
Secil 2015 / 2020 80 000 000 80 000 000 May 2020 Fixed rate n.a.
Secil 2016 / 2021 26 000 000 26 000 000 January 2021 Fixed rate n.a.
Secil 2016 / 2023 30 000 000 30 000 000 February 2023 Fixed rate n.a.
Secil 2017 / 2022 20 000 000 20 000 000 October 2022 Fixed rate n.a.
Secil 2018 / 2023 20 000 000 - June 2023 Fixed rate n.a.
911 000 000 891 000 000

2018
AN
NU
AL R
EPO
RT
220
*04
COMMERCIAL PAPERAs of 31 December 2018 and 2017, the current and non-current Commercial Paper Programs are detailed as follows:
31/12/2018Amounts in Euro
Contracted Amount
Used Amount
Maturity Date Interest RateNon-current Current Total
Holdings
Commercial Paper Programme 100M 100 000 000 - - - November 2020 Variable rate indexed to Euribor
Commercial Paper Programme 40M 40 000 000 - - - August 2021 Variable rate indexed to Euribor
Commercial Paper Programme 100M 100 000 000 25 300 000 - 25 300 000 September 2021 Variable rate indexed to Euribor
Commercial Paper Programme 25M 25 000 000 25 000 000 - 25 000 000 February 2022 Variable rate indexed to Euribor
Commercial Paper Programme 50M 50 000 000 40 000 000 - 40 000 000 October 2023 Variable rate indexed to Euribor
Cement and Derivatives Segment
Commercial Paper Programme 20M 20 000 000 - - - December 2022 Variable rate indexed to Euribor
Commercial Paper Programme 5M 5 000 000 - - - May 2019 Variable rate indexed to Euribor
Commercial Paper Programme 50M 50 000 000 - - - January 2019 Variable rate indexed to Euribor
Commercial Paper Programme 50M 50 000 000 - - - n.a. Fixed rate
Commercial Paper Programme 25M 25 000 000 - - - July 2021 Variable rate indexed to Euribor
Commercial Paper Programme 50M 50 000 000 20 000 000 - 20 000 000 January 2023 Variable rate indexed to Euribor
Commercial Paper Programme 20M 20 000 000 - - - July 2021 Variable rate indexed to Euribor
Commercial Paper Programme 30M 30 000 000 30 000 000 - 30 000 000 April 2021 Fixed rate
Commercial Paper Programme 75M 75 000 000 75 000 000 - 75 000 000 May 2021 Variable rate indexed to Euribor
Pulp and Paper Segment
Commercial Paper Programme 125M 125 000 000 125 000 000 - 125 000 000 May 2020 Variable rate indexed to Euribor
Commercial Paper Programme 70M 70 000 000 70 000 000 - 70 000 000 April 2021 Fixed rate
Commercial Paper Programme 50M 50 000 000 50 000 000 - 50 000 000 July 2020 Variable rate indexed to Euribor
Commercial Paper Programme 75M 75 000 000 - - - July 2020 Variable rate indexed to Euribor
Commercial Paper Programme 100M 100 000 000 - - - March 2020 Variable rate indexed to Euribor
Commercial Paper Programme 35M 35 000 000 - 35 000 000 35 000 000 January 2019 Variable rate indexed to Euribor
Commercial Paper Programme 35M 35 000 000 - 35 000 000 35 000 000 January 2019 Variable rate indexed to Euribor
Commercial Paper Programme 30M 30 000 000 - 30 000 000 30 000 000 January 2019 Variable rate indexed to Euribor
Total 1 160 000 000 460 300 000 100 000 000 560 300 000
31/12/2017 Amounts in Euro
Contracted Amount
Used Amount
Maturity Date Interest RateNon-current Current Total
Holdings
Commercial Paper Programme 100M 100 000 000 88 250 000 - 88 250 000 September 2021 Variable rate indexed to Euribor
Commercial Paper Programme 100M 100 000 000 - - - November 2020 Variable rate indexed to Euribor
Commercial Paper Programme 120M 120 000 000 - - - December 2018 Variable rate indexed to Euribor
Commercial Paper Programme 25M 25 000 000 25 000 000 - 25 000 000 February 2019 Variable rate indexed to Euribor
Commercial Paper Programme 40M 40 000 000 - - - August 2021 Variable rate indexed to Euribor
Commercial Paper Programme 50M 50 000 000 40 000 000 - 40 000 000 October 2023 Variable rate indexed to Euribor
Cement and Derivatives Segment
Commercial Paper Programme 20M 20 000 000 17 000 000 - 17 000 000 December 2022 Variable rate indexed to Euribor
Commercial Paper Programme 75M 75 000 000 75 000 000 - 75 000 000 May 2021 Variable rate indexed to Euribor
Commercial Paper Programme 10M 10 000 000 10 000 000 - 10 000 000 May 2019 Variable rate indexed to Euribor
Commercial Paper Programme 43M 43 050 000 - - - January 2019 Variable rate indexed to Euribor
Commercial Paper Programme 25M 25 000 000 - 25 000 000 25 000 000 July 2021 Variable rate indexed to Euribor
Commercial Paper Programme 50M 50 000 000 - - - January 2023 Variable rate indexed to Euribor
Commercial Paper Programme 15M 15 000 000 5 000 000 - 5 000 000 June 2018 Variable rate indexed to Euribor
Commercial Paper Programme 20M 20 000 000 20 000 000 - 20 000 000 July 2021 Variable rate indexed to Euribor
Commercial Paper Programme 20M 20 000 000 15 000 000 - 15 000 000 August 2018 Variable rate indexed to Euribor
Pulp and Paper Segment
Commercial Paper Programme 125M 125 000 000 125 000 000 - 125 000 000 May 2020 Variable rate indexed to Euribor
Commercial Paper Programme 70M 70 000 000 70 000 000 - 70 000 000 April 2021 Fixed rate
Commercial Paper Programme 50M 50 000 000 50 000 000 - 50 000 000 July 2020 Variable rate indexed to Euribor
Commercial Paper Programme 25M 25 000 000 - 25 000 000 25 000 000 December 2018 Variable rate indexed to Euribor
Commercial Paper Programme 75M 75 000 000 - - - July 2020 Variable rate indexed to Euribor
Commercial Paper Programme 100M 100 000 000 - - - March 2020 Variable rate indexed to Euribor
Total 1 158 050 000 540 250 000 50 000 000 590 250 000

2018 ANN
UAL R
EPO
RT
221
*04
MATURITY OF BOND LOANS AND OTHER LOANSThe reimbursement terms relating to the bond loans, commercial paper, bank loans and other medium and long-term loans is detailed as follows:
Amounts in Euro 31/12/2018 31/12/2017
1 to 2 years 465 361 686 225 660 658
2 to 3 years 427 612 033 487 244 473
3 to 4 years 91 549 853 481 844 104
4 to 5 years 393 120 427 84 568 925
More than 5 years 26 666 233 380 358 073
1 404 310 232 1 659 676 233
As of 31 December 2018 and 2017, non-current bank loans were as follows:
Amounts in Euro 31/12/2018 31/12/2017 Reference rate
Non-current
Holdings
Banco BIC 10 000 000 10 000 000 Euribor
Abanca 40 000 000 40 000 000 Euribor
Cement and derivatives segment
BNDES - Banco Nacional de Desenvolvimento Económico e Social 18 863 148 33 303 234 TJLP/Cesta Moedas/Fixed and US$
Banco Santander (Banco EKF) 24 846 225 32 841 517 CDI
Millennium - BCP SA 8 209 731 11 700 636 Euribor
Bank Med 3 062 950 3 178 417 Libor
Attijari Bank 2 399 476 4 281 482 TMM
Banque Nationale Agricole 1 345 625 1 867 319 TMM
Banco ITAU - 3 080 775 CDI
Union Bancaire pour le Commerce et l' Industrie 1 742 287 3 066 835 TMM
Banco do Brasil - 923 989 CDI
Other loans 554 669 1 208 213 Several
Paper and pulp segment
BEI 64 027 778 75 833 333 Several
Environment segment
Banco BPI 5 000 000 500 000 Euribor
Bankinter 2 500 000 1 000 000 Euribor
Banco BIC - 944 444 Euribor
Total 182 551 889 223 730 194

2018
AN
NU
AL R
EPO
RT
222
*04
CURRENT INTEREST-BEARING LIABILITIESAs of 31 December 2018 and 2017, current interest-bearing liabilities were as follows:
Amounts in Euro 31/12/2018 31/12/2017
Current
Bond loans 150 000 000 -
Commercial paper 100 000 000 50 000 000
Bank loans 81 564 826 209 415 643
Expenses with bond loans issuing (1 354 927) (1 415 182)
Interest-bearing bank debt 330 209 899 258 000 461
Shareholders short-term loans (Note 35) 3 209 343 4 470 475
Financial leases 456 169 919 264
Other interest-bearing debts 3 665 512 5 389 739
Current interest-bearing liabilities 333 875 411 263 390 200
As of 31 December 2018 and 2017, current bank loans were as follows:
Amounts in Euro 31/12/2018 31/12/2017 Reference rate
Current
Holdings
Banco do Brasil - 17 500 000 Euribor
Cement and derivatives segment
BNDES - Banco Nacional de Desenvolvimento Econômico e Social 12 895 447 13 091 274 TJLP/Cesta Moedas/Fixed and US$
Banque Nationale Agricole 934 715 136 462 TMM
Banco EKF 4 517 495 5 052 541 CDI
Banco Caixa Geral Brasil SA 13 881 288 4 627 095 CDI
Banco do Brasil SA 6 770 818 1 847 978 CDI
Bank Med 1 813 196 3 326 381 Libor
Attijari Bank 3 338 415 3 255 010 TMM
Banco de Fomento Angola SA 671 791 1 197 495 Fixed rate (18%)
Banco Caixa Geral Angola SA 552 756 1 978 765 Luibor 3 M
Banque Internacionale Arabe de Tunisie 1 431 516 1 697 562 TMM
Millennium - BCP SA 4 183 467 3 427 234 Euribor
Itaú Unibanco S.A 3 226 499 3 080 775 CDI
Union Bancaire pour le Commerce et l' Industrie 2 389 267 2 086 801 TMM
Banco Millennium Atlântico SA 2 763 782 5 335 461 Luibor 1M
Banco Keve SA 1 923 592 2 224 790 CDI
Other loans 4 395 067 4 080 539 Several
Paper and pulp segment
BEI 11 805 556 19 702 381 Euribor
Other loans - 105 503 210 Several
Environment segment
Banco BIC 1 594 444 4 138 889 Euribor
Banco BPI 1 918 715 3 540 000 Euribor
Banco Popular - 1 380 000 Euribor
Novo Banco 557 000 1 205 000 Euribor
Total 81 564 826 209 415 643

2018 ANN
UAL R
EPO
RT
223
*04
The evolution of the interest-bearing net debt of the Group, for the years ended as at 31 December 2018 and 2017, is as follows:
Amounts in Euro 31/12/2018 31/12/2017
Opening balance 1 673 683 744 1 779 732 473
Interest payment 53 158 959 61 369 235
Receipt of interest - (2 131 538)
Dividends payment 115 495 619 119 558 249
Receipt of dividends (876 450) (833 509)
Net payments related to Tangible Assets and Others 153 692 528 137 839 075
Net payments related to financial investments 7 470 989 25 806 534
Payments related to Acquisition of treasury shares 704 553 -
Changes of perimeter 78 058 -
Cumulative exchange rate effect (10 175 307) (20 035 222)
Change in charges with the issuance of loans 2 117 590 1 833 432
Other effects 975 066 -
Net receipts from operating activity (444 689 705) (429 454 985)
Net Debt Change (122 048 100) (106 048 729)
Closing Balance 1 551 635 644 1 673 683 744
The evolution of the Group’s interest-bearing debt in the years ended as at 31 December 2018 and 2017 is as follows:
Amounts in Euro 31/12/2018 31/12/2017
Opening Balance 1 916 871 005 1 963 833 747
Borrowings - outflows (2 636 390 562) (4 489 643 932)
Borrowings - inflows 2 464 467 735 4 472 035 089
Amortisation of leasing contracts (917 234) (855 373)
Cumulative exchange rate effect (11 263 913) (30 331 958)
Change in charges with the issuance of loans 2 117 590 1 833 432
Change in Interest-bearing debt (181 986 384) (46 962 742)
Closing Balance 1 734 884 621 1 916 871 005
The exchanges rate effects refer to the impact of changes in exchange rate on interest bearing debt and cash and cash equivalents of the Group’s subsidiaries, the financial statements of which are translated into Euros, mainly Brazilian Real, Tunisian Dinar, Lebanese Pound and US Dollar. See Note 42.

2018
AN
NU
AL R
EPO
RT
224
*04
LIABILITIES RELATED TO FINANCIAL LEASINGSAs of 31 December 2018 and 2017, the Group’s debt-repayment terms relating to finance leases, except for liabilities resulting from the application of IFRIC 4, are shown as follows:
Amounts in Euro 31/12/2018 31/12/2017
Less than a year 456 169 919 264
1 to 2 years 400 690 328 999
2 to 3 years 350 623 230 929
3 to 4 years 347 637 238 617
4 to 5 years 341 068 242 882
More than 5 years 1 061 705 683 480
2 957 892 2 644 171
Future interest 599 046 10 947
Liabilities present value 3 556 938 2 655 118
As at 31 December 2018 and 2017, the Group’s assets acquired under financial lease, are detailed as follows:
Amounts in Euro
31/12/2018 31/12/2017
Acquisition Value
Accumulated depreciation
Net book value
Acquisition value
Accumulated depreciation
Net book value
Building 2 000 815 (200 609) 1 800 206 2 000 815 (162 719) 1 838 096
Machinery and equipment 1 424 721 (9 602) 1 415 119 6 750 055 (5 377 701) 1 372 354
Machinery and equipment - IFRIC 4 14 000 000 (14 000 000) - 14 000 000 (12 486 487) 1 513 513
Transport equipment 779 813 (139 979) 639 834 603 507 (39 358) 564 149
18 205 349 (14 350 190) 3 855 159 23 354 377 (18 066 265) 5 288 112
BANK CREDIT FACILITIES GRANTED AND NOT DRAWNAs of 31 December 2018 and 2017, bank credit facilities granted and not drawn amounted to EUR 666,794,998 and EUR 708,232,606, respectively.
FINANCIAL COVENANTS For certain types of financing operations, there are commitments to maintain certain financial ratios within previously negotiated limits. The existing covenants are clauses of Cross default, Pari Passu, Negative pledge, Ownership-clause, clauses related to Group’s activities maintenance, financial ratios, mainly Net Debt/EBITDA, Interest coverage, Indebtedness and Financial autonomy and fulfilment of regular financial contracts’ obligations (operational, legal and tax obligations), common in loan agreements and fully known in the market.
Additionally, as of 31 December 2018 and 2017, the Group comply with the financial ratios limits imposed under its financing contracts.
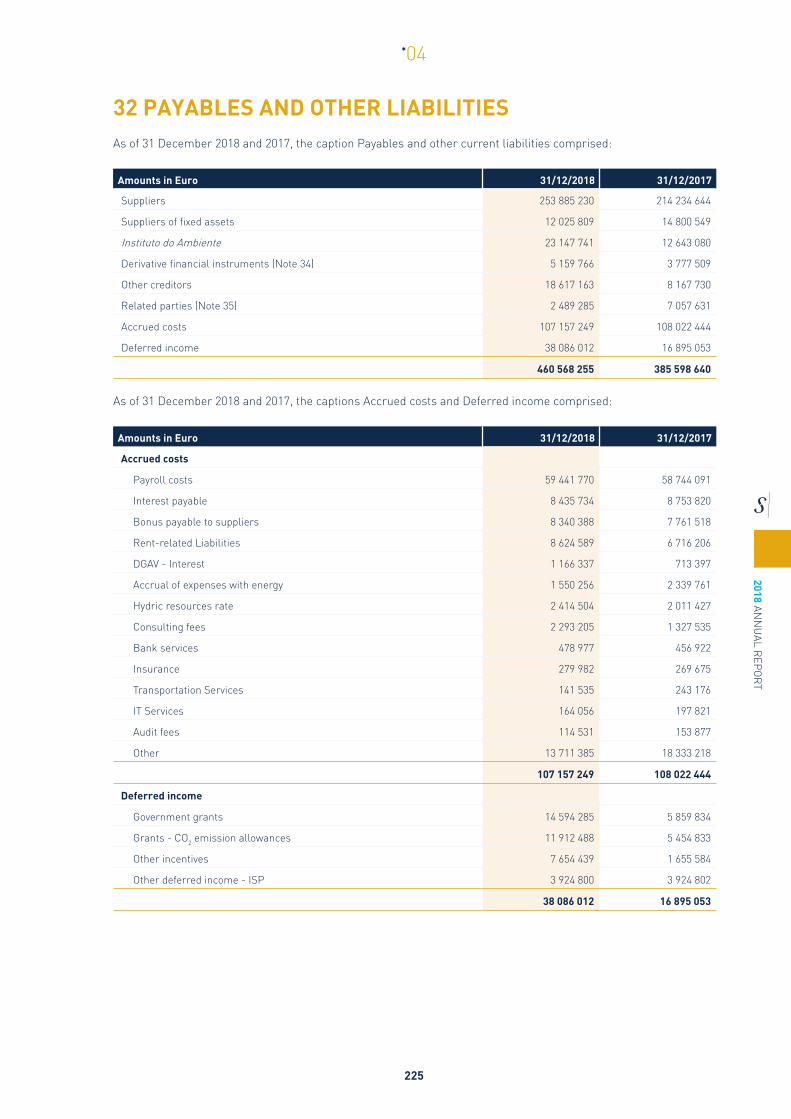
2018 ANN
UAL R
EPO
RT
225
*04
32 PAYABLES AND OTHER LIABILITIESAs of 31 December 2018 and 2017, the caption Payables and other current liabilities comprised:
Amounts in Euro 31/12/2018 31/12/2017
Suppliers 253 885 230 214 234 644
Suppliers of fixed assets 12 025 809 14 800 549
Instituto do Ambiente 23 147 741 12 643 080
Derivative financial instruments (Note 34) 5 159 766 3 777 509
Other creditors 18 617 163 8 167 730
Related parties (Note 35) 2 489 285 7 057 631
Accrued costs 107 157 249 108 022 444
Deferred income 38 086 012 16 895 053
460 568 255 385 598 640
As of 31 December 2018 and 2017, the captions Accrued costs and Deferred income comprised:
Amounts in Euro 31/12/2018 31/12/2017
Accrued costs
Payroll costs 59 441 770 58 744 091
Interest payable 8 435 734 8 753 820
Bonus payable to suppliers 8 340 388 7 761 518
Rent-related Liabilities 8 624 589 6 716 206
DGAV - Interest 1 166 337 713 397
Accrual of expenses with energy 1 550 256 2 339 761
Hydric resources rate 2 414 504 2 011 427
Consulting fees 2 293 205 1 327 535
Bank services 478 977 456 922
Insurance 279 982 269 675
Transportation Services 141 535 243 176
IT Services 164 056 197 821
Audit fees 114 531 153 877
Other 13 711 385 18 333 218
107 157 249 108 022 444
Deferred income
Government grants 14 594 285 5 859 834
Grants - CO2 emission allowances 11 912 488 5 454 833
Other incentives 7 654 439 1 655 584
Other deferred income - ISP 3 924 800 3 924 802
38 086 012 16 895 053
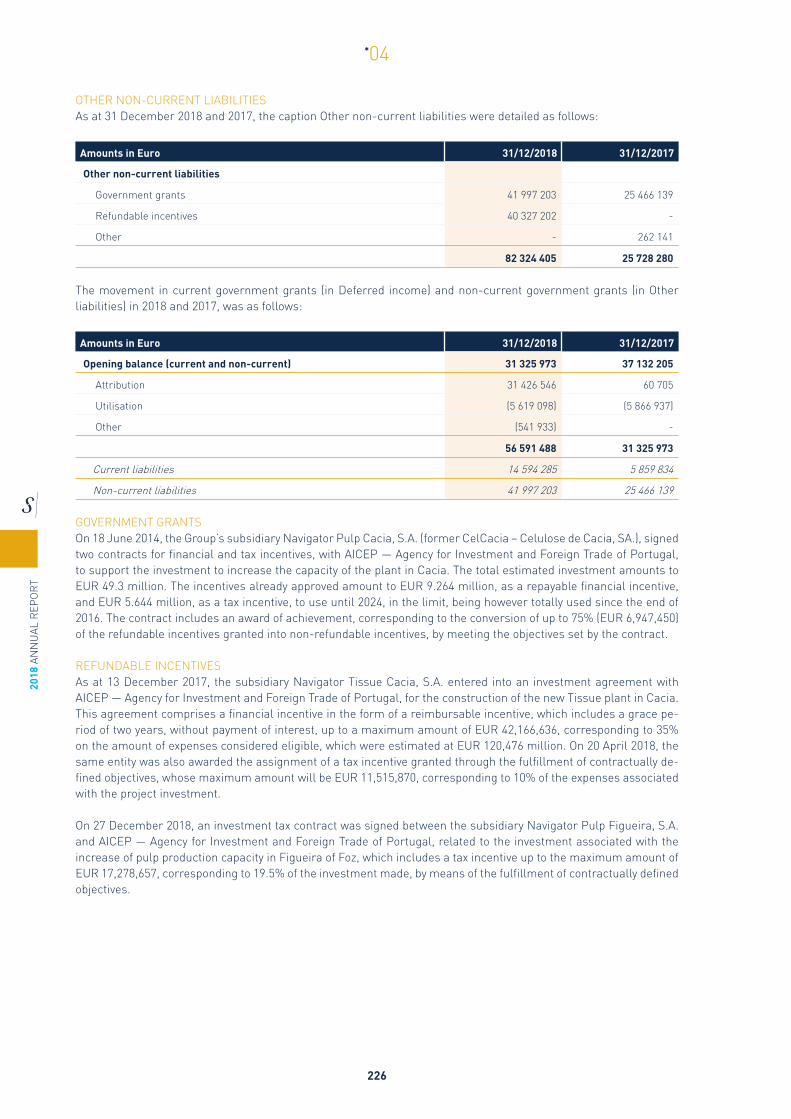
2018
AN
NU
AL R
EPO
RT
226
*04
OTHER NON-CURRENT LIABILITIESAs at 31 December 2018 and 2017, the caption Other non-current liabilities were detailed as follows:
Amounts in Euro 31/12/2018 31/12/2017
Other non-current liabilities
Government grants 41 997 203 25 466 139
Refundable incentives 40 327 202 -
Other - 262 141
82 324 405 25 728 280
The movement in current government grants (in Deferred income) and non-current government grants (in Other liabilities) in 2018 and 2017, was as follows:
Amounts in Euro 31/12/2018 31/12/2017
Opening balance (current and non-current) 31 325 973 37 132 205
Attribution 31 426 546 60 705
Utilisation (5 619 098) (5 866 937)
Other (541 933) -
56 591 488 31 325 973
Current liabilities 14 594 285 5 859 834
Non-current liabilities 41 997 203 25 466 139
GOVERNMENT GRANTSOn 18 June 2014, the Group’s subsidiary Navigator Pulp Cacia, S.A. (former CelCacia – Celulose de Cacia, SA.), signed two contracts for financial and tax incentives, with AICEP — Agency for Investment and Foreign Trade of Portugal, to support the investment to increase the capacity of the plant in Cacia. The total estimated investment amounts to EUR 49.3 million. The incentives already approved amount to EUR 9.264 million, as a repayable financial incentive, and EUR 5.644 million, as a tax incentive, to use until 2024, in the limit, being however totally used since the end of 2016. The contract includes an award of achievement, corresponding to the conversion of up to 75% (EUR 6,947,450) of the refundable incentives granted into non-refundable incentives, by meeting the objectives set by the contract.
REFUNDABLE INCENTIVESAs at 13 December 2017, the subsidiary Navigator Tissue Cacia, S.A. entered into an investment agreement with AICEP — Agency for Investment and Foreign Trade of Portugal, for the construction of the new Tissue plant in Cacia. This agreement comprises a financial incentive in the form of a reimbursable incentive, which includes a grace pe-riod of two years, without payment of interest, up to a maximum amount of EUR 42,166,636, corresponding to 35% on the amount of expenses considered eligible, which were estimated at EUR 120,476 million. On 20 April 2018, the same entity was also awarded the assignment of a tax incentive granted through the fulfillment of contractually de-fined objectives, whose maximum amount will be EUR 11,515,870, corresponding to 10% of the expenses associated with the project investment.
On 27 December 2018, an investment tax contract was signed between the subsidiary Navigator Pulp Figueira, S.A. and AICEP — Agency for Investment and Foreign Trade of Portugal, related to the investment associated with the increase of pulp production capacity in Figueira of Foz, which includes a tax incentive up to the maximum amount of EUR 17,278,657, corresponding to 19.5% of the investment made, by means of the fulfillment of contractually defined objectives.

2018 ANN
UAL R
EPO
RT
227
*04
33 ASSETS AND LIABILITIES HELD FOR SALE As at 31 December 2017, Non-current assets held for sale included an amount of EUR 85,433,905 of property, plant and equipment and EUR 803,143 of Inventories for the pellets business, held by the subsidiary Navigator. In December 2017, this subsidiary entered into a contract to buy and sell its pellets business in the United States with a joint venture managed and operated by an associate of Enviva Holdings, LP, for USD 135 million. The realisation of the sale was effected on 16 February 2018.
As of 31 December 2018, the assets held for sale correspond to assets related to the acquisition of Uniconcreto – Betão Pronto, S.A. performed by the subsidiary Secil, whose sale, up to date, has not yet occurred.
34 FINANCIAL ASSETS AND LIABILITIESAs its activities are exposed to a variety of financial and operational risk factors, the Group adopts a proactive approach to risk management, as a way to mitigate the potential adverse effects associated with these risks, namely the risk arising from the price of pulp, foreign exchange risk and interest rate risk.
As of 31 December of 2018 and 2017, the reconciliation of the consolidated statement of financial position with the various categories of financial assets and liabilities included therein is detailed as follows:
31 December 2018 Amounts in Euro
Financial instruments -
tradingNote 24/32
Financial intruments -
hedgingNote 24/32
Loans and other accounts
receivableNote 24/31/32
Equity instruments
Note 21
Other interests - bearing liabilities
Notes 31/32
Non financial Assets/
LiabilitiesNote 24/32
Assets
Equity instruments - - - 1 450 919 - -
Other non-current assets - - 67 645 781 - - -
Current assets 1 398 288 323 965 389 281 591 - - 13 129 539
Cash and cash equivalents - - 183 248 977 - - -
Total assets 1 398 288 323 965 640 176 349 1 450 919 - 13 129 539
Liabilities
Non-current interest-bearing liabilities - - - - 1 401 009 210 -
Other liabilities - - - - 82 324 405 -
Current interest-bearing liabilities - - - - 333 875 411 -
Current liabilities - 5 159 766 - - 394 174 736 61 233 753
Total liabilities - 5 159 766 - - 2 211 383 762 61 233 753
31 December 2017 Amounts in Euro
Financial instruments -
tradingNote 24/32
Financial intruments -
hedgingNote 24/32
Loans and other accounts
receivableNote 24/31/32
Financial assets at fair
value through profit or loss
Note 21
Financial assets
available for saleNote 21
Other interests - bearing liabilities
Notes 31/32
Non financial Assets/
LiabilitiesNote 24/32
Assets
Financial assets at fair value through profit or loss - - - 44 508 - - -
Financial assets available for sale - - - - 424 428 - -
Other non-current assets - - 6 244 448 - - - -
Current assets 2 755 315 1 816 274 317 627 212 - - - 12 668 285
Cash and cash equivalents - - 243 187 261 - - - -
Total assets 2 755 315 1 816 274 567 058 921 44 508 424 428 - 12 668 285
Liabilities
Non-current interest-bearing liabilities - - - - - 1 653 480 805 -
Other liabilities - - - - - 25 728 280 -
Current interest-bearing liabilities - - - - - 263 390 200 -
Current liabilities 304 029 3 473 480 - - - 352 282 998 29 538 133
Total liabilities 304 029 3 473 480 - - - 2 294 882 283 29 538 133
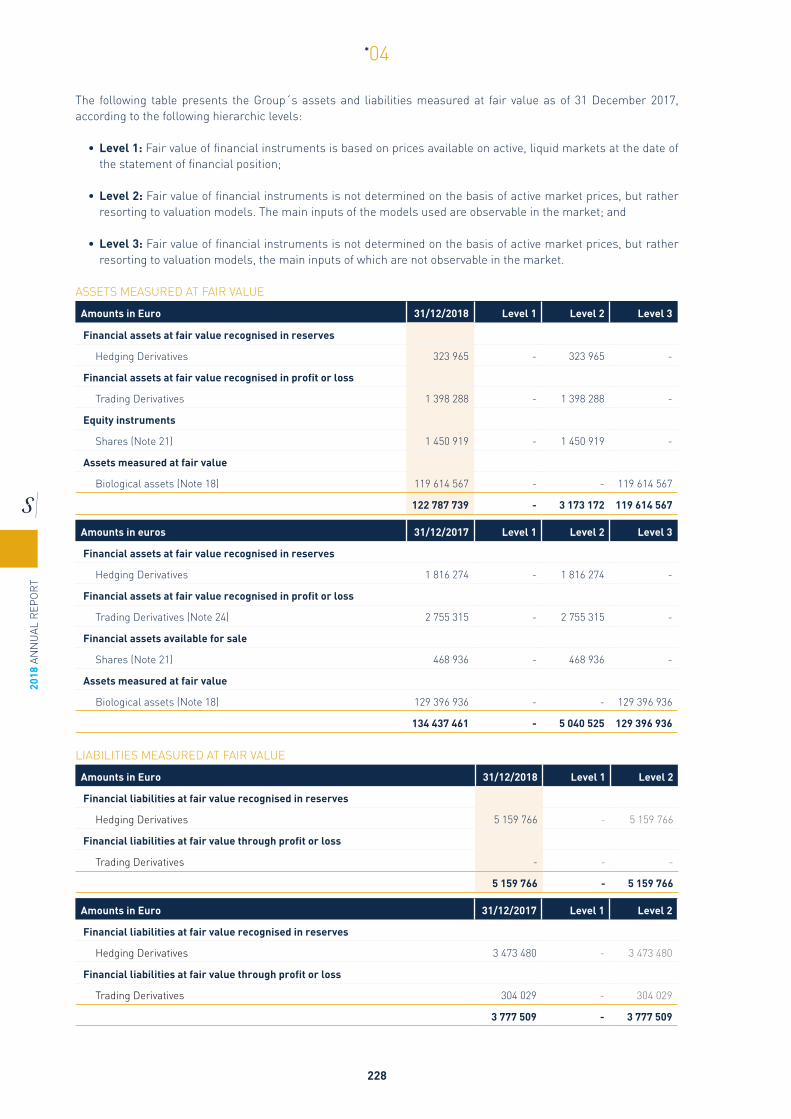
2018
AN
NU
AL R
EPO
RT
228
*04
The following table presents the Group´s assets and liabilities measured at fair value as of 31 December 2017, according to the following hierarchic levels:
• Level 1: Fair value of financial instruments is based on prices available on active, liquid markets at the date of the statement of financial position;
• Level 2: Fair value of financial instruments is not determined on the basis of active market prices, but rather resorting to valuation models. The main inputs of the models used are observable in the market; and
• Level 3: Fair value of financial instruments is not determined on the basis of active market prices, but rather resorting to valuation models, the main inputs of which are not observable in the market.
ASSETS MEASURED AT FAIR VALUE
Amounts in Euro 31/12/2018 Level 1 Level 2 Level 3
Financial assets at fair value recognised in reserves
Hedging Derivatives 323 965 - 323 965 -
Financial assets at fair value recognised in profit or loss
Trading Derivatives 1 398 288 - 1 398 288 -
Equity instruments
Shares (Note 21) 1 450 919 - 1 450 919 -
Assets measured at fair value
Biological assets (Note 18) 119 614 567 - - 119 614 567
122 787 739 - 3 173 172 119 614 567
Amounts in euros 31/12/2017 Level 1 Level 2 Level 3
Financial assets at fair value recognised in reserves
Hedging Derivatives 1 816 274 - 1 816 274 -
Financial assets at fair value recognised in profit or loss
Trading Derivatives (Note 24) 2 755 315 - 2 755 315 -
Financial assets available for sale
Shares (Note 21) 468 936 - 468 936 -
Assets measured at fair value
Biological assets (Note 18) 129 396 936 - - 129 396 936
134 437 461 - 5 040 525 129 396 936
LIABILITIES MEASURED AT FAIR VALUE
Amounts in Euro 31/12/2018 Level 1 Level 2
Financial liabilities at fair value recognised in reserves
Hedging Derivatives 5 159 766 - 5 159 766
Financial liabilities at fair value through profit or loss
Trading Derivatives - - -
5 159 766 - 5 159 766
Amounts in Euro 31/12/2017 Level 1 Level 2
Financial liabilities at fair value recognised in reserves
Hedging Derivatives 3 473 480 - 3 473 480
Financial liabilities at fair value through profit or loss
Trading Derivatives 304 029 - 304 029
3 777 509 - 3 777 509

2018 ANN
UAL R
EPO
RT
229
*04
DERIVATIVE FINANCIAL INSTRUMENTSAs of 31 December 2018, details of the fair value of derivative financial instruments were as follows:
Amounts in Euro Fair value
changes (trading) Fair value
changes (hedging) Total
As of 1 January 2018 2 451 286 (1 657 206) 794 080
New contracts / Settlements (1 191 450) 7 064 975 5 873 526
Changes in fair value recognised in the income statement (Note 10) 140 363 (6 526 185) (6 385 822)
Changes in fair value recognised in equity - (3 717 385) (3 717 385)
Currency Adjustment (1 911) - (1 911)
As of 31 December 2018 1 398 288 (4 835 801) (3 437 513)
DETAILS AND MATURITY OF THE DERIVATIVE FINANCIAL INSTRUMENTSThe fair value of derivative financial instruments is included under the caption Current payables (Note 32), if negative, and in the caption Current receivables (Note 24), if positive. The movement in the balances presented in the years ended as at 31 December 2018 and 2017, relating to financial instruments were as follows:
Amounts in Euro Amount Currency Maturity
31/12/2018 31/12/2017
Positive Negative Net Net
Hedging
Net Investment Hedging - USD 2018 - - - 114 914
Exchange rate forwards (future sales) 360 666 667 USD 2019 - (117 912) (117 912) 1 701 360
Exchange rate forwards (future sales) 67 166 667 GBP 2019 323 965 - 323 965 -
Interest rate swaps (SWAP's) 465 000 000 Euro 2020/23 - (5 024 761) (5 024 761) (3 473 480)
Non Deliverable Forward (NDF) 10 564 866 BRL 2019 - (17 093) (17 093)
323 965 (5 159 766) (4 835 801) (1 657 206)
Trading
Exchange rate forwards 69 500 000 USD 2018 113 278 - 113 278 669 733
Exchange rate forwards 12 150 000 GBP 2018 28 582 - 28 582 8 407
Cross currency interest rate swap 9 239 298 USD 2019 483 666 - 483 666 18 044
Currency Collar - BRL 2018 - - - (25 370)
Interest rate swaps (SWAP's) 15 900 000 USD 2019 623 793 - 623 793 630 491
Hedging Cash Anti-Dumping - USD 2018 - - - 1 149 981
Non Deliverable Forward (NDF) 6 133 306 Euro 2019 148 969 - 148 969 -
1 398 288 - 1 398 288 2 451 286
1 722 253 (5 159 766) (3 437 513) 794 080
DERIVATIVE FINANCIAL INSTRUMENTS | NEGOTIATION
Pulp and paper segmentThe Navigator Group has a currency exposure on sales invoiced in foreign currencies, namely US dollars (USD) and sterling pounds (GBP). Since the Group’s financial statements are translated into Euro, it runs an economic risk on the conversion of these currency flows to the Euro. The Group is also obliged, albeit to a lesser degree, to make certain payments in those same currencies which, for currency exposure purposes, act as a natural hedge. Thus, the hedge is aimed at safeguarding the net value of the statement of financial position items denominated in foreign currencies against the respective currency fluctuations.
The hedging instruments used in this operation are foreign exchange forward contracts, covering the net exposure to other currencies at the time the invoices are issued, for the same maturity dates and the same amounts of these documents. The nature of the risk hedged is the change in the carrying amount of sales and purchases expressed

2018
AN
NU
AL R
EPO
RT
230
*04
in foreign currencies. At the end of each month, customer and suppliers’ balances expressed in foreign currency are updated, with the gain or loss offset against the fair value change of the forwards negotiated.
The fair value of trading instruments, forwards, at 31 December 2018 amounts to EUR 141,860.
Cement and derivatives segmentIn July 2016, the subsidiary Supremo Cimentos, S.A., contracted with a Brazilian financial institution for external financing in the amount of USD 9,239,298, maturing on 22 July 2019 and amortised in five equal instalments, beginning on 24 July 2017. On the same date, a cross currency interest rate swap contract was signed with the purpose of covering exchange rate exposure. This derivative financial instrument allowed the Company to set the nominal value of the financing in BRL 30,000,000 and the payment of interest at the CDI rate plus a spread, fully replicating the amortisation plan of said financing in USD.
In January 2018, the subsidiary Supremo contracted with a financial institution an external financing amount of approximately EUR 6 million maturing on 11 January 2019, with a single amortization in January 2019. On that same date, a Non-delivery Forward contract with the objective of covering the exposure to the exchange rate in the quarterly payment of interest and the repayment of capital at maturity, fully replicating the financing in euros.
In October 2018, the subsidiary Margem contracted with a Brazilian financial institution for external financing in the amount of USD 15,900,000 maturing in October 2019, with a single amortization on maturity. On the same date, a cross currency interest rate swap agreement was entered into with the purpose of hedging exposure to the exchange rate. This derivative allowed Margin to set the nominal value of the financing in BRL and the payment of interest at the CDI rate plus a spread, fully replicating the amortization plan of the said financing in USD.
DERIVATIVE FINANCIAL INSTRUMENTS | HEDGE
Pulp and paper segment – hedge of investment in foreign operationsThe Navigator Group hedged the economic risk associated with exposure to the exchange rate of its participation in Navigator North America until May 2018. To this purpose, the Group has entered into a foreign exchange forward maturing in May 2018, with a notional outstanding of USD 25,050,000.
This instrument was designated as hedge of the investment made in the North American subsidiary of the Group, with changes in fair value recognised under comprehensive income of the period.
Pulp and paper segment – hedge of future sales | exchange rate risk eur/usdThe Navigator Group uses derivative financial instruments to limit the net risk of exchange exposure associated with estimated future sales and purchases in USD.
In this context, during the last quarter of 2018, the Group contracted a set of financial structures to cover the totality of the net foreign exchange exposure of estimated sales in USD for 2019. The derivative financial instruments, in force since 1 January 2019 are Options and Zero Cost Collar, totaling USD 346,666,667 and GBP 67,166,667, maturing on 31 December 2019 and 31 January 2020, in the case of USD, and February 2020, for GBP.
As of 2019, the financial instruments were further strengthened through the additional contracting of GBP 57,000,000, divided between Options and Zero Cost Collar, maturing in December 2019.
2018 ANN
UAL R
EPO
RT
231
*04
Pulp and paper segment – hedge of cash flows | interest rateThe Navigator Group hedges its future interest payments on loans, commercial paper and bond loans, by engaging in an interest rate swap, in which it pays a fixed rate and receives a variable rate. The instrument is designated as a cash flow hedge of the interest rate risk, associated with the issued debt and does not cover credit risk. This hedge is designated until the maturity of the hedging instruments.
Cement and derivatives segment – hedge of cash flows | interest rateIn 2015, Secil contracted a bond loan of Euro 60,000,000 that will be repaid to the pair in June 2020, with semi-annual and in arrears payments. Additionally, on 23 June 2016, Secil contracted an interest rate hedge derivative, through an interest rate Swap (IRS), with a nominal value of EUR 60,000,000, beginning on 9 December 2016 and maturing on 9 June 2020.
Also in 2015, Secil contracted a bond loan of Euro 80,000,000, with a full repayment at par in May 2020, with semi-annual and in arrears payments. On 23 June 2016, an interest rate hedge derivative was contracted through an interest rate swap (IRS) with a notional amount of Euro 80,000,000, beginning on 25 November 2016 and maturing on 25 May 2020.
Cement and derivatives segmentSecil granted intercompany financing in Brazilian Reals (BRL) to the subsidiary Supremo and contracted a financial instrument to cover the receipt in euros of the financing, namely a Non-deliverable Forward in the total amount of BRL 10,564,866 due in October 2019.
Equity instrumentsThese amounts are recognised at fair value, which corresponds to their market value, deducted from impairment losses, if any (Note 21).
Loans and receivablesThese amounts are recognised at fair value, which corresponds to their nominal value, after deducting any impairment losses identified during the credit risk analysis to the credit portfolios held (Notes 2.1.3, 22 and 24).
Other financial liabilitiesThese items are recognised at their amortised cost, corresponding to the value of the respective cash flows discounted at the effective interest rate, associated with each one of the liabilities concerned (Note 31).

2018
AN
NU
AL R
EPO
RT
232
*04
35 BALANCES AND TRANSACTIONS WITH RELATED PARTIESBALANCES WITH RELATED PARTIES AND SHAREHOLDERSAs of 31 December 2018 and 2017, related parties and shareholders balances are detailed as follows:
Amounts in Euro
31/12/2018 31/12/2017
Other receivables
(Note 24)Other payables
(Note 32)
Interest-bearing
liabilities(Note 31)
Other receivables
(Note 24)Other payables
(Note 32)
Interest-bearing
liabilities(Note 31)
Shareholders
Sodim. SGPS. S.A. 520 - - - - -
Cimigest. SGPS. S.A. 5 691 - - 2 763 3 242 -
Cimo SGPS. S.A. - - 3 209 343 - - 4 433 589
Longapar. SGPS. S.A. - - - 106 - 36 886
Other related entities
Cimilonga - Imobiliária. S.A. - - - - 31 215 -
Hotel Ritz. S.A. - - - - 12 487 -
Sonagi. SGPS. S.A. 295 - - - - -
Soc. Agrícola Herdade dos Fidalgos. Lda. - - - - 504 -
Ave-Gestão Ambiental. S.A. 109 264 202 631 - 128 262 481 578 -
Cotif Sicar - 78 294 - - 92 844 -
Enermontijo. S.A. 65 477 20 430 - 54 656 12 551 -
Enerpar. SGPS. S.A. - - - - 21 598 -
Inertogrande 214 674 - - 213 993 - -
J.M.J. Henriques. Lda. 127 533 - - 126 852 - -
Seribo. S.A. - - - - 324 717 -
Grupo Setefrete - Soc. Tráfego Cargas. S.A. 36 039 187 913 - - 183 471 -
Minority shareholders of Ciment de Sibline* - 1 980 168 - - 5 873 015 -
Other subsidiaries shareholders - 19 849 - - 20 409 -
Total 559 493 2 489 285 3 209 343 526 632 7 057 631 4 470 475
* Assigned dividends which are awaiting settlement

2018 ANN
UAL R
EPO
RT
233
*04
TRANSACTIONS WITH RELATED PARTIES AND SHAREHOLDERSAs of 31 December 2018 and 2017, transactions between shareholders and other related parties comprised:
Amounts in Euro
2018 2017
Purchase of Services
Sales and services
rendered
Other operating
income
Financial income/
(expenses)Purchase of
Services
Sales and services
rendered
Other operating
income
Financial income/
(expenses)
Shareholders
Sodim. SGPS. S.A. - - 423 (1 877) - - 423 -
Cimigest SGPS. S.A. (107 740) - 15 596 - (107 740) - 15 596 (1 547)
Cimo SGPS. S.A. - - - (14 958) - - - (23 863)
Longapar. SGPS. S.A. - - - - - - - (1 095)
OEM SGPS. S.A. - - - - - - - (5 598)
(107 740) - 16 019 (16 835) (107 740) - 16 019 (32 103)
Other related entities
Sonagi - Imobiliária. S.A.(former Cimilonga. S.A.) (964 578) - 1 274 - (1 037 624) - - -
Hotel Ritz. S.A. (72 570) - 134 - (49 837) - 1 600 -
Sonagi. SGPS. S.A. - - 670 - - - 4 327 -
Enermontijo. S.A. (522 676) 409 768 - - (102 499) 218 205 - -
Enerpar. SGPS. S.A. (17 401) - - - (222 120) - - -
Ave-Gestão Ambiental. S.A. (2 030 784) - - - (2 770 573) 54 648 66 064 -
Seribo. S.A. - - - - - - - (4 810)
Setefrete. S.A. (2 778 726) - - - (3 176 943) - 20 351 -
Bestweb. Lda. (42 788) - - - (39 786) - - -
CLA - Caldas. Lopes. Almeida & Associados (36 000) - - - - - - -
Others - - - (334) (3 147) - 3 600 (334)
(6 465 523) 409 768 2 078 (334) (7 402 529) 272 853 95 942 (5 144)
The balances and transactions with Shareholders relate essentially to short-term treasury operations that bear interest at market rates.
In previous years, lease agreements were signed between Semapa and Sonagi - Imobiliária, S.A., (which also entered into a lease agreement with Navigator Paper Figueira, S.A.) relating to the lease of several office floors in the building which it owns and operates the headquarters of Semapa, SGPS, S.A., at Av. Fontes Pereira de Melo, No. 14, in Lisbon.
In March 2015, the subsidiary The Navigator Company entered into an agreement with Enerpar SGPS, Lda., under which it paid the latter a remuneration for the promotion of the pellet project in the United States of America. Enerpar SGPS, Lda. is a company that manages holdings in the renewable energy sector, which holds the entire capital of Enermontijo, S.A., (that has been engaged in the production of wood pellets of forest origin since 2008) and whose shareholders had family ties to a non-executive director of the Group.
In connection with the identification of the related parties, for the purposes of financial reporting, AVE, S.A. and Setefrete, SA were also referred to as related parties, because they are associated companies of the subsidiary Secil, to which the Group acquires waste and alternative fuels, in the first case, and stowage in cargo handling for ships, in the second.
As mentioned in Note 21, in 2018 the Group, through its subsidiary Semapa Next, SA, entered into an agreement to perform an investment of USD 12 million in the “Alter Venture Partners Fund I”, entity in which a member of the executive team is also a non-executive board member of Semapa.

2018
AN
NU
AL R
EPO
RT
234
*04
REMUNERATION OF THE MEMBERS OF THE BOARD OF DIRECTORSThe short-term benefits/remuneration received by the members of the Board of Directors of Semapa and members of the boards of directors of the Other Group´s companies are described in Note 7. All details of the remuneration policy of the Board members of Semapa’s management are detailed in the Company’s Corporate Governance Report, Part I - Section D.
In addition, with respect to post-employment benefits and as described in Note 29, as of 31 December 2018, the amount of liabilities related to post-employment benefit plans, related to one Board Member of the Navigator Group, amounted to EUR 1,025,289 (31 December 2017 regarding two Board Members: EUR 1,701,096).
As of 31 December 2018 and 2017, for the members of the Board of Directors of Semapa, there were no (i) additional liabilities related to other long-term benefits, (ii) termination benefits, (iii) share-based payments, (iv) outstanding balances.
36 ENVIRONMENTAL EXPENDITURESAs part of its business operations, the Group incurs in several environmental expenditure which, depending on their nature, are capitalised or recognised as costs, in the operating results for the year.
Environmental expenses incurred by the Group, in order to preserve resources or to avoid or reduce future damage, are capitalised, when they are expected to extend the useful life or to increase the capacity, safety or efficiency of other assets held by the Group.
Expenditures capitalised and recognised as costs, in the year ended as at 31 December 2018 and 2017, were as follows:
Amounts in Euro
2018 2017
Revenue Expenses Capitalisation Revenue Expenses Capitalisation
Atmospheric emissions - 9 506 967 5 636 557 - 2 509 248 130 237
Energy - - 3 018 088 - - 313 756
Residual managements (610 458) 1 662 730 13 439 (801 410) 1 619 646 -
Protection of nature - 634 665 - - 628 474 193 149
Management of residual waters - 13 943 971 88 994 - 12 399 758 160 920
Other activities - 2 905 139 1 850 095 - 4 384 484 737 914
(610 458) 28 653 473 10 607 173 (801 410) 21 541 609 1 535 976

2018 ANN
UAL R
EPO
RT
235
*04
37 AUDIT FEES During the period under review, and following the resolution of the Extraordinary General Meeting, dated 22 September 2017, the Group changed its Statutory Auditor with effect from 1 January 2018 to KPMG & Associados - Sociedade de Revisores Oficiais de Contas, S.A.
In the year ended 31 December 2018, fees charged by the company of statutory auditors (KPMG) and other entities belonging to the same network for the statutory audit of the annual accounts, limited review of interim accounts, other reliability assurance services, tax advice and other services, are broken down as follows:
Amounts in Euro 2018
Statutory audit services 235 701
Tax advisory services -
Other reliability assurance services 11 363
Other services 25 000
272 064
In 2018, the previous Statutory Auditor, PwC also invoiced fees in the amount of EUR 576,553 regarding the Statutory Audit for the 2017 year.
In the year ended 31 December 2017, the fees invoiced by the company of statutory auditors (PwC) and other entities belonging to the same network are as follows:
Amounts in Euro 2017
Statutory audit services 720 815
Tax consultancy services 49 913
Other reliability assurance services 18 080
Other services 24 500
813 308
The services described as tax advisory, mainly comprise the support in complying with tax obligations, being fully integrated in the transitional period expressed in Article 3 of Law 140/2015.
The services indicated as Other reliability assurance services concern the issuance of analysis reports to the management information systems, specialised support in the scope of the Group’s subsidiaries’ sustainability reports and issuing opinions for certification of irrecoverable debts.
Other services essentially include advice provided under the socio-economic impact study of the Navigator Tissue Cacia invoiced by another entity of the KPMG network.
The Board of Directors believes there are adequate procedures safeguarding the independence of auditors, through the Audit Board process analysis of the work proposed and careful definition of the work to be performed by the auditors.

2018
AN
NU
AL R
EPO
RT
236
*04
38 NUMBER OF EMPLOYEESAs of 31 December 2018 and 2017, the number of Employees working for the Group’s various companies, was as follows:
Segment 31/12/2018 31/12/2017 Var. 18/17
Pulp and paper 3 282 3 197 85
Cement and derivatives 2 470 2 556 (86)
Environment 270 270 -
Holdings and others 32 28 4
6 054 6 051 3
39 COMMITMENTS AND CONTINGENCIES As of 31 December 2018 and 2017, the guarantees provided by the Group were as follows:
Amounts in Euro 31/12/2018 31/12/2017
Warranties
Tax and Customs Authority 24 053 434 26 022 893
IAPMEI 5 594 650 5 762 249
APSS - Admi. dos Portos de Setúbal e Sesimbra 2 605 009 2 605 009
Product Clearance 1 835 250 1 835 250
Agência Estatal de Administ. Tributaria Espanhola 1 033 204 1 033 204
Comissão de Coordenação e Desenv. Regional LVT 876 372 1 000 926
Conselho de Emprego, Indústria e Turismo (Espanha) 954 118 954 118
Direção Geral de Alfândegas de Setúbal - 800 000
APDL - Administração do Porto de Leixões 720 657 711 219
Simria 338 829 338 829
Instituto de Conservação da Natureza - Arrábida 474 444 406 540
Secretaria Regional do Ambiente e Recursos Naturais - 274 595
IAPMEI (in the perimeter of PEDIP) 209 305 209 305
Comissão de Coordenação e Desenv. Regional Norte 236 403 236 403
Comissão de Coordenação e Desenv. Regional Centro 745 825 727 825
Comissão de Coordenação e Desenv. Regional Algarve 534 620 534 620
CCRLVT 298 638 -
Mercedes Benz - Vehicles rental 500 000 500 000
Others 2 036 526 1 695 324
43 047 283 45 648 309
Other commitments
Of purchase
Property, plant and equipment 27 842 940 109 933 881
Wood 197 544 779 89 569 000
Energy supply 18 029 651 26 704 382
Raw materials - Petcoque and Coal 13 689 302 360 771
Others 5 951 569 5 066 433
Forestry land rents 52 667 093 53 498 715
Mortgages on Land, Real Estate and Equipment 61 893 651 59 794 669
377 618 984 344 927 851
420 666 267 390 576 160

2018 ANN
UAL R
EPO
RT
237
*04
As part of the fiscal inspection process for 2013, the subsidiary The Navigator Company, S.A., was notified on 4 September 2017 of the Final Tax Inspection Report, which resulted in an additional tax assessment in the amount of Euros 20,556,589. Not agreeing with the correction identified, Navigator decided to appeal and to present a bank guarantee in the amount of Euros 26,022,893 to suspend the respective tax enforcement process, following a number of litigation already filed on the subject since 2012.
After a favorable decision on one of the most relevant cases presented and, as a result of Navigator’s insistence throughout this litigation and in particular since the end of 2017, the alteration of TA’s internal understanding on one of the essential issues under discussion (i.e., at the end of 2018, the Tax Authority (TA) allowed the deduction of the entire RFAI made up of Navigator in the periods between 2009 and 2013. On this basis, as early as 2018 the value of the bank guarantee was reduced to EUR 24,053,434, pending the release of the guarantee in 2019 after the completion of the proceeding.
The guarantees provided to IAPMEI essentially include the guarantees made under the Investment contracts entered into between the Portuguese State and Navigator Pulp Cacia, S.A. (EUR 2,438,132) and Navigator Tissue Ródão, S.A. (EUR 2,771,188), in accordance with the terms and conditions stipulated in the Payment Rule applicable to Projects approved under the NSRF Incentive Systems. In 2018, the guarantee provided by Navigator Tissue Ródão, S.A., was demobilized.
As at 31 December 2017, Other commitments for the purchase of tangible fixed assets refer essentially to the commitments made by the subsidiary Navigator, relating to investments in plant equipment, namely in connection with the project to increase pulp production capacity in Figueira da Foz and the new production line of Tissue in Cacia concluded in 2018.
As at 31 December 2018, commitments assumed for 2019 regarding the acquisition of wood amounted to Euro 197,544,779 (Iberian and non-Iberian market). In addition to these commitments, there are also commitments amounting to Euro 89,569,000 regarding long-term agreements for the acquisition of wood.
The amount related to the item Electric Energy corresponds to the acquisition commitments assumed by the Brazilian subsidiaries of Secil.
Within the financing agreements with the EIB, the Navigator Group also provided bank guarantees in the amount of EUR 91,346 million.
As of 31 December 2018 and 2017, debt’s reimbursement plans for operating leases are as follows:
Amounts in Euro 31/12/2018 31/12/2017
Less than 1 year 3 596 579 3 258 777
Over 1 year and less than 5 years 4 809 132 4 828 374
8 405 711 8 087 151
Costs incurred in the year 4 156 314 3 306 061
40 OTHER COMMITMENTS OF THE GROUP SECURITY DEPOSITThe subsidiary Ciminpart sold its stake in VIROC in 2012. In the context of this proceeding, Secil has lodged a pledge on a bank deposit amounting to EUR 400,000.

2018
AN
NU
AL R
EPO
RT
238
*04
41 CONTINGENT ASSETSNON-TAX MATTERS
Infrastructure enhancement and maintenance feeUnder the licensing process no 408/04 related to the new paper mill project, the Setúbal City Council issued a settlement note to Navigator regarding an infrastructure increase and maintenance fee (TMUE), amounting to Euro 1,199,560, with which the company disagrees.
This situation regards the amount collected under this levy in the licensing process mentioned above, for the construction of a new paper mill in the industrial site of Mitrena, Setúbal. Navigator disagrees with the amount charged and filled an administrative claim against it on 25 February 2008 (request 2485/08), followed by an appeal in Court against the rejection of the claim on 28 October 2008. At 3 October 2012, this claim had an adverse decision, and in 13 November an appeal to the Administrative Supreme Court (STA) was performed, which has brought down the action to Central Administrative Court (TCA) on 4 July 2013, pending decision.
Public debt settlement fundIn addition to the tax matters described below, a second request to the Public Debt Settlement Fund was submitted on 2 June 2010, which called for the reimbursement of various amounts, totalling Euro 136,243,939. These amounts were related to adjustments in the financial statements of the group after its privatisation, that have not been considered in formulating the price of such privatisation, as they were not included in the documentation made available for consultation by the bidders.
On 24 May 2014 the Court denied the Navigator Company Group’s proposal to present testimony evidence, alternatively proposing written submissions. On 30 June 2014 Navigator Company Group appealed against this decision, but continuously presented written evidence. The Court subsequently confirmed the Navigator Company Group’s views on this matter, both parts appointed experts and the partial expert report was issued on July 2017, being required either by The Navigator Company, S.A. either by the Ministry of Finance, the attendance of both designated experts in court hearing, in order to provide oral explanations on the issued reports. The date of the court hearing is still to be appointed.
PledgesIn the first quarter of 2019, the companies of the Navigator Group will intent an Administrative Action on Civil Liability against the Ministry of Finance which aims at the recognition of their right and in consequence, convict the Ministry of Finance to pay a compensation for the charges incurred by them, in 2018, related to the collaboration provided to the Portuguese Tax Authorities within the context of pledges in tax enforcement proceedings.
TAX MATTERS
Public debt settlement fundAccording to Decree-Law No. 36/93 of 13 February 13, tax debts of privatized companies related to periods prior to the privatization date (November 25, 2006) are the responsibility of the Public Debt Regularization Fund. On 16 April 2008, The Navigator Company filed an application to the Public Debt Settlement Fund to request payment of tax debts previously paid by the Tax Authorities. On 13 December 2010, it filed a new application requesting the payment of the debts settled by the Tax Authorities related to the years 2006 and 2003, which was supplemented, on 13 October 2011, with the amounts already paid and not disputed relating to these debts, as well as expenses directly related thereto, pursuant to the Judgment dated 24 May 2011 (Case No. 0993A / 02), which confirmed the Company’s position regarding the enforceability of such expenses.
On 13 December 2017, The Navigator Company, S.A. entered into an extra-judicial agreement with the Treasury, in which the FRDP was recognized as having responsibility for recovering the amount of EUR 5,725,771 corresponding to the amount of Corporate Income Tax (CIT) improperly paid, resulting from the alleged qualification/incorrect consideration by the tax administration of the tax loss accruing as a result of the operations carried out by Soporcel, SA in 2003, as well as to promote restitution to Navigator of said amount.
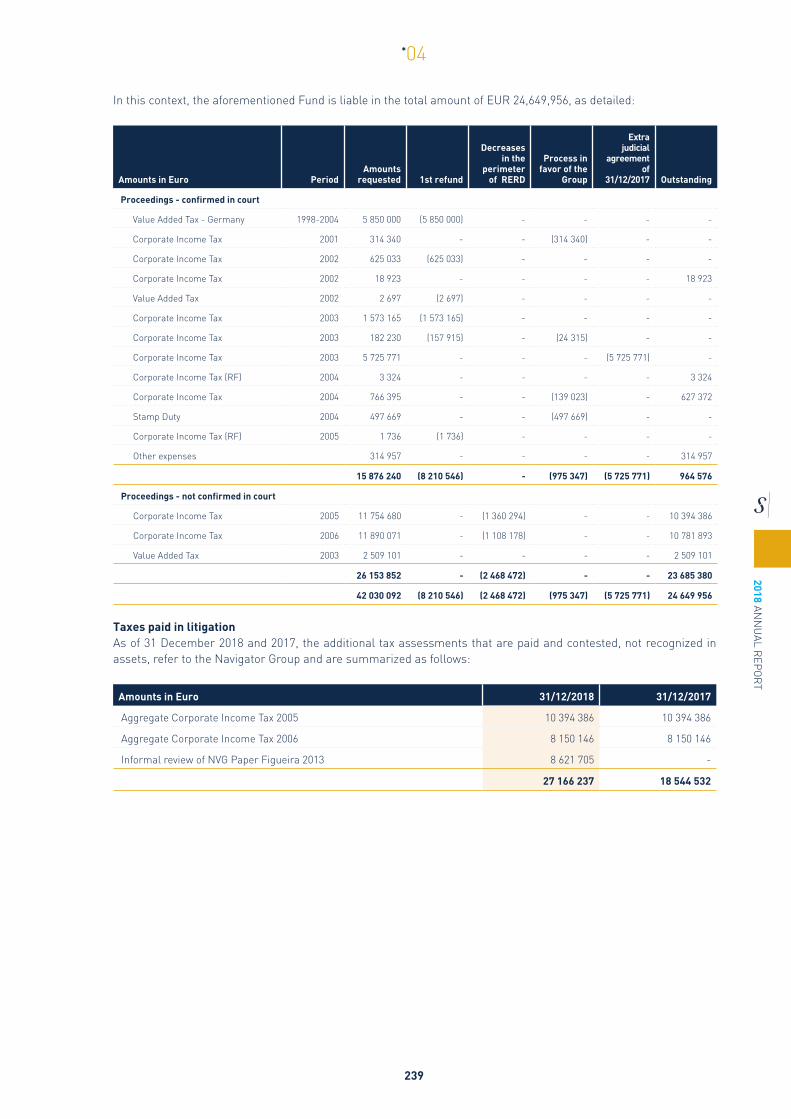
2018 ANN
UAL R
EPO
RT
239
*04
In this context, the aforementioned Fund is liable in the total amount of EUR 24,649,956, as detailed:
Amounts in Euro Period Amounts
requested 1st refund
Decreases in the
perimeter of RERD
Process in favor of the
Group
Extra judicial
agreement of
31/12/2017 Outstanding
Proceedings - confirmed in court
Value Added Tax - Germany 1998-2004 5 850 000 (5 850 000) - - - -
Corporate Income Tax 2001 314 340 - - (314 340) - -
Corporate Income Tax 2002 625 033 (625 033) - - - -
Corporate Income Tax 2002 18 923 - - - - 18 923
Value Added Tax 2002 2 697 (2 697) - - - -
Corporate Income Tax 2003 1 573 165 (1 573 165) - - - -
Corporate Income Tax 2003 182 230 (157 915) - (24 315) - -
Corporate Income Tax 2003 5 725 771 - - - (5 725 771) -
Corporate Income Tax (RF) 2004 3 324 - - - - 3 324
Corporate Income Tax 2004 766 395 - - (139 023) - 627 372
Stamp Duty 2004 497 669 - - (497 669) - -
Corporate Income Tax (RF) 2005 1 736 (1 736) - - - -
Other expenses 314 957 - - - - 314 957
15 876 240 (8 210 546) - (975 347) (5 725 771) 964 576
Proceedings - not confirmed in court
Corporate Income Tax 2005 11 754 680 - (1 360 294) - - 10 394 386
Corporate Income Tax 2006 11 890 071 - (1 108 178) - - 10 781 893
Value Added Tax 2003 2 509 101 - - - - 2 509 101
26 153 852 - (2 468 472) - - 23 685 380
42 030 092 (8 210 546) (2 468 472) (975 347) (5 725 771) 24 649 956
Taxes paid in litigationAs of 31 December 2018 and 2017, the additional tax assessments that are paid and contested, not recognized in assets, refer to the Navigator Group and are summarized as follows:
Amounts in Euro 31/12/2018 31/12/2017
Aggregate Corporate Income Tax 2005 10 394 386 10 394 386
Aggregate Corporate Income Tax 2006 8 150 146 8 150 146
Informal review of NVG Paper Figueira 2013 8 621 705 -
27 166 237 18 544 532

2018
AN
NU
AL R
EPO
RT
240
*04
42 EXCHANGE RATESThe assets and liabilities of the foreign subsidiaries and associated companies were translated to Euro at the exchange rate prevailing as of 31 December 2018.
The income statement transactions were translated at the average rate for the period. The differences arising from the application of these rates, as compared with the balance prior to the conversion, were reflected under the Currency translation reserve heading in shareholders’ equity. The rates used as of 31 December 2018 and 2017, against the Euro, were as follows:
31/12/2018 31/12/2017 Valuation/
(depreciation) 31/12/2018 31/12/2017 Valuation/
(depreciation)
TND (tunisian dinar) DKK (danish krone)
Average exchange rate for the period 3.1249 2.7184 (14.95%)
Average exchange rate for the period 7.4532 7.4386 (0.20%)
Exchange rate at the end of the period 3.4928 2.9454 (18.58%)
Exchange rate at the end of the period 7.4673 7.4449 (0.30%)
LBN (lebanese pound) HUF (hungarian florim)
Average exchange rate for the period 1 780.30 1 703.00 (4.54%)
Average exchange rate for the period 318.8899 309.2462 (3.12%)
Exchange rate at the end of the period 1 726.10 1 807.90 4.52%
Exchange rate at the end of the period 320.9800 310.3300 (3.43%)
USD (american dollar) AUD (australian dollar)
Average exchange rate for the period 1.1810 1.1297 (4.54%)
Average exchange rate for the period 1.5797 1.4732 (7.23%)
Exchange rate at the end of period 1.1450 1.1993 4.53%
Exchange rate at the end of the period 1.6220 1.5346 (5.70%)
GBP (sterling pound) MZM (mozambican metical)
Average exchange rate for the period 0.8847 0.8763 (0.96%)
Average exchange rate for the period 71.9575 72.1990 0.33%
Exchange rate at the end of the period 0.8945 0.8872 (0.82%)
Exchange rate at the end of the period 70.9500 71.4800 0.74%
PLN (polish zloty) BRL (brazilian real)
Average exchange rate for the period 4.2615 4.2573 (0.10%)
Average exchange rate for the period 4.3087 3.6081 (19.42%)
Exchange rate at the end of the period 4.3014 4.1770 (2.98%)
Exchange rate at the end of the period 4.4383 3.9683 (11.84%)
SEK (swedish krone) MAD (moroccan dirame)
Average exchange rate for the period 10.2583 9.6354 (6.46%)
Average exchange rate for the period 10.8811 10.9633 0.75%
Exchange rate at the end of the period 10.2548 9.8438 (4.18%)
Exchange rate at the end of the period 11.0504 11.2210 1.52%
CZK (czech krone) NOK (norwegian krone)
Average exchange rate for the period 25.6469 26.3309 2.60%
Average exchange rate for the period 9.5975 9.3294 (2.87%)
Exchange rate at the end of the period 25.7240 25.5350 (0.74%)
Exchange rate at the end of the period 9.9483 9.8403 (1.10%)
CHF (swiss franc) AOA (angolan kwanza)
Average exchange ratefor the period 1.1549 1.1115 (3.91%)
Average exchange rate for the period 303.4909 190.6947 (59.15%)
Exchange rate at the end of the period 1.1269 1.1702 3.70%
Exchange rate at the end of the period 361.8230 202.9815 (78.25%)
TRY (turkish lira) MXN (Mexican Peso)
Average exchange rate for the period 5.7077 4.1194 (38.56%)
Average exchange rate for the period 22.7003 21.3286 (6.43%)
Exchange rate at the end of the period 6.0588 4.5464 (33.27%)
Exchange rate at the end of the period 22.4921 23.6612 4.94%
ZAR (South African rand) AED (United Arab Emirates Dirham )
Average exchange rate for the period 15.6188 15.0442 (3.82%)
Average exchange rate for the period 4.3344 3.9549 (9.60%)
Exchange rate at theend of the period 16.4594 14.8054 (11.17%)
Exchange rate at the end of the period 4.2050 4.1215 (2.03%)

2018 ANN
UAL R
EPO
RT
241
*04
43 COMPANIES INCLUDED IN THE CONSOLIDATION PERIMETERINSTRUMENTAL COMPANIES INCLUDED IN CONSOLIDATION
Name Head Office
Direct and indirect % of equity held by Semapa
Direct Indirect 31/12/2018 31/12/2017
Parent - company
Semapa - Sociedade de Investimento e Gestão. SGPS. S.A. Lisbon
Subsidiaries
Seminv. SGPS. S.A.* Lisbon - - - 100.00
Seinpart. SGPS. S.A.* Lisbon - - - 100.00
Seinpar Investments. B.V. Amsterdam 100.00 - 100.00 100.00
Semapa Inversiones S.L. Madrid 100.00 - 100.00 100.00
Celcimo S.L. Madrid - 100.00 100.00 100.00
Semapa Next. S.A. Lisbon 100.00 - 100.00 100.00
Aphelion. S.A. Lisbon 100.00 - 100.00 100.00
* Company liquidated during the year
SUBSIDIARY COMPANIES OF SUB-GROUP ETSA – CONSOLIDATED BY THE FULL CONSOLIDATION METHOD
Name Head Office
Direct and indirect % of equity held in ETSA % shares held by Semapa
Direct Indirect Total 31/12/2018 31/12/2017
Parent - company:
ETSA - Investimentos. SGPS. S.A. Loures 99.99 - 99.99 99.99 99.99
Subsidiaries:
ETSA LOG.S.A. Loures 100.00 - 100.00 100.00 100.00
SEBOL – Comércio e Industria de Sebo. S.A. Loures 100.00 - 100.00 100.00 100.00
ITS – Indústria Transformadora deSubprodutos Animais. S.A. Coruche 100.00 - 100.00 100.00 100.00
ABAPOR – Comércio e Industria de Carnes. S.A. Coruche 100.00 - 100.00 100.00 100.00
BIOLOGICAL - Gestão de Resíduos Industriais. Lda. Loures 100.00 - 100.00 100.00 100.00
AISIB – Aprovechamiento Integral de Subprodutos Ibéricos. S.A. Spain 100.00 - 100.00 100.00 100.00

2018
AN
NU
AL R
EPO
RT
242
*04
SUBSIDIARY COMPANIES OF SUB-GROUP NAVIGATOR – CONSOLIDATED BY THE FULL CONSOLIDATION METHOD
Name Head Office
Direct and indirect % equity held in Navigator % of shares held by Semapa
Direct Indirect Total 31/12/2018 31/12/2017
Parent - company:
The Navigator Company. S.A. Setúbal 35.73 33.71 69.44 69.44 69.40
Subsidiaries:
Navigator Paper Figueira. S.A.Figueira da
Foz 100.00 - 100.00 69.44 69.40
Navigator Parques Industriais. S.A. Setúbal 100.00 - 100.00 69.44 69.40
Navigator Products & Tecnology. S.A. Setúbal 100.00 - 100.00 69.44 69.40
Raiz - Instituto de Investigação da Floresta e Papel Aveiro 97.00 97.00 67.35 67.32
Enerpulp – Cogeração Energética de Pasta. S.A. Setúbal 100.00 - 100.00 69.44 69.40
Navigator Pulp Figueira. S.A.Figueira da
Foz 100.00 - 100.00 69.44 69.40
Navigator Pulp Setúbal. S.A. Setúbal 100.00 - 100.00 69.44 69.40
Navigator Pulp Cacia. S.A. Aveiro 100.00 - 100.00 69.44 69.40
Navigator International GmbH Germany 100.00 - 100.00 69.44 69.40
AboutBalance - SGPS. S.A. Lisbon - - - - 69.40
Navigator Tissue Cacia. S.A. Aveiro 100.00 - 100.00 69.44 69.40
Navigator Tissue Ródão . S.A.Vila Velha de
Ródão - 100.00 100.00 69.44 69.40
Navigator Tissue Ibérica. S.A. Spain - 100.00 100.00 69.44 -
Navigator Internacional Holding SGPS. S.A. Setúbal 100.00 - 100.00 69.44 69.40
Portucel Moçambique - Sociedade de Desenvolvimento Florestal e Industrial. Lda Mozambique 20.05 60.15 80.20 55.69 55.66
Magellan Holdings Inc. USA 25.00 75.00 100.00 69.44 69.40
Navigator Financial Services Sp. Z o.o. Poland 25.00 75.00 100.00 69.44 69.40
Navigator Floresta. SGPS. S.A. Setúbal - - - - 69.40
Navigator Forest Portugal. S.A. Setúbal 100.00 - 100.00 69.44 69.40
Sociedade de Vinhos da Herdade de Espirra - Produção e Comercialização de Vinhos. S.A. Setúbal - 100.00 100.00 69.44 69.40
Gavião - Sociedade de Caça e Turismo. S.A. Setúbal - 100.00 100.00 69.44 69.40
Afocelca - Agrupamento complementar de empresas para protecção contra incêndios. ACE Portugal - 64.80 64.80 45.00 44.97
Viveiros Aliança - Empresa Produtora de Plantas. S.A. Palmela - 100.00 100.00 69.44 69.40
Atlantic Forests. S.A. Setúbal - 100.00 100.00 69.44 69.40
Bosques do Atlantico. SL Spain - 100.00 100.00 69.44 69.40
Navigator Paper Holding. SGPS. S.A. Setúbal - - - - 69.40
About the Future - Empresa Produtora de Papel. S.A. Setúbal - 100.00 100.00 69.44 69.40
Navigator Fine Paper . S.A. Setúbal - 100.00 100.00 69.44 69.40
Navigator Paper Setúbal. S.A. Setúbal - - - - 69.40
Navigator North America Inc. USA - 100.00 100.00 69.44 69.40
Navigator Sales & Marketing. S.A. Belgium 25.00 75.00 100.00 69.44 69.40
Navigator Africa. SRL Italy - 100.00 100.00 69.44 69.40
Navigator Participações Holding .SGPS. S.A. Setúbal 100.00 - 100.00 69.44 69.40
Portucel Florestal. S.A. Setúbal - - - - 69.40
Arboser – Serviços Agro-Industriais. S.A. Setúbal - 100.00 100.00 69.44 69.40
EMA21 - Engenharia e ManutençãoIndustrial Século XXI. S.A. Setúbal - 100.00 100.00 69.44 69.40
Ema Cacia - Engenharia e Manutenção Industrial. ACE Aveiro - 95.00 95.00 65.97 64.27
Ema Setúbal - Engenharia e Manutenção Industrial. ACE Setúbal - 89.91 89.91 62.43 63.36
Ema Figueira da Foz- Engenharia e Manutenção Industrial. ACE
Figueira da Foz - 90.72 90.72 62.99 61.56
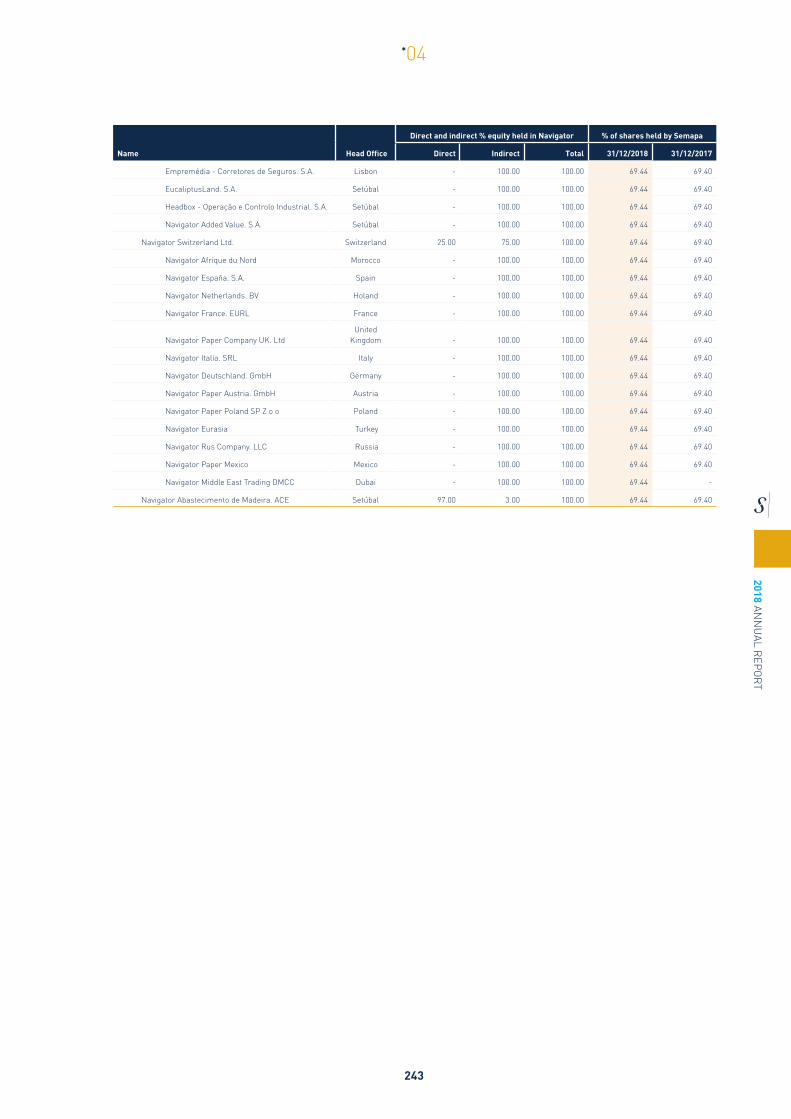
2018 ANN
UAL R
EPO
RT
243
*04
Name Head Office
Direct and indirect % equity held in Navigator % of shares held by Semapa
Direct Indirect Total 31/12/2018 31/12/2017
Empremédia - Corretores de Seguros. S.A. Lisbon - 100.00 100.00 69.44 69.40
EucaliptusLand. S.A. Setúbal - 100.00 100.00 69.44 69.40
Headbox - Operação e Controlo Industrial. S.A. Setúbal - 100.00 100.00 69.44 69.40
Navigator Added Value. S.A. Setúbal - 100.00 100.00 69.44 69.40
Navigator Switzerland Ltd. Switzerland 25.00 75.00 100.00 69.44 69.40
Navigator Afrique du Nord Morocco - 100.00 100.00 69.44 69.40
Navigator España. S.A. Spain - 100.00 100.00 69.44 69.40
Navigator Netherlands. BV Holand - 100.00 100.00 69.44 69.40
Navigator France. EURL France - 100.00 100.00 69.44 69.40
Navigator Paper Company UK. LtdUnited
Kingdom - 100.00 100.00 69.44 69.40
Navigator Italia. SRL Italy - 100.00 100.00 69.44 69.40
Navigator Deutschland. GmbH Germany - 100.00 100.00 69.44 69.40
Navigator Paper Austria. GmbH Austria - 100.00 100.00 69.44 69.40
Navigator Paper Poland SP Z o o Poland - 100.00 100.00 69.44 69.40
Navigator Eurasia Turkey - 100.00 100.00 69.44 69.40
Navigator Rus Company. LLC Russia - 100.00 100.00 69.44 69.40
Navigator Paper Mexico Mexico - 100.00 100.00 69.44 69.40
Navigator Middle East Trading DMCC Dubai - 100.00 100.00 69.44 -
Navigator Abastecimento de Madeira. ACE Setúbal 97.00 3.00 100.00 69.44 69.40

2018
AN
NU
AL R
EPO
RT
244
*04
SUBSIDIARY COMPANIES OF SUB-GROUP SECIL – CONSOLIDATED BY THE FULL CONSOLIDATION METHOD
Name Head Office
Direct and indirect % of equity held in SECIL % of shares held by Semapa
Direct Indirect Total 31/12/2018 31/12/2017
Parent - company:
Secil - Companhia Geral de Cal e Cimento. S.A. Setúbal 99.998 - 99.998 99.998 99.998
Subsidiaries:
Hewbol. S.G.P.S.. Lda. Funchal 100.00 - 100.00 99.998 99.998
Secil Cabo Verde Comércio e Serviços. Lda. Praia 99.80 0.20 100.00 99.998 99.998
ICV - Inertes de Cabo Verde. Lda. Praia 37.50 25.00 62.50 62.499 62.499
Florimar- Gestão e Participações. S.G.P.S.. Lda. Funchal 100.00 - 100.00 99.998 99.998
Sociedade de Inertes. Lda Nacala - 100.00 100.00 99.998 99.998
Secil Cement. B.V. (ex Seciment Investments. B.V.) Terneuzen 100.00 - 100.00 99.998 99.998
Serife - Sociedade de Estudos e Realizações Industriais e de Fornecimento de Equipamento. Lda. Lisbon 100.00 - 100.00 99.998 99.998
Silonor. S.A. Dunkerque 100.00 - 100.00 99.998 99.998
Société des Ciments de Gabés Tunis 98.72 - 98.72 98.716 98.716
Sud- Béton- Société de Fabrication de Béton du Sud Tunis - 98.72 98.72 98.716 98.716
Zarzis Béton Tunis - 98.52 98.52 98.519 98.519
Secil Angola. SARL Luanda 100.00 - 100.00 99.998 99.998
Secil - Companhia de Cimento do Lobito. S.A. Lobito - 51.00 51.00 50.999 50.999
Unibetão - Indústrias de Betão Preparado. S.A. Lisbon 100.00 - 100.00 99.998 99.998
Secil Britas. S.A. Lisbon 100.00 - 100.00 99.998 99.998
Lusoinertes. S.A. (c) Lisbon - - - - 99.998
Secil Martingança - Aglomerantes e Novos Materiais para a Construção. S.A. Leiria 100.00 - 100.00 99.998 99.998
IRP - Industria de Rebocos de Portugal. S.A. Santarém - 75.00 75.00 74.998 74.998
Allmicroalgae - Natural products. S.A. Leiria 100.00 - 100.00 99.998 99.998
Argibetão - Sociedade de Novos Produtos de Argila e Betão. S.A. Lisbon 99.53 - 99.53 99.528 99.528
Ciminpart - Investimentos e Participações. S.G.P.S.. S.A. Lisbon 100.00 - 100.00 99.998 99.998
ALLMA - Microalgas. Lda. Leiria - 70.00 70.00 69.999 69.999
Secil Brasil Participações. S.A. Rio de Janeiro - 100.00 100.00 99.998 99.998
Supremo Cimentos. SA Santa
Catarina - 100.00 100.00 99.998 99.998
Margem - Companhia de Mineração. SA Paraná - 100.00 100.00 99.998 99.998
I3 Participações e Serviços. Ltda. (g) Rio de Janeiro - - - - 99.998
Secil Brands - Marketing. Publicidade. Gestão e Desenvolvimento de Marcas. Lda. Lisbon - 100.00 100.00 99.998 99.998
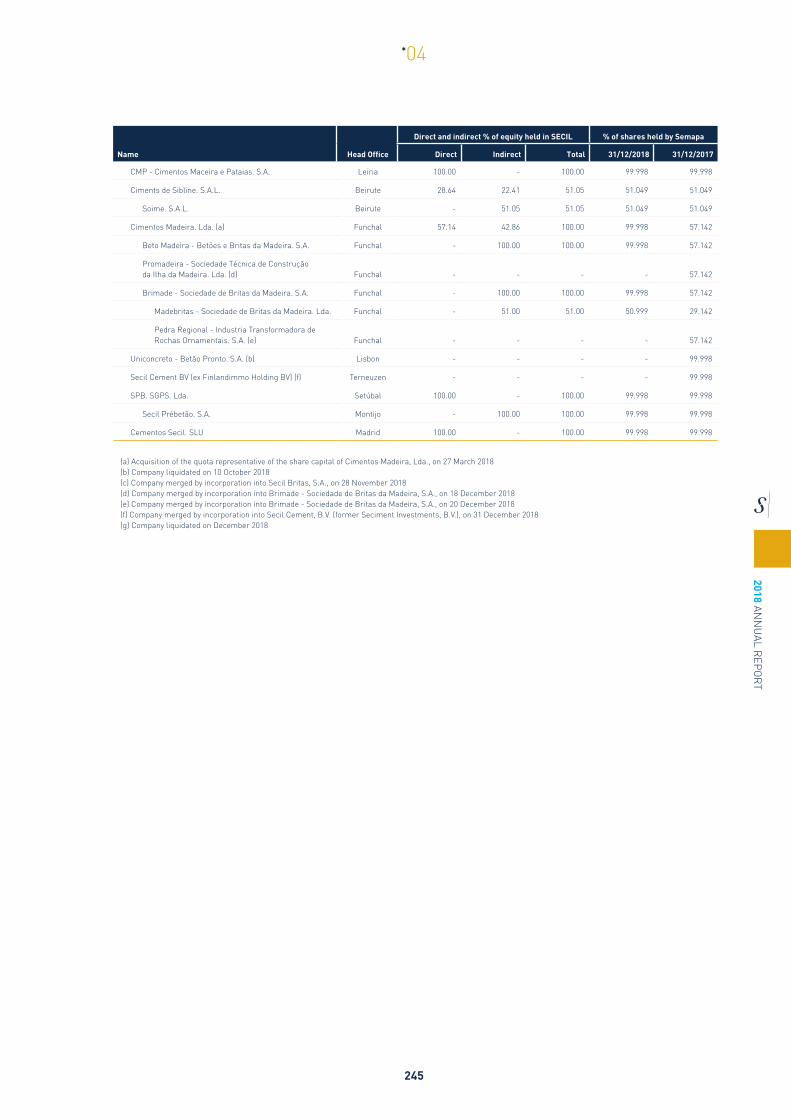
2018 ANN
UAL R
EPO
RT
245
*04
Name Head Office
Direct and indirect % of equity held in SECIL % of shares held by Semapa
Direct Indirect Total 31/12/2018 31/12/2017
CMP - Cimentos Maceira e Pataias. S.A. Leiria 100.00 - 100.00 99.998 99.998
Ciments de Sibline. S.A.L. Beirute 28.64 22.41 51.05 51.049 51.049
Soime. S.A.L. Beirute - 51.05 51.05 51.049 51.049
Cimentos Madeira. Lda. (a) Funchal 57.14 42.86 100.00 99.998 57.142
Beto Madeira - Betões e Britas da Madeira. S.A. Funchal - 100.00 100.00 99.998 57.142
Promadeira - Sociedade Técnica de Construção da Ilha da Madeira. Lda. (d) Funchal - - - - 57.142
Brimade - Sociedade de Britas da Madeira. S.A. Funchal - 100.00 100.00 99.998 57.142
Madebritas - Sociedade de Britas da Madeira. Lda. Funchal - 51.00 51.00 50.999 29.142
Pedra Regional - Industria Transformadora de Rochas Ornamentais. S.A. (e) Funchal - - - - 57.142
Uniconcreto - Betão Pronto. S.A. (b) Lisbon - - - - 99.998
Secil Cement BV (ex Finlandimmo Holding BV) (f) Terneuzen - - - - 99.998
SPB. SGPS. Lda. Setúbal 100.00 - 100.00 99.998 99.998
Secil Prébetão. S.A. Montijo - 100.00 100.00 99.998 99.998
Cementos Secil. SLU Madrid 100.00 - 100.00 99.998 99.998
(a) Acquisition of the quota representative of the share capital of Cimentos Madeira, Lda., on 27 March 2018 (b) Company liquidated on 10 October 2018 (c) Company merged by incorporation into Secil Britas, S.A., on 28 November 2018 (d) Company merged by incorporation into Brimade - Sociedade de Britas da Madeira, S.A., on 18 December 2018 (e) Company merged by incorporation into Brimade - Sociedade de Britas da Madeira, S.A., on 20 December 2018 (f) Company merged by incorporation into Secil Cement, B.V. (former Seciment Investments, B.V.), on 31 December 2018 (g) Company liquidated on December 2018

2018
AN
NU
AL R
EPO
RT
246
*04
CHANGES OF PERIMETER
During the year ended 31 December 2018, the perimeter changed due to the following operations:
• Liquidation of Seminv, SGPS, S.A.
• Liquidation of Seinpart, SGPS, S.A.
• Merger by incorporation of AboutBalance SGPS, S.A. in Navigator Tissue Cacia, S.A.
• Merger by incorporation of Navigator Paper Setúbal, S.A. in Navigator Tissue Cacia, S.A.
• Merger by incorporation of Navigator Floresta, SGPS, S.A. in The Navigator Company, S.A.
• Merger by incorporation of Navigator Paper Holding, SGPS, S.A. in About The Future, S.A.
• Merger by incorporation of Portucel Florestal, S.A. in Eucaliptusland, S.A.
• Liquidation of Uniconcreto – Betão Pronto, S.A.
• Merger by incorporation of Lusoinertes, S.A. in Secil Britas, S.A.
• Merger by incorporation of Promadeira, Lda. in Brimade – Sociedade de Britas da Madeira, S.A.
• Merger by incorporation of Pedra Regional, S.A. in Brimade – Sociedade de Britas da Madeira, S.A.
• Merger by incorporation of Secil Cement, BV (former Finlandimmo Holding BV) in Secil Cement, BV (former
Seciment Investment BV)
44 SUBSEQUENT EVENTSSemapa SGPS, S.A.| Treasury shares In January 2019, Semapa – Sociedade de Investimento e Gestão, SGPS, S.A. acquired 27,874 treasury shares, therefore holding 0.82% of its share capital.
Navigator Group | Setting-up of the new defined contribution plan – The Navigator Company IIIFollowing the request made to the Board of Directors of the Portuguese Insurance and Pension Funds Supervisory Authority (Autoridade de Supervisão de Seguros e Fundos de Pensões - ASF), aiming to amend the Pension Fund Agreement for the setting-up of a new Defined Contribution Plan (CD), ASF approved, on 28 December 2018, the request made. The proposal for amendment to the Agreement is pending of approval and signature of ASF and its members.
Navigator Group | Extension of loans’ maturityIn January 2019, as part of the refinancing process of the Navigator Group - with extension of maturities - and to replace a pre-existing commercial paper credit facility, the Group contracted a commercial paper credit facility of EUR 75 million and, simultaneously, a bond loan in the amount of EUR 50 million, both due in 2026.
As early as February 2019, the Group contracted a “green” commercial paper credit facility, in the amount of EUR 65 million, with a 7-year term (amortizing), in which the financing conditions are linked to the ESG classification granted by a specialized entity. This credit facility replaces a normal commercial paper program of EUR 50 million, which was in force in 2018.
Also in February 2019, the Group used the EIB financing contracted in July 2018, in the amount of EUR 40 million, for a 10-year term (amortizing).

2018 ANN
UAL R
EPO
RT
247
*04
The Navigator Company, S.A. | Treasury sharesIn January 2019, Navigator acquired, in the stock exchange, 880,882 treasury shares, corresponding to 0.243% of its share capital.
45 NOTE ADDED FOR TRANSLATIONThese financial statements are a free translation of the financial statements originally issued in Portuguese in accordance with International Financial Reporting Standards as adopted by the European Union. In the event of discrepancies, the Portuguese language version prevails.
BOARD OF DIRECTORS
CHAIRMANHEINZ-PETER ELSTRODT
MEMBERSJOÃO NUNO DE SOTTOMAYOR PINTO DE CASTELLO BRANCO
JOSÉ MIGUEL PEREIRA GENS PAREDES
PAULO MIGUEL GARCÊS VENTURA
RICARDO MIGUEL DOS SANTOS PACHECO PIRES
ANTÓNIO PEDRO DE CARVALHO VIANA BAPTISTA
CARLOS EDUARDO COELHO ALVES
FILIPA MENDES DE ALMEIDA DE QUEIROZ PEREIRA
FRANCISCO JOSÉ MELO E CASTRO GUEDES
JOSÉ ANTÔNIO DO PRADO FAY
LUA MÓNICA MENDES DE ALMEIDA DE QUEIROZ PEREIRA
MAFALDA MENDES DE ALMEIDA DE QUEIROZ PEREIRA
VÍTOR MANUEL GALVÃO ROCHA NOVAIS GONÇALVES
VÍTOR PAULO PARANHOS PEREIRA


*05 STATUTORY AUDIT REPORT CONSOLIDATED
2018
AN
NU
AL R
EPO
RT
250
*05
STATUTORY AUDITORS’ REPORT AND AUDITORS’ REPORT(Free translation from a report originally issued in Portuguese language.In case of doubt the Portuguese version will always prevail.)
REPORT ON THE AUDIT OF THE CONSOLIDATED FINANCIAL STATEMENTS
OPINION
We have audited the accompanying consolidated financial statements of Semapa – Sociedade de Investimento e Gestão, SGPS, S.A. (the Group), which comprise the consolidated statement of financial position as at 31 December 2018 (showing a total of Euro 3,992,272,013 and total equity of Euro 1,257,590,681, including a profit for the year attributable to Semapa´s shareholders of Euro 132,554,337), the consolidated income statement, consolidated statement of comprehensive income, consolidated statement of changes in equity and consolidated statement of cash flows for the year then ended, and the accompanying notes to the consolidated financial statements, including a summary of significant accounting policies.
In our opinion, the accompanying consolidated financial statements give a true and fair view, in all material respects, of the consolidated financial position of Semapa – Sociedade de Investimento e Gestão, SGPS, S.A. as at 31 December 2018 and of its consolidated financial performance and its consolidated cash flows for the year then ended in accordance with the International Financial Reporting Standards (IFRS) as adopted by the European Union.
BASIS FOR OPINION
We conducted our audit in accordance with International Standards on Auditing (ISA) and further technical and ethical standards and guidelines as issued by Ordem dos Revisores Oficiais de Contas (the Portuguese Institute of Statutory Auditors). Our responsibilities under those standards are further described in the “Auditors’ Responsibilities for the Audit of the Consolidated Financial Statements” section below. We are independent of the entities that comprise the Group in accordance with the law and we have fulfilled other ethical requirements in accordance with the Ordem dos Revisores Oficiais de Contas’ code of ethics.
We believe that the audit evidence we have obtained is sufficient and appropriate to provide a basis for our opinion.
KEY AUDIT MATTERSKey audit matters are those matters that, in our professional judgment, were of most significance in our audit of the consolidated financial statements of the current year. These matters were addressed in the context of our audit of the consolidated financial statements as a whole, and in forming our opinion thereon, and we do not provide a separate opinion on these matters.

2018 ANN
UAL R
EPO
RT
251
*05
RECOVERABILITY OF GOODWILL, OTHER INTANGIBLE ASSETS AND PROPERTY, PLANT AND EQUIPMENT
Information regarding this matter is presented in Notes 1.6.2, 1.7, 1.8 and 1.10 of the summary of the main accounting policies, Notes 3.1 and 3.6 of Main estimates and judgments and Notes 15, 16 and 17 of the Consolidated Financial Statements
THE RISK OUR RESPONSE TO THE IDENTIFIED RISK
Recoverability of goodwill (Euro 346,170,987), other intangible assets (Euro 292,846,882) and property, plant and equipment (Euro 2,043,753,765) is a relevant matter due to the materiality of the amounts involved as well as due to the complexity and subjectivity inherent to impairment tests, namely regarding the uncertainty inherent to the financial projections, which are based on the Board of Directors expectations materialised in business plans, which key assumptions such as discount rates, expected margins, short and long term growth rates, investment plans and demand behaviors depend on unobservable inputs.
As part of our audit we performed the following procedures, among others:
• We have analysed the budgeting procedures in which the financial projections are based on, by comparing the actual performance with estimates performed in prior periods, as well as the integrity of the discounted cash flow model;
• We compared the internal and external assump-
tions used, such as current business trends, mar-ket performance, inflation, projected economic growth and discount rates and assessed their rea-sonability;
• We performed sensitivity analysis to the robustness of assumptions and forecasts;
• We involved experts in the calculation of the weight-ed average cost of capital; and,
• We assessed the adequacy of the financial state-ments disclosures considering the applicable ac-counting framework.
BIOLOGICAL ASSETS FAIR VALUE
Information regarding this matter is presented in Note 1.11 of the summary of the main accounting policies, Note 3.4 of Main estimates and judgments and Note 18 of the Consolidated Financial Statements
THE RISK OUR RESPONSE TO THE IDENTIFIED RISK
The fair value of biological assets (Euro 119,614,567) is determined through an internally developed model, based on economic and market projections, whose assumptions, namely the forest productivity, the sales price of wood less the harvesting cost, the value of own and leased land rents, logging and transportation costs, plantation and maintenance costs and the discount rate, require a high degree of estimation and judgment of the Board of Directors.
As part of our audit we performed the following procedures, among others:
• We tested the model mathematical accuracy and integrity;
• We analysed the budgeting procedures in which pro-jections are based on;
• We compared the actual performance of variables inherent to the model with the estimates performed in prior periods, namely: forest productivity, the value of own and leased land rents, fixed costs, logging and transportation costs, plantation and maintenance costs;
• We compared the internal and external assumptions used, such as spot price vs expected price and the discount rate with the market data and assessed their sensitivity;
• We assessed the adequacy of the financial statements disclosures considering the applicable accounting framework.

2018
AN
NU
AL R
EPO
RT
252
*05
TAX MATTERS
Information regarding this matter is presented in Notes 1.14 and 1.21 of the summary of the main accounting policies, Notes 3.2 and 3.5 of Main estimates and judgments and Notes 11 and 30 of the Consolidated Financial Statements
THE RISK OUR RESPONSE TO THE IDENTIFIED RISK
The application of tax law to the several transactions has an inherent complexity and requires the exercise of judgment in determining the respective tax impact, as well as in the identification of tax contingencies, measurement of provisions and determination of contingent liabilities.
The estimate of amounts that may result in future outflows requires a high degree of judgment of the Board of Directors, which assesses the probability of an outcome, supported by the opinion of their legal and tax advisors.
As part of our audit we performed the following procedures, among others:
• We understood and evaluated the processes for mo-nitoring tax contingencies, including inquiries to the Board of Directors and to the tax managers on the basis of their estimates and judgments;
• We analysed the ongoing tax proceedings, as well as the tax contingencies, supported by tax experts, and reviewed the existing documentation;
• We analysed the responses to the confirmation re-quests received from external lawyers;
• We assessed the consistency of the criteria followed in the previous years; and
• We assessed the adequacy of the financial statements disclosures considering the applicable accounting framework.
2018 ANN
UAL R
EPO
RT
253
*05
RESPONSIBILITIES OF MANAGEMENT AND THE SUPERVISORY BODY FOR THE CONSOLIDATED FINANCIAL STATEMENTS
Management is responsible for:
• the preparation of consolidated financial statements that give a true and fair view of the Group’s financial posi-tion, financial performance and the cash flows, in accordance with the International Financial Reporting Stan-dards (IFRS) as adopted by the European Union;
• the preparation of the management report and the corporate governance report in accordance with applicable laws and regulations;
• designing and maintaining an appropriate internal control system to enable the preparation of consolidated financial statements that are free from material misstatement, whether due to fraud or error;
• the adoption of accounting policies and principles appropriate in the circumstances; and• assessing the Group’s ability to continue as a going concern, and disclosing, as applicable, the matters that may
cast significant doubt about the Group’s ability to continue as a going concern.
The supervisory body is responsible for overseeing the Group’s financial reporting process.
AUDITOR´S RESPONSIBILITIES FOR THE AUDIT OF THE CONSOLIDATED FINANCIAL STATEMENTS
Our responsibility is to obtain reasonable assurance about whether the consolidated financial statements as a whole are free from material misstatements whether due to fraud or error, and to issue an auditors’ report that includes our opinion. Reasonable assurance is a high level of assurance, but is not a guarantee that an audit conducted in accordance with ISA will always detect a material misstatement when it exists. Misstatements can arise from fraud or error and are considered material if, individually or in the aggregate, they could reasonably be expected to influence the economic decisions of users taken on the basis of these financial statements.
As part of an audit in accordance with ISAs, we exercise professional judgment and maintain professional skepticism throughout the audit. We also:
• identify and assess the risks of material misstatement of the consolidated financial statements, whether due to fraud or error, design and perform audit procedures responsive to those risks, and obtain audit evidence that is sufficient and appropriate to provide a basis for our opinion. The risk of not detecting a material misstatement resulting from fraud is higher than for one resulting from error, as fraud may involve collusion, forgery, intentio-nal omissions, misrepresentations or the override of internal control;
• obtain an understanding of internal control relevant to the audit in order to design audit procedures that are appropriate in the circumstances, but not for the purpose of expressing an opinion on the effectiveness of the Group’s internal control;
• evaluate the appropriateness of accounting policies used and the reasonableness of accounting estimates and related disclosures made by management;
• - conclude on the appropriateness of management’s use of the going concern basis of accounting and, based on the audit evidence obtained, whether a material uncertainty exists related to events or conditions that may cast significant doubt on the Group’s ability to continue as a going concern. If we conclude that a material uncertainty exists, we are required to draw attention in our auditors’ report to the related disclosures in the consolidated financial statements or, if such disclosures are inadequate, to modify our opinion. Our conclusions are based on the audit evidence obtained up to the date of our auditors’ report. However, future events or conditions may cause the Group to cease to continue as a going concern;
• evaluate the overall presentation, structure and content of the consolidated financial statements, including the disclosures, and whether the financial statements represent the underlying transactions and events in a man-ner that achieves fair presentation;
• obtain sufficient appropriate audit evidence regarding the financial information of the entities or business activi-ties within the Group to express an opinion on the consolidated financial statements. We are responsible for the direction, supervision and performance of the group audit. We remain solely responsible for our audit opinion;

2018
AN
NU
AL R
EPO
RT
254
*05
• communicate with those charged with governance, including the supervisory body, regarding, among other matters, the planned scope and timing of the audit, and significant audit findings including any significant defi-ciencies in internal control that we identify during our audit;
• determine, from the matters communicated with those charged with governance, including the supervisory body, those matters that were of most significance in the audit of the consolidated financial statements of the current year and are therefore the key audit matters. We describe these matters in our auditors’ report unless law or regulation precludes their public disclosure; and,
• provide the supervisory body with a statement that we have complied with the relevant ethical requirements regarding independence, and communicate all relationships and other matters that may reasonably be thought to bear on our independence, and where applicable, related safeguards.
Our responsibility also includes the verification that the information contained in the management report is consistent with the consolidated financial statements, and the verification of the requirements as provided in numbers 4 and 5 of Article 451 of the Portuguese Companies’ Code, and if the non-financial information was duly presented.
REPORT ON OTHER LEGAL AND REGULATORY REQUIREMENTS
On the Management ReportPursuant to Article 451, paragraph 3-e of the Portuguese Companies’ Code, it is our opinion that the management report was prepared in accordance with the applicable legal and regulatory requirements and the information contained therein is consistent with the audited consolidated financial statements and, having regard to our knowledge and assessment of the Group, we have not identified any material misstatements.
On the Corporate Governance ReportPursuant to Article 451, paragraph 4, of the Portuguese Companies’ Code, it is our opinion that the corporate governance report includes the information required to the Group to provide under article 245-A of the Securities Code, and we have not identified any material misstatements on the information provided therein in compliance with paragraphs c), d), f), h), i) and m) of that article.
On the non-financial information defined in the Article 508-G of the Portuguese Companies’ CodePursuant to Article 451, paragraph 6, of the Portuguese Companies’ Code, we inform that the Group has prepared a separate report where includes the non-financial information defined in Article 508-G of the Portuguese Companies’ Code, having that report being published with the management report.

2018 ANN
UAL R
EPO
RT
255
*05
On the additional matters provided in Article 10 of the Regulation (EU) 537/2014Pursuant to Article 10 of the Regulation (EU) 537/2014 of the European Parliament and of the Council, of 16 April
2014, and in addition to the key audit matters mentioned above, we also report the following:
• We were first appointed as auditors of Semapa – Sociedade de Investimento e Gestão, SGPS, S.A. (parent Entity of the Group) in the shareholders general assembly held on 22 September 2017 for a first mandate from 2018 to 2021.
• Management as confirmed to us that they are not aware of any fraud or suspicion of fraud having occurred that has a material effect on the financial statements. In planning and executing our audit in accordance with ISAs we maintained professional skepticism, and we designed audit procedures to respond to the possibility of ma-terial misstatement in the consolidated financial statements due to fraud. As a result of our work, we have not identified any material misstatement of the consolidated financial statements due to fraud.
• We confirm that the audit opinion we issue is consistent with the additional report that we prepared and delive-red to the supervisory body of the Group on 18 March 2019.
• We declare that we have not provided any prohibited services as described in Article 77, paragraph 8 of the Or-dem dos Revisores Oficiais de Contas’ Statutes, and we have remained independent of the Group in conducting the audit.
18 March 2019
SIGNED ON THE ORIGINAL
KPMG & ASSOCIADOS -SOCIEDADE DE REVISORES OFICIAIS DE CONTAS, S.A. (N.º 189)represented byPAULO ALEXANDRE MARTINS QUINTAS PAIXÃO (ROC N.º 1427)


*06 REPORT AND OPINION OF THE AUDIT BOARD CONSOLIDATED

2018
AN
NU
AL R
EPO
RT
258
*06
REPORT AND OPINION OF THE AUDIT BOARDCONSOLIDATED FINANCIAL STATEMENTS
YEAR 2018
Dear Shareholders,
1. As laid down by law, established in the articles of association and in carrying out the mandate entrusted to us, we hereby deliver our report on the audit activities carried out in 2018 and issue our opinion on the Management Report and the Consolidated Financial Statements submitted by the Board of Directors of Semapa – Sociedade de Investimento e Gestão, SGPS, S.A., for the year ended 31 December 2018.
2. During the year, we monitored the company’s activity and that of its main subsidiaries and affiliated companies on a regular basis, with the frequency and to the extent that we deemed appropriate, namely through regular meetings with the Company’s Management and Directors. We oversaw the reviewing of the accounting records and the supporting documents, and the efficacy of the risk management, internal control and audit systems. We ensured compliance with the law and the Articles of Association. We did not run up against any obstacles in the exercise of our duties.
3. We met several times with the statutory auditor and the external auditor, KPMG & Associados, SROC, Lda., to monitor the audits conducted and supervise their independence. We have analysed the legal Accounts Certificate and Audit Report, which merit our agreement.
4. The Audit Board analysed the proposals that were presented to it for non-audit services by the Statutory and Ex-ternal Auditor, having approved those that related with permitted services, did not affect the independence of the Statutory and External Auditor and fulfilled the other legal requirements.
5. Within the scope of our competences, we found that:
a) The Consolidated Income Statement, the Consolidated Financial Statement, the Statement of Comprehen-sive Income, the Statement of Consolidated Changes in Equity and the Consolidated Cash Flow Statement and its Notes to the Consolidated Financial Statements give a true and fair view of the financial position of the company, in respect of its results, comprehensive income, changes in equity and cash flow;
b) The accounting policies and valuation criteria applied are in conformity with the International Financial Reporting Standards (IFRS), as adopted in the European Union, and ensure that a true and fair assessment of the company’s assets and results is given, and the findings and recommendations of the external auditor have been followed through;
c) The Management Report clearly shows the development of the business and the situation of the company and the subsidiaries included in the consolidation, highlighting key aspects of the activity;
d) The Corporate Governance Report covers all of the points referred to in Article 245 A of the Securities Code, and considered the recommendations on the Code of the Portuguese Corporate Governance Institute (IPCG).

2018 ANN
UAL R
EPO
RT
259
*06
6. Consequently, taking into account the information delivered by the Company’s Board of Directors and Depart-ments, and the conclusions of the Legal Accounts Certificate and Audit Report, we are of the opinion that:
a) The Management Report should be approved;
b) b) The Consolidated Financial Statements should be approved.
7. Finally, the members of the Audit Board are grateful to the Board of Directors, the key supervisors and other com-
pany staff, as well as to the statutory auditor KPMG & Associados, SROC, Lda. for their collaboration.
Lisbon, 18 March 2019
The Chairman of the Audit Board JOSÉ MANUEL OLIVEIRA VITORINO
Member of the Audit BoardGONÇALO NUNO PALHA GAIO PICÃO CALDEIRA
Member of the Audit BoardMARIA DA GRAÇA TORRES FERREIRA DA CUNHA GONÇALVES


*07 FINANCIAL STATEMENTS SEPARATE

2018
AN
NU
AL R
EPO
RT
262
*07
SEPARATE INCOME STATEMENT BY NATUREFOR THE YEARS ENDED AT 31 DECEMBER 2018 AND 2017
Amounts in Euro Notes 2018 2017
INCOME AND EXPENSES
Sales and services rendered 4 13 297 832 13 037 095
Other income 5 30 168 301 884
Supplies and services 6 (4 338 360) (3 009 893)
Payroll costs 7 (9 241 498) (9 471 494)
Other expenses 8 (428 616) (368 696)
(Expenses) / reversals of depreciation and amortisation 9 (190 390) (199 655)
Operating results (870 864) 289 241
Share of profit/ (losses) of subsidiaries - equity method 10 147 842 004 138 591 309
Financial results 11 (14 925 829) (15 369 843)
Profit before tax 132 045 311 123 510 707
Income tax expense 12 509 026 582 760
Net profit for the year 132 554 337 124 093 467
Earnings per share
Basic earnings per share, Eur 13 1.643 1.538
Diluted earnings per share, Eur 13 1.643 1.538
The following notes form an integral part of these separate financial statements

2018 ANN
UAL R
EPO
RT
263
*07
SEPARATE STATEMENT OF COMPREHENSIVE INCOMEFOR THE YEARS ENDED AT 31 DECEMBER 2018 AND 2017
Amounts in Euro Notes 2018 2017
Net profit for the year 132 554 337 124 093 467
Items that may subsequently be reclassified to the income statement
Adjustments of financial investments 19 (31 379 718) (64 243 237)
Items that may not subsequently be reclassified to the income statement
Post-employment benefits
Actuarial Gains/ (Losses) 22 - (105 741)
Adjustments of financial investments in subsidiaries 19 (9 605 810) 2 956 333
Total other comprehensive income (40 985 528) (61 392 645)
Total comprehensive income 91 568 809 62 700 822
The following notes form an integral part of these separate financial statements

2018
AN
NU
AL R
EPO
RT
264
*07
SEPARATE STATEMENT OF FINANCIAL POSITIONAS OF 31 DECEMBER 2018 AND 2017
Amounts in Euro Notes 31-12-2018 31-12-2017
ASSETS
Non-current assets
Property, plant and equipment 14 722 773 492 548
Investments in subsidiaries 10 1 375 391 926 1 412 427 451
Equity instruments at fair value 28 10 372 -
Other financial assets 28 15 339 13 673
1 376 140 410 1 412 933 672
Current assets
Receivables and other current assets 16 13 444 032 11 940 776
Cash and cash equivalents 17 105 675 51 472
13 549 707 11 992 248
Total assets 1 389 690 117 1 424 925 920
EQUITY AND LIABILITIES
Equity
Share capital 18 81 270 000 81 270 000
Treasury shares 18 (6 740 954) (6 036 401)
Legal reserves 19 16 695 625 16 695 625
Other reserves 19 896 323 538 817 155 627
Retained earnings 19 83 870 483 34 979 997
Adjustments in financial assets 19 (313 619 142) (224 760 490)
757 799 550 719 304 359
Net profit for the year 13 132 554 337 124 093 467
Total Equity 890 353 887 843 397 825
Liabilities
Non-current liabilities
Provisions 20 12 800 000 12 800 000
Interest-bearing liabilities 21 318 283 541 530 251 661
Pensions and other post-employment benefits 22 1 115 990 1 239 645
Deferred tax liabilities 23 880 331 610 914
333 079 862 544 902 220
Current liabilities
State and other public entities 15 600 851 652 220
Income tax 15 386 212 2 518 060
Interest-bearing liabilities 21 154 409 411 22 163 771
Payable and other current liabilities 24 10 859 894 11 291 824
166 256 368 36 625 875
Total Liabilities 499 336 230 581 528 095
Total Equity and Liabilities 1 389 690 117 1 424 925 920
The following notes form an integral part of these separate financial statements

2018 ANN
UAL R
EPO
RT
265
*07
SEP
AR
ATE
STA
TEM
ENT
OF
CH
AN
GES
IN E
QU
ITY
FRO
M 1
JA
NU
AR
Y 20
17 T
O 3
1 D
ECEM
BER
201
8
Am
ount
s in
Eur
oN
otes
Shar
e C
apit
alTr
easu
ry S
hare
sLe
gal
Res
erve
sO
ther
R
eser
ves
Ret
aine
d Ea
rnin
gsAd
just
men
ts in
Fi
nanc
ial A
sset
sN
et p
rofi
t fo
r th
e ye
arTo
tal
Equ
ity
Equi
ty a
s of
1 J
anua
ry 2
017
81
270
000
(6
036
401
)16
695
625
76
7 45
2 35
3 6
233
851
(163
148
442
)11
4 86
2 81
2 81
7 32
9 79
8
Net
pro
fit fo
r th
e ye
ar-
- -
- -
- 12
4 09
3 46
7 12
4 09
3 46
7
Oth
er c
ompr
ehen
sive
inco
me
19-
- -
- (1
05 7
41)
(61
286
904)
- (6
1 39
2 64
5)
Oth
er m
ovem
ents
in e
quity
of s
ubsi
diar
ies
19-
- -
- -
(325
144
)-
(325
144
)
Dis
trib
utio
ns19
- -
- -
- -
(36
307
652)
(36
307
652)
Tran
sfer
to r
eser
ves
and
reta
ined
ear
ning
s19
- -
- 48
813
251
29
741
909
-
(78
555
160)
-
Oth
er o
pera
tions
- -
- 89
0 02
3 (8
90 0
22)
- -
1
Equi
ty a
s of
31
Dec
embe
r 20
17
81 2
70 0
00
(6 0
36 4
01)
16 6
95 6
25
817
155
627
34 9
79 9
97
(224
760
490
)12
4 09
3 46
7 84
3 39
7 82
5
Am
ount
s in
Eur
oN
otes
Shar
e C
apit
alTr
easu
ry
Shar
esLe
gal
Res
erve
sO
ther
R
eser
ves
Ret
aine
d Ea
rnin
gsAd
just
men
ts in
Fi
nanc
ial A
sset
sN
et p
rofi
t fo
r th
e ye
arTo
tal
Equi
ty
Equi
ty a
s of
1 J
anua
ry 2
018
81
270
000
(6
036
401
)16
695
625
81
7 15
5 62
7 34
979
997
(2
24 7
60 4
90)
124
093
467
843
397
825
Net
pro
fit fo
r th
e ye
ar-
- -
- -
- 13
2 55
4 33
7 13
2 55
4 33
7
Oth
er c
ompr
ehen
sive
inco
me
19-
- -
- -
(43
663
074)
- (4
3 66
3 07
4)
Oth
er m
ovem
ents
in e
quity
of s
ubsi
diar
ies
19-
- -
- -
79 3
93-
79 3
93
Acqu
isiti
on o
f tre
asur
y sh
ares
18-
(704
553
)-
- -
- -
(704
553
)
Dis
trib
utio
ns19
- -
- -
- -
(41
310
039)
(41
310
039)
Tran
sfer
to r
eser
ves
and
reta
ined
ear
ning
s19
- -
- 78
383
427
49
674
970
(4
5 27
4 97
1)(8
2 78
3 42
8)(2
)
Oth
er o
pera
tions
-
- -
784
484
(784
484
)-
- -
Equi
ty a
s of
31
Dec
embe
r 20
18
81 2
70 0
00
(6 7
40 9
54)
16 6
95 6
25
896
323
538
83 8
70 4
83
(313
619
142
)13
2 55
4 33
7 89
0 35
3 88
7
The
follo
win
g no
tes
form
an
inte
gral
par
t of t
hese
sep
arat
e fin
anci
al s
tate
men
ts
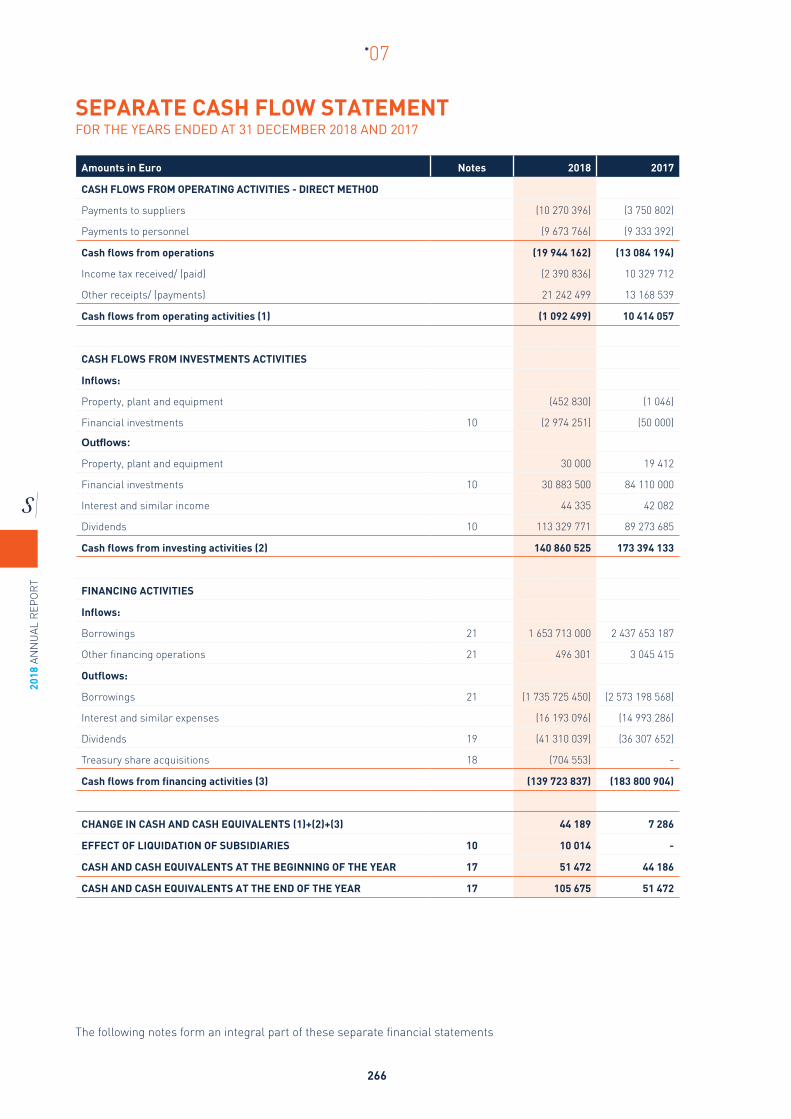
2018
AN
NU
AL R
EPO
RT
266
*07
SEPARATE CASH FLOW STATEMENT FOR THE YEARS ENDED AT 31 DECEMBER 2018 AND 2017
Amounts in Euro Notes 2018 2017
CASH FLOWS FROM OPERATING ACTIVITIES - DIRECT METHOD
Payments to suppliers (10 270 396) (3 750 802)
Payments to personnel (9 673 766) (9 333 392)
Cash flows from operations (19 944 162) (13 084 194)
Income tax received/ (paid) (2 390 836) 10 329 712
Other receipts/ (payments) 21 242 499 13 168 539
Cash flows from operating activities (1) (1 092 499) 10 414 057
CASH FLOWS FROM INVESTMENTS ACTIVITIES
Inflows:
Property, plant and equipment (452 830) (1 046)
Financial investments 10 (2 974 251) (50 000)
Outflows:
Property, plant and equipment 30 000 19 412
Financial investments 10 30 883 500 84 110 000
Interest and similar income 44 335 42 082
Dividends 10 113 329 771 89 273 685
Cash flows from investing activities (2) 140 860 525 173 394 133
FINANCING ACTIVITIES
Inflows:
Borrowings 21 1 653 713 000 2 437 653 187
Other financing operations 21 496 301 3 045 415
Outflows:
Borrowings 21 (1 735 725 450) (2 573 198 568)
Interest and similar expenses (16 193 096) (14 993 286)
Dividends 19 (41 310 039) (36 307 652)
Treasury share acquisitions 18 (704 553) -
Cash flows from financing activities (3) (139 723 837) (183 800 904)
CHANGE IN CASH AND CASH EQUIVALENTS (1)+(2)+(3) 44 189 7 286
EFFECT OF LIQUIDATION OF SUBSIDIARIES 10 10 014 -
CASH AND CASH EQUIVALENTS AT THE BEGINNING OF THE YEAR 17 51 472 44 186
CASH AND CASH EQUIVALENTS AT THE END OF THE YEAR 17 105 675 51 472
The following notes form an integral part of these separate financial statements

2018 ANN
UAL R
EPO
RT
267
*07
*CONTENTS OF THE NOTES TO THE SEPARATE FINANCIAL STATEMENTS
*01 INTRODUCTION 269*02 ACCOUNTING STANDARDS USED FOR THE PREPARATION OF THE FINANCIAL STATEMENTS 270*03 SUMMARY OF THE MAIN ACCOUNTING POLICIES 270 3.1 COMPARABILITY 270 3.2 AMENDMENTS TO ACCOUNTING POLICIES AND DISCLOSURES 270 3.3 PROPERTY, PLANT AND EQUIPMENT 273 3.4 GOODWILL 274 3.5 INVESTMENTS IN SUBSIDIARIES 274 3.6 IMPAIRMENT OF NON-CURRENT ASSETS 275 3.7 FINANCIAL ASSETS 276 3.8 CORPORATE INCOME TAX 277 3.9 STATE AND OTHER PUBLIC ENTITIES 277 3.10 ACCOUNTS RECEIVABLE 278 3.11 CASH AND CASH EQUIVALENTS 278 3.12 SHARE CAPITAL AND TREASURY SHARES 278 3.13 INTEREST-BEARING LIABILITIES 279 3.14 BORROWING COSTS BORROWING COSTS 279 3.15 PROVISIONS 279 3.16 PENSIONS AND OTHER POST-EMPLOYMENT BENEFITS 279 3.17 PAYABLES AND OTHER CURRENT LIABILITIES 280 3.18 LEASES 280 3.19 DIVIDENDS DISTRIBUTION 281 3.20 REVENUE 281 3.21 ACCRUAL ACCOUNTING PRINCIPLE 281 3.22 FAIR VALUE 281 3.23 CONTINGENT ASSETS AND LIABILITIES 281 3.24 EARNINGS PER SHARE 282 3.25 SUBSEQUENT EVENTS 282 3.26 RISK MANAGEMENT 282 3.26.1 FINANCIAL RISK FACTORS 282 3.26.2 OPERATIONAL RISKS FACTORS 284 3.26.3 STRATEGIC RISKS 285 3.26.4 OTHER RISKS 285 3.27 RELEVANT ACCOUNTING ESTIMATES AND JUDGMENTS 285 3.27.1 RECOVERABILITY OF FINANCIAL INVESTMENTS 285 3.27.2 ACTUARIAL ASSUMPTIONS 286 3.27.3 RECOGNITION OF PROVISIONS 286 3.27.4 INCOME TAX 286

2018
AN
NU
AL R
EPO
RT
268
*07
*04 SALES AND SERVICES RENDERED 286*05 OTHER INCOME 286*06 SUPPLIES AND SERVICES 287*07 PAYROLL EXPENSES 287*08 OTHER EXPENSES 287*09 (EXPENSES)/REVERSALS RELATED TO DEPRECIATION AND AMORTISATION 288*010 FINANCIAL INVESTMENTS – EQUITY METHOD 288*011 FINANCIAL RESULTS 293*012 INCOME TAX 293*013 EARNINGS PER SHARE 294*014 PROPERTY, PLANT AND EQUIPMENT 295*015 STATE AND OTHER PUBLIC ENTITIES 295*016 RECEIVABLES AND OTHER CURRENT ASSETS 296*017 CASH AND CASH EQUIVALENTS 297*018 SHARE CAPITAL AND TREASURY SHARES 297*019 RESERVES AND RETAINED EARNINGS 297*020 PROVISIONS 299*021 INTEREST-BEARING LIABILITIES 299*022 PENSIONS AND OTHER POST-EMPLOYMENT BENEFITS 303*023 DEFERRED TAXES 303*024 PAYABLES AND OTHER LIABILITIES 305*025 BALANCES AND TRANSACTIONS WITH RELATED PARTIES 306*026 AUDIT FEES 313*027 COMMITMENTS 313*028 FINANCIAL ASSETS AND LIABILITIES 314*029 SUBSEQUENT EVENTS 315*030 NOTE ADDED FOR TRANSLATION 315

2018 ANN
UAL R
EPO
RT
269
*07
NOTES TO THE SEPARATE FINANCIAL STATEMENTSFOR THE YEAR ENDED 31 DECEMBER 2018
(IN THESE NOTES, UNLESS INDICATED OTHERWISE, ALL AMOUNTS ARE EXPRESSED IN EURO)
1 INTRODUCTION
ENTITY: Semapa - Sociedade de Investimento e Gestão, SGPS, S.A.
HEAD OFFICE: Av. Fontes Pereira de Melo, 14, 10º Piso, Lisboa
SHARE CAPITAL: Euro 81,270,000
CORPORATE BODY NO.: 502 593 130
Semapa — Sociedade de Investimento e Gestão, SGPS, S.A., (“Semapa” or “Company”) was incorporated on June 21, 1991, and its corporate purpose is to manage holdings in other companies, particularly in the segments of pulp and paper, cement and derivatives and environment, through its subsidiaries Secil — Companhia Geral de Cal e Cimento, S.A., The Navigator Company, S.A. and ETSA Investimentos, SGPS, S.A., and has been listed on NYSE Euronext Lisbon since 1995, with ISIN PTSEM0AM0004.
The Navigator Company, S.A. was acquired in 2004 and leads the Enterprise Group related with the production and sales in Portugal, Germany, Spain, France, Italy, United Kingdom, Netherlands, Austria, Belgium, Switzerland, Morocco, Poland, Turkey, United States of America and Mozambique, among others, of cellulose pulp and paper and its related products, purchase of wood, forest and agricultural production, cutting timber and production and sale of pulp and paper.
Secil – Companhia Geral de Cal e Cimento, S.A. leads the Enterprise Group of cements and related products. Moreover, Secil operates in Portugal, Brazil, Lebanon, Tunisia, Angola, Netherlands, France and Cape Verde, with cement production taking place at the Maceira, Pataias, Outão, Adrianópolis (Brazil), Gabès (Tunisia), Beirut (Lebanon) and Lobito (Angola) plants, and the production and sale of ready-mix concrete, aggregates, pre-cast and the operation of quarries via its subsidiaries.
ETSA – Investimentos, SGPS, S.A. leads the Enterprise Group of Environment that operates in Portugal.
In 2018 Semapa created a new venture capital business unit through its subsidiary Semapa Next, S.A., whose purpose is to promote investments in startups and venture capital funds with high growth potential.
Semapa is included in the consolidation perimeter of Sodim — SGPS, S.A., which is its parent company and the final controlling entity.
These financial statements were approved by the Board of Directors on 13 March 2019. However, they are also subject to approval by the Shareholders´ General Meeting, in accordance with the commercial legislation in force in Portugal
The Company’s senior management, i.e. the members of the Board of Directors who sign this report, declare that, to the best of their knowledge, the information contained therein has been prepared in accordance with the applicable Accounting Standards, giving a true and fair view of the Company’s assets and liabilities, its financial position and results. However, they are still subject to approval by the Shareholders’ General Meeting, in accordance with the commercial legislation in force in Portugal.
2018
AN
NU
AL R
EPO
RT
270
*07
2 ACCOUNTING STANDARDS USED FOR THE PREPARATION OF THE FINANCIAL STATEMENTSThe separate financial statements for the year ended at 31 December 2018 were prepared by Semapa, in accordance with the International Financial Reporting Standards as adopted by the European Union (IFRS - formerly International Accounting Standards (IAS)), issued by the International Accounting Standards Board (IASB) and Interpretations issued by the International Financial Reporting Interpretations Committee (IFRIC) or by the previous Standing Interpretations Committee (SIC), in force at the date of preparation of these financial statements.
In preparing these separate financial statements, Semapa followed the historical cost convention, modified when applicable, by measuring the fair value of i) derivative financial instruments and ii) financial assets at fair value.
The financial statements were prepared on a going concern basis.
In preparing the financial statements, in accordance with IFRS, the Board of Directors made the use of estimates, assumptions and critical judgments with an impact on the value of assets and liabilities and the recognition of income and expenses of each reporting period. Although these estimates are based on the best information available at the time of preparation of the financial statements, current and future results may differ from these estimates. The areas involving a higher degree of judgment and estimates are presented in Note 3.26.
3 SUMMARY OF THE MAIN ACCOUNTING POLICIESThe main accounting policies applied in the preparation of these financial statements are described below.
3.1 COMPARABILITY
The elements presented in these separate financial statements are fully comparable with those of the previous period.
3.2 AMENDMENTS TO ACCOUNTING POLICIES AND DISCLOSURES
Standards and interpretations whose application became mandatory for annual periods beginning on or after 1 January 2018, are detailed as follows:
IFRS 9 – Financial InstrumentsIFRS 9 was endorsed by the Commission Regulation (EU) No. 2067/2016 of 22 November 2016, with an effective date of mandatory application for periods beginning on or after 1 January 2018. IFRS 9 (2009 and 2010) introduces new requirements for the classification and measurement of financial assets and liabilities. In this new approach, financial assets are classified and measured based on the business model adopted for managing the assets and on the characteristics of the contractual cash flows. IASB published IFRS 9 (2013) with the requirements that provide the hedge accounting for transactions. IFRS 9 (2014) was also published, which revised some guidelines for the classification and measurement of financial instruments (in addition to financial investments in companies deemed strategic, extended to other debt instruments the fair value measurement with changes to be recognised in other comprehensive income - OCI) and implemented a new impairment model based on the expected losses model.
2018 ANN
UAL R
EPO
RT
271
*07
IFRS 15 – Revenue from contracts with customersThe International Accounting Standards Board (IASB) issued IFRS 15 - Revenue from contracts with customers on 28 May 2014 and was endorsed by the European Commission Regulation No. 1905/2016 of 22 September 2016 with mandatory application for periods beginning on or after 1 January 2018. This standard replaces IAS 11 - Construction Contracts, IAS 18 - Revenue, IFRIC 13 - Customer Loyalty Programs, IFRIC 15 - Agreements for the construction of Real Estate, IFRIC 18 - Transfers of Assets from Customers and SIC 31 Revenue - Barter Transactions Involving Advertising Services. IFRS 15 is based on a 5-step analysis model aiming to determine when revenue should be recognised and the amount to be recognised. The model specifies that revenue must be recognised when an entity transfers goods or services to the customer, measured by the amount that the entity expects to receive. Depending on the fulfilment of some criteria, the revenue is recognised:
i) At the precise moment when the control of goods and services is transferred to the customer; or
ii) Over the period, to the extent that depicts the Entity’s performance.
IFRIC 22 – Foreign currency transactions and advance considerationIFRIC 22 was issued on 8 December 2016, with a mandatory application date for periods beginning on or after 1 January 2018. The new IFRIC 22 provides that, in the event of advance considerations in foreign currency for asset acquisition purposes, expenses support or income generation, when applying paragraphs 21 to 22 of IAS 21, the transaction date considered for the purpose of determining the exchange rate to be used in the recognition of the asset, expense or income (or part thereof) inherent is the date on which the entity initially recognises the non-monetary asset or liability resulting from the payment or receipt of the advance consideration in foreign currency (or where there is several advance payments, the rates prevailing at each advance payment).
OTHER AMENDMENTS
Amendments issued by IASB were also adopted by the EU:
• On 20 June 2016 and applicable for annual periods beginning on or after 1 January 2018, amendments to IFRS 2 - Classification and Measurement of Share-based Payment Transactions;
• On 8 December 2016, and applicable for annual periods beginning on or after 1 January 2018, amendments to IAS 40 - Transfers of Investment Property, clarifying whether an entity should transfer property under construc-tion or development to, or from, investment property when there is a change in the use of such property which is supported by evidence other than specifically listed in paragraph 57 of IAS 40.
• The annual improvements cycle 2014-2016, issued by IASB on 8 December 2016, introduce amendments, with effective date for annual periods beginning on or after, 1 July 2018, to the standards IFRS 1 (elimination of short-term exemption for first-time adopters) and IAS 28 (measuring an associate or joint venture at fair value).
The aforementioned amendments did not have a significant impact on Semapa’s separate financial statements.

2018
AN
NU
AL R
EPO
RT
272
*07
There are new standards, amendments and interpretations, which, although already published, are only mandatory for annual periods beginning after 1 January 2019, as follows:
Description Amendment Effective date *
1. STANDARDS (NEW AND AMENDED) THAT BECOME EFFECTIVE ON OR AFTER 1 JANUARY 2019, ALREADY ENDORSED BY THE EU
1.1 STANDARDS
IFRS 16 - Leases New definition of lease. New accounting of leases for lessees. There are no changes to the accounting of leases by lessors. 1 January 2019
IFRS 9 – Financial instruments Accounting treatment options for financial assets with negative compensation 1 January 2019
1.2 INTERPRETATIONS
IFRIC 23 – Uncertainty over income tax treatments
Clarification on the application of the principles of recognition and measurement of IAS 12 when there is uncertainty about the tax treatment of a transaction, concerning income tax 1 January 2019
2. STANDARDS (NEW AND AMENDED) AND INTERPRETATIONS THAT BECOME EFFECTIVE ON OR AFTER 1 JANUARY 2019, NOT YET ENDORSED BY THE EU
IAS 28 – Investments in associate and joint-ventures
Clarification regarding long-term investments in associates and joint-ventures that are not being measured using the equity method. 1 January 2019
Improvement to standards 2015 – 2017 Several clarifications: IAS 23, IAS 12, IFRS 3 and IFRS 11 1 January 2019
IFRS 17 – Insurance contracts New accounting for insurance contracts, reinsurance contracts and investment contracts with discretionary participation characteristics. 1 January 2021
* Periods started on or after
Semapa will adopt the new standards in the years in which they become effective and is still evaluating the impacts that this adoption will have on their separate financial statements.
With regard to the adoption of IFRS 16, effective for periods beginning on or after 1 January 2019, the expected impacts are as follows:
I) NATURE OF THE CHANGE
In January 2016, the International Accounting Standards Board (IASB) issued IFRS 16 – Leases, which is effective for annual reporting periods beginning on or after 1 January 2019.
IFRS 16 defines the principles for recognising, measuring and presenting leases, replacing IAS 17 – Leases and its interpretative guidance. The main objective is to ensure that lessors and lessees report useful information to the users of the financial statements, especially regarding the effect that leases have on financial positions, financial performance and cash flows.
The main aspects covered by IFRS 16 are:
• Addition of some considerations in order to distinguish leases from service agreements, based on the existence of control over an asset at the time it becomes available for use;
• Introduction of a unique accounting model that requires the lessee to recognise the assets and liabilities for all leases with a duration longer than 12 months (except for leases of assets with a limited amount). The lessee shall recognise the right to use the respective asset and the liability associated with the payments to be made in the separate statement of financial position, and also recognise the financial costs and the depreciation sep-arately, in the separate income statement by nature; and
• Difference between the total amount paid between capital and interest (presented as financing activities) in the consolidated statement of cash flows.

2018 ANN
UAL R
EPO
RT
273
*07
In accordance with IFRS 16, rights-of-use assets will be tested for impairment in accordance with IAS 36 - Impairment of Assets. This treatment will replace the previous requirement for recognition of a provision for onerous lease contracts.
II) IMPACT
Semapa has already performed the inventory of existing leases, considering the provisions of IFRS 16. The standard will mainly affect the accounting of the Company’s operating leases.
The Company has assessed the practical case of the transition to IFRS 16 from not reassessing whether a contract is or contains a lease, having made an overall assessment of the new definition and evaluating the totality of contracts it has executed or modified before 1 January 2019.
The change in the lease definition essentially concerns the concept of control. IFRS 16 distinguishes lease services on based of whether or not there is control over the customer’s use of an identifiable asset. Control is considered to exist if the customer has, cumulatively:
• The right to obtain substantially all economic benefits from the use of a specific identified asset; and
• The right to direct the use of this specific asset.
The Company shall apply the lease definition established in IFRS 16 and its applicable guidance to all lease agreements in which has entered into as lessor or lessee, including all agreements on or after 1 January 2019.
The Company has developed an implementation project in the preparation for the first application of IFRS 16. The project has demonstrated that the new lease definition will not significantly change the scope of contracts that meet the lease definition for the Company.
At the balance sheet date, Semapa has non-cancellable operating lease commitments in the amount of Euro 686,500 (Note 27). From these commitments, approximately Euro 325,500 refer to short-term leases and Euro 2,000 to low-value leases, both of which will be recognised on a straight-line basis as expenses in the income statement.
For the remaining lease commitments, as at 1 January 2019, the Company expects to recognise assets under right of use of approximately EUR 359,000 and a corresponding lease liability in the same amount.
III) ADOPTION DATESemapa will apply the standard from the date of mandatory adoption on 1 January 2019. The Company intends to apply the simplified transition approach set forth in its paragraphs IFRS 16: C3(b), C7 and C8 and will not restate the comparative amounts for the period prior to the first adoption. Assets under right of use will be measured by the amount of the lease liability on the date of adoption of the standard.
3.3 PROPERTY, PLANT AND EQUIPMENT
Property, plant and equipment are recorded at acquisition cost, less depreciation and impairment losses (Note 14).
Acquisition cost includes all the expenses directly attributable to the acquisition of the assets. Subsequent costs are included in acquisition cost of the asset or recognised as separate assets, as appropriate, only when it is probable that future economic benefits will flow to the Company and the respective cost can be reliably measured. Other repairs and maintenance costs are recognised as a cost in the period they are incurred.

2018
AN
NU
AL R
EPO
RT
274
*07
Depreciation is calculated over the acquisition cost, using the straight-line method since the asset is available for use and using the rates that best reflect their estimated useful life, as follows:
Average useful life
Buildings and other constructions 8 – 10
Equipment:
Administrative equipment 3 - 10
Other property, plant and equipment 8
The residual values of the assets and related useful lives are reviewed and adjusted when necessary at the statement of financial position date. When the carrying amount of the asset exceeds its realisable value, the asset is written down to the estimated recoverable amount, and an impairment charge is recognised (Note 3.6). The recoverable amount is determined as the higher of fair value less costs to sell, and the value of the use of the asset, the latter being calculated based on the present value of the estimated future cash flows, arising from the continued use and disposal of the asset at the end of the defined useful life.
Gains or losses arising on the write off or disposal represent the difference between the proceeds received on disposal less costs to sell and the asset’s carrying amount, and are recognised in the income statement as other operating income or expenses.
3.4 GOODWILL
Goodwill represents the excess of the consideration paid over the fair value of the identifiable assets, liabilities and contingent liabilities of the subsidiaries at the acquisition date. It is included in amount of financial investment, under the heading financial investments — equity method.
Goodwill is not amortised and is subject to impairment tests together with the book value of the related financial investment. All investments are tested for impairment, comparing its book value with its recoverable value (higher between the value in use and the fair value less costs to sell), whenever there are signs of impairment. Any impairment losses are allocated to the financial investment whose recoverable amount is lower than its book value. Future reversals are performed if the recoverable amount of the financial investment increases.
The recoverable value of a given investment will be calculated for each financial investment, except for financial investments that do not have cash inflows, which are mostly independent of cash flows from other financial investments, in which case they will be jointly evaluated as cash-generating unit for the purposes of impairment tests.
Gains or losses arising from the sale of an entity include the amount of the corresponding Goodwill.
3.5 INVESTMENTS IN SUBSIDIARIES
Financial investments in subsidiaries are recorded in the Statement of financial position by the equity method, less any accumulated impairment losses (Note 10).
SUBSIDIARIESSubsidiaries are all entities (including structured entities) over which Semapa has control. The Company controls an entity when it is exposed to, or has rights, to variable returns generated as result of their involvement with the organisation, and has the ability to affect these variables returns through the exercise of power over the relevant activities of the subsidiary.
Under the equity method, financial investments are initially recorded at cost and subsequently adjusted by the amount corresponding to the participation in the net results of subsidiary companies against “Gains/(losses) of subsidiaries — equity method” by the dividends received and other changes in its shareholders’ equity against “Other comprehensive income”. In addition, interests in subsidiaries may also be adjusted by recognition of impairment losses.

2018 ANN
UAL R
EPO
RT
275
*07
The differences between the acquisition cost and the fair value of the subsidiary’s identifiable assets, liabilities and contingent liabilities at the acquisition date, if positive, are recognised as Goodwill. If these differences are negative, they are recorded as income for the year under the caption “Gains/ (losses) of subsidiaries — equity method”.
An evaluation of the investments in subsidiaries is made when there are signs that the asset may be impaired and any impairment losses that are deemed to exist are expensed. When impairment losses recognised in prior years cease to exist, they are reversed (Note 3.6).
When the Company’s interest in the subsidiary’s losses equals or exceeds its investment in these companies, the Company ceases to recognise additional losses, unless it has incurred liabilities or made payments on their behalf. Unrealised gains and losses on transactions with subsidiaries are eliminated in the extent of the Company’s interest therein. Unrealised losses are also eliminated, unless the transaction reveals additional evidence of impairment over the transferred asset.
Unrealised gains and losses on transactions between Semapa and its subsidiaries are eliminated in the extent of the Company’s interest therein. Unrealised losses are also eliminated, unless the transaction reveals additional evidence of impairment over the transferred asset.
Dividends received from subsidiaries are recorded as a decrease in the amount of the financial investment.
The accounting policies of the subsidiaries are changed, whenever necessary, in order to ensure consistency with the policies adopted by the Company.
3.6 IMPAIRMENT OF NON-CURRENT ASSETS
Non-current assets which do not have a defined useful life are not subject to depreciation, but are subject to annual impairment tests. Assets subject to amortisation are reviewed for impairment whenever events or changes in circumstances indicate that their carrying amount may not be recoverable.
Assets subject to depreciation are reviewed for impairment, whenever events or changes in circumstances indicate that the carrying amount may not be recoverable.
An impairment loss is recognised by the amount of the excess of the carrying amount of the asset, in relation to its recoverable value. The recoverable amount is the higher of an asset’s fair value less costs to sell, and its value in use.
For the purpose of conducting impairment tests, the assets are grouped at the lowest level for which cash flows can be identified separately (cash generating units that the assets belong to), when it is not possible to do it individually for each asset.
The reversal of impairment losses recognised in previous periods is recorded when it can be concluded that the recognised impairment losses no longer exist or have decreased.
The reversal of impairment losses is recognised in the income statement as operating income. However, the reversal of the impairment loss is reversed only up to the limit of the amount that would have been recognised (net of amortisation or depreciation), had the impairment loss not been recorded in previous periods.

2018
AN
NU
AL R
EPO
RT
276
*07
3.7 FINANCIAL ASSETS
IFRS 9 establishes new requirements for the classification and measurement of financial assets, replacing the requirements established in IAS 39.
This classification is based on the business model used in the management of the financial assets and on the characteristics of the cash flows defined in the contract, being determined at the time of the initial recognition and reassessed at each reporting date.
The Company classifies its financial assets into the following categories: subsequently measured at amortised cost, at fair value through other comprehensive income or at fair value through profit or loss. The classification and measurement of financial assets is based on the business model adopted for managing the assets and on the characteristics of the contractual cash flows. The classification is determined at time of initial recognition of the investments, and this classification is revalued on each reporting date, due to the change in the business model for the management of financial assets.
All acquisitions and disposals of these investments are recognised at the date of the respective purchase and sale contracts, irrespective of the financial settlement date.
Investments are initially recorded at their acquisition cost and their fair value is equal to the price paid and payable, including transaction costs, except for financial assets at fair value through profit or loss. The subsequent measurement depends on the category of the investment, as follows:
FINANCIAL ASSETS AT AMORTISED COSTA financial asset is measured at amortised cost if (i) it is held to collect contractual cash flows; and (ii) the asset’s underlying contractual cash flows represent solely the payment of principal and interest. Assets classified in this category are initially recognised at fair value and subsequently measured at amortised cost.
Loans and receivables are non-derivative financial assets with fixed or determinable payments that are not quoted in an active market. They are originated when the Company provides money, goods or services directly to a debtor, with no intention of negotiating the debt.
They are included in current assets, except for maturities over 12 months after the date of the statement of financial position, in which case they are classified as non-current assets.
Loans and receivables are included in the statement of financial position under Receivables and other current assets.
FINANCIAL ASSETS AT FAIR VALUE THROUGH OTHER COMPREHENSIVE INCOMEA financial asset is measured at fair value through other comprehensive income if (i) the inherent objective of the business model used is achieved, either by collecting contractual cash flows or selling financial assets; and (ii) the underlying contractual cash flows only represent the payment of principal and interest. Assets classified under this category are initially and subsequently measured at their fair value, and changes in their carrying amount are recorded against other comprehensive income, except for recognition of impairment losses, interest and foreign exchange gains and losses which are recognised against the income statement. When the financial asset is derecognised, the gain or loss accumulated in other comprehensive income is reclassified to the income statement.
FINANCIAL ASSETS AT FAIR VALUE THROUGH PROFIT OR LOSSFinancial assets that do not meet the requirements for classification in the situations referred to above are classified and measured at fair value through profit or loss, residual category in accordance with IFRS 9.
IMPAIRMENTIFRS 9 establishes a new model for the recognition of impairment, replacing the concept of “incurred losses” (IAS 39) with the concept of “expected losses”. This model is applicable to financial instruments measured at amortised cost or at fair value through other comprehensive income (including loans, bank deposits, accounts receivable and debt securities).

2018 ANN
UAL R
EPO
RT
277
*07
DERECOGNITION OF FINANCIAL ASSETSSemapa derecognises financial assets only when the contractual rights to its cash flows expire, or when it transfers the financial assets and all significant risks and benefits associated with their possession to another entity. The transferred financial assets for which the Company has retained significant risks and benefits are derecognised, provided that control over them has been assigned. Semapa derecognises financial liabilities only when the corresponding obligation is settled, cancelled or expired.
3.8 CORPORATE INCOME TAX
Semapa is subject to the special tax regime for groups of companies (“RETGS”), comprising companies in which the shareholding is equal to or more than 75% and which meet the conditions laid down, in articles 69, and following of the Corporate Income Tax Code (CIT Code), which includes the subsidiaries Secil — Companhia Geral de Cal e Cimento, S.A. and ETSA Investimentos, SGPS, S.A. and its subsidiaries which comply with those conditions. The tax period of the companies included in Semapa’s tax group corresponds to the calendar year.
Companies included in RETGS calculate and record income tax as if they were taxed in an individual basis. The liabilities determined are however recognised as due to the dominant company of the tax group, which is responsible for the global calculation and settlement of the income tax. If gains are recognised in the application of this tax regime, these are recorded as income in the parent company.
In accordance with the current legislation, gains and losses of subsidiaries, associates and joint-ventures resulting from the application of the equity method are deducted from or accrued, respectively, to the income for the period, to determine the taxable amount.
Corporate income tax includes current and deferred tax. Current income tax is calculated based on net profit, adjusted in conformity with tax legislation in force at the statement of financial position date (Note 12).
Deferred tax is calculated using the liability method, based on the temporary differences between the book values of the assets and liabilities and their respective tax base. The income tax rate expected to be in force in the period in which the temporary differences will reverse is used in calculating deferred tax.
Deferred tax assets are recognised whenever there is a reasonable likelihood that future taxable profits will be generated against which they can be offset. Deferred tax assets are revised periodically and decreased, whenever it is likely that tax losses will not be used.
Deferred tax liabilities are recognised on all taxable temporary differences, except those related to: i) the initial recognition of Goodwill; or ii) the initial recognition of assets and liabilities, which do not result from a business combination, and which at the date of the transaction do not affect the net results, accounting or fiscal. However, for taxable temporary differences related to investments in subsidiaries, these should not be recognised if: (i) the parent company has the ability to control the period of reversal of the temporary difference; and (ii) it is likely that the temporary difference will not reverse in the near future.
Deferred taxes are recorded as an expense or income for the year, unless they result from amounts recorded directly in equity, in which case deferred tax is also recorded under the same caption.
3.9 STATE AND OTHER PUBLIC ENTITIES
The balances payable and/or receivable from these entities relating to taxes, contributions and fees, are measured at the amount that is expected to be recovered/paid from tax and other authorities, using the laws in force at the date of the statement of the financial position (Note 15).

2018
AN
NU
AL R
EPO
RT
278
*07
3.10 ACCOUNTS RECEIVABLE
Accounts receivable are initially recorded at fair value and subsequently measured at amortised cost, net of impairment losses, which are required to reduce the assets to their expected net realisable value (Note 16).
Impairment losses are recorded when there is objective evidence that the Company will not receive all outstanding amounts under the original conditions of accounts receivable, whenever, at each reporting period, there is a significant increase of credit risk since the initial recognition of the asset.
3.11 CASH AND CASH EQUIVALENTS
Cash and cash equivalents include cash, bank deposits and other short-term investments with an initial maturity of up to 3 months, which can be immediately mobilised without significant risk of fluctuations in value (Note 17).
The cash flows statement is prepared in accordance with the direct method and is classified in operating, investing and financing activities.
The operating activities include customer receipts and payments to suppliers, personnel and others related to the operating activity.
Cash flows from investing activities include the acquisitions and disposal of investments in subsidiary companies as well as the receipts and payments arising from the purchases and sales of tangible fixed assets, among others.
Financing activities include payments and receipts related to loans, payment of interest and similar costs, leasing contracts, purchase and sale of treasury shares and payment of dividends.
For the purposes of the cash flow statement, this caption includes bank overdrafts, which are presented in the statement of financial position in current liabilities, under Interest-bearing liabilities.
The Company classifies interests and dividends received and paid as investing and financing activities, respectively.
3.12 SHARE CAPITAL AND TREASURY SHARES
Ordinary shares are classified in shareholder’s equity (Note 18).
Costs directly attributable to the issue of new shares or other equity instruments are reported as a deduction, net of taxes, from the proceeds of the issue.
The cost directly attributable to the issue of new shares or options for a business acquisition are included in the acquisition cost, as part of the purchase price.
Treasury shares are recorded at their acquisition cost as a decrease in shareholders’ equity, in the caption Treasury shares (Note 18), while the gains or losses inherent in their disposal are recorded under Other reserves.
When any Group company acquires shares of the parent company (treasury shares), the payment, which includes directly-attributable incremental costs, is deducted from the shareholders’ equity attributable to the holders of the parent company’s capital until the shares are cancelled, redeemed or sold.
When such shares are subsequently sold or repurchased, any proceeds, net of the directly attributable transaction costs and taxes, is reflected in the shareholders’ equity of the company’s shareholders, under Other reserves.
The extinction of treasury shares is reflected in the consolidated financial statements, as a reduction of share capital and in the caption Treasury shares at its nominal and acquisition cost, respectively. Its differential is assessed between the amounts recorded in Other reserves.

2018 ANN
UAL R
EPO
RT
279
*07
3.13 INTEREST-BEARING LIABILITIES
Interest-bearing liabilities are initially recognised at fair value, net of the transaction costs incurred, and are subsequently stated at their amortised cost. Any difference between the amounts received (net of transaction costs) and the amounts reimbursed is recognised in the income statement over the term of the debt, using the effective interest rate method.
Interest-bearing debt is classified as a current liability, except if the Company has an unconditional right to defer the settlement of the liability for at least 12 months after the statement of financial position date (Note 21).
3.14 BORROWING COSTS
Borrowing costs relating to loans are generally recognised as financial costs, in accordance with the accrual accounting principle (Note 11).
Borrowing costs directly related to the acquisition, construction or production of fixed assets are capitalised when their construction period exceeds one year, and form part of the asset’s cost.
Capitalisation of these charges commences after the start of the asset’s preparation or development activities and ceases when substantially all the activities necessary to prepare the qualifying assets for their intended use or sale are completed, or when the relevant project is suspended or substantially concluded.
Any financial income directly related to a specific investment is deducted from the borrowing costs of the referred asset.
3.15 PROVISIONS
Provisions are recognised whenever the Company has a legal or constructive obligation, as a result of past events, in which it is probable that an outflow of resources will be required to settle the obligation and the amount has been reliably estimated.
The provisions related to legal proceedings brought against the Company are recognised in accordance with the risk assessments carried out internally by Semapa with the support of its legal advisors, based on the likelihood of the decision being favourable or unfavourable to Semapa.
The amount of provisions for tax proceedings arises from an evaluation made by Semapa with reference to the date of the Statement of Financial Position, regarding potential differences of understanding with the Tax Administration, taking into account the developments occurring in tax matters.
Provisions for future operating losses are not recognised. Provisions are reviewed on the statement of financial position date and are adjusted so as to reflect the best estimate at that date (Note 20).
3.16 PENSIONS AND OTHER POST-EMPLOYMENT BENEFITS
PENSIONS OBLIGATIONS – DEFINED BENEFIT PLANThe liabilities for the payment of retirement pensions are recorded in accordance with the criteria established by IAS 19.
According to IAS 19, companies with pension plans recognise the costs with the granting of these benefits as and when the services are rendered by the beneficiary employees. In this sense, the Group’s total liability is estimated at least every six months at the date of the interim and annual financial statements, by an independent and specialised entity in conformity with the projected unit credit method.
2018
AN
NU
AL R
EPO
RT
280
*07
The liability thus determined is shown in the statement of financial position and pension expenditure is recorded under Personnel expenses. The actuarial deviations resulting from the differences between the assumptions used for the clearance of liabilities and what actually occurred (as well as the changes made to them and the difference between the expected value of the fund assets’ return and actual profitability) are recognised, when incurred, in the statement of comprehensive income (Note 22).
Expenses with past liabilities, resulting from the implementation of a new plan or accrued benefits, are recognised immediately, in the event that the benefits are being paid or are past due.
The liability thus determined is shown in the statement of financial position under the caption Post-employment benefits liabilities in non-current liabilities.
The net interest corresponds to the application of the discount rate to the value of net responsibilities (value of the responsibilities deducted of fund asset’s fair value) and is recognised under the caption Personnel costs.
Gains and losses generated by a curtailment or settlement of a defined-benefit plan are recognised in the income statement when the curtailment or settlement occurs. A curtailment occurs when there is a material reduction in the number of Employees, or the plan is altered in such a way that the benefits awarded are reduced with a material impact.
HOLIDAY PAY, ALLOWANCES AND BONUSESUnder the terms of the prevailing legislation, Employees are entitled annually to 22 working days of vacation, as well as a one-month holiday allowance, entitlement to which is acquired in the year preceding its payment.
According to the current Performance Management System (Sistema de Gestão de Desempenho), Employees have the right to a bonus, based on annually-defined objectives.
Accordingly, these liabilities are recorded in the year in which the Employees acquire the respective right, irrespective of the date of payment, whilst the balance payable at the date of the consolidated statement of financial position is shown under the caption Payables and other current liabilities.
The benefits arising from termination of employment are recognised when the Company can no longer withdraw the offer of such benefits or in which the Group recognises the cost of restructuring under the provisions recording. Benefits due over 12 months after the end of the reporting period are discounted to their present value.
3.17 PAYABLES AND OTHER CURRENT LIABILITIES
Trade creditors and current accounts payable are initially recorded at their fair value and subsequently at amortised cost using the effective interest rate method (Note 24).
3.18 LEASES
Property, plant and equipment acquired under leasing contracts, as well as the corresponding liabilities, are recorded using the financial method. According to this method, the asset’s cost is recorded in property, plant and equipment and the corresponding liability is recognised, under the caption Interest bearing liabilities — financial leases, while the interest included in the instalments and the asset’s depreciation are recorded as costs in the income statement of the year to which they relate.
Leases, under which a significant part of the risks and benefits of the property is assumed by the lessor, with the Group being the lessee, are classified as operating leases. Payments made under operating leases, net of any incentives received by the lessee, are recorded in the income statement during the period of the lease.

2018 ANN
UAL R
EPO
RT
281
*07
3.19 DIVIDENDS DISTRIBUTION
The distribution of dividends to shareholders is recognised as a liability in the Company’s financial statements in the period in which the dividends are approved by the shareholders and up until the time of their payment.
3.20 REVENUE
Income derived from sales of goods or services rendered is recognised in the statement of consolidated income in accordance with the principles established by IFRS 15. Revenue shall reflect the transfer of goods and services contracted to customers, for the amount corresponding that the entity expects to receive as consideration for the delivery of those goods or services, based on a model that includes 5 phases: (i) identification of a contract with a customer; (ii) identification of performance obligations; (iii) determination of a transaction price; (iv) transaction price allocation and (v) revenue recognition.
Services rendered are recognised net of taxes and discounts (Note 4).
3.21 ACCRUAL ACCOUNTING PRINCIPLE
Interest received is recognised in accordance with the principle of accrual accounting using the amortised cost method, taking into consideration the amount outstanding and the effective interest rate, during the period up to maturity. Interest is recorded under the instrument caption that gave rise to them.
The Company recognises their expenses and income in accordance with the accrual accounting principle, in terms of which expenses and income are recognised as and when generated, regardless of the moment in which they are received or paid.
The differences between the amounts received and paid and the respective expenses and income are recognised in “Receivables and other current assets” and “Payables and other current liabilities” (Notes 16 and 24, respectively).
3.22 FAIR VALUE
Financial Assets and Liabilities measured at fair value are classified according to the following levels of fair value hierarchy:
• Level 1: fair value of financial assets and liabilities is based on active markets quotations, at the reference date of the consolidated financial position;
• Level 2: the fair value of financial assets and liabilities is not determined based on active market quotations, but rather using valuation models. The main inputs of the models used are observable in the market; and
• Level 3: the fair value of financial assets and liabilities is not determined based on active market quotations, but rather using valuation models, whose main inputs are not observable in the market.
3.23 CONTINGENT ASSETS AND LIABILITIES
Contingent assets are assets that arise from past events and whose existence will only be confirmed by the occurrence, or not, of one or more uncertain future events not wholly under the control of the Company.
Contingent assets are not recognised in the Company’s financial statements but are disclosed in the notes when it is probable that a future economic benefit will arise from them.
Contingent liabilities are defined as: (i) possible obligations arising from past events, the existence of which will only be confirmed by the occurrence or not of one or more uncertain future events not wholly under the control of the

2018
AN
NU
AL R
EPO
RT
282
*07
Company; or (ii) present obligations that arise from past events, but are not recognised because it isn´t probable that a flow of resources, which affects economic benefits, is necessary to settle the obligation or the amount of the obligation cannot be measured with sufficient reliability.
Contingent liabilities are not recognised in the Company’s financial statements but are subject to disclosure (Note 27), unless the possibility of an outflow of funds affecting future economic benefits is remote, in case they are not even disclosed.
3.24 EARNINGS PER SHARE
The basic earnings per share are determined based on the division of profits or losses by the weighted average number of common shares outstanding during the period.
For the purpose of calculating diluted earnings per share, the Company adjusts the profits or losses, as well as the weighted average number of outstanding shares, for the purposes of all potential dilutive common shares.
3.25 SUBSEQUENT EVENTS
Events occurring after the date of the statement of financial position and before the date of issuance of the financial statements, which provide additional information on conditions prevailing at the date of the statement of financial position are reflected in the separate financial statements.
Subsequent events after the date of the statement of financial position and before the date of issuance of the financial statements, which provide information about conditions occurring after the statement of financial position date are disclosed in the notes to the separate financial statements, if material (Note 29).
3.26 RISK MANAGEMENT
As an economic agent, Semapa is exposed to risks inherent to its activity, which can have a decisive impact on the value of its assets. The performance of Semapa as a holding company is also closely linked to the results of its subsidiaries.
Notwithstanding the objectives and levels of results defined, Semapa promotes autonomy and accountability among its subsidiaries. This combination of demand and autonomy is reflected in the exposure to a set of risks that impact not only each of its subsidiaries, but can also spread to the Holding and other companies in the group.
Regarding risk management, during 2018, Semapa undertook a restructuring of its risk management and control systems based on the best practices and methodological references such as COSO, ISO 31000 and follow-up to the recommendations of the Code of Corporate Governance (Código de Governo das Sociedades) issued by the Instituto Português de Corporate Governance (IPCG) and the Portuguese Securities Market Commission (CMVM).
3.26.1 FINANCIAL RISK FACTORS
Semapa, as a holding company develops direct and indirect managing activities over its subsidiaries. Therefore the fulfilment of the assumed obligations depends on the cash flow generated by its subsidiaries. Thus, the company depends on the eventual dividends distribution by subsidiaries, interests’ payment, loans reimbursement and other cash-flows generated by those companies.
The ability of Semapa subsidiaries to make funds available will depend, partly, of their ability to generate positive cash flows and, on the other hand, of the respective earnings, available reserves and financial structure.
The Semapa Group has a risk-management program, which focuses its analysis on the financial markets with a view to mitigate the potential adverse effects on the Semapa Group’s financial performance. Risk management is undertaken by the Financial Management of the holding, in accordance with the policies approved by the Board of Directors and monitored by the Risks and Control Commission.
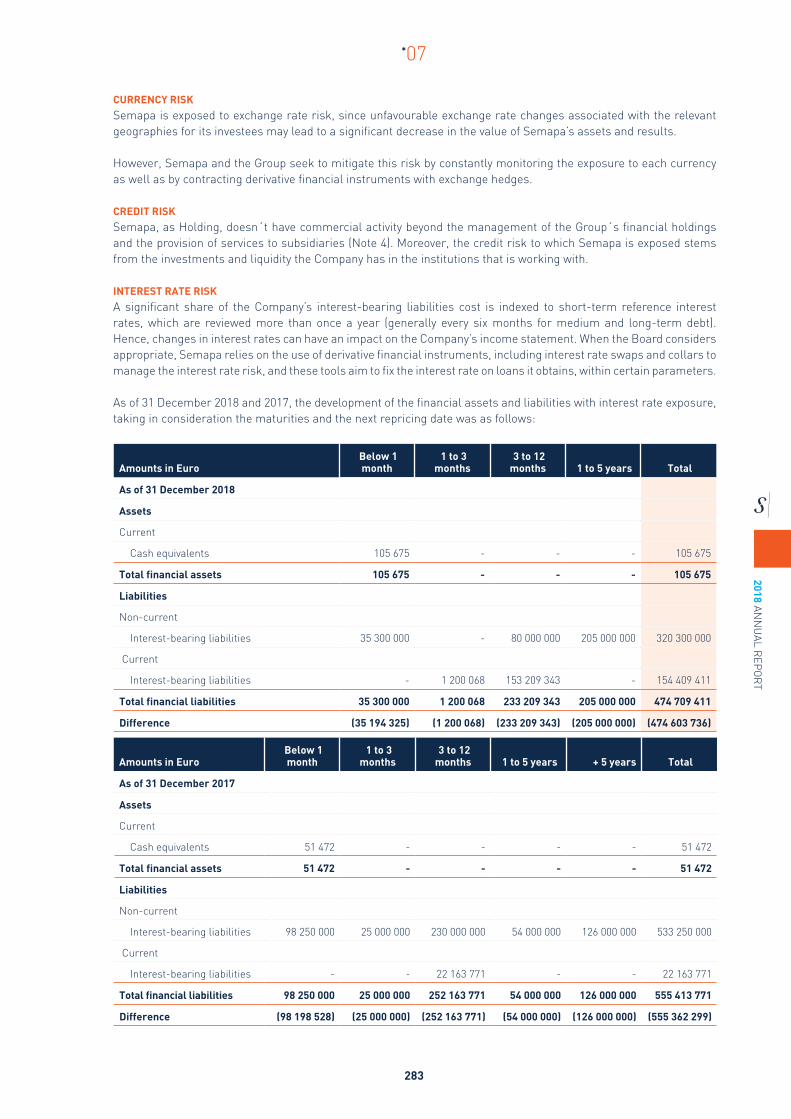
2018 ANN
UAL R
EPO
RT
283
*07
CURRENCY RISKSemapa is exposed to exchange rate risk, since unfavourable exchange rate changes associated with the relevant geographies for its investees may lead to a significant decrease in the value of Semapa’s assets and results.
However, Semapa and the Group seek to mitigate this risk by constantly monitoring the exposure to each currency as well as by contracting derivative financial instruments with exchange hedges.
CREDIT RISKSemapa, as Holding, doesn´t have commercial activity beyond the management of the Group´s financial holdings and the provision of services to subsidiaries (Note 4). Moreover, the credit risk to which Semapa is exposed stems from the investments and liquidity the Company has in the institutions that is working with.
INTEREST RATE RISKA significant share of the Company’s interest-bearing liabilities cost is indexed to short-term reference interest rates, which are reviewed more than once a year (generally every six months for medium and long-term debt). Hence, changes in interest rates can have an impact on the Company’s income statement. When the Board considers appropriate, Semapa relies on the use of derivative financial instruments, including interest rate swaps and collars to manage the interest rate risk, and these tools aim to fix the interest rate on loans it obtains, within certain parameters.
As of 31 December 2018 and 2017, the development of the financial assets and liabilities with interest rate exposure, taking in consideration the maturities and the next repricing date was as follows:
Amounts in Euro Below 1
month 1 to 3
months 3 to 12 months 1 to 5 years Total
As of 31 December 2018
Assets
Current
Cash equivalents 105 675 - - - 105 675
Total financial assets 105 675 - - - 105 675
Liabilities
Non-current
Interest-bearing liabilities 35 300 000 - 80 000 000 205 000 000 320 300 000
Current
Interest-bearing liabilities - 1 200 068 153 209 343 - 154 409 411
Total financial liabilities 35 300 000 1 200 068 233 209 343 205 000 000 474 709 411
Difference (35 194 325) (1 200 068) (233 209 343) (205 000 000) (474 603 736)
Amounts in Euro Below 1 month
1 to 3 months
3 to 12 months 1 to 5 years + 5 years Total
As of 31 December 2017
Assets
Current
Cash equivalents 51 472 - - - - 51 472
Total financial assets 51 472 - - - - 51 472
Liabilities
Non-current
Interest-bearing liabilities 98 250 000 25 000 000 230 000 000 54 000 000 126 000 000 533 250 000
Current
Interest-bearing liabilities - - 22 163 771 - - 22 163 771
Total financial liabilities 98 250 000 25 000 000 252 163 771 54 000 000 126 000 000 555 413 771
Difference (98 198 528) (25 000 000) (252 163 771) (54 000 000) (126 000 000) (555 362 299)

2018
AN
NU
AL R
EPO
RT
284
*07
Semapa uses the sensibility analysis technique to measure impacts on the income statement and equity of increase or decrease on interest rates maintaining the other variables constant. This analysis is only for theoretical reasons, since changes in interest rates rarely occur in isolation from changes in other market factors.
The sensitivity analysis is based on the following assumptions:
(i) Changes in market interest rates affect interest income and expenses arising from financial instruments subject to floating rates;
ii) Changes in market interest rates only lead to interest income and expenses regarding fixed rate financial instruments if those are measured at their fair value;
iii) Changes in market interest rates affect the fair value of derivative financial instruments as well as other financial assets or liabilities;
iv) Changes in fair value of derivative financial instruments and other financial assets and liabilities are measured using the discounted cash flows method, with market interest rates at year end.
Under these assumptions, a 0.5% increase in market interest rates for all currencies to which Semapa has liabilities and assets as of 31 December 2018 would result in a decrease in pretax profit of approximately Euro 1,873,547 (31 December 2017: decrease of Euro 2,276,102).
LIQUIDITY RISKSemapa manages liquidity risk in two ways: (i) ensuring that its financial debt has a high medium and long-term component with maturities appropriate to the characteristics of the industries in which its subsidiaries operate, and (ii) through the contracting with financial institutions of credit facilities available at all times, for an amount that guarantees adequate liquidity.
The liquidity of contracted and interest-bearing financial liabilities will give rise to the following undiscounted monetary flows, including interest, based on the remaining period to maturity at the date of the Consolidated Financial Position:
As of 31 December 2018 and 2017, bank loans granted and not withdrawn amount to Euro 254,450,000 and Euro 331,500,000 respectively.
CAPITAL RISKThe objectives of Semapa, when managing capital, are to safeguard the Group´s ability to continue as a going concern and value creation for shareholders, through a conservative dividend policy based on principles of financial strength. The aim has been to maintain a financial structure compatible with the Group´s sustained growth and different business areas, whilst maintaining sound solvency and financial autonomy indicators. Accordingly, capital for the purposes of capital management corresponds to the shareholders equity and it is not considered any financial liability as an integral part thereof.
3.26.2 OPERATIONAL RISKS FACTORS
The operational risk factors are essentially at the level of Semapa´ s subsidiaries and are as follows:
• Risk of raw materials unavailability• Risk of environmental disaster• Risk of obsolescence or product discontinuation• Risk of assets obsolescence• Risk of cybersecurity

2018 ANN
UAL R
EPO
RT
285
*07
3.26.3 STRATEGIC RISKS
The strategic risks that directly affect Semapa, but also its subsidiaries, are mainly the following:
• Risk of devaluation of reputation capital• Risk of portfolio concentration• Risk of investment decision-making• Risk of significant business erosion• Risk of external shocks• Risk of talent retention
3.26.4 OTHER RISKS
Other risks were identified that affect Semapa and its subsidiaries, which are mainly the following:
• Risk of regulatory default• Risk of governance• Risk of fraud
3.27 RELEVANT ACCOUNTING ESTIMATES AND JUDGMENTS
The preparation of separate financial statements requires Semapa’ s management to make judgments and estimates that affect the amount of revenue, costs, assets, liabilities and disclosures at the date of the separate statement of financial position.
These estimates are influenced by Semapa’ s management’s judgments, based on:
(i) the best information and knowledge of present events and in certain cases on the reports of independent experts; and
(ii) the actions that Semapa considers it may have to take in the future. However, on the date on which the operations are realised, the outcome could differ from those estimates.
The estimates and assumptions which present a significant risk of generating a material adjustment to the book value of assets and liabilities in the following financial year are presented below:
3.27.1 RECOVERABILITY OF FINANCIAL INVESTMENTS
Semapa annually tests for impairment its financial investments, including Goodwill, in accordance with the accounting policy described in Note 3.5.
The recoverable amounts of cash flow units are determined, based on the calculation of usage values or fair value, less costs to sell. These calculations require the use of estimates and assumptions that, in case of change, may have an impact on the estimated recoverable amount (Note 10).
A sensitivity analysis was performed, as at 31 December 2018, to the key assumptions (independently for each assumption) identified as follows:
1) Increase of 50 basis points in the discount rate used (WACC) in the base scenario; and
2) Reduction of free cash flow by 5% compared to the base scenario.
As a result of these tests, it was concluded that a 50 base points increase in the discount rates used (WACC) for the impairment tests of Goodwill would imply a devaluation of: i) 8% in the valuation value of CGU Pulp and Paper and ii) 12% in the valuation value of the CGU Cement and Derivatives, in any of the cases without resulting in any impairment loss.

2018
AN
NU
AL R
EPO
RT
286
*07
It was also concluded that a reduction of free cash flow by 5% would imply a devaluation of i) 6% in the valuation value of CGU Pulp and Paper and ii) 8% in the valuation value of CGU Cement and Derivatives, in any of the cases without resulting in any impairment loss.
3.27.2 ACTUARIAL ASSUMPTIONS
Liabilities relating to defined-benefit plans to employees are calculated, based on actuarial assumptions. Changes to those assumptions can have a material impact on the previously mentioned liabilities.
3.27.3 RECOGNITION OF PROVISIONS
Semapa, based on the opinion of its legal counsels, makes a judgment to determine whether a provision should be recorded to cover risks of different natures.
3.27.4 INCOME TAX
Semapa recognises liabilities for additional tax settlements that may result from tax authorities’ revisions. When the final result of these situations is different from the amounts initially recorded, the differences will have an impact on income tax and tax provisions in the period in which they occur.
In Portugal, annual income statements are subject to review and possible adjustment by the tax authorities for a period of 4 years (5 years for Social Security). However, if tax losses are presented they may be subject to review by the tax authorities for a greater period.
The Board of Directors considers that any corrections to those declarations as a result of reviews/inspections by the tax authorities will not have a significant impact in the separate financial statements as at 31 December 2018, although the years up to and including 2014 have already been reviewed.
4 SALES AND SERVICES RENDEREDThe amounts of Euro 13,297,832 and Euro 13,037,095, recognised in Services rendered for the years ended as at 31 December 2018 and 2017, respectively, refer to management services provided by Semapa to its subsidiaries in the strategic planning, legal, financial, accounting, tax, IT areas and Talent Management among others, provided in the domestic market (Note 25).
5 OTHER INCOMEAs of 31 December 2018 and 2017, the caption Other Income comprises:
Amounts in Euro 2018 2017
Gains on disposal of property, plant and equipment (Note 14) 30 000 8 831
VAT recovery from prior years - 293 029
Other operating income 168 24
30 168 301 884

2018 ANN
UAL R
EPO
RT
287
*07
6 SUPPLIES AND SERVICESDuring the years ended 31 December 2018 and 2017, Supplies and services were detailed as follows:
Amounts in Euro 2018 2017
Specialised services 2 611 027 1 327 051
Materials 50 942 58 804
Energy and fluids 91 890 86 398
Travel and accommodation 496 995 456 287
Other services 1 116 695 1 133 600
Reinvoicing of external services (29 189) (52 247)
4 338 360 3 009 893
7 PAYROLL EXPENSESAs of 31 December 2018 and 2017, Payroll expenses were detailed as follows:
Amounts in Euro 2018 2017
Statutory Bodies remuneration (Note 25) 5 724 823 5 966 274
Other remunerations 2 313 001 2 250 603
Post-employment benefits (Note 22) 23 431 23 431
Charges on remuneration 1 027 277 1 033 586
Other payroll costs 152 966 197 600
9 241 498 9 471 494
The number of Employees working for the Company as at 31 December 2018 and 2017 was of 30 and 28, respectively.
8 OTHER EXPENSESAs of 31 December 2018 and 2017, Other expenses was detailed as follows:
Amounts in Euro 2018 2017
Taxes (252 133) (267 332)
Donations (87 903) (40 150)
Membership fees (45 768) (54 081)
Other expenses (42 812) (7 133)
(428 616) (368 696)

2018
AN
NU
AL R
EPO
RT
288
*07
9 (EXPENSES)/REVERSALS RELATED TO DEPRECIATION AND AMORTISATIONFor the years ended 31 December 2018 and 2017, the caption (Expenses)/ reversals related to depreciation and amortisation were as follows:
Amounts in Euro 2018 2017
Depreciation of tangible assets
Buildings and other constructions (Note 14) (106 311) (111 407)
Equipment and other tangible assets (Note 14) (84 079) (88 248)
(Expenses) / reversals of depreciation and amortisation (190 390) (199 655)
10 FINANCIAL INVESTMENTS – EQUITY METHODAs at 31 December 2018 and 2017, investments in financial investments recorded under the equity method in the statement of financial position, including Goodwill, were as follows:
Amounts in Euro
31/12/2018 31/12/2017
% heldFinancial
Investment
Share premium and
Supplementary payments Total % held
Financial Investment
Share premium and
Supplementary payments Total
Aphelion, S.A. 100.00% 45 313 - 45 313 100.00% 46 874 - 46 874
ETSA Investimentos, SGPS, S.A. 99.99% 62 267 172 - 62 267 172 99.99% 60 256 269 - 60 256 269
Secil - Companhia Geral de Cal e Cimento, S.A. 100.00% 364 161 421 136 500 000 500 661 421 100.00% 394 643 810 140 000 000 534 643 810
Seinpar Investments, B.V. 100.00% 415 751 490 - 415 751 490 100.00% 391 265 841 27 383 500 418 649 341
Seinpart - Participações, SGPS, S.A. 100.00% - - - 49.00% 23 877 - 23 877
Semapa Inversiones, S.L. 100.00% 147 556 - 147 556 100.00% 154 065 - 154 065
Semapa Next, S.A. (former Inspiredplace, S.A.) 100.00% 2 985 234 - 2 985 234 100.00% 39 323 - 39 323
Seminv - Investimentos, SGPS, S.A. 100.00% - - - 100.00% 2 009 993 - 2 009 993
The Navigator Company, S.A. 35.73% 393 533 740 - 393 533 740 35.71% 396 603 899 - 396 603 899
1 238 891 926 136 500 000 1 375 391 926 1 245 043 951 167 383 500 1 412 427 451
In addition, Semapa holds a 33.71% indirect interest in The Navigator Company, S.A., through Seinpar Investments, B.V.

2018 ANN
UAL R
EPO
RT
289
*07
Changes in financial investments-equity method, during the years ended as of 31 December 2018 and 2017, were as follows:
Amounts in Euro 31/12/2018 31/12/2017
Opening balance 1 412 427 451 1 508 781 876
Contributions and capital increase - 50 000
Capital increases / (reductions) 2 950 000 -
Acquisitions (Note 25) 24 251 -
Share of profits/ (losses) 147 842 004 138 591 309
Dividends allocated by the subsidiary:
The Navigator Company, S.A. (71 417 924) (89 273 685)
Seinpar Investments, B.V. (39 950 000) -
Seminv - Investimentos, SGPS, S.A. (1 961 847) -
Reimbursement of:
Supplementary capital contributions (3 500 000)
Share premium (27 383 500) (84 110 000)
Adjustments of financial investments (43 583 681) (61 612 048)
Disposal of subsidiaries (54 828) -
Other movements - (1)
Closing balance 1 375 391 926 1 412 427 451
During the year ended at 31 December 2018, Semapa acquired the remaining 51% of the capital share of Seinpart - Participações, SGPS, S.A. to its subsidiary Semapa Inversiones, SL. Later, during that year, Semapa liquidated subsidiaries Seminv - Investimentos, SGPS, S.A. and Seinpart - Participações, SGPS, S.A. The effect of disposal these subsidiaries, in the amount of Euro 54,828, includes the transfer to Semapa of cash and cash equivalents in the total amount of Euros 10,014.
During the year ended at 31 December 2018, the subsidiary Secil - Companhia Geral de Cal e Cimento, S.A. partially repaid supplementary capital contributions in the amount of Euro 3,500,000. On 31 December 2018, these supplementary capital contributions amounted to Euro 136,500,000 and did not bear interest.
In 2018, the subsidiary Seinpar Investments, B.V. reimbursed Semapa the remaining share premium in the amount of Euro 27,383,500.
Gains/ (losses) from investments accounted for under the equity method, during the years ended as at 31 December 2018 and 2017, are detailed as follows
Amounts in Euro 2018 2017
Share of profit/ (losses)
Aphelion, S.A. (1 561) (3 126)
ETSA Investimentos, SGPS, S.A. 2 010 903 3 244 649
Secil - Companhia Geral de Cal e Cimento, S.A. (2 637 660) (1 078 160)
Seinpar Investments, B.V. 72 073 129 66 212 031
Seinpart - Participações, SGPS, S.A. (576) (1 176)
Semapa Inversiones, S.L. (6 509) (12 284)
Semapa Next, S.A. 3 034 (3 816)
Seminv - Investimentos, SGPS, S.A. (39 529) (4 909)
The Navigator Company, S.A. 76 440 773 70 238 100
147 842 004 138 591 309

2018
AN
NU
AL R
EPO
RT
290
*07
The detail of Goodwill included in the caption Financial investments — equity method, in 2018 and 2017, is as follows:
Amounts in EuroAcquisition
year 31/12/2018 31/12/2017
Secil - Companhia Geral de Cal e Cimento, S.A. 2012 134 165 305 134 165 305
The Navigator Company, S.A. 2011 40 100 229 40 100 229
174 265 534 174 265 534
As recommended by IAS 36, Goodwill is subject to impairment tests, carried out on a minimum annual basis or when there is evidence of impairment, in accordance with the accounting policy described in Note 3.5.
For the purposes of impairment tests for CGUs, the recoverable amount was determined based on the value in use, in accordance with the discounted cash flow method. The recoverable amount of CGUs is derived from assumptions related to the activity, included sales volumes, average selling prices and variable costs that in the projection periods result from a combination of economic forecasts for the regions and markets where the subsidiaries of Semapa operate, forecasts including alterations in the markets, derived from changes in installed capacity for each operational activity, internal management projections and historical performance.
These projections result from budgets for the following year and estimates of cash flows for a subsequent period of four years reflected, in the approved Medium/Long Term Plans.
Cash flows are discounted at the WACC (Weighted Average Cost of Capital) rates, calculated using the Capital Asset Pricing Model (CAPM) model, and based on weighted average debt and equity costs, estimated according to the segments where the CGU are inserted. The considered risk-free interest rate results from market information on medium-term sovereign debt. The beta and industry leverage are based on information from a broad range of comparable companies subject to annual review. All this information is collected from international and independent sources, among others, through Reuters and rating agencies (S&P, Moody’s and Fitch).
The growth rate in perpetuity reflects the medium/long term management’s view of the different CGUs, taking into account the inflation targets of the respective Central Banks, future inflation rate estimates, macroeconomic outlooks, as well as the foreseeable evolution of the Markets where the Group operates. The sources of macroeconomic forecasts are the IMF and the Banco de Portugal.
The assumptions that were the basis of the business plans are detailed as follows:
Assumptions (CAGR 2019-2023) Pulp and
Paper
Cement and Derivatives
Portugal Tunisia Lebanon Brazil Angola*
Sales in quantity (kt)
Reference UWF Paper Cement and clinker
CAGR Sales in quantity (kt) 0.4% -1.2% 0.5% -2.9% 6.3% 5.4%
Average selling price LC/t
Reference UWF Paper Grey cement in the domestic market
CAGR Average selling price LC/t 0.0% 1.6% 2.8% 1.0% 7.4% 8.9%
Total Cash Costs LC
CAGR Total Cash Costs LC -0.1% 2.3% 1.1% -2.4% 6.4% 7.8%
LC: Local Currency
*: In Angola the CAGR of the Average Selling Price has AOA currency but the CAGR of the Total Cash Costs has USD currency.

2018 ANN
UAL R
EPO
RT
291
*07
Macroeconomic Assumptions
31/12/2018 31/12/2017
2019 2020 2021 2022 2023 2018 2019 2020 2021 2022
Pulp and Paper
Portugal
GDP growth rate 1.9% 1.7% 1.4% 1.4% 1.4% 2.0% 1.8% 1.5% 1.2% 1.2%
Inflation EUR 1.5% 1.4% 1.9% 2.1% 2.1% 1.4% 1.5% 2.2% 2.3% 2.4%
Cement and Derivatives
Portugal
GDP growth rate 1.9% 1.7% 1.4% 1.4% 1.4% 2.0% 1.8% 1.5% 1.2% 1.2%
Inflation EUR 1.5% 1.4% 1.9% 2.1% 2.1% 1.4% 1.5% 2.2% 2.3% 2.4%
The main assumptions of a financial nature, used in the impairment tests, are detailed as follows:
Financial Assumptions
31/12/2018 31/12/2017
Risk free interest
rate* WACC Rate
EUR
Perp. Growth Rate
EUR Tax Rate
Risk free interest
rate* WACC Rate
UR
Perp. Growth Rate
EUR Tax Rate
Pulp and Paper
Portugal
Explicit planning period 1.83% 6.59% - 27.50% 2.34% 6.83% - 27.50%
Perpetuity 1.83% 6.59% 0.00% 27.50% 2.34% 6.83% 0.00% 27.50%
Cement and Derivatives
Portugal
Explicit planning period 1.83% 6.43% - 27.50% 2.34% 6.93% - 27.50%
Perpetuity 1.83% 6.43% 1.35% 27.50% 2.34% 6.93% 2.00% 27.50%
Note: WACC Rate EUR between 7.6% and 11.2% were also considered in Cement and Derivatives for Brazil, Tunisia, Lebanon and Angola
* Includes Country Risk Premium
As a result of the impairment tests performed, no impairment loss was identified in Goodwill.
In addition, sensitivity analyses were carried out on the fundamental assumptions considered in the impairment tests, performed for each of the Cash Generating Units identified, as follows:
• Reduction of free cash flow by 5%, over that used in the base scenario. This sensitivity analysis, performed in-dependently for this assumption, did not determine any impairment for the Goodwill allocated to each CGU; and
• Increase of 50 basis points in the discount rate used in the base scenario. This sensitivity analysis, performed independently for this assumption, did not determine any impairment for Goodwill allocated to each CGU.
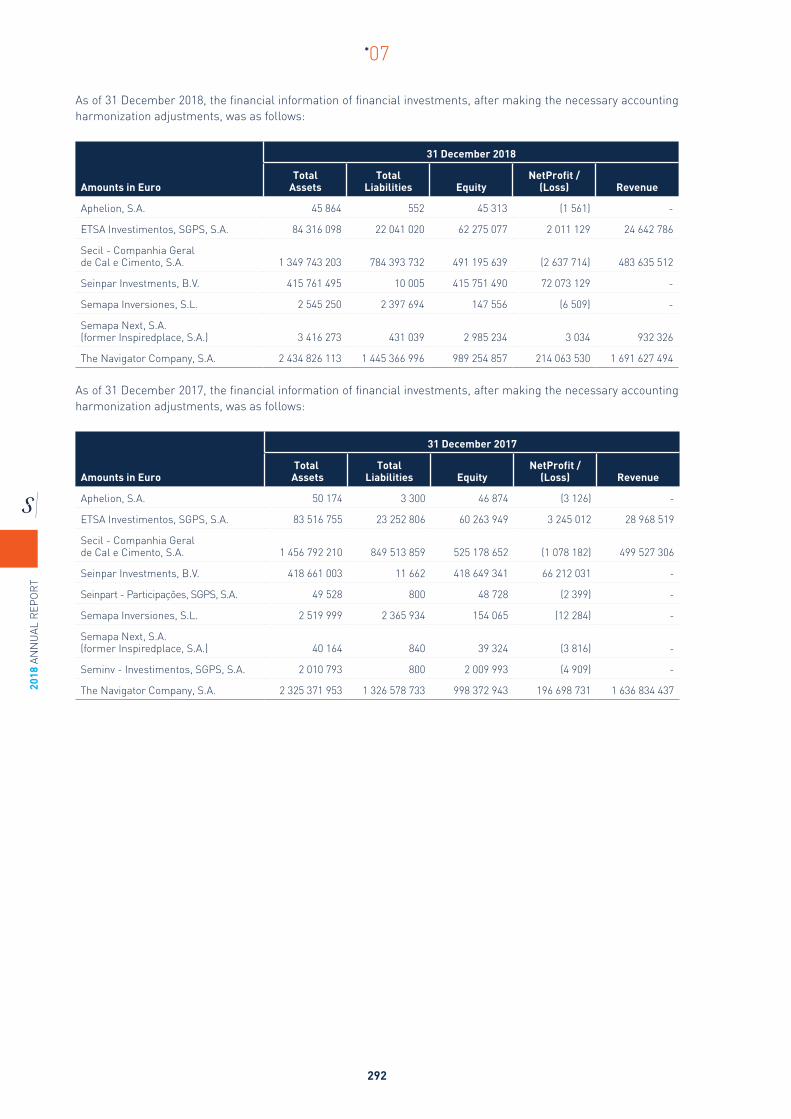
2018
AN
NU
AL R
EPO
RT
292
*07
As of 31 December 2018, the financial information of financial investments, after making the necessary accounting harmonization adjustments, was as follows:
Amounts in Euro
31 December 2018
Total Assets
Total Liabilities Equity
NetProfit / (Loss) Revenue
Aphelion, S.A. 45 864 552 45 313 (1 561) -
ETSA Investimentos, SGPS, S.A. 84 316 098 22 041 020 62 275 077 2 011 129 24 642 786
Secil - Companhia Geral de Cal e Cimento, S.A. 1 349 743 203 784 393 732 491 195 639 (2 637 714) 483 635 512
Seinpar Investments, B.V. 415 761 495 10 005 415 751 490 72 073 129 -
Semapa Inversiones, S.L. 2 545 250 2 397 694 147 556 (6 509) -
Semapa Next, S.A.(former Inspiredplace, S.A.) 3 416 273 431 039 2 985 234 3 034 932 326
The Navigator Company, S.A. 2 434 826 113 1 445 366 996 989 254 857 214 063 530 1 691 627 494
As of 31 December 2017, the financial information of financial investments, after making the necessary accounting harmonization adjustments, was as follows:
Amounts in Euro
31 December 2017
Total Assets
Total Liabilities Equity
NetProfit / (Loss) Revenue
Aphelion, S.A. 50 174 3 300 46 874 (3 126) -
ETSA Investimentos, SGPS, S.A. 83 516 755 23 252 806 60 263 949 3 245 012 28 968 519
Secil - Companhia Geral de Cal e Cimento, S.A. 1 456 792 210 849 513 859 525 178 652 (1 078 182) 499 527 306
Seinpar Investments, B.V. 418 661 003 11 662 418 649 341 66 212 031 -
Seinpart - Participações, SGPS, S.A. 49 528 800 48 728 (2 399) -
Semapa Inversiones, S.L. 2 519 999 2 365 934 154 065 (12 284) -
Semapa Next, S.A. (former Inspiredplace, S.A.) 40 164 840 39 324 (3 816) -
Seminv - Investimentos, SGPS, S.A. 2 010 793 800 2 009 993 (4 909) -
The Navigator Company, S.A. 2 325 371 953 1 326 578 733 998 372 943 196 698 731 1 636 834 437

2018 ANN
UAL R
EPO
RT
293
*07
11 FINANCIAL RESULTSFor the years ended 31 December 2018 and 2017, Financial results are analysed as follows:
Amounts in Euro 2018 2017
Interest and similar income obtained
Interest on financing granted to subsidiaries (Note 25) 40 546 41 894
Interest on other net financial investments 1 133 -
Financial assets at fair value through profit or loss 4 468 -
Other financial assets - Compensation Fund 77 200
Other financial income - 2
46 224 42 096
Interest and similar expense incurred
Interest on loans obtained from credit institutions (5 487 839) (5 838 425)
Interest on loans obtained from shareholders (Note 25) (16 835) (32 103)
Interest on loans obtained from subsidiaries (Note 25) (1 651) (1 861)
Interest on other loans obtained (9 465 728) (9 539 550)
(14 972 053) (15 411 939)
Financial results (14 925 829) (15 369 843)
The caption Interest on other loans obtained refers to the expenses incurred on the loan obligations detailed in Note 21 and the expenses with the issuance of loans which are recognized in accordance with the accounting policy described in Notes 3.13 and 3.14.
12 INCOME TAXSemapa is subject to the special taxation regime for group companies, comprising companies in which the shareholding is equal to or more than 75% and which meet the conditions laid down in articles 69 and following of the Corporate Income Tax (CIT) Code.
As of 31 December 2018, the tax business group led by Semapa as the dominant society comprises Group Secil, and ETSA, as well has all the subsidiaries that meet the legal requirements of the Corporate Income Tax Code.
Companies included within the tax business group, calculate and recognise corporate income tax (CIT) as though they were taxed on an individual basis. However, the liabilities are recognised as due to the dominant entity of the tax business Group, which is responsible for the Group’s overall clearance and payment of the corporate income tax. Where there are gains on the use of this regime, these are recorded in the dominant entity financial statements.
As of 31 December 2018 and 2017, Income tax expense comprises:
Amounts in Euro 2018 2017
Current tax 778 444 80 685
Deferred tax (Note 23) (269 418) 502 075
509 026 582 760

2018
AN
NU
AL R
EPO
RT
294
*07
The reconciliation of the effective tax rate in 2018 and 2017 is as follows:
Amounts in Euro 2018 2017
Profit before tax 132 045 311 123 510 707
Expected tax 29 710 195 27 789 909
Permanent differences (a) (33 260 611) (31 192 432)
CIT from prior years (2 420 280) (1 841 533)
Non-recoverable tax losses 3 819 834 2 900 448
Autonomous taxation 1 641 836 1 760 848
(509 026) (582 760)
Effective tax rate (0.39%) (0.47%)
Effective tax rate without EM effect 41.43% 42.00%
(a) This value essentially refers to:
Amounts in Euro 2018 2017
Effect of application of the equity method (Note 10) (147 842 004) (138 591 309)
Post-employment benefits (Notes 8 and 22) 23 431 23 431
Pensions paid (Note 22) (147 086) (122 180)
Capital gains/ (losses) for tax purposes 30 000 8 831
Capital (gains)/losses for accounting purposes (30 000) (8 831)
Other 140 720 57 027
(147 824 939) (138 633 031)
Tax Effect (22.50%) (33 260 611) (31 192 432)
According to the legislation in force, the gains and losses relating to group and associated companies resulting from the application of the equity method are deducted from or added to, respectively, to the net income of the year for the purpose of calculating taxable income.
13 EARNINGS PER SHAREThere are no convertible financial instruments over Semapa’s shares, so there is no dilution of earnings.
Amounts in Euro 2018 2017
Net profit attributable to the Shareholders of Semapa 132 554 337 124 093 467
Total number of shares issued 81 270 000 81 270 000
Average number of treasury shares in the portfolio (588 174) (586 329)
Weighted average number of shares 80 681 826 80 683 671
Total number of treasury shares as of 31 December 640 666 586 329
Basic earnings per share 1.643 1.538
Diluted earnings per share 1.643 1.538

2018 ANN
UAL R
EPO
RT
295
*07
14 PROPERTY, PLANT AND EQUIPMENTThe following movements were registered in the years ended as of 31 December 2018 and 2017 under the caption Property, plant and equipment, as well as on the respective depreciation and impairment losses accounts:
Amounts in Euro
Buildings and other
constructions
Equipment and Other tangible
assetsAssets under construction Total
Acquisition cost
Balance as of 1 January 2017 1 872 176 1 323 375 104 417 3 299 968
Acquisitions - 29 434 3 875 33 309
Disposals - (17 915) - (17 915)
Transfers - 2 125 (2 125) -
Balance as of 31 December 2017 1 872 176 1 337 019 106 167 3 315 362
Acquisitions - 67 633 352 981 420 614
Disposals - (137 988) - (137 988)
Transfers 3 308 - (3 308) -
Balance as of 31 December 2018 1 875 484 1 266 664 455 840 3 597 988
Accumulated depreciations and impairment losses
Balance as of 1 January 2017 (1 408 048) (1 119 485) (102 292) (2 629 825)
Increases (Note 9) (111 407) (88 248) - (199 655)
Disposals - 6 665 - 6 665
Writte-offs and adjustments - 1 - 1
Balance as of 31 December 2017 (1 519 455) (1 201 067) (102 292) (2 822 814)
Increases (Note 9) (106 311) (84 079) (190 390)
Disposals 137 988 137 988
Writte-offs and adjustments 544 (543) 1
Balance as of 31 December 2018 (1 625 222) (1 147 701) (102 292) (2 875 215)
Book value as of 1 January 2017 464 128 203 890 2 125 670 143
Book value as of 31 December 2017 352 721 135 952 3 875 492 548
Book value as of 31 December 2018 250 262 118 963 353 548 722 773
15 STATE AND OTHER PUBLIC ENTITIESAs of 31 December 2018 and 2017, there were no arrears debts to the State and other public entities.
The balances relating to these entities were as follows:
CURRENT LIABILITIES
Amounts in Euro 31/12/2018 31/12/2017
Corporate Income Tax 386 212 2 518 060
Income tax withholdings 115 415 125 200
Value-added tax 377 147 414 785
Contributions to Social Security 107 766 111 753
Other taxes 523 482
987 063 3 170 280

2018
AN
NU
AL R
EPO
RT
296
*07
As of 31 December 2018 and 2017, the caption Corporate Income tax - CIT is detailed as follows:
Amounts in Euro 31/12/2018 31/12/2017
Corporate Income Tax (1 641 836) (629 591)
Income tax on subsidiaries (RETGS) (2 172 154) (2 859 078)
Payments on account 1 272 894 -
Special payments on account 827 980 682 892
Additional payments on account 1 123 167 67 021
Withholding tax recoverable 18 485 35 444
Income tax recoverable from prior years 185 252 185 252
(386 212) (2 518 060)
16 RECEIVABLES AND OTHER CURRENT ASSETS As of 31 December 2018 and 2017, the caption Receivables and other current assets comprised:
Amounts in Euro 31/12/2018 31/12/2017
Trade payables (debtor balances) 1 134 -
Related Parties (Note 25)
Loans to subsidiaries - 496 301
Current account balances 4 840 747 3 271 196
RETGS operations balances 7 140 656 8 015 760
Bonds Semapa 2014/2019 (treasury) 1 316 496 -
Other debtors - general 63 609 32 724
Expenses to recognise 81 390 124 795
13 444 032 11 940 776
During 2018, Semapa acquired 1,300,000 Treasury bonds from the Semapa 2014/2019 issue, whose maturity and settlement will take place in April 2019. As at 31 December 2018, the Company’s treasury bonds, in the amount of Euro 1,316,496, were valued at amortised cost and the quotation value on NYSE Euronext Lisbon was of Euro 100.20 (Note 21).
As at 31 December 2017, the amount receivable from subsidiary companies in the amount of Euro 496,301 (Note 25), refers to short-term treasury operations that bear interest at market rates, charged on a quarterly basis.
As at 31 December 2018 and 2017, Deferred costs were detailed as follows:
Amounts in Euro 31/12/2018 31/12/2017
Supplies and services 80 800 111 899
Other expenses to recognise 590 12 896
81 390 124 795

2018 ANN
UAL R
EPO
RT
297
*07
17 CASH AND CASH EQUIVALENTSThe caption Cash and Cash equivalents is detailed as follows, for the years ended as at 31 December 2018 and 2017:
Amounts in Euro 31/12/2018 31/12/2017
Cash 4 535 6 137
Bank deposits 101 140 45 335
105 675 51 472
18 SHARE CAPITAL AND TREASURY SHARESAs of 31 December 2018 and 2017, Semapa’s share capital was fully subscribed and paid up, represented by 81,270,000 shares with no nominal value.
During the year ended 31 December 2018, Semapa acquired 54,337 treasury shares in the amount of EUR 704,553.
As of 31 December 2018 and 2017, Semapa holds 640,666 and 586,329 treasury shares, respectively, with a global amount of Euro 6,740,954 and Euro 6,036,401.
The legal persons that held relevant positions in the Company’s share capital as at 31 December 2018 and 2017, are detailed as follows:
Name
31/12/2018 31/12/2017
No. of shares % No. of shares %
Cimo - Gestão de Participações, SGPS, S.A. 38 959 431 47.94 16 734 031 20.59
Longapar, SGPS, S.A. - - 22 225 400 27.35
Sodim, SGPS, S.A. 15 252 726 18.77 15 252 726 18.77
Bestinver Gestión, SGIIC, S.A. 7 166 756 8.82 7 166 756 8.82
Cimigest, SGPS, S.A. 3 185 019 3.92 3 185 019 3.92
Santander Asset Management España, S.A. 1 981 216 2.44 1 981 216 2.44
Norges Bank (the Central Bank of Norway) 1 699 613 2.09 - -
Sociedade Agrícola da Quinta da Vialonga, S.A. 625 199 0.77 625 199 0.77
Treasury shares 640 666 0.79 586 329 0.72
Other shareholders with less than 2% participation 11 759 374 14.47 13 513 324 16.63
81 270 000 100.00 81 270 000 100.00
19 RESERVES AND RETAINED EARNINGSLEGAL RESERVES Commercial Company law prescribes that at least 5% of annual net profit must be transferred to the legal reserve, until this is equal to at least 20% of the issued capital, which is verified as of 31 December 2018 and 2017.
This reserve cannot be distributed, unless the Company is liquidated. However, it may be used to absorb losses after the other reserves have been exhausted or it can be incorporated in the share capital.

2018
AN
NU
AL R
EPO
RT
298
*07
OTHER RESERVESThis caption corresponds to reserves available for distribution to shareholders that were constituted through the appropriation of prior year’s earnings.
RETAINED EARNINGS
INCREASE AND DECREASE IN THE INTEREST HELD IN SUBSIDIARY COMPANIES WITHOUT LOSS OF CONTROLSemapa records in this caption the differences between the group share of net assets acquired/disposed of and the acquisition/disposal price to non-controlling interest of already controlled entities.
ACTUARIAL GAINS AND LOSSESActuarial deviations, resulting from differences between the assumptions used to calculate post-employment benefit liabilities and what actually occurred, as well as changes made in them, are recorded under this caption, as described in Note 3.16.
APPLICATION OF THE NET PROFITFollowing the Annual General Meetings held on 24 May 2018 and 25 May 2017, the net profits for 2017 and 2016, respectively, had the following application:
Amounts in Euro
Application of the profit for
2017 2016
Distribution of dividends 41 310 039 36 307 652
Bonus to employees 3 615 516 3 509 978
Other reserves 79 167 912 49 703 273
Net profit for the year (2016: SNC) 124 093 467 89 520 903
Impact of conversion to IFRS 25 341 909
Net profit for the year (IFRS) 124 093 467 114 862 812
Dividends per outstanding share 0.512 0.450
ADJUSTMENTS IN FINANCIAL ASSETSThis caption shows the adjustments arising from the application of the equity method in subsidiaries.
As of 31 December 2018 and 2017, the caption Adjustments in financial assets is broken down as follows:
Amounts in Euro 31/12/2018 31/12/2017
ETSA Investimentos, SGPS, S.A. (9 227 390) (9 227 390)
Secil - Companhia Geral de Cal e Cimento, S.A. (194 367 627) (166 522 899)
Seinpar Investments, B.V. (35 600 253) (27 962 773)
Seinpart - Participações, SGPS, S.A. - 35 857 480
Semapa Inversiones, S.L. (36 764 962) (36 764 962)
Semapa Next, S.A. (7 123) -
Seminv - Investimentos, SGPS, S.A. - 9 417 498
The Navigator Company, S.A. (37 651 787) (29 557 444)
(313 619 142) (224 760 490)

2018 ANN
UAL R
EPO
RT
299
*07
The caption Adjustments in financial assets recorded the following movements in the year ended at 31 December 2018 and 2017:
Amounts in Euro 31/12/2018 31/12/2017
Opening balance (224 760 490) (163 148 442)
Adjustments included in Comprehensive Income
Items that may be reclassified to the income statement
Fair value of financial instruments (1 895 544) 3 962 339
Currency conversion reserve (29 484 174) (68 205 576)
(31 379 718) (64 243 237)
Items that may not be reclassified to the income statement
Actuarial gains/ (losses) (9 598 687) 2 956 333
Exchange differences on equity instruments (7 123) -
(9 605 810) 2 956 333
Adjustments not included in Comprehensive Income
Intra-group acquisition differences of share capital 62 089 (200)
Initial impact of IFRS 9 adoption (2 677 546) -
Other movements 17 304 (324 944)
(2 598 153) (325 144)
Transfers and ajustments
Disposal of subsidiaries transfered to retained earnings:
Seinpart - Participações, SGPS, S.A. (35 857 480) -
Seminv - Investimentos, SGPS, S.A. (9 417 491) -
(45 274 971) -
Closing balance (313 619 142) (224 760 490)
20 PROVISIONSAs of 31 December 2018 and 2017, provisions amounted to Euro 12,800,000 and refer to provisions to cover risks related to events/disputes of a fiscal nature, the resolution of which may result in outflows of cash.
21 INTEREST-BEARING LIABILITIESDuring the years ended 31 December 2018 and 2017, the interest-bearing net debt is detailed as follows:
Amounts in Euro 31/12/2018 31/12/2017
Interest-bearing debt
Non-current 318 283 541 530 251 661
Current 154 409 411 22 163 771
472 692 952 552 415 432
Cash and cash equivalents (Note 17)
Cash 4 535 6 137
Bank deposits 101 140 45 335
105 675 51 472
Interest-bearing net debt 472 587 277 552 363 960

2018
AN
NU
AL R
EPO
RT
300
*07
NON-CURRENT INTEREST-BEARING LIABILITIESAs of 31 December 2018 and 2017, non-current interest-bearing liabilities were as follows:
Amounts in Euro 31/12/2018 31/12/2017
Non-current
Bond loans 180 000 000 330 000 000
Commercial paper 90 300 000 153 250 000
Bank loans 50 000 000 50 000 000
Loans-related charges (2 016 459) (2 998 339)
Total non-current interest-bearing debt 318 283 541 530 251 661
BOND LOANSAs of 31 December 2018 and 2017, non-current bond loans were as follows:
Amounts in Euro 31/12/2018 31/12/2017 Maturity Interest ratePrice
31-12-2018
Non-current loans
Semapa 2014 / 2019 150 000 000 April 2019 Variable rate
indexed to Euribor 100.20
Semapa 2014 / 2020 80 000 000 80 000 000 November
2020 Variable rate
indexed to Euribor 102.50
Semapa 2016 / 2021 100 000 000 100 000 000 June 2021 Fixed rate n.a.
180 000 000 330 000 000
The fair value of the bond loans, taking into account the date and respective contractual conditions, determined according to level 2 of the fair value hierarchy, does not differ substantially from the reported book value.

2018 ANN
UAL R
EPO
RT
301
*07
COMMERCIAL PAPERAs of 31 December 2018 and 2017, the non-current Commercial Paper Programs are detailed as follows:
31/12/2018Amounts in Euro
Amount used
Interestrate
Contractedamount
Non-current
Maturitydate
Commercial Paper Program 100M 100 000 000 - November
2020 Variable rate indexed to Euribor
Commercial Paper Program 40M 40 000 000 - August 2021 Variable rate indexed to Euribor
Commercial Paper Program 100M 100 000 000 25 300 000 September
2021 Variable rate indexed to Euribor
Commercial Paper Program 25M 25 000 000 25 000 000 February
2022 Variable rate indexed to Euribor
Commercial Paper Program 50M 50 000 000 40 000 000 October
2023 Variable rate indexed to Euribor
Total 315 000 000 90 300 000
31/12/2017Amounts in Euro
Amount used
Interestrate
Contractedamount
Non-current
Maturitydate
Commercial Paper Program 120M 120 000 000 - December
2018 Variable rate indexed to Euribor
Commercial Paper Program 25M 25 000 000 25 000 000 February
2019 Variable rate indexed to Euribor
Commercial Paper Program 100M 100 000 000 - November
2020 Variable rate indexed to Euribor
Commercial Paper Program 40M 40 000 000 - August 2021 Variable rate indexed to Euribor
Commercial Paper Program 100M 100 000 000 88 250 000 September
2021 Variable rate indexed to Euribor
Commercial Paper Program 50M 50 000 000 40 000 000 October
2023 Variable rate indexed to Euribor
Total 435 000 000 153 250 000
MATURITY FOR LOAN REPAYMENTSThe reimbursement terms relating to the bond loans, commercial paper, bank loans and other non-current loans is detailed as follows:
Amounts in Euro 31/12/2018 31/12/2017
1 to 2 years 100 500 000 175 000 000
2 to 3 years 45 800 000 100 500 000
3 to 4 years 45 500 000 108 750 000
4 to 5 years 128 500 000 20 500 000
Above 5 years - 128 500 000
320 300 000 533 250 000

2018
AN
NU
AL R
EPO
RT
302
*07
CURRENT INTEREST-BEARING LIABILITIESAs of 31 December 2018 and 2017, current interest-bearing liabilities were as follows:
Amounts in Euro 31/12/2018 31/12/2017
Current
Bond loans 150 000 000 -
Bank loans - 17 500 000
Interest-bearing debt 150 000 000 17 500 000
Short-term shareholder loans (Note 25) 3 209 343 4 470 475
Short-term loans from subsidiaries (Note 25) 1 200 068 193 296
Other interest-bearing debt 4 409 411 4 663 771
Total current interest-bearing debt 154 409 411 22 163 771
The evolution of Semapa’s net debt, for the years ended as at 31 December 2018 and 2017, is as follows:
Amounts in Euro 31/12/2018 31/12/2017
Balance as of 1 January 552 363 960 687 629 885
Interest paid 16 183 082 14 993 286
Interest received (44 335) (42 082)
Dividends paid (Note 19) 41 310 039 36 307 652
Dividends received (Note 10) (113 329 771) (89 273 685)
Net payments/ (receipts) related to Financial assets and other 422 830 (18 366)
Net payments/ (receipts) related to Financial investments (26 609 249) (84 060 000)
Payments related to acquisition of Treasury shares 704 553 -
Payments/ (Receipts) related to loans granted to subsidiaries (496 301) (3 045 415)
Net payments/ (receipts) related to operating activities 1 092 499 (10 414 057)
Capitalising interest from loans of subsidiaries and shareholders 8 090 18 719
Charges with the issuance of loans 981 880 268 023
Net debt variation (79 776 683) (135 265 925)
Net debt as of 31 December 472 587 277 552 363 960
The evolution of the interest-bearing net debt of Semapa, for the years ended as at 31 December 2018 and 2017, is as follows:
Amounts in Euro 31/12/2018 31/12/2017
Balance as of 1 January 552 415 432 687 674 071
Receipt from loans obtained 1 653 713 000 2 437 653 187
Loans reimbursement (1 734 425 450) (2 573 198 568)
Loans flow (80 712 450) (135 545 381)
Capitalising interest 8 090 18 719
Charges with the issuance of loans 981 880 268 023
Net debt variation (79 722 480) (135 258 639)
Net debt as of 31 December 472 692 952 552 415 432
FINANCIAL COVENANTS Para determinado tipo de operações de financiamento existem compromissos de manutenção de certos rácios For certain types of financing operations, there are commitments to maintain certain financial ratios within previously negotiated limits. The existing covenants are clauses of Cross default, Pari Passu, Negative pledge, Ownership-

2018 ANN
UAL R
EPO
RT
303
*07
clause, maintenance of financial ratios namely Net Debt/EBITDA and Financial autonomy and fulfilment of regular financial contracts’ obligations (operational, legal and tax obligations), common in loan agreements and fully known in the market.
Additionally, as of 31 December 2018 and 2017, Semapa complies with the financial ratios limits imposed under its financing contracts.
22 PENSIONS AND OTHER POST-EMPLOYMENT BENEFITSAs of 31 December 2018 and 2017, the amount of the liability reflected in the statement of financial position, under the caption Responsibilities for post-employment benefits, corresponds to Semapa’s responsibility regarding a single beneficiary, who did not adhere to the revocation of the pension plan of the Board of Directors of Semapa, which occurred in December 2012, and this liability amounted to Euro 1,115,990 (31 December 2017: Euro 1,239,645).
The Company’s liabilities, for the year ended as at 31 December 2018 and 2017, were as follows:
Amounts in Euro 31/12/2018 31/12/2017
Liabilities at the beginning of the year 1 239 645 1 232 653
Period variations:
Net interest (Note 7) 23 431 23 431
Actuarial (gains)/ losses - 105 741
Pensions paid in the period (147 086) (122 180)
Liabilities at the end of the year 1 115 990 1 239 645
The actuarial calculation considers the following financial and demographic assumptions:
Amounts in Euro 31/12/2018 31/12/2017
Mortality table TV 88/90 TV 88/90
Disability table EKV 80 EKV 80
Pension growth rate 1.00% 1.00%
Technical interest rate 2.00% 2.00%
Yield rates 2.00% 2.00%
Wage growth rate 1.00% 1.00%
Pension reversibility rate 50% 50%
Number of Semapa complement annual payments 12 12
Social Security Benefits FormulaDecree-Law no.
187/2007 of 10 MayDecree-Law no.
187/2007 of 10 May
23 DEFERRED TAXESIn 2018, the changes in deferred taxes assets and liabilities were as follows:
Amounts in Euro 1 January
2018
Income Statement 31 December
2018 Increases Decreases
Temporary differences that give rise to deferred tax liabilities
Reportable intra-group tax losses (2 909 114) - 2 463 664 (445 450)
Reportable intra-group tax benefits - (1 229 931) 443 144 (786 787)
(6 463 678) (1 229 931) 2 906 808 (1 232 237)
Deferred tax liabilities (610 914) (1 229 931) 960 513 (880 331)

2018
AN
NU
AL R
EPO
RT
304
*07
In 2017, the changes in deferred taxes assets and liabilities were as follows:
Amounts in Euro 1 January 2017
Income Statement
31 December 2017 Increases
Temporary differences that give rise to deferred tax liabilities
Reportable intra-group tax losses (5 924 974) 3 015 860 (2 909 114)
Deferred tax liabities (1 357 372) 502 075 (610 914)
As mentioned in Note 12, companies included in RETGS calculate and record income tax as if they were taxed on an individual basis. Thus and in accordance with current accounting standards (Note 3.8), the Company records deferred tax liabilities on tax losses and tax benefits to subsidiaries within RETGS, which are reportable intra-group, whenever their future use is expected by these same subsidiaries on an individual basis.
As of 31 December 2018 and 2017, the amounts of tax losses carried forward available for future use, within the scope of the RETGS of Semapa, for which no deferred tax assets were recognised in these separate financial statements as their recognition and/or recoverability conditions were not guaranteed, amounted to Euro 337,514,599 and Euro 314,408,181, respectively. These losses have the following maturities:
Total 2025 2026 2027 2028
Reportable intra-group tax losses 337 514 599 216 909 597 - 117 075 386 3 529 616

2018 ANN
UAL R
EPO
RT
305
*07
24 PAYABLES AND OTHER LIABILITIESAs of 31 December 2018 and 2017, the caption Payables and other liabilities comprised:
Amounts in Euro 31/12/2018 31/12/2017
Related Parties (Note 25)
Trade payables 1 161 650 20 232
Current account balances 107 1 961 079
RETGS operations balances 2 683 455 1 818 736
Other trade payables and other liabilities 91 929 58 508
Fixed assets suppliers 27 038 29 975
Consultants and Advisors 30 573 39 660
Other creditors 920 -
Accrued costs 6 864 222 7 363 634
10 859 894 11 291 824
As of 31 December 2018 and 2017, the caption Accrued costs comprised:
Amounts in Euro 31/12/2018 31/12/2017
Payroll costs 4 303 238 4 734 672
Interest payable 2 144 066 2 300 853
Stamp duty 21 464 19 418
Bank services 283 469 251 628
Supplies and services 106 193 57 063
Other 5 792 -
6 864 222 7 363 634

2018
AN
NU
AL R
EPO
RT
306
*07
25 BALANCES AND TRANSACTIONS WITH RELATED PARTIESAs of 31 December 2018, balances with related parties are detailed as follows:
Amounts in Euro
Assets Liabilities
RETGS Other Receivables
(Note 16)
Other Receivables
(Note 16)
Trade Suppliers (Note 24)
Interest-bearing
Liabilities (Note 21)
RETGS Accounts
Payable (Note 24)
Payables and Other liabilities (Note 24)
Shareholders
Cimigest, SGPS, S.A. - 5 691 - - -
Cimo - Gestão de Participações, SGPS, S.A. - - - 3 209 343 - -
Sodim, SGPS, S.A. - 520 - - - -
- 6 211 - 3 209 343 - -
Subsidiaries
Abapor - Comércio e Indústria de Carnes, S.A. - 59 932 - - 14 879 -
About The Future - Empresa Produtora de Papel, S.A. 894 938 - - - - -
Aboutbalance, SGPS, S.A. - - - - 500 -
Allmicroalgae - Natural Products, S.A. - - - - 1 799 -
Aphelion, S.A. - 275 - 44 853 328 -
Arboser - Serviços Agro-Industriais, S.A. 61 694 - - - - -
Argibetão - Soc. de Novos Prod. de Argila e Betão, S.A. 5 484 - - - - -
Atlantic Forests - Comércio de Madeiras, S.A. 337 - - - - -
Biological - Gestão de Resíduos Industriais, Lda. - 3 931 - - 11 793 -
Ciminpart - Investimentos e Participações, SGPS, S.A. - - - - 6 685 -
CMP - Cimentos Maceira e Pataias, S.A. - 1 294 621 - - 498 723 -
EMA21 - Eng. e Manutenção Industrial Século XXI, S.A. - - - - 7 351 -
Empremédia - Corretores de Seguros, S.A. - - - - 825 -
ETSA Investimentos, SGPS, S.A. - 65 612 - - 61 847 -
ETSA Log, S.A. 25 922 2 205 - - - -
Headbox - Operação e Controlo Industrial, S.A. - 149 - - 12 149 -
Hewbol - SGPS, Lda. - - - - 999 107
ITS - Indústria Transformadora de Subprodutos, S.A. - 98 164 - - 87 433 -
Navigator Added Value, S.A. 27 698 - - - - -
Navigator Floresta, SGPS, S.A. - - - - 500 -
Navigator Forest Portugal, S.A. - - - - 904 -
Navigator Lusa, Unipessoal, Lda. 4 712 - - - - -
Navigator Paper Setúbal, S.A. 342 917 - - - - -
Navigator Pulp Cacia, S.A. 359 456 - - - - -
Navigator Pulp Figueira, S.A. 1 851 898 - - - - -
Navigator Pulp Holding, SGPS, S.A. - - - - 243 411 -
Navigator Pulp Setúbal, S.A. - - - - 484 -
Navigator Tissue Ródão, S.A. - - - - 26 520 -
Sebol - Comércio e Indústria de Sebo, S.A. - 64 581 - - 212 572 -
Secil - Britas, S.A. - 117 051 - - 325 368 -
Secil - Companhia Geral de Cal e Cimento, S.A. 368 415 115 816 - - - -
Secil Brands - Marketing, Publicidade, Gestão e Desenvolv. de Marcas, Lda. - - - - 1 880 -
Secil Martingança - Aglomerantes e Novos Materiais para a Construção, S.A. - 147 234 - - 398 319 -

2018 ANN
UAL R
EPO
RT
307
*07
Amounts in Euro
Assets Liabilities
RETGS Other Receivables
(Note 16)
Other Receivables
(Note 16)
Trade Suppliers (Note 24)
Interest-bearing
Liabilities (Note 21)
RETGS Accounts
Payable (Note 24)
Payables and Other liabilities (Note 24)
Semapa Inversiones, S.L. - - - 119 009 - -
Semapa Next (ex. Inspiredplace, S.A.) - 4 338 1 146 761 1 036 206 2 921 -
Serife - Soc. de Estudos e Realizações Industriais e de Fornec. de Equip., Lda. - - - - 3 178 -
Sociedade de Vinhos da Herdade de Espirra - Produção e Com. de Vinhos, S.A. - - - - 610 -
SPCG - Sociedade Portuguesa de Co-Geração Eléctrica, S.A. - - - - 35 -
The Navigator Company, S.A. 2 851 033 2 647 383 - - - -
Unibetão - Indústrias de Betão Preparado, S.A. - 212 949 - - 758 264 -
Uniconcreto - Betão Pronto, S.A. - - - - 3 178 -
Viveiros Aliança - Empresa Produtora de Plantas, S.A. 345 454 - - - - -
7 140 656 4 834 241 1 146 761 1 200 068 2 683 455 107
Other companies
Hotel Ritz, S.A. - - 10 887 - - -
Sociedade Agrícola da Herdade dos Fidalgos, Unipessoal, Lda. - - 1 482 - - -
Sonagi - Imobiliária, S.A. (former Cimilonga - Imobiliária, S.A.) - - 2 520 - - -
Sonagi, SGPS, S.A. - 295 - - - -
- 295 14 889 - - -
Total 7 140 656 4 840 747 1 161 650 4 409 411 2 683 455 107

2018
AN
NU
AL R
EPO
RT
308
*07
As of 31 December 2017, balances with related parties are detailed as follows:
Amounts in Euro
Assets Liabilities
RETGS Other Receivables
(Note 16)
Loans to Subsidiaries
(Note 16)
Other Receivables
(Note 16)Suppliers (Note 24)
Interest-bearing
Liabilities (Note 21)
RETGS Accounts
Payable (Note 24)
Payables and Other Liabilities (Note 24)
Shareholders
Cimigest, SGPS, S.A. - - 2 763 3 242 - -
Cimo - Gestão de Participações, SGPS, S.A. - - 105 - 4 433 589 - -
Longapar, SGPS, S.A. - - - - 36 886 - -
- - 2 868 3 242 4 470 475 - -
Subsidiaries
Abapor - Comércio e Indústria de Carnes, S.A. 18 715 - 628 - - - -
About The Future - Empresa Produtora de Papel, S.A. 894 938 - - - - - 33
Aboutbalance, SGPS, S.A. - - - - - 500 -
Allmicroalgae - Natural Products, S.A. - - 425 - - 1 401 -
Aphelion, S.A. - - - - 49 574 - -
Arboser - Serviços Agro-Industriais, S.A. 61 694 - - - - - -
Argibetão - Soc. de Novos Prod. de Argila e Betão, S.A. 6 006 - 6 432 - - - -
Atlantic Forests - Comércio de Madeiras, S.A. 337 - - - - - -
Biological - Gestão de Resíduos Industriais, Lda. 5 555 - - - - - -
Ciminpart - Investimentos e Participações, SGPS, S.A. 897 911 - 57 463 - - - -
CMP - Cimentos Maceira e Pataias, S.A. - - 1 672 143 - - 872 003 -
EMA21 - Eng. e Manutenção Industrial Século XXI, S.A. - - - - - 7 351 -
Empremédia - Corretores de Seguros, S.A. - - - - - 825 -
ETSA Investimentos, SGPS, S.A. - 496 301 30 779 - - 79 849 3 669
ETSA Log, S.A. - - 112 - - 45 992 -
Headbox - Operação e Controlo Industrial, S.A. - - - - - 12 149 -
Hewbol - SGPS, Lda. - - - - - 13 403 107
ITS - Indústria Transformadora de Subprodutos, S.A. 41 874 - 209 - - - -
Lusoinertes, S.A. - - 114 844 - - 190 945 -
Navigator Added Value, S.A. 27 698 - - - - - -
Navigator Floresta, SGPS, S.A. - - - - - 500 -
Navigator Forest Portugal, S.A. - - - - - 904 -
Navigator Lusa, Unipessoal, Lda. 4 712 - - - - - -
Navigator Paper Figueira, S.A. - - 863 015 - - - -
Navigator Paper Setúbal, S.A. 342 917 - - - - - -
Navigator Pulp Cacia, S.A. 359 456 - - - - - -
Navigator Pulp Figueira, S.A. 1 851 898 - - - - - -
Navigator Pulp Holding, SGPS, S.A. - - - - - 243 411 -
Navigator Pulp Setúbal, S.A. - - - - - 484 -
Navigator Tissue Ródão, S.A. - - - - - 26 520 -
Sebol - Comércio e Indústria de Sebo, S.A. - - 262 - - 67 032 -
Secil - Britas, S.A. 101 058 - 21 358 - - - -
Secil - Companhia Geral de Cal e Cimento, S.A. 203 806 - 358 303 - - - -
Secil Brands - Marketing, Publicidade, Gestão e Desenvolv. de Marcas, Lda. - - 420 - - 2 357 -
Secil Martingança - Aglomerantes e Novos Materiais para a Construção, S.A. - - 72 844 - - 144 420 -
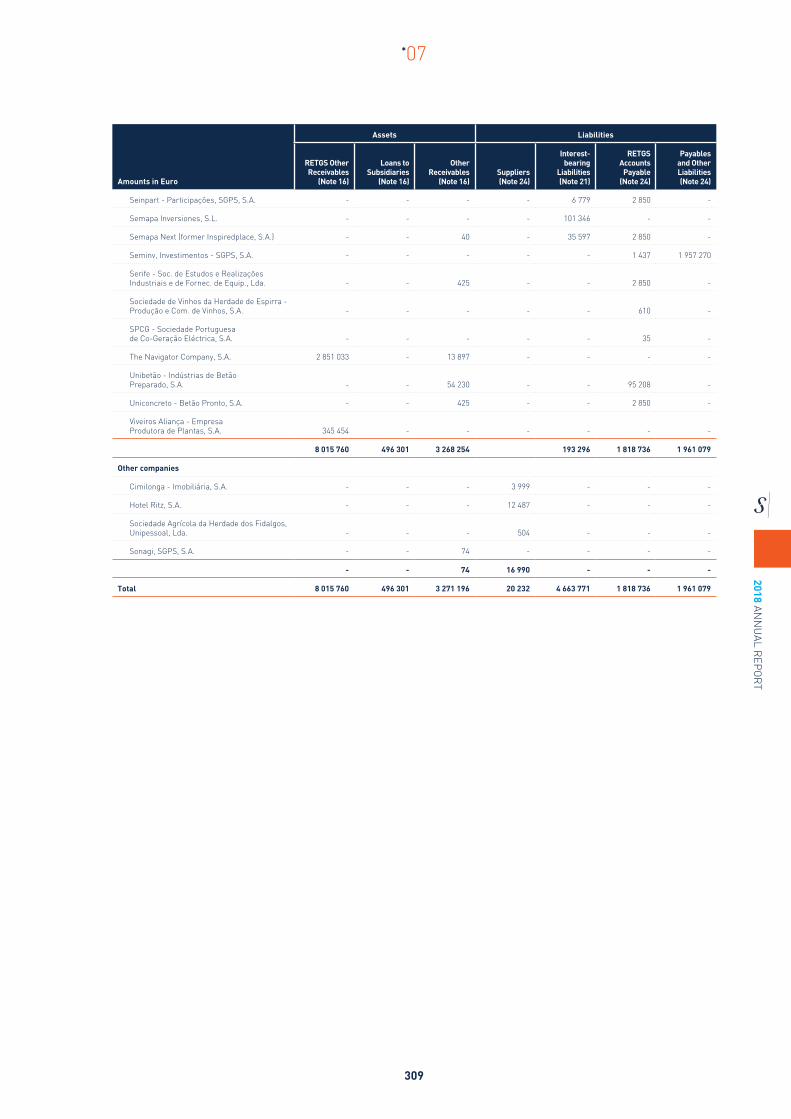
2018 ANN
UAL R
EPO
RT
309
*07
Amounts in Euro
Assets Liabilities
RETGS Other Receivables
(Note 16)
Loans to Subsidiaries
(Note 16)
Other Receivables
(Note 16)Suppliers (Note 24)
Interest-bearing
Liabilities (Note 21)
RETGS Accounts
Payable (Note 24)
Payables and Other Liabilities (Note 24)
Seinpart - Participações, SGPS, S.A. - - - - 6 779 2 850 -
Semapa Inversiones, S.L. - - - - 101 346 - -
Semapa Next (former Inspiredplace, S.A.) - - 40 - 35 597 2 850 -
Seminv, Investimentos - SGPS, S.A. - - - - - 1 437 1 957 270
Serife - Soc. de Estudos e Realizações Industriais e de Fornec. de Equip., Lda. - - 425 - - 2 850 -
Sociedade de Vinhos da Herdade de Espirra - Produção e Com. de Vinhos, S.A. - - - - - 610 -
SPCG - Sociedade Portuguesa de Co-Geração Eléctrica, S.A. - - - - - 35 -
The Navigator Company, S.A. 2 851 033 - 13 897 - - - -
Unibetão - Indústrias de Betão Preparado, S.A. - - 54 230 - - 95 208 -
Uniconcreto - Betão Pronto, S.A. - - 425 - - 2 850 -
Viveiros Aliança - Empresa Produtora de Plantas, S.A. 345 454 - - - - - -
8 015 760 496 301 3 268 254 193 296 1 818 736 1 961 079
Other companies
Cimilonga - Imobiliária, S.A. - - - 3 999 - - -
Hotel Ritz, S.A. - - - 12 487 - - -
Sociedade Agrícola da Herdade dos Fidalgos, Unipessoal, Lda. - - - 504 - - -
Sonagi, SGPS, S.A. - - 74 - - - -
- - 74 16 990 - - -
Total 8 015 760 496 301 3 271 196 20 232 4 663 771 1 818 736 1 961 079

2018
AN
NU
AL R
EPO
RT
310
*07
As of 31 December 2018, the balances receivable and payable to the subsidiaries included in the tax group, related to RETGS operations, are as follows:
Amounts in Euro
31/12/2018
Debtor Creditor
RETGS
Income tax on subsidiaries 803 184 (1 220 132)
CIT Receivables (395 849) 3 599 397
Withholding tax recoverable (7 516) 10 899
CIT from prior years 6 740 837 293 291
7 140 656 2 683 455
As of 31 December 2017, the balances receivable and payable to the subsidiaries included in the tax group, related to RETGS operations, are as follows:
Amounts in Euro
31/12/2017
Debtor Creditor
RETGS
Income tax on subsidiaries 2 535 223 (324 105)
CIT Receivables (1 244 777) 1 829 123
Withholding tax recoverable (15 523) 20 171
CIT from prior years 6 740 837 293 547
8 015 760 1 818 736

2018 ANN
UAL R
EPO
RT
311
*07
As of 31 December 2018, transactions with related parties are as follow:
Amounts in Euro
Sales and services
rendered (Note 4)
Additional income
Interest and other income
(Note 11)
Interest and other expenses (Note 11)
Purchase of goods and
Acquisition of investments
(Note 10)
Shareholders
Cimigest, SGPS, S.A. - - - - (107 740) -
Cimo - Gestão de Participações, SGPS, S.A. - - - (14 958) - -
Sodim, SGPS, S.A. - 423 - (1 877) - -
- 423 - (16 835) (107 740) -
Subsidiaries
Aphelion, S.A. - - - (280) - -
CMP - Cimentos Maceira e Pataias, S.A. 3 984 459 - - - - -
ETSA Investimentos, SGPS, S.A. 275 110 2 820 121 - - -
Navigator Paper Figueira, S.A. (236 314) - - - - -
Secil - Companhia Geral de Cal e Cimento, S.A. - 10 434 40 425 - - -
Semapa Inversiones, S.L. - - - (262) - 24 251
Semapa Next, S.A. (former Inspiredplace, S.A.) - - - (1 109) (932 326) -
The Navigator Company, S.A. 9 274 577 12 321 - - - -
13 297 832 25 575 40 546 (1 651) (932 326) 24 251
Other companies
Bestweb, Lda. - - - - (42 788) -
CLA - Caldas, Lopes, Almeida & Associados - - - - (36 000) -
Hotel Ritz, S.A. - 134 - - (51 825) -
Salvador Pereira Palha Mendes de Almeida - - - - (65 000) -
Sonagi - Imobiliária, S.A. (former Cimilonga - Imobiliária, S.A.) - 1 274 - - (757 656) -
Sonagi, SGPS, S.A. - 670 - - - -
- 2 078 - - (953 269) -
Total 13 297 832 28 076 40 546 (18 486) (1 993 335) 24 251

2018
AN
NU
AL R
EPO
RT
312
*07
As of 31 December 2017, transactions with related parties are as follow:
Amounts in Euro
Sales and services
rendered (Note 4)
Additional income
Interest and other income
(Note 11)
Interest and other expenses (Note 11)
Purchase of goods and
services
Shareholders
Cimigest, SGPS, S.A. - 15 596 - (1 547) (107 740)
Cimo - Gestão de Participações, SGPS, S.A. - - - (23 863) -
Longapar, SGPS, S.A. - - - (1 095) -
OEM - Organização de Empresas, SGPS, S.A. - - - (5 598) -
Sodim, SGPS, S.A. - 423 - - -
- 16 019 - (32 103) (107 740)
Subsidiaries
Abapor - Comércio e Indústria de Carnes, S.A. - - 2 553 - -
Aphelion, S.A. - - - (574) -
Biological - Gestão de Resíduos Industriais, Lda. - - 3 - -
CMP - Cimentos Maceira e Pataias, S.A. 4 337 707 - - - -
ETSA Investimentos, SGPS, S.A. 269 896 2 820 32 966 - -
ETSA Log, S.A. - - 454 - -
ITS - Indústria Transformadora de Subprodutos, S.A. - - 852 - -
Navigator Paper Figueira, S.A. 8 429 492 2 721 - - -
Sebol - Comércio e Indústria de Sebo, S.A. - - 1 065 - -
Secil - Companhia Geral de Cal e Cimento, S.A. - 10 434 3 733 - -
Seinpar Investments, B.V. - - 268 - -
Seinpart - Participações, SGPS, S.A. - - - (30) -
Semapa Inversiones, S.L. - - - (548) -
Semapa Next, S.A. (former Inspiredplace, S.A.) - - - (709) -
The Navigator Company, S.A. - 13 429 - - -
13 037 095 29 404 41 894 (1 861) -
Other companies
Bestweb, Lda. - - - - (39 786)
Cimilonga - Imobiliária, S.A. - - - - (758 065)
Hotel Ritz, S.A. - 1 600 - - (44 104)
Refundos, SGFII, S.A. - 420 - - -
Salvador Pereira Palha Mendes de Almeida - - - - (55 000)
Sonagi, SGPS, S.A. - 4 327 - - -
- 6 347 - - (896 955)
Total 13 037 095 51 770 41 894 (33 964) (1 004 695)
In previous years, lease agreements were signed between Semapa and Sonagi - Imobiliária, S.A., (former Cimilonga – Imobiliária, S.A.) relating to the lease of several office floors in the building which it owns and operates the headquarters of Semapa, at Av. Fontes Pereira de Melo, No. 14, in Lisbon.
As of 31 December 2018 and 2017, financing obtained from shareholders and subsidiaries refers to short-term treasury operations that bear interest at market rates, charged on a quarterly basis.

2018 ANN
UAL R
EPO
RT
313
*07
Remunerations of the statutory bodies, including the management bonus for the years ended as at 31 December 2018 and 2017, was as follows:
Amounts in Euro 2018 2017
Board of Directors
Remunerations 2 723 277 2 735 458
Management Fees 2 926 811 3 157 816
Audit Board and other Corporate bodies 74 735 73 000
Impact on profit/ (loss) for the year (Note 7) 5 724 823 5 966 274
As of 31 December 2018 and 2017, there were no: i) any additional liabilities related to other long-term benefits; (ii) termination benefits; iii) share-based payments attributed or iv) any outstanding balances relating to members of the Board of Directors of Semapa .
All details of the remuneration policy of the members of the Board of Directors of Semapa are detailed in the Company’s Corporate Governance Report, Part I — Section D and Annex II.
26 AUDIT FEESIn the years ended 31 December 2018 and 2017, the fees invoiced to Semapa relating to statutory audit and other services were as follows:
Amounts in Euro 2018 % 2017 %
Statutory audit and audit services 12 731 74% 34 765 100%
Other reliability assurance services 4 500 26% - -
Total 17 231 100% 34 765 100%
In 2018, the previous Statutory Auditor, PwC also invoiced fees in the amount of EUR 17,382 regarding the Statutory Audit for the year of 2017.
The Board of Directors believes there are adequate procedures safeguarding the independence of auditors, through the Audit Board process analysis of the work proposed and careful definition of the work to be performed by the auditors.
27 COMMITMENTSAs of 31 December 2018 and 2017, the commitments assumed by Semapa with operating leases, including interest and non-deductible VAT, are detailed as follows:
Amounts in Euro 31/12/2018 31/12/2017
Less than 1 year * 573 963 547 803
1 to 2 years 150 131 141 013
2 to 3 years 101 361 88 345
3 to 4 years 59 333 44 710
4 to 5 years 12 907 11 759
Total commitments 897 695 833 630
Expenses recognised in the year * 951 164 925 830
* includes expenses with real estate leases

2018
AN
NU
AL R
EPO
RT
314
*07
On 31 December 2018, the updated amount of non-cancellable operating lease commitments amounts to Euro 686,500.
On 1 January 2019, the estimated impact of the adoption of IFRS 16 on assets under operating leases as of 31 December 2018 is as follows:
Amounts in EuroAssets and Liabilities
01.01.2019
Vehicles 358 960
28 FINANCIAL ASSETS AND LIABILITIESIn January 2019, Semapa - Sociedade de Investimento e Gestão, SGPS, S.A. acquired 27,874 treasury shares, holding 0.82% of its share capital.
31 December 2018 Amounts in Euro
FA measured at amortised cost
Notes 16 and 17FA/FL at fair value
through profit or loss
FL measured at amortised cost
Notes 21 and 24
Assets
Equity instruments at fair value - 10 372 -
Other non-current financial assets
Work Compensation Fund - 15 339 -
Other current receivables 13 444 032 - -
Cash and cash equivalents 105 675 - -
Total Assets 13 575 418 25 711 -
Liabilities
Non-current financial liabilities - - 318 283 541
Current financial liabilities - - 154 409 411
Other current payables - - 10 859 894
Total Liabilities - - 483 552 846
FA - Financial Assets / FL - Financial Liabilities
31 December 2017 Amounts in Euro
FA measured at amortised cost
Notes 16 and 17FA/FL at fair value
through profit or loss
FL measured at amortised cost
Notes 21 and 24
Assets
Non-current financial assets
Work Compensation Fund - 13 673 -
Other current receivables 11 940 776 - -
Cash and cash equivalents 51 472 - -
Total Assets 11 992 248 13 673 -
Liabilities
Non-current financial liabilities - - 530 251 661
Current financial liabilities - - 22 163 771
Other current payables - - 11 291 824
Total Liabilities - - 563 707 256
FA - Financial Assets / FL - Financial Liabilities
2018 ANN
UAL R
EPO
RT
315
*07
29 SUBSEQUENT EVENTSIn January 2019, Semapa - Sociedade de Investimento e Gestão, SGPS, S.A. acquired 27,874 treasury shares, holding 0.82% of its share capital.
30 NOTE ADDED FOR TRANSLATIONThese financial statements are a free translation of the financial statements originally issued in Portuguese in accordance with International Financial Reporting Standards as adopted by the European Union. In the event of discrepancies, the Portuguese language version prevails.
PAULO JORGE MORAIS COSTACERTIFIED ACCOUNTANT
BOARD OF DIRECTORS
CHAIRMANHEINZ PETER ELSTRODT
MEMBERS
JOÃO NUNO DE SOTTOMAYOR PINTO DE CASTELLO BRANCO
JOSÉ MIGUEL PEREIRA GENS PAREDES
PAULO MIGUEL GARCÊS VENTURA
RICARDO MIGUEL DOS SANTOS PACHECO PIRES
ANTÓNIO PEDRO DE CARVALHO VIANA BAPTISTA
CARLOS EDUARDO COELHO ALVES
FILIPA MENDES DE ALMEIDA DE QUEIROZ PEREIRA
FRANCISCO JOSÉ MELO E CASTRO GUEDES
JOSE ANTÓNIO DO PRADO FAY
LUA MÓNICA MENDES DE ALMEIDA DE QUEIROZ PEREIRA
MAFALDA MENDES DE ALMEIDA DE QUEIROZ PEREIRA
VÍTOR MANUEL GALVÃO ROCHA NOVAIS GONÇALVES
VÍTOR PAULO PARANHOS PEREIRA

*08 STATUTORY AUDIT REPORTSEPARATE
2018
AN
NU
AL R
EPO
RT
318
*08
STATUTORY AUDITORS’ REPORT AND AUDITORS’ REPORT(Free translation from a report originally issued in Portuguese language.
In case of doubt the Portuguese version will always prevail.)
REPORT ON THE AUDIT OF THE FINANCIAL STATEMENTSS
OPINION
We have audited the accompanying financial statements of Semapa – Sociedade de Investimento e Gestão, SGPS, S.A. (the Entity), which comprise the separate statement of financial position as at 31 December 2018 (showing a total of Euro 1,389,690,117 and total equity of Euro 890,353,887, including a net profit for the year of Euro 132,554,337), the separate income statement by nature, the separate statement of comprehensive income, the separate statement of changes in equity and the separate statement of cash flows for the year then ended, and the accompanying notes to the financial statements, including a summary of significant accounting policies.
In our opinion, the accompanying financial statements give a true and fair view, in all material respects, of the financial position of Semapa – Sociedade de Investimento e Gestão, SGPS, S.A. as at 31 December 2018 and of its financial performance and its cash flows for the year then ended in accordance with the International Financial Reporting Standards (IFRS) as adopted by the European Union.
BASIS FOR OPINION
We conducted our audit in accordance with International Standards on Auditing (ISA) and further technical and ethical standards and guidelines as issued by Ordem dos Revisores Oficiais de Contas (the Portuguese Institute of Statutory Auditors). Our responsibilities under those standards are further described in the “Auditors’ Responsibilities for the Audit of the Financial Statements” section below. We are independent of the Entity in accordance with the law and we have fulfilled other ethical requirements in accordance with the Ordem dos Revisores Oficiais de Contas’ code of ethics.
We believe that the audit evidence we have obtained is sufficient and appropriate to provide a basis for our opinion.
KEY AUDIT MATTERS
Key audit matters are those matters that, in our professional judgment, were of most significance in our audit of the financial statements of the current year. These matters were addressed in the context of our audit of the financial statements as a whole, and in forming our opinion thereon, and we do not provide a separate opinion on these matters.

2018 ANN
UAL R
EPO
RT
319
*08
VALUATION OF FINANCIAL INVESTMENTS
Information regarding this matter is presented in Notes 3.5 and 3.6 of the summary of the main accounting policies, Note 3.27.1 of Main estimates and judgments and Note 10 of the Financial Statements
THE RISK OUR RESPONSE TO THE IDENTIFIED RISK
The risk assessment over the valuation of Semapa Group’s financial investments requires a high degree of estimation and judgment by the Board of Directors, namely regarding the recoverable amount of investments when there are signs of impairment.
As part of our audit we performed the following procedures, among others:
• We have analysed the budgeting procedures in whi-ch the financial projections are based on, by com-paring the actual performance with estimates per-formed in prior periods, as well as the integrity of the discounted cash flow model;
• We compared the internal and external assump-tions used, such as current business trends, mar-ket performance, inflation, projected economic growth and discount rates and assessed their rea-sonability;
• We performed sensitivity analysis to the robustness of assumptions and forecasts;
• We involved experts in the calculation of the weighted average cost of capital; and,
• We assessed the adequacy of the financial state-ments disclosures regarding impairment tests of financial investments, considering the applicable accounting framework.
RESPONSIBILITIES OF MANAGEMENT AND THE SUPERVISORY BODY FOR THE FINANCIAL STATEMENTS
Management is responsible for:
• the preparation of financial statements that give a true and fair view of the Entity’s financial position, financial performance and the cash flows, in accordance with the International Financial Reporting Standards (IFRS) as adopted by the European Union;
• the preparation of the management report and the corporate governance report in accordance with applicable laws and regulations;
• designing and maintaining an appropriate internal control system to enable the preparation of financial state-ments that are free from material misstatement, whether due to fraud or error;
• the adoption of accounting policies and principles appropriate in the circumstances; and• assessing the Entity’s ability to continue as a going concern, and disclosing, as applicable, the matters that may
cast significant doubt about the Entity’s ability to continue as a going concern.
The supervisory body is responsible for overseeing the Entity’s financial reporting process.
2018
AN
NU
AL R
EPO
RT
320
*08
AUDITOR´S RESPONSIBILITIES FOR THE AUDIT OF THE FINANCIAL STATEMENTS
Our responsibility is to obtain reasonable assurance about whether the financial statements as a whole are free from material misstatements whether due to fraud or error, and to issue an auditors’ report that includes our opinion. Reasonable assurance is a high level of assurance, but is not a guarantee that an audit conducted in accordance with ISAs will always detect a material misstatement when it exists. Misstatements can arise from fraud or error and are considered material if, individually or in the aggregate, they could reasonably be expected to influence the economic decisions of users taken on the basis of these financial statements.
As part of an audit in accordance with ISAs, we exercise professional judgment and maintain professional skepticism throughout the audit. We also:
• identify and assess the risks of material misstatement of the financial statements, whether due to fraud or er-ror, design and perform audit procedures responsive to those risks, and obtain audit evidence that is sufficient and appropriate to provide a basis for our opinion. The risk of not detecting a material misstatement resulting from fraud is higher than for one resulting from error, as fraud may involve collusion, forgery, intentional omis-sions, misrepresentations or the override of internal control;
• obtain an understanding of internal control relevant to the audit in order to design audit procedures that are appropriate in the circumstances, but not for the purpose of expressing an opinion on the effectiveness of the Entity’s internal control;
• evaluate the appropriateness of accounting policies used and the reasonableness of accounting estimates and related disclosures made by management;
• conclude on the appropriateness of management’s use of the going concern basis of accounting and, based on the audit evidence obtained, whether a material uncertainty exists related to events or conditions that may cast significant doubt on the Entity’s ability to continue as a going concern. If we conclude that a material uncer-tainty exists, we are required to draw attention in our auditors’ report to the related disclosures in the financial statements or, if such disclosures are inadequate, to modify our opinion. Our conclusions are based on the audit evidence obtained up to the date of our auditors’ report. However, future events or conditions may cause the Entity to cease to continue as a going concern;
• evaluate the overall presentation, structure and content of the financial statements, including the disclosures, and whether the financial statements represent the underlying transactions and events in a manner that achieves fair presentation;
• communicate with those charged with governance, including the supervisory body, regarding, among other matters, the planned scope and timing of the audit, and significant audit findings including any significant defi-ciencies in internal control that we identify during our audit;
• determine, from the matters communicated with those charged with governance, including the supervisory body, those matters that were of most significance in the audit of the financial statements of the current year and are therefore the key audit matters. We describe these matters in our auditors’ report unless law or regula-tion precludes their public disclosure; and,
• provide the supervisory body with a statement that we have complied with the relevant ethical requirements regarding independence, and communicate all relationships and other matters that may reasonably be thought to bear on our independence, and where applicable, related safeguards.
Our responsibility also includes the verification that the information contained in the management report is consistent with the financial statements, and the verification of the requirements as provided in paragraphs 4 and 5 of Article 451 of the Portuguese Companies’ Code.

2018 ANN
UAL R
EPO
RT
321
*08
REPORT ON OTHER LEGAL AND REGULATORY REQUIREMENTS
On the Management Report
Pursuant to Article 451, paragraph 3-e of the Portuguese Companies’ Code, it is our opinion that the management report was prepared in accordance with the applicable legal and regulatory requirements and the information contained therein is consistent with the audited financial statements and, having regard to our knowledge and assessment of the Entity, we have not identified any material misstatements.
On the Corporate Governance Report
Pursuant to Article 451, paragraph 4, of the Portuguese Companies’ Code, it is our opinion that the corporate governance report includes the information required to the Entity to provide under article 245-A of the Securities Code, and we have not identified any material misstatements on the information provided therein in compliance with paragraphs c), d), f), h), i) and m) of that article.
On the additional matters provided in Article 10 of the Regulation (EU) 537/2014
Pursuant to Article 10 of the Regulation (EU) 537/2014 of the European Parliament and of the Council, of 16 April 2014, and in addition to the key audit matters mentioned above, we also report the following:
• We were first appointed as auditors of the Entity in the shareholders general assembly held on 22 September 2017 for a first mandate from 2018 to 2021.
• Management as confirmed to us that they are not aware of any fraud or suspicion of fraud having occurred that has a material effect on the financial statements. In planning and executing our audit in accordance with ISA we maintained professional skepticism, and we designed audit procedures to respond to the possibility of material misstatement in the financial statements due to fraud. As a result of our work, we have not identified any mate-rial misstatement of the financial statements due to fraud.
• We confirm that the audit opinion we issue is consistent with the additional report that we prepared and deliv-ered to the supervisory body of the Entity on 18 March 2019.
• We declare that we have not provided any prohibited services as described in Article 77, paragraph 8 of the Or-dem dos Revisores Oficiais de Conta’ Statutes, and we have remained independent of the Entity in conducting the audit.
18 March 2019
SIGNED ON THE ORIGINAL
KPMG & ASSOCIADOS -SOCIEDADE DE REVISORES OFICIAIS DE CONTAS, S.A. (N.º 189)representedPAULO ALEXANDRE MARTINS QUINTAS PAIXÃO (ROC N.º 1427)


*09 REPORT AND OPINION OF THE AUDIT BOARD SEPARATE

2018
AN
NU
AL R
EPO
RT
324
*09
REPORT AND OPINION OF THE AUDIT BOARDSEPARATE FINANCIAL STATEMENTS
YEAR 2018
Dear Shareholders,
1. As laid down by law, established in the articles of association and in carrying out the mandate entrusted to us, we hereby deliver our report on the audit activities carried out in 2018 and issue our opinion on the Management Report and the Separate Financial Statements submitted by the Board of Directors of Semapa – Sociedade de Investimento e Gestão, SGPS, S.A., for the year ended 31 December 2018.
2. During the year, we monitored the company’s activity on a regularly basis, with the frequency and to the extent that we deemed appropriate, namely through regular meetings with the Company’s Management and Directors. We oversaw the reviewing of the accounting records and the supporting documents, and the efficacy of the risk man-agement, internal control and audit systems. We ensured compliance with the law and the Articles of Association. We did not run up against any obstacles in the exercise of our duties.
3. We met several times with the Statutory Auditor and the External Auditor, KPMG & Associados, SROC, Lda., to monitor the audits conducted and supervise their independence. We have analysed the legal Accounts Certificate and Audit Report, which merit our agreement.
4. The Audit Board analysed the proposals that were presented to it for non-audit services by the Statutory and Ex-ternal Auditor, having approved those that related with permitted services, did not affect the independence of the Statutory and External Auditor and fulfil the other legal requirements.
5. Within the scope of our competences, we find that:
a) The separate Income Statement by nature, the separate Financial Statement, the separate Statement of Comprehensive Income, the separate Statement of Changes in Equity and the separate Cash Flow State-ment and its Notes to the separate financial statements give a true and fair view of the financial position of
the company, in respect of its results, comprehensive income, changes in equity and cash flow;
b) The accounting policies and valuation criteria applied are in conformity with the International Financial Reporting Standards (IFRS), as adopted in the European Union, and ensure that a true and fair assessment of the company’s assets and results is given, and the findings and recommendations of the external auditor
have been followed through;
c) The Management Report clearly shows the development of the business and the situation of the company,
highlighting key aspects of the activity;
d) The Corporate Governance Report covers all of the points required under the terms of Article 245 A of the Securities Code, and considered the recommendations to the Code of the Portuguese Corporate Govern-
ance Institute (IPCG).

2018 ANN
UAL R
EPO
RT
325
*09
6. We are of the opinion that the allocation of profits as proposed by the Board of Directors does not run counter to
the applicable legal or statutory provisions.
7. Consequently, taking into account the information delivered by the company’s Board of Directors and Depart-ments, and the conclusions of the legal Accounts Certificate and Audit Report, we are of the opinion that:
a) The Management Report should be approved;
b) The separate Financial Statements should be approved;
c) The allocation of results as proposed by the Board of Directors should be approved.
8. Finally, the members of the Audit Board are grateful to the Board of Directors, the key supervisors and other com-
pany staff, as well as to the statutory auditor KPMG & Associados, SROC, Lda. for their collaboration.
Lisbon, 18 March 2019
The Chairman of the Audit Board JOSÉ MANUEL OLIVEIRA VITORINO
Member of the Audit BoardGONÇALO NUNO PALHA GAIO PICÃO CALDEIRA
Member of the Audit BoardMARIA DA GRAÇA TORRES FERREIRA DA CUNHA GONÇALVES

SOCIEDADE DE INVESTIMENTO E GESTÃO, SGPS, SA
AV. FONTES PEREIRA DE MELO, 14 - 10º 1050 - 121 LISBOA - PORTUGALTEL (351) 213 184 700 FAX (351) 213 521 748
WWW.SEMAPA.PT
CORPORATE PERSON AND LISBON COMPANIES REGISTRY NO. 502 593 130
SHARE CAPITAL 81 270 000 EUROS
*DESIGN AND DEVELOPMENT BESTWEB
*GRAPHIC PRODUCTIONTUTTI FRUTTI
*LEGAL DEPOSIT NUMBER426416/17

www.semapa.pt