Embed Size (px)
Citation preview

2017 TSO and TAO Allowed Revenue and TUoS
Tariffs 2016/2017
DOCUMENT
TYPE:
Information Note
REFERENCE:
CER/16248
DATE
PUBLISHED:
26 August 2016
QUERIES TO: [email protected]
The Commission for Energy Regulation,
The Exchange,
Belgard Square North,
Tallaght,
Dublin 24.
www.cer.ie

Page 2 of 30
Abstract:
This Information Note outlines the revenues that EirGrid and ESB Networks will be
allowed to recover from the Transmission Use of System (TUoS) customer over the
calendar year 2017. These revenues are to cover the costs of EirGrid and ESB
Networks as electricity Transmission System Operator (TSO) and Transmission
Asset Owner (TAO), respectively.
In 2015, the Commission for Energy Regulation (CER) outlined its decision
(CER/15/296) on the current electricity transmission price review, known as Price
Review 4 (PR4) and covering the period 2016 to 2020. During the PR4 period, yearly
updates are to be completed as per the structures outlined in section 13 of
CER/15/296. The following Information Note outlines the results of implementing the
yearly update for the 2017 revenues and the resulting Transmission Use of System
tariffs for the period 1st October 2016 to 30th September 2017.
Target Audience:
This Information Note is for the attention of members of the public, the energy
industry, customers and all interested parties.
Related Documents:
CER/15/296 Decision on TSO and TAO transmission revenue for 2016 to 2020
CER/15/187 Consultation on TSO and TAO transmission revenue for 2016 to 2020
CER/15/216 TUoS Demand Tariffs 2015/2016
CER/14/427 Information Note on 2015 TSO and TAO Revenue
CER/13/189 Information Note on 2014 TSO and TAO Revenue
CER/12/150 Information Note on 2013 TSO and TAO Revenue
CER/11/167 Information Note on 2012 TSO and TAO Revenue
CER/11/128 Decision on 2011/2012 Transmission Incentives
CER/10/206 Decision on TSO and TAO transmission revenue for 2011 to 2015

Page 3 of 30
Executive Summary
Last year the CER published its decision on transmission network revenues for each
year from 2016 to 2020. That decision (CER/15/296) was the fourth such revenue
decision spanning 5 years. It is referred to as Price Review 4 (PR4).
PR4 set transmission network revenues to deliver value for money for the customer
while providing for continued investment in the network. That continued investment is
vital to ensure that the network delivers reliable supply for the customer and assists
in Ireland’s economic growth and meeting renewable generation targets.
Transmission revenues are collected through Transmission Use of System (TUoS)
tariffs. TUoS tariffs are charged to energy suppliers, who may choose to pass them
on to their customers. At present TUoS tariffs make up approximately 8% of a
customer’s bill.
These tariffs are designed to recoup the approved transmission revenues. They are
updated each year, with effect from 1st October. When setting these charges, the
allowed revenues are reviewed. This is to ensure the most up to date information is
used. This year the review pertains to revenues for the calendar year 2017. This
paper sets out the results of that review and the resultant TUoS tariffs that will come
into effect on 1st October 2016.
PR4 had provided for € 359.07m (2015 monies). The CER’s review has resulted in
an updated figure of €354.84. This is approximately 1 % less than anticipated. This
results in an average tariff1 of 1.34c/kWh; to be charged from 1st October 2016 to
30th September 2017. This is 1.44% higher than currently.
The CER’s current expectation is that this 1.44% increase will result in approximately a 0.1% rise in overall electricity customer prices in October 2016. However, the actual outcome for customer prices depends, among other factors, on international fuel and related generation costs, which are currently circa 50% of the overall cost of electricity to customers, and we note that these costs have fallen over the last year or so. The revenue update is now discussed in more detail.
---------
2017 TSO and TAO revenue
The 2016 allowed revenue as per the PR4 decision is €360.17 million (2015
monies). The updated allowed transmission revenue for 2017 is €354.84 million
1 This is called the average unit price and is calculated by simply dividing revenues for the period in question by demand. It is an approximation of the change in TUoS tariffs, which have standing and unit charge components.

Page 4 of 30
(2015 monies). This updated allowed revenue equates to a 1.48% decrease. The
transmission revenues for the TSO and TAO for 2017 are detailed in Table 1.
Table 1 revenues for the TSO and TAO for 2017
€ Millions PR4 Allowed
Revenue
(2015 monies)
CER Adjusted
Revenue
(2015 monies)
CER Adjusted
Revenue
Estimated 2017
monies2
2017 TSO Revenue €148.50 €146.06 €149.59
2017 TAO Revenue €210.57 €208.78 €213.60
2017 Total Transmission
Revenue
€359.07 €354.84 €363.19
Transmission AUP for 2016/2017 tariff period
Allowed revenues are set on a calendar year basis. However TUoS tariffs are set for
periods that span two calendar years (from 1 October in one year to 30th September
the following year). Within this paper the relevant portion of 2016 calendar year
revenue3 and the relevant portion of 2017 revenue, have been allocated for recovery
through TUoS within the 1 October 2016 to 30 September 2017 tariff period.4
The update of revenues outlined previously lead to a €356.83 million revenue figure
(2017 monies, i.e. nominal) for the TUoS tariff period from 1 October 2016 to 30
September 2017. This is slightly lower than had been anticipated in the PR4 decision
due to the reduced 2017 revenues as detailed in the previous section.
Based on the above revenue figure and the estimated tariff period consumption of
26,700GWh, the transmission average unit price (AUP) for the period from 1 October
2016 to 30 September 2017, is estimated to be approximately 1.34c/kWh in 2017
monies. This is an increase of 1.44% on the 2015/2016 tariff period transmission
AUP (approximately 0.11% increase in end user tariff).
Key drivers
This rise in the transmission AUP can be attributed mostly to the following factors:
- The increase in overall revenue to be collected in 2017, as per the PR4
determination;
2 2017 monies inflated based on actual/forecast Irish HICP rates of 0.3% in 2014, 0.0% in 2015, 0.6% in 2016, and 1.7% in 2017. Please refer to Central Bank Q2 2016 Quarterly Bulletin. 3 The 2016 calendar revenue referred to here is that which was approved in advance of the PR4 decision to facilitate the implementation of 2015/16 tariffs, (i.e. a 2016 nominal revenue figure of €339.64 million). 4 27% of 2016 calendar year revenue and 73% of 2017 calendar year revenue, based on the demand weighted average.

Page 5 of 30
- Deferred capital expenditure from PR3 in addition to forecast new
connections;
- An increase to asset management costs (opex) due to successful planning
applications for new line builds; and
- An increase to repairs and maintenance costs driven by a reduction in lone
working and implementation of health and safety processes.

Page 6 of 30
Table of Contents
Executive Summary ................................................................................................. 3
Table of Contents ..................................................................................................... 6
1. Introduction ........................................................................................................ 7
1.1 The Commission for Energy Regulation ........................................................... 7
1.2 Purpose of this paper ........................................................................................ 7
1.3 Structure of this paper ....................................................................................... 7
2. Background Information ................................................................................... 8
2.1 PR4 Transmission Revenue Control ................................................................. 8
2.2 Determination of TSO and TAO revenue for each calendar year ...................... 9
2.3 Determination of TUoS tariffs for each tariff period ........................................... 9
3. TSO and TAO revenue for the 2017 calendar year ........................................ 10
3.1 Introduction ..................................................................................................... 10
3.2 TSO revenue for the 2017 calendar year ........................................................ 10
3.3 Revenue control formula ................................................................................. 10
3.4 2015 TSO outturn and k-factor to apply to 2017 TSO revenue ....................... 11
3.5 2015 TSO Incentives outturn .......................................................................... 12
3.6 2017 TSO revenue and explanation of 2017 adjustments .............................. 15
3.7 TAO revenue for the 2017 calendar year ........................................................ 20
3.8 Revenue control formula ................................................................................. 20
3.9 2015 TAO outturn and k-factors to apply to 2017 TAO revenue ..................... 21
3.10 2015 TAO Incentives outturn ........................................................................ 23
3.11 2017 TAO revenue and explanation of 2017 adjustments ............................ 23
3.12 Interest Provision for 2015 TSO and TAO Over/Under-Recovery ................. 25
3.13 The inflation rate ........................................................................................... 25
3.14 Comparison with revenue for 2016 calendar year ......................................... 26
4. TUoS tariffs for 1 Oct 2016 to 30 Sept 2017 ..................................................... 27
5. Summary ............................................................................................................ 28
Appendix A - Transmission Tariffs 2014/2015 ..................................................... 29

Page 7 of 30
1. Introduction
1.1 The Commission for Energy Regulation The CER is the independent body responsible for overseeing the regulation of
Ireland's electricity and gas sectors. The CER was initially established and granted
regulatory powers over the electricity market under the Electricity Regulation Act,
1999. The enactment of the Gas (Interim) (Regulation) Act, 2002 expanded the
CER’s jurisdiction to include regulation of the natural gas market, while the Energy
(Miscellaneous Provisions) Act 2006 granted the CER additional powers in relation
to gas and electricity safety.
The Electricity Regulation Amendment (SEM) Act 2007 outlined the CER’s functions
in relation to the Single Electricity Market (SEM) for the island of Ireland. This market
is regulated by the CER and the Northern Ireland Authority for Utility Regulation
(NIAUR). The CER is working to ensure that consumers benefit from regulation and
the introduction of competition in the energy sector.
1.2 Purpose of this paper This Information note outlines the level of transmission revenue that EirGrid (the
Transmission System Operator, TSO) and ESB Networks (the Transmission Asset
Owner, TAO) will be allowed to recover from the TUoS customer in the 2017
calendar year. This revenue will allow the TSO and TAO to finance their activities as
the monopoly electricity system operator and system owner in Ireland.
1.3 Structure of this paper This paper is structured in the following manner:
Section 1 provides an introduction to the purpose of this Information Note;
Section 2 provides background information on this note. It outlines, at a high
level, the decisions made as part of the PR4 Transmission Price Review
published in December 20155;
Section 3 provides detail on the transmission revenue that has been
approved for the 2017 calendar year;
Section 4 discusses the TUoS tariffs applicable to the upcoming tariff period;
and
Section 5 provides a summary.
Appendix A outlines the approved 2016/2017 TUoS Demand Schedule of
tariffs for the period 1 October 2016 to 30 September 2017. Please note that
the full 2016/2017 Statement of Charges will be published by EirGrid, as TSO,
in accordance with Section 36 of the Electricity Regulation Act 1999 before
commencement of the new tariff period.
5 Please refer to the CER decision paper CER/15/296.

Page 8 of 30
2. Background Information
2.1 PR4 Transmission Revenue Control
In December 2015, the CER published a decision paper6 on the revenue that EirGrid
(as TSO) and ESB Networks (as TAO) would be allowed to recover from the TUoS
customer over the period 2016 to 2020. This period is known as PR4.
The five years from 2016 to 2020 will require continued investment in the
transmission system and delivering ongoing infrastructure projects. The PR3 period
was characterised by the initiation of a large scale infrastructure delivery programme
in order to meet 2020 renewable generation targets. Given the nature of electricity
infrastructure, the capital projects span more than the five year review period; with
large scale projects often taking up to 10 years to complete. The transmission
network also needs ongoing investment to ensure that it operates securely and
effectively.
This necessary investment will mean that the overall revenues to be recovered by
the TSO and TAO over the period of the review will rise from the CER’s allowed
outturn levels for the last price control (PR3, 2011 to 2015). As a result TUoS
charges, levied to consumers, will rise somewhat. However, it should be noted that
TUoS represents a relatively small overall amount of a residential bill (approximately
8%).
The CER adopts an incentive based model to separately determine the TSO’s and
TAO’s allowed revenues. Both utilities internal operating costs are fixed for a five
year period. If either utility spends more than it is allowed, it bears the cost. On the
other hand if the utility spends below what it is allowed, a five-year rolling retention
mechanism applies. This mean that benefits achieved through costs lower than
target levels can be retained by the TSO and TAO for five years so that they remain
neutral as to when in the regulatory cycle those efficiencies are gained. This
encourages them to drive efficiencies throughout the price review period and not in
specific years, (for example at the start of the price review period). Of course this is
provided that such savings have not been made at the expense of performance/
inefficiency and quality of service or as a result of poor forecasting. The utilities
cannot simply make apparent savings through the avoidance of expenditure, which
could be to the detriment of the transmission system.
The allowed revenue set for each calendar year, 2016 to 2020, for the TSO and
TAO, as per the PR4 determination is detailed in Table 2.7
6 CER/15/296 7 Please refer to CER/15/296 for the breakdown of these revenues.

Page 9 of 30
Table 2 PR4 determination of TSO and TAO allowed revenues for 2016 to 2020
(2014 monies, €m’s) 2016 2017 2018 2019 2020 Total
TSO Allowed
Revenue 151.13 154.98 155.04 155.07 155.50 771.72
TAO Allowed Revenue 209.04 210.57 233.83 259.61 288.98 1,202.04
Total Allowed Revenue 360.17 365.56 388.86 414.68 444.49 1,973.76
Note: Figures are rounded
2.2 Determination of TSO and TAO revenue for each calendar year
The CER’s PR4 paper ‘Decision on TSO and TAO Transmission Revenue for 2016
to 2020’8 details how the allowed revenues are to be updated each year for both the
TSO and TAO throughout the PR4 period.9 Accordingly, this is the first year that
such an update will take place – for calendar year 2017.
2.3 Determination of TUoS tariffs for each tariff period
For 2006 (and previous years), TUoS tariffs were set on a calendar year basis using
estimated Gigawatt hour (GWh) figures and the allowed transmission revenue for
that calendar year.
In 2007, it was decided that annual TUoS demand tariffs were to be set on a 1st
October start date. The reasons behind the decision to change the tariff period to a
non-calendar-year term are documented in the SEM decision document
AIP/SEM/07/93.10 Following that decision, TUoS tariffs are now set on a tariff year
basis, i.e. 1 October to 30 September.
8 CER/15/296 9 Section 13 of CER/15/296 discusses how the TSO and TAO revenue will be updated for each calendar year. 10 The decision paper on PES retails tariff period alignment in both regulatory jurisdictions (AIP/SEM/07/93) is available here.

Page 10 of 30
3. TSO and TAO revenue for the 2017 calendar year
3.1 Introduction As detailed in Section 2.1, in December 2015, the CER published its PR4 decision
paper detailing the level of TSO and TAO allowed revenue for the period 2016 to
2020. That decision paper also detailed how the allowed revenue would be updated
each year.
The TSO and TAO revenue for the 2017 calendar year have been separately
updated according to the PR4 decision paper. This has resulted in a TSO revenue of
€146.06 million and a TAO revenue of €208.78 million for the 2017 calendar year.
This is based on a revenue submission provided by the TSO and TAO. The
calculations behind these figures are now explained.
3.2 TSO revenue for the 2017 calendar year
The 2016 allowed revenue as per the PR4 decision is €151.13 million (2015
monies). The updated allowed TSO revenue for 2017 is €146.06 million (2015
monies). This updated allowed revenue equates to a decrease of 3.35%. This figure
has been derived from the following:
Allowed 2017 TSO revenue of €154.98 million (2015 monies) as per PR4;
Outturn results for 2015 TSO External costs (e.g. Ancillary Services);
Outturn results for 2015 TSO System Performance Incentives;
Adjustment for actual 2015 inflation11; and
Adjustment for differential in TUoS energy volume recovery against the
assumed energy throughput forecast in 2015, known as the 2015 K-Factor.
Inflating the resulting TSO revenue of €146.06 million to nominal 2017 monies12
results in a TSO allowed amount of €149.59 million.
3.3 Revenue control formula
The revenue control formula, which is used to keep the TSO’s revenue in line with
allowed costs, is set out in detail in Section 13 of CER/15/296. This has been slightly
modified to take account of the TSO Incentive outturn in year t-2 (in this case
calendar year 2015). Very simply, the revenue control formula takes the ‘base’
allowed revenue (in 2014 monies, as detailed in Table 1 above), inflates that
revenue into nominal figures, and adjusts it for specific revenue parameters. The
following formula is used:
11 For the current price control PR4 (2016-2020) Irish HICP will be used as the inflation factor. Please refer section 13 of CER/15/296. 12 2017 monies based on inflation of the 2015 monies by actual/forecast Irish HICP rates of 0.6% in 2016, 1.7% in 2017. Please refer to Central Bank Q2 2016 Quarterly Bulletin.

Page 11 of 30
𝑅𝑡 = ∏ 𝑡
2015
[1 + 𝐼𝑛𝑓𝑡 − 𝑋
100] ∗ 𝐵𝑡 + 𝐼𝑁𝐶𝐸𝑁𝑇𝑡 + 𝐾𝐼𝑁𝐶𝐸𝑁𝑇𝑡−1 ∆𝑃𝑡 + ∆𝑈𝑡 + 𝐾𝑡−1 + 𝐾𝑡−2
Equation 1: Price control formula from CER/15/296
𝑅𝑡 = ∏ 𝑡 [1 + 𝐼𝑛𝑓𝑡 − 𝑋
100] ∗ 𝐵𝑡 + 𝐼𝑁𝐶𝐸𝑁𝑇𝑡−2 + ∆𝑃𝑡 + ∆𝑈𝑡 + 𝐾𝑡−1 + 𝐾𝑡−2
Equation 1: Price control formula from CER/15/296
The terms within Equation 2 are fully explained within CER/15/296, apart from
𝐼𝑁𝐶𝐸𝑁𝑇𝑡−2 which is defined below. For the 2017 calendar year:
Rt, the maximum level of TSO revenue allowed in 2017, is €149.59 million
(2017 monies);
Inft, when inflating from 2014 to 2017 values, the relevant figures are inflated
based on actual/forecast Irish HICP rates of 0.0% in 2015, 0.6% in 2016, and
1.7% in 2017;
X, the efficiency factor, is set at zero;
Bt, the level of allowed revenue for the 2017 calendar year in 2014 monies is
€154.98 million.
INCENTt-2, is the difference in value of incentives/penalties in year t-2 in €
millions. The value of the TSO incentive payment for 2015 is €1.40million
(2015 monies);
Pt, the change in 2017 in TSO external costs (e.g. Inter TSO Compensation
and Ancillary Services) from those assumed in the PR4 determination. This is
€1.09million (2015 monies);
Ut, the change in 2017 uncertain costs from those assumed in the PR4
determination. This is €2.31million (2015 monies);
Kt-1, this is the correction factor, which ensures that prices in year t are
adjusted by an amount equal to the over or under recovery in 2016. For the
purposes of calculating the 2017 TSO revenue this is €0; and
Kt-2, this is the correction factor, which ensures that prices in year t are
adjusted by an amount equal to the over or under recovery in 2015. This is
minus €6.28million (2015 monies).
3.4 2015 TSO outturn and k-factor to apply to 2017 TSO revenue
The k factor for 2015, which feeds into 2017 revenues is discussed in this section.
This section outlines the TSO’s revenue for 2015 allowed under the 2015
transmission revenue determination (CER/14/427) and the changes now made, on
an ex-post basis. This is then compared with the actual revenue received from
market participants to calculate the total allowed transmission over-recovery of
revenue in 2015, known as the ‘k-factor’. This k-factor will feed into the 2017 TSO
revenue.

Page 12 of 30
Table 3 TSO outturn revenue for 2015 and associated k-factor
2015 monies
€ millions
CER ex-ante
allowed 201513
CER Outturn
allowed 2015
Difference
(Outturn minus
ex-ante)
Total Internal Costs 55.36 55.28 -0.08
External Costs
EWIC TUoS Entitlement 33.39 33.90 .051
CER Levy 1.03 .87 -0.16
DUoS costs 1.37 1.26 -0.11
Interconnector Services 1.44 0.28 -1.16
Inter TSO Compensation 1.10 0.58 -0.52
Ancillary Services 48.95 47.17 -1.78
Total External Costs 89.47 86.25 -3.22
2015 TAO Charge cost 199.83 202.23 2.40
2015 Incentive allowance 1.40 1.40
Total TSO Costs +
Incentives 341.41 341.99 (a) 0.58
Total TSO Income 341.41 348.2914 (b) -6.88
Total K-Factor
adjustment (pre-interest)
(a)+(b)
-6.30
The adjustments in the above table are now discussed.
3.5 2015 TSO Incentives outturn
An incentive value of €1.40m (rounded) is included in the above table. This includes
system performance incentives values for System Minutes Lost (SML) and System
Frequency15. Also included are transmission delivery incentives values for “TSO
project milestone” targets and separately, imperfections costs16.
The TSO target levels for 2015 and the outturn results and applicable TSO
payment/penalties are detailed in Table 4. The CER has undertaken an ex-post
13 Figures adjusted for actual 2010 – 2015 inflation of -1.6% in 2010, 1.1% in 2011, 2% in 2012, 0.5% in 2013, 0.3% in 2014, and 0.0% in 2015. 14 EirGrid submission made to CER in April 2016 on EirGrid’s actual 2015 income. 15 Please refer to the Annual Transmission System Performance reports published by EirGrid. 16 SEM-16-031

Page 13 of 30
review of the TSO’s performance against 2015 targets. The incentives are discussed
below.
Table 4 TSO incentive targets and outturn results for 2015
Incentive Target(s) Outturn
Payment/Penalty
in 2015 monies
€ millions
System Minutes
Lost 1.0 1.5 – 3.0 3.5 0.05 +0.33
System Frequency
in range 50Hz +/-
0.1Hz
94% 96% 98% 99.4% +0.33
TSO Project
Milestones 32 40 48 44 +0.27
Delivery of
Enhanced Network
Capacity
Demonstrable through Cost-
Benefit Analysis - 0
Imperfections Costs
Incentive (DBC
Incentive)
€145.9m €128.7 +0.4717
Total 1.40
(a) System Minutes Lost
The System Minutes Lost (SML) is an index that measures the severity of each
system disturbance relative to the size of the transmission system. It is determined
by calculating the ratio of unsupplied energy during an outage to the energy that
would be supplied during one minute, if the supplied energy was at its peak value.
The outturn of 0.049 SML equates to full achievement of the target and therefore
results in a full reward to the TSO of €330k.
(b) System Frequency
The National Control Centre (NCC) in the TSO office aims to maintain the frequency
of the transmission system within a target operating range of 50 +/-0.1 Hz. The
frequency, however, may deviate outside the normal operating range under fault or
abnormal operating conditions.
17 The outturn Imperfections Costs Incentive payment/penalty is recovered on a split 75:25 (ROI:NI) basis in accordance with SEM-12-033

Page 14 of 30
The outturn of system frequency being kept in the range 50Hz +/- 0.1Hz for 99.4% of
the year equates to full achievement of the target. This results in a full reward to the
TSO of €330k.
(c) TSO Project Milestones
This is a joint incentive with the TAO. In CER/11/128 the CER introduced an
incentive on stages of project initiation to project completion, i.e. lodgement of
planning permission right through to energisation. It was called the “Project
Milestones” incentive. An ex-post adjustment is a correct step to take within this
incentive considering the level of degree of influence each party has under its
control, something which the CER acknowledged in CER/11/128.
However, just as important is the nature of that adjustment. The CER has reviewed
the TSO/TAO submission and each of the individual proposed adjustments. The
CER believes that the TUoS customer should be rewarding the transmission utilities
(collectively) for delivery of the transmission network and not just on making sure
one party fulfils their own project milestones. Therefore, the CER considers that lack
of achievement in this incentive should be shared equally between the TSO and
TAO. The central target of the TSO “project milestones” for 2015 was 40, with the
outturn being 44. The TSO and TAO have jointly submitted a total of 13 adjustments
to the incentive targets, which the CER considers to be valid.
As a result, the CER has decided that a total “Project Milestones” incentive payment
of €0.27 million should be paid to the TSO and TAO. This equates to plus €0.27
million to the TSO and €0 to the TAO.
Targets for 2016 have been submitted to the CER and are currently being reviewed.
However, as referred to in CER/15/296, the CER intends to put in place a more
robust monitoring and reporting framework throughout PR4 (2016 to 2020) tied to an
incentive framework. The CER will be consulting separately on proposals for the
incentives that the TSO and TAO would be subject to over that period.
(d) Delivery of Enhanced Network Capacity
In CER/11/128, the CER placed an incentive on the TSO to investigate measures
which would make more efficient use of the network, such that additional network
capacity is released to allow non-firm generation to connect.
Measures include adoption/more progressive interpretation of network planning
standards, operating security standards and the use of active network management
techniques and tools such as dynamic line ratings and advanced protection/control
schemes. These issues may particularly come into focus as levels of intermittent
generation on the system increase in the coming years. There is no lower bound or
reduction in TSO revenues linked to this incentive. Full achievement of the target,
Page 15 of 30
which is determined by the CER through a review of a TSO economic cost benefit
analysis, would result in a reward of €420k.
It is the view of the TSO that this incentive requires re-design in order to better
support the objectives of innovative development of the grid and grid infrastructure.
The TSO notes that while it has sought and continues to seek to advance innovative
solutions for not only enhanced network capacity but also system operation, system
co-ordination and grid delivery, it is not seeking any return under this incentive for
calendar year 2015. Therefore, no payment will be processed through the 2017
revenue.
As noted in the CER’s PR4 determination, the CER will carry out a review of the
incentive mechanism that currently applies to the TSO and TAO in relation to service
delivery and targets. Within this review the CER will put in place strategic incentives
separately to incentives that are focused on operational and service level targets. It
is the CER’s intention to consult on the objectives against which the incentives would
be assessed and the details of the mechanism itself.
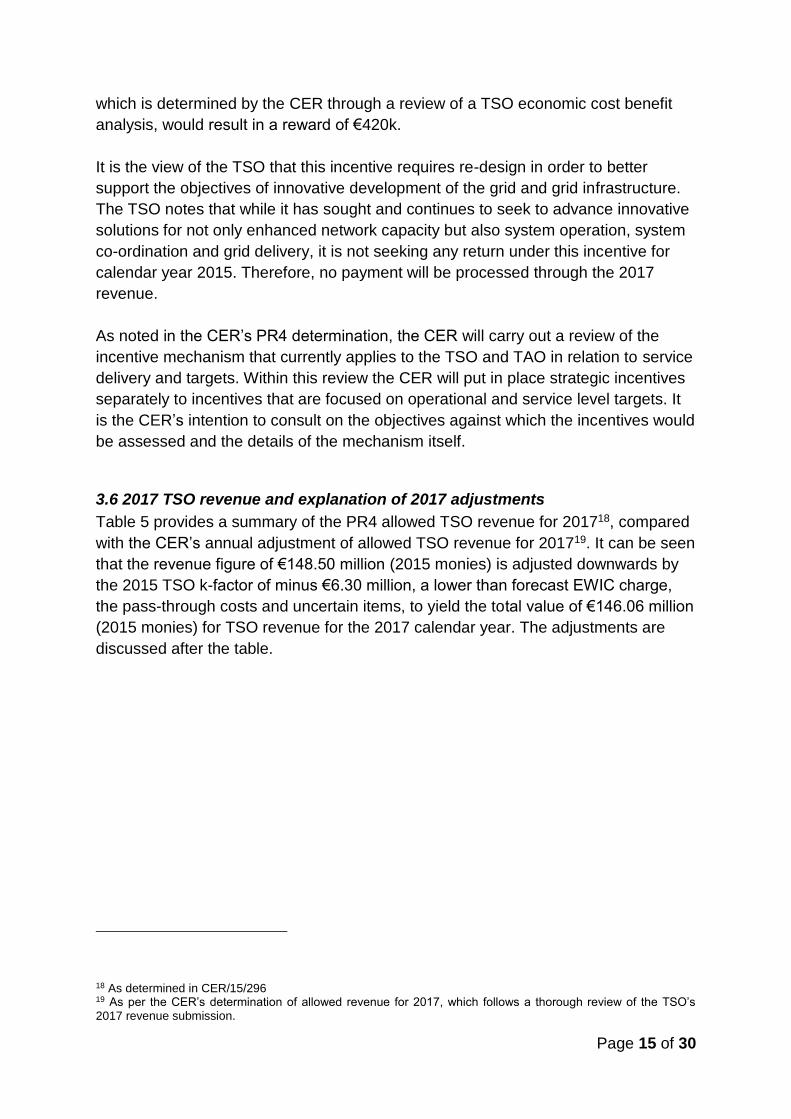
3.6 2017 TSO revenue and explanation of 2017 adjustments
Table 5 provides a summary of the PR4 allowed TSO revenue for 201718, compared
with the CER’s annual adjustment of allowed TSO revenue for 201719. It can be seen
that the revenue figure of €148.50 million (2015 monies) is adjusted downwards by
the 2015 TSO k-factor of minus €6.30 million, a lower than forecast EWIC charge,
the pass-through costs and uncertain items, to yield the total value of €146.06 million
(2015 monies) for TSO revenue for the 2017 calendar year. The adjustments are
discussed after the table.
18 As determined in CER/15/296 19 As per the CER’s determination of allowed revenue for 2017, which follows a thorough review of the TSO’s 2017 revenue submission.
Page 16 of 30
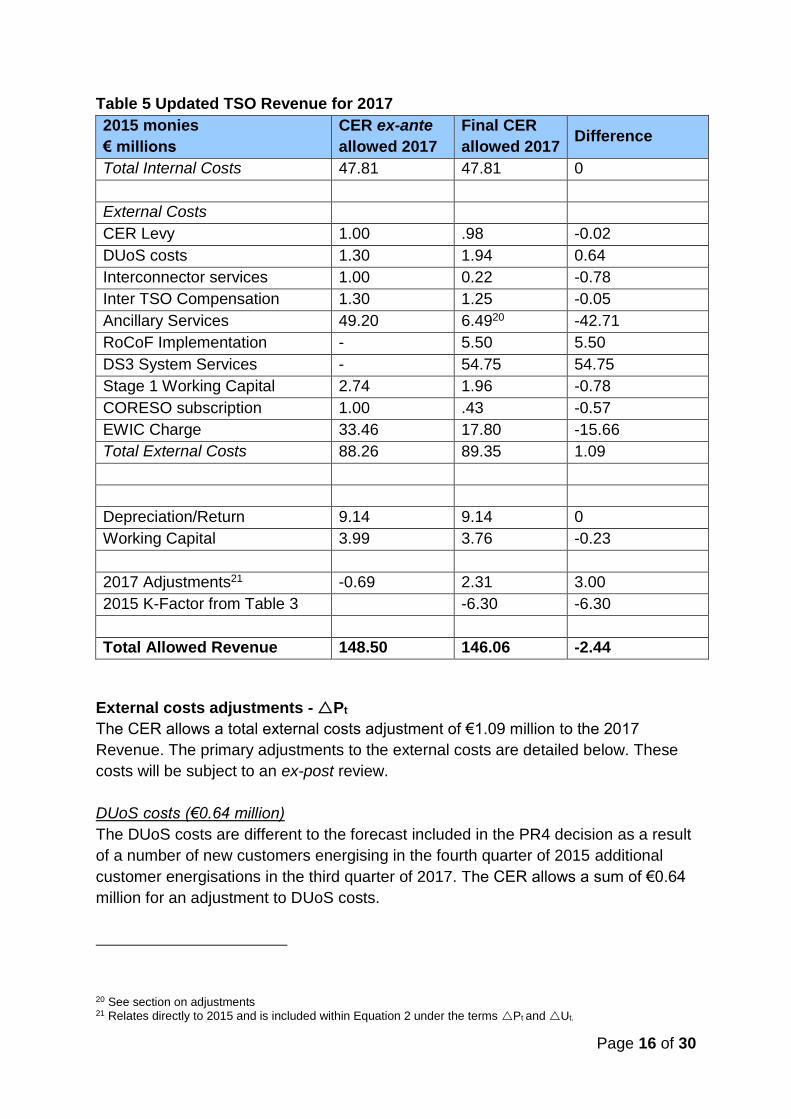
Table 5 Updated TSO Revenue for 2017
2015 monies
€ millions
CER ex-ante
allowed 2017
Final CER
allowed 2017 Difference
Total Internal Costs 47.81 47.81 0
External Costs
CER Levy 1.00 .98 -0.02
DUoS costs 1.30 1.94 0.64
Interconnector services 1.00 0.22 -0.78
Inter TSO Compensation 1.30 1.25 -0.05
Ancillary Services 49.20 6.4920 -42.71
RoCoF Implementation - 5.50 5.50
DS3 System Services - 54.75 54.75
Stage 1 Working Capital 2.74 1.96 -0.78
CORESO subscription 1.00 .43 -0.57
EWIC Charge 33.46 17.80 -15.66
Total External Costs 88.26 89.35 1.09
Depreciation/Return 9.14 9.14 0
Working Capital 3.99 3.76 -0.23
2017 Adjustments21 -0.69 2.31 3.00
2015 K-Factor from Table 3 -6.30 -6.30
Total Allowed Revenue 148.50 146.06 -2.44
External costs adjustments - Pt
The CER allows a total external costs adjustment of €1.09 million to the 2017
Revenue. The primary adjustments to the external costs are detailed below. These
costs will be subject to an ex-post review.
DUoS costs (€0.64 million)
The DUoS costs are different to the forecast included in the PR4 decision as a result
of a number of new customers energising in the fourth quarter of 2015 additional
customer energisations in the third quarter of 2017. The CER allows a sum of €0.64
million for an adjustment to DUoS costs.
20 See section on adjustments 21 Relates directly to 2015 and is included within Equation 2 under the terms Pt and Ut.

Page 17 of 30
East-West Interconnector Allowance (-€15.66 million)
This cost item was introduced in the PR3 period. The EWIC charge is not a TSO
related cost, but recoverable under TUoS in accordance with the interconnector
licence. The EWIC charge is treated in the exact same fashion as all the external
TSO cost items listed above, i.e. this charge will be allowed as pass through in PR4.
However, the CER will undertake an annual ex-post adjustment to take account of
actual outturn costs and revenues earned by the EWIC.22
The CER included a forecast annual cost of €33.46 million in the PR4 decision to be
included in the TUoS tariffs based on the estimated cost for the infrastructure and
the financing arrangements. However, up to date forecasts from those used in the
PR4 submission are submitted annually. The calculation of these up to date
forecasts include an adjustment for auction receipts, ancillary services receipts and
hosting income. Based on the CER’s review of these updates, the CER allows a
downward adjustment of minus €15.66 million to the 2017 revenue.
Rate-of-Change-of-Frequency (€5.50 million)
In April and May 2014, the CER and UR respectively decided in principle to
introduce a Rate-of-Change-of-Frequency (RoCoF) Grid Code standard of 1 Hz/s for
Ireland and 2 Hz/s for Northern Ireland (calculated over 500ms). The CER and UR
directed that industry implementation projects be established in each jurisdiction to
implement a new Grid Code standard. In respect of such implementation projects,
the forecast spend for the TSO in Ireland in 2017 is €5.50 million. The CER allows
an adjustment of €5.50 million to the 2017 revenue.
Ancillary Services (-€42.5 million)
Provision for Ancillary Services in PR4 was on the basis of existing Ancillary
Services requirements in 2015. Ancillary services have been phased into DS3
System Services and with that the PR4 forecast figure for ancillary services has
been revised downwards by €42.5 million to a total of €6.66 million for 2017. Costs
associated with DS3 System Services will be detailed as a separate cost item, see
section below. The CER allows a downward adjustment of minus €42.5 million to the
2017 revenue.
DS3 System Services (€54.75 million)
In December 2014, the SEM Committee published a decision paper on the high-level
design for the procurement of DS3 System Services (SEM-14-108). In the decision
paper, the SEM Committee directed that transitional Interim Arrangements be
established for the tariff year beginning 1 October 2016.
22 Please refer the CER Information Note on the EWIC revenue requirement (CER/12/149) which can be found here.

Page 18 of 30
The DS3 system services costs capture system services that were not considered as
part of PR4 and also services that had been previously captured under ancillary
services (see reduction of -€42.5m previously outlined). The estimated all-island
spend on DS3 System Services for the year beginning 1 October 2016 is €73 million.
Based on an allocation consistent with the specified proportions 75:25
(EirGrid:SONI), the provision required under TUoS is expected to be €54.75m.The
CER allows an adjustment of €54.75 million to the 2017 revenue.
Uncertain costs adjustments - Ut.
The CER allows a total uncertain costs adjustment of €2.31 million to the 2017
Revenue. The primary adjustments to the uncertain costs are detailed below. These
costs will be subject to an ex-post review.
Guarantees of Origin (€0.32 million)
In CER’s decision paper CER/11/824 entitled ‘Supervisory Framework for
Administration of Guarantees of Origin’, it was set out that the operational costs and
costs involved in setting up a charging infrastructure for Guarantees of Origin
(GoOs), would be recovered through EirGrid’s network charges.
The TSO has submitted a request for €0.32 million to conduct the work associated
with GoOs. The figure comprises the cost of resource allowance, development of an
automated system for the management of GoOs, membership to the Association of
Issuing Bodies and associated licensing costs. The CER allows an adjustment of
€0.32 million to the 2017 revenue.
Constraints Arrangement Fees (€0.45 million)
The arrangement in place since 2001 relates to the ongoing provision of working
capital for the TSO business to manage cash flow differentials which result from the
operation of its business.
This constraint arrangement fees line item is separate to the general working capital
arrangements contained in the allowed TSO revenue and it covers funding
arrangements associated with the all-island Imperfections charge. The TSO has
submitted for costs of €0.45 million. The CER allows this cost of €0.45 million for
2017.
Strategic Projects (€0.26 million)
In 2014 the CER approved the framework (CER/14/427) for the recovery of phase 1
(feasibility) of the Ireland France Interconnector project. In June 2015, the CER
approved EirGrid’s costs for this phase of the project. The TSO has submitted a
forecast cost of €0.26 million for 2017. The CER allows an adjustment of €0.26
million to the 2017 revenue.

Page 19 of 30
PR3 Adjustments (-€0.69 million)
The CER as part of its PR4 decision disallowed €2.75 million against the North
South Interconnector project.23 The disallowance is to be spread out over the period
2017 to 2020 inclusive. As part of the 2017 revenue allowance, this results in an
adjustment of minus €0.69 million.
23 Section 8 of CER/15/296

Page 20 of 30
3.7 TAO revenue for the 2017 calendar year
The 2016 allowed revenue as per the PR4 decision is €209.04 million (2015
monies). The updated allowed TAO revenue for 2017 is €208.78 million (2015
monies). This updated allowed revenue equates to a decrease of 0.12%. This figure
has been derived from the following:
Allowed 2017 TAO revenue of €210.57m (2015monies) as per PR4;
Outturn adjustments of minus €1.80 million (2015 monies) (detailed below);
and
Adjustment for actual 2015 inflation24.
Inflating the resulting TAO revenue of €208.78 million to a nominal 2017 price level25
results in a TAO allowed amount of €213.60 million.
3.8 Revenue control formula
The revenue control formula, which is used to keep the TAO’s revenue in line with
allowed costs, is also set out in detail in Section 13 of CER/15/296. As with the TSO
this has been slightly modified to take account of the TAO Incentive outturn in year t-
2. The revenue control formula for the TAO takes the ‘base’ allowed revenue (in
2014 monies, as detailed in Table 1), inflates that revenue into nominal figures, and
adjusts it for specific revenue parameters. The following formula is used:
𝑅𝑡 = ∏ 𝑡
2015
[1 + 𝐼𝑛𝑓𝑡 − 𝑋
100] ∗ 𝐵𝑡 + 𝐼𝑁𝐶𝐸𝑁𝑇𝑡 + 𝐾𝐼𝑁𝐶𝐸𝑁𝑇𝑡−1 ∆𝑃𝑡 + ∆𝑈𝑡 + 𝐾𝑡−1 + 𝐾𝑡−2
Equation 3: Price control formula from CER/15/296
𝑅𝑡 = ∏ 𝑡 [1 + 𝐼𝑛𝑓𝑡 − 𝑋
100] ∗ 𝐵𝑡 + 𝐼𝑁𝐶𝐸𝑁𝑇𝑡−2 + ∆𝑃𝑡 + ∆𝑈𝑡 + 𝐾𝑡−1 + 𝐾𝑡−2
Equation 4: Updated formula for application in revenue year 2017
The terms within Equation 4 are fully explained within CER/15/296, apart from
𝐼𝑁𝐶𝐸𝑁𝑇𝑡−2 which is defined below. For the 2017 calendar year:
Rt, the maximum level of TAO revenue allowed in 2017, is €208.78 million;
Inft, when inflating from 2014 to 2017 values, the relevant figures are inflated
based on actual/forecast Irish HICP rates of 0.0% in 2015, 0.6% in 2016, and
1.7% in 2017;
X, the efficiency factor, is set at zero;
Bt, the level of allowed revenue for the 2017 calendar year in 2014 monies is
€210.57 million;
24 HICP of 0%, 0.6% and 1.7% for each of the years from 2015 to 2017. 25 2017 monies based on inflation of the 2015 monies by actual/forecast Irish HICP rates of 0.6% in 2016, 1.7% in 2017. Please refer to Central Bank Q2 2016 Quarterly Bulletin.

Page 21 of 30
INCENTt-2, is the value of incentive penalties in year t-2 in € millions in respect
of the penalties or payments. The value of TAO incentive payments for 2017
is -€3 million (2015 monies). This includes a penalty of €1 million and a
clawback of the €2 million placeholder resulting in a k-factor of €3 million;
Pt, the change in 2017 in TAO external costs (e.g. Local Authority Rates)
from those assumed in the determination paper CER/15/296, is zero;
Ut, the change in 2017 uncertain costs from those assumed in the
determination paper CER/15/296 is also zero;
Kt-1, this is the correction factor, which ensures that prices in year t are
adjusted by an amount equal to the over or under recovery in the previous
calendar year. For the purposes of calculating the 2017 TAO revenue this
figure is €0; and
Kt-2, this is the correction factor, which ensures that prices in year t are
adjusted by an amount equal to the over or under recovery in 2015. This is
minus €1.80 million (2015 monies). Note that this is a net k-factor figure which
includes the incentive adjustment outlined above.
3.9 2015 TAO outturn and k-factors to apply to 2017 TAO revenue
The k factor for 2015, which feeds into 2017 revenues is discussed in this section.
This section outlines the TAO’s allowed revenue for 2015 and the changes now
made, on an ex-post basis. This is then compared with the actual revenue received
to calculate the total allowed transmission over-recovery of revenue in 2015, known
as the k-factor. This k-factor will feed into the 2017 TAO revenue.
The CER allows a total k-factor adjustment of minus €1.80 million to the 2017
Revenue. The individual k-factor adjustments are described below with the
respective figures detailed in Table 6.
K-factor adjustments - Kt-2
Local authority network (-€1.88 million)
Rates are levied annually by county, city and certain town councils around the
country on the TAO. Due to an annual ex-post review an adjustment of minus €1.88
million is made to 2015 allowed Network Rates costs.
Regulatory levy (€0.33 million)
Rates are levied annually by CER on the TAO. Due to an annual ex-post review an
adjustment of minus €0.33 million is made to 2015 allowed CER Levy.
Additional use of system (€0.13 million)
There was a variance of €0.13 million between the AUoS allowed for 2015 and the
actual outturn. This has resulted in an increase of €0.13m to the TAO’s 2017 allowed
revenue.

Page 22 of 30
PR3 operational expenditure (€4.71 million)
There was a variance of €4.71 million between the operational expenditure allowed
for 2015 and the actual outturn. The CER has decided the variance in the allowed
revenue for 2017 with the full amount (or clawback) subject to further review. This
has resulted in an increase of €4.71 million to the TAO’s 2017 allowed revenue.
PR3 recovery inflation (-€1.07 million)
The 2015 outturn revenue is the only outturn revenue amount that was inputted to
the PR3 over/under spend calculation that was based on a forecast. Adjustments to
capture actual outturn of minus €1.07 million is allowed by CER.
Net Present Value (€0.06 million)
The Net Present Value (NPV) of the allowed revenue and the collected revenue over
a price review must balance. After adjusting the PR3 allowed revenue for actual
2015 outturns an adjustment is required to ensure the NPV of the allowed and
collected revenue for PR3 balances. The correction of this balancing results in an
increase of €0.06 million in the 2017 revenue requirement.
PR3 capex (-€0.43 million)
An underspend €11.97 million results a reduction of €0.43 million to the 2017
revenue. The €0.43 million reduction pertains to depreciation and return on the
€11.97 million underspend.

Page 23 of 30
Table 6 TAO outturn revenue for 2015 and associated k-factor
2015 monies
€ millions
CER ex-ante
allowed 2015
CER Outturn
allowed 2015
Difference
(Outturn minus ex-
ante)
Pass Through Costs
Local Authority Rates 22.23 20.35 -1.88
CER Regulatory Levy 1.20 0.87 -0.33
Incentives
2015 Incentive allowance 2.00 -1.00 -3.00
Uncertain Costs – Non
Capitalised
AUoS -0.50 -0.37 0.13
PR3 Opex 29.04 33.75 4.71
PR3 Recovery Inflation 0 -1.07 -1.07
PR3 Recovery NPV 0 0.06 0.06
Uncertain Costs –
Capitalised
PR3 Capex 0 -11.97 -
Deprecation 0 - 0.12 -0.12
Return 0 -0.31 -0.31
Total k-factor
adjustment (pre-
interest)
-1.80
3.10 2015 TAO Incentives outturn
An incentive value of minus €3 million is detailed in Table 6. The CER included a
placeholder value of €2 million in its PR3 decision for 2015 incentives. The TAO did
not submit its incentive outturn report in sufficient time to be considered.
Consequently, the CER has clawed back the €2 million placeholder value that was
included in revenues and has imposed a further reduction of €1 million. This €1
million is approximately half of the maximum penalty that can be applied for not
meeting incentive targets. The CER has now received the incentive report and will
review it in due course. Any necessary amendments will be made in the form of a k-
factor where appropriate and discussed in a future revenue paper.

Page 24 of 30
3.11 2017 TAO revenue and explanation of 2017 adjustments
Table 7 provides a summary of the PR4 allowed TAO revenue for 201726, compared with the CER’s annual adjustment of allowed TAO revenue for 201727. It can be seen that the revenue figure of €210.57 million (2015 monies) is adjusted downwards by the 2015 TAO k-factor of minus €1.80 million, to yield the total value of €208.78 million for TAO revenue for the 2017 calendar year. Table 7 Updated TAO Revenue for 2017
2015 monies € millions
CER ex-ante allowed 2017
Final CER allowed 2017
Difference
Total Internal Costs 31.50 31.50 0
Total External Costs 27.50 27.50 0
AUoS -0.50 -0.50 0
Incentives 2.25 2.25 0
Depreciation 59.67 59.67 0
Return on Capital 90.16 90.16 0
2015 K-Factor from Table 6 -1.80 -1.80
Total Allowed Revenue 210.57 208.78 -1.80
26 As determined in CER/15/296 27 As per the CER’s determination of allowed revenue for 2017, which follows a thorough review of the TAO’s 2017 revenue submission.

Page 25 of 30
3.12 Interest Provision for 2015 TSO and TAO Over/Under-Recovery
As stated in CER/15/296, the mechanism for inter-year adjustments for under or
over-recovery is to apply interest at the three month average Euribor rate. The
interest rate (I) that is applied to under and over-recoveries of transmission revenue
for year t-2 is as follows:
It-2 is the mean of the twelve monthly average three month Euribor rate between
April and March of the year t-2 (i.e. April of year t-3 to March year t-2) multiplied by
the mean of the twelve monthly average three month Euribor rate between April and
March of the year t-1 (i.e. April of year t-2 to March year t-1).
Applying an interest rate of minus 0.02% in 2015 and minus 0.28% in 2016 to the
2015 TSO k-factor of minus €6.30 million, results in a net TSO k-factor of minus
€6.28 million (rounded) in 2017 nominal monies.
Again, applying an interest rate of minus 0.02% in 2015 and minus 0.28% in 2016 to
the 2015 TAO k-factor of €1.80 million, results in a net TAO k-factor of €1.79 million
(rounded) in 2017 nominal monies.
The net k-factor, interest adjusted, is minus €4.48 million.
3.13 The inflation rate
The TSO’s and TAO’s allowed revenue is indexed to take account of price inflation.
The index used should be the best reflection of the increases in prices faced by the
transmission utilities, such as wage inflation or materials inflation. Also the index
needs to be practical to implement, robust and transparent.
In PR3 (2011-2015) the CER used the Harmonised Index of Consumer Prices
(HICP) as the index to inflate revenue. The rationale being that the HICP is likely to
be less volatile than the CPI, leading to more stable revenues which would be of
benefit to both the final customer and transmission utilities. The CER will continue to
use the Irish HICP as the inflation index for PR4 period.
Therefore, Irish HICP is being used to inflate from 2014 actual monies to 2017
nominal monies.
Page 26 of 30
3.14 Comparison with revenue for 2016 calendar year
The allowed TSO revenue for the 2017 calendar year is €146.06 million (2015 monies), a decrease of approximately 3.35% relative to the €151.13 million (2015 monies) revenue approved for the 2016 calendar year in the PR4 determination.
The allowed TAO revenue for the 2017 calendar year is €208.78 million (2015
monies), a decrease of approximately 0.12% relative to the €209.04 million
(2015 monies) revenue approved for the 2016 calendar year in the PR4
determination.
The combined allowed 2017 transmission revenue is €354.84 million (2015
monies), a decrease of 1.48% relative to the €360.17 million (2015 monies)
that was allowed for the 2016 calendar year in the PR4 determination.
However, it is important to note that tariffs are not set on a calendar year basis.
Consequently, interested parties may find it more useful to compare the transmission
AUP between tariff periods as discussed within Section 4 of this paper.

Page 27 of 30
4. TUoS tariffs for 1 Oct 2016 to 30 Sept 2017
Allowed revenues are set on a calendar year basis. However TUoS tariffs are set for
periods that span two calendar years (from 1 October in one year to 30th September
the following year). Within this paper the relevant portion of 2016 calendar year
revenue and the relevant portion of 2017 revenue, have been allocated for recovery
through TUoS within the 1 October 2016 to 30 September 2017 tariff period.28
The update of revenues detailed in the previous sections lead to a €356.83 million
revenue figure (2017 nominal monies) for the TUoS tariff period from 1 October 2016
to 30 September 2017. This is slightly lower than anticipated due to the reduced
2017 revenues as detailed in the previous section.
Based on the above revenues figure and the estimated tariff period consumption of
26,700GWh, the transmission average unit price (AUP) for the period from 1 October
2016 to 30 September 2017, is estimated to be approximately 1.34c/kWh in 2017
nominal monies. This is an increase of 1.44% on the 2015/2016 tariff period
transmission AUP (approximately 0.11% increase in end user tariff). Table 2
provides the resultant demand tariffs. This rise in AUP can be attributed mostly to the
following factors:
- The increase in overall revenue to be collected in 2017 as per the PR4
determination;;
- A key element driving the increase is deferred capital expenditure from PR3 in
addition to forecast new connections;
- An increase to asset management costs (opex) due to successful planning
applications for new line builds; and
- An increase to repairs and maintenance costs driven by a reduction in lone
working and implementation of health and safety processes.
28 27% of 2016 calendar year revenue and 73% of 2017 calendar year revenue, based on the demand weighted average.

Page 28 of 30
5. Summary
This Information Note outlines the application of the first PR4 annual update (2017)
to the PR4 transmission revenue. This revenue is to be collected during calendar
year 2017 and will cover the costs of the TSO and TAO.
The paper outlines:
- The TSO allowed revenue approved for the 2017 calendar year;
- The TAO allowed revenue approved for the 2017 calendar year; and
- The Demand TUoS tariffs approved for implementation during the tariff period
from 1 October 2016 to 30 September 2017.29
The total transmission allowed revenue for the 2017 calendar year as per the annual
update is €354.84million (2015 monies). This is a decrease of 1.48% relative to the
€360.17 million (2015 monies) that was allowed for the 2016 calendar year in the
PR4 determination.
The total transmission allowed revenue for the TUoS tariff period from 1 October
2016 to 30 September 2017 is €356.83 million (2017 monies). This is a nominal
revenue increase of 4.6% relative to the equivalent revenue (€341.23 million) for the
period 1 October 2015 to 30 September 2016.
The transmission AUP for the 2016/2017period is estimated to be €1.34c/kWh in
2017 monies. This is an increase of 1.44% on the 2015/2016 tariff period
transmission AUP.
The Demand TUoS tariffs that have been approved for implementation during the
period from 1 October 2016 to 30 September 2017 are contained in Appendix A of
this paper.
29 The full Statement of Charges will be published by EirGrid under Section 36 of the Electricity Regulation Act 1999 before the commencement of the upcoming tariff period.

Page 29 of 30
Appendix A - Transmission Tariffs 2014/2015
1.A Demand TUoS Tariffs for the Republic of Ireland
In calculating the TUoS Demand Tariffs, which cover the twelve month period from
1st October 2016 to 30th September 2017, EirGrid has applied an energy based
weighting to the tariffs derived from the transmission revenue for the full calendar
year of 201630 and the full calendar year 2017. The TUoS Demand Tariffs are
detailed in the table below.
The following should be noted when reviewing the table:
- Large Energy Users (LEUs) are defined as Users in the DUoS tariff group
DG7, DG8, or DG9; users connected to the 110kV network; or users
connected directly to the transmission system. 31
- Non-Large Energy Users (Non-LEUs) are defined as Users in the DUoS tariff
group DG1, DG2, DG3, DG4, DG5, DG5a, DG5b, DG6, DG6a or DG6b.32
- DTS-T customers are those directly connected to the transmission system.
DTS-T customers are classed as LEUs.33
- DTS-D1 customers are those indirectly connected to the transmission system
via the distribution system and have a maximum import capacity (MIC) of
greater than or equal to 0.5MWs. DTS-D2 customers have the potential to be
classed as either LEUs or non-LEUs.34
- DTS-D2 customers are those indirectly connected to the transmission system
via the distribution system and have a MIC of less than 0.5MWs. DTS-D2
customers have the potential to be classed as either LEUs or non-LEUs.35
30 Please refer to 2016 transmission revenue decision paper – CER/15/216 31 Definition/ Interpretation as per EirGrid's Statement of Charges 2015/2016 32 Ibid 33 Ibid 34 Definition/ Interpretation as per EirGrid's Statement of Charges 2015/2016 35 Ibid

Page 30 of 30
Schedule of 2016/2017 TUoS Demand Tariffs
Schedule TUoS Charge Charges % Variance Charges % Variance
2016/2017
non-LEUs
Change from
15/16 non-
LEU tariffs
2016/2017
LEUs
Change
from 15/16
LEU tariffs
DTS-T Network Capacity Charge € 1,770.4821/MW36 2.86% € 1,305.9947/MW 5.58%
Network Transfer Charge € 2.8623/MWh37 -0.22% € 2.1114/MW 2.42%
System Services Charge € 3.8242/MWh38 5.85% € 2.8210/MW 8.65%
DSM* Charge € 0.0003/MWh39 -93.90% € 0.0003/MW -93.90%
DTS-D1 Network Capacity Charge € 1,482.1834/MW 3.52% € 1,093.3314/MW 6.25%
Network Transfer Charge € 2.8623/MW -0.22% € 2.1114/MW 2.42%
System Services Charge € 3.8242/MW 5.85% € 2.8210/MW 8.65%
DSM* Charge € 0.0003/MW -93.90% € 0.0003/MW -93.90%
DTS-D2 Network Capacity Charge € 6.0246/MWh -0.71% € 4.4440/MWh 1.92%
Network Transfer Charge € 2.8623/MWh -0.22% € 2.1114/MWh 2.42%
System Services Charge € 3.8242/MWh 5.85% € 2.8210/MWh 8.65%
DSM* Charge € 0.0003/MWh -93.90% € 0.0003/MWh -93.90%
*Demand Side Management (DSM)
The full set of Demand tariffs and application of these tariffs will be set out in
EirGrid’s Statement of Charges to be approved by the CER and published by EirGrid
under Section 36 of the Electricity Regulation Act 1999, before the commencement
of the upcoming tariff period.
1.B All-island Generator TUoS Tariffs
The All-Island Generator Tariffs for the period 1st October 2016 to 30th September
2017 will be published on EirGrid’s website.40
36 All DTS-T connected customers are LEUs, therefore this charge is not applicable. 37 Ibid 38 Ibid 39 Ibid 40 EirGrid TUoS webpage