Embed Size (px)
Citation preview

City of Southlake, Texas
2017 Traffic Count Report
(Year B)
2017 Year B Counts collected in April 2017 2016 Year A Counts collected in April 2016.
Prepared by:
Lee Engineering for
City of Southlake, Texas 1400 Main Street, Suite 310
Southlake, TX 76092 Phone: 817-748-8621
www.cityofsouthlake.com

Southlake, Texas 2017 Traffic Count Report (Year B) Page 2
Introduction & Purpose This report is prepared every few years by the city staff to provide information regarding traffic volumes on roadways in the city. The traffic volumes are collected at designated traffic count locations. For analytical and historical purposes, every attempt is made to count the same locations each time a new report is prepared. Additional stations are added as new roadways are constructed or traffic volumes increase along existing roadways to warrant counts being collected. The main purpose of this report is to serve as a “snapshot” of the traffic volume conditions at a fixed point in time. Traffic data from different time periods can be used to analyze trends and to assist in identification of problem areas. Traffic data is the foundation of many specialized studies, such as warrant studies for traffic signals, and is used in part when updating the city’s Mobility and Master Thoroughfare Plan. Also, the traffic count data is provided to the Planning and Zoning Commission and City Council to assist them in evaluating planning cases such as rezonings, site plans and plats. This report also serves as a valuable economic development tool for real estate brokers, lenders, developers, and others with similar interests. Traffic volume is a critical factor associated with many of the decision points made by companies, particularly retailers, when looking to locate businesses in a particular region. This traffic count report will also provide current traffic data for any area of interest in the city to residents, property owners, and other interested parties. Beginning in 2014, the City of Southlake was divided into two count zones in order to split the data collection effort into separate years. Year B, collected in spring of 2017, includes data in the southern portion of the City. Year A data was previously collected in 2016 and collected data along the entire SH 114 corridor, as well as all count locations generally north of Highland Street. The map of traffic count locations shown in Figure 1 depicts the over 100 different count locations along arterial and collector roadways within the City of Southlake, regardless of collection year. Figure 2 depicts the count locations along SH 114. Figure 3 depicts the count zone boundaries for the Year A and Year B collection zones. This year in 2017, two-direction counts were taken at arterial and collection locations in the Year B zone. This report presents the basic traffic volume data recently collected at these locations. Traffic counts for the Year B zone were collected on weekdays from April 18 to May 3, 2017. Year A counts taken along SH 114 frontage roads and freeway ramps were one-direction. Two-direction counts were taken at arterial and collection locations. Traffic counts for the 2016 Year A report were collected on weekdays from April 14 to April 27, 2016. The 2017 report includes one table for the data collected in the Year A zone, one table for the new 2017 data from the Year B zone, and one table for the Year A SH 114 data. All tables include the twenty-four hour counts and peak-hour traffic times for all arterial and major collector roadways within that specific study zone in Southlake. Additional historical data and analysis may be found in previous editions of the Traffic Count Report available from the Planning & Development Services Department.

Southlake, Texas 2017 Traffic Count Report (Year B) Page 3
Methodology The City of Southlake contracted with Lee Engineering to collect traffic counts at designated locations in Southlake and prepare this report. The data was downloaded to a raw data file, and a printed copy of this data was provided to the City. Between April 18 and May 3, 2017, traffic counters were placed at locations throughout the Year B zone of the city, with counts taken in both directions of traffic flow during a typical weekday. Total traffic volumes were compiled in fifteen (15) minute intervals over a twenty-four (24) hour period. The raw data sheets, with fifteen (15) minute intervals and peak hours defined for each segment can be obtained in pdf format or hard copy for the cost of reproduction from the Department of Planning & Development Services. Definitions Ref. # - The number associated with a one-directional traffic count location. Segment – A particular area of roadway, with a beginning point (“From”) and an end point (“To”) location. Direction – The direction of traffic flow for each location. Each location has two directions, each listed in a separate row in Table 1, for both northbound and southbound (NB, SB) or westbound and eastbound (WB, EB). Counts taken at frontage roads and freeway ramps were one-direction. 24-Hour Totals – The total traffic volume (each direction) counted during the 24-hour period from 12 a.m. (midnight) to 12 a.m. (midnight) the following day. A.M. Peak Hour – The one-hour time period between 12 a.m. (midnight) and 12 p.m. (noon) during which the highest one-hour traffic volume occurs, and the associated count. P.M. Peak Hour – The one-hour time period between 12 p.m. (noon) and 12 a.m. (midnight) during which the highest one-hour traffic volume occurs, and the associated count. EBFR – East Bound Frontage Road WBFR – West Bound Frontage Road

Southlake, Texas 2017 Traffic Count Report (Year B) Page 4
Figure 1: Non-Freeway Traffic Count Location Map

Southlake, Texas 2017 Traffic Count Report (Year B) Page 5
Figure 2: SH 114 Traffic Count Location Map

Southlake, Texas 2017 Traffic Count Report (Year B) Page 6
Figure 3: Year A and B Traffic Count Location Map

Ref # Segment Begin End 2013 Total 2014 Total 2016 Total% Change2014-2016
2016 AM Peak Hour
2016 AM Peak Total
2016 PM Peak Hour
2016 PM Peak Total
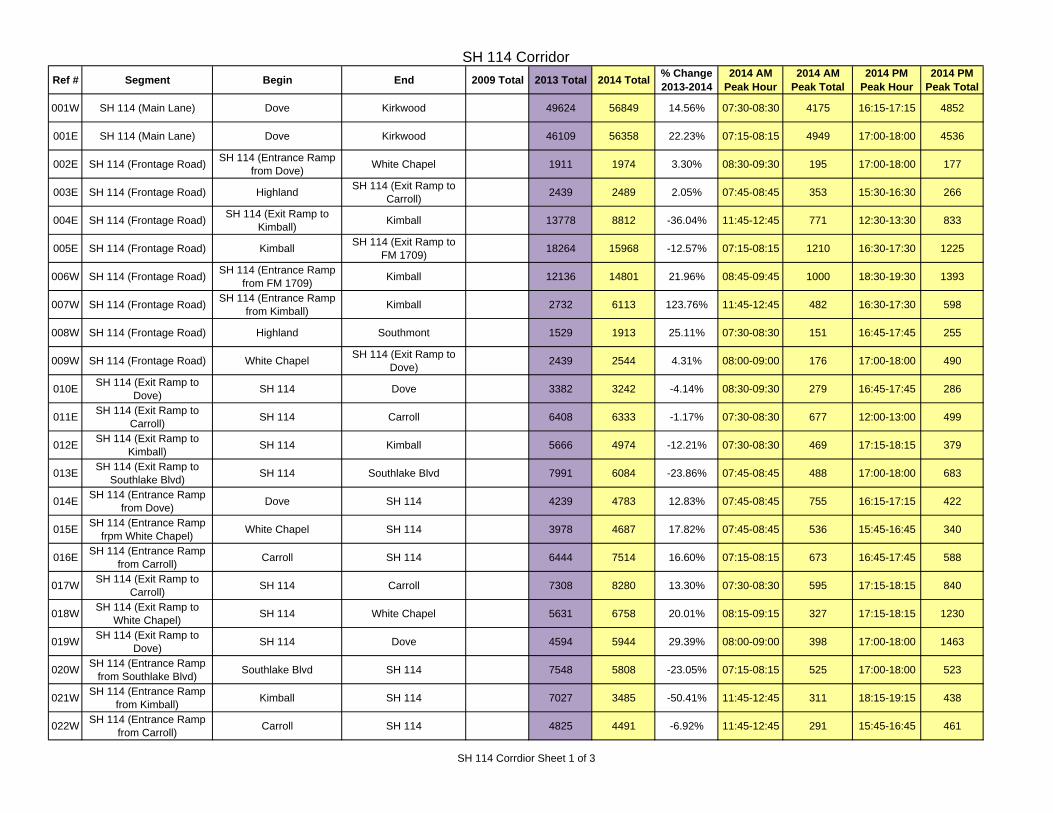
001W SH 114 (Main Lane) Dove Kirkwood 49,624 56,849 56,681 -0.30% 7:30-8:30 3,928 16:45-17:45 4,354
001E SH 114 (Main Lane) Dove Kirkwood 46,109 56,358 60,049 6.55% 6:45-7:45 4,922 16:45-17:45 5,287
002E SH 114 (Frontage Road)SH 114 (Entrance Ramp
from Dove)White Chapel 1,911 1,974 2,420 22.59% 7:45-8:45 277 17:00-18:00 207
003E SH 114 (Frontage Road) HighlandSH 114 (Exit Ramp to
Carroll)2,439 2,489 2,974 19.49% 7:30-8:30 380 15:15-16:15 331
004E SH 114 (Frontage Road)SH 114 (Exit Ramp to
Kimball)Kimball 13,778 8,812 9,794 11.14% 11:30-12:30 802 13:15-14:15 876
005E SH 114 (Frontage Road) KimballSH 114 (Exit Ramp to
FM 1709)18,264 15,968 17,980 12.60% 7:30-8:30 1,360 12:45-13:45 1,343
006W SH 114 (Frontage Road)SH 114 (Entrance Ramp
from FM 1709)Kimball 12,136 14,801 15,587 5.31% 11:30-12:30 1,070 16:45-17:45 1,515
007W SH 114 (Frontage Road)SH 114 (Entrance Ramp
from Kimball)Kimball 2,732 6,113 3,457 -43.45% 11:45-12:45 279 17:00-18:00 358
008W SH 114 (Frontage Road) Highland Southmont 1,529 1,913 2,730 42.71% 7:30-8:30 238 17:00-18:00 460
009W SH 114 (Frontage Road) White ChapelSH 114 (Exit Ramp to
Dove)2,439 2,544 3,473 36.52% 7:45-8:45 256 16:30-17:30 829
010ESH 114 (Exit Ramp to
Dove)SH 114 Dove 3,382 3,242 3,848 18.69% 7:45-8:45 385 16:45-17:45 324
011ESH 114 (Exit Ramp to
Carroll)SH 114 Carroll 6,408 6,333 7,103 12.16% 11:30-12:30 626 16:15-17:15 630
012ESH 114 (Exit Ramp to
Kimball)SH 114 Kimball 5,666 4,974 5,431 9.19% 7:30-8:30 494 12:00-13:00 445
013ESH 114 (Exit Ramp to
Southlake Blvd)SH 114 Southlake Blvd 7,991 6,084 6,158 1.22% 7:15-8:15 486 17:00-18:00 571
014ESH 114 (Entrance Ramp
from Dove)Dove SH 114 4,239 4,783 5,220 9.14% 7:15-8:15 607 16:45-17:45 518
015ESH 114 (Entrance Ramp
frpm White Chapel)White Chapel SH 114 3,978 4,687 5,823 24.24% 7:00-8:00 520 15:30-16:30 429
016ESH 114 (Entrance Ramp
from Carroll)Carroll SH 114 6,444 7,514 8,576 14.13% 7:15-8:15 608 15:30-16:30 657
017WSH 114 (Exit Ramp to
Carroll)SH 114 Carroll 7,308 8,280 10,281 24.17% 7:45-8:45 750 17:00-18:00 935
018WSH 114 (Exit Ramp to
White Chapel)SH 114 White Chapel 5,631 6,758 8,184 21.10% 7:30-8:30 402 16:45-17:45 1,475
019WSH 114 (Exit Ramp to
Dove)SH 114 Dove 4,594 5,944 6,478 8.98% 7:45-8:45 428 17:00-18:00 1,156
020WSH 114 (Entrance Ramp
from Southlake Blvd)Southlake Blvd SH 114 7,548 5,808 6,038 3.96% 7:30-8:30 506 15:30-16:30 524
021WSH 114 (Entrance Ramp
from Kimball)Kimball SH 114 7,027 3,485 6,815 95.55% 11:45-12:45 543 12:45-13:45 594
SH 114 Corridor
SH 114 Corrdior Sheet 1 of 3

Ref # Segment Begin End 2013 Total 2014 Total 2016 Total% Change2014-2016
2016 AM Peak Hour
2016 AM Peak Total
2016 PM Peak Hour
2016 PM Peak Total
SH 114 Corridor
022WSH 114 (Entrance Ramp
from Carroll)Carroll SH 114 4,825 4,491 5,145 14.56% 11:45-12:45 354 12:45-13:45 464
023WSH 114 (Entrance Ramp
from Dove)Dove SH 114 3,620 4,444 5,588 25.74% 8:00-9:00 329 16:30-17:30 1,127
1aW SH 114 (Main Lane) City Limit Kimball 44,137 59,603 58,038 -2.63% 3,776 5,211
1aE SH 114 (Main Lane) Kimball City Limit 37,323 52,709 57,128 8.38% 4,666 4,921
1bW SH 114 (Main Lane) KimballSH 114 (Entrance Ramp
from Kimball)51,685 65,411 64,076 -2.04% 4,282 5,735
1bE SH 114 (Main Lane)SH 114 (Exit Ramp to
Kimball)Kimball 45,314 58,793 63,286 7.64% 5,152 5,492
3W SH 114 (Frontage Road) Northwest Highway Kimball 19,684 20,609 21,625 4.93% 1,576 2,039
3E SH 114 (Frontage Road) Northwest Highway Kimball 26,255 22,052 24,138 9.46% 1,846 1,914
4W SH 114 (Main Lane)SH 114(Entrance Ramp
from Kimball)SH 114 (Exit Ramp to
Carroll)58,712 68,896 70,891 2.90% 4,825 6,329
4E SH 114 (Main Lane)SH 114 (Entrance Ramp
from Carroll)SH 114 (Exit Ramp to
Kimball)50,980 63,767 68,717 7.76% 5,646 5,937
5W SH 114 (Frontage Road) Kimball Carroll 2,732 6,113 3,457 -43.45% 279 358
5E SH 114 (Frontage Road) Kimball Carroll 8,112 3,838 4,363 13.68% 308 431
6aW SH 114 (Main Lane)SH 114 (Exit Ramp to
Carroll)SH 114 (Entrance Ramp
from Carroll)51,404 60,616 60,610 -0.01% 4,075 5,394
6aE SH 114 (Main Lane)SH 114 (Exit Ramp to
Carroll)SH 114 (Entrance Ramp
from Carroll)44,536 56,253 60,141 6.91% 5,038 5,280
6bW SH 114 (Main Lane)SH 114 (Entrance Ramp
from Carroll)SH 114 (Exit Ramp to
White Chapel)56,229 65,107 65,755 1.00% 4,429 5,858
6bE SH 114 (Main Lane)SH 114 (Entrance Ramp
from White Chapel)SH 114 (Exit Ramp to
Carroll)50,944 62,586 67,244 7.44% 5,664 5,910
7W SH 114 (Frontage Road) Carroll Highland 1,529 1,913 2,730 42.71% 238 460
7E SH 114 (Frontage Road) Carroll Highland 2,439 2,489 2,974 19.49% 380 331
8W SH 114 (Frontage Road) Highland White Chapel 1,529 1,913 2,730 42.71% 238 460
8E SH 114 (Frontage Road) Highland White Chapel 2,439 2,489 2,974 19.49% 380 331
9W SH 114 (Main Lane)SH 114 (Exit Ramp to
White Chapel)SH 114 (Exit Ramp to
Dove)50,598 58,349 57,571 -1.33% 4,027 4,383
9E SH 114 (Main Lane)SH 114 (Entrance Ramp
from Dove)SH 114 (Entrance Ramp
from White Chapel)46,966 57,899 61,421 6.08% 5,144 5,481
SH 114 Corrdior Sheet 2 of 3

Ref # Segment Begin End 2013 Total 2014 Total 2016 Total% Change2014-2016
2016 AM Peak Hour
2016 AM Peak Total
2016 PM Peak Hour
2016 PM Peak Total
SH 114 Corridor
10W SH 114 (Frontage Road) White Chapel Dove 2,439 2,544 3,473 36.52% 256 829
10E SH 114 (Frontage Road) White Chapel Dove 1,911 1,974 2,420 22.59% 277 207
11W SH 114 (Main Lane)SH 114 (Exit Ramp to
Dove)Dove 46,004 52,405 51,093 -2.50% 3,599 3,227
11E SH 114 (Main Lane) DoveSH 114 (Entrance Ramp
from Dove)42,727 53,116 56,201 5.81% 4,537 4,963
12W SH 114 (Frontage Road) Dove Kirkwood 3,620 4,444 5,588 25.74% 329 1,127
12E SH 114 (Frontage Road) Dove Kirkwood 3,382 3,242 3,848 18.69% 385 324
111E SH 114 (Frontage Road) FM 1709 Industrial Blvd - 19,580 21,357 9.08% 7:15-8:15 1,687 16:30-17:30 1,493
112WSH 114 (WB Exit Ramp to
Kimball)FM 1709 Kimball - 11,612 12,530 7.91% 11:30-12:30 822 17:15-18:15 1,260
113ESH 114 (EB Entrance Ramp from Kimball)
Kimball FM 1709 - 12,215 13,854 13.42% 7:15-8:15 1,091 14:00-15:00 998
*Reference Number 2 was intentionally skipped
SH 114 Corrdior Sheet 3 of 3

Ref # Segment Begin End 2013 Total 2014 Total 2016 Total% Change2013-2014
% Change2014-2016
2016 AM Peak Hour
2016 AM Peak Total
2016 PM Peak Hour
2016 PM Peak Total
31W Highland Kimball Carroll 508 504 567 -0.79% 12.50% 7:15-8:15 97 14:15-15:15 5731E Highland Kimball Carroll 461 461 563 0.00% 22.13% 7:30-8:30 65 15:00-16:00 6632W Highland Carroll SH 114 246 283 418 15.04% 47.70% 7:45-8:45 78 15:15-16:15 7032E Highland Carroll SH 114 21 20 372 -4.76% 1760.00% 11:30-12:30 59 15:15-16:15 5433W Highland SH 114 White Chapel 383 584 421 52.48% -27.91% 7:15-8:15 56 16:30-17:30 6833E Highland SH 114 White Chapel 1,379 1,109 1,295 -19.58% 16.77% 7:45-8:45 220 15:30-16:30 18234W Highland White Chapel Shady Oaks 1,308 1,444 1,750 10.40% 21.19% 7:45-8:45 221 16:45-17:45 27234E Highland White Chapel Shady Oaks 1,773 1,909 2,128 7.67% 11.47% 7:30-8:30 453 15:30-16:30 24735W Turnberry Shady Oaks Peytonville 695 647 636 -6.91% -1.70% 11:45-12:45 42 15:30-16-30 8435E Turnberry Shady Oaks Peytonville 804 751 862 -6.59% 14.78% 7:30-8:30 162 15:30-16:30 8836W Dove Kimball Carroll 2,370 1,589 1,830 -32.95% 15.17% 7:30-8:30 185 17:15-18:15 25136E Dove Kimball Carroll 2,196 1,705 1,704 -22.36% -0.06% 7:30-8:30 153 16:30-17:30 20537W Dove Carroll White Chapel 2,488 2,228 2,517 -10.45% 12.97% 7:15-8:15 233 17:15-18:15 35137E Dove Carroll White Chapel 2,714 2,122 2,345 -21.81% 10.51% 7:30-8:30 206 17:00-18:00 26038W Dove White Chapel SH 114 2,606 2,430 3,447 -6.75% 41.85% 7:30-8:30 341 17:00-18:00 72738E Dove White Chapel SH 114 2,453 2,103 2,377 -14.27% 13.03% 7:30-8:30 305 17:00-18:00 33939W Dove Shady Oaks Peytonville 5,135 5,716 6,322 11.31% 10.60% 7:30-8:30 408 16:45-17:45 109039E Dove Shady Oaks Peytonville 4,575 5,365 5,344 17.27% -0.39% 7:15-8:15 798 17:00-18:00 44040W Dove Peytonville Randol Mill 3,168 3,682 4,434 16.22% 20.42% 7:45-8:45 224 17:00-18:00 89840E Dove Peytonville Randol Mill 2,872 3,274 3,789 14.00% 15.73% 7:00-8:00 627 16:45-17:45 39742W Kirkwood SH 114 Precinct Line 1,855 3,209 2,340 72.99% -27.08% 11:30-12:30 153 16:45-17:45 45642E Kirkwood SH 114 Precinct Line 1,275 2,987 3,655 134.27% 22.36% 7:15-8:15 929 17:00-18:00 36743W Bob Jones White Chapel TW King 213 195 232 -8.45% 18.97% 7:15-8:15 19 17:15-18:15 3143E Bob Jones White Chapel TW King 208 147 200 -29.33% 36.05% 7:45-8:45 17 15:45-16:45 2244N TW King Kirkwood Bob Jones 426 381 424 -10.56% 11.29% 8:30-9:30 33 15:15-16:15 4744S TW King Kirkwood Bob Jones 446 410 441 -8.07% 7.56% 7:15-8:15 44 15:00-16:00 4553N Peytonville Coventry Dove 2,458 2,393 2,292 -2.64% -4.22% 7:30-8:30 267 14:30-15:30 18053S Peytonville Coventry Dove 2,566 2,487 2,584 -3.08% 3.90% 7:15-8:15 274 16:30-17:30 33055N Shady Oaks Highland Dove 1,137 1,411 1,216 24.10% -13.82% 7:45-8:45 154 17:15-18:15 16255S Shady Oaks Highland Dove 1,355 1,203 1,268 -11.22% 5.40% 7:45-8:45 222 15:30-16:30 16759N White Chapel Highland SH 114 6,537 6,681 7,966 2.20% 19.23% 7:30-8:30 831 16:30-17:30 74259S White Chapel Highland SH 114 6,915 7,017 8,466 1.48% 20.65% 7:30-8:30 535 16:15-17:15 816
60aN White Chapel SH 114 Kirkwood 3,150 3,358 4,442 6.60% 32.28% 7:15-8:15 308 17:00-18:00 80360aS White Chapel SH 114 Kirkwood 2,979 2,982 3,508 0.10% 17.64% 7:15-8:15 373 15:00-16:00 30460N White Chapel Kirkwood Dove 3,222 2,816 3,758 -12.60% 33.45% 7:30-8:30 250 17:00-18:00 76860S White Chapel Kirkwood Dove 3,049 2,508 2,960 -17.74% 18.02% 7:30-8:30 313 15:00-16:00 28661N White Chapel Dove Bob Jones 2,250 1,488 1,723 -33.87% 15.79% 7:45-8:45 98 17:15-18:15 31861S White Chapel Dove Bob Jones 2,207 1,463 1,657 -33.71% 13.26% 7:30-8:30 139 19:00-20:00 24766N Carroll Highland Dove 2,942 2,650 2,788 -9.93% 5.21% 7:45-8:45 225 17:15-18:15 27366S Carroll Highland Dove 2,854 3,423 2,656 19.94% -22.41% 7:30-8:30 340 18:15-19:15 22867N Carroll Dove Burney 1,717 915 1,983 -46.71% 116.72% 7:45-8:45 137 16:30-17:30 17467S Carroll Dove Burney 1,730 950 2,072 -45.09% 118.11% 7:15-8:15 258 16:30-17:30 17868N Lonesome Dove Dove Burney 413 1,272 1,660 207.99% 30.50% 11:30-12:30 93 18:15-19:15 21468S Lonesome Dove Dove Burney 390 1,331 1,592 241.28% 19.61% 7:30-8:30 181 18:30-19:30 144
73aN Kimball SH 114 Kirkwood 6,457 6,385 7,114 -1.12% 11.42% 11:45-12:45 430 18:00-19:00 72773aS Kimball SH 114 Kirkwood 6,071 6,782 6,915 11.71% 1.96% 7:15-8:15 773 16:45-17:45 48773N Kimball Kirkwood Highland 6,486 5,496 6,285 -15.26% 14.36% 11:45-12:45 355 18:00-19:00 69873S Kimball Kirkwood Highland 5,415 5,408 6,045 -0.13% 11.78% 07:15-08:15 755 18:00-19:00 42574N Kimball Highland Dove 4,721 4,541 5,209 -3.81% 14.71% 11:45-12:45 307 18:00-19:00 57374S Kimball Highland Dove 4,545 4,801 5,037 5.63% 4.92% 7:15-8:15 637 16:45-17:45 353
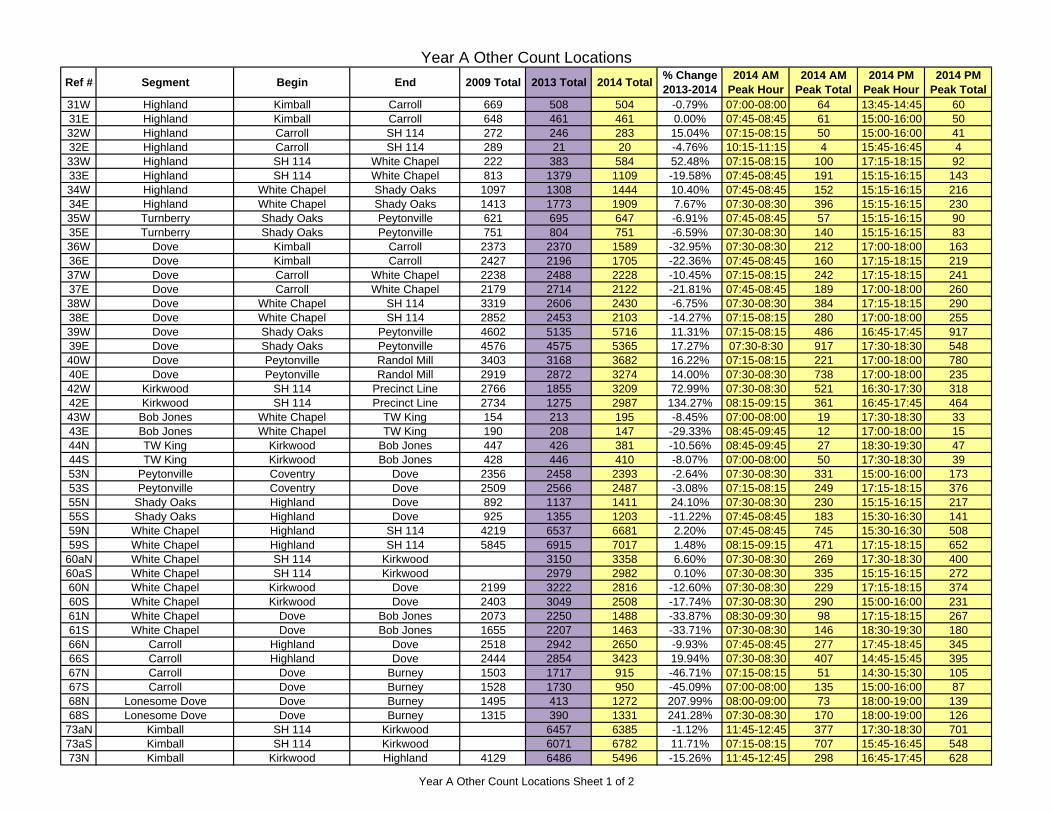
Year A Count Locations
Year A Count Locations Sheet 1 of 2

Ref # Segment Begin End 2013 Total 2014 Total 2016 Total% Change2013-2014
% Change2014-2016
2016 AM Peak Hour
2016 AM Peak Total
2016 PM Peak Hour
2016 PM Peak Total
Year A Count Locations
75N Kimball Dove City Limit 2,816 2,784 2,976 -1.14% 6.90% 11:45-12:45 164 16:45-17:45 32975S Kimball Dove City Limit 2,613 2,793 3,151 6.89% 12.82% 7:00-8:00 385 16:45-17:45 24480N* Randol Mill Kingswood Marantha 4,733 5,874 4,916 -16.31% 7:45-8:45 506 15:30-16:30 42680S* Randol Mill Kingswood Marantha 5,703 6,688 4,327 -35.30% 7:30-8:30 373 15:00-16:00 39581N** Sam School Dove Kirkwood 747 768 - - - - - - -81S** Sam School Dove Kirkwood 697 628 - - - - - - -82N White Chapel Bob Jones City Limit 157 139 148 -11.46% 6.47% 10:30-11:30 15 13:30-14:30 2182S White Chapel Bob Jones City Limit 162 125 149 -22.84% 19.20% 10:30-11:30 15 17:45-18:45 2093N TW King SH 114 TW King E 537 565 519 5.21% -8.14% 8:30-9:30 46 15:15-16:15 5793S TW King SH 114 TW King E 376 395 382 5.05% -3.29% 7:45-8:45 44 17:15-18:15 3694N Randol Mill Our Dove 948 1,002 1,264 5.70% 26.15% 7:30-8:30 157 16:45-17:45 10394S Randol Mill Our Dove 1,398 1,270 1,374 -9.16% 8.19% 11:15-12:15 71 17:00-18:00 21795N Carroll SH 114 Highland 5,418 4,379 4,916 -19.18% 12.26% 7:45-8:45 506 15:30-16:30 42695S Carroll SH 114 Highland 4,641 4,006 4,327 -13.68% 8.01% 7:30-8:30 373 15:00-16:00 395
103N Precinct Line Randol Mill Sabine 4,202 4,465 4,554 6.26% 1.99% 7:15-8:15 572 12:15-13:15 294103S Precinct Line Randol Mill Sabine 4,729 4,925 4,633 4.14% -5.93% 11:30-12:30 290 16:30-17:30 535104N Kirkwood Dove Stockton 1,538 1,585 2,289 3.06% 44.42% 7:45-8:45 240 16:45-17:45 566104S Kirkwood Dove Stockton 1,920 1,639 1,868 -14.64% 13.97% 11:15-12:15 146 16:45-17:45 409105W Kirkwood White Chapel Carroll 392 120 293 -69.39% 144.17% 10:45-11:45 33 13:00-14:00 27105E Kirkwood White Chapel Carroll 414 149 483 -64.01% 224.16% 11:00-12:00 52 15:30-16:30 56106W Kirkwood Carroll Highland 1,863 1,211 1,245 -35.00% 2.81% 7:45-8:45 223 15:30-16:30 188106E Kirkwood Carroll Highland 2,231 1,538 1,686 -31.06% 9.62% 7:45-8:45 390 15:15-16:15 230107W Kirkwood Highland Blessed 1,023 725 576 -29.13% -20.55% 7:45-8:45 143 15:30-16:30 139107E Kirkwood Highland Blessed 1,565 1,077 953 -31.18% -11.51% 7:45-8:45 326 15:15-16:15 167108W Kirkwood Blessed Kimball 526 647 652 23.00% 0.77% 7:45-8:45 149 15:15-16:15 131108E Kirkwood Blessed Kimball 863 1,294 857 49.94% -33.77% 7:45-8:45 174 15:30-16:30 144109N Blessed SH 114 Kirkwood 1,206 603 255 -50.00% -57.71% 7:45-8:45 30 15:15-16:15 27109S Blessed SH 114 Kirkwood 1,188 607 422 -48.91% -30.48% 7:45-8:45 115 15:30-16:30 99116W Kirkwood SH 114 TW King - - 4,752 - 7:15-8:15 477 17:00-18:00 946116E Kirkwood SH 114 TW King - - 2,588 - 8:15-9:15 628 12:15-13:15 197
*Location 80 was previously collected in 2015, rather than 2014.**Location 81 was not counted in 2016 due to the road being closed for construction.***Reference Numbers 41, 83, 89, 90, 91, and 96 were intentionally skipped.
Year A Count Locations Sheet 2 of 2

Ref # Segment Begin End 2013 Total 2015 Total 2017 Total % Change2013-2015
% Change2015-2017
2017 AM Peak Hour
2017 AM Peak Total
2017 PM Peak Hour
2017 PM Peak Total
13bW FM 1709 SH 114 Gateway - 16,040 16,745 - 4.40% 11:45-12:45 1,282 16:45-17:45 1,58613bE FM 1709 SH 114 Gateway - 19,370 20,445 - 5.55% 7:00-8:00 1,735 16:30-17:30 1,52113aW FM 1709 Gateway Nolen 15,124 14,846 16,069 -1.84% 8.24% 11:45-12:45 1,361 17:00-18:00 1,50813aE FM 1709 Gateway Nolen 18,402 17,735 18,191 -3.62% 2.57% 7:00-8:00 1,575 17:00-18:00 1,31013W FM 1709 Nolen Kimball 19,054 18,369 18,411 -3.60% 0.23% 11:45-12:45 1,609 16:45-17:45 1,79913E FM 1709 Nolen Kimball 20,652 20,285 19,928 -1.78% -1.76% 7:15-8:15 1,667 12:15-13:15 1,45014W FM 1709 Kimball Carroll 21,431 25,379 22,000 18.42% -13.31% 11:45-12:45 1,506 16:30-17:30 2,22314E FM 1709 Kimball Carroll 22,294 23,395 23,522 4.94% 0.54% 7:15-8:15 2,327 12:30-13:30 1,54715W FM 1709 Carroll Byron Nelson 26,563 23,966 25,076 -9.78% 4.63% 11:45-12:45 1,469 16:45-17:45 2,54915E FM 1709 Carroll Byron Nelson 27,226 25,545 26,551 -6.17% 3.94% 7:15-8:15 2,718 12:30-13:30 1,66416W FM 1709 Byron Nelson White Chapel 25,006 24,299 20,946 -2.83% -13.80% 7:30-8:30 1,080 17:00-18:00 2,44516E FM 1709 Byron Nelson White Chapel 25,639 25,189 21,944 -1.76% -12.88% 7:15-8:15 2,783 17:15-18:15 1,53017W FM 1709 White Chapel Shady Oaks 26,501 25,385 26,599 -4.21% 4.78% 11:45-12:45 1,507 16:30-17:30 2,77417E FM 1709 White Chapel Shady Oaks 27,878 27,182 26,321 -2.50% -3.17% 6:45-7:45 2,665 13:00-14:00 1,66718W FM 1709 Shady Oaks Southridge Lakes 24,997 23,647 25,473 -5.40% 7.72% 11:45-12:45 1,372 16:30-17:30 2,71718E FM 1709 Shady Oaks Southridge Lakes 25,998 27,262 26,433 4.86% -3.04% 7:00-8:00 2,928 13:00-14:00 1,72219W FM 1709 Southridge Lakes Peytonville 24,948 24,094 24,641 -3.42% 2.27% 11:45-12:45 1,325 16:45-17:45 2,61819E FM 1709 Southridge Lakes Peytonville 26,014 25,225 25,804 -3.03% 2.30% 7:00-8:00 2,849 13:00-14:00 1,75020W FM 1709 Peytonville Randol Mill 23,663 22,797 22,770 -3.66% -0.12% 11:45-12:45 1,276 16:45-17:45 2,47720E FM 1709 Peytonville Randol Mill 24,880 24,309 23,516 -2.30% -3.26% 7:00-8:00 2,702 13:15-14:15 1,42821W FM 1709 Randol Mill Pearson 19,472 18,766 18,433 -3.63% -1.77% 11:45-12:45 1,018 17:00-18:00 2,06621E FM 1709 Randol Mill Pearson 18,893 18,836 18,619 -0.30% -1.15% 6:45-7:45 2,230 13:15-14:15 1,15822N Crooked Lane Nolen Kimball 563 499 647 -11.37% 29.66% 7:45-8:45 71 15:30-16:30 6622S Crooked Lane Nolen Kimball 554 593 714 7.04% 20.40% 11:45-12:45 68 17:00-18:00 10323N Crooked Lane Kimball Continental 1,529 1,735 1,509 13.47% -13.03% 7:30-8:30 182 18:00-19:00 15323S Crooked Lane Kimball Continental 1,862 1,949 1,917 4.67% -1.64% 7:45-8:45 211 15:45-16:45 26424W Continental Kimball Crooked 3,575 4,820 5,429 34.83% 12.63% 11:30-12:30 293 17:00-18:00 72424E Continental Kimball Crooked 4,135 4,781 5,546 15.62% 16.00% 7:30-8:30 923 16:45-17:45 35125W Continental Crooked Carroll 4,544 6,084 6,290 33.89% 3.39% 7:45-8:45 425 17:00-18:00 84825E Continental Crooked Carroll 4,886 5,534 6,083 13.26% 9.92% 7:30-8:30 1,003 15:30-16:30 43326W Continental Carroll Byron Nelson 4,682 6,235 6,467 33.17% 3.72% 7:45-8:45 475 17:15-18:15 80126E Continental Carroll Byron Nelson 5,039 5,786 6,106 14.82% 5.53% 7:30-8:30 823 16:00-17:00 44927W Continental Byron Nelson White Chapel 5,654 5,936 6,932 4.99% 16.78% 7:30-8:30 371 17:00-18:00 92527E Continental Byron Nelson White Chapel 5,652 7,280 6,538 28.80% -10.19% 7:15-8:15 886 17:45-18:45 46028W Continental White Chapel Peytonville 5,371 5,226 6,608 -2.70% 26.44% 7:15-8:15 407 16:30-17:30 72028E Continental White Chapel Peytonville 5,254 4,958 6,310 -5.63% 27.27% 7:15-8:15 856 16:15-17:15 46429W Continental Peytonville Davis 4,743 5,240 5,549 10.48% 5.90% 11:45-12:45 327 16:45-17:45 60429E Continental Peytonville Davis 4,754 5,130 5,620 7.91% 9.55% 7:15-8:15 798 16:45-17:45 40530W Union Church Davis Pearson 2,380 2,500 2,894 5.04% 15.76% 7:30-8:30 196 17:15-18:15 30930E Union Church Davis Pearson 2,335 2,495 2,748 6.85% 10.14% 7:00-8:00 265 16:00-17:00 21545N Pearson Union Church FM 1709 2,387 2,241 2,470 -6.12% 10.22% 7:30-8:30 236 16:45-17:45 20545S Pearson Union Church FM 1709 2,434 2,596 2,761 6.66% 6.36% 7:30-8:30 250 17:15-18:15 24746N Pearson FM 1709 Johnson 3,036 3,312 2,917 9.09% -11.93% 7:30-8:30 268 17:00-18:00 23946S Pearson FM 1709 Johnson 3,193 3,263 3,105 2.19% -4.84% 7:00-8:00 223 16:45-17:45 36947N Pearson Johnson Florence 3,244 3,533 3,233 8.91% -8.49% 7:30-8:30 417 15:15-16:15 29147S Pearson Johnson Florence 3,443 3,467 3,475 0.70% 0.23% 7:15-8:15 296 16:45-17:45 44448N Davis Continental FM 1709 15,856 15,144 15,000 -4.49% -0.95% 7:00-8:00 1,319 17:15-18:15 1,07148S Davis Continental FM 1709 15,375 13,523 14,818 -12.05% 9.58% 11:30-12:30 897 16:45-17:45 1,53249N Randol Mill FM 1709 Johnson 6,657 6,712 8,164 0.83% 21.63% 7:15-8:15 757 17:00-18:00 677
Year B Count Locations
Year B Count Locations Sheet 1 of 3

Ref # Segment Begin End 2013 Total 2015 Total 2017 Total % Change2013-2015
% Change2015-2017
2017 AM Peak Hour
2017 AM Peak Total
2017 PM Peak Hour
2017 PM Peak Total
Year B Count Locations
49S Randol Mill FM 1709 Johnson 7,514 7,406 8,301 -1.44% 12.08% 7:00-8:00 682 16:45-17:45 86250N Randol Mill Johnson Florence 6,298 6,598 7,477 4.76% 13.32% 7:15-8:15 767 17:00-18:00 56850S Randol Mill Johnson Florence 6,367 7,095 7,347 11.43% 3.55% 7:00-8:00 513 16:30-17:30 80351N Peytonville Continental Stonebury 1,855 2,244 2,214 20.97% -1.34% 7:00-8:00 387 15:00-16:00 22751S Peytonville Continental Stonebury 2,053 2,252 1,998 9.69% -11.28% 7:15-8:15 202 13:00-14:00 209
52aN Peytonville Stonebury FM 1709 3,006 2,130 2,974 -29.14% 39.62% 7:00-8:00 549 15:00-16:00 29252aS Peytonville Stonebury FM 1709 2,997 2,247 2,700 -25.03% 20.16% 7:15-8:15 200 13:00-14:00 27552N Peytonville FM 1709 Coventry 2,679 2,318 2,445 -13.48% 5.48% 7:30-8:30 260 16:30-17:30 22052S Peytonville FM 1709 Coventry 2,973 2,505 2,905 -15.74% 15.97% 7:00-8:00 486 16:45-17:45 29654N Shady Oaks FM 1709 Highland 2,028 2,104 2,385 3.75% 13.36% 7:30-8:30 345 15:15-16:15 26554S Shady Oaks FM 1709 Highland 1,862 2,015 2,161 8.22% 7.25% 7:30-8:30 188 15:45-16:45 30356N White Chapel City Limit Continental 4,092 3,750 4,483 -8.36% 19.55% 7:30-8:30 464 17:15-18:15 35656S White Chapel City Limit Continental 4,439 4,420 4,997 -0.43% 13.05% 7:45-8:45 318 17:00-18:00 66457N White Chapel Continental FM 1709 4,724 4,434 4,934 -6.14% 11.28% 7:30-8:30 660 16:45-17:45 42257S White Chapel Continental FM 1709 5,271 4,857 5,150 -7.85% 6.03% 7:30-8:30 292 17:00-18:00 52958N White Chapel FM 1709 Highland 6,909 6,413 10,847 -7.18% 69.14% 7:15-8:15 877 16:30-17:30 1,20458S White Chapel FM 1709 Highland 7,406 6,898 9,156 -6.86% 32.73% 7:15-8:15 681 16:15-17:15 94862N Byron Nelson FM 1709 Continental 2,273 2,972 2,198 30.75% -26.04% 7:15-8:15 301 16:15-17:15 20262S Byron Nelson FM 1709 Continental 2,470 2,829 2,171 14.53% -23.26% 7:30-8:30 146 16:45-17:45 24763N Byron Nelson Continental City Limit 918 845 1,005 -7.95% 18.93% 7:45-8:45 99 17:45-18:45 10463S Byron Nelson Continental City Limit 968 570 1,013 -41.12% 77.72% 7:15-8:15 83 16:45-17:45 8564N Carroll Carlisle Zena Rucker 7,838 5,442 6,320 -30.57% 16.13% 7:30-8:30 557 16:15-17:15 57764S Carroll Carlisle Zena Rucker 7,294 5,403 6,431 -25.93% 19.03% 11:45-12:45 373 16:45-17:45 696
65aN Carroll Zena Rucker FM 1709 8,760 6,596 8,457 -24.70% 28.21% 11:45-12:45 632 16:15-17:15 72265aS Carroll Zena Rucker FM 1709 8,693 5,446 8,545 -37.35% 56.90% 11:30-12:30 716 16:45-17:45 86365N Carroll FM 1709 SH 114 10,893 10,491 11,458 -3.69% 9.22% 11:45-12:45 821 12:45-13:45 92865S Carroll FM 1709 SH 114 11,584 10,541 11,746 -9.00% 11.43% 11:30-12:30 956 16:45-17:45 1,19969N Brumlow SH 26 Continental 6,907 6,126 6,753 -11.31% 10.24% 7:45-8:45 628 16:15-17:15 58669S Brumlow SH 26 Continental 7,970 6,109 6,546 -23.35% 7.15% 11:45-12:45 376 17:00-18:00 70470N Kimball Continental Crooked 4,477 4,329 4,627 -3.31% 6.88% 7:45-8:45 449 16:45-17:45 46670S Kimball Continental Crooked 4,394 3,930 3,830 -10.56% -2.54% 7:45-8:45 368 15:45-16:45 38871N Kimball Crooked FM 1709 5,720 9,194 5,605 60.73% -39.04% 7:45-8:45 505 16:30-17:30 58071S Kimball Crooked FM 1709 4,145 5,286 5,039 27.53% -4.67% 7:45-8:45 557 15:15-16:15 46072N Kimball FM 1709 SH 114 8,941 10,902 10,537 21.93% -3.35% 11:45-12:45 790 12:30-13:30 87872S Kimball FM 1709 SH 114 12,150 11,908 12,620 -1.99% 5.98% 7:30-8:30 1,023 16:45-17:45 1,04676N Commerce FM 1709 Exchange 2,868 2,884 2,371 0.56% -17.79% 11:45-12:45 195 15:45-16:45 26376S Commerce FM 1709 Exchange 2,491 2,528 2,195 1.49% -13.17% 11:45-12:45 170 17:00-18:00 18477W Johnson Pearson Randol Mill 1,404 1,158 1,256 -17.52% 8.46% 10:15-11:15 54 17:15-18:15 19377E Johnson Pearson Randol Mill 1,437 1,466 1,488 2.02% 1.50% 7:15-8:15 243 16:15-17:15 10278N Southridge Lakes FM 1709 Peytonville 1,452 1,005 1,629 -30.79% 62.09% 7:30-8:30 101 15:30-16:30 16378S Southridge Lakes FM 1709 Peytonville 1,297 866 1,432 -33.23% 65.36% 7:00-8:00 135 16:45-17:45 11779W Florence Pearson Randol Mill 1,040 1,138 1,081 9.42% -5.01% 11:45-12:45 57 16:45-17:45 12179E Florence Pearson Randol Mill 802 1,024 980 27.68% -4.30% 7:15-8:15 144 16:00-17:00 7284N Nolen SH 114 FM 1709 3,367 2,951 1,761 -12.36% -40.33% 11:45-12:45 135 13:45-14:45 16484S Nolen SH 114 FM 1709 3,895 3,497 3,436 -10.22% -1.74% 11:45-12:45 342 12:00-13:00 33585N Nolen FM 1709 Crooked 2,773 4,533 3,036 63.47% -33.02% 11:45-12:45 353 16:30-17:30 39585S Nolen FM 1709 Crooked 2,710 3,476 3,068 28.27% -11.74% 8:15-9:15 345 12:45-13:45 34586N Nolen Crooked Kimball 2,479 2,205 2,000 -11.05% -9.30% 7:45-8:45 191 15:15-16:15 15686S Nolen Crooked Kimball 2,200 1,927 1,835 -12.41% -4.77% 11:30-12:30 137 16:45-17:45 204
Year B Count Locations Sheet 2 of 3

Ref # Segment Begin End 2013 Total 2015 Total 2017 Total % Change2013-2015
% Change2015-2017
2017 AM Peak Hour
2017 AM Peak Total
2017 PM Peak Hour
2017 PM Peak Total
Year B Count Locations
87N Carroll Carlisle Continental 6,337 4,840 5,201 -23.62% 7.46% 7:30-8:30 440 16:15-17:15 46487S Carroll Carlisle Continental 6,121 4,437 4,974 -27.51% 12.10% 7:30-8:30 297 16:45-17:45 47988N Kimball SH 26 Nolen 6,830 7,629 7,442 11.70% -2.45% 7:30-8:30 669 17:00-18:00 67088S Kimball SH 26 Nolen 6,855 8,767 8,491 27.89% -3.15% 8:00-9:00 657 16:45-17:45 76892N Village Center FM 1709 SH 114 2,818 1,896 1,747 -32.72% -7.86% 11:30-12:30 202 12:00-13:00 16692S Village Center FM 1709 SH 114 1,729 1,825 1,535 5.55% -15.89% 11:30-12:30 126 12:45-13:45 16597N Central FM 1709 Main 1,805 2,976 3,865 64.88% 29.87% 11:30-12:30 383 12:45-13:45 41697S Central FM 1709 Main 1,307 2,941 3,407 125.02% 15.84% 11:45-12:45 313 17:00-18:00 32598N Central Division SH 114 1,917 2,015 2,241 5.11% 11.22% 11:45-12:45 176 13:30-14:30 21598S Central Division SH 114 868 1,123 1,280 29.38% 13.98% 11:30-12:30 115 12:45-13:45 11999N Grand Division SH 114 1,408 640 1,277 -54.55% 99.53% 11:45-12:45 82 18:45-19:45 13199S Grand Division SH 114 1,244 2,014 1,924 61.90% -4.47% 11:00-12:00 166 16:45-17:45 274
100W Federal State Carroll 2,189 2,433 2,798 11.15% 15.00% 11:45-12:45 209 13:15-14:15 268100E Federal State Carroll 2,443 2,098 2,541 -14.12% 21.12% 11:30-12:30 252 16:45-17:45 276101W Prospect State Carroll 3,856 2,298 1,930 -40.40% -16.01% 10:45-11:45 197 12:00-13:00 189101E Prospect State Carroll 1,412 1,951 3,489 38.17% 78.83% 11:45-12:45 326 12:30-13:30 342102W Main State Carroll 2,065 2,602 3,091 26.00% 18.79% 11:30-12:30 342 12:00-13:00 333102E Main State Carroll 4,427 3,420 2,145 -22.75% -37.28% 11:45-12:45 167 13:00-14:00 232110N Silicon Kimball Nolen 1,584 1,409 1,588 -11.05% 12.70% 7:45-8:45 204 13:00-14:00 127110S Silicon Kimball Nolen 1,515 1,328 1,528 -12.34% 15.06% 11:45-12:45 125 16:30-17:30 226114W Zena Rucker Carroll FM 1709 - 78 171 - 119.23% 8:00-9:00 15 16:15-17:15 19114E Zena Rucker Carroll FM 1709 - 125 256 - 104.80% 7:15-8:15 25 14:45-15:45 48115N Watermere FM 1709 Union Church - 523 914 - 74.76% 8:15-9:15 80 13:45-14:45 101115S Watermere FM 1709 Union Church - 674 963 - 42.88% 8:30-9:30 79 16:00-17:00 85
*Reference Numbers 41, 83, 89, 90, 91, and 96 were intentionally skipped
Year B Count Locations Sheet 3 of 3

City of Southlake, Texas
2015 Traffic Count Report
(Year B)
2015 Year B Counts collected in April 2015 2014 Year A Counts collected in September 2014.
Prepared by:
Lee Engineering for
City of Southlake, Texas 1400 Main Street, Suite 310
Southlake, TX 76092 Phone: 817-748-8621
www.cityofsouthlake.com

Southlake, Texas 2015 Traffic Count Report (Year B) Page 2
Introduction & Purpose This report is prepared every few years by the city staff to provide information regarding traffic volumes on roadways in the city. The traffic volumes are collected at designated traffic count locations. For analytical and historical purposes, every attempt is made to count the same locations each time a new report is prepared. Additional stations are added as new roadways are constructed or traffic volumes increase along existing roadways to warrant counts being collected. The main purpose of this report is to serve as a “snapshot” of the traffic volume conditions at a fixed point in time. Traffic data from different time periods can be used to analyze trends and to assist in identification of problem areas. Traffic data is the foundation of many specialized studies, such as warrant studies for traffic signals, and is used in part when updating the city’s Mobility and Master Thoroughfare Plan. Also, the traffic count data is provided to the Planning and Zoning Commission and City Council to assist them in evaluating planning cases such as rezonings, site plans and plats. This report also serves as a valuable economic development tool for real estate brokers, lenders, developers, and others with similar interests. Traffic volume is a critical factor associated with many of the decision points made by companies, particularly retailers, when looking to locate businesses in a particular region. This traffic count report will also provide current traffic data for any area of interest in the city to residents, property owners, and other interested parties. Beginning in 2014, the City of Southlake was divided into two count zones in order to split the data collection effort into separate years. The southern portion of the City, collected in spring of 2015, was designated as Year B. Year A data was previously collected in 2014 and collected data along the entire SH 114 corridor, as well as all count locations generally north of Highland Street. The map of traffic count locations shown in Figure 1 depicts the over 100 different count locations along arterial and collector roadways within the City of Southlake, regardless of collection year. Figure 2 depicts the count locations along SH 114. Figure 3 depicts the count zone boundaries for the Year A and Year B collection zones. This year in 2015, two-direction counts were taken at arterial and collection locations in the Year B zone. This report presents the basic traffic volume data recently collected at these locations. Traffic counts for the Year B zone were collected on weekdays from April 7 to April 9, 2015. Year A counts taken along SH 114 frontage roads and freeway ramps were one-direction. Two-direction counts were taken at arterial and collection locations Traffic counts for the 2014 year A report were collected on weekdays from September 3 to September 17, 2014. The 2015 report includes one table for the data collected in the Year A zone, one table for the new 2015 data from the Year B zone, and one table for the Year A SH 114 data. All tables include the twenty-four hour counts and peak-hour traffic times for all arterial and major collector roadways within that specific study zone in Southlake. Additional historical data and analysis may be found in previous editions of the Traffic Count Report available from the Planning & Development Services Department.

Southlake, Texas 2015 Traffic Count Report (Year B) Page 3
Methodology The City of Southlake contracted with Lee Engineering to collect traffic counts at designated locations in Southlake and prepare this report. The data was downloaded to a raw data file, and a printed copy of this data was provided to the City. Between April 7 and April 9, 2015, traffic counters were placed at locations throughout the Year B zone of the city, with counts taken in both directions of traffic flow during a typical weekday. Total traffic volumes were compiled in fifteen (15) minute intervals over a twenty-four (24) hour period. The raw data sheets, with fifteen (15) minute intervals and peak hours defined for each segment can be obtained in pdf format or hard copy for the cost of reproduction from the Department of Planning & Development Services. Definitions Ref. # - The number associated with a one-directional traffic count location. Segment – A particular area of roadway, with a beginning point (“From”) and an end point (“To”) location. Direction – The direction of traffic flow for each location. Each location has two directions, each listed in a separate row in Table 1, for both northbound and southbound (NB, SB) or westbound and eastbound (WB, EB). Counts taken at frontage roads and freeway ramps were one-direction. 24-Hour Totals – The total traffic volume (each direction) counted during the 24-hour period from 12 a.m. (midnight) to 12 a.m. (midnight) the following day. A.M. Peak Hour – The one-hour time period between 12 a.m. (midnight) and 12 p.m. (noon) during which the highest one-hour traffic volume occurs, and the associated count. P.M. Peak Hour – The one-hour time period between 12 p.m. (noon) and 12 a.m. (midnight) during which the highest one-hour traffic volume occurs, and the associated count. EBFR – East Bound Frontage Road WBFR – West Bound Frontage Road

Southlake, Texas 2015 Traffic Count Report (Year B) Page 4
Figure 1: Non-Freeway Traffic Count Location Map

Southlake, Texas 2015 Traffic Count Report (Year B) Page 5
Figure 2: SH 114 Traffic Count Location Map

Southlake, Texas 2015 Traffic Count Report (Year B) Page 6
Figure 3: Year A and B Traffic Count Location Map

Ref # Segment Begin End 2009 Total 2013 Total 2015 Total % Change2013-2015
2015 AM Peak Hour
2015 AM Peak Total
2015 PM Peak Hour
2015 PM Peak Total
13bW FM 1709 SH 114 Gateway 16,040 11:45-12:45 1188 16:30-17:30 138213bE FM 1709 SH 114 Gateway 19,370 7:30-8:30 1663 17:00-18:00 138613aW FM 1709 Gateway Nolen 15,124 14,846 -1.84% 11:45-12:45 1163 16:30-17:30 140313aE FM 1709 Gateway Nolen 18,402 17,735 -3.62% 7:30-8:30 1615 16:45-17:45 125713W FM 1709 Nolen Kimball 19,003 19,054 18,369 -3.60% 11:45-12:45 1469 16:45-17:45 171213E FM 1709 Nolen Kimball 18,371 20,652 20,285 -1.78% 7:45-8:45 1760 12:00-13:00 148314W FM 1709 Kimball Carroll 20,626 21,431 25,379 18.42% 11:45-12:45 1966 16:45-17:45 237514E FM 1709 Kimball Carroll 22,375 22,294 23,395 4.94% 7:30-8:30 2093 12:30-13:30 176215W FM 1709 Carroll Byron Nelson 24,495 26,563 23,966 -9.78% 11:45-12:45 1575 16:45-17:45 253415E FM 1709 Carroll Byron Nelson 25,363 27,226 25,545 -6.17% 7:30-8:30 2920 15:15-16:15 170416W FM 1709 Byron Nelson White Chapel 23,020 25,006 24,299 -2.83% 11:45-12:45 1496 16:45-17:45 245416E FM 1709 Byron Nelson White Chapel 24,135 25,639 25,189 -1.76% 7:15-8:15 2824 12:45-13:45 174117W FM 1709 White Chapel Shady Oaks 24,678 26,501 25,385 -4.21% 11:45-12:45 1456 16:45-17:45 263817E FM 1709 White Chapel Shady Oaks 24,137 27,878 27,182 -2.50% 7:00-8:00 2887 13:00-14:00 182518W FM 1709 Shady Oaks Southridge Lakes 25,272 24,997 23,647 -5.40% 11:15-12:15 1416 17:00-18:00 272518E FM 1709 Shady Oaks Southridge Lakes 26,560 25,998 27,262 4.86% 7:00-8:00 3016 15:15-16:15 181819W FM 1709 Southridge Lakes Peytonville 23,752 24,948 24,094 -3.42% 11:45-12:45 1335 17:00-18:00 259019E FM 1709 Southridge Lakes Peytonville 22,223 26,014 25,225 -3.03% 7:15-8:15 2868 13:00-14:00 164020W FM 1709 Peytonville Randol Mill 20,979 23,663 22,797 -3.66% 11:45-12:45 1321 17:00-18:00 254920E FM 1709 Peytonville Randol Mill 21,361 24,880 24,309 -2.30% 7:15-8:15 2716 16:45-17:45 146021W FM 1709 Randol Mill Pearson 16,941 19,472 18,766 -3.63% 11:30-12:30 1110 17:00-18:00 212221E FM 1709 Randol Mill Pearson 16,830 18,893 18,836 -0.30% 7:00-8:00 2075 16:45-17:45 113722N Crooked Lane Nolen Kimball 487 563 499 -11.37% 8:00-9:00 57 16:45-17:45 4922S Crooked Lane Nolen Kimball 410 554 593 7.04% 11:45-12:45 53 17:00-18:00 7823N Crooked Lane Kimball Continental 1,422 1,529 1,735 13.47% 7:45-8:45 234 16:15-17:15 21723S Crooked Lane Kimball Continental 1,568 1,862 1,949 4.67% 7:45-8:45 186 16:30-17:30 28324W Continental Kimball Crooked 4,663 3,575 4,820 34.83% 8:00-9:00 263 17:00-18:00 74624E Continental Kimball Crooked 4,831 4,135 4,781 15.62% 7:30-8:30 795 15:30-16:30 31625W Continental Crooked Carroll 3,827 4,544 6,084 33.89% 7:45-8:45 389 16:45-17:45 91725E Continental Crooked Carroll 4,335 4,886 5,534 13.26% 7:30-8:30 883 16:15-17:15 37226W Continental Carroll Byron Nelson 5,254 4,682 6,235 33.17% 7:30-8:30 436 16:45-17:45 91826E Continental Carroll Byron Nelson 5,432 5,039 5,786 14.82% 7:30-8:30 899 15:30-16:30 39027W Continental Byron Nelson White Chapel 5,298 5,654 5,936 4.99% 7:30-8:30 521 16:45-17:45 87127E Continental Byron Nelson White Chapel 5,413 5,652 7,280 28.80% 7:15-8:15 1096 15:15-16:15 52428W Continental White Chapel Peytonville 4,140 5,371 5,226 -2.70% 7:15-8:15 542 16:45-17:45 61228E Continental White Chapel Peytonville 3,994 5,254 4,958 -5.63% 7:30-8:30 749 15:15-16:15 36429W Continental Peytonville Davis 3,702 4,743 5,240 10.48% 7:15-8:15 299 17:00-18:00 64729E Continental Peytonville Davis 3,791 4,754 5,130 7.91% 7:15-8:15 736 17:45-18:45 36330W Union Church Davis Pearson 1,755 2,380 2,500 5.04% 8:00-9:00 183 17:00-18:00 27830E Union Church Davis Pearson 1,893 2,335 2,495 6.85% 8:00-9:00 282 17:00-18:00 21545N Pearson Union Church FM 1709 1,340 2,387 2,241 -6.12% 7:15-8:15 245 17:15-18:15 19345S Pearson Union Church FM 1709 1,643 2,434 2,596 6.66% 8:00-9:00 273 16:45-17:45 26346N Pearson FM 1709 Johnson 2,537 3,036 3,312 9.09% 8:00-9:00 508 16:15-17:15 24946S Pearson FM 1709 Johnson 2,755 3,193 3,263 2.19% 7:15-8:15 290 16:45-17:45 37047N Pearson Johnson Florence 2,680 3,244 3,533 8.91% 7:45-8:45 554 15:00-16:00 28547S Pearson Johnson Florence 2,898 3,443 3,467 0.70% 7:15-8:15 339 17:00-18:00 480
Year B Count Locations
Year B Count locations Sheet 1 of 3

Ref # Segment Begin End 2009 Total 2013 Total 2015 Total % Change2013-2015
2015 AM Peak Hour
2015 AM Peak Total
2015 PM Peak Hour
2015 PM Peak Total
Year B Count Locations
48N Davis Continental FM 1709 14,934 15,856 15,144 -4.49% 7:15-8:15 1392 16:15-17:15 105148S Davis Continental FM 1709 15,219 15,375 13,523 -12.05% 8:30-9:30 824 17:00-18:00 133149N Randol Mill FM 1709 Johnson 4,305 6,657 6,712 0.83% 7:45-8:45 617 16:45-17:45 53249S Randol Mill FM 1709 Johnson 4,171 7,514 7,406 -1.44% 7:15-8:15 674 17:00-18:00 78650N Randol Mill Johnson Florence 3,451 6,298 6,598 4.76% 7:30-8:30 721 16:45-17:45 50950S Randol Mill Johnson Florence 3,356 6,367 7,095 11.43% 7:15-8:15 508 16:30-17:30 79751N Peytonville Continental Stonebury 1,726 1,855 2,244 20.97% 7:15-8:15 388 17:45-18:45 25651S Peytonville Continental Stonebury 1,892 2,053 2,252 9.69% 7:15-8:15 202 16:45-17:45 265
52aN Peytonville Stonebury FM 1709 3,006 2,130 -29.14% 7:15-8:15 559 15:00-16:00 18952aS Peytonville Stonebury FM 1709 2,997 2,247 -25.03% 7:15-8:15 183 17:30-18:30 24552N Peytonville FM 1709 Coventry 2,302 2,679 2,318 -13.48% 7:30-8:30 278 16:45-17:45 18952S Peytonville FM 1709 Coventry 2,472 2,973 2,505 -15.74% 7:15-8:15 336 17:30-18:30 34054N Shady Oaks FM 1709 Highland 1,590 2,028 2,104 3.75% 7:30-8:30 335 15:00-16:00 20254S Shady Oaks FM 1709 Highland 1,432 1,862 2,015 8.22% 7:45-8:45 196 15:45-16:45 26656N White Chapel City Limit Continental 3,528 4,092 3,750 -8.36% 7:30-8:30 451 17:45-18:45 28056S White Chapel City Limit Continental 3,631 4,439 4,420 -0.43% 7:30-8:30 286 17:00-18:00 68657N White Chapel Continental FM 1709 3,926 4,724 4,434 -6.14% 7:30-8:30 561 17:00-18:00 35457S White Chapel Continental FM 1709 4,231 5,271 4,857 -7.85% 7:30-8:30 315 18:15-19:15 48458N White Chapel FM 1709 Highland 5,022 6,909 6,413 -7.18% 6:45-7:45 495 15:15-16:15 53258S White Chapel FM 1709 Highland 5,923 7,406 6,898 -6.86% 7:15-8:15 604 18:00-19:00 63862N Byron Nelson FM 1709 Continental 2,187 2,273 2,972 30.75% 7:15-8:15 478 14:30-15:30 25862S Byron Nelson FM 1709 Continental 2,345 2,470 2,829 14.53% 7:30-8:30 204 16:45-17:45 29363N Byron Nelson Continental City Limit 1,665 918 845 -7.95% 7:15-8:15 122 14:45-15:45 8563S Byron Nelson Continental City Limit 1,654 968 570 -41.12% 7:30-8:30 65 15:15-16:15 6464N Carroll Carlisle Zena Rucker 4,921 7,838 5,442 -30.57% 7:30-8:30 524 15:45-16:45 44964S Carroll Carlisle Zena Rucker 5,059 7,294 5,403 -25.93% 10:45-11:45 312 16:45-17:45 554
65aN Carroll Zena Rucker FM 1709 8,760 6,596 -24.70% 7:30-8:30 612 15:30-16:30 55665aS Carroll Zena Rucker FM 1709 8,693 5,446 -37.35% 10:45-11:45 335 17:00-18:00 53365N Carroll FM 1709 SH 114 7,939 10,893 10,491 -3.69% 11:45-12:45 830 12:00-13:00 84865S Carroll FM 1709 SH 114 8,507 11,584 10,541 -9.00% 11:15-12:15 842 16:30-17:30 94869N Brumlow SH 26 Continental 6,080 6,907 6,126 -11.31% 8:15-9:15 536 16:00-17:00 49569S Brumlow SH 26 Continental 6,147 7,970 6,109 -23.35% 11:30-12:30 397 16:00-17:00 53170N Kimball Continental Crooked 3,357 4,477 4,329 -3.31% 11:45-12:45 372 16:45-17:45 44670S Kimball Continental Crooked 3,624 4,394 3,930 -10.56% 7:45-8:45 457 15:45-16:45 36971N Kimball Crooked FM 1709 4,795 5,720 9,194 60.73% 7:45-8:45 802 16:45-17:45 91471S Kimball Crooked FM 1709 3,281 4,145 5,286 27.53% 7:45-8:45 680 15:15-16:15 49372N Kimball FM 1709 SH 114 7,729 8,941 10,902 21.93% 11:45-12:45 777 13:15-14:15 93572S Kimball FM 1709 SH 114 9,775 12,150 11,908 -1.99% 7:45-8:45 955 16:45-17:45 100576N Commerce FM 1709 Exchange 2,491 2,868 2,884 0.56% 11:15-12:15 243 16:15-17:15 30976S Commerce FM 1709 Exchange 2,456 2,491 2,528 1.49% 7:45-8:45 223 12:30-13:30 21577W Johnson Pearson Randol Mill 945 1,404 1,158 -17.52% 11:30-12:30 70 17:15-18:15 17877E Johnson Pearson Randol Mill 1,114 1,437 1,466 2.02% 7:00-8:00 263 14:15-15:15 9278N Southridge Lakes FM 1709 Peytonville 1,803 1,452 1,005 -30.79% 7:30-8:30 153 14:30-15:30 8278S Southridge Lakes FM 1709 Peytonville 1,664 1,297 866 -33.23% 7:45-8:45 74 18:00-19:00 10079W Florence Pearson Randol Mill 856 1,040 1,138 9.42% 11:45-12:45 68 17:00-18:00 18879E Florence Pearson Randol Mill 710 802 1,024 27.68% 7:15-8:15 176 12:45-13:45 61
Year B Count locations Sheet 2 of 3

Ref # Segment Begin End 2009 Total 2013 Total 2015 Total % Change2013-2015
2015 AM Peak Hour
2015 AM Peak Total
2015 PM Peak Hour
2015 PM Peak Total
Year B Count Locations
80N Randol Mill Kingswood Marantha 2,670 4,733 5,874 24.11% 7:15-8:15 849 17:30-18:30 39080S Randol Mill Kingswood Marantha 2,707 5,703 6,688 17.27% 7:30-8:30 385 17:00-18:00 91084N Nolen SH 114 FM 1709 1,472 3,367 2,951 -12.36% 11:30-12:30 208 16:00-17:00 26384S Nolen SH 114 FM 1709 2,410 3,895 3,497 -10.22% 11:15-12:15 303 16:15-17:15 31685N Nolen FM 1709 Crooked 2,351 2,773 4,533 63.47% 11:45-12:45 370 16:30-17:30 44485S Nolen FM 1709 Crooked 2,432 2,710 3,476 28.27% 8:15-9:15 390 12:30-13:30 34286N Nolen Crooked Kimball 1,621 2,479 2,205 -11.05% 7:15-8:15 208 15:45-16:45 16186S Nolen Crooked Kimball 1,549 2,200 1,927 -12.41% 11:45-12:45 125 16:30-17:30 21487N Carroll Carlisle Continental 5,247 6,337 4,840 -23.62% 7:30-8:30 445 16:30-17:30 40987S Carroll Carlisle Continental 4,962 6,121 4,437 -27.51% 7:15-8:15 324 16:30-17:30 39788N Kimball SH 26 Nolen 6,316 6,830 7,629 11.70% 7:30-8:30 768 16:30-17:30 65188S Kimball SH 26 Nolen 7,056 6,855 8,767 27.89% 7:45-8:45 624 16:45-17:45 93692N Village Center FM 1709 SH 114 2,133 2,818 1,896 -32.72% 9:45-10:45 220 19:15-20:15 19692S Village Center FM 1709 SH 114 1,222 1,729 1,825 5.55% 11:45-12:45 177 12:15-1:15 19597N Central FM 1709 Main 2,637 1,805 2,976 64.88% 11:45-12:45 336 12:30-13:30 35297S Central FM 1709 Main 2,677 1,307 2,941 125.02% 11:45-12:45 278 12:30-13:30 32498N Central Division SH 114 1,917 2,015 5.11% 11:45-12:45 146 13:15-14:15 22098S Central Division SH 114 868 1,123 29.38% 11:00-12:00 119 17:15-18:15 10699N Grand Division SH 114 1,408 640 -54.55% 9:30-10:30 31 19:30-20:30 10199S Grand Division SH 114 1,244 2,014 61.90% 11:15-12:15 194 16:30-17:30 247
100W Federal State Carroll 2,189 2,433 11.15% 11:45-12:45 236 13:30-14:30 252100E Federal State Carroll 2,443 2,098 -14.12% 10:30-11:30 204 12:15-13:15 210101W Prospect State Carroll 3,856 2,298 -40.40% 11:30-12:30 225 14:15-15:15 262101E Prospect State Carroll 1,412 1,951 38.17% 11:00-12:00 229 12:30-13:30 206102W Main State Carroll 2,065 2,602 26.00% 11:45-12:45 199 12:45-13:45 309102E Main State Carroll 4,427 3,420 -22.75% 11:15-12:15 383 16:45-17:45 343110N Silicon Kimball Nolen 1,584 1,409 -11.05% 7:45-8:45 184 16:15-17:15 111110S Silicon Kimball Nolen 1,515 1,328 -12.34% 11:30-12:30 103 16:30-17:30 203111E Zena Rucker Carroll FM 1709 125 7:30-8:30 31 15:00-16:00 18111W Zena Rucker Carroll FM 1709 78 7:00-8:00 15 12:30-13:30 11112N Watermere FM 1709 Union Church 523 7:45-8:45 64 14:45-15:45 53112S Watermere FM 1709 Union Church 674 11:45-12;45 56 16:30-17:30 71
*Reference Numbers 41, 83, 89, 90, 91, and 96 were intentionally skipped
Year B Count locations Sheet 3 of 3
Ref # Segment Begin End 2009 Total 2013 Total 2014 Total% Change2013-2014
2014 AM Peak Hour
2014 AM Peak Total
2014 PM Peak Hour
2014 PM Peak Total
31W Highland Kimball Carroll 669 508 504 -0.79% 07:00-08:00 64 13:45-14:45 6031E Highland Kimball Carroll 648 461 461 0.00% 07:45-08:45 61 15:00-16:00 5032W Highland Carroll SH 114 272 246 283 15.04% 07:15-08:15 50 15:00-16:00 4132E Highland Carroll SH 114 289 21 20 -4.76% 10:15-11:15 4 15:45-16:45 433W Highland SH 114 White Chapel 222 383 584 52.48% 07:15-08:15 100 17:15-18:15 9233E Highland SH 114 White Chapel 813 1379 1109 -19.58% 07:45-08:45 191 15:15-16:15 14334W Highland White Chapel Shady Oaks 1097 1308 1444 10.40% 07:45-08:45 152 15:15-16:15 21634E Highland White Chapel Shady Oaks 1413 1773 1909 7.67% 07:30-08:30 396 15:15-16:15 23035W Turnberry Shady Oaks Peytonville 621 695 647 -6.91% 07:45-08:45 57 15:15-16:15 9035E Turnberry Shady Oaks Peytonville 751 804 751 -6.59% 07:30-08:30 140 15:15-16:15 8336W Dove Kimball Carroll 2373 2370 1589 -32.95% 07:30-08:30 212 17:00-18:00 16336E Dove Kimball Carroll 2427 2196 1705 -22.36% 07:45-08:45 160 17:15-18:15 21937W Dove Carroll White Chapel 2238 2488 2228 -10.45% 07:15-08:15 242 17:15-18:15 24137E Dove Carroll White Chapel 2179 2714 2122 -21.81% 07:45-08:45 189 17:00-18:00 26038W Dove White Chapel SH 114 3319 2606 2430 -6.75% 07:30-08:30 384 17:15-18:15 29038E Dove White Chapel SH 114 2852 2453 2103 -14.27% 07:15-08:15 280 17:00-18:00 25539W Dove Shady Oaks Peytonville 4602 5135 5716 11.31% 07:15-08:15 486 16:45-17:45 91739E Dove Shady Oaks Peytonville 4576 4575 5365 17.27% 07:30-8:30 917 17:30-18:30 54840W Dove Peytonville Randol Mill 3403 3168 3682 16.22% 07:15-08:15 221 17:00-18:00 78040E Dove Peytonville Randol Mill 2919 2872 3274 14.00% 07:30-08:30 738 17:00-18:00 23542W Kirkwood SH 114 Precinct Line 2766 1855 3209 72.99% 07:30-08:30 521 16:30-17:30 31842E Kirkwood SH 114 Precinct Line 2734 1275 2987 134.27% 08:15-09:15 361 16:45-17:45 46443W Bob Jones White Chapel TW King 154 213 195 -8.45% 07:00-08:00 19 17:30-18:30 3343E Bob Jones White Chapel TW King 190 208 147 -29.33% 08:45-09:45 12 17:00-18:00 1544N TW King Kirkwood Bob Jones 447 426 381 -10.56% 08:45-09:45 27 18:30-19:30 4744S TW King Kirkwood Bob Jones 428 446 410 -8.07% 07:00-08:00 50 17:30-18:30 3953N Peytonville Coventry Dove 2356 2458 2393 -2.64% 07:30-08:30 331 15:00-16:00 17353S Peytonville Coventry Dove 2509 2566 2487 -3.08% 07:15-08:15 249 17:15-18:15 37655N Shady Oaks Highland Dove 892 1137 1411 24.10% 07:30-08:30 230 15:15-16:15 21755S Shady Oaks Highland Dove 925 1355 1203 -11.22% 07:45-08:45 183 15:30-16:30 14159N White Chapel Highland SH 114 4219 6537 6681 2.20% 07:45-08:45 745 15:30-16:30 50859S White Chapel Highland SH 114 5845 6915 7017 1.48% 08:15-09:15 471 17:15-18:15 652
60aN White Chapel SH 114 Kirkwood 3150 3358 6.60% 07:30-08:30 269 17:30-18:30 40060aS White Chapel SH 114 Kirkwood 2979 2982 0.10% 07:30-08:30 335 15:15-16:15 27260N White Chapel Kirkwood Dove 2199 3222 2816 -12.60% 07:30-08:30 229 17:15-18:15 37460S White Chapel Kirkwood Dove 2403 3049 2508 -17.74% 07:30-08:30 290 15:00-16:00 23161N White Chapel Dove Bob Jones 2073 2250 1488 -33.87% 08:30-09:30 98 17:15-18:15 26761S White Chapel Dove Bob Jones 1655 2207 1463 -33.71% 07:30-08:30 146 18:30-19:30 18066N Carroll Highland Dove 2518 2942 2650 -9.93% 07:45-08:45 277 17:45-18:45 34566S Carroll Highland Dove 2444 2854 3423 19.94% 07:30-08:30 407 14:45-15:45 39567N Carroll Dove Burney 1503 1717 915 -46.71% 07:15-08:15 51 14:30-15:30 10567S Carroll Dove Burney 1528 1730 950 -45.09% 07:00-08:00 135 15:00-16:00 8768N Lonesome Dove Dove Burney 1495 413 1272 207.99% 08:00-09:00 73 18:00-19:00 13968S Lonesome Dove Dove Burney 1315 390 1331 241.28% 07:30-08:30 170 18:00-19:00 126
73aN Kimball SH 114 Kirkwood 6457 6385 -1.12% 11:45-12:45 377 17:30-18:30 70173aS Kimball SH 114 Kirkwood 6071 6782 11.71% 07:15-08:15 707 15:45-16:45 54873N Kimball Kirkwood Highland 4129 6486 5496 -15.26% 11:45-12:45 298 16:45-17:45 628
Year A Other Count Locations
Year A Other Count Locations Sheet 1 of 2

Ref # Segment Begin End 2009 Total 2013 Total 2014 Total% Change2013-2014
2014 AM Peak Hour
2014 AM Peak Total
2014 PM Peak Hour
2014 PM Peak Total
Year A Other Count Locations
73S Kimball Kirkwood Highland 3973 5415 5408 -0.13% 07:30-08:30 702 16:15-17:15 38474N Kimball Highland Dove 4146 4721 4541 -3.81% 11:45-12:45 260 16:30-17:30 54474S Kimball Highland Dove 4151 4545 4801 5.63% 16:30-17:30 624 16:15-17:15 34475N Kimball Dove City Limit 1866 2816 2784 -1.14% 11:30-12:30 152 17:45-18:45 36475S Kimball Dove City Limit 1802 2613 2793 6.89% 07:15-08:15 368 18:30-19:30 21081N Sam School Dove Kirkwood 909 747 768 2.81% 08:00-09:00 154 17:00-18:00 7681S Sam School Dove Kirkwood 849 697 628 -9.90% 11:45-12:45 38 16:45-17:45 9282N White Chapel Bob Jones City Limit 443 157 139 -11.46% 09:00-10:00 13 17:30-18:30 2382S White Chapel Bob Jones City Limit 770 162 125 -22.84% 08:00-09:00 16 17:00-18:00 1893N TW King SH 114 TW King E 563 537 565 5.21% 11:45-12:45 42 15:30-16:30 5993S TW King SH 114 TW King E 388 376 395 5.05% 07:15-08:15 50 14:00-15:00 4194N Randol Mill Our Dove 2968 948 1002 5.70% 07:30-08:30 157 17:15-18:15 7294S Randol Mill Our Dove 3727 1398 1270 -9.16% 08:45-09:45 82 17:00-18:00 24995N Carroll SH 114 Highland 3547 5418 4379 -19.18% 07:45-08:45 429 18:15-19:15 44295S Carroll SH 114 Highland 3506 4641 4006 -13.68% 07:30-08:30 403 15:45-16:45 371
103N Precinct Line Randol Mill Sabine 4202 4465 6.26% 07:30-08:30 685 17:15-18:15 314103S Precinct Line Randol Mill Sabine 4729 4925 4.14% 08:45-09:45 313 16:45-15:45 763104N Kirkwood Dove Stockton 1538 1585 3.06% 08:00-09:00 258 17:15-18:15 230104S Kirkwood Dove Stockton 1920 1639 -14.64% 07:15-08:15 139 17:00-18:00 322105W Kirkwood White Chapel Carroll 392 120 -69.39% 10:00-11:00 18 15:00-16:00 14105E Kirkwood White Chapel Carroll 414 149 -64.01% 10:30-11:30 32 12:00-13:00 22106W Kirkwood Carroll Highland 1863 1211 -35.00% 07:45-08:45 279 15:15-16:15 199106E Kirkwood Carroll Highland 2231 1538 -31.06% 07:30-08:30 172 15:45-16:45 171107W Kirkwood Highland Blessed 1023 725 -29.13% 08:00-09:00 129 15:45-16:45 109107E Kirkwood Highland Blessed 1565 1077 -31.18% 07:45-08:45 255 16:45-17:45 147108W Kirkwood Blessed Kimball 526 647 23.00% 07:45-08:45 110 16:15-17:15 98108E Kirkwood Blessed Kimball 863 1294 49.94% 10:45-11:45 210 15:45-16:45 183109N Blessed SH 114 Kirkwood 1206 603 -50.00% 09:00-10:00 86 18:15-19:15 119109S Blessed SH 114 Kirkwood 1188 607 -48.91% 07:30-08:30 110 20:30-21:30 149
*Reference Numbers 41, 83, 89, 90, 91, and 96 were intentionally skipped
Year A Other Count Locations Sheet 2 of 2
Ref # Segment Begin End 2009 Total 2013 Total 2014 Total% Change2013-2014
2014 AM Peak Hour
2014 AM Peak Total
2014 PM Peak Hour
2014 PM Peak Total
001W SH 114 (Main Lane) Dove Kirkwood 49624 56849 14.56% 07:30-08:30 4175 16:15-17:15 4852
001E SH 114 (Main Lane) Dove Kirkwood 46109 56358 22.23% 07:15-08:15 4949 17:00-18:00 4536
002E SH 114 (Frontage Road)SH 114 (Entrance Ramp
from Dove)White Chapel 1911 1974 3.30% 08:30-09:30 195 17:00-18:00 177
003E SH 114 (Frontage Road) HighlandSH 114 (Exit Ramp to
Carroll)2439 2489 2.05% 07:45-08:45 353 15:30-16:30 266
004E SH 114 (Frontage Road)SH 114 (Exit Ramp to
Kimball)Kimball 13778 8812 -36.04% 11:45-12:45 771 12:30-13:30 833
005E SH 114 (Frontage Road) KimballSH 114 (Exit Ramp to
FM 1709)18264 15968 -12.57% 07:15-08:15 1210 16:30-17:30 1225
006W SH 114 (Frontage Road)SH 114 (Entrance Ramp
from FM 1709)Kimball 12136 14801 21.96% 08:45-09:45 1000 18:30-19:30 1393
007W SH 114 (Frontage Road)SH 114 (Entrance Ramp
from Kimball)Kimball 2732 6113 123.76% 11:45-12:45 482 16:30-17:30 598
008W SH 114 (Frontage Road) Highland Southmont 1529 1913 25.11% 07:30-08:30 151 16:45-17:45 255
009W SH 114 (Frontage Road) White ChapelSH 114 (Exit Ramp to
Dove)2439 2544 4.31% 08:00-09:00 176 17:00-18:00 490
010ESH 114 (Exit Ramp to
Dove)SH 114 Dove 3382 3242 -4.14% 08:30-09:30 279 16:45-17:45 286
011ESH 114 (Exit Ramp to
Carroll)SH 114 Carroll 6408 6333 -1.17% 07:30-08:30 677 12:00-13:00 499
012ESH 114 (Exit Ramp to
Kimball)SH 114 Kimball 5666 4974 -12.21% 07:30-08:30 469 17:15-18:15 379
013ESH 114 (Exit Ramp to
Southlake Blvd)SH 114 Southlake Blvd 7991 6084 -23.86% 07:45-08:45 488 17:00-18:00 683
014ESH 114 (Entrance Ramp
from Dove)Dove SH 114 4239 4783 12.83% 07:45-08:45 755 16:15-17:15 422
015ESH 114 (Entrance Ramp
frpm White Chapel)White Chapel SH 114 3978 4687 17.82% 07:45-08:45 536 15:45-16:45 340
016ESH 114 (Entrance Ramp
from Carroll)Carroll SH 114 6444 7514 16.60% 07:15-08:15 673 16:45-17:45 588
017WSH 114 (Exit Ramp to
Carroll)SH 114 Carroll 7308 8280 13.30% 07:30-08:30 595 17:15-18:15 840
018WSH 114 (Exit Ramp to
White Chapel)SH 114 White Chapel 5631 6758 20.01% 08:15-09:15 327 17:15-18:15 1230
019WSH 114 (Exit Ramp to
Dove)SH 114 Dove 4594 5944 29.39% 08:00-09:00 398 17:00-18:00 1463
020WSH 114 (Entrance Ramp
from Southlake Blvd)Southlake Blvd SH 114 7548 5808 -23.05% 07:15-08:15 525 17:00-18:00 523
021WSH 114 (Entrance Ramp
from Kimball)Kimball SH 114 7027 3485 -50.41% 11:45-12:45 311 18:15-19:15 438
022WSH 114 (Entrance Ramp
from Carroll)Carroll SH 114 4825 4491 -6.92% 11:45-12:45 291 15:45-16:45 461
SH 114 Corridor
SH 114 Corrdior Sheet 1 of 3

Ref # Segment Begin End 2009 Total 2013 Total 2014 Total% Change2013-2014
2014 AM Peak Hour
2014 AM Peak Total
2014 PM Peak Hour
2014 PM Peak Total
SH 114 Corridor
023WSH 114 (Entrance Ramp
from Dove)Dove SH 114 3620 4444 22.76% 07:45-08:45 265 17:00-18:00 1007
1aW SH 114 (Main Lane) City Limit Kimball 44137 59603 35.04% 4103 5956
1aE SH 114 (Main Lane) Kimball City Limit 37323 52709 41.22% 5000 4039
1bW SH 114 (Main Lane) KimballSH 114 (Entrance Ramp
from Kimball)43199 51685 65411 26.56% 4628 6479
1bE SH 114 (Main Lane)SH 114 (Exit Ramp to
Kimball)Kimball 42811 45314 58793 29.75% 5488 4722
3W SH 114 (Frontage Road) Northwest Highway Kimball 15135 19684 20609 4.70% 1525 1916
3E SH 114 (Frontage Road) Northwest Highway Kimball 20784 26255 22052 -16.01% 1698 1908
4W SH 114 (Main Lane)SH 114(Entrance Ramp
from Kimball)SH 114 (Exit Ramp to
Carroll)42731 58712 68896 17.35% 4939 6917
4E SH 114 (Main Lane)SH 114 (Entrance Ramp
from Carroll)SH 114 (Exit Ramp to
Kimball)38624 50980 63767 25.08% 5957 5101
5W SH 114 (Frontage Road) Kimball Carroll 2062 2732 6113 123.76% 482 598
5E SH 114 (Frontage Road) Kimball Carroll 6109 8112 3838 -52.69% 302 454
6aW SH 114 (Main Lane)SH 114 (Exit Ramp to
Carroll)SH 114 (Entrance Ramp
from Carroll)51404 60616 17.92% 4344 6077
6aE SH 114 (Main Lane)SH 114 (Exit Ramp to
Carroll)SH 114 (Entrance Ramp
from Carroll)44536 56253 26.31% 5284 4513
6bW SH 114 (Main Lane)SH 114 (Entrance Ramp
from Carroll)SH 114 (Exit Ramp to
White Chapel)40397 56229 65107 15.79% 4635 6538
6bE SH 114 (Main Lane)SH 114 (Entrance Ramp
from White Chapel)SH 114 (Exit Ramp to
Carroll)45537 50944 62586 22.85% 5961 5012
7W SH 114 (Frontage Road) Carroll Highland 905 1529 1913 25.11% 151 255
7E SH 114 (Frontage Road) Carroll Highland 2438 2439 2489 2.05% 353 266
8W SH 114 (Frontage Road) Highland White Chapel 1036 1529 1913 25.11% 151 255
8E SH 114 (Frontage Road) Highland White Chapel 1065 2439 2489 2.05% 353 266
9W SH 114 (Main Lane)SH 114 (Exit Ramp to
White Chapel)SH 114 (Exit Ramp to
Dove)37963 50598 58349 15.32% 4308 5308
9E SH 114 (Main Lane)SH 114 (Entrance Ramp
from Dove)SH 114 (Entrance Ramp
from White Chapel)37605 46966 57899 23.28% 5425 4672
10W SH 114 (Frontage Road) White Chapel Dove 1802 2439 2544 4.31% 176 490
10E SH 114 (Frontage Road) White Chapel Dove 1844 1911 1974 3.30% 195 177
SH 114 Corrdior Sheet 2 of 3

Ref # Segment Begin End 2009 Total 2013 Total 2014 Total% Change2013-2014
2014 AM Peak Hour
2014 AM Peak Total
2014 PM Peak Hour
2014 PM Peak Total
SH 114 Corridor
11W SH 114 (Main Lane)SH 114 (Exit Ramp to
Dove)Dove 37184 46004 52405 13.91% 3910 3845
11E SH 114 (Main Lane) DoveSH 114 (Entrance Ramp
from Dove)35154 42727 53116 24.31% 4670 4250
12W SH 114 (Frontage Road) Dove Kirkwood 3379 3620 4444 22.76% 265 1007
12E SH 114 (Frontage Road) Dove Kirkwood 3073 3382 3242 -4.14% 279 286
111E SH 114 (Frontage Road) FM 1709 Industrial Blvd 19580 07:00-08:00 1725 12:15-13:15 1350
112WSH 114 (WB Exit Ramp to
Kimball)FM 1709 Kimball 11612 11:30-12:30 777 17:30-18:30 1173
113ESH 114 (EB Entrance Ramp from Kimball)
Kimball FM 1709 12215 07:15-08:15 1068 17:00-18:00 905
*Reference Number 2 was intentionally skipped
SH 114 Corrdior Sheet 3 of 3

City of Southlake, Texas
2013 Traffic Count Report
Counts taken in April and May 2013
Prepared by:
Lee Engineering
City of Southlake, Texas 1400 Main Street, Suite 310
Southlake, TX 76092 Phone: 817-748-8621
www.cityofsouthlake.com

Southlake, Texas 2013 Traffic Count Report Page 2
Introduction & Purpose This report is prepared every few years by the city staff to provide information regarding traffic volumes on roadways in the city. The traffic volumes are collected at designated traffic count locations. For analytical and historical purposes, every attempt is made to count the same locations each time a new report is prepared. Additional stations are added as new roadways are constructed or traffic volumes increase along existing roadways to warrant counts being collected. The main purpose of this report is to serve as a “snapshot” of the traffic volume conditions at a fixed point in time. Traffic data from different time periods can be used to analyze trends and to assist in problem areas. Traffic data is the foundation of many specialized studies, such as warrant studies for traffic signals, and is used in part when updating the city’s Mobility and Master Thoroughfare Plan. Also, the traffic count data is provided to the Planning and Zoning Commission and City Council to assist them in evaluating planning cases such as rezonings, site plans and plats. This report also serves as a valuable economic development tool for real estate brokers, lenders, developers, and others with similar interests. Traffic volume is a critical factor associated with many of the decision points made by companies, particularly retailers, when looking to locate businesses in a particular region. This traffic count report will also provide current traffic data for any area of interest in the city to residents, property owners, and other interested parties. This year, two-direction counts were taken at 120 different locations within the city boundaries, as shown in Figure 1 and Figure 2. Counts taken at frontage roads and freeway ramps were one-direction. This report will present the basic traffic volume data recently collected at these locations. Traffic counts were taken during the weekdays from April 30 to May 29, 2013. The 2013 report includes one table indicating twenty-four hour counts and peak-hour traffic times for all arterial and major collector roadways in Southlake. Additional historical data and analysis may be found in previous editions of the Traffic Count Report available from the Planning & Development Services Department. Methodology In April 2013, the City of Southlake contracted with Lee Engineering to take traffic counts at designated locations in Southlake and prepare this report. The data was downloaded to a raw data file, and a printed copy of this data was provided to the City. Between April 30 and May 29, 2013, traffic counters were placed at one hundred and twenty (120) locations throughout the city, with counts taken in both directions of traffic flow during the weekday. Total traffic volumes were compiled in fifteen (15) minute intervals over a twenty-four (24) hour period. The raw data sheets, with fifteen (15) minute intervals and peak hours defined for each segment can be obtained in pdf format or hard copy for the cost of reproduction from the Department of Planning & Development Services. Definitions Ref. # - The number associated with a one-directional traffic count location. Segment – A particular area of roadway, with a beginning point (“From”) and an end point (“To”) location. Direction – The direction of traffic flow for each location. Each location has two directions, each listed in a separate row in Table 1, for both northbound and southbound (NB, SB) or westbound and eastbound (WB, EB). Counts taken at frontage roads and freeway ramps were one-direction. 24-Hour Totals – The total traffic volume (each direction) counted during the 24-hour period from 12 a.m. (midnight) to 12 a.m. (midnight) the following day. A.M. Peak Hour – The one-hour time period between 12 a.m. (midnight) and 12 p.m. (noon) during which the highest one-hour traffic volume occurs, and the associated count.

Southlake, Texas 2013 Traffic Count Report Page 3
P.M. Peak Hour – The one-hour time period between 12 p.m. (noon) and 12 a.m. (midnight) during which the highest one-hour traffic volume occurs, and the associated count. EBFR – East Bound Frontage Road WBFR – West Bound Frontage Road

Southlake, Texas 2013 Traffic Count Report Page 4
Figure 1: Non-Freeway Traffic Count Location Map

Southlake, Texas 2013 Traffic Count Report Page 5 Page 5
Figure 2: SH 114 Traffic Count Location Map

Ref # Segment Begin End 2009 Total 2013 Total % Change2013 AM Peak
Hour2013 AM
Peak Total2013 PM Peak
Hour2013 PM Peak
Total001W SH 114 (Main Lane) Dove Kirkwood 49624 7:45-8:45 3654 16:30-17:30 4342001E SH 114 (Main Lane) Dove Kirkwood 46109 6:45-7:45 4065 16:30-17:30 3825
002E SH 114 (Frontage Road)SH 114 (Entrance Ramp from Dove)
White Chapel 1911 8:15-9:15 203 16:45-17:45 167
003E SH 114 (Frontage Road) HighlandSH 114 (Exit Ramp
to Carroll)2439 7:45-8:45 292 15:00-16:00 316
004E SH 114 (Frontage Road)SH 114 (Exit Ramp to
Kimball)Kimball 13778 11:30-12:30 1128 16:45-17:45 1182
005E SH 114 (Frontage Road) KimballSH 114 (Exit Ramp
to FM 1709)18264 11:45-12:45 1529 12:45-13:45 1576
006W SH 114 (Frontage Road)SH 114 (Entrance
Ramp from FM 1709)Kimball 12136 11:45-12:45 889 17:30-18:30 1010
007W SH 114 (Frontage Road)SH 114 (Entrance
Ramp from Kimball)Kimball 2732 11:30-12:30 223 12:30-13:30 246
008W SH 114 (Frontage Road) Highland Southmont 1529 7:30-8:30 168 15:15-16:15 160
009W SH 114 (Frontage Road) White ChapelSH 114 (Exit Ramp
to Dove)2439 7:45-8:45 292 15:00-16:00 316
010ESH 114 (Exit Ramp to
Dove)SH 114 Dove 3382 8:15-9:15 297 16:15-17:15 316
011ESH 114 (Exit Ramp to
Carroll)SH 114 Carroll 6408 11:30-12:30 553 16:45-17:45 627
012ESH 114 (Exit Ramp to
Kimball)SH 114 Kimball 5666 7:15-8:15 597 16:45-17:45 537
013ESH 114 (Exit Ramp to
Southlake Blvd)SH 114 Southlake Blvd 7991 7:00-8:00 1172 16:45-17:45 923
014ESH 114 (Entrance Ramp
from Dove)Dove SH 114 4239 7:30-8:30 447 16:45-17:45 439
015ESH 114 (Entrance Ramp
frpm White Chapel)White Chapel SH 114 3978 7:15-8:15 344 15:15-16:15 282
016ESH 114 (Entrance Ramp
from Carroll)Carroll SH 114 6444 7:00-8:00 515 15:15-16:15 516
017WSH 114 (Exit Ramp to
Carroll)SH 114 Carroll 7308 7:45-8:45 475 17:30-18:30 733
018WSH 114 (Exit Ramp to
White Chapel)SH 114 White Chapel 5631 8:30-9:30 298 17:15-18:15 604
019WSH 114 (Exit Ramp to
Dove)SH 114 Dove 4594 7:45-8:45 357 17:00-18:00 544
020WSH 114 (Entrance Ramp
from Southlake Blvd)Southlake Blvd SH 114 7548 7:15-8:15 665 17:15-18:15 696
021WSH 114 (Entrance Ramp
from Kimball)Kimball SH 114 7027 11:45-12:45 573 17:00-18:00 640
022WSH 114 (Entrance Ramp
from Carroll)Carroll SH 114 4825 7:45-8:45 336 16:45-17:45 467
023WSH 114 (Entrance Ramp
from Dove)Dove SH 114 3620 7:45-8:45 297 16:45-17:45 359
1aW SH 114 (Main Lane) City Limit Kimball 44137 2913 40611aE SH 114 (Main Lane) Kimball City Limit 37323 2752 2659
SH 114 Corridor

Ref # Segment Begin End 2009 Total 2013 Total % Change2013 AM Peak
Hour2013 AM
Peak Total2013 PM Peak
Hour2013 PM Peak
Total
1bW SH 114 (Main Lane) KimballSH 114 (Entrance
Ramp from Kimball)43199 51685 19.64% 3578 4757
1bE SH 114 (Main Lane)SH 114 (Exit Ramp to
Kimball)Kimball 42811 45314 5.85% 3924 3582
3W SH 114 (Frontage Road) Northwest Highway Kimball 15135 19684 30.06% 1554 17063E SH 114 (Frontage Road) Northwest Highway Kimball 20784 26255 26.32% 2701 2499
4W SH 114 (Main Lane)SH 114(Entrance
Ramp from Kimball)SH 114 (Exit Ramp
to Carroll)42731 58712 37.40% 4151 5397
4E SH 114 (Main Lane)SH 114 (Entrance
Ramp from Carroll)SH 114 (Exit Ramp
to Kimball)38624 50980 31.99% 4521 4119
5W SH 114 (Frontage Road) Kimball Carroll 2062 2732 32.49% 223 2465E SH 114 (Frontage Road) Kimball Carroll 6109 8112 32.79% 531 645
6aW SH 114 (Main Lane)SH 114 (Exit Ramp to
Carroll)SH 114 (Entrance
Ramp from Carroll)51404 3676 4664
6aE SH 114 (Main Lane)SH 114 (Exit Ramp to
Carroll)SH 114 (Entrance
Ramp from Carroll)44536 4006 3603
6bW SH 114 (Main Lane)SH 114 (Entrance
Ramp from Carroll)SH 114 (Exit Ramp to White Chapel)
40397 56229 39.19% 4012 5131
6bE SH 114 (Main Lane)SH 114 (Entrance Ramp from White
Chapel)
SH 114 (Exit Ramp to Carroll)
45537 50944 11.87% 4559 4230
7W SH 114 (Frontage Road) Carroll Highland 905 1529 68.95% 168 1607E SH 114 (Frontage Road) Carroll Highland 2438 2439 0.04% 292 3168W SH 114 (Frontage Road) Highland White Chapel 1036 1529 47.59% 168 1608E SH 114 (Frontage Road) Highland White Chapel 1065 2439 129.01% 292 316
9W SH 114 (Main Lane)SH 114 (Exit Ramp to
White Chapel)SH 114 (Exit Ramp
to Dove)37963 50598 33.28% 3714 4527
9E SH 114 (Main Lane)SH 114 (Entrance Ramp from Dove)
SH 114 (Entrance Ramp from White
Chapel)37605 46966 24.89% 4215 3948
10W SH 114 (Frontage Road) White Chapel Dove 1802 2439 35.35% 292 31610E SH 114 (Frontage Road) White Chapel Dove 1844 1911 3.63% 203 167
11W SH 114 (Main Lane)SH 114 (Exit Ramp to
Dove)Dove 37184 46004 23.72% 3357 3983
11E SH 114 (Main Lane) DoveSH 114 (Entrance Ramp from Dove)
35154 42727 21.54% 3768 3509
12W SH 114 (Frontage Road) Dove Kirkwood 3379 3620 7.13% 297 35912E SH 114 (Frontage Road) Dove Kirkwood 3073 3382 10.06% 297 316
*Reference Numbers 2 and 12 were intentionally skipped

Ref # Segment Begin End 2009 Total 2013 Total % Change2013 AM Peak
Hour2013 AM
Peak Total2013 PM Peak
Hour2013 PM Peak
Total13aW FM 1709 SH 114 Nolen 15124 11:45-12:45 1107 16:45-17:45 143413aE FM 1709 SH 114 Nolen 18402 6:45-7:45 1738 17:00-18:00 128913W FM 1709 Nolen Kimball 19003 19054 0.27% 11:45-12:45 1538 16:45-17:45 181213E FM 1709 Nolen Kimball 18371 20652 12.42% 7:30-8:30 1768 12:00-13:00 161514W FM 1709 Kimball Carroll 20626 21431 3.90% 11:45-12:45 1425 17:00-18:00 209914E FM 1709 Kimball Carroll 22375 22294 -0.36% 7:45-8:45 2203 12:00-13:00 155615W FM 1709 Carroll Byron Nelson 24495 26563 8.44% 11:45-12:45 1580 17:00-18:00 266515E FM 1709 Carroll Byron Nelson 25363 27226 7.35% 7:15-8:15 2811 15:00-16:00 186116W FM 1709 Byron Nelson White Chapel 23020 25006 8.63% 11:45-12:45 1501 16:45-17:45 258016E FM 1709 Byron Nelson White Chapel 24135 25639 6.23% 7:15-8:15 2720 12:30-13:30 170217W FM 1709 White Chapel Shady Oaks 24678 26501 7.39% 11:45-12:45 1460 16:45-17:45 283017E FM 1709 White Chapel Shady Oaks 24137 27878 15.50% 7:30-8:30 2795 13:15-14:15 184318W FM 1709 Shady Oaks Southridge Lakes 25272 24997 -1.09% 11:30-12:30 1327 16:45-17:45 271918E FM 1709 Shady Oaks Southridge Lakes 26560 25998 -2.12% 7:15-8:15 2725 13:00-14:00 175219W FM 1709 Southridge Lakes Peytonville 23752 24948 5.04% 11:30-12:30 1331 16:45-17:45 264519E FM 1709 Southridge Lakes Peytonville 22223 26014 17.06% 7:15-8:15 2780 15:30-16:30 170620W FM 1709 Peytonville Randol Mill 20979 23663 12.79% 11:45-12:45 1308 17:00-18:00 257120E FM 1709 Peytonville Randol Mill 21361 24880 16.47% 7:00-8:00 2538 12:30-13:30 150021W FM 1709 Randol Mill Pearson 16941 19472 14.94% 11:45-12:45 1103 17:30-18:30 210621E FM 1709 Randol Mill Pearson 16830 18893 12.26% 7:00-8:00 2020 16:45-17:45 109222N Crooked Lane Nolen Kimball 487 563 15.61% 8:00-9:00 43 16:45-17:45 7022S Crooked Lane Nolen Kimball 410 554 35.12% 11:30-12:30 44 16:45-17:45 9523N Crooked Lane Kimball Continental 1422 1529 7.52% 7:45-8:45 198 17:00-18:00 15823S Crooked Lane Kimball Continental 1568 1862 18.75% 7:45-8:45 197 15:30-16:30 26724W Continental Kimball Crooked 4663 3575 -23.33% 11:45-12:45 245 16:45-17:45 54024E Continental Kimball Crooked 4831 4135 -14.41% 7:15-8:15 642 15:45-16:45 27625W Continental Crooked Carroll 3827 4544 18.74% 7:45-8:45 345 16:45-17:45 65125E Continental Crooked Carroll 4335 4886 12.71% 7:15-8:15 732 15:45-16:45 34226W Continental Carroll Byron Nelson 5254 4682 -10.89% 7:30-8:30 336 16:45-17:45 63226E Continental Carroll Byron Nelson 5432 5039 -7.23% 7:00-8:00 656 17:15-18:15 38827W Continental Byron Nelson White Chapel 5298 5654 6.72% 7:30-8:30 383 17:00-18:00 77727E Continental Byron Nelson White Chapel 5413 5652 4.42% 7:15-8:15 744 15:30-16:30 43728W Continental White Chapel Peytonville 4140 5371 29.73% 7:30-8:30 399 17:00-18:00 63828E Continental White Chapel Peytonville 3994 5254 31.55% 7:15-8:15 723 17:15-18:15 40229W Continental Peytonville Davis 3702 4743 28.12% 8:15-9:15 280 17:00-18:00 54729E Continental Peytonville Davis 3791 4754 25.40% 7:00-8:00 683 17:00-18:00 34630W Union Church Davis Pearson 1755 2380 35.61% 8:00-9:00 174 16:45-17:45 29930E Union Church Davis Pearson 1893 2335 23.35% 7:00-8:00 293 17:00-18:00 19331W Highland Kimball Carroll 669 508 -24.07% 7:15-8:15 82 14:15-15:15 5331E Highland Kimball Carroll 648 461 -28.86% 7:15-8:15 56 15:45-16:45 5432W Highland Carroll SH 114 272 246 -9.56% 7:45-8:45 62 15:15-16:15 3832E Highland Carroll SH 114 289 21 -92.73% 8:30-9:30 3 16:15-17:15 533W Highland SH 114 White Chapel 222 383 72.52% 7:30-8:30 48 17:15-18:15 9533E Highland SH 114 White Chapel 813 1379 69.62% 7:45-8:45 225 15:30-16:30 21334W Highland White Chapel Shady Oaks 1097 1308 19.23% 7:30-8:30 164 15:15-16:15 17534E Highland White Chapel Shady Oaks 1413 1773 25.48% 7:30-8:30 351 15:30-16:30 21935W Turnberry Shady Oaks Peytonville 621 695 11.92% 7:45-8:45 77 15:15-16:15 99
Other Count Locations

Ref # Segment Begin End 2009 Total 2013 Total % Change2013 AM Peak
Hour2013 AM
Peak Total2013 PM Peak
Hour2013 PM Peak
Total35E Turnberry Shady Oaks Peytonville 751 804 7.06% 7:30-8:30 181 15:00-16:00 9036W Dove Kimball Carroll 2373 2370 -0.13% 7:15-8:15 236 17:00-18:00 36436E Dove Kimball Carroll 2427 2196 -9.52% 7:15-8:15 264 17:00-18:00 30537W Dove Carroll White Chapel 2238 2488 11.17% 7:30-8:30 249 17:15-18:15 26137E Dove Carroll White Chapel 2179 2714 24.55% 7:00-8:00 209 16:45-17:45 37638W Dove White Chapel SH 114 3319 2606 -21.48% 7:30-8:30 414 17:00-18:00 30238E Dove White Chapel SH 114 2852 2453 -13.99% 7:15-8:15 347 17:00-18:00 36639W Dove Shady Oaks Peytonville 4602 5135 11.58% 7:30-8:30 410 17:00-18:00 78239E Dove Shady Oaks Peytonville 4576 4575 -0.02% 7:15-8:15 803 16:30-17:30 34240W Dove Peytonville Randol Mill 3403 3168 -6.91% 7:45-8:45 207 16:45-17:45 54840E Dove Peytonville Randol Mill 2919 2872 -1.61% 7:15-8:15 636 16:30-17:30 21842W Kirkwood SH 114 Precinct Line 2766 1855 -32.94% 7:15-8:15 162 17:00-18:00 45142E Kirkwood SH 114 Precinct Line 2734 1275 -53.37% 7:45-8:45 306 17:00-18:00 10043W Bob Jones White Chapel TW King 154 213 38.31% 7:45-8:45 21 17:30-18:30 2343E Bob Jones White Chapel TW King 190 208 9.47% 8:30-9:30 18 15:45-16:45 2244N TW King Kirkwood Bob Jones 447 426 -4.70% 7:45-8:45 29 17:00-18:00 4244S TW King Kirkwood Bob Jones 428 446 4.21% 7:15-8:15 51 15:15-16:15 4645N Pearson Union Church FM 1709 1340 2387 78.13% 7:30-8:30 243 16:45-17:45 26245S Pearson Union Church FM 1709 1643 2434 48.14% 7:30-8:30 251 17:15-18:15 25246N Pearson FM 1709 Johnson 2537 3036 19.67% 7:45-8:45 323 17:30-18:30 28646S Pearson FM 1709 Johnson 2755 3193 15.90% 7:15-8:15 278 17:00-18:00 40247N Pearson Johnson Florence 2680 3244 21.04% 7:30-8:30 464 15:00-16:00 26747S Pearson Johnson Florence 2898 3443 18.81% 7:15-8:15 360 17:00-18:00 48348N Davis Continental FM 1709 14934 15856 6.17% 7:15-8:15 1481 17:15-18:15 108948S Davis Continental FM 1709 15219 15375 1.03% 8:45-9:45 966 16:45-17:45 146049N Randol Mill FM 1709 Johnson 4305 6657 54.63% 7:30-8:30 681 17:45-18:45 52249S Randol Mill FM 1709 Johnson 4171 7514 80.15% 7:00-8:00 663 17:00-18:00 78050N Randol Mill Johnson Florence 3451 6298 82.50% 7:15-8:15 756 17:15-18:15 48850S Randol Mill Johnson Florence 3356 6367 89.72% 7:00-8:00 456 17:00-18:00 75651N Peytonville Continental Stonebury 1726 1855 7.47% 7:30-8:30 359 15:00-16:00 19751S Peytonville Continental Stonebury 1892 2053 8.51% 7:15-8:15 189 17:15-18:15 269
52aN Peytonville Stonebury FM 1709 3006 7:15-8:15 593 17:15-18:15 28052aS Peytonville Stonebury FM 1709 2997 7:30-8:30 184 17:30-18:30 39652N Peytonville FM 1709 Coventry 2302 2679 16.38% 8:00-9:00 280 17:15-18:15 29352S Peytonville FM 1709 Coventry 2472 2973 20.27% 7:15-8:15 496 16:45-17:45 38753N Peytonville Coventry Dove 2356 2458 4.33% 7:00-8:00 314 17:15-18:15 18953S Peytonville Coventry Dove 2509 2566 2.27% 7:15-8:15 306 17:00-18:00 37754N Shady Oaks FM 1709 Highland 1590 2028 27.55% 7:45-8:45 338 15:30-16:30 24854S Shady Oaks FM 1709 Highland 1432 1862 30.03% 7:45-8:45 344 15:15-16:15 25155N Shady Oaks Highland Dove 892 1137 27.47% 7:45-8:45 159 16:30-17:30 9955S Shady Oaks Highland Dove 925 1355 46.49% 7:30-8:30 234 16:45-17:45 15756N White Chapel City Limit Continental 3528 4092 15.99% 7:30-8:30 431 17:00-18:00 36656S White Chapel City Limit Continental 3631 4439 22.25% 7:30-8:30 249 17:15-18:15 60557N White Chapel Continental FM 1709 3926 4724 20.33% 7:30-8:30 582 18:00-19:00 36657S White Chapel Continental FM 1709 4231 5271 24.58% 7:30-8:30 350 17:15-18:15 60458N White Chapel FM 1709 Highland 5022 6909 37.57% 7:15-8:15 793 15:15-16:15 49658S White Chapel FM 1709 Highland 5923 7406 25.04% 7:15-8:15 663 17:15-18:15 74959N White Chapel Highland SH 114 4219 6537 54.94% 7:00-8:00 612 18:15-19:15 494

Ref # Segment Begin End 2009 Total 2013 Total % Change2013 AM Peak
Hour2013 AM
Peak Total2013 PM Peak
Hour2013 PM Peak
Total59S White Chapel Highland SH 114 5845 6915 18.31% 7:15-8:15 412 17:15-18:15 660
60aN White Chapel SH 114 Kirkwood 3150 7:30-8:30 289 17:00-18:00 29060aS White Chapel SH 114 Kirkwood 2979 7:15-8:15 364 14:45-15:45 26960N White Chapel Kirkwood Dove 2199 3222 46.52% 7:00-8:00 287 14:15-15:15 29560S White Chapel Kirkwood Dove 2403 3049 26.88% 7:15-8:15 414 14:45-15:45 28461N White Chapel Dove Bob Jones 2073 2250 8.54% 7:00-8:00 476 14:15-15:15 28561S White Chapel Dove Bob Jones 1655 2207 33.35% 7:30-8:30 496 14:45-15:45 28162N Byron Nelson FM 1709 Continental 2187 2273 3.93% 7:30-8:30 303 17:00-18:00 22362S Byron Nelson FM 1709 Continental 2345 2470 5.33% 7:30-8:30 171 17:00-18:00 38063N Byron Nelson Continental City Limit 1665 918 -44.86% 7:00-8:00 90 18:15-19:15 9763S Byron Nelson Continental City Limit 1654 968 -41.48% 7:45-8:45 110 17:15-18:15 10164N Carroll Carlisle Zena Rucker 4921 7838 59.28% 7:30-8:30 661 16:45-17:45 71464S Carroll Carlisle Zena Rucker 5059 7294 44.18% 11:45-12:45 438 16:45-17:45 720
65aN Carroll Zena Rucker FM 1709 8760 7:30-8:30 689 17:00-18:00 73565aS Carroll Zena Rucker FM 1709 8693 11:45-12:45 572 17:00-18:00 84565N Carroll FM 1709 SH 114 7939 10893 37.21% 7:30-8:30 846 16:45-17:45 87965S Carroll FM 1709 SH 114 8507 11584 36.17% 11:30-12:30 835 16:30-17:30 118066N Carroll Highland Dove 2518 2942 16.84% 7:45-8:45 236 15:45-16:45 28166S Carroll Highland Dove 2444 2854 16.78% 7:30-8:30 429 15:00-16:00 22067N Carroll Dove Burney 1503 1717 14.24% 7:45-8:45 103 15:45-16:45 18567S Carroll Dove Burney 1528 1730 13.22% 7:15-8:15 280 16:30-17:30 14368N Lonesome Dove Dove Burney 1495 413 -72.37% 11:00-12:00 34 18:00-19:00 5168S Lonesome Dove Dove Burney 1315 390 -70.34% 7:15-8:15 39 18:00-19:00 3369N Brumlow SH 26 Continental 6080 6907 13.60% 8:15-9:15 510 16:15-17:15 62669S Brumlow SH 26 Continental 6147 7970 29.66% 7:15-8:15 526 17:00-18:00 83070N Kimball Continental Crooked 3357 4477 33.36% 11:45-12:45 437 16:45-17:45 42670S Kimball Continental Crooked 3624 4394 21.25% 7:45-8:45 524 15:45-16:45 37671N Kimball Crooked FM 1709 4795 5720 19.29% 7:45-8:45 497 15:45-16:45 58571S Kimball Crooked FM 1709 3281 4145 26.33% 7:15-8:15 342 16:30-17:30 44972N Kimball FM 1709 SH 114 7729 8941 15.68% 11:45-12:45 693 16:30-17:30 82672S Kimball FM 1709 SH 114 9775 12150 24.30% 7:45-8:45 924 16:45-17:45 992
73aN Kimball SH 114 Kirkwood 6457 11:45-12:45 420 18:15-19:15 68173aS Kimball SH 114 Kirkwood 6071 7:30-8:30 681 15:30-16:30 43573N Kimball Kirkwood Highland 4129 6486 57.08% 11:30-12:30 360 17:00-18:00 69073S Kimball Kirkwood Highland 3973 5415 36.29% 7:15-8:15 616 17:30-18:30 43074N Kimball Highland Dove 4146 4721 13.87% 11:45-12:45 284 16:00-17:00 45674S Kimball Highland Dove 4151 4545 9.49% 7:15-8:15 532 17:45-18:45 39675N Kimball Dove City Limit 1866 2816 50.91% 11:45-12:45 162 17:30-18:30 32175S Kimball Dove City Limit 1802 2613 45.01% 7:15-8:15 302 17:45-18:45 21276N Commerce FM 1709 Exchange 2491 2868 15.13% 11:00-12:00 223 16:00-17:00 34876S Commerce FM 1709 Exchange 2456 2491 1.43% 7:30-8:30 180 12:00-13:00 20777W Johnson Pearson Randol Mill 945 1404 48.57% 10:15-11:15 69 17:15-18:15 23377E Johnson Pearson Randol Mill 1114 1437 28.99% 7:15-8:15 227 16:00-17:00 10678N Southridge Lakes FM 1709 Peytonville 1803 1452 -19.47% 11:45-12:45 95 18:30-19:30 13578S Southridge Lakes FM 1709 Peytonville 1664 1297 -22.06% 7:30-8:30 119 17:30-18:30 11879W Florence Pearson Randol Mill 856 1040 21.50% 7:00-8:00 87 17:15-18:15 14679E Florence Pearson Randol Mill 710 802 12.96% 7:45-8:45 120 15:00-16:00 7380N Randol Mill Kingswood Marantha 2670 4733 77.27% 7:30-8:30 678 17:45-18:45 300

Ref # Segment Begin End 2009 Total 2013 Total % Change2013 AM Peak
Hour2013 AM
Peak Total2013 PM Peak
Hour2013 PM Peak
Total80S Randol Mill Kingswood Marantha 2707 5703 110.68% 7:15-8:15 325 17:00-18:00 86481N Sam School Dove Kirkwood 909 747 -17.82% 7:45-8:45 139 17:15-18:15 4681S Sam School Dove Kirkwood 849 697 -17.90% 8:00-9:00 38 17:00-18:00 12082N White Chapel Bob Jones City Limit 443 157 -64.56% 10:30-11:30 13 16:15-17:15 1882S White Chapel Bob Jones City Limit 770 162 -78.96% 11:30-12:30 20 17:15-18:15 1884N Nolen SH 114 FM 1709 1472 3367 128.74% 11:45-12:45 327 12:45-13:45 32884S Nolen SH 114 FM 1709 2410 3895 61.62% 11:45-12:45 388 12:45-13:45 43785N Nolen FM 1709 Crooked 2351 2773 17.95% 11:45-12:45 305 16:30-17:30 33585S Nolen FM 1709 Crooked 2432 2710 11.43% 8:15-9:15 307 12:45-13:45 31886N Nolen Crooked Kimball 1621 2479 52.93% 7:30-8:30 234 15:45-16:45 21086S Nolen Crooked Kimball 1549 2200 42.03% 11:45-12:45 157 16:30-17:30 25287N Carroll Carlisle Continental 5247 6337 20.77% 7:30-8:30 517 17:30-18:30 51987S Carroll Carlisle Continental 4962 6121 23.36% 7:30-8:30 437 17:00-18:00 58688N Kimball SH 26 Nolen 6316 6830 8.14% 7:45-8:45 567 16:00-17:00 56488S Kimball SH 26 Nolen 7056 6855 -2.85% 7:15-8:15 741 17:00-18:00 57792N Village Center FM 1709 SH 114 2133 2818 32.11% 11:30-12:30 333 12:30-13:30 32192S Village Center FM 1709 SH 114 1222 1729 41.49% 11:30-12:30 179 12:30-13:30 17793N TW King SH 114 TW King E 563 537 -4.62% 7:30-8:30 43 15:00-16:00 4893S TW King SH 114 TW King E 388 376 -3.09% 7:45-8:45 55 15:15-16:15 3294N Randol Mill Our Dove 2968 948 -68.06% 7:15-8:15 152 14:30-15:30 6894S Randol Mill Our Dove 3727 1398 -62.49% 11:00-12:00 70 17:15-18:15 25195N Carroll SH 114 Highland 3547 5418 52.75% 7:30-8:30 453 15:30-16:30 69595S Carroll SH 114 Highland 3506 4641 32.37% 7:15-8:15 347 16:15-17:15 61697N Central FM 1709 Main 2637 1805 -31.55% 11:30-12:30 166 12:30-13:30 19997S Central FM 1709 Main 2677 1307 -51.18% 11:30-12:30 102 18:00-19:00 12798N Central Division SH 114 1917 11:30-12:30 136 12:30-13:30 21598S Central Division SH 114 868 11:45-12:45 88 16:45-17:45 8899N Grand Division SH 114 1408 11:45-12:45 94 21:30-22:30 12499S Grand Division SH 114 1244 11:30-12:30 136 18:00-19:00 139
100W Federal State Carroll 2189 11:30-12:30 152 13:00-14:00 216100E Federal State Carroll 2443 11:30-12:30 233 15:30-16:30 239101W Prospect State Carroll 3856 11:45-12:45 243 16:30-17:30 466101E Prospect State Carroll 1412 11:15-12:15 202 12:15-13:15 168102W Main State Carroll 2065 11:45-12:45 188 13:45-14:45 240102E Main State Carroll 4427 11:30-12:30 499 12:30-13:30 434103N Precinct Line Randol Mill Sabine 4202 7:15-8:15 689 16:30-17:30 272103S Precinct Line Randol Mill Sabine 4729 7:30-8:30 274 16:30-17:30 741104N Kirkwood Dove Stockton 1538 7:45-8:45 260 17:45-18:45 120104S Kirkwood Dove Stockton 1920 7:15-8:15 146 16:45-17:45 386105W Kirkwood White Chapel Carroll 392 9:45-10:45 42 13:45-14:45 40105E Kirkwood White Chapel Carroll 414 9:00-10:00 47 12:00-13:00 39106W Kirkwood Carroll Highland 1863 7:30-8:30 197 16:30-17:30 336106E Kirkwood Carroll Highland 2231 7:45-8:45 388 15:00-16:00 330107W Kirkwood Highland Blessed 1023 7:45-8:45 118 15:30-16:30 283107E Kirkwood Highland Blessed 1565 7:45-8:45 328 15:15-16:15 317108W Kirkwood Blessed Kimball 526 7:45-8:45 134 18:15-19:15 102108E Kirkwood Blessed Kimball 863 7:45-8:45 175 20:30-21:30 182109N Blessed SH 114 Kirkwood 1206 9:15-10:15 59 18:30-19:30 332

Ref # Segment Begin End 2009 Total 2013 Total % Change2013 AM Peak
Hour2013 AM
Peak Total2013 PM Peak
Hour2013 PM Peak
Total109S Blessed SH 114 Kirkwood 1188 7:45-8:45 121 20:45-21:45 332110N Silicon Kimball Nolen 1584 8:15-9:15 228 12:45-13:45 134110S Silicon Kimball Nolen 1515 11:45-12:45 116 17:00-18:00 219
*Reference Numbers 41, 83, 89, 90, 91, and 96 were intentionally skipped