Embed Size (px)
Citation preview

2017 Plastic Surgery Statistics Report
ASPS Public RelationsPhone: 773-332-4719Fax:847-981-5482Email: [email protected] Website: www.plasticsurgery.org
Please credit the AMERICAN SOCIETY OF PLASTIC SURGEONS when citing statistical data or using graphics.
1
All figures are projected.* Data unavailable in prior year.**87% of total 2017 breast implants were silicone; 13% were saline.***Botulinum Toxin Type A numbers are of anatomic sites injected.****Counts of procedures performed by ASPS member surgeons only.^In 2000 figure included all animal bites.^^In 2000 figure included facial laceration repair.^^^^In 2017 and 2016 figure includes facial laceration repair.
ASPS procedural statistics represent procedures performed by ASPS Member Surgeons certified by The American Board of Plastic Surgery® as well as other physicians certified by American Board of Medical Specialties-recognized boards. ©ASPS, 2018
Margin of error = +/- 4.05%
2017 Cosmetic Plastic Surgery StatisticsCosmetic Procedure Trends
COSMETIC SURGICAL PROCEDURES 2017 2016 2000 % CHANGE2017 vs. 2016
% CHANGE2017 vs. 2000
Breast augmentation (Augmentation mammaplasty)** 300,378 290,467 212,500 3% 41%Breast implant removals (Augmentation patients only) 27,507 28,467 40,787 -3% -33%Breast lift (Mastopexy) 105,219 101,264 52,836 4% 99%Breast reduction (Aesthetic patients only)**** 43,635 39,148 * 11% *Breast reduction in men (Gynecomastia) 26,839 27,760 20,351 -3% 32%Buttock augmentation with fat grafting**** 20,301 18,489 * 10% *Buttock implants**** 1,323 2,999 * -56% *Buttock lift 4,804 4,251 1,356 13% 254%Calf augmentation**** 658 419 * 57% *Cheek implant (Malar augmentation) 14,277 13,197 10,427 8% 37%Chin augmentation (Mentoplasty) 16,136 16,688 26,924 -3% -40%Dermabrasion 84,276 88,182 42,218 -4% 100%Ear surgery (Otoplasty) 23,433 23,709 36,295 -1% -35%Eyelid surgery (Blepharoplasty) 209,571 209,020 327,514 0% -36%Facelift (Rhytidectomy) 125,697 131,106 133,856 -4% -6% Full Facelift 96,438 97,110 * -1% * Mini Facelift 29,259 33,996 * -14% *Forehead lift 39,886 43,038 120,971 -7% -67%Hair transplantation 19,979 16,784 44,694 19% -55%Labiaplasty **** ┼ 10,253 12,666 * -19% *Lip augmentation (other than injectable materials) 29,797 28,430 18,589 5% 60%Lip reduction**** 1,065 3,547 * -70% *Liposuction 246,354 235,237 354,015 5% -30%Lower body lift 9,075 11,299 207 -20% 4284%Neck lift 53,028 55,227 * -4% *Nose reshaping (Rhinoplasty) 218,924 223,018 389,155 -2% -44%Pectoral implants**** 983 1,153 * -15% *Thigh Lift 9,648 9,929 5,303 -3% 82%Tummy tuck (Abdominoplasty) 129,753 127,633 62,713 2% 107%Upper arm lift 18,033 17,860 338 1% 5235%
TOTAL COSMETIC SURGICAL PROCEDURES 1,790,832 1,780,987 1,901,049 1% -6%
Top 5 procedures appear in bold.

2017 Plastic Surgery Statistics Report
ASPS Public RelationsPhone: 773-332-4719Fax: 847-981-5482Email: [email protected] Website: www.plasticsurgery.org
Please credit the AMERICAN SOCIETY OF PLASTIC SURGEONS when citing statistical data or using graphics.
2
All figures are projected.* Data unavailable in prior year.**87% of total 2017 breast implants were silicone; 13% were saline.***Botulinum Toxin Type A numbers are of anatomic sites injected.****Counts of procedures performed by ASPS member surgeons only.^In 2000 figure included all animal bites.^^In 2000 figure included facial laceration repair.^^^^In 2017 and 2016 figure includes facial laceration repair.
ASPS procedural statistics represent procedures performed by ASPS Member Surgeons certified by The American Board of Plastic Surgery® as well as other physicians certified by American Board of Medical Specialties-recognized boards. ©ASPS, 2018
Margin of error = +/- 4.05%
COSMETIC MINIMALLY-INVASIVE PROCEDURES 2017 2016 2000 % CHANGE2017 vs. 2016
% CHANGE2017 vs. 2000
Botulinum Toxin Type A (Botox®, Dysport®, Xeomin®)*** 7,230,967 7,056,255 786,911 2% 819%Cellulite treatment (Velosmooth®, Endermology) 37,034 30,995 23,952 19% 55%Chemical peel 1,376,703 1,360,850 1,149,457 1% 20%Injection lipolysis (e.g., Kybella®)┼ 62,587 55,660 * 12% *Intense Pulsed Light (IPL) treatment 667,561 656,781 * 2% *Laser hair removal 1,086,830 1,109,385 735,996 -2% 48%Laser skin resurfacing 587,903 586,662 170,951 0% 244% Ablative 161,670 166,194 * -3% * Non-ablative (Fraxel®, etc.) 426,233 420,468 * 1% *Laser treatment of leg veins 218,929 217,179 245,424 1% -11%Microdermabrasion 740,287 775,014 868,315 -4% -15%Non-invasive fat reduction (e.g., Coolsculpting®, Liposonix®)┼ 356,378 333,082 * 7% *Non-surgical skin tightening (e.g., Pelleve®, Thermage®, Ulthera®) 333,334 306,089 * 9% *Sclerotherapy 324,340 323,009 866,555 0% -63%Soft Tissue Fillers 2,691,265 2,600,868 652,885 3% 312% Acellular Dermal Matrix**** 8,349 7,809 * 7% * Calcium hydroxylapatite (Radiesse®) 237,244 242,563 * -2% * Collagen 13,656 14,126 587,615 -3% -98% Porcine/bovine-based (Evolence®, Zyderm®, Zyplast®) 13,656 14,126 * -3% * Fat 85,685 79,208 65,270 8% 31% Hyaluronic acid (Juvederm Ultra®, Juvederm Ultra Plus®, Perlane®, Restylane®, Belotero®) 2,091,476 2,012,672 * 4% *
Platelet-Rich Plasma (PRP)┼ 113,356 102,101 * 11% * Polylactic acid (Sculptra®) 123,860 125,044 * -1% * Polymethyl-methacrylate microspheres (Artefill®) 17,639 17,345 * 2% *
TOTAL COSMETIC MINIMALLY-INVASIVE PROCEDURES 15,714,118 15,411,829 5,500,446 2% 186%
TOTAL COSMETIC PROCEDURES 17,504,950 17,192,816 7,401,495 2% 137%
2017 Cosmetic Plastic Surgery StatisticsCosmetic Procedure Trends
2017 Plastic Surgery Statistics Report
ASPS Public RelationsPhone: 773-332-4719Fax:847-981-5482Email: [email protected] Website: www.plasticsurgery.org
Please credit the AMERICAN SOCIETY OF PLASTIC SURGEONS when citing statistical data or using graphics.
3
All figures are projected.* Data unavailable in prior year.**87% of total 2017 breast implants were silicone; 13% were saline.***Botulinum Toxin Type A numbers are of anatomic sites injected.****Counts of procedures performed by ASPS member surgeons only.^In 2000 figure included all animal bites.^^In 2000 figure included facial laceration repair.^^^^In 2017 and 2016 figure includes facial laceration repair.
ASPS procedural statistics represent procedures performed by ASPS Member Surgeons certified by The American Board of Plastic Surgery® as well as other physicians certified by American Board of Medical Specialties-recognized boards. ©ASPS, 2018
Margin of error = +/- 4.05%
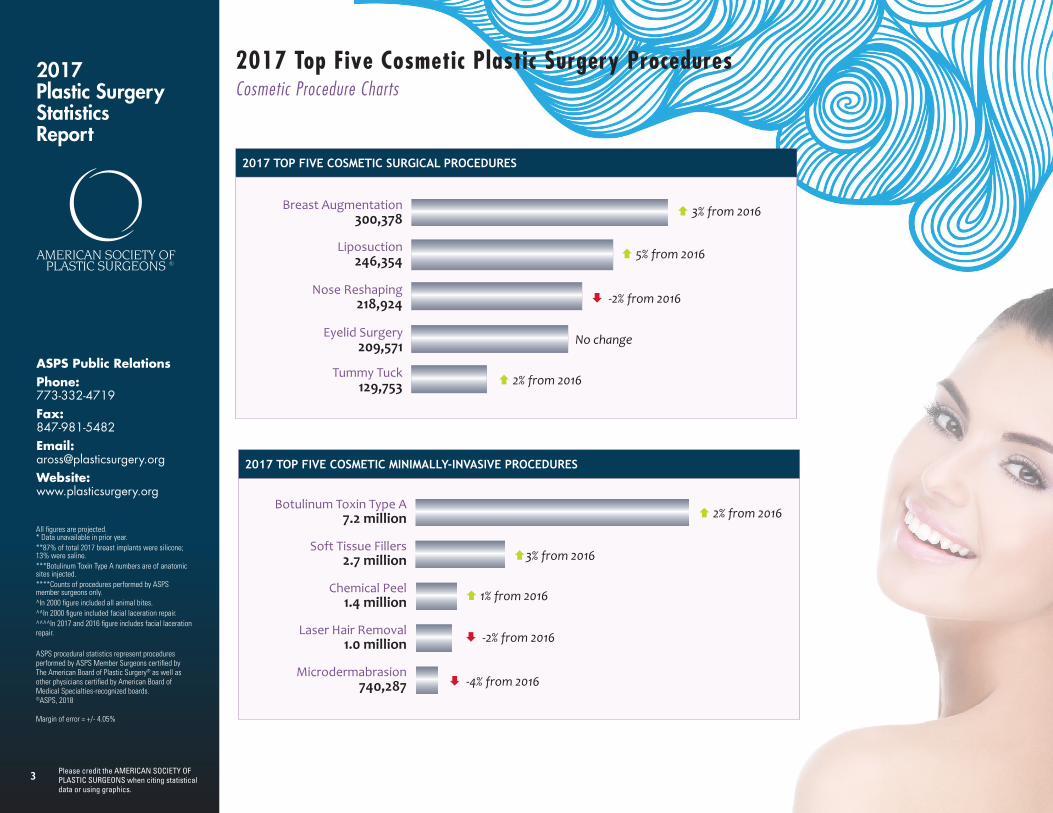
2017 Top Five Cosmetic Plastic Surgery ProceduresCosmetic Procedure Charts
Breast Augmentation300,378
Liposuction246,354
Eyelid Surgery209,571
Tummy Tuck129,753
2017 TOP FIVE COSMETIC SURGICAL PROCEDURES
Nose Reshaping218,924 -2% from 2016
5% from 2016
No change
2% from 2016
3% from 2016
Botulinum Toxin Type A 7.2 million
Soft Tissue Fillers2.7 million
Chemical Peel1.4 million
Laser Hair Removal1.0 million
Microdermabrasion740,287
2% from 2016
3% from 2016
1% from 2016
2017 TOP FIVE COSMETIC MINIMALLY-INVASIVE PROCEDURES
-2% from 2016
-4% from 2016

Please credit the AMERICAN SOCIETY OF PLASTIC SURGEONS when citing statistical data or using graphics.
2017 Plastic Surgery Statistics Report
2017 Reconstructive Plastic Surgery StatisticsReconstructive Procedure Trends
RECONSTRUCTIVE PROCEDURES 2017 2016 2000 % CHANGE2017 vs. 2016
% CHANGE2017 vs. 2000
Dog bite repair^ 27,923 28,991 43,089 -4% -35%Birth defect (congenital deformities) 31,582 29,959 40,076 5% -21%Breast implant removals (Reconstructive patients only)**** 19,415 18,778 16,287 3% 19%Breast reconstruction**** 106,295 109,256 78,832 -3% 35%Breast reduction (reconstructive patients only) 59,463 61,821 * -4% *Burn care 16,964 16,183 * 5% *Hand surgery (excluding microsurgical) 138,095 135,250 * 2% *Head and neck reconstruction**** 27,898 28,496 * -2% *Hernia repair**** 10,758 9,938 * 8% *Laceration repair (other than facial)^^ 253,760 253,361 358,666 0% -29%Lower extremity reconstruction (including microsurgical)**** 15,625 16,444 * -5% *Maxillofacial surgery^^^^ 204,778 202,688 79,331 1% 158%Pelvic floor reconstruction**** 1,592 1,421 * 12% *Scar revision 182,321 181,190 221,858 1% -18%Tumor removal (including skin cancer) 4,479,033 4,473,238 * 0% *Other reconstructive procedures 258,851 253,993 376,270 2% -31%
TOTAL RECONSTRUCTIVE PROCEDURES 5,834,353 5,821,007 * 0% *
Top 5 procedures appear in bold.
ASPS Public RelationsPhone: 847-228-9900Fax:847-981-5482Email: [email protected] Website: www.plasticsurgery.org
All figures are projected.* Data unavailable in prior year.**87% of total 2017 breast implants were silicone; 13% were saline.***Botulinum Toxin Type A numbers are of anatomic sites injected.****Counts of procedures performed by ASPS member surgeons only.^In 2000 figure included all animal bites.^^In 2000 figure included facial laceration repair.^^^^In 2017 and 2016 figure includes facial laceration repair.
ASPS procedural statistics represent procedures performed by ASPS Member Surgeons certified by The American Board of Plastic Surgery® as well as other physicians certified by American Board of Medical Specialties-recognized boards. ©ASPS, 2018
Margin of error = +/- 4.05%
4
Tumor Removal 4.5 million
Laceration Repair253,760
Maxillofacial Surgery204,778
2017 TOP FIVE RECONSTRUCTIVE PROCEDURES
Scar Revision182,321
Hand Surgery138,095
No change
1% from 2016
2% from 2016
No change
1% from 2016