Embed Size (px)
Citation preview

ASPS Public Relations Phone: 773-332-4719 Fax: 847-981-5482 Email: [email protected] www.PlasticSurgery.org
ASPS National Clearinghouse of Plastic Surgery Procedural Statistics
PLASTIC SURGERY STATISTICS REPORT

2017 Plastic Surgery Statistics Report
ASPS Public RelationsPhone: 773-332-4719Fax: 847-981-5482Email: [email protected] Website: www.plasticsurgery.org
Please credit the AMERICAN SOCIETY OF PLASTIC SURGEONS when citing statistical data or using graphics.
2
2017 Plastic Surgery StatisticsTable of Contents
Introduction
About the American Society of Plastic Surgeons ......................................................................................3
Methodology and Validity ..........................................................................................................................4
2017 Quick Facts - Plastic Surgery Trends .................................................................................................5
2017 Quick Facts - Demographic Trends ....................................................................................................6
Statistical Reports
Cosmetic Procedure Trends .....................................................................................................................7-8
Cosmetic Procedure Charts ........................................................................................................................8
Reconstructive Procedure Trends and Charts ............................................................................................9
Cosmetic Surgery Gender Distribution – Female ....................................................................................10
Top Five Cosmetic Surgery Gender Distribution Charts – Female ...........................................................11
Cosmetic Surgery Gender Distribution – Male .......................................................................................12
Top Five Cosmetic Surgery Gender Distribution Charts – Male ..............................................................13
Cosmetic Surgery Age Distribution (13-19) .............................................................................................14
Cosmetic Surgery Age Distribution (20-29) .............................................................................................15
Cosmetic Surgery Age Distribution (30-39) .............................................................................................16
Cosmetic Surgery Age Distribution (40-54) .............................................................................................17
Cosmetic Surgery Age Distribution (55 and Over) ...................................................................................18
Regional Distribution ..............................................................................................................................19
Average Surgeon/Physician Fees – Cosmetic Procedures ......................................................................20
Cosmetic Demographics ..........................................................................................................................21
Reconstructive Demographics .................................................................................................................22
Reconstructive Breast Procedures ...........................................................................................................22
Body Contouring after Massive Weight Loss ..........................................................................................23
Gender Confirmation Surgery Statistics ..................................................................................................23

2017 Plastic Surgery Statistics Report
ASPS Public RelationsPhone: 773-332-4719Fax: 847-981-5482Email: [email protected] Website: www.plasticsurgery.org
Please credit the AMERICAN SOCIETY OF PLASTIC SURGEONS when citing statistical data or using graphics.
3
2017 Plastic Surgery StatisticsAbout the American Society of Plastic Surgeons
The American Society of Plastic Surgeons®
ASPS®, a non-profit organization, supports members in their efforts to provide the highest quality patient care through education, research and advocacy. It is the only organization with two decades of plastic surgery statistics – 1992-2015. ASPS is the largest organization of board-certified plastic surgeons in the world. With more than 7,000 members, the Society is recognized as a leading authority and information source on cosmetic and reconstructive plastic surgery. ASPS comprises more than 94 percent of all board-certified plastic surgeons in the United States. Founded in 1931, the Society represents physicians certified by The American Board of Plastic Surgery, Inc.® (ABPS®) or The Royal College of Physicians and Surgeons of Canada.
The ASPS mission is to advance quality care to plastic surgery patients by encouraging high standards of training, ethics, physician practice, and research in plastic surgery.
ASPS Member Surgeons are uniquely qualified to perform cosmetic and reconstructive plastic surgery on the face and all areas of the body.
Consumers can visit the ASPS at PlasticSurgery.org to find ASPS Member Surgeons in their area or learn more about cosmetic and reconstructive plastic surgery, like us on Facebook.com/PlasticSurgeryASPS and follow us at Twitter.com/ASPS_News.
ASPS Spokespersons Network
The ASPS Spokespersons Network is a valuable plastic surgery resource. It comprises more than 100 plastic surgeons from across the United States and Canada trained and available to assist journalists.
These spokespersons provide expert perspectives on a broad range of plastic surgery topics including procedural details, the patient-physician relationship, emerging trends, teens, and minorities.
They are also knowledgeable about the Society’s positions on health care reform, scope of practice and other issues that affect patient care.
To arrange interviews with members of the ASPS Spokespersons Network, contact the ASPS Public Relations Department.
PlasticSurgery.org
The ASPS online newsroom is the most comprehensive site for journalistic research on cosmetic and reconstructive plastic surgery on the Internet. The latest news releases and the online version of the National Clearinghouse of Plastic Surgery Statistics are available.
Full color graphics and statistical graphs can be downloaded or are available by contacting the ASPS Public Relations Department.
Pre- and Postoperative Photos and B-Roll
ASPS has a library of pre- and postoperative images and B-roll available to the media by contacting the ASPS Public Relations Department.
ASPS Member Surgeons have the following qualifications:
✔ Are certified by The American Board of Plastic Surgery and trained specifically in plastic surgery.
✔ Have at least 6 years surgical training, minimum of 3 years plastic surgery training.
✔ Operate only in accredited medical facilities.
✔ Adhere to a strict code of ethics.
✔ Fulfill continuing education requirements, including patient safety techniques.
✔ Are partners with patients in cosmetic and reconstructive plastic surgery

Please credit the AMERICAN SOCIETY OF PLASTIC SURGEONS when citing statistical data or using graphics.
4
2017 Plastic Surgery Statistics Report
4
ASPS Public RelationsPhone: 847-228-9900Fax: 847-981-5482Email: [email protected] Website: www.plasticsurgery.org
2017 Plastic Surgery StatisticsMethodology and Validity
Methodology
Since 1992, the American Society of Plastic Surgeons® (ASPS®) has been the source of cosmetic and reconstructive plastic surgery statistical trends in the U.S., and this series represents two decades of procedural data. ASPS has partnered with Data Harbor Solutions, a health care industry data management and technology development company, to ensure objectivity in the gathering, analysis and publication of its procedural statistics.
Since 2000, the report represents a universal and comprehensive estimate of cosmetic and reconstructive plastic surgery procedures performed by ASPS Member Surgeons as well as other physicians most likely to perform plastic surgery procedures. These physicians are all certified by American Board of Medical Specialties (ABMS) recognized boards.
ABMS is the umbrella organization for the 24 approved medical specialty boards in the United States. Established in 1933, ABMS serves to provide information concerning issues involving specialization and certification in medicine. The American Board of Plastic Surgery® (ABPS®) represents physicians who are certified by ABPS®, the only ABMS member board that certifies surgeons in plastic surgery of the face and entire body.
ASPS offers the most comprehensive, reliable statistics on cosmetic and reconstructive plastic surgery procedures performed in the United States. The annual questionnaire was distributed to more than 24,500 ABMS board-certified physicians (An online and faxed version of the questionnaire were made available. A total of 571 active physicians returned questionnaires. Overall, 783 active physicians were included in the final sample). This data is combined with the first online national database for plastic surgery procedures Tracking Operations and Outcomes for Plastic SurgeonsSM (TOPSSM).
All responses are aggregated and extrapolated to the entire population of more than 24,500 board certified physicians most likely to perform cosmetic and reconstructive plastic surgery procedures, resulting in the most accurate census available.
Validity
Results of the survey are based on a 95 percent confidence level with a ±4.05 percent margin of error.

2017 Plastic Surgery Statistics Report
ASPS Public RelationsPhone: 773-332-4719Fax: 847-981-5482Email: [email protected] Website: www.plasticsurgery.org
Please credit the AMERICAN SOCIETY OF PLASTIC SURGEONS when citing statistical data or using graphics.
5
2017 Quick FactsCosmetic and Reconstructive Plastic Surgery Trends
2017 Top 5 Cosmetic Surgical Procedures 2017 vs. 2016Breast augmentation (300,000) 3% Liposuction (246,000) 5% Nose Reshaping (218,000) 2% Eyelid surgery (209,000) no change Tummy Tuck (129,000) 2%
Percentage change 2017 vs. 2016
17.5 million cosmetic procedures 2%
• 1.8 million cosmetic surgical procedures 1%
• 15.7 million cosmetic minimally-invasive procedures 2%
5.8 million reconstructive procedures no change
2017 Top 5 Cosmetic Minimally-Invasive Procedures
2017 vs. 2016Botulinum toxin type A (7.2 million) 2% Soft tissue fillers (2.7 million) 3% Chemical peel (1.4 million) 1% Laser hair removal (1.0 million) 2% Microdermabrasion (740,000) 4%
2017 Top 5 Reconstructive Procedures
2017 vs. 2016Tumor removal (4.5 million) no change Laceration repair (253,000) no change Maxillofacial surgery (204,000) 1%Scar revision (182,000) 1% Hand surgery (138,000) 2%
Breast augmentation continues to be the top cosmetic surgical procedureand has been since 2006. Silicone implants were used in 87%, and saline implants in 13%, of all breast augmentations in 2017.
Cosmetic surgical procedures, not among the Top 5, with notable gains in 2017 include: • Buttock augmentation w/ fat grafting – up 10%• Breast Reduction – up 11%• Hair Transplantation – up 19%
Facial rejuvenation procedures continue to experience growth, as 2017 marked the highest number of botulinum toxin type A injections to date, with over 7.2 million injections!
Tumor removal is overwhelming the top reconstructive procedure performed every year with approximately 4.5 million procedures in 2017!
ASPS procedural statistics represent procedures performed by ASPS Member Surgeons certified by The American Board of Plastic Surgery® as well as other physicians certified by American Board of Medical Specialties-recognized boards. ©ASPS, 2018
Please credit the AMERICAN SOCIETY OF PLASTIC SURGEONS when citing statistical data or using graphics.
6
2017 Plastic Surgery Statistics Report
6
ASPS Public RelationsPhone: 773-332-4719Fax: 847-981-5482Email: [email protected] Website: www.plasticsurgery.org
ASPS procedural statistics represent procedures performed by ASPS Member Surgeons certified by The American Board of Plastic Surgery® as well as other physicians certified by American Board of Medical Specialties-recognized boards. ©ASPS, 2018
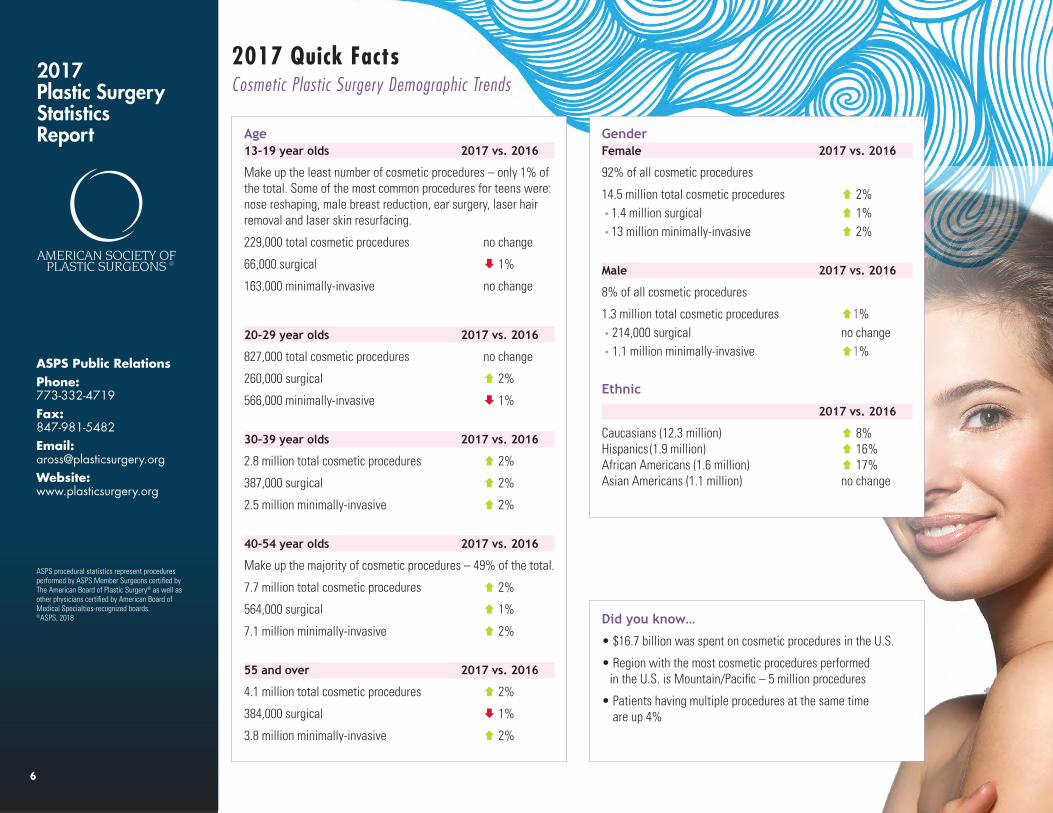
2017 Quick FactsCosmetic Plastic Surgery Demographic Trends
Age13-19 year olds 2017 vs. 2016
Make up the least number of cosmetic procedures – only 1% of the total. Some of the most common procedures for teens were: nose reshaping, male breast reduction, ear surgery, laser hair removal and laser skin resurfacing.
229,000 total cosmetic procedures no change
66,000 surgical 1%
163,000 minimally-invasive no change
20-29 year olds 2017 vs. 2016
827,000 total cosmetic procedures no change
260,000 surgical 2%
566,000 minimally-invasive ↑ 1%
30-39 year olds 2017 vs. 2016
2.8 million total cosmetic procedures 2%
387,000 surgical 2%
2.5 million minimally-invasive 2%
40-54 year olds 2017 vs. 2016
Make up the majority of cosmetic procedures – 49% of the total.
7.7 million total cosmetic procedures 2%
564,000 surgical ↑ 1%
7.1 million minimally-invasive 2%
55 and over 2017 vs. 2016
4.1 million total cosmetic procedures ↑ 2%
384,000 surgical 1%
3.8 million minimally-invasive 2%
Gender Female 2017 vs. 2016
92% of all cosmetic procedures
14.5 million total cosmetic procedures 2% • 1.4 million surgical 1% • 13 million minimally-invasive 2%
Male 2017 vs. 2016
8% of all cosmetic procedures
1.3 million total cosmetic procedures 1% • 214,000 surgical no change • 1.1 million minimally-invasive 1%
Ethnic
2017 vs. 2016
Caucasians (12.3 million) 8% Hispanics (1.9 million) 16% African Americans (1.6 million) 17% Asian Americans (1.1 million) no change
Did you know…
• $16.7 billion was spent on cosmetic procedures in the U.S.
• Region with the most cosmetic procedures performed in the U.S. is Mountain/Pacific – 5 million procedures
• Patients having multiple procedures at the same time are up 4%
2017 Plastic Surgery Statistics Report
ASPS Public RelationsPhone: 773-332-4719Fax: 847-981-5482Email: [email protected] Website: www.plasticsurgery.org
Please credit the AMERICAN SOCIETY OF PLASTIC SURGEONS when citing statistical data or using graphics.
7
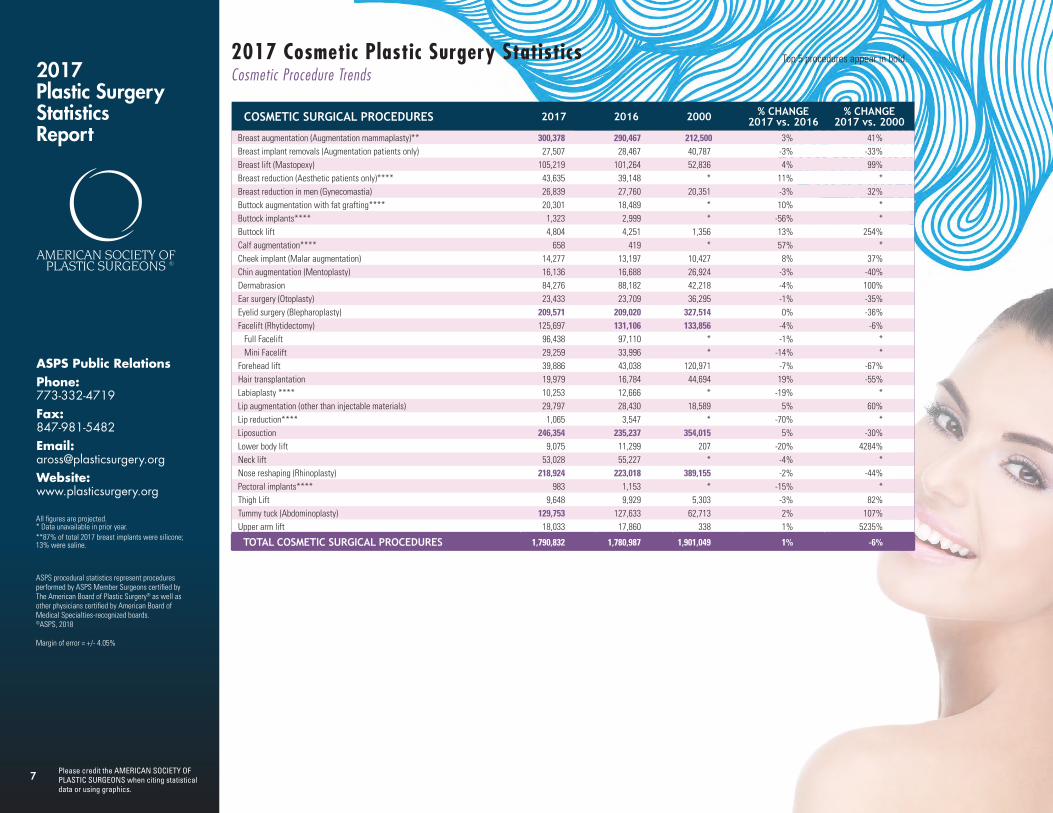
All figures are projected.* Data unavailable in prior year.**87% of total 2017 breast implants were silicone; 13% were saline.
ASPS procedural statistics represent procedures performed by ASPS Member Surgeons certified by The American Board of Plastic Surgery® as well as other physicians certified by American Board of Medical Specialties-recognized boards. ©ASPS, 2018
Margin of error = +/- 4.05%
2017 Cosmetic Plastic Surgery StatisticsCosmetic Procedure Trends
COSMETIC SURGICAL PROCEDURES 2017 2016 2000 % CHANGE2017 vs. 2016
% CHANGE2017 vs. 2000
Breast augmentation (Augmentation mammaplasty)** 300,378 290,467 212,500 3% 41%Breast implant removals (Augmentation patients only) 27,507 28,467 40,787 -3% -33%Breast lift (Mastopexy) 105,219 101,264 52,836 4% 99%Breast reduction (Aesthetic patients only)**** 43,635 39,148 * 11% *Breast reduction in men (Gynecomastia) 26,839 27,760 20,351 -3% 32%Buttock augmentation with fat grafting**** 20,301 18,489 * 10% *Buttock implants**** 1,323 2,999 * -56% *Buttock lift 4,804 4,251 1,356 13% 254%Calf augmentation**** 658 419 * 57% *Cheek implant (Malar augmentation) 14,277 13,197 10,427 8% 37%Chin augmentation (Mentoplasty) 16,136 16,688 26,924 -3% -40%Dermabrasion 84,276 88,182 42,218 -4% 100%Ear surgery (Otoplasty) 23,433 23,709 36,295 -1% -35%Eyelid surgery (Blepharoplasty) 209,571 209,020 327,514 0% -36%Facelift (Rhytidectomy) 125,697 131,106 133,856 -4% -6% Full Facelift 96,438 97,110 * -1% * Mini Facelift 29,259 33,996 * -14% *Forehead lift 39,886 43,038 120,971 -7% -67%Hair transplantation 19,979 16,784 44,694 19% -55%Labiaplasty **** ↑ 10,253 12,666 * -19% *Lip augmentation (other than injectable materials) 29,797 28,430 18,589 5% 60%Lip reduction**** 1,065 3,547 * -70% *Liposuction 246,354 235,237 354,015 5% -30%Lower body lift 9,075 11,299 207 -20% 4284%Neck lift 53,028 55,227 * -4% *Nose reshaping (Rhinoplasty) 218,924 223,018 389,155 -2% -44%Pectoral implants**** 983 1,153 * -15% *Thigh Lift 9,648 9,929 5,303 -3% 82%Tummy tuck (Abdominoplasty) 129,753 127,633 62,713 2% 107%Upper arm lift 18,033 17,860 338 1% 5235%
TOTAL COSMETIC SURGICAL PROCEDURES 1,790,832 1,780,987 1,901,049 1% -6%
Top 5 procedures appear in bold.

2017 Plastic Surgery Statistics Report
ASPS Public RelationsPhone: 773-332-4719Fax: 847-981-5482Email: [email protected] Website: www.plasticsurgery.org
Please credit the AMERICAN SOCIETY OF PLASTIC SURGEONS when citing statistical data or using graphics.
8
All figures are projected.* Data unavailable in prior year.***Botulinum Toxin Type A numbers are of anatomic sites injected.****Counts of procedures performed by ASPS member surgeons only. ASPS procedural statistics represent procedures performed by ASPS Member Surgeons certified by The American Board of Plastic Surgery® as well as other physicians certified by American Board of Medical Specialties-recognized boards. ©ASPS, 2018
Margin of error = +/- 4.05%
COSMETIC MINIMALLY-INVASIVE PROCEDURES 2017 2016 2000 % CHANGE2017 vs. 2016
% CHANGE2017 vs. 2000
Botulinum Toxin Type A (Botox®, Dysport®, Xeomin®)*** 7,230,967 7,056,255 786,911 2% 819%Cellulite treatment (Velosmooth®, Endermology) 37,034 30,995 23,952 19% 55%Chemical peel 1,376,703 1,360,850 1,149,457 1% 20%Injection lipolysis (e.g., Kybella®)↑ 62,587 55,660 * 12% *Intense Pulsed Light (IPL) treatment 667,561 656,781 * 2% *Laser hair removal 1,086,830 1,109,385 735,996 -2% 48%Laser skin resurfacing 587,903 586,662 170,951 0% 244% Ablative 161,670 166,194 * -3% * Non-ablative (Fraxel®, etc.) 426,233 420,468 * 1% *Laser treatment of leg veins 218,929 217,179 245,424 1% -11%Microdermabrasion 740,287 775,014 868,315 -4% -15%Non-invasive fat reduction (e.g., Coolsculpting®, Liposonix®)↑ 356,378 333,082 * 7% *Non-surgical skin tightening (e.g., Pelleve®, Thermage®, Ulthera®) 333,334 306,089 * 9% *Sclerotherapy 324,340 323,009 866,555 0% -63%Soft Tissue Fillers 2,691,265 2,600,868 652,885 3% 312% Acellular Dermal Matrix**** 8,349 7,809 * 7% * Calcium hydroxylapatite (Radiesse®) 237,244 242,563 * -2% * Collagen 13,656 14,126 587,615 -3% -98% Porcine/bovine-based (Evolence®, Zyderm®, Zyplast®) 13,656 14,126 * -3% * Fat 85,685 79,208 65,270 8% 31% Hyaluronic acid (Juvederm Ultra®, Juvederm Ultra Plus®, Perlane®, Restylane®, Belotero®) 2,091,476 2,012,672 * 4% *
Platelet-Rich Plasma (PRP)↑ 113,356 102,101 * 11% * Polylactic acid (Sculptra®) 123,860 125,044 * -1% * Polymethyl-methacrylate microspheres (Artefill®) 17,639 17,345 * 2% *
TOTAL COSMETIC MINIMALLY-INVASIVE PROCEDURES 15,714,118 15,411,829 5,500,446 2% 186%
TOTAL COSMETIC PROCEDURES 17,504,950 17,192,816 7,401,495 2% 137%
2017 Cosmetic Plastic Surgery StatisticsCosmetic Procedure Trends

2017 Plastic Surgery Statistics Report
ASPS Public RelationsPhone: 773-332-4719Fax: 847-981-5482Email: [email protected] Website: www.plasticsurgery.org
Please credit the AMERICAN SOCIETY OF PLASTIC SURGEONS when citing statistical data or using graphics.
9
ASPS procedural statistics represent procedures performed by ASPS Member Surgeons certified by The American Board of Plastic Surgery® as well as other physicians certified by American Board of Medical Specialties-recognized boards. ©ASPS, 2018
Margin of error = +/- 4.05%
2017 Top Five Cosmetic Plastic Surgery ProceduresCosmetic Procedure Charts
Breast Augmentation300,378
Liposuction246,354
Eyelid Surgery209,571
Tummy Tuck129,753
2017 TOP FIVE COSMETIC SURGICAL PROCEDURES
Nose Reshaping218,924 -2% from 2016
5% from 2016
No change
2% from 2016
3% from 2016
Botulinum Toxin Type A 7.2 million
Soft Tissue Fillers2.7 million
Chemical Peel1.4 million
Laser Hair Removal1.0 million
Microdermabrasion740,287
2% from 2016
3% from 2016
1% from 2016
2017 TOP FIVE COSMETIC MINIMALLY-INVASIVE PROCEDURES
-2% from 2016
-4% from 2016

Please credit the AMERICAN SOCIETY OF PLASTIC SURGEONS when citing statistical data or using graphics.
10
2017 Plastic Surgery Statistics Report
2017 Reconstructive Plastic Surgery StatisticsReconstructive Procedure Trends
RECONSTRUCTIVE PROCEDURES 2017 2016 2000 % CHANGE2017 vs. 2016
% CHANGE2017 vs. 2000
Dog bite repair^ 27,923 28,991 43,089 -4% -35%Birth defect (congenital deformities) 31,582 29,959 40,076 5% -21%Breast implant removals (Reconstructive patients only)**** 19,415 18,778 16,287 3% 19%Breast reconstruction**** 106,295 109,256 78,832 -3% 35%Breast reduction (reconstructive patients only) 59,463 61,821 * -4% *Burn care 16,964 16,183 * 5% *Hand surgery (excluding microsurgical) 138,095 135,250 * 2% *Head and neck reconstruction**** 27,898 28,496 * -2% *Hernia repair**** 10,758 9,938 * 8% *Laceration repair (other than facial)^^ 253,760 253,361 358,666 0% -29%Lower extremity reconstruction (including microsurgical)**** 15,625 16,444 * -5% *Maxillofacial surgery^^^^ 204,778 202,688 79,331 1% 158%Pelvic floor reconstruction**** 1,592 1,421 * 12% *Scar revision 182,321 181,190 221,858 1% -18%Tumor removal (including skin cancer) 4,479,033 4,473,238 * 0% * Skin cancer tumor removal 3,878,488 3,885,947 * 0% * Base cell 2,398,350 2,391,373 * 0% * Squamous cell 1,200,906 1,204,846 * 0% * Melanoma 279,232 289,728 * -4% *Other reconstructive procedures 258,851 253,993 376,270 2% -31%
TOTAL RECONSTRUCTIVE PROCEDURES 5,834,353 5,821,007 * 0% *
Top 5 procedures appear in bold.
ASPS Public RelationsPhone: 847-228-9900Fax: 847-981-5482Email: [email protected] Website: www.plasticsurgery.org
All figures are projected.* Data unavailable in prior year.****Counts of procedures performed by ASPS member surgeons only.^In 2000 figure included all animal bites.^^In 2000 figure included facial laceration repair.^^^^In 2017 and 2016 figure includes facial laceration repair. ASPS procedural statistics represent procedures performed by ASPS Member Surgeons certified by The American Board of Plastic Surgery® as well as other physicians certified by American Board of Medical Specialties-recognized boards. ©ASPS, 2018
Margin of error = +/- 4.05%
10
Tumor Removal 4.5 million
Laceration Repair253,760
Maxillofacial Surgery204,778
2017 TOP FIVE RECONSTRUCTIVE PROCEDURES
Scar Revision182,321
Hand Surgery138,095
No change
1% from 2016
2% from 2016
No change
1% from 2016
Please credit the AMERICAN SOCIETY OF PLASTIC SURGEONS when citing statistical data or using graphics.
11
2017 Plastic Surgery Statistics Report
ASPS Public RelationsPhone: 773-332-4719Fax: 847-981-5482Email: [email protected] Website: www.plasticsurgery.org
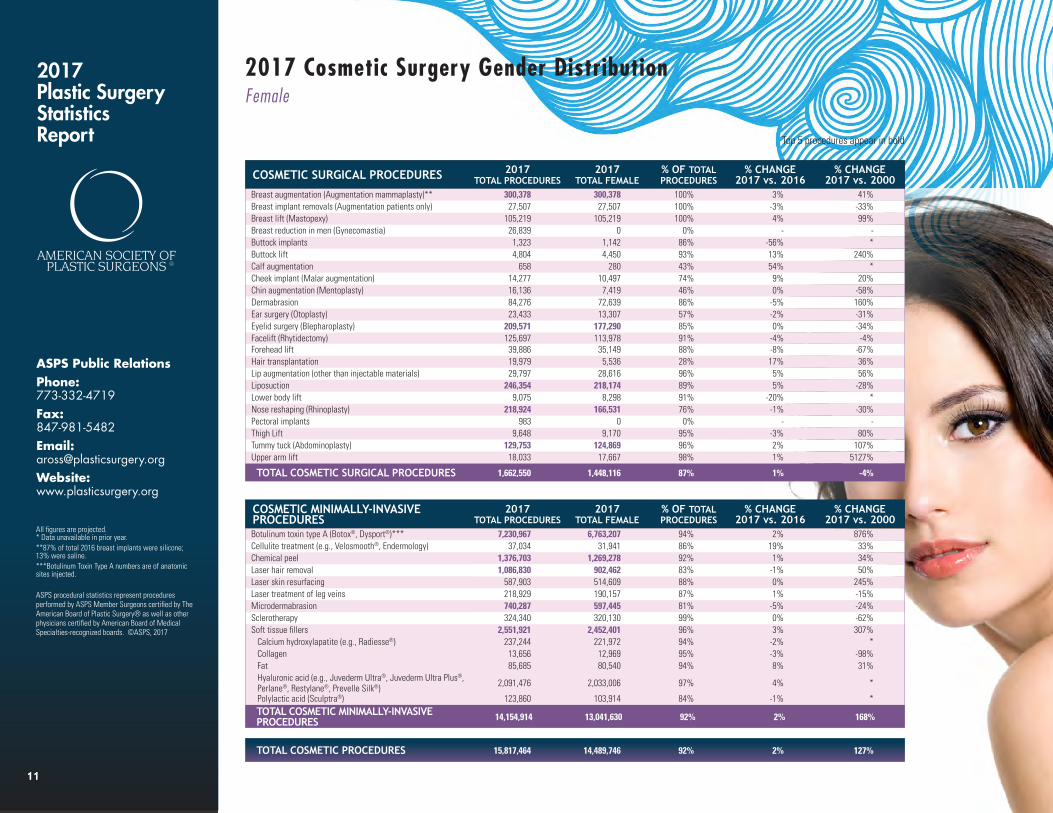
All figures are projected.* Data unavailable in prior year.**87% of total 2016 breast implants were silicone; 13% were saline.***Botulinum Toxin Type A numbers are of anatomic sites injected. ASPS procedural statistics represent procedures performed by ASPS Member Surgeons certified by The American Board of Plastic Surgery® as well as other physicians certified by American Board of Medical Specialties-recognized boards. ©ASPS, 2017
COSMETIC SURGICAL PROCEDURES 2017TOTAL PROCEDURES
2017TOTAL FEMALE
% OF TOTAL PROCEDURES
% CHANGE2017 vs. 2016
% CHANGE2017 vs. 2000
Breast augmentation (Augmentation mammaplasty)** 300,378 300,378 100% 3% 41%Breast implant removals (Augmentation patients only) 27,507 27,507 100% -3% -33%Breast lift (Mastopexy) 105,219 105,219 100% 4% 99%Breast reduction in men (Gynecomastia) 26,839 0 0% - -Buttock implants 1,323 1,142 86% -56% *Buttock lift 4,804 4,450 93% 13% 240%Calf augmentation 658 280 43% 54% *Cheek implant (Malar augmentation) 14,277 10,497 74% 9% 20%Chin augmentation (Mentoplasty) 16,136 7,419 46% 0% -58%Dermabrasion 84,276 72,639 86% -5% 160%Ear surgery (Otoplasty) 23,433 13,307 57% -2% -31%Eyelid surgery (Blepharoplasty) 209,571 177,290 85% 0% -34%Facelift (Rhytidectomy) 125,697 113,978 91% -4% -4%Forehead lift 39,886 35,149 88% -8% -67%Hair transplantation 19,979 5,536 28% 17% 36%Lip augmentation (other than injectable materials) 29,797 28,616 96% 5% 56%Liposuction 246,354 218,174 89% 5% -28%Lower body lift 9,075 8,298 91% -20% *Nose reshaping (Rhinoplasty) 218,924 166,531 76% -1% -30%Pectoral implants 983 0 0% - -Thigh Lift 9,648 9,170 95% -3% 80%Tummy tuck (Abdominoplasty) 129,753 124,869 96% 2% 107%Upper arm lift 18,033 17,667 98% 1% 5127%
TOTAL COSMETIC SURGICAL PROCEDURES 1,662,550 1,448,116 87% 1% -4%
COSMETIC MINIMALLY-INVASIVE PROCEDURES
2017TOTAL PROCEDURES
2017TOTAL FEMALE
% OF TOTAL PROCEDURES
% CHANGE2017 vs. 2016
% CHANGE2017 vs. 2000
Botulinum toxin type A (Botox®, Dysport®)*** 7,230,967 6,763,207 94% 2% 876%Cellulite treatment (e.g., Velosmooth®, Endermology) 37,034 31,941 86% 19% 33%Chemical peel 1,376,703 1,269,278 92% 1% 34%Laser hair removal 1,086,830 902,462 83% -1% 50%Laser skin resurfacing 587,903 514,609 88% 0% 245%Laser treatment of leg veins 218,929 190,157 87% 1% -15%Microdermabrasion 740,287 597,445 81% -5% -24%Sclerotherapy 324,340 320,130 99% 0% -62%Soft tissue fillers 2,551,921 2,452,401 96% 3% 307% Calcium hydroxylapatite (e.g., Radiesse®) 237,244 221,972 94% -2% * Collagen 13,656 12,969 95% -3% -98% Fat 85,685 80,540 94% 8% 31% Hyaluronic acid (e.g., Juvederm Ultra®, Juvederm Ultra Plus®, Perlane®, Restylane®, Prevelle Silk®) 2,091,476 2,033,006 97% 4% *
Polylactic acid (Sculptra®) 123,860 103,914 84% -1% *TOTAL COSMETIC MINIMALLY-INVASIVE PROCEDURES 14,154,914 13,041,630 92% 2% 168%
TOTAL COSMETIC PROCEDURES 15,817,464 14,489,746 92% 2% 127%
2017 Cosmetic Surgery Gender DistributionFemale
Top 5 procedures appear in bold
11

Please credit the AMERICAN SOCIETY OF PLASTIC SURGEONS when citing statistical data or using graphics.
12
2017 Plastic Surgery Statistics Report
12
ASPS procedural statistics represent procedures performed by ASPS Member Surgeons certified by The American Board of Plastic Surgery® as well as other physicians certified by American Board of Medical Specialties-recognized boards. ©ASPS, 2018
ASPS Public RelationsPhone: 773-332-4719Fax: 847-981-5482Email: [email protected] Website: www.plasticsurgery.org
2017 Cosmetic Surgery Gender Distribution ChartsFemale
2017 TOP FIVE FEMALE COSMETIC SURGICAL PROCEDURES
Tummy Tuck124,000
Nose Reshaping166,000
Liposuction218,000
Eyelid Surgery 177,000
Breast Augmentation300,000 3 % from 2016
5 % from 2016
no change
-1% from 2016
Botulinum Toxin Type A 5.4 million
Soft Tissue Fillers1.8 million
Chemical Peel1.1 million
Laser Hair Removal938,000
Microdermabrasion825,000
2017 TOP FIVE FEMALE COSMETIC MINIMALLY-INVASIVE PROCEDURES
Botulinum Toxin Type A 6.7 million
Soft Tissue Fillers2.4 million
Chemical Peel1.2 million
Laser Hair Removal902,000
Microdermabrasion597,000
2% from 2016
3% from 2016
1% from 2016
-1% from 2016
-5% from 2016
2% from 2016

Please credit the AMERICAN SOCIETY OF PLASTIC SURGEONS when citing statistical data or using graphics.
13
2017 Plastic Surgery Statistics Report
13
2017 Cosmetic Surgery Gender DistributionMale
Top 5 procedures appear in bold
All figures are projected.* Data unavailable in prior year.***Botulinum Toxin Type A numbers are of anatomic sites injected. ASPS procedural statistics represent procedures performed by ASPS Member Surgeons certified by The American Board of Plastic Surgery® as well as other physicians certified by American Board of Medical Specialties-recognized boards. ©ASPS, 2018
ASPS Public RelationsPhone: 773-332-4719Fax: 847-981-5482Email: [email protected] Website: www.plasticsurgery.org
COSMETIC SURGICAL PROCEDURES 2017TOTAL PROCEDURES
2017TOTAL MALE
% OF TOTAL PROCEDURES
% CHANGE2017 vs. 2016
% CHANGE2017 vs. 2000
Breast augmentation (augmentation mammaplasty) 300,378 0 0% - -Breast implant removals (augmentation patients only) 27,507 0 0% - -Breast lift (mastopexy) 105,219 0 0% - -Breast reduction in men (gynecomastia) 26,839 26,839 100% -3% 32%Buttock implants 1,323 181 14% -55% *Buttock lift 4,804 354 7% 11% 638%Calf augmentation 658 378 57% 59% *Cheek implant (malar augmentation) 14,277 3,780 26% 5% 126%Chin augmentation (mentoplasty) 16,136 8,717 54% -6% -4%Dermabrasion 84,276 11,637 14% -3% -19%Ear surgery (otoplasty) 23,433 10,126 43% 0% -41%Eyelid surgery (blepharoplasty) 209,571 32,281 15% 4% -44%Facelift (rhytidectomy) 125,697 11,719 9% -3% -23%Forehead lift 39,886 4,737 12% -5% -63%Hair transplantation 19,979 14,443 72% 20% -64%Lip augmentation (other than injectable materials) 29,797 1,181 4% 2% 409%Liposuction 246,354 28,180 11% 5% -46%Lower body lift 9,075 777 9% -19% *Nose reshaping (rhinoplasty) 218,924 52,393 24% -5% -65%Pectoral implants 983 983 100% - -Thigh lift 9,648 478 5% 0% 117%Tummy tuck (abdominoplasty) 129,753 4,884 4% 0% 113%Upper arm lift 18,033 366 2% -1% *
TOTAL COSMETIC SURGICAL PROCEDURES 1,662,550 214,434 13% 0% -46%
COSMETIC MINIMALLY-INVASIVE PROCEDURES
2017TOTAL PROCEDURES
2017TOTAL MALE
% OF TOTAL PROCEDURES
% CHANGE2017 vs. 2016
% CHANGE2017 vs. 2000
Botulinum toxin type A (Botox®, Dysport®)*** 7,230,967 467,760 6% 5% 397%Cellulite treatment (e.g., Velosmooth®, Endermology) 37,034 5,093 14% 22% *Chemical peel 1,376,703 107,425 8% 3% -47%Laser hair removal 1,086,830 184,368 17% -5% 38%Laser skin resurfacing 587,903 73,294 12% -1% 240%Laser treatment of leg veins 218,929 28,772 13% -1% 37%Microdermabrasion 740,287 142,842 19% -1% 66%Sclerotherapy 324,340 4,210 1% -3% -84%Soft tissue fillers 2,551,921 99,520 4% 0% 99% Calcium hydroxylapatite (e.g., Radiesse®) 237,244 15,272 6% -3% * Collagen 13,656 687 5% -4% -99% Fat 85,685 5,145 6% 6% 31% Hyaluronic acid (e.g., Juvederm Ultra®, Juvederm Ultra Plus®, Perlane®, Restylane®, Prevelle Silk®) 2,091,476 58,470 3% 1% *
Polylactic acid (Sculptra®) 123,860 19,946 16% -3% *
TOTAL COSMETIC MINIMALLY-INVASIVE PROCEDURES 14,154,914 1,113,284 8% 1% 76%
TOTAL COSMETIC PROCEDURES 15,817,464 1,327,718 8% 1% 29%

Please credit the AMERICAN SOCIETY OF PLASTIC SURGEONS when citing statistical data or using graphics.
14
2017 Plastic Surgery Statistics Report
14
ASPS procedural statistics represent procedures performed by ASPS Member Surgeons certified by The American Board of Plastic Surgery® as well as other physicians certified by American Board of Medical Specialties-recognized boards. ©ASPS, 2018
2017 Cosmetic Surgery Gender Distribution ChartsMale
2017 TOP FIVE MALE COSMETIC SURGICAL PROCEDURES
Botulinum Toxin Type A 467,000
Laser Hair Removal184,000
Microdermabrasion142,000
Chemical Peel107,000
Soft Tissue Fillers 99,000
2017 TOP FIVE MALE COSMETIC MINIMALLY-INVASIVE PROCEDURES
Hair Transplantation 14,000
Breast Reduction in Men 26,000
Eyelid Surgery 32,000
Nose Reshaping 52,000
Liposuction 28,000
-5% from 2016
4% from 2016
-3% from 2016
5% from 2016
20% from 2016
5 % from 2016
-1% from 2016
-5% from 2016
3 % from 2016
no change
ASPS Public RelationsPhone: 773-332-4719Fax: 847-981-5482Email: [email protected] Website: www.plasticsurgery.org
Please credit the AMERICAN SOCIETY OF PLASTIC SURGEONS when citing statistical data or using graphics.
15
2017 Plastic Surgery Statistics Report
15
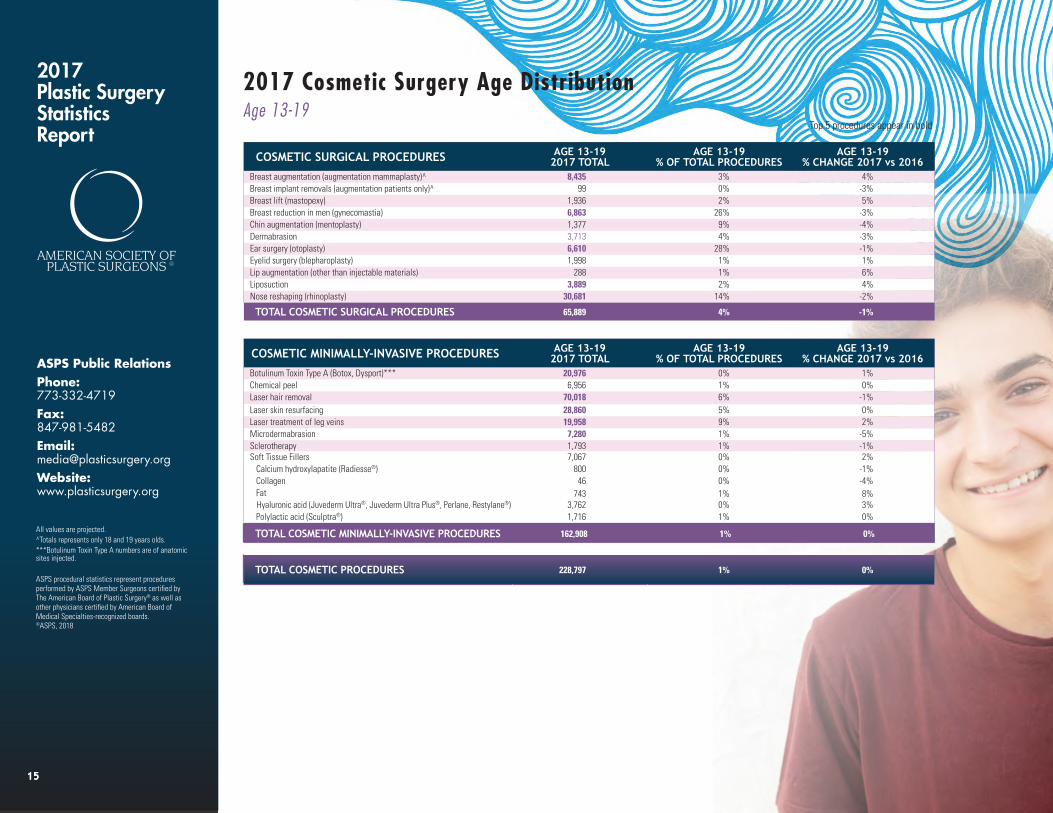
2017 Cosmetic Surgery Age DistributionAge 13-19
Top 5 procedures appear in bold
ASPS Public RelationsPhone: 773-332-4719Fax: 847-981-5482Email: [email protected] Website: www.plasticsurgery.org
COSMETIC SURGICAL PROCEDURES AGE 13-192017 TOTAL
AGE 13-19% OF TOTAL PROCEDURES
AGE 13-19% CHANGE 2017 vs 2016
Breast augmentation (augmentation mammaplasty)^ 8,435 3% 4%Breast implant removals (augmentation patients only)^ 99 0% -3%Breast lift (mastopexy) 1,936 2% 5%Breast reduction in men (gynecomastia) 6,863 26% -3%Chin augmentation (mentoplasty) 1,377 9% -4%Dermabrasion 3,713 4% -3%Ear surgery (otoplasty) 6,610 28% -1%Eyelid surgery (blepharoplasty) 1,998 1% 1%Lip augmentation (other than injectable materials) 288 1% 6%Liposuction 3,889 2% 4%Nose reshaping (rhinoplasty) 30,681 14% -2%
TOTAL COSMETIC SURGICAL PROCEDURES 65,889 4% -1%
COSMETIC MINIMALLY-INVASIVE PROCEDURES AGE 13-192017 TOTAL
AGE 13-19% OF TOTAL PROCEDURES
AGE 13-19% CHANGE 2017 vs 2016
Botulinum Toxin Type A (Botox, Dysport)*** 20,976 0% 1%Chemical peel 6,956 1% 0%Laser hair removal 70,018 6% -1%Laser skin resurfacing 28,860 5% 0%Laser treatment of leg veins 19,958 9% 2%Microdermabrasion 7,280 1% -5%Sclerotherapy 1,793 1% -1%Soft Tissue Fillers 7,067 0% 2% Calcium hydroxylapatite (Radiesse®) 800 0% -1% Collagen 46 0% -4% Fat 743 1% 8%
Hyaluronic acid (Juvederm Ultra®, Juvederm Ultra Plus®, Perlane, Restylane®) 3,762 0% 3% Polylactic acid (Sculptra®) 1,716 1% 0%
TOTAL COSMETIC MINIMALLY-INVASIVE PROCEDURES 162,908 1% 0%
TOTAL COSMETIC PROCEDURES 228,797 1% 0%
All values are projected.^Totals represents only 18 and 19 years olds.***Botulinum Toxin Type A numbers are of anatomic sites injected. ASPS procedural statistics represent procedures performed by ASPS Member Surgeons certified by The American Board of Plastic Surgery® as well as other physicians certified by American Board of Medical Specialties-recognized boards. ©ASPS, 2018
Please credit the AMERICAN SOCIETY OF PLASTIC SURGEONS when citing statistical data or using graphics.
16
2017 Plastic Surgery Statistics Report
16
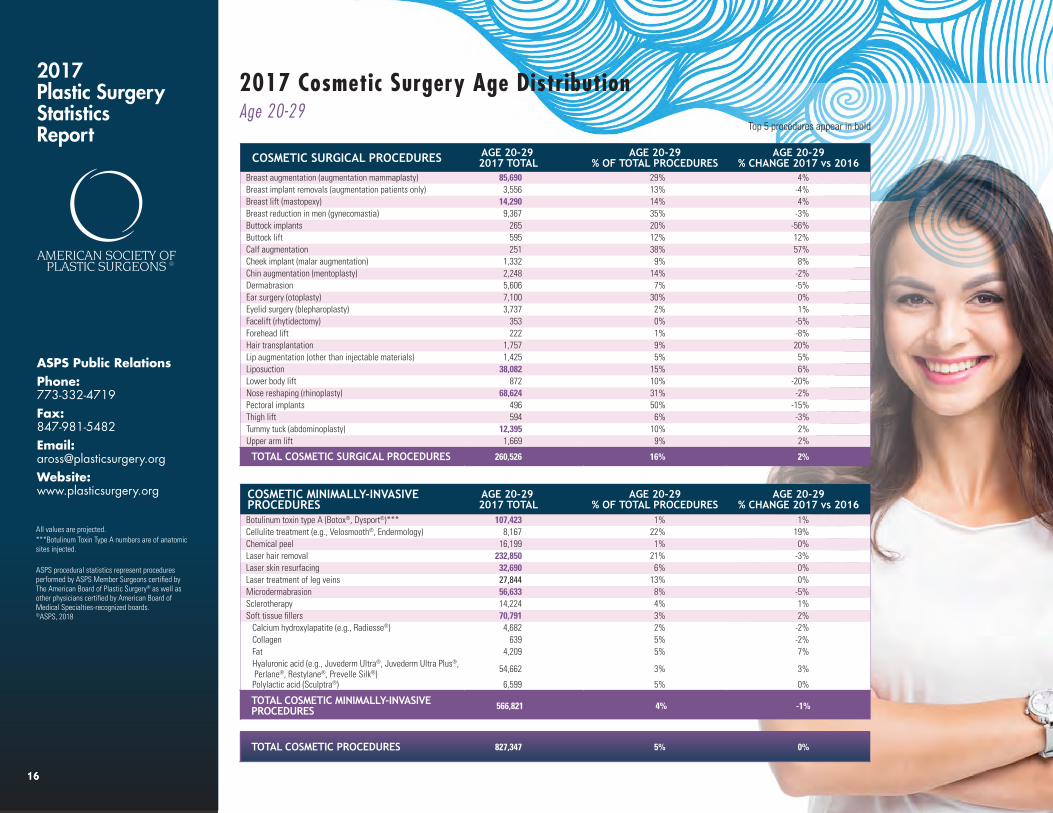
2017 Cosmetic Surgery Age DistributionAge 20-29
Top 5 procedures appear in bold
ASPS Public RelationsPhone: 773-332-4719Fax: 847-981-5482Email: [email protected] Website: www.plasticsurgery.org
All values are projected.***Botulinum Toxin Type A numbers are of anatomic sites injected. ASPS procedural statistics represent procedures performed by ASPS Member Surgeons certified by The American Board of Plastic Surgery® as well as other physicians certified by American Board of Medical Specialties-recognized boards. ©ASPS, 2018
COSMETIC SURGICAL PROCEDURES AGE 20-29 2017 TOTAL
AGE 20-29% OF TOTAL PROCEDURES
AGE 20-29% CHANGE 2017 vs 2016
Breast augmentation (augmentation mammaplasty) 85,690 29% 4%Breast implant removals (augmentation patients only) 3,556 13% -4%Breast lift (mastopexy) 14,290 14% 4%Breast reduction in men (gynecomastia) 9,367 35% -3%Buttock implants 265 20% -56%Buttock lift 595 12% 12%Calf augmentation 251 38% 57%Cheek implant (malar augmentation) 1,332 9% 8%Chin augmentation (mentoplasty) 2,248 14% -2%Dermabrasion 5,606 7% -5%Ear surgery (otoplasty) 7,100 30% 0%Eyelid surgery (blepharoplasty) 3,737 2% 1%Facelift (rhytidectomy) 353 0% -5%Forehead lift 222 1% -8%Hair transplantation 1,757 9% 20%Lip augmentation (other than injectable materials) 1,425 5% 5%Liposuction 38,082 15% 6%Lower body lift 872 10% -20%Nose reshaping (rhinoplasty) 68,624 31% -2%Pectoral implants 496 50% -15%Thigh lift 594 6% -3%Tummy tuck (abdominoplasty) 12,395 10% 2%Upper arm lift 1,669 9% 2%
TOTAL COSMETIC SURGICAL PROCEDURES 260,526 16% 2%
COSMETIC MINIMALLY-INVASIVE PROCEDURES
AGE 20-29 2017 TOTAL
AGE 20-29% OF TOTAL PROCEDURES
AGE 20-29% CHANGE 2017 vs 2016
Botulinum toxin type A (Botox®, Dysport®)*** 107,423 1% 1%Cellulite treatment (e.g., Velosmooth®, Endermology) 8,167 22% 19%Chemical peel 16,199 1% 0%Laser hair removal 232,850 21% -3%Laser skin resurfacing 32,690 6% 0%Laser treatment of leg veins 27,844 13% 0%Microdermabrasion 56,633 8% -5%Sclerotherapy 14,224 4% 1%Soft tissue fillers 70,791 3% 2% Calcium hydroxylapatite (e.g., Radiesse®) 4,682 2% -2% Collagen 639 5% -2% Fat 4,209 5% 7% Hyaluronic acid (e.g., Juvederm Ultra®, Juvederm Ultra Plus®, Perlane®, Restylane®, Prevelle Silk®) 54,662 3% 3%
Polylactic acid (Sculptra®) 6,599 5% 0%
TOTAL COSMETIC MINIMALLY-INVASIVE PROCEDURES 566,821 4% -1%
TOTAL COSMETIC PROCEDURES 827,347 5% 0%

17
2017 Plastic Surgery Statistics Report
17
2017 Cosmetic Surgery Age DistributionAge 30-39
Top 5 procedures appear in bold
ASPS Public RelationsPhone: 773-332-4719Fax: 847-981-5482Email: [email protected] Website: www.plasticsurgery.org
All values are projected.***Botulinum toxin type A numbers are of anatomic sites injected.
ASPS procedural statistics represent procedures performed by ASPS Member Surgeons certified by The American Board of Plastic Surgery® as well as other physicians certified by American Board of Medical Specialties-recognized boards. ©ASPS, 2018
COSMETIC SURGICAL PROCEDURES AGE 30-392017 TOTAL
AGE 30-39% OF TOTAL PROCEDURES
AGE 30-39% CHANGE 2017 vs 2016
Breast augmentation (augmentation mammaplasty) 111,210 37% 2%Breast implant removals (augmentation patients only) 7,951 29% -3%Breast lift (mastopexy) 31,578 30% 3%Breast reduction in men (gynecomastia) 4,753 18% -3%Buttock implants 441 33% -56%Buttock lift 1,351 28% 14%Calf augmentation 265 40% 58%Cheek implant (malar augmentation) 3,003 21% 9%Chin augmentation (mentoplasty) 2,135 13% -3%Dermabrasion 8,549 10% -3%Ear surgery (otoplasty) 4,085 17% -2%Eyelid surgery (blepharoplasty) 13,118 6% 0%Facelift (rhytidectomy) 1,954 2% -3%Forehead lift 1,634 4% -8%Hair transplantation 1,625 8% 19%Lip augmentation (other than injectable materials) 3,865 13% 5%Liposuction 83,040 34% 5%Lower body lift 2,491 27% -19%Nose reshaping (rhinoplasty) 52,208 24% -1%Pectoral implants 179 18% -14%Thigh lift 2,765 29% -3%Tummy tuck (abdominoplasty) 46,295 36% 3%Upper arm lift 2,608 14% 1%
TOTAL COSMETIC SURGICAL PROCEDURES 387,103 23% 2%
COSMETIC MINIMALLY-INVASIVE PROCEDURES
AGE 30-392017 TOTAL
AGE 30-39% OF TOTAL PROCEDURES
AGE 30-39% CHANGE 2017 vs 2016
Botulinum toxin type A (Botox®, Dysport®)*** 1,306,718 18% 2%Cellulite treatment (e.g., Velosmooth®, Endermology) 19,799 53% 19%Chemical peel 181,156 13% 2%Laser hair removal 317,604 29% -2%Laser skin resurfacing 49,629 8% 0%Laser treatment of leg veins 66,522 30% 2%Microdermabrasion 169,432 23% -4%Sclerotherapy 66,565 21% 1%Soft tissue fillers 290,791 11% 4% Calcium hydroxylapatite (e.g., Radiesse®) 19,880 8% -1% Collagen 2,141 16% -2% Fat 11,077 13% 7% Hyaluronic acid (e.g., Juvederm Ultra®, Juvederm Ultra Plus®, Perlane®, Restylane®, Prevelle Silk®) 243,774 12% 5%
Polylactic acid (Sculptra®) 13,919 11% 0%
TOTAL COSMETIC MINIMALLY-INVASIVE PROCEDURES 2,468,216 17% 2%
TOTAL COSMETIC PROCEDURES 2,855,319 18% 2%
Please credit the AMERICAN SOCIETY OF PLASTIC SURGEONS when citing statistical data or using graphics.

18
2017 Plastic Surgery Statistics Report
18
2017 Cosmetic Surgery Age DistributionAge 40-54
Top 5 procedures appear in bold
ASPS Public RelationsPhone: 773-332-4719Fax: 847-981-5482Email: [email protected] Website: www.plasticsurgery.org
All values are projected.***Botulinum toxin type A numbers are of anatomic sites injected.
ASPS procedural statistics represent procedures performed by ASPS Member Surgeons certified by The American Board of Plastic Surgery® as well as other physicians certified by American Board of Medical Specialties-recognized boards. ©ASPS, 2018
COSMETIC SURGICAL PROCEDURES AGE 40-54 2017 TOTAL
AGE 40-54% OF TOTAL PROCEDURES
AGE 40-54% CHANGE 2017 vs 2016
Breast augmentation (augmentation mammaplasty) 87,623 29% 3%Breast implant removals (augmentation patients only) 11,543 42% -3%Breast lift (mastopexy) 40,724 39% 4%Breast reduction in men (gynecomastia) 3,567 13% -3%Buttock implants 521 39% -56%Buttock lift 2,001 42% 12%Calf augmentation 100 15% 56%Cheek implant (malar augmentation) 6,237 44% 8%Chin augmentation (mentoplasty) 3,983 25% -4%Dermabrasion 32,568 39% -3%Ear surgery (otoplasty) 3,423 15% -2%Eyelid surgery (blepharoplasty) 88,364 42% -1%Facelift (rhytidectomy) 41,847 33% -3%Forehead lift 15,869 40% -8%Hair transplantation 4,176 21% 19%Lip augmentation (other than injectable materials) 10,814 36% 6%Liposuction 96,091 39% 4%Lower body lift 3,925 43% -20%Nose reshaping (rhinoplasty) 45,765 21% -2%Pectoral implants 192 20% -14%Thigh lift 4,598 48% -3%Tummy tuck (abdominoplasty) 52,934 41% 0%Upper arm lift 7,714 43% 2%
TOTAL COSMETIC SURGICAL PROCEDURES 564,579 34% 1%
COSMETIC MINIMALLY-INVASIVE PROCEDURES
AGE 40-54 2017 TOTAL
AGE 40-54% OF TOTAL PROCEDURES
AGE 40-54% CHANGE 2017 vs 2016
Botulinum toxin type A (Botox®, Dysport®)*** 4,136,368 57% 2%Cellulite treatment (e.g., Velosmooth®, Endermology) 9,052 24% 21%Chemical peel 579,782 42% 2%Laser hair removal 395,291 36% -2%Laser skin resurfacing 241,934 41% 0%Laser treatment of leg veins 68,128 31% 1%Microdermabrasion 331,463 45% -4%Sclerotherapy 156,573 48% -1%Soft tissue fillers 1,254,138 49% 3% Calcium hydroxylapatite (e.g., Radiesse®) 93,222 39% -2% Collagen 4,795 35% -4% Fat 28,533 33% 7% Hyaluronic acid (e.g., Juvederm Ultra®, Juvederm Ultra Plus®, Perlane®, Restylane®, Prevelle Silk®)
1,056,538 51% 4%
Polylactic acid (Sculptra®) 71,050 57% -1%
TOTAL COSMETIC MINIMALLY-INVASIVE PROCEDURES 7,172,729 51% 2%
TOTAL COSMETIC PROCEDURES 7,737,308 49% 2%
Please credit the AMERICAN SOCIETY OF PLASTIC SURGEONS when citing statistical data or using graphics.

Please credit the AMERICAN SOCIETY OF PLASTIC SURGEONS when citing statistical data or using graphics.
19
2017 Plastic Surgery Statistics Report
19
2017 Cosmetic Surgery Age DistributionAge 55 and over
Top 5 procedures appear in bold
ASPS Public RelationsPhone: 773-332-4719Fax: 847-981-5482Email: [email protected] Website: www.plasticsurgery.org
All values are projected.***Botulinum toxin type A numbers are of anatomic sites injected.
ASPS procedural statistics represent procedures performed by ASPS Member Surgeons certified by The American Board of Plastic Surgery® as well as other physicians certified by American Board of Medical Specialties-recognized boards. ©ASPS, 2018
COSMETIC SURGICAL PROCEDURES AGE 55 AND OVER2017 TOTAL
AGE 55 AND OVER% OF TOTAL PROCEDURES
AGE 55 AND OVER% CHANGE 2017 vs 2016
Breast augmentation (augmentation mammaplasty) 7,420 2% 4%Breast implant removals (augmentation patients only) 4,358 16% -4%Breast lift (mastopexy) 16,691 16% 5%Breast reduction in men (gynecomastia) 2,289 9% -3%Buttock implants 96 7% -56%Buttock lift 857 18% 14%Calf augmentation 42 6% 56%Cheek implant (malar augmentation) 3,705 26% 8%Chin augmentation (mentoplasty) 6,393 40% -3%Dermabrasion 33,840 40% -6%Ear surgery (otoplasty) 2,215 9% -2%Eyelid surgery (blepharoplasty) 102,354 49% 1%Facelift (rhytidectomy) 81,543 65% -5%Forehead lift 22,161 56% -7%Hair transplantation 12,421 62% 19%Lip augmentation (other than injectable materials) 13,405 45% 4%Liposuction 25,252 10% 5%Lower body lift 1,787 20% -20%Nose reshaping (rhinoplasty) 21,646 10% -3%Pectoral implants 116 12% -16%Thigh lift 1,691 18% -3%Tummy tuck (abdominoplasty) 18,129 14% 3%Upper arm lift 6,042 34% 0%
TOTAL COSMETIC SURGICAL PROCEDURES 384,453 23% -1%
COSMETIC MINIMALLY-INVASIVE PROCEDURES
AGE 55 AND OVER 2017 TOTAL
AGE 55 AND OVER% OF TOTAL PROCEDURES
AGE 55 AND OVER% CHANGE 2017 vs 2016
Botulinum toxin type A (Botox®, Dysport®)*** 1,659,482 23% 4%Cellulite treatment (e.g., Velosmooth®, Endermology) 16 0% 23%Chemical peel 592,610 43% 0%Laser hair removal 71,067 7% -1%Laser skin resurfacing 234,790 40% 0%Laser treatment of leg veins 36,477 17% 0%Microdermabrasion 175,479 24% -5%Sclerotherapy 85,185 26% 1%Soft tissue fillers 929,134 36% 3% Calcium hydroxylapatite (e.g., Radiesse®) 118,660 50% -2% Collagen 6,035 44% -3% Fat 41,123 48% 9% Hyaluronic acid (e.g., Juvederm Ultra®, Juvederm Ultra Plus®, Perlane®, Restylane®, Prevelle Silk®)
732,740 35% 4%
Polylactic acid (Sculptra®) 30,576 25% -2%
TOTAL COSMETIC MINIMALLY-INVASIVE PROCEDURES 3,784,240 27% 2%
TOTAL COSMETIC PROCEDURES 4,168,693 26% 2%

2017 Plastic Surgery Statistics Report
ASPS Public Relations Phone: 773-332-4719 | Fax: 847-981-5482 | Email: [email protected] | Website: www.plasticsurgery.org
All values are projected.
ASPS procedural statistics represent procedures performed by ASPS Member Surgeons certified by The American Board of Plastic Surgery® as well as other physicians certified by American Board of Medical Specialties-recognized boards. ©ASPS, 2018
% OF TOTAL PROCEDURES
Top 5 procedures appear in bold
New England (CT, ME, MA, NH, RI, VT)
Middle Atlantic (NJ, NY, PA)
East North Central (IL, IN, MI, OH, WI)
West North Central (IA, KS, MN, MO, NE, ND, SD)
Mountain (AZ, CO, ID, MT, NV, NM, UT, WY)
Pacific (AK, CA, HI, OR, WA)
Region 3 Region 4 Region 5Region 2Region 1
South Atlantic (DE, DC, FL, GA, MD, NC, SC, VA, WV)
East South Central (AL, KY, MS, TN)
West South Central (AR, LA, OK, TX)
COSMETIC SURGICAL PROCEDURES TOTAL PROCEDURES Region 1 Region 2 Region 3 Region 4 Region 5Breast augmentation (augmentation mammaplasty) 300,378 44,748 15% 50,736 17% 47,508 16% 49,225 16% 108,161 36%Breast implant removals (augmentation patients only) 27,507 5,463 20% 4,645 17% 5,825 21% 5,786 21% 5,788 21%Breast lift (mastopexy) 105,219 13,344 13% 15,347 15% 21,726 21% 21,773 21% 33,029 31%Breast reduction (Aesthetic patiebts only) 43,635 7,114 16% 12,490 29% 6,502 15% 8,897 20% 8,632 20%Breast reduction in men (gynecomastia) 26,839 8,891 33% 4,588 17% 4,299 16% 3,151 12% 5,910 22%Buttock augmentation with fat grafting 20,301 4,596 23% 5,767 28% 4,145 20% 3,420 17% 2,373 12%Buttock implants 1,323 203 15% 183 14% 374 28% 304 23% 259 20%
Buttock lift 4,804 1,148 24% 1,561 32% 867 18% 688 14% 540 11%Calf augmentation 658 194 29% 66 10% 184 28% 79 12% 135 21%Cheek implant (malar augmentation) 14,277 2,622 18% 1,306 9% 2,825 20% 6,208 43% 1,316 9%Chin augmentation (mentoplasty) 16,136 3,762 23% 2,340 15% 2,417 15% 1,761 11% 5,856 36%Dermabrasion 84,276 10,335 12% 25,659 30% 18,335 22% 9,721 12% 20,226 24%Ear surgery (otoplasty) 23,433 4,548 19% 4,546 19% 3,547 15% 3,765 16% 7,027 30%Eyelid surgery (blepharoplasty) 209,571 37,788 18% 28,584 14% 46,341 22% 25,721 12% 71,137 34%Facelift (rhytidectomy) 125,697 24,753 20% 14,860 12% 28,422 23% 18,105 14% 39,557 31% Full Facelift 96,438 18,902 20% 11,427 12% 21,755 23% 13,955 14% 30,399 32% Mini Facelift 29,259 5,851 20% 3,433 12% 6,667 23% 4,150 14% 9,158 31%Forehead lift 39,886 6,318 16% 5,541 14% 6,873 17% 7,580 19% 13,574 34%Hair transplantation 19,979 1,921 10% 1,981 10% 2,296 11% 9,264 46% 4,517 23%Labiaplasty ↑ 10,253 2,060 20% 1,640 16% 2,331 23% 1,324 13% 2,898 28%Lip augmentation (other than injectable materials) 29,797 7,976 27% 5,030 17% 4,966 17% 5,935 20% 5,890 20%Lip reduction 1,065 189 18% 383 36% 199 19% 153 14% 141 13%Liposuction 246,354 43,335 18% 32,345 13% 55,559 23% 37,807 15% 77,308 31%Lower body lift 9,075 2,721 30% 1,400 15% 968 11% 1,908 21% 2,078 23%Neck lift 53,028 10,208 19% 6,464 12% 11,111 21% 8,298 16% 16,947 32%Nose reshaping (rhinoplasty) 218,924 63,538 29% 30,188 14% 27,017 12% 39,171 18% 59,010 27%
Pectoral implants 983 155 16% 102 10% 275 28% 175 18% 276 28%Thigh lift 9,648 2,371 25% 1,522 16% 1,364 14% 1,869 19% 2,522 26%Tummy tuck (abdominoplasty) 129,753 25,668 20% 23,740 18% 22,197 17% 21,624 17% 36,524 28%Upper arm lift 18,033 5,251 29% 2,524 14% 3,791 21% 2,499 14% 3,968 22%
TOTAL COSMETIC SURGICAL PROCEDURES 1,790,832 341,220 19% 285,538 16% 332,264 19% 296,211 17% 535,599 30%
20
2017 Regional Distribution

ASPS Public Relations Phone: 773-332-4719 | Fax: 847-981-5482 | Email: [email protected] | Website: www.plasticsurgery.org
% OF TOTAL PROCEDURES
Top 5 procedures appear in bold
21
2017 Regional Distribution
2017 Plastic Surgery Statistics Report
New England (CT, ME, MA, NH, RI, VT)
Middle Atlantic (NJ, NY, PA)
East North Central (IL, IN, MI, OH, WI)
West North Central (IA, KS, MN, MO, NE, ND, SD)
Region 3 Region 4Region 2Region 1
South Atlantic (DE, DC, FL, GA, MD, NC, SC, VA, WV)
East South Central (AL, KY, MS, TN)
West South Central (AR, LA, OK, TX)
COSMETIC MINIMALLY-INVASIVE PROCEDURES TOTAL PROCEDURES Region 1 Region 2 Region 3 Region 4 Region 5Botulinum toxin type A (Botox®, Dysport®)*** 7,230,967 1,454,427 20% 953,302 13% 1,725,730 24% 1,016,448 14% 2,081,060 29%Cellulite treatment (e.g., Velosmooth®, Endermology) 37,034 8,326 22% 8,279 22% 7,395 20% 4,217 11% 8,817 24%Chemical peel 1,376,703 338,960 25% 204,270 15% 269,792 20% 122,808 9% 440,873 32%Injection lipolysis (e.g., Kybella®) 62,587 11,698 19% 12,223 20% 13,288 21% 8,279 13% 17,099 27%Intense pulsed light (IPL) 667,561 180,141 27% 102,917 15% 120,733 18% 59,890 9% 203,880 31%Laser hair removal 1,086,830 190,361 18% 142,007 13% 232,651 21% 170,113 16% 351,698 32%Laser skin resurfacing 587,903 115,831 20% 130,392 22% 94,287 16% 57,128 10% 190,265 32%
Laser treatment of leg veins 218,929 53,791 25% 22,903 10% 35,140 16% 23,966 11% 83,129 38%Microdermabrasion 740,287 187,461 25% 143,417 19% 153,631 21% 86,730 12% 169,048 23%Non-invasive fat reduction (e.g., Coolsculpting®, Liposonix®) 356,378 73,973 21% 47,492 13% 83,423 23% 50,320 14% 101,170 28%Non-surgical skin tightening (e.g., Pelleve®, Thermage®, Ulthera®) 333,334 66,410 20% 45,895 14% 78,283 23% 45,440 14% 97,306 29%Sclerotherapy 324,340 49,830 15% 37,628 12% 68,265 21% 121,137 37% 47,480 15%Soft tissue fillers 2,691,265 773,691 29% 352,432 13% 506,561 19% 284,576 11% 774,005 29% Acellular Dermal Matrix ↑ 8,349 1,487 18% 1,789 21% 1,800 22% 1,049 13% 2,224 27% Calcium hydroxylapatite (e.g., Radiesse®) 237,244 79,168 33% 35,281 15% 45,938 19% 35,490 15% 41,367 17% Collagen 13,656 6,905 51% 915 7% 2,263 17% 1,582 12% 1,991 15% Fat 85,685 14,596 17% 15,914 19% 20,277 24% 6,743 8% 28,155 33% Hyaluronic acid (e.g., Juvederm Ultra®, Juvederm Ultra Plus®, Perlane®, Restylane®, Prevelle Silk®) 2,091,476 629,838 30% 255,363 12% 385,296 18% 177,836 9% 643,143 31%
Platelet-Rich Plasma (PRP) 113,356 23,797 21% 14,656 13% 26,146 23% 16,597 15% 32,160 28% Polylactic acid (Sculptra®) 123,860 14,873 12% 27,553 22% 18,801 15% 44,109 36% 18,524 15% Polymethyl-methacrylate microspheres (e.g., Artefill) 17,639 3,027 17% 961 5% 6,040 34% 1,170 7% 6,441 37%
TOTAL COSMETIC MINIMALLY-INVASIVE PROCEDURES 15,714,118 3,504,900 22% 2,203,157 14% 3,389,179 22% 2,051,052 13% 4,565,830 29%
TOTAL COSMETIC PROCEDURES 17,504,950 3,846,120 22% 2,488,695 14% 3,721,443 21% 2,347,263 13% 5,101,429 29%
RECONSTRUCTIVE PROCEDURES TOTAL PROCEDURES Region 1 Region 2 Region 3 Region 4 Region 5Breast reconstruction 106,295 20,901 20% 17,952 17% 22,288 21% 22,583 21% 22,571 21%
All values are projected.***Botulinum toxin type A numbers are of anatomic sites injected.
ASPS procedural statistics represent procedures performed by ASPS Member Surgeons certified by The American Board of Plastic Surgery® as well as other physicians certified by American Board of Medical Specialties-recognized boards. ©ASPS, 2018
Mountain (AZ, CO, ID, MT, NV, NM, UT, WY)
Pacific (AK, CA, HI, OR, WA)
Region 5
Please credit the AMERICAN SOCIETY OF PLASTIC SURGEONS when citing statistical data or using graphics.
22
2017 Plastic Surgery Statistics Report
22
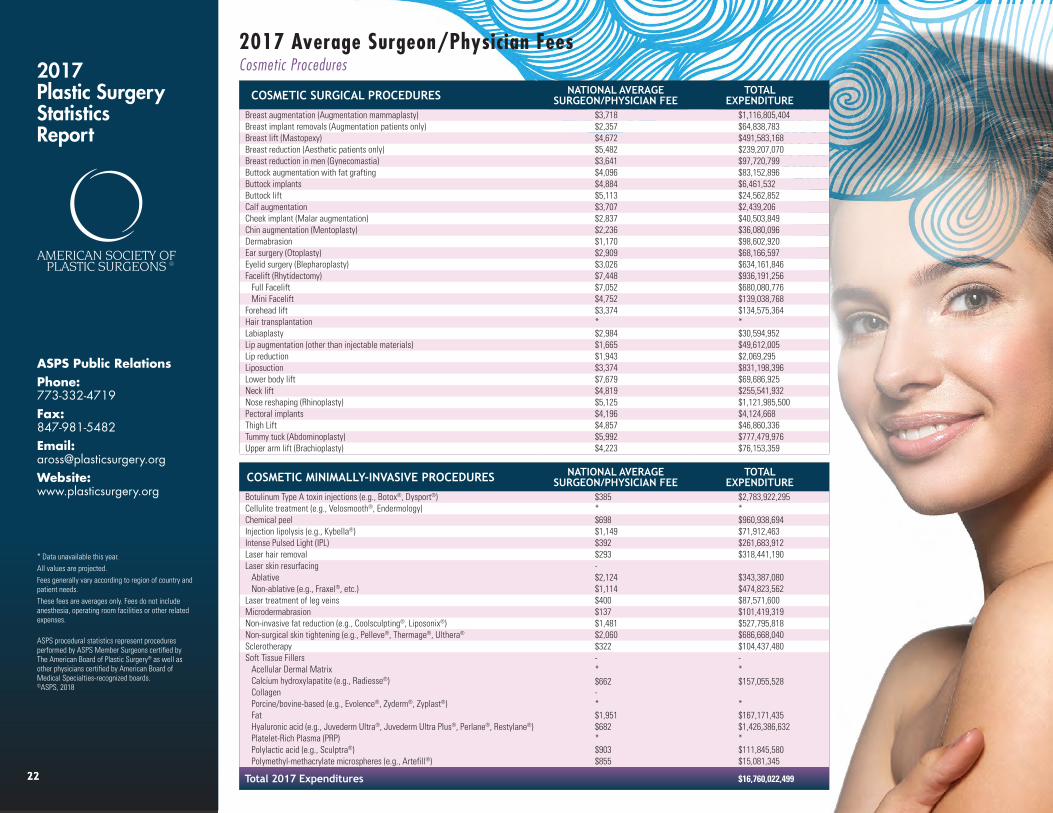
2017 Average Surgeon/Physician FeesCosmetic Procedures
ASPS Public RelationsPhone: 773-332-4719Fax: 847-981-5482Email: [email protected] Website: www.plasticsurgery.org
* Data unavailable this year.All values are projected.Fees generally vary according to region of country and patient needs.These fees are averages only. Fees do not include anesthesia, operating room facilities or other related expenses.
ASPS procedural statistics represent procedures performed by ASPS Member Surgeons certified by The American Board of Plastic Surgery® as well as other physicians certified by American Board of Medical Specialties-recognized boards. ©ASPS, 2018
COSMETIC SURGICAL PROCEDURES NATIONAL AVERAGESURGEON/PHYSICIAN FEE
TOTALEXPENDITURE
Breast augmentation (Augmentation mammaplasty) $3,718 $1,116,805,404Breast implant removals (Augmentation patients only) $2,357 $64,838,783Breast lift (Mastopexy) $4,672 $491,583,168Breast reduction (Aesthetic patients only) $5,482 $239,207,070Breast reduction in men (Gynecomastia) $3,641 $97,720,799Buttock augmentation with fat grafting $4,096 $83,152,896Buttock implants $4,884 $6,461,532Buttock lift $5,113 $24,562,852Calf augmentation $3,707 $2,439,206Cheek implant (Malar augmentation) $2,837 $40,503,849Chin augmentation (Mentoplasty) $2,236 $36,080,096Dermabrasion $1,170 $98,602,920Ear surgery (Otoplasty) $2,909 $68,166,597Eyelid surgery (Blepharoplasty) $3,026 $634,161,846Facelift (Rhytidectomy) $7,448 $936,191,256 Full Facelift $7,052 $680,080,776 Mini Facelift $4,752 $139,038,768Forehead lift $3,374 $134,575,364Hair transplantation * *Labiaplasty $2,984 $30,594,952Lip augmentation (other than injectable materials) $1,665 $49,612,005Lip reduction $1,943 $2,069,295Liposuction $3,374 $831,198,396Lower body lift $7,679 $69,686,925Neck lift $4,819 $255,541,932Nose reshaping (Rhinoplasty) $5,125 $1,121,985,500Pectoral implants $4,196 $4,124,668Thigh Lift $4,857 $46,860,336Tummy tuck (Abdominoplasty) $5,992 $777,479,976Upper arm lift (Brachioplasty) $4,223 $76,153,359
COSMETIC MINIMALLY-INVASIVE PROCEDURES NATIONAL AVERAGESURGEON/PHYSICIAN FEE
TOTALEXPENDITURE
Botulinum Type A toxin injections (e.g., Botox®, Dysport®) $385 $2,783,922,295Cellulite treatment (e.g., Velosmooth®, Endermology) * *Chemical peel $698 $960,938,694Injection lipolysis (e.g., Kybella®) ↑ $1,149 $71,912,463Intense Pulsed Light (IPL) $392 $261,683,912Laser hair removal $293 $318,441,190Laser skin resurfacing - Ablative $2,124 $343,387,080 Non-ablative (e.g., Fraxel®, etc.) $1,114 $474,823,562Laser treatment of leg veins $400 $87,571,600Microdermabrasion $137 $101,419,319Non-invasive fat reduction (e.g., Coolsculpting®, Liposonix®) ↑ $1,481 $527,795,818Non-surgical skin tightening (e.g., Pelleve®, Thermage®, Ulthera®↑ $2,060 $686,668,040Sclerotherapy $322 $104,437,480Soft Tissue Fillers - - Acellular Dermal Matrix ↑ * * Calcium hydroxylapatite (e.g., Radiesse®) $662 $157,055,528 Collagen - Porcine/bovine-based (e.g., Evolence®, Zyderm®, Zyplast®) * * Fat $1,951 $167,171,435 Hyaluronic acid (e.g., Juvederm Ultra®, Juvederm Ultra Plus®, Perlane®, Restylane®) $682 $1,426,386,632 Platelet-Rich Plasma (PRP) * * Polylactic acid (e.g., Sculptra®) $903 $111,845,580 Polymethyl-methacrylate microspheres (e.g., Artefill®) $855 $15,081,345
Total 2017 Expenditures $16,760,022,499

2017 Plastic Surgery Statistics Report
ASPS Public RelationsPhone: 773-332-4719Fax: 847-981-5482Email: [email protected] Website: www.plasticsurgery.org
Please credit the AMERICAN SOCIETY OF PLASTIC SURGEONS when citing statistical data or using graphics.
23
All values are projected. *Due to a methodologic change, projection is not comparable to prior years
ASPS procedural statistics represent procedures performed by ASPS Member Surgeons certified by The American Board of Plastic Surgery® as well as other physicians certified by American Board of Medical Specialties-recognized boards. ©ASPS, 2018
2017 Cosmetic Demographics
Cosmetic minimally-invasive procedures by group Caucasian African-
AmericanAsian/Pacific
Islander Hispanic Other
Botulinum toxin type A (Botox®, Dysport®) 80% 4% 5% 10% 1%
Soft tissue fillers 81% 5% 4% 8% 1%
Chemical peel 83% 3% 5% 7% 3%
Laser hair removal 78% 6% 5% 8% 3%
Microdermabrasion 77% 5% 5% 9% 5%
Cosmetic surgical procedures by group Caucasian African- American
Asian/Pacific Islander Hispanic Other
Breast Augmentation 76% 6% 5% 11% 2%
Rhinoplasty 75% 6% 4% 10% 5%
Blepharoplasty 83% 3% 6% 7% 2%
Liposuction 77% 8% 4% 10% 1%
Abdominoplasty 70% 11% 5% 12% 2%
Ethnicity breakdown of cosmetic procedures 2017 % 2017 2016 % 2016 % CHANGE2017 vs. 2016
Caucasian 12,335,710 70% 11,392,019 70% 8%
Hispanic 1,911,652 11% 1,654,228 10% 16%
African-American 1,593,506 9% 1,367,616 8% 17%
Asian-American 1,150,603 7% 1,154,084 7% 0%
Other 513,479 3% 822,828 5% -38%
Patient behavior 2017 % 2017 2016 % 2016 % CHANGE2017 vs. 2016
Cosmetic Patients who are repeat patients 45% 48%
Patients having multiple cosmetic procedures at the same time 41% 42%

Please credit the AMERICAN SOCIETY OF PLASTIC SURGEONS when citing statistical data or using graphics.
24
2017 Plastic Surgery Statistics Report
24
2017 Reconstructive Demographics
ASPS Public RelationsPhone: 847-228-9900Fax: 847-981-5482Email: [email protected] Website: www.plasticsurgery.org
Reconstructive procedures by group Caucasian African- American
Asian/Pacific Islander Hispanic Other
Breast reconstruction 71.1% 13.7% 3.2% 10.4% 1.6%
Burn care 69.7% 13.2% 4.2% 9.5% 3.5%
Cleft Lip & Palate Repair 46.5% 4.2% 10.5% 25.1% 13.6%
Tumor removal 76.2% 8.6% 4.1% 8.5% 2.6%
Treatment of dog bites 72.4% 10.5% 2.9% 12.5% 1.6%
RECONSTRUCTIVE BREAST PROCEDURES TOTAL PROCEDURES 13-19 20-29 30-39 40-54 55 AND OVER
Breast reconstruction* 106,295 511 2,561 12,160 54,679 36,384 Saline implants 4,400 - - - - - Silicone implants 82,579 - - - - - Implant alone 12,246 - - - - - Tissue expander and implant 74,733 - - - - - TRAM flap 4,194 - - - - - DIEP flap 9,495 - - - - - Latissimus Dorsi flap 4,589 - - - - - Other flap 1,038 - - - - - Timing-Immediate 78,511 - - - - - Timing-Dlayed 27,784 - - - - - Unilateral 35,965 - - - - - Bilateral 70,330 - - - - - Acellular dermal matrix 59,774 - - - - - Fat grafts 31,862 - - - - -Breast reduction (reconstructive patients only) 59,198 - - - - -Breast implant removals (Reconstructive patients only) 19,415 145 1,153 3,722 8,881 5,514
2017 Reconstructive Breast Procedures (with age distribution)
* 95% of total breast implants were silicone: 5% were saline.
‡Due to a methodologic change, projection is not comparable to prior years
All values are projected.
ASPS procedural statistics represent procedures performed by ASPS Member Surgeons certified by The American Board of Plastic Surgery® ©ASPS, 2018
2017 Plastic Surgery Statistics Report
ASPS Public RelationsPhone: 773-332-4719Fax: 847-981-5482Email: [email protected] Website: www.plasticsurgery.org
Please credit the AMERICAN SOCIETY OF PLASTIC SURGEONS when citing statistical data or using graphics.
25
2017 Gender Confirmation Surgery Statistics
All values are projected.
****Counts of procedures performed by ASPS member surgeon only.
ASPS procedural statistics represent procedures performed by ASPS Member Surgeons certified by The American Board of Plastic Surgery® ©ASPS, 2018
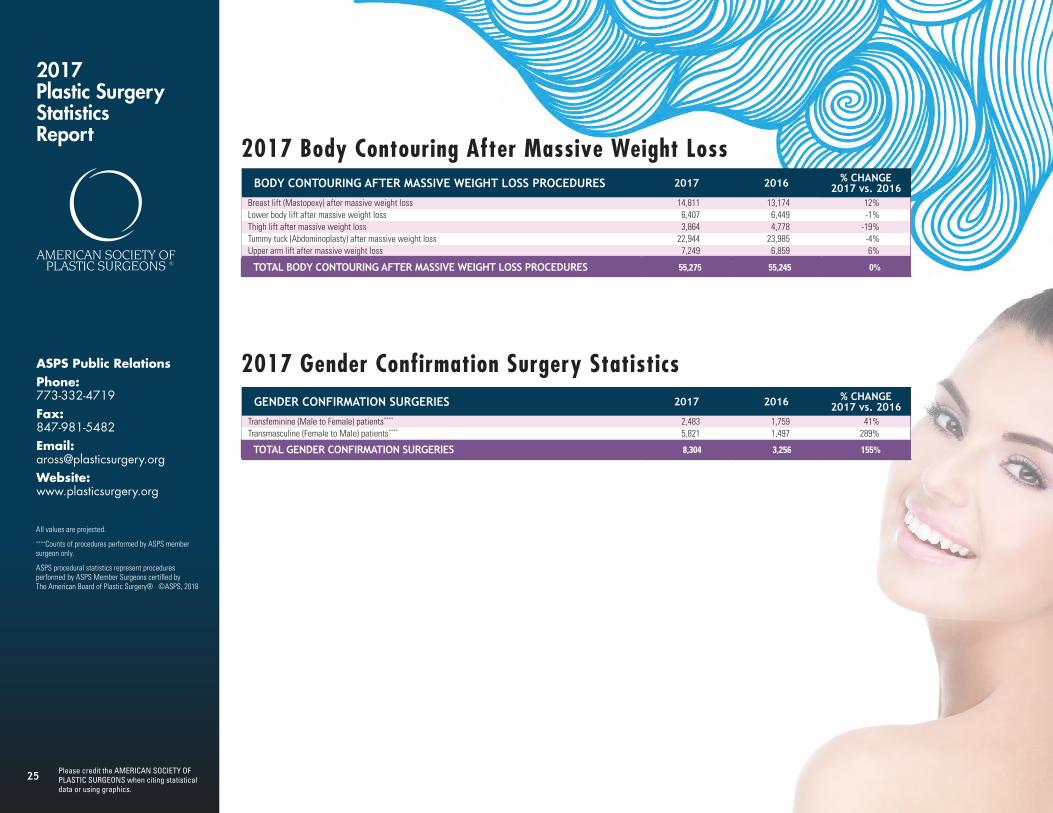
BODY CONTOURING AFTER MASSIVE WEIGHT LOSS PROCEDURES 2017 2016 % CHANGE2017 vs. 2016
Breast lift (Mastopexy) after massive weight loss 14,811 13,174 12%Lower body lift after massive weight loss 6,407 6,449 -1%Thigh lift after massive weight loss 3,864 4,778 -19%Tummy tuck (Abdominoplasty) after massive weight loss 22,944 23,985 -4%Upper arm lift after massive weight loss 7,249 6,859 6%
TOTAL BODY CONTOURING AFTER MASSIVE WEIGHT LOSS PROCEDURES 55,275 55,245 0%
GENDER CONFIRMATION SURGERIES 2017 2016 % CHANGE2017 vs. 2016
Transfeminine (Male to Female) patients**** 2,483 1,759 41%Transmasculine (Female to Male) patients****↑ 5,821 1,497 289%
TOTAL GENDER CONFIRMATION SURGERIES 8,304 3,256 155%
2017 Body Contouring After Massive Weight Loss