Embed Size (px)
Citation preview

2017 Edexcel Economics Paper 3 Synoptic Paper
Model Answers
The following outstanding candidate responses are published in the Edexcel exam board's Examiners' Report. Please note these responses are for reference study only, and Qurious Education Ltd. does not claim any copyright to the materials Pearson Education publishes. We only extracted them for educational purposes and to make their public resources more accessible. Please visit their website for the full version of the Examiners' Report.
This document is helpful for longer essay questions/responses. Please reference the Mark Scheme for answers to Multiple Choice questions.
Examiners’ ReportJune 2017
GCE Economics A 9EC0 03
4 GCE Economics A 9EC0 03
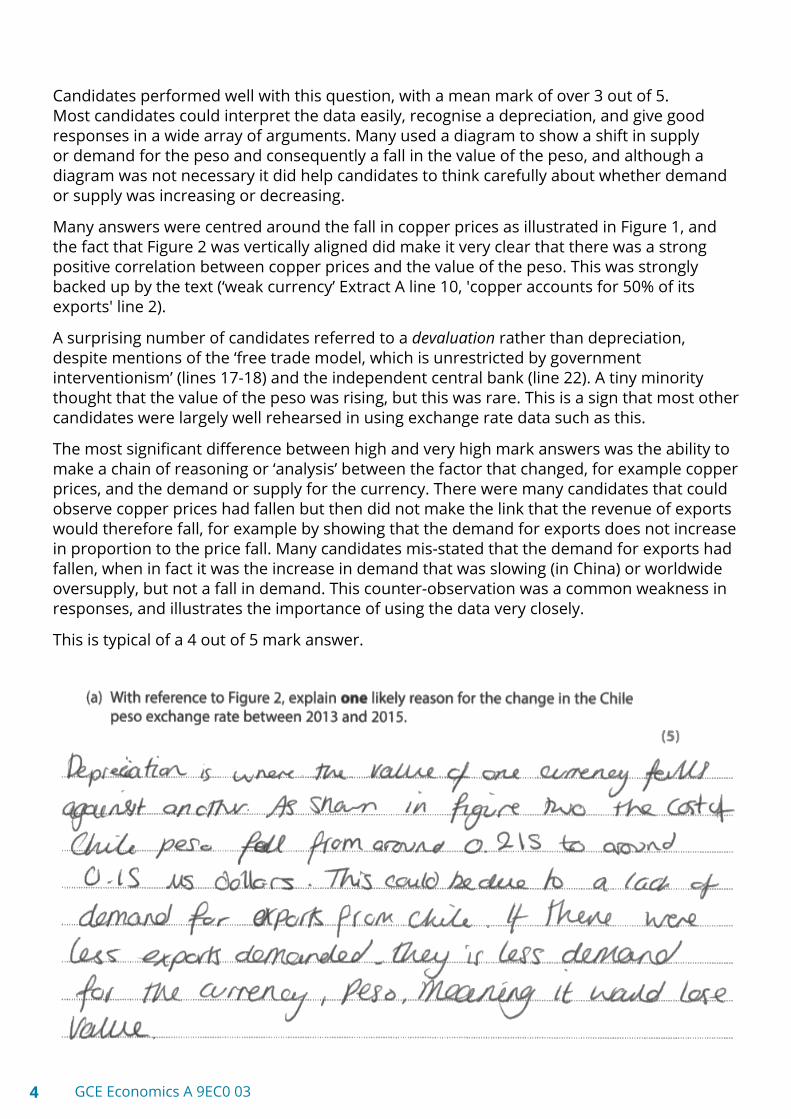
Candidates performed well with this question, with a mean mark of over 3 out of 5. Most candidates could interpret the data easily, recognise a depreciation, and give good responses in a wide array of arguments. Many used a diagram to show a shift in supply or demand for the peso and consequently a fall in the value of the peso, and although a diagram was not necessary it did help candidates to think carefully about whether demand or supply was increasing or decreasing.
Many answers were centred around the fall in copper prices as illustrated in Figure 1, and the fact that Figure 2 was vertically aligned did make it very clear that there was a strong positive correlation between copper prices and the value of the peso. This was strongly backed up by the text (‘weak currency’ Extract A line 10, 'copper accounts for 50% of its exports' line 2).
A surprising number of candidates referred to a devaluation rather than depreciation, despite mentions of the ‘free trade model, which is unrestricted by government interventionism’ (lines 17-18) and the independent central bank (line 22). A tiny minority thought that the value of the peso was rising, but this was rare. This is a sign that most other candidates were largely well rehearsed in using exchange rate data such as this.
The most significant difference between high and very high mark answers was the ability to make a chain of reasoning or ‘analysis’ between the factor that changed, for example copper prices, and the demand or supply for the currency. There were many candidates that could observe copper prices had fallen but then did not make the link that the revenue of exports would therefore fall, for example by showing that the demand for exports does not increase in proportion to the price fall. Many candidates mis-stated that the demand for exports had fallen, when in fact it was the increase in demand that was slowing (in China) or worldwide oversupply, but not a fall in demand. This counter-observation was a common weakness in responses, and illustrates the importance of using the data very closely.
This is typical of a 4 out of 5 mark answer.

5GCE Economics A 9EC0 03
Question 1 (a)

6 GCE Economics A 9EC0 03
K Reduced interest ratesK Less saving by foreignersAP ER droppedAP Data referenceAN Diagram
5/5
Examiner Comments
Using a diagram can save a good deal of writing, if relevant.
Examiner Tip
10 GCE Economics A 9EC0 03
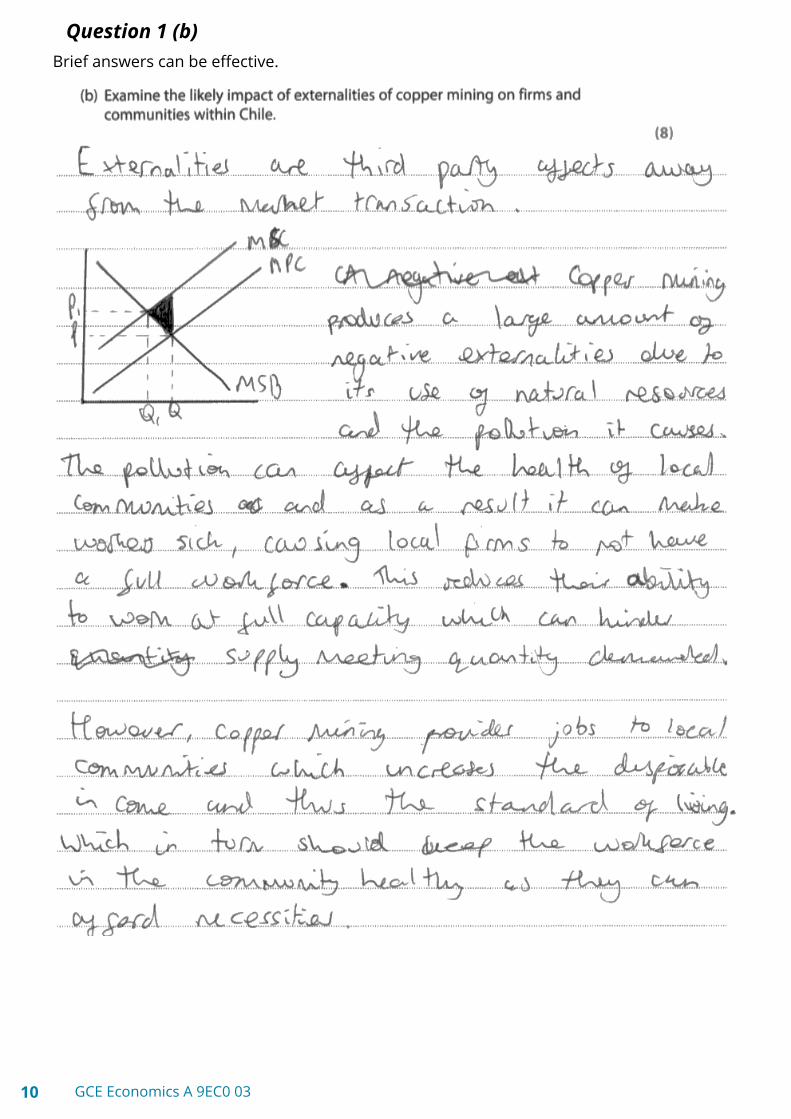
Brief answers can be effective.
Question 1 (b)

11GCE Economics A 9EC0 03
K DefineK Firms + Communities combinedAN DevelopmentAN DevelopmentAP DiagramAP DiagramEV XBEV XB
6/6 + 2/2 (8): full marks
Examiner Comments
Diagrams are effective when asked for impact.Examiner Comments
12 GCE Economics A 9EC0 03
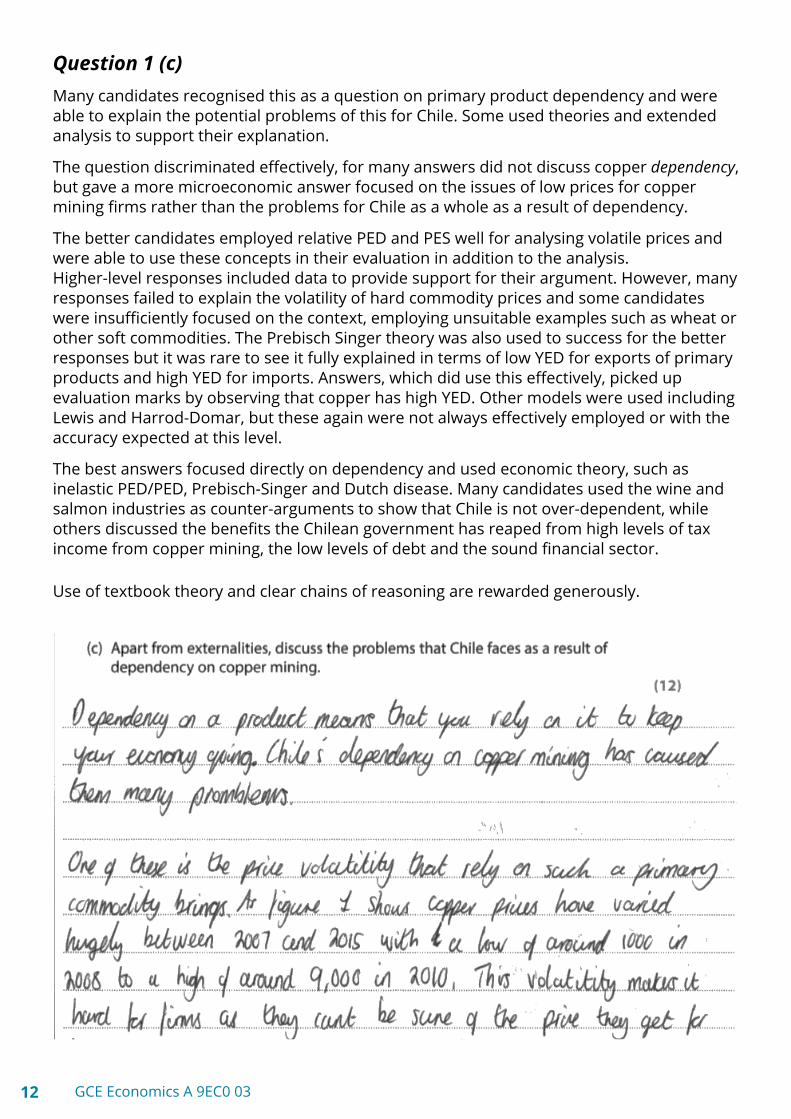
Question 1 (c)Many candidates recognised this as a question on primary product dependency and were able to explain the potential problems of this for Chile. Some used theories and extended analysis to support their explanation.
The question discriminated effectively, for many answers did not discuss copper dependency, but gave a more microeconomic answer focused on the issues of low prices for copper mining firms rather than the problems for Chile as a whole as a result of dependency.
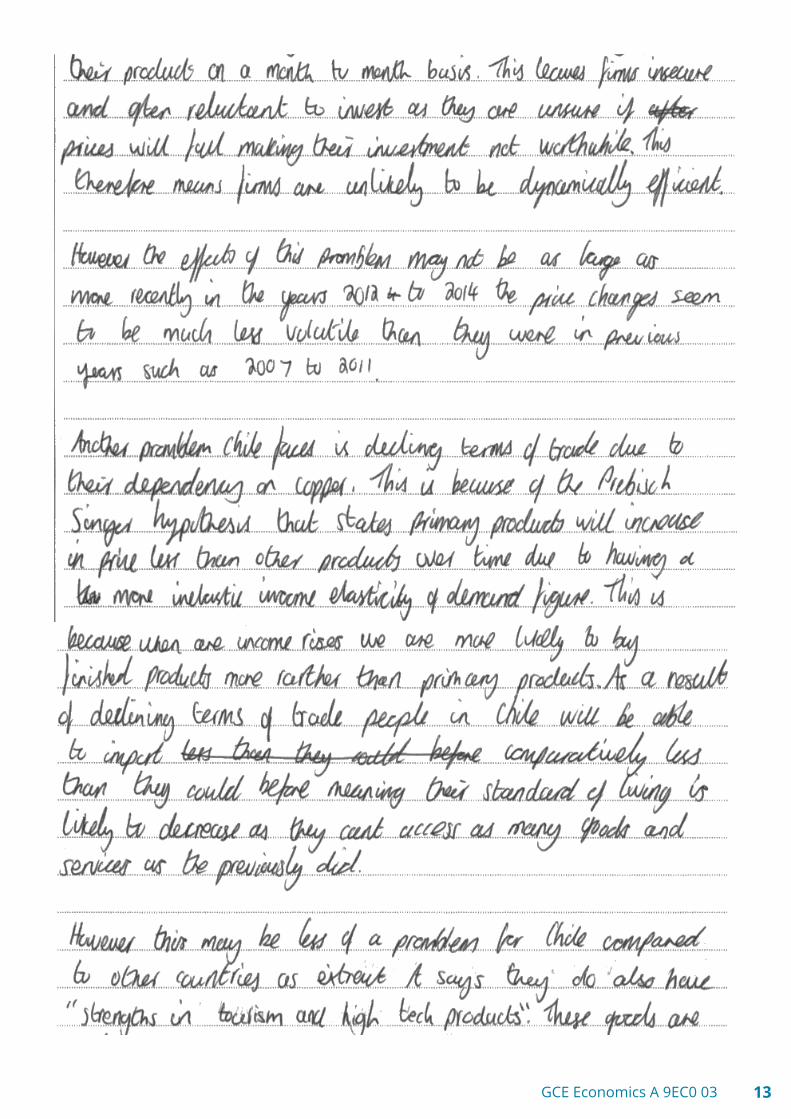
The better candidates employed relative PED and PES well for analysing volatile prices and were able to use these concepts in their evaluation in addition to the analysis. Higher-level responses included data to provide support for their argument. However, many responses failed to explain the volatility of hard commodity prices and some candidates were insufficiently focused on the context, employing unsuitable examples such as wheat or other soft commodities. The Prebisch Singer theory was also used to success for the better responses but it was rare to see it fully explained in terms of low YED for exports of primary products and high YED for imports. Answers, which did use this effectively, picked up evaluation marks by observing that copper has high YED. Other models were used including Lewis and Harrod-Domar, but these again were not always effectively employed or with the accuracy expected at this level.
The best answers focused directly on dependency and used economic theory, such as inelastic PED/PED, Prebisch-Singer and Dutch disease. Many candidates used the wine and salmon industries as counter-arguments to show that Chile is not over-dependent, while others discussed the benefits the Chilean government has reaped from high levels of tax income from copper mining, the low levels of debt and the sound financial sector.
Use of textbook theory and clear chains of reasoning are rewarded generously.
13GCE Economics A 9EC0 03
14 GCE Economics A 9EC0 03
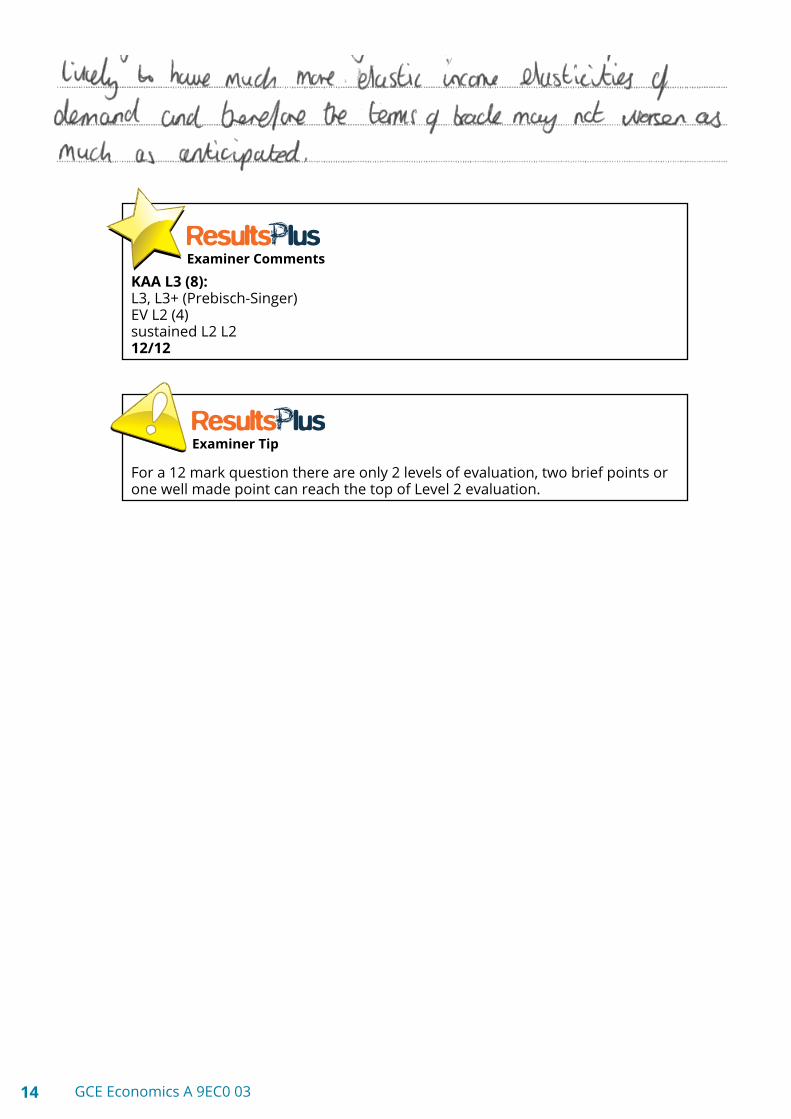
KAA L3 (8):L3, L3+ (Prebisch-Singer)EV L2 (4)sustained L2 L212/12
Examiner Comments
For a 12 mark question there are only 2 levels of evaluation, two brief points or one well made point can reach the top of Level 2 evaluation.
Examiner Tip
21GCE Economics A 9EC0 03
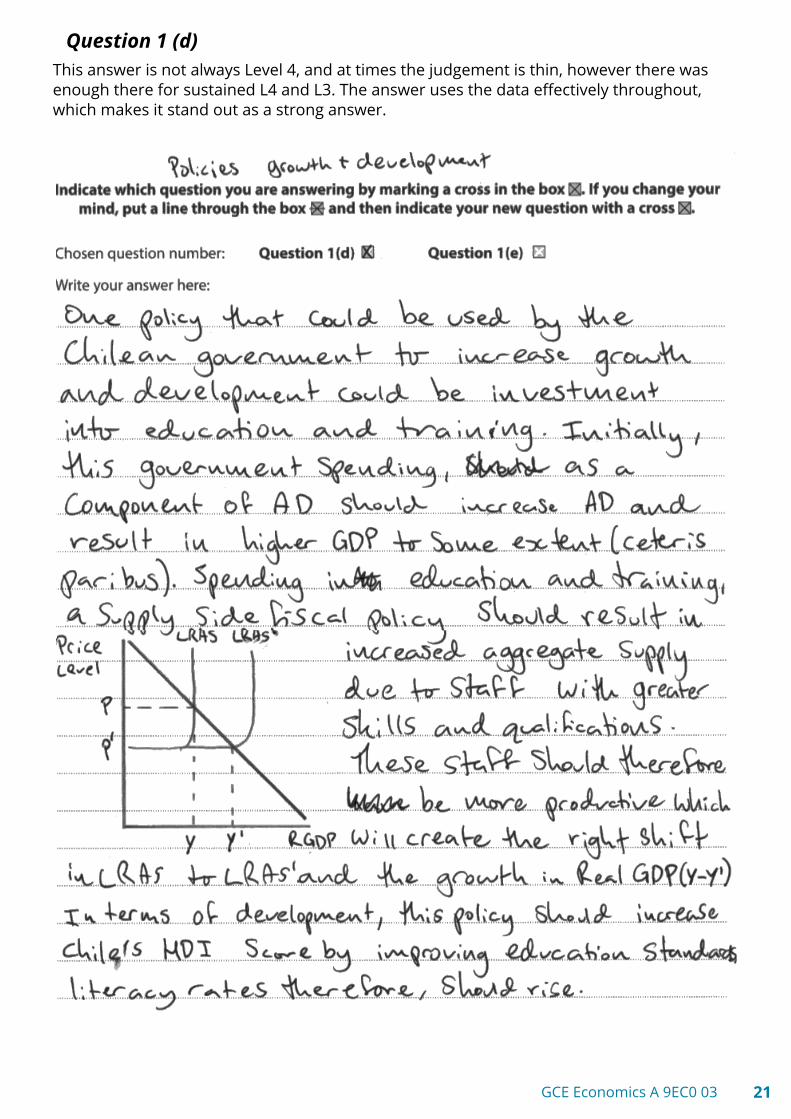
This answer is not always Level 4, and at times the judgement is thin, however there was enough there for sustained L4 and L3. The answer uses the data effectively throughout, which makes it stand out as a strong answer.
Question 1 (d)

22 GCE Economics A 9EC0 03

23GCE Economics A 9EC0 03
24 GCE Economics A 9EC0 03

25GCE Economics A 9EC0 03
L4 (growth and dev), L3+ (generic), L4 (micro macro) so 15/16 EV L3 (9)E3-, E2, E3- informed judgement so mid level 3 8/9 eval23/25KAA L (15)
Examiner Comments
Use the context data provided as the springboard for your answer. The passages were full of fiscal, monetary and supply side policies. The evaluation was also strongly indicated in the passages.
Examiner Tip
30 GCE Economics A 9EC0 03
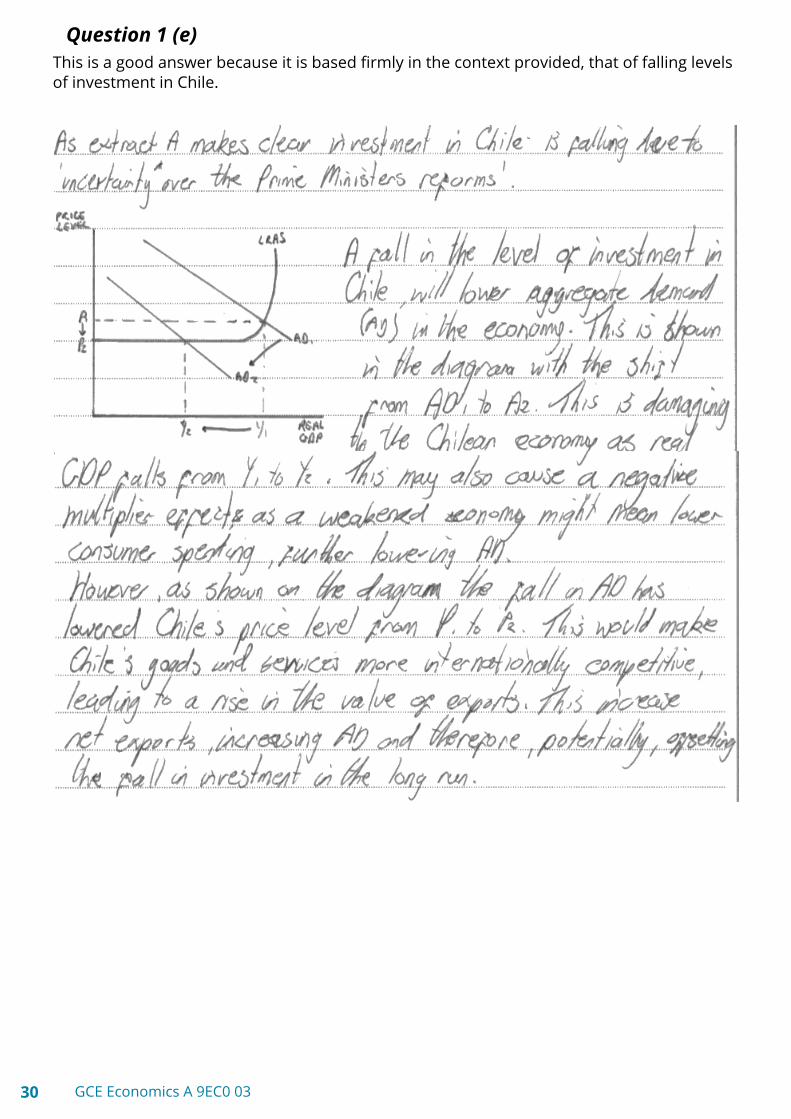
This is a good answer because it is based firmly in the context provided, that of falling levels of investment in Chile.
Question 1 (e)
31GCE Economics A 9EC0 03
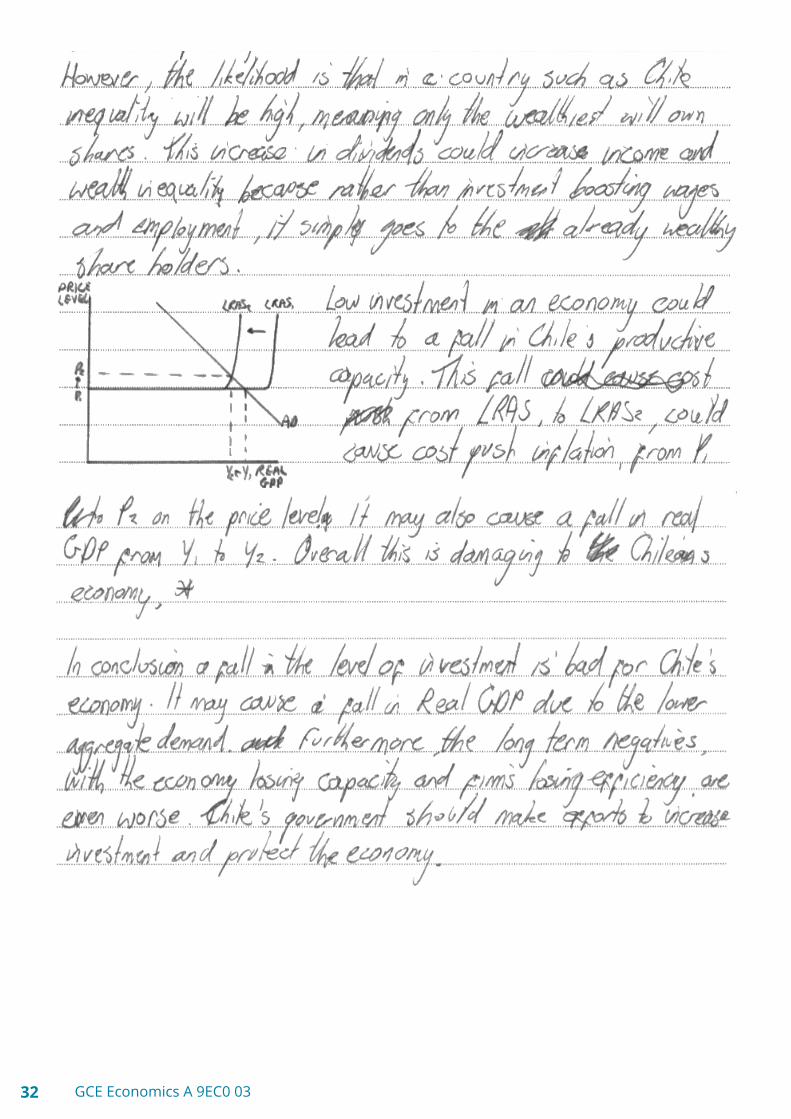
32 GCE Economics A 9EC0 03
36 GCE Economics A 9EC0 03
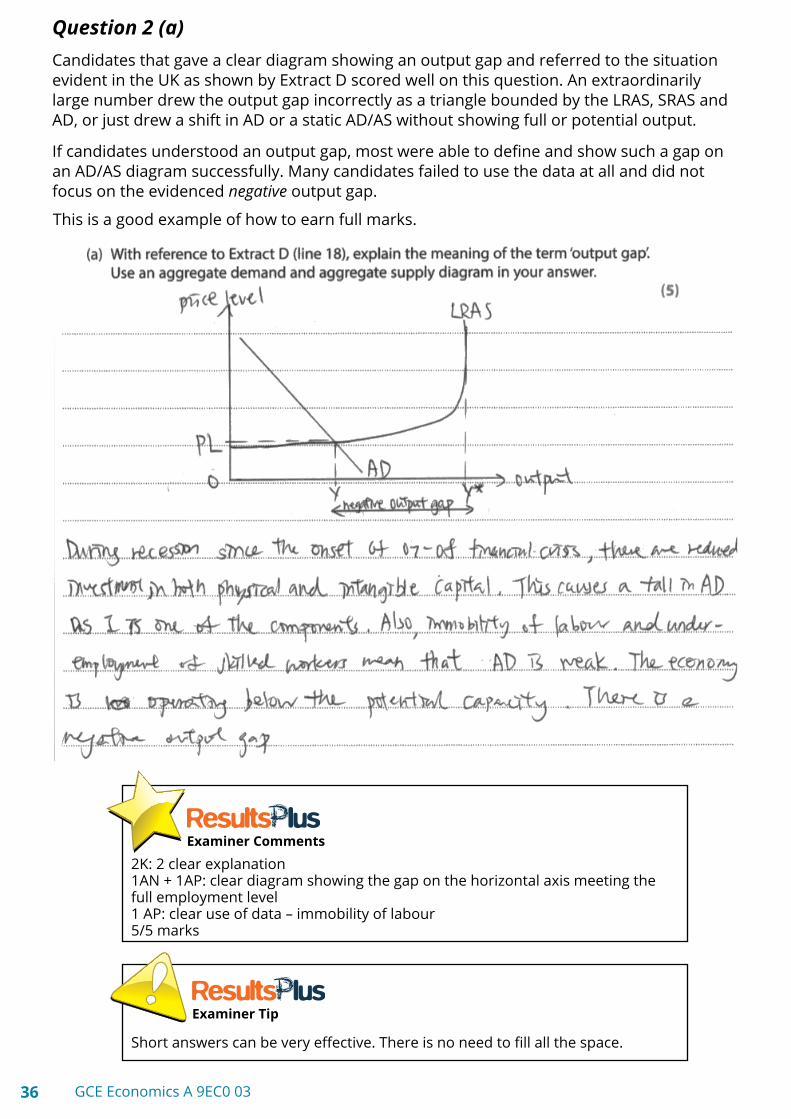
This is a good example of how to earn full marks.
2K: 2 clear explanation1AN + 1AP: clear diagram showing the gap on the horizontal axis meeting the full employment level1 AP: clear use of data – immobility of labour5/5 marks
Examiner Comments
Short answers can be very effective. There is no need to fill all the space.
Examiner Tip
Question 2 (a)Candidates that gave a clear diagram showing an output gap and referred to the situation evident in the UK as shown by Extract D scored well on this question. An extraordinarily large number drew the output gap incorrectly as a triangle bounded by the LRAS, SRAS and AD, or just drew a shift in AD or a static AD/AS without showing full or potential output.
If candidates understood an output gap, most were able to define and show such a gap on an AD/AS diagram successfully. Many candidates failed to use the data at all and did not focus on the evidenced negative output gap.
38 GCE Economics A 9EC0 03
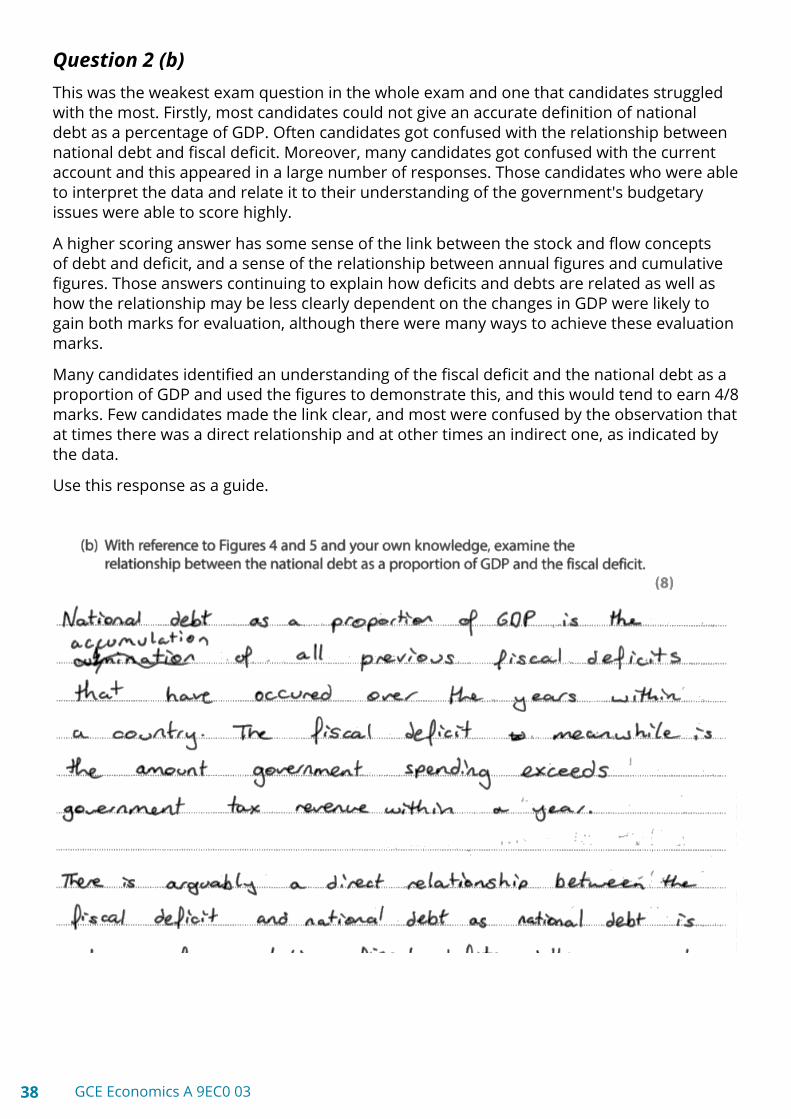
Use this response as a guide.
Question 2 (b)This was the weakest exam question in the whole exam and one that candidates struggled with the most. Firstly, most candidates could not give an accurate definition of national debt as a percentage of GDP. Often candidates got confused with the relationship between national debt and fiscal deficit. Moreover, many candidates got confused with the current account and this appeared in a large number of responses. Those candidates who were able to interpret the data and relate it to their understanding of the government's budgetary issues were able to score highly.
A higher scoring answer has some sense of the link between the stock and flow concepts of debt and deficit, and a sense of the relationship between annual figures and cumulative figures. Those answers continuing to explain how deficits and debts are related as well as how the relationship may be less clearly dependent on the changes in GDP were likely to gain both marks for evaluation, although there were many ways to achieve these evaluation marks.
Many candidates identified an understanding of the fiscal deficit and the national debt as a proportion of GDP and used the figures to demonstrate this, and this would tend to earn 4/8 marks. Few candidates made the link clear, and most were confused by the observation that at times there was a direct relationship and at other times an indirect one, as indicated by the data.

39GCE Economics A 9EC0 03
K Define deficitK Implicit debt definitionAN Deficit/surplus to debtAN Gains two marks on mark schemeAP Relationship (surplus and debt)AP Data referenceEV Depends on growth (strong ev)EV Development6/6 + 2/2 (8)
Examiner Comments
National debt is nothing to do with the household or external debt of a country. It is a governmental issue.
Examiner Tip

40 GCE Economics A 9EC0 03
Question 2 (c)Many candidates recognised that the National Living Wage would increase firms’ costs and lead to a rise in average and marginal costs. A good and challenging question which candidates attempted well. Most were able to give a correct diagram. Diagrams then showed a reduction in profits for the firm, but finding the new profit area lined up with the new MC=MR point was challenging for many candidates (although much easier for those who had reasoned that the change in costs was a fixed factor and therefore no change in MC).
This was often evaluated by arguing that any fall in profits may be offset by gains in productivity because of increased wages. Other excellent evaluation included the evidence that the wage increase was estimated to have a 0.3% impact on overall costs, does not affect the under-25s, depends on whether firms can pass on cost increases (often with consideration of the market power of firms and their profit levels), and effects on productivity also suggested in the data.
This was the question where candidates gave a large amount of evaluation to a very good standard. Candidates were able to respond well to this question perhaps as it resembled the previous syllabus Unit 3 questions. There was a tendency for the candidates to provide very long multiple evaluative points (a legacy from the 16 mark questions in 6EC03) and so perhaps spent too much time on this question.
Some candidates confused the concept of a mandatory NLW with the optional Living Wage proposed but not mandatory in some areas of the country. The passages made it clear that the NLW was a change in mandatory pay for the 25+ age group with a premium for the 25+ age group.
This diagram was one of very few that was drawn fully accurately.

41GCE Economics A 9EC0 03
KAA L3 (8):strong KAA and diagram; no need for second KAA as diagram required EV L2 (4):sustained L2 ev
Examiner Comments
The handwriting on this script was Illegible and it took some deciphering. Examiner’s must be able to read responses.
Examiner Tip
46 GCE Economics A 9EC0 03
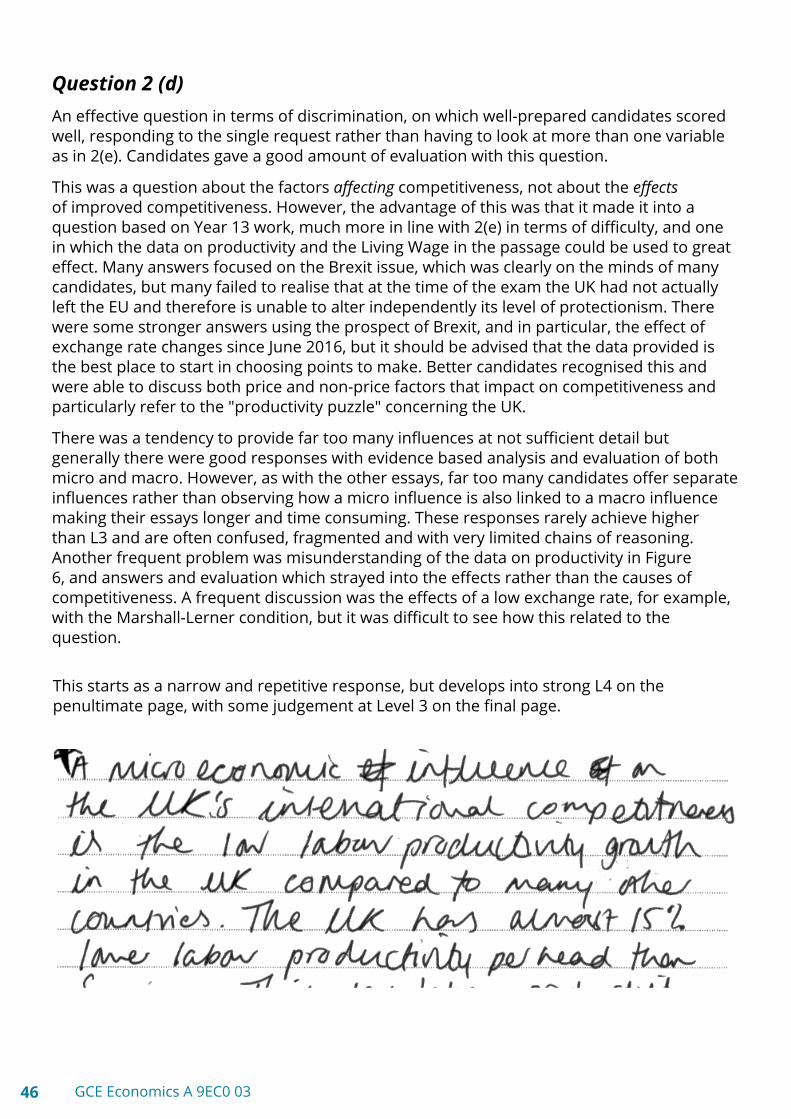
This starts as a narrow and repetitive response, but develops into strong L4 on the penultimate page, with some judgement at Level 3 on the final page.
Question 2 (d)An effective question in terms of discrimination, on which well-prepared candidates scored well, responding to the single request rather than having to look at more than one variable as in 2(e). Candidates gave a good amount of evaluation with this question.
This was a question about the factors affecting competitiveness, not about the effects of improved competitiveness. However, the advantage of this was that it made it into a question based on Year 13 work, much more in line with 2(e) in terms of difficulty, and one in which the data on productivity and the Living Wage in the passage could be used to great effect. Many answers focused on the Brexit issue, which was clearly on the minds of many candidates, but many failed to realise that at the time of the exam the UK had not actually left the EU and therefore is unable to alter independently its level of protectionism. There were some stronger answers using the prospect of Brexit, and in particular, the effect of exchange rate changes since June 2016, but it should be advised that the data provided is the best place to start in choosing points to make. Better candidates recognised this and were able to discuss both price and non-price factors that impact on competitiveness and particularly refer to the "productivity puzzle" concerning the UK.
There was a tendency to provide far too many influences at not sufficient detail but generally there were good responses with evidence based analysis and evaluation of both micro and macro. However, as with the other essays, far too many candidates offer separate influences rather than observing how a micro influence is also linked to a macro influence making their essays longer and time consuming. These responses rarely achieve higher than L3 and are often confused, fragmented and with very limited chains of reasoning. Another frequent problem was misunderstanding of the data on productivity in Figure 6, and answers and evaluation which strayed into the effects rather than the causes of competitiveness. A frequent discussion was the effects of a low exchange rate, for example, with the Marshall-Lerner condition, but it was difficult to see how this related to the question.

47GCE Economics A 9EC0 03
48 GCE Economics A 9EC0 03

49GCE Economics A 9EC0 03

50 GCE Economics A 9EC0 03

51GCE Economics A 9EC0 03
KAA L4 (14): L4-, repeat, L3 (too similar), L4EV L3 (7): E2, E3-, E3- 21/25
Examiner Comments
Definitions are not required (unless specifically requested in a question) but they are a useful way to keep the answer focused on the question. This candidate left the definition until the end of the final page, but the understanding was clearly there throughout the whole answer.
Examiner Tip
55GCE Economics A 9EC0 03
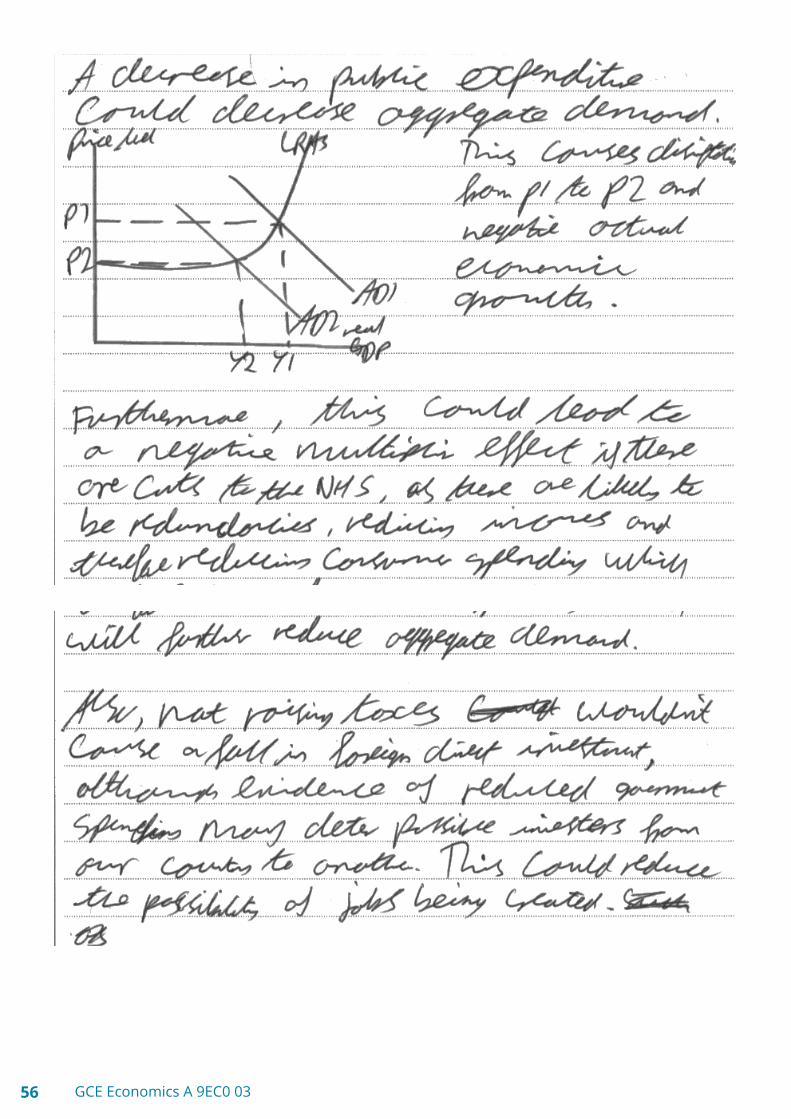
This response does actually answer the question, comparing cuts with government spending with the raising of taxes, but there are many questions left in the analysis.
Question 2 (e)
56 GCE Economics A 9EC0 03
57GCE Economics A 9EC0 03

58 GCE Economics A 9EC0 03
Use the data. Give extended chains of reasoning. Fewer strongly argued points score better than lists of undeveloped factors.
Examiner Tip
KAA L3 (11):L3, L3 (both focused on Q), L3 (developed but only G), L3 (tax); no data EV L2 (6)E2, E3; some judgement but not sustained E3 so top E217/25
Examiner Comments