Embed Size (px)
Citation preview
Integration of Renewables into the Grid

About Us
SEPA’s mission is to facilitate the utility industry’s smart transition to a clean energy future through
education, research, and collaboration.
www.sepapower.org

www.sepapower.org
Neutral Platform for Stakeholder Collaboration
Words most frequently used to
describe SEPA:
• Trustworthy• Balanced• Strategic
• Collaborative• Accessible
• Informational• Knowledgeable
• Friendly
2015 survey with 800 member and non-member responses

www.sepapower.org
The “Smart” Transition

Solar Snapshot

www.sepapower.org
Solar grows;utilities respond
Mainstream Utility Solar Strategies:
• Large Scale Solar PV in IRPs
• Redesigning Rate Structures
• Exploring Community Solar

www.sepapower.org
2015 Pricing
Sources: SEPA “2015 Utility Solar Marketplace Snapshot,” Data from EnergySage & Mercatus
US pricing varies significantly by state, and is generally higher than many countries by as much as 50% in the residential market
• Residential pricing has been quoted as low as $2.50/W
• FirstSolar expects $1/W for large scale by 2017
www.sepapower.org
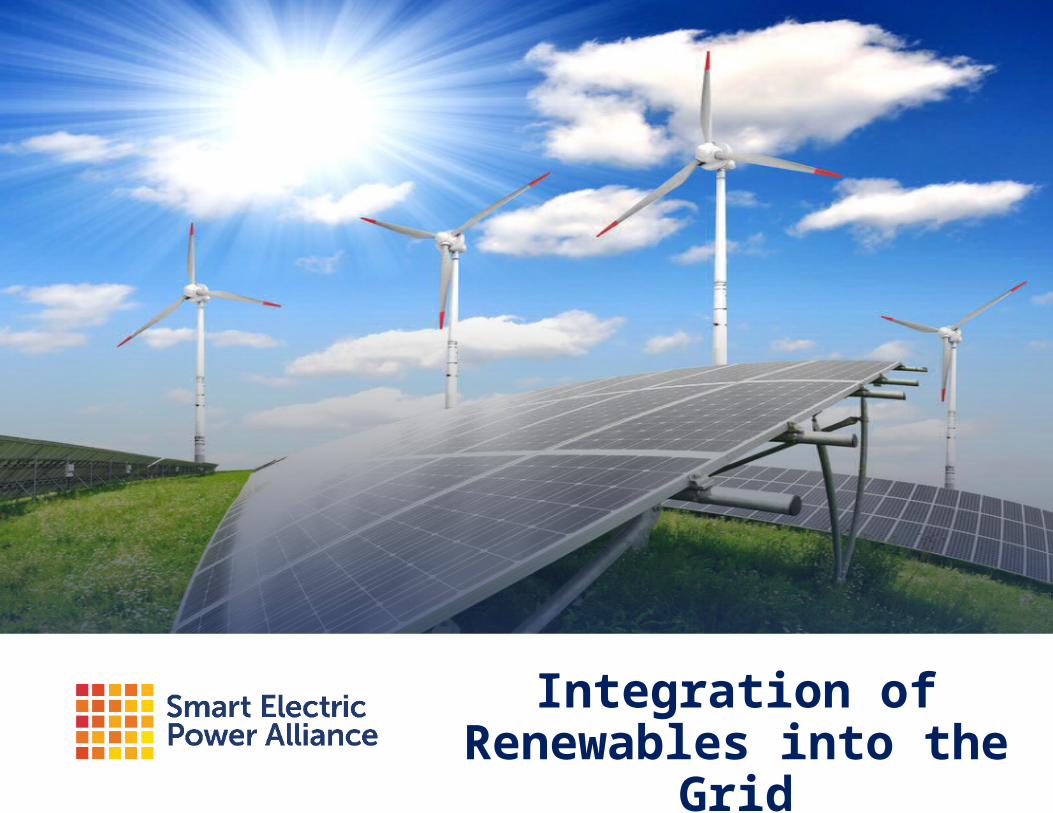
Community solar
8
Customer Benefits
Utility Benefits
• Increase customer access
• Ability to hedge costs• Portability within utility
service area• Leverages economies of
scale
• Can be strategically sited• Proactive customer
engagement• Support the local PV
industry• Opportunity to gain
understanding of solar resource

www.sepapower.org
Rate Reform Strategies

Continued Storage Growth

www.sepapower.org
Storage: Multiple Values
www.sepapower.org
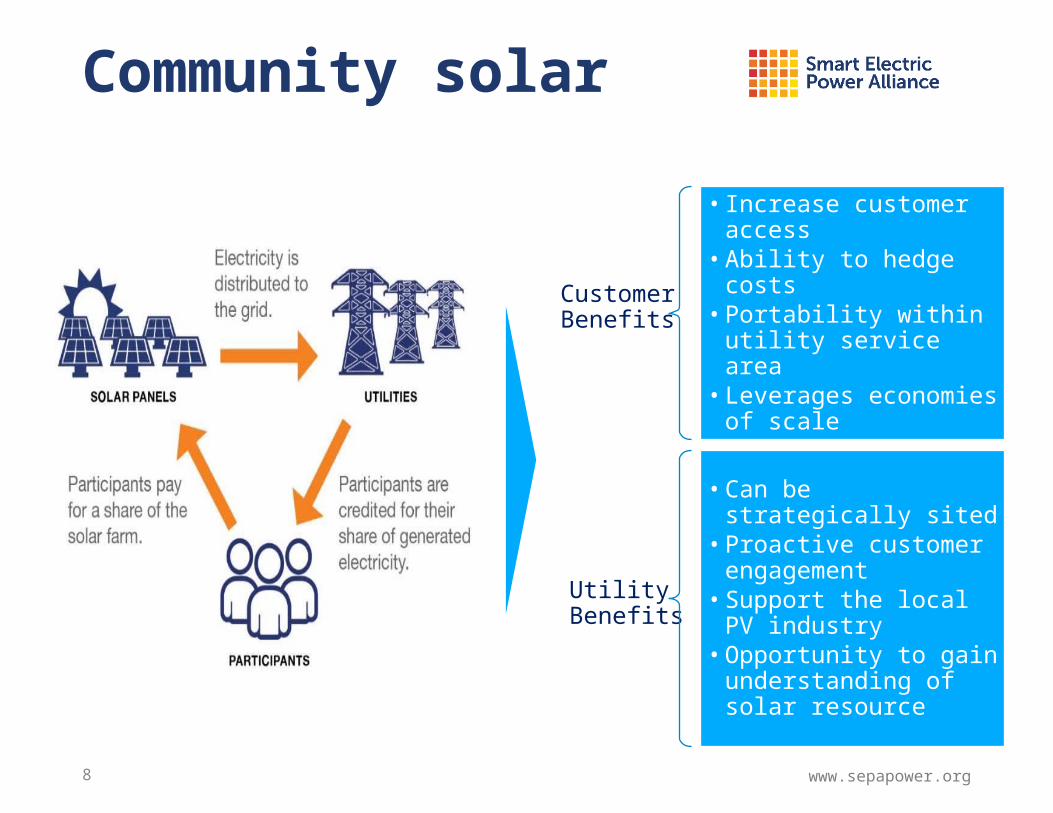
Storage: Utility Approaches

Business Model Evolution
Julia Hamm
202-559-2025
HEADQUARTERS
Smart Electric Power Alliance
1220 19th St NW, Suite 800
Washington, DC 20036
Contact Info

SEPA is an educational non-profit (501 c3)
Membership
Our unique mission is aimed at supporting utilities integration of solar, and other distributed energy resources, through educational events, research publications, & tailored consultations.
550+ Utility
> 90% of
installed solar
capacity550+
solar industry & stakeholder
About SEPA

Education
SEPA Products & Services
Research
Advisory
Our Work
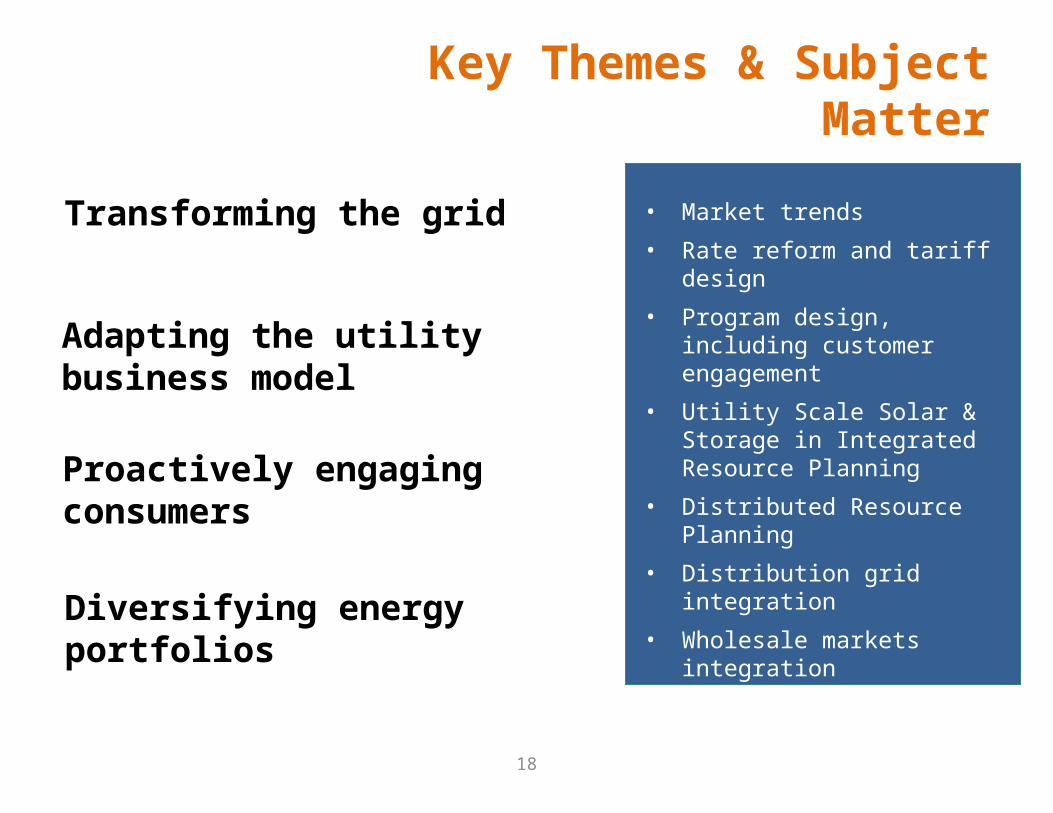
Transforming the grid
Key Themes & Subject Matter
18
• Market trends• Rate reform and tariff design• Program design, including
customer engagement• Utility Scale Solar & Storage in
Integrated Resource Planning• Distributed Resource Planning• Distribution grid integration• Wholesale markets integration• Asset management• Energy analytics • Clean Power Plan Implementation
Adapting the utility business model
Proactively engaging consumers
Diversifying energy portfolios

Market TrendsSolar’s Big Decade
• In the past ten years, the cost of solar has fallen by about 80% and worldwide growth has boomed.
• In the U.S., solar capacity has expanded from approximately 500 MW in 2005 to about 23 GW in 2015, and an estimated 60-70 GW by 2020.
19

20156,193
Source: SEPA, GTM Research
Cumulative: 22,488 MW
Solar Growth

Installed PV Costs – 2014-2015
21

Cost of Residential PV in Selected States
22Source: Energy Sage
Strong solar policy does not equate to lower costs to the consumer

How Competitive Is Solar?
23Source: “Lazard’s LCOE Analysis – Version 9.0” (November 2015)

Forecasts of Customer-sited PV Costs
24Source: Lazard's Levelized Cost of Energy Analysis - Version 8.0 (Nov 2014)
42% price decline projected28% price decline projected

Source: Sioux Valley Energy
Solar: Not The Perfect Utility Resource…

All Solar Markets are Growing
26
Source: SEPA 2014 Solar Market Snapshot www.sepatop10.org
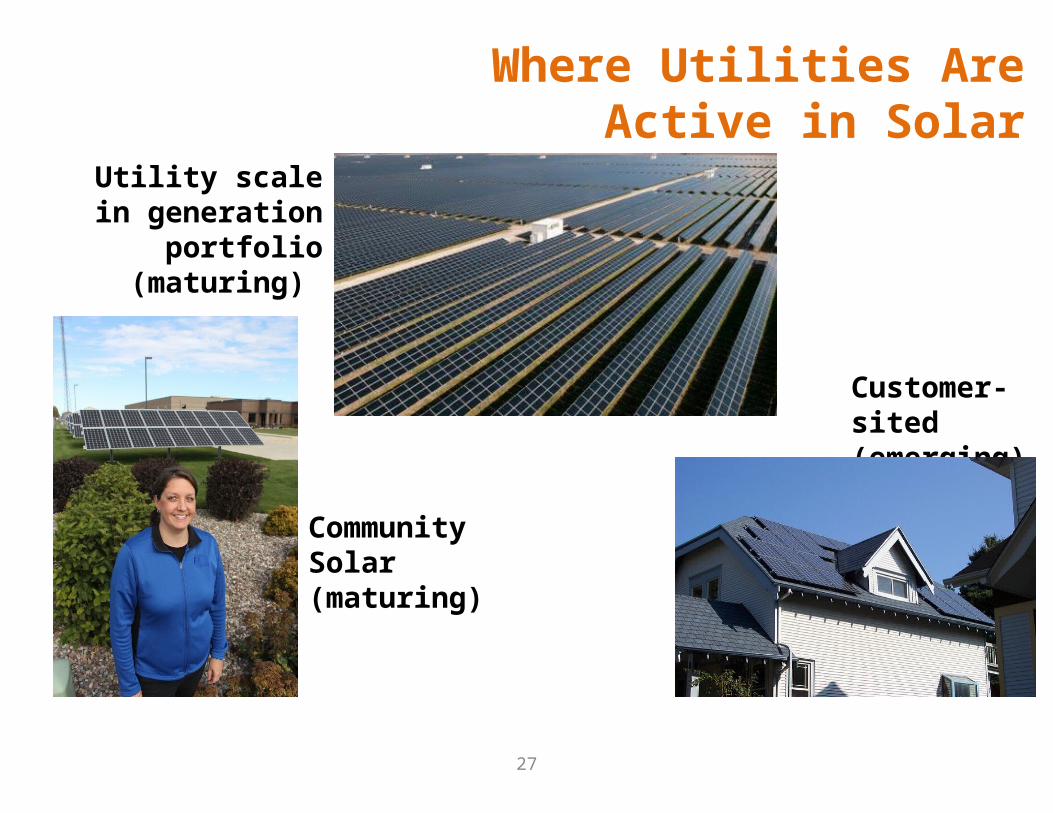
Where Utilities Are Active in Solar
27
Community Solar (maturing)
Utility scale in generation
portfolio (maturing)
Customer-sited (emerging)

Source: GTM Research, SEPA Analysis
• ~80% of customers interested in solar ownership are precluded due to non-policy constraints.
• Suggests 50 GW of demand unmet1
1 10 GW met demand / (20% met demand/total market ) = 50 GW
Community Solar An Alternative To Rooftop PV

Example:Orlando Utilities Commission
29
• 1 kW blocks, up to 15 kW at $0.13/kWh fixed based on actual plant generation; net metered $.025/kWh (residential) or $.015/kWh (commercial) more than current rates
• Term: 25 years• No performance guarantee• Customers pay a $50 deposit
(refundable after 2 years)
• Phase I: 400 KW
• Fully subscribed in 6 days
Offer
Response
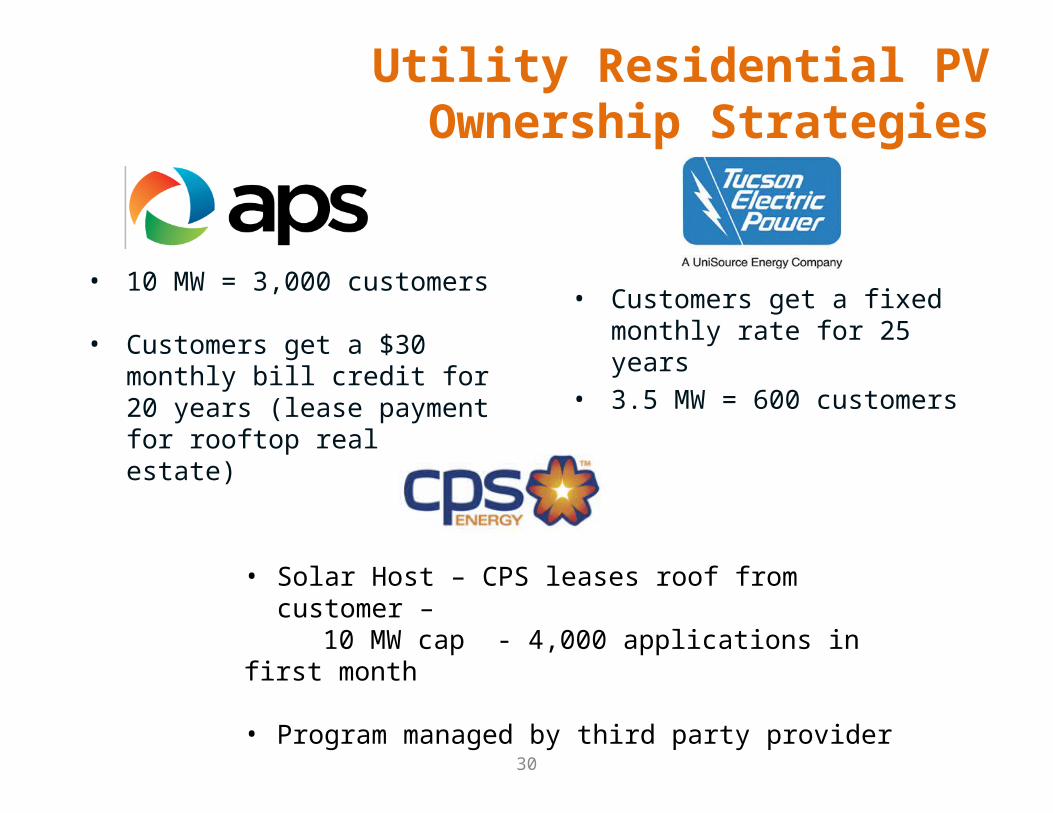
Utility Residential PV Ownership Strategies
30
• 10 MW = 3,000 customers
• Customers get a $30 monthly bill credit for 20 years (lease payment for rooftop real estate)
• Customers get a fixed monthly rate for 25 years
• 3.5 MW = 600 customers
• Solar Host – CPS leases roof from customer – 10 MW cap - 4,000 applications in first month
• Program managed by third party provider

Examples of Utilities Venturing into “Solar Plus”
• San Diego Gas & Electric solar plus storage microgrid boosts system reliability
• Steele-Waseca Co-op Electric – Community Solar + Load Management + Load Growth!
• Green Mountain Power – offering customers purchase or lease of Tesla Powerwall (goal: peak demand reduction)
31

Where We Are Today
32
At today’s costs, modifying retail rate design can impact solar deployment economics
Solar LCOE Range varies by orientation and location
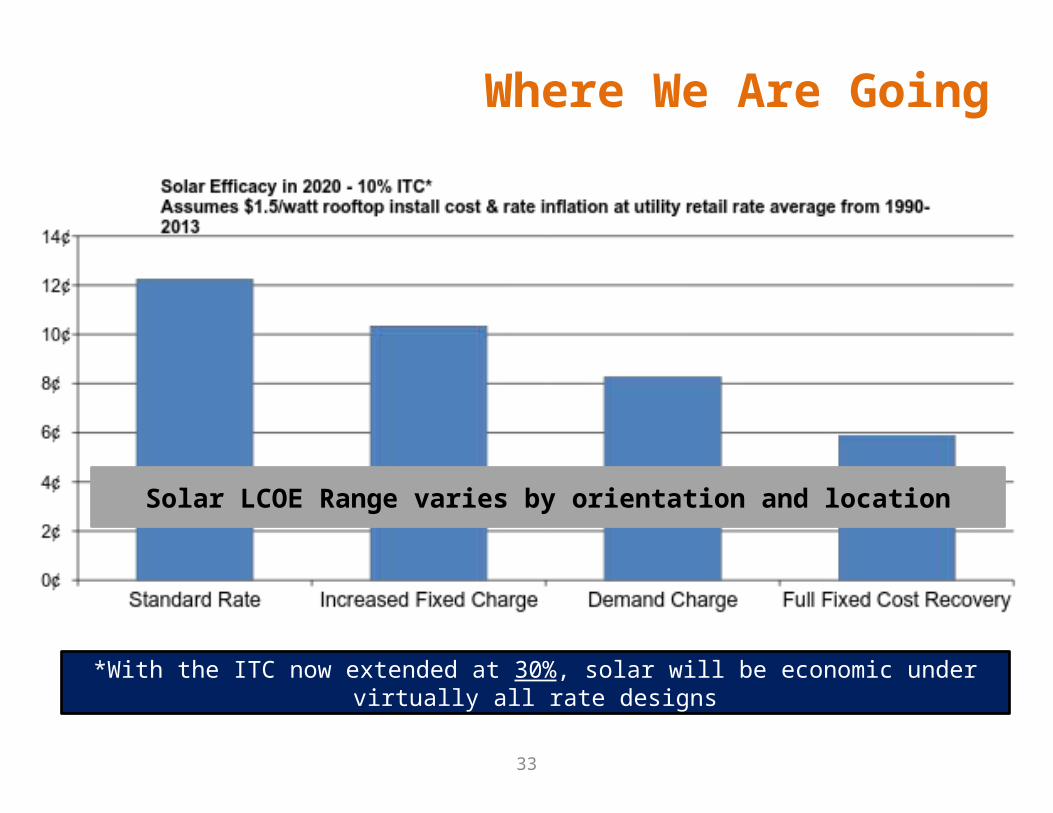
Where We Are Going
33
*With the ITC now extended at 30%, solar will be economic under virtually all rate designs
Solar LCOE Range varies by orientation and location

Increased Expectations of Utilities
34
LegacyExpectations
● Safe● Reliable● Low Cost● Enabling Economic Development● Stable and Predictable Costs

35
LegacyExpectations
NewDemands
● Safe● Reliable● Low Cost● Enabling Economic Development● Stable and Predictable Cost
● Greater Grid Resiliency● Proactive Environmental Stewardship● Support for Consumer Choice, including Self Generation
(Solar)● Support for Electric Vehicles
Increased Expectations of Utilities

Public Expectations of Utility are Increasing
36
LegacyExpectations
NewDemands
OftenForgotten
● Safe● Reliable● Low Cost● Enabling Economic Development● Stable and Predictable Cost
● Resilient● Support for DSM● Proactive Environmental Stewardship● Support for Consumer Choice, including Self
Generation● Support for Transportation Infrastructure
● Obligation to serve● Existing (& Unquestioned) Cross-Subsidization● Impact on Capital Cost & Availability● Data Availability, Security, & Ownership

A Proactive Utility Strategy
Passive Player Trusted Energy Advisor
Trusted Energy Partner
37
Transitioning from a passive player …
…to a proactive partner for customers adopting solar and other DER

Solar Is Pushing Change
38

SEPA’s 51st State
Created to provide a collaborative platform across the power sector to discuss the future of the electric industry. Designed as an alternative to today’s contentious debates.
The 51st State is a safe space for experts and industry leaders to present, sound out, and provide feedback on utility sector evolution.
39

40
2015 Concepts
Incremental Movement● Refresh the regulatory construct● Shift towards innovative rate
designs● Clearly articulate the roles of the
monopoly utility● Focus on enabling customer
adoption through:1. Improved interconnection
standards 2. Real-time information for
consumers
Paradigm Shift● Create a platform to connect
consumer-sited assets● Shift the role of utilities to grid
investment and maintenance● Place an independent third party
in charge of planning and operations
● Include societal impacts in cost-benefit calculations
● Turn customers from passive “takers” to proactive decision-makers in the electricity marketplace (“prosumers”)
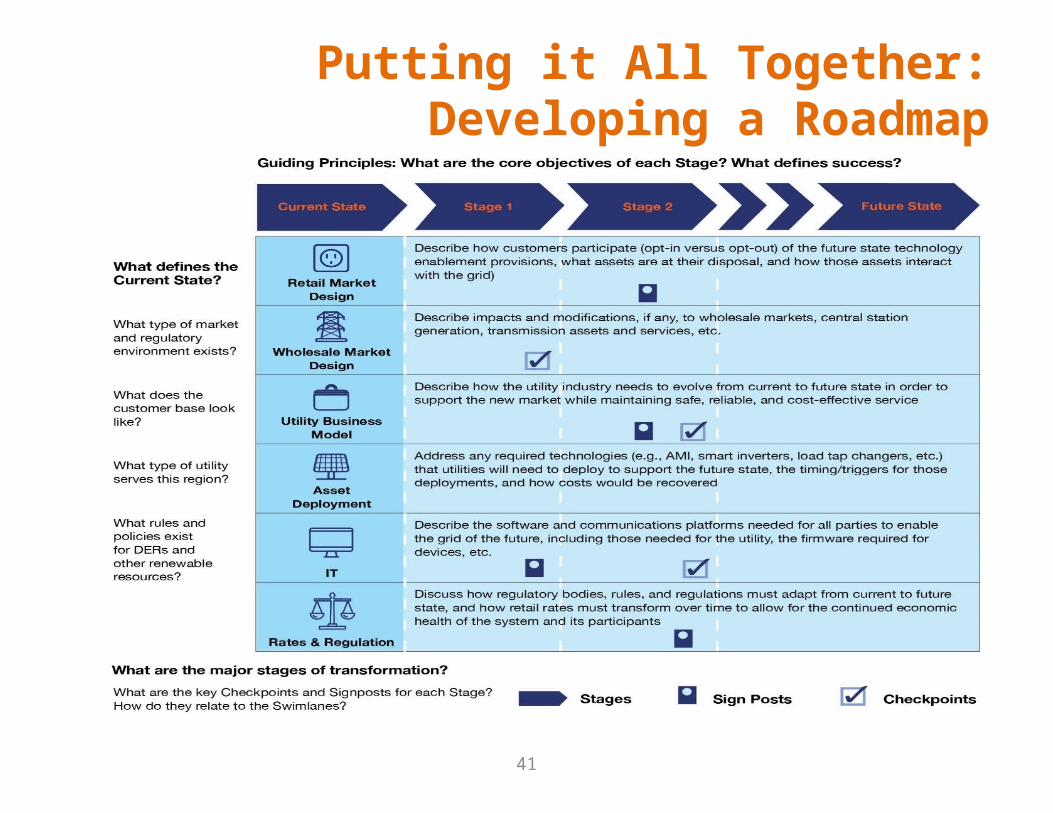
Putting it All Together:Developing a Roadmap
41

In Conclusion
• Solar growth will continue, based on increasingly compelling economics, across all market types. But solar won’t be a mature and truly valuable power resource until it becomes smart…
• The next constraint facing solar adoption will be integration challenges – engineering and economic.
• Utilities are learning how to turn this “threat” into an opportunity – for both customers and shareholders.
• Solar PV will be one part of a clean energy portfolio, which will include a mix of bulk power and distribution system scale resources.
42
Thank You!
43
Jennifer SzaroSenior Director of ProgramsSmart Electric Power Alliancejszaro@sepapower.orgwww.sepapower.orgwww.sepatop10.orgwww.sepa51.org

•Step 1 –Identify Service
Type
•Step 2–Evaluate existing
Service Capacity for PV Export
•Step 3 –Identify Local Area
Network’s Minimum Load Condition
NYC Grid Ready Project

Upcoming Initiatives - CECONY CUNY NY Solar Map
Grid Ready ProjectSummaryThis building is on a spot or isolated
network. In order to install the PV system size analyzed in Grid Ready,
grid upgrades may be required to accommodate potential solar export.
Please review the NYC Grid Ready Fact Sheet for more information on spot networks and average costs
incurred by the customer/developer to install a PV system.
49 5th Avenue,
Manhattan, NY 10003
Solar Potential Analyzed275 kW
Is the building on a Spot or Isolated Network?
Is the building’s service capacity too small to accommodate potential PV export?
Is the minimum load in the surrounding area too small to accommodate potential PV
export?
Interconnection Preliminary Review
45

UTILITY INTERVIEW FINDINGS
46

UTILITY TRENDS
47
1. Solar PV (and smart inverters)2. Energy Storage3. Electric Vehicles4. Demand Response5. Non-Solar DG6. Energy Efficiency
Technologies of Concern
• Traditional siloes with some cross-functional coordination vs. dedicated DER planning departments
• Distribution engineer responsibilities becoming more complex
• Most utilities are short-staffed in this area
Organizational Structure

EXTERNAL PRESSURES
48
Customers/Developers
Maintain Grid Reliability
Faster Interconnection
Times
Ease Penetration Limits
Compensation for Grid Services
Regulators
Maintain Grid Reliability: Mandates
Interconnection Timelines
DER Plan Mandates
Market/Rate Restructuring

UTILITY DER INTERCONNECTION PROCESSES
Receive paper interconnection applications
Apply basic screens (“rules of thumb”)
Allow/reject interconnections one at a time
Upgrade equipment (if needed)
49
Conventional Approach
Emerging Approach
Provide map of preferred interconnection locations
Receive online interconnection
applications
Run full distribution grid model for DER
“clusters”
Plan for optimal mix of mitigation solutions

SOFTWARE AND IT SYSTEMS
•EMS, DMS, OMS, DRMS, DERMS
•SCADA data, customer AMI data, DER meter data (MDMS)
•Traditional static tools vs. emerging dynamic tools
•Details on DERs, transformers, capacitor banks, etc. (GIS)
Distribution Infrastructure
Data
Distribution Modeling Software
Real-Time Management
SystemsInterval Metering
Data
50• Difficult to fully integrate all these components
DER Forecasting Tools

INDUSTRY GAPS
51
Methodology
Standard approach for distribution planning, taking DER deployment into account (how to
define “optimal”?)
Best practices for modeling (timescale, which impacts, which
mitigation solutions, etc.)
What level of DER control/aggregation is
appropriate?
Tools
Comprehensive time-series distribution system models that are easy to use and automated
Accurate DER device-level models (e.g., smart inverters)
Financial/rate models tied to distribution/DER planning
Solutions for widespread DER monitoring/control

• Planning vs. Operations• Most utilities struggling to meet operational needs and
comply with regulations• Most are not developing comprehensive plans or
streamlining processes for the future• Data/Modeling/IT
• Gathering/updating distribution system data• Ensuring accurate DER modeling• Integrating software/IT systems
• Coordination/Collaboration with Customers/Developers• Guiding projects to preferred interconnection locations• DER project design to minimize grid impacts
TOP CHALLENGES
52

SUMMARY OF DER PLANNING PROCESSES
53
Utility 1 Utility 2 Utility 3 Utility 4 Utility 5
Key Drivers
Regulatory Compliance
Regulatory DER Mandates
PUC DER Mandates
PUC DER & Reliability Mandates
Reliability Mandates None
Operational Necessity
Inter-connections
Inter-connections
Reliability; Inter-connections
Reliability; Inter-connections
Inter-connections
Methodology
Timeline for DER planning
Short-termEarly 2016
Short-termJuly 2015 Short-term Mixed Not set
Incentivizing preferred
interconnection locations
Somewhat Somewhat Yes Somewhat No
Cost recovery/rate restructuring
Under consideration Yes Under
consideration No specific plans Under consideration
Tools
Maps of preferred
interconnection locations
Somewhat Yes No Somewhat No
Advanced DER modeling tools Most Developed Some
DevelopmentSome
Development Most Developed Some Development
Active DER management Pilots Most Advanced Demo-stage Most Advanced Demo-stage

DETAILS OF DER PLANNING PROCESSES (1)
54
Utility 1 Utility 2 Utility 3 Utility 4 Utility 5
Key Drivers
Regulatory Compliance
Regulatory DER Mandates
PUC DER Mandates
PUC DER & Reliability Mandates
Reliability Mandates None
Operational Necessity Interconnections Interconnections Reliability;
InterconnectionsReliability;
Interconnections Interconnections
Methodology
Timeline for DER planning
Short-termEarly 2016
Short-termBy July 1, 2015
Short-termWill submit DER plan under PUC
proceeding in the near future
MixedJurisdictions have different planning
requirements, some include DERs
Not setNo specific
timeline
Incentivizing preferred
interconnection locations
SomewhatInterconnection
studies differentiate costs
by location (indirect guidance
for customers)
SomewhatProvides maps of
preferred interconnection
locations
YesStrategic Solar Locations come
with extra incentives
SomewhatCurrently provides
maps of "restricted" circuits; may provide more
detailed guidance in the future
NoDoes not provide
any specific guidance on
interconnection locations
Cost recovery/rate restructuring
Under consideration
Conscious of DER rate impacts and
considering future rate design
options
YesNEM 2.0
proceeding underway
Under consideration
Rate restructuring likely under PUC
proceeding
No specific plansNEM tariff is only
rate structure currently for
behind-the-meter DERs
Under consideration
Assessing current rate structure and
design

DETAILS OF DER PLANNING PROCESSES (2)
55
Utility 1 Utility 2 Utility 3 Utility 4 Utility 5
Tools
Maps of preferred interconnection
locations
SomewhatRecent RFO
identifies optimal solar
interconnection locations
YesPreferred
interconnection location maps
publicly available
NoThird-party
provides solar installation
mapping for public view; but contains no interconnection
info
SomewhatPublic can view
distribution mapping of
restricted circuits; working on further
guidance
No
Advanced DER modeling tools
Most DevelopedSystem-wide
distribution model; tools for measuring
and forecasting solar output
Some DevelopmentDoes T&D
modeling, but no system-wide
distribution model; uses static
distribution modeling tools
Some DevelopmentNo DER forecasting;
sophisticated internal modeling
tools but no system-wide
distribution model and tools need to
be integrated better
Most Developed System-wide
distribution model and DER forecasting tools; DOE grant for modeling advanced
voltage reg. strategies and
upgraded control schemes
Some DevelopmentRuns offline GIS/DMS for
interconnection studies in some
cases;conducting high
solar penetration impact studies on
bulk generation and T&D system-wide
Active DER management
Demo-stageMultiple storage
demos; establishing EV plans; testing IT systems to better
integrate DER data
Most AdvancedSmart inverter
standards; substation-level
energy storage; EV and demand
response integration; DERMS
Demo-stageMicrogrid projects;
AMI pilot
Most AdvancedPlanning auto-sectionalizing /
restoration schemes w/ all customer DER
mapped; testing smart inverter
functions
Demo-stageDeveloping DER interoperability
standards; adapting DMS to handle DER

PROACTIVE DER PLANNING FRAMEWORK
56

Does not take DER deployment into account
Forecast Load Growth
Model Circuit Impacts (Static)
Implement Lowest-Cost Solutions
Calculate Rate Impacts
STATUS QUO FOR UTILITY DISTRIBUTION PLANNING
57
Forecast Load Growth
Forecast DER Deployment
Model Full T&D Grid Impacts (Dynamic)
Implement Optimized Solution Mix
Recover Costs Through Innovative Rates
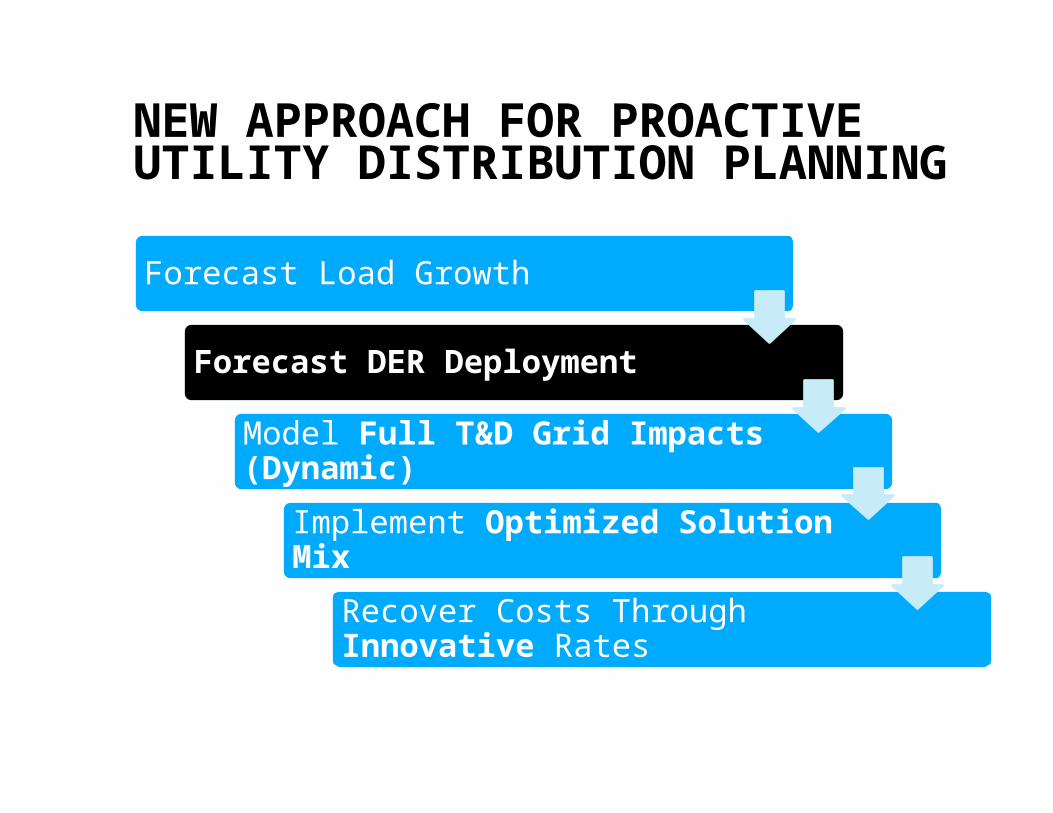
NEW APPROACH FOR PROACTIVE UTILITY DISTRIBUTION PLANNING
58
Forecast Load Growth
Forecast DER Deployment (Feeder by Feeder)
Model Full T&D Grid Impacts (Dynamic)
Implement Optimized Distribution Solution Mix
Calculate Rate Impacts
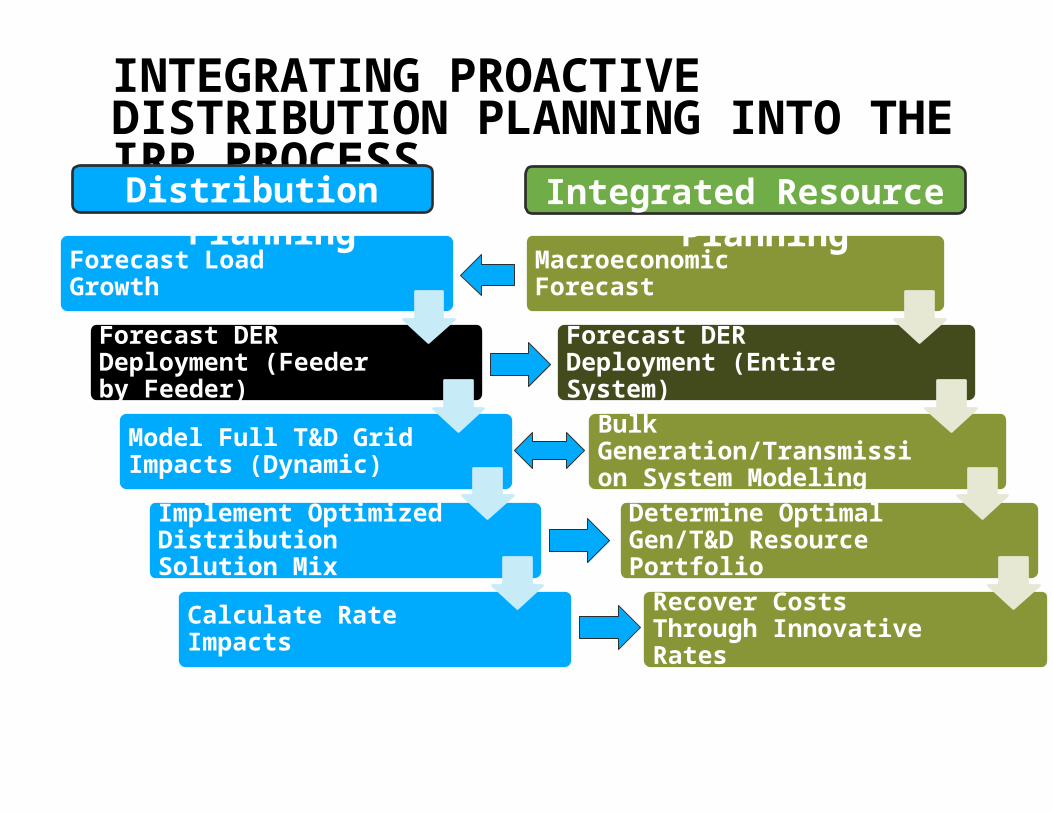
INTEGRATING PROACTIVE DISTRIBUTION PLANNING INTO THE IRP PROCESS
59
Macroeconomic Forecast
Forecast DER Deployment (Entire System)
Bulk Generation/Transmission System Modeling
Determine Optimal Gen/T&D Resource Portfolio
Recover Costs Through Innovative Rates
Distribution Planning Integrated Resource Planning

GRID MODELING HAS THREE PARTS
6 May 2015
60
Power FlowState Estimation
T, D Asset Model
Analytics Optimization
GIS
SCADALoad Research
AMIMonitoring & Sensors
Existing Models
Scenarios

GRID MODELING THEN & NOW
6 May 2015
61
T and DPlanningOperationsDynamicOptimizationFull systemFull DER
T or DEngineeringDesignSnapshotsHeuristicFeedersLimited DER
DMS Grid ModelsOperationsOracle, GE, Schneider/Telvent

Find out how utilities are rethinking everything to embrace a new distributed energy grid.
Download at: one.btm.report
Beyond the MeterThe Potential for a New Customer-Grid Dynamic

Discover our methodology for quantifying the locational value of deployed DER grid assets.
Download at: two.btm.report
Beyond the MeterAddressing the Locational Valuation Challenge for Distributed Energy Resources

www.sepapower.org

What the Community Solar Customer Wants
Based on a survey of 2,000 customers and over 250 small businesses, we uncover what community solar customers really want out of their program.
Download at: communitysolar.report
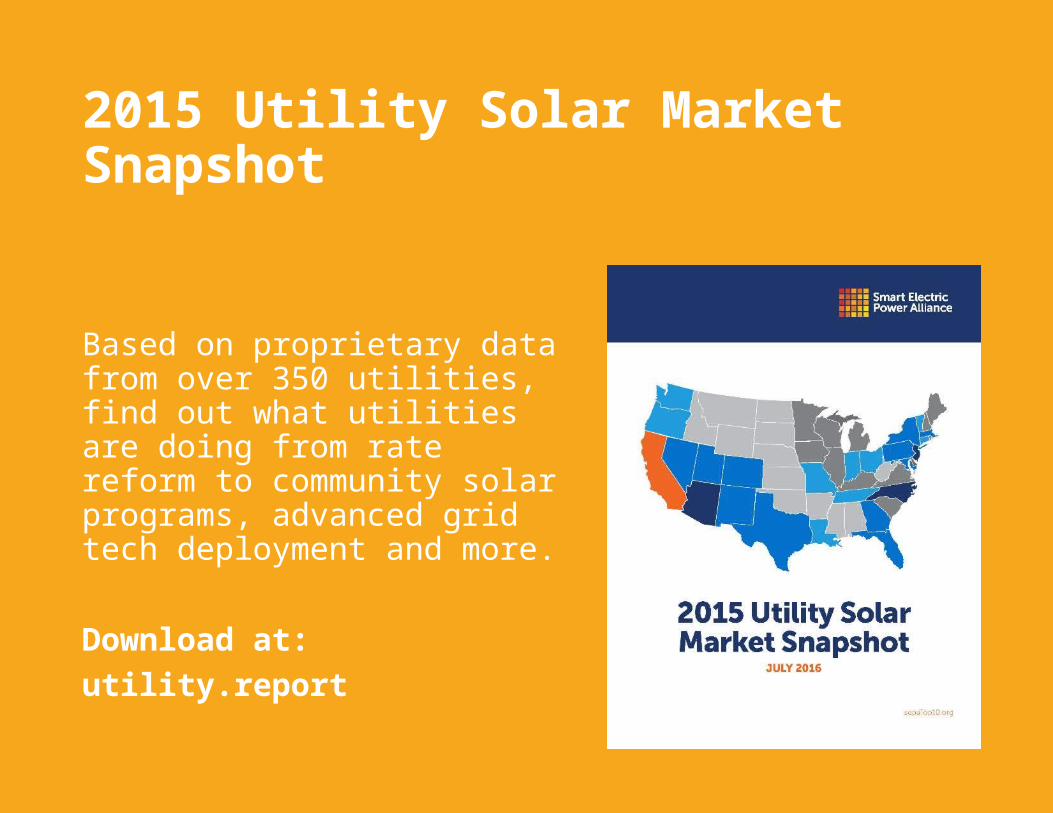
2015 Utility Solar Market Snapshot
Based on proprietary data from over 350 utilities, find out what utilities are doing from rate reform to community solar programs, advanced grid tech deployment and more.
Download at: utility.report
www.sepapower.org
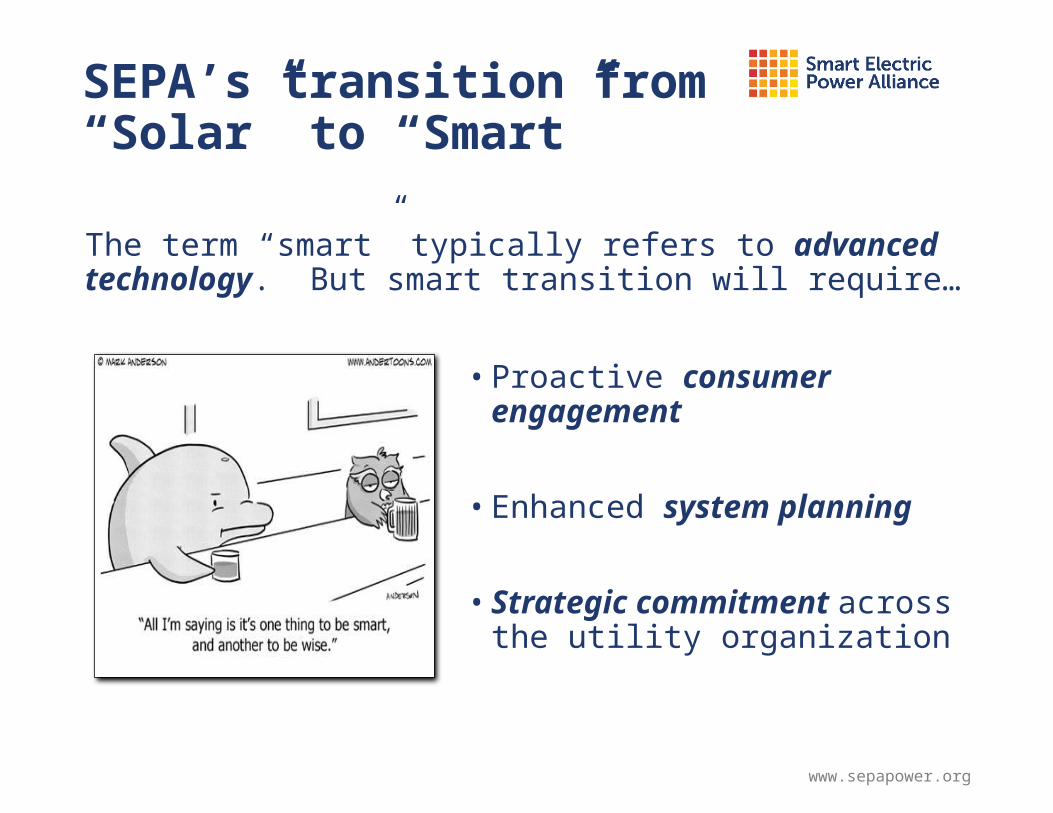
SEPA’s transition from “Solar” to “Smart”The term “smart” typically refers to advanced technology. But smart transition will require…
• Proactive consumer engagement
• Enhanced system planning
• Strategic commitment across the utility organization
www.sepapower.org
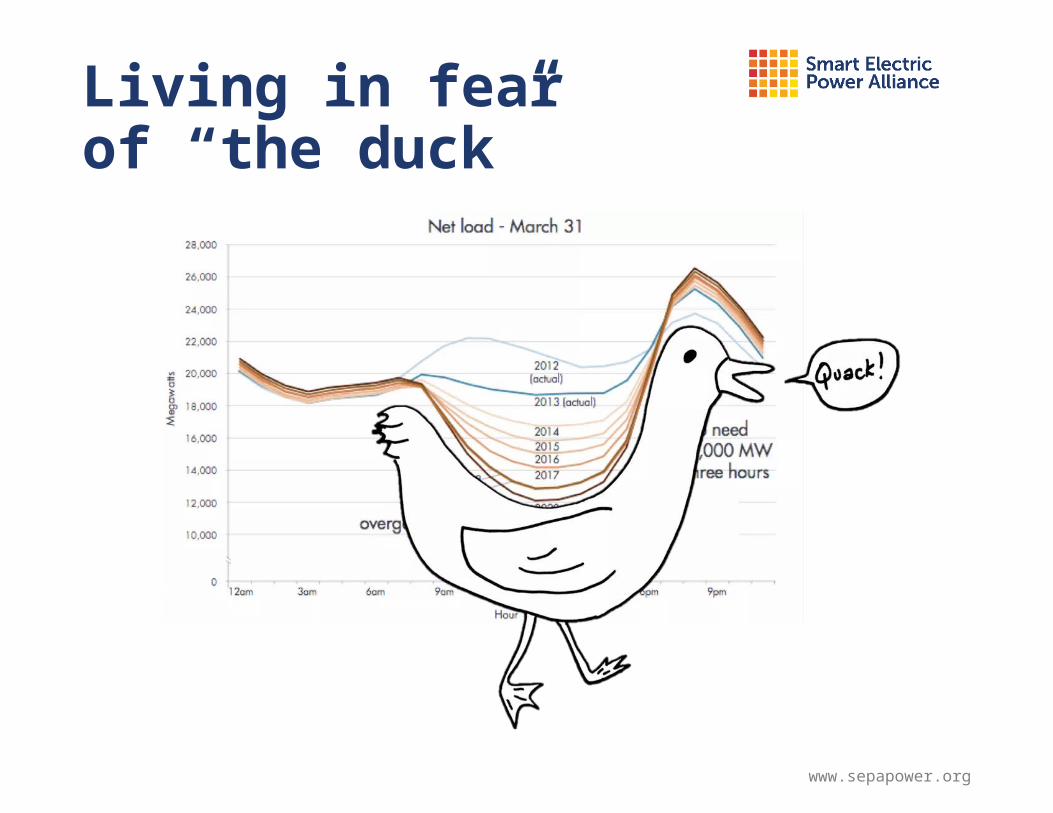
Living in fear of “the duck”

www.sepapower.org
Advanced grid tech deployments underway
Source: 2015 Solar Market Snapshot, SEPA
www.sepapower.org
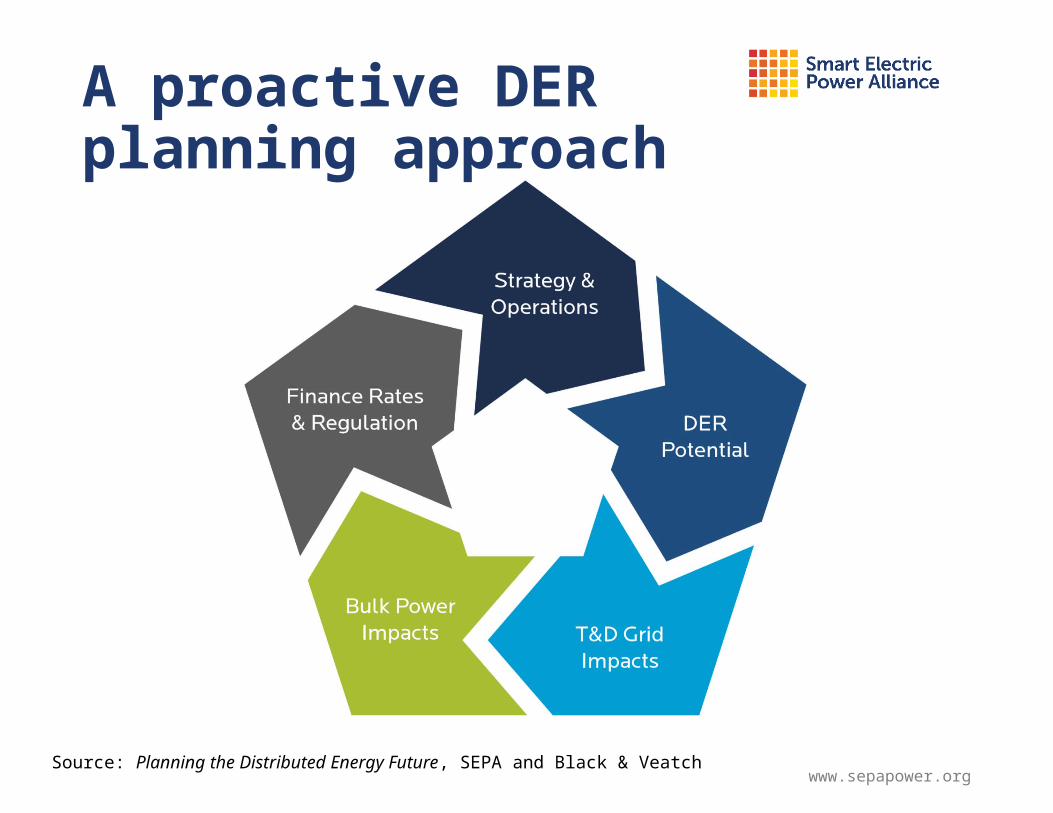
A proactive DER planning approach
Source: Planning the Distributed Energy Future, SEPA and Black & Veatch

www.sepapower.org
DER capabilities
Source: Distributed Energy Resources Capabilities Guide, SEPA

www.sepapower.org
Valuation of DER of Distribution Assets
Source: Addressing the Locational Valuation Challenge for Distributed Energy Resources, SEPA and Nexant

www.sepapower.org
Utilities thinking “Beyond the Meter”
Source: Beyond the Meter: The Potential for a New Customer-Grid Dynamic, SEPA
Aligning Solar and UtilitiesSampling of Utility Members
74

Aligning Solar and UtilitiesSampling of Non-Utility Members
75

SEPA Events, Products, & Services
76

77
Planning for an Uncertain Future
The future of the utility industry is
uncertain; whether current conditions continue or a push
towards a greener or more interactive
future awaits, utilities must plan and
prepare for tomorrow
NREL’s Electric System of the Future

78
SEPA / NREL Collaboration• SEPA and NREL have partnered on a research
initiative to dive into how a utility’s functions across the organization are impacted by this future uncertainty
• Focus on Rapid Growth of DER Future• Provides distinct operational challenges compared to
Business as Usual• Being experienced today in many jurisdictions
• Goal: identify steps that can be taken today to prepare for the future, regardless of what that may entail
• Expected publication at end of month• Publicly available on both SEPA and NREL websites

Solar Impact Areas
79
Sola
r Im
pact
Are
as
Long-Term PlanningImpact to generation, transmission, and distribution long-term planning
processes, including net load impacts
OperationsImpact to generation, transmission,
and distribution real-time operations and technology deployment
IT, Data, & CommunicationsImpact to data systems, including
information technology, data gathering, data processing,
communications, etc.
Utility Interactions with Customers
Impact to systems, processes, and procedures used to interact with
customers, both as ratepayers and potentially as self-generators
Utility Business ModelsImpact to how utilities run their
business, including which products and services are offered to
customers, and how utilites collect $
Distributed Solar impacts utilities in many ways…

80
Utility Impact Areas…across a host of different utility functions, roles, and responsibilities

81
Integration of Planning & Operations
• Increasing integration within the utility can lead to stronger long-term planning processes that better account for the impacts of DERs
• Proactive planning can lead to better operational visibility at the edge of the grid• Operational visibility translates into prevention of system issues before they
happen, and quicker resolution when issues do arise• Constant feedback loop

82
Least Regrets StrategiesLong-Term Planning
Develop supply- and demand-based distribution plans that roll up into the IRP
Treat DERs as both fixed inputs and as selectable resources in the IRP
Integrate Supply, Demand, Transmission, and Distribution planning processes into an
overarching process
Discuss a long-term distribution system investment plan with regulators

83
Least Regrets StrategiesOperations
Update standard equipment list to support distribution integration needs and
infrastructure requirements
Deploy advanced inverters system-wide
Deploy sub-meters for distributed generation resources

84
Least Regrets StrategiesIT, Data, & Communications
Develop a long-term IT, data, and communications plan that is tied into other planning processes
Strategically deploy real-time communications infrastructure, AMI, etc.
Move towards automated data management and analytics

85
Least Regrets StrategiesUtility Interactions with Customers
Create a “green team” for the customer call center
Enable sophisticated customer energy portals
Investigate new rate and pricing models
Create routine customer workshops on energy consumption, new in-home technologies, and
other topics of interest

86
Least Regrets StrategiesUtility Business Models
Move towards holistic customer program design
Create employee training initiatives around the changing grid
Balance rate cases with multi-year rate reform plans

SignpostsIdentifying the Speed and Direction of Change
• Industry Trends• Cost trends• Technology
advancements• Codes & standards
• Utility Metrics• Peer activities• Feeder characteristics• Interconnection volume
• Customer Activities• Load shape changes• Energy portal utilization

88
The Flexible Utility
The Flexible Utility
Prepares for a variety of
potential futures
Focuses strategic
thinking on a future where
DERs are commonplace
Proactively integrates
planning and operations activities
Identifies and monitors DER
signposts regularly
Leverages Least Regrets
strategies

89
The 51st State Phase II
www.sepa51.org

RenewablesTransmission Connected RenewablesSmart inverter control; Generation Management
Distribution Connected RenewablesSmart inverter control
Rooftop SolarSmart inverter control
Smart Inverter Control
PF, Volt-varVolt-Watt, Watt-FreqPower export limit L/HVRT, L/HFRT
Primary Voltage
0.9
0.925
0.95
0.975
1
1.025
1.05
0 4 8 12 16 20
Hour
Vol
tage
(pu)
Baseline – No PV
20% PV20% PV withvolt/var control
24 Hour Simulation%
Ava
ilabl
e Va
rs
% voltage
100%
0.95
1.05
-100%
1.0V
Control Settings

Energy Storage
Bulk Storage Peaking and ramping service; Grid flexibility
Distribution Storage
Power flow control; Load peak shaving
Customer-Sited StorageDemand & energy savings; Resiliency Vehicle-to-Grid
(V2G)
Virtual Power Plant (VPP)

Load Management
Industrial Demand ResponseFrequency Regulation; Reserve; Capacity
Residential Demand ResponseDemand & energy savings;Energy services (aggregate)
-1.5
-1
-0.5
0
0.5
1
1.5
8:00 10:00 12:00 14:00 16:00 18:00 20:00 22:00 0:00
Load
Red
uctio
n (k
W)
Customer Control
Utility Control (4hr Event)
Utility Control (6hr event)
Load Reduction
“Snapback”
Demand Response Characteristics

DER - Reshaping the Power System
Sharing the same power system – need more coordination and shared responsibility
• Consumers becoming energy producers
• Loads becoming more interactive and dynamic
• Generation becoming more flexible
• T&D becoming more controllable and resilient

Beneficial Integration of DER
Making grid ready for seamless integration of DER to support customer choice
Making DER more operationally integrated in cost competitive manner
Extending DER benefits beyond
customer premises
System Controller
Local Controller #1
Local DER
….
Integrated DER
Distribution System Controllable Equipment
(cap banks, LTCs, etc.)
Local Controller #2
Local DER
Local Controller #N
Local DER
Integrated Solution
Non-integrated DERIntegrated DER Integrated DER

Grid Issues with High Penetration of PVVoltage• Overvoltage• Voltage variations
Equipment Operation• Feeder regulators, • Load tap changers• Switched capacitor banks
Demand/Energy• “Masking” peak demand• Unbalancing supply and demand
System Protection• Relay desensitization, networks• Breaker reduction of reach• Unintentional islanding
Power Quality• Harmonic generation• Flicker worries
1 2 3 4 5
6 7 8 9 10 11 12
13 14 15 16 17 18 19
20 21 22 23 24 25 26
27 28 29 30
Tue Wed Thu Fri SatSun MonApril 2014
Variability Conditions: AZ
Variability Conditions: NM Variability Conditions: NJ
Q2 2012 Q3 2012 Q4 2012 Q1 20130
20
40
60
80
100
Perc
enta
ge o
f Day
s (%
)
Season
Variability Conditions: TN
Q2 2012 Q3 2012 Q4 2012 Q1 20130
20
40
60
80
100
Perc
enta
ge o
f Day
s (%
)
Season
Q2 2012 Q3 2012 Q4 2012 Q1 20130
20
40
60
80
100
Perc
enta
ge o
f Day
s (%
)
Season
Q2 2012 Q3 2012 Q4 2012 Q1 20130
20
40
60
80
100
Perc
enta
ge o
f Day
s (%
)
Season

Understanding Distribution Circuit’s DER Hosting CapacityWhat matters most Regarding Hosting Capacity?• DER technology and impacts• DER size and location• Feeder construction and operation
Impact Below
Threshold
Impact Depends
Impact Above
ThresholdVoltage
Protection coordination
Thermal capacity
Safety/ Reliability
DER Distribution Impacts
DER Size and Location Feeder Construction and Operation

Improving Analytics• Grid/DER modeling
• Planning methods
• Improving Planning Tools
Proactive Planning• DER locational value
Integrating New Technologies
• Smart inverters
• Automation and dispatchable resources
Advancing Distribution Planning and Analysis
Substation
EV/PHEV
Demand Response
Distributed Var control
Energy Storage
Primary Voltage
0.9
0.925
0.95
0.975
1
1.025
1.05
0 4 8 12 16 20
Hour
Vol
tage
(pu)
Baseline – No PV
20% PV20% PV withvolt/var control
24 Hour Simulation
Substation-level Hosting Capacity
Feeder-levelHosting Capacity

Adopting Open Standards and Protocols
VoltageManagement
BulkSystemSupport
Comm. & Interactivity
• Fixed Power Factor• Volt-VAR Control• Volt-Watt Control
• Voltage Ride-through• Freq Ride-through• Freq-Watt Control
• Configuration• Coordination• R/T Feedback

Architecture for DER Integration
DERMS = Distributed Energy Resource Management System
DERMS
SOLAR BATTERY PEV
MDMS OMS
Enterprise Integration
GIS Etc.
DRASDMS
AD
MS
GAP Area
Maturing, Well Defined Interfaces

DER Integration Challenges …
Grid SupportIncentivized or
grid-code
AuthorityUtility resource vs. customer owned Control &
CommunicationAutonomous or configurable
Co-ordinationOpen standards and Protocols
Transmission and DistributionPlanning and operation