Embed Size (px)
Citation preview

Professor Wenge Qiu
Southwest Jiaotong
University
December 2016 HongKong
2016 International Geo. Symposium
New Thinking about Stability and Support Theory of
Tunnel Surrounding rock

1 Inspiration
2 Hypothesis
3 Argument
4 Practice
5 Exploration
Outline

Why is the support required?
1 Inspiration

Inspired by long-term stability
of unlined tunnel
Inspired by the long-term stability
of tunnel with brick support

Natural karst cave-Zhijin Cave
Zhijin cave is located
in Zhijin county
Guizhou province.
The cave is 6.6km long,
maximum width
reaches 175 m and
height is more than
150m.

Natural karst cave-Tenglong Cave
Tenglong cave is
located in Lichuan
city Hubei province.
The cave is 74m
high,64m wide. It is
the biggest dry cave
in Asia.

Natural karst cave-Huanglong Cave
Huanglong cave is
located in
Zhangjiajie city
Hunan province.
The dimension is
96m wide,105m
long.

Built around 493 AD
In Paleozoic Cambrian
and Ordovician
limestone layer
Solid rock and compact
structure
Not likely to weather
and crack
Longmen Grottoes

Built around 366 AD
Quaternary Jiuquan
conglomerate rock with
sandstone
Lithology changes greatly
and cross-bedding is
largely developed.
The upper part is muddy
cementation, and the
lower part is calcareous
cementation.
This kind of conglomerate
rock is thick-massive
mostly.
Mogao Grottoes of Dunhuang

Yungang Grottoes
Built around 460~524 AD
The Mesozoic Jurassic
Yungang group and
Cenozoic quaternary
upper Pleistocene series
and Holocene stratum
Lithological wise , the
formation is composed
mainly of mudstone and
sandy mudstone.

Maijishan Grottoes
Built around 384~417 AD
Lithological wise, the
formation is composed
mainly by old tertiary or
cretaceous sandy
conglomerate

Built by burning
and quenching
method in the
Eastern Han
Dynasty, it is still
functioning.
Shimen Tunnel

Governed by Empress Dowager
Cixi, built by domestic and
overseas engineers in 1904. It is
324m long.
Mangshan Tunnel

Mangshan Tunnel

Zhongheng mountain Tunnel
Located in Ali Mountain Taroko Gorge, built in the middle
of the mountain.

Mountain highway along Taihang Mountains
The so called road on the wall was excavated along the cliffs.

Built in 1902.
Siberia Railway Tunnel

挪威地下体育馆
Gjovik Stadium
The largest underground facility in the world
Span:61m; length:91m; height:25m; buried depth:25-50m

Stockholm Subway Station
loess cave dwelling

loess cave dwelling

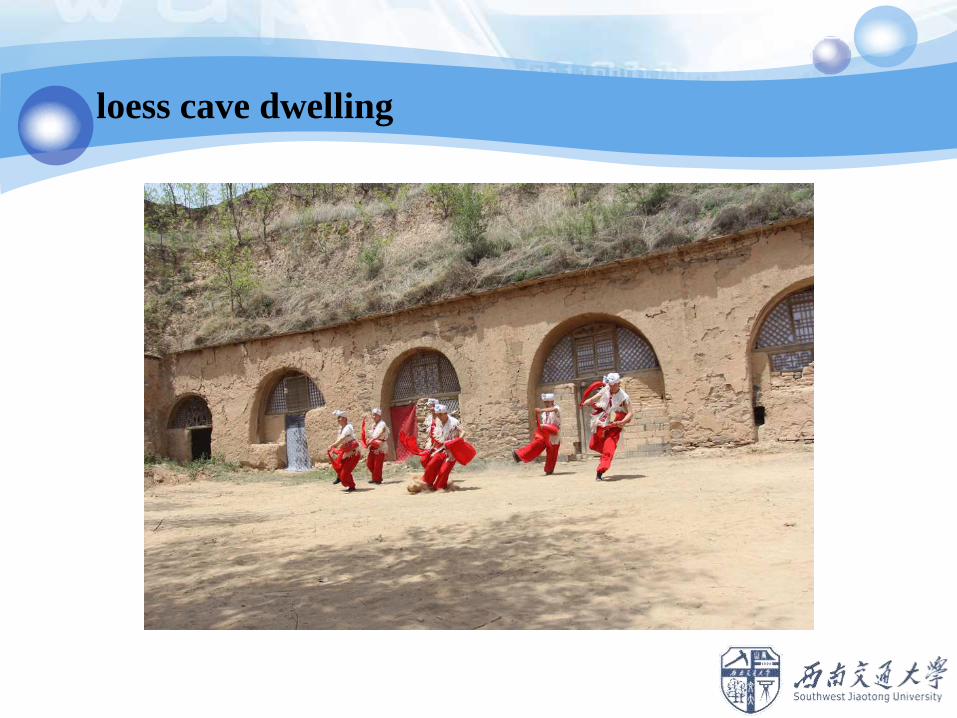
loess cave dwelling
loess cave dwelling

loess cave dwelling

Jiaohe ancient city ruins
It was built on the ancient silk way about 2000 years ago.

Jiaohe ancient city ruins

Jiaohe ancient city ruins

Longyou Grottoes

Longyou Grottoes

Turkey underground cavern group
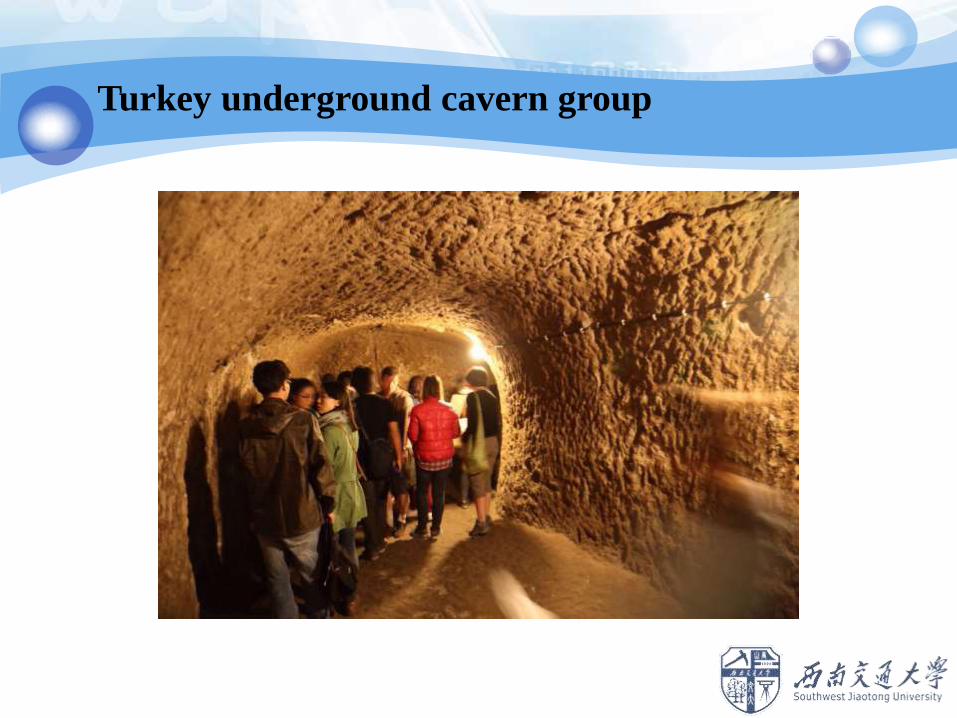
Turkey underground cavern group

Turkey underground cavern group

Natural bridge

Natural bridge

Natural bridge

Drug dealer prison break unlined tunnel in Mexican

Experiment Tunnel in our Laboratory

Experiment Tunnel in our Laboratory

‘3 spaces’ spatial distribution characteristics of tunnel and underground space stability
hypothesis
2 Hypothesis
Influenced by buried depth, lithology, shape and dimension of tunnel, a
law exists from surface to underground:
shallow buried Poor stability - Difficult to support
DⅠ Space
deep-buried Good stability - Easy to support
E Space
Super deep-buried Poorer stability - more Difficult to support DⅡ Space

σ/[σ]
H
σ
[σ]
n×10(m)
1000(m)
D
E
D

3 Argument
Adopting finite element limit analysis method (shear strength reduction
method) to calculate global factor of safety of surrounding rock stability.
For numerical simulation in geotechnical engineering, rock mass is allowed to
be in plastic state. Self-supported ability could be considered.
We should calculate according to plastic mechanics and limit state analysis to
attain factor of safety.

Factor of safety calculation Case 1:rectangular tunnel(height*width:6m*12m),V- level surrounding rock,
different buried depth, static numerical simulation
Case 2:horse-shoe tunnel(span:12m), V- level surrounding rock, different
buried depth, static numerical simulation
Case 3:circular tunnel( span:12m ),VI- level surrounding rock, different buried
depth, static numerical simulation
Case 4: circular tunnel( span:12m ), VI- level surrounding rock (0-5m ), V-
level surrounding rock (5-10m ), IV- level surrounding rock (10-30m) ,III-
level surrounding rock (30-300m) , static numerical simulation
Case 5:dynamic calculation based on Case 2(sinuous wave with a wavelength
of 120m)
Case 6:dynamic calculation based on Case 3 (sinuous wave with a wavelength
of 120m )

Results: Case 1:rectangular tunnel (height*width:6m*12m), V- level surrounding
rock, different buried depth, static numerical simulation
The relationship between factor of safety and buried depth
Regard 1.0 as critical factor of safety.
Drawing the diagram of factor of safety,
the factor of safety less than 1.0 is in
the red region , this is D Space.
Analysis:
1.The general trend of factor of safety
increases first, then decline; factor of
safety increases along with increase of
buried depth within 0-15m; factor of
safety declines along with the
increasing of buried depth more than
15m;
2.Generally factor of safety is less than
1.0, so E Space doesn’t exist.

Results: Case 2:horse-shoe tunnel (span:12m), V- level surrounding rock, different
buried depth, static numerical simulation
The relationship between safety
factor and buried depth
Regard 1.0as critical factor of safety. Drawing
the diagram of factor of safety, factor of
safety less than 1.0 is in the red region , this is
D Space; factor of safety more than 1.0 is in
the green region, this is E Space.
Analysis:
1.The general trend of factor of safety
increases first then declines; Factor of safety
increases along with increase of buried depth
within 0-15m; Factor of safety declines along
with increase of buried depth within 5-400m;
2. There are cases that value of factor of
safety is larger than 1.0, DⅠ Space , E Space
and DⅡ Space co-exist.

Results: Case 3 :circular tunnel ( span:12m ),VI- level surrounding rock, different
buried depth, static numerical simulation
The relationship between safety
factor and buried depth
Regard 1.0as critical factor of safety.
Drawing the diagram of factor of safety,
factor of safety less than 1.0 is in the red
region , this is D Space ; factor of safety
more than 1.0 is in the green region , this is
E Space.
Analysis:
1.The general trend of factor of safety
increases first then declines; Factor of safety
increases along with increase of buried depth
within 0-7m; Factor of safety declines along
with increase of buried depth within 7-400m.
2. There are cases that value of factor of
safety is larger than 1.0, DⅠ Space , E Space
and DⅡ Space co-exist..

Results: Case 4 : circular tunnel( span:12m ), VI- level surrounding rock (0-5m ),
V- level surrounding rock (5-10m ), IV- level surrounding rock (10-
30m) ,III- level surrounding rock (30-300m) , static numerical
simulation
The relationship between safety
factor and buried depth
Regard 1.0 as critical factor of safety.
Draw distribution diagram of factor of
safety, factor of safety less than 1.0 is in
the red region, this is D Space ; factor of
safety more than 1.0 is in the green region,
this is E Space.
Analysis:
1.The general trend of factor of safety
increases first then decline; E space
expands and D space shrinks gradually.
2. The curve fluctuates with the change of
surrounding rock parameters.
3. There are cases that value of factor of
safety is larger than 1.0, DⅠ Space , E
Space and DⅡ Space co-exist.

Results: Case 5 :dynamic calculation based on Case 2(sinuous wave with a
wavelength of 120m)
The relationship between safety
factor and buried depth
Regard 1.0 as critical factor of safety. Draw diagram of factor
of safety, factor of safety less than 1.0 is in the red region , this
is D Space; Factor of safety more than 1.0 is in the green
region, this is E Space.
Analysis:
1. There are cases that value of factor of safety is larger than
1.0, DⅠ Space , E Space and DⅡ Space co-exist.
2.Dynamic factor of safety is less than static one, E Space
shrinks and D Space expands.
3.The general trend of dynamic factor of safety increases first
then decline;
4. Seismic induced stress reaches maximum at depth of the ¼
or ¾ of wave length (30m, 90m). Dynamic factor of safety
fluctuates at such places.

Results: Case 6 :dynamic calculation based on Case 3 (sinuous wave with a
wavelength of 120m )
The relationship between safety
factor and buried depth
Regard 1.0 as critical factor of safety. Draw diagram of factor
of safety, factor of safety less than 1.0 is in the red region , this
is D Space; Factor of safety more than 1.0 is in the green
region, this is E Space.
Analysis:
1. There are cases that value of factor of safety is larger than
1.0, DⅠ Space , E Space and DⅡ Space co-exist.
2.Dynamic factor of safety is less than static one, E Space
shrinks and D Space expands.
3.The general trend of dynamic factor of safety increases first
then decline;
4. Seismic induced stress reaches maximum at depth of the ¼
or ¾ of wave length (30m, 90m). Dynamic factor of safety
fluctuates at such places.

stratigraphic
types
Number of samples
Average thickness
≤3m ≤6m ≤9m ≤12m ≤15m ≤18m
quaternary
stratum 3227 5.1m 46.1% 66.3% 80.0% 89.4% 96.3% 99.8%
weak stratum 3227 10.3m 15.6% 30.7% 45.6% 61.4% 77.5% 89.7%
intermediary
weathered
stratum
3165 5.3m 43.2% 67.4% 81.7% 90.7% 95.0% 97.3%
Statistics analysis based on 3227 geological drilling samples in Qingdao metro Line 2 and
Line 3 shows that thickness of weak stratum is 2.0~15.0m, average 10.3m; thickness of
intermediary weathered rock is 0.0~9.0m, average thickness is 5.3m.
There is a strong correlation between thickness distribution and topography.
‘3 spaces’ spatial distribution of tunnel stability in Qingdao

‘3 spaces’ spatial distribution of tunnel stability in Qingdao

Summary:
1.Generally DⅠSpace , E Space and DⅡ Space exist in static state.
2.E Space shrinks and D Space expands under dynamic condition.
3.Spatial distribution of tunnel stability will vary in situation of
special surrounding rock .
Ⅲ
Ⅳ
Ⅴ
Ⅱ
Ⅰ
DⅠ
E
DⅡ
H2
H2
H2
H2
H2
H1
H1
H1
H1

For II~VI level of rock mass from China railway tunnel
design standard, stability space is re-categorized.
Stability classification and support choose based on
conventional engineering rock mass classification
II level for one track railway
3m
780m
DI
E
DII

DI
E
DII
700m
二级围岩-双线
6m
II level for two track railway
Stability classification and support choose based on
conventional engineering rock mass classification

Stability classification and support choose based on
conventional engineering rock mass classification

Stability classification and support choose based on
conventional engineering rock mass classification

Stability classification and support choose based on
conventional engineering rock mass classification

Stability classification and support choose based on
conventional engineering rock mass classification

Conclusion
One
track
Two
track


Comparison to China railway tunnel design standard
In China railway tunnel design standard (TB10003-2005), vertical stress for deep
buried tunnel should be calculated as following equation.
𝒒 = 𝜸h
h= 𝟎. 𝟒𝟓 × 𝟐𝒔−𝟏𝝎
Where s is the classification of rock mass, w is the width influential index, B is width
of tunnel, i represents stress increment while B increase or decrease. When B<5m,
i=0.2; When B>5m, i=0.1;
𝝎 = 𝟏 + 𝒊(𝑩 − 𝟓)
According to equations, it assumes that all levels of rock mass should be ‘guilty’.
However, from our study, we find that rock mass may have the ability to support
itself. Therefor, the assumption in the standard is wrong.

Comparison with rock mass quality Q system
Grimstad, E., & Barton, N. (1993). Updating of the Q-system for NMT. In Proceedings of the
International Symposium on Sprayed Concrete—Modern Use of Wet Mix Sprayed Concrete for
Underground Support[C], Oslo: Fagernes, Norwegian Concrete Association.
According to the figure, we find that even when rock quality is poor we don’t need
strong support. Rock quality should not be blamed. Our study is in accordance with
Q system.
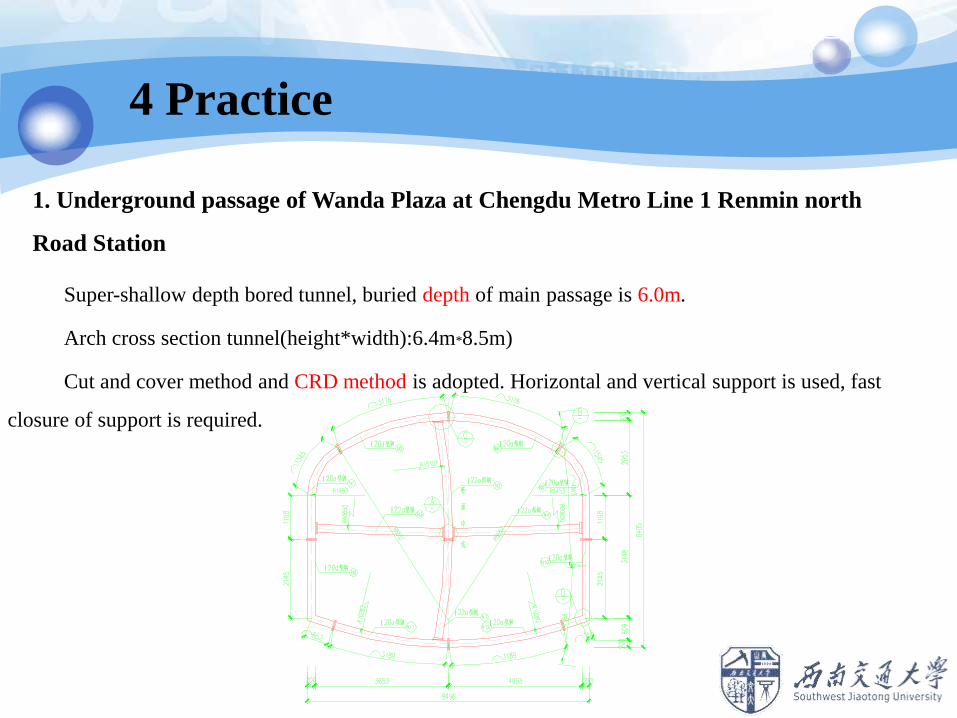
Super-shallow depth bored tunnel, buried depth of main passage is 6.0m.
Arch cross section tunnel(height*width):6.4m*8.5m)
Cut and cover method and CRD method is adopted. Horizontal and vertical support is used, fast
closure of support is required.
1. Underground passage of Wanda Plaza at Chengdu Metro Line 1 Renmin north
Road Station
4 Practice

63
The ground is crowded.
Underground passage of Wanda Plaza at Chengdu Metro Line 1 People
North Road Station

64
Steel stress measurement removing support-Section 1

65
Steel stress measurement removing support-Section
2

66
Steel stress measurement removing support-Section
3

67
The maximum stress increment is 7.8~10.0 MPa,
total stress is 11.6~13.8MPa, it is much less than the
design strength value of steel bracelet (188MPa).
Steel Arch could offer support to keep the
surrounding rock-supporting system in balance state.
Steel stress measurement removing support

68
Internal force diagram

69
Suggesting to remove all of
steel support through
numerical analysis
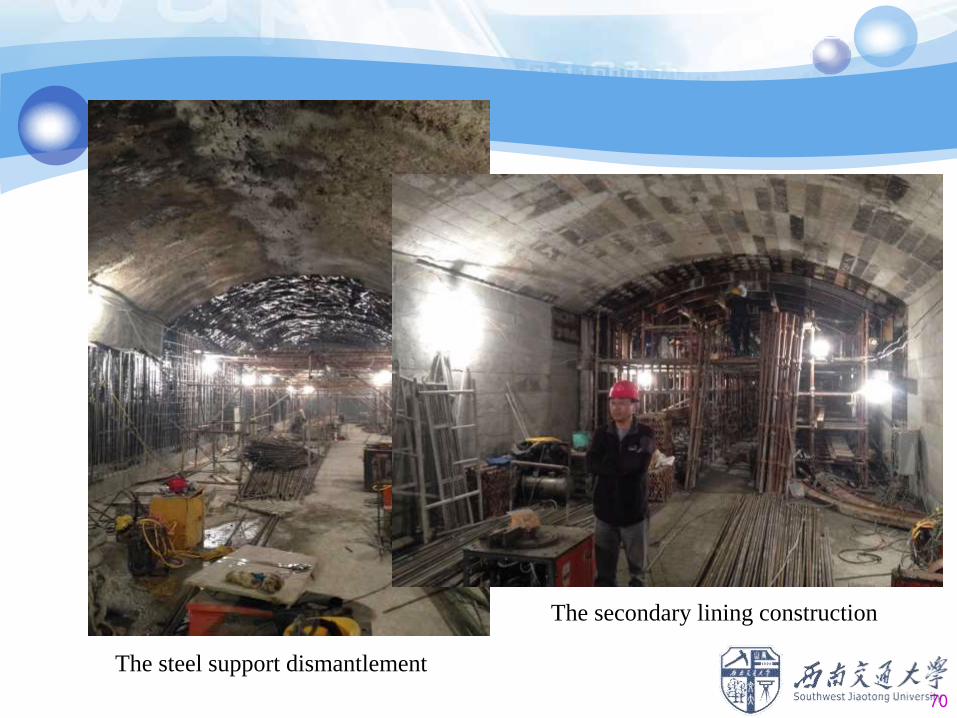
70
The steel support dismantlement
The secondary lining construction

2. Free way passing through Wenxiang Tunnel
350km/h double-track railway tunnel.
Upper ground on the top of the tunnel is flat.
The buried depth is only 11m at the overlap section. Angle between High speed railway
tunnel and free way is 15°34’12’.
Existing Highway
New Highway
Wenxiang
Tunnel

Soil Parameters
Stratum soil state
density Water
content
Void
ratio
saturabili
ty
Liquid
limit
Plastic
limit
Plastic
index
Liquidity
index
Dry
density
g/cm3
% e % WI WP IP IL
g/cm3
<1-3> Sandy
loess loose 1.5 / / / / / / / /
<2-1>
Sandy
loess loose 1.49 9.08 0.97 22.44 26.3 17.1 9.2 -0.78 1.37
<2-2>
Sandy
loess
Slight
dense 1.5 8.26 0.96 24.34 27.1 17.85 9.25 -1.02 1.38
<2-3>
Sandy
loess
Mediu
m
dense
1.73 10.5 0.72 41 25.94 17.08 8.86 -0.8 1.6

To ensure safety, 30cm of arch structure or a 80m span
bridge is required. The two scheme is conservative. Here, we
carry out 3 protecting method.

None Protecting
Arch protecting
Pile and arch protecting

Shear strengthening reduction method is used and overload of automobile is
considered as 480kPa:
Factor of Safety for 3 Protect Ways
Case Before
construction
Largest
excavation
time
Normal
load Overload
Factor of
Safety
None protect DK298+834 10 8 9 8
DK298+790 10 7 10 9
Arch protect DK298+834 10 6 12 12
DK298+790 10 6 12 12
Pile and arch
protect / 10 ≤6 ≥12 ≥12
None protect structure scheme is selected and construction of free way is
completed. Free way is now in operation.

FoS with excavation depth variation FoS with filling depth variation


Stress Variation in Site

3. Stability analysis for Slight Inclined Stratum
(1)Numerical simulation based on homogenous hypotheis
250m depth, plane strain model, only gravitational stress is
considered. Solid element is adopted as rock mass. Mohr-coulomb is
selected as constitutive model.
Rock mass Density/k
N/m3
Elastic
modulus/
Gpa
Poisson
ratio/ν
Internal friction
angle
Sandstone 21 0.2 0.25 40
Mudstone
with
sandstone
19 0.06 0.25 35
Sandstone
with shale 20 0.1 0.25 35
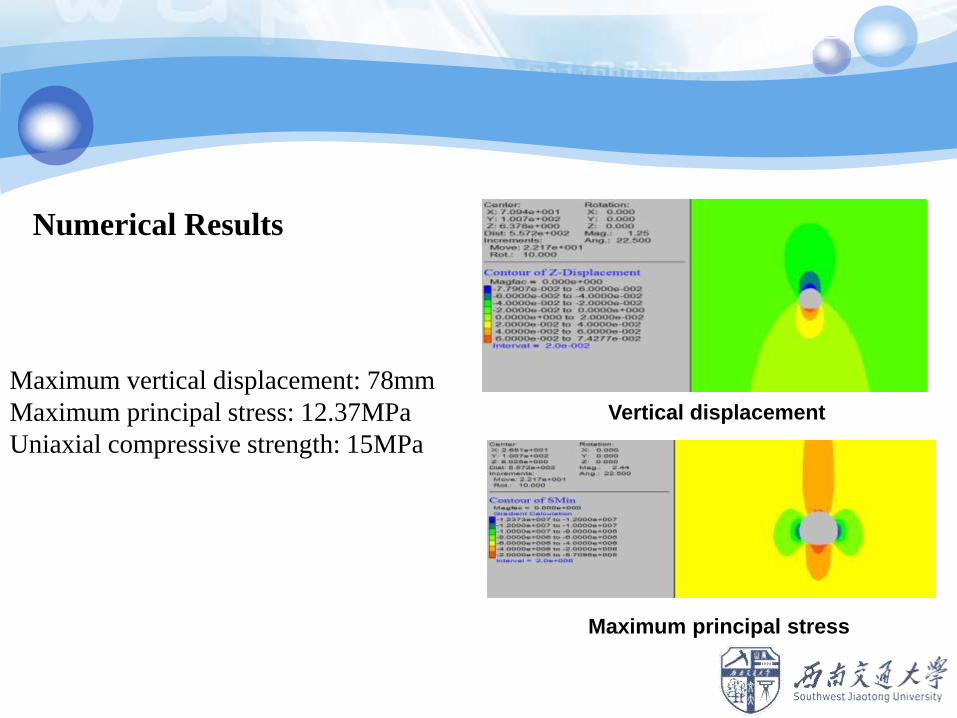
Numerical Results
Maximum vertical displacement: 78mm
Maximum principal stress: 12.37MPa
Uniaxial compressive strength: 15MPa
Vertical displacement
Maximum principal stress

Numerical Results
FoS(SSR): 3.01
Rock mass would be stability.
No stress-induced damage would
happen.
Shear strain increment
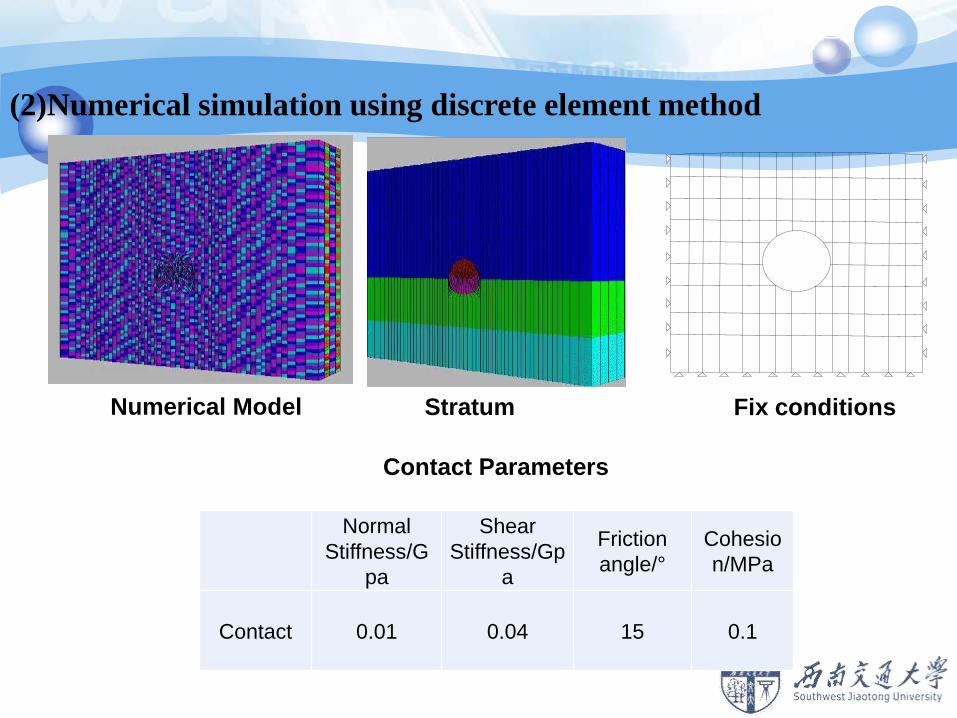
(2)Numerical simulation using discrete element method
Numerical Model Stratum Fix conditions
Normal
Stiffness/G
pa
Shear
Stiffness/Gp
a
Friction
angle/°
Cohesio
n/MPa
Contact 0.01 0.04 15 0.1
Contact Parameters

Numerical Results
This kind of structural plane distribution would lead to structurally controlled
gravity-driven rock mass falls-of-ground.
Displacement
6000 time step 7000 time step 8000 time step
9000 time step 10000 time step 12000 time step

Experiment design
(1)Using brick to develop a horizontal stratum rock mass model.
(2)First support by jack, then remove it.
Experiment Model

FDM and DEM Results Comparison
(1) In homogenous medium, unlined tunnel is proved to be stable. FoS is 3.01
which means stress-induced damage would not happen.
(2) In horizontal stratum with moderate fractured rock mass, structurally-
controlled gravity driven process leading to wedge fall-of-ground would happen.

Results Analysis
Without support, Instable part would fall, other brick could be stable.
Friction force balances gravity.

4. Wumeng Mount Tunnel (A four-track railway station in
large span tunnel)
Wumeng II tunnel, 12.26km length, design speed of train 160Km/h.
According to transport capacity requirement, a four line railway station railway is needed.

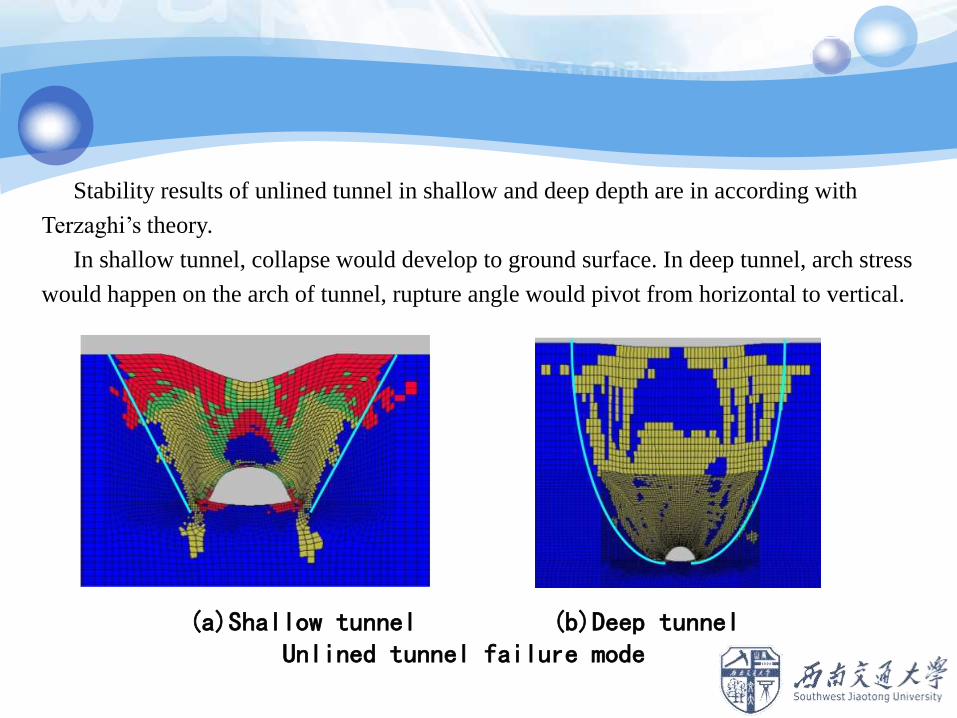
Stability results of unlined tunnel in shallow and deep depth are in according with
Terzaghi’s theory.
In shallow tunnel, collapse would develop to ground surface. In deep tunnel, arch stress
would happen on the arch of tunnel, rupture angle would pivot from horizontal to vertical.
(a)Shallow tunnel (b)Deep tunnel Unlined tunnel failure mode

Shallow tunnel section(depth≤50m)
Construction Method
Side wall pilot with temporary support turning to anchor method is
adopted. It would efficiently control displacement of structure. It allows
first support then excavate (Excavate with protect from secondary lining).

‘Anchor replacing support’3 bench method is adopted.
Deep tunnel section(Depth>50m)

Optimizing:
①Anchor replacing
②Side wall pilot→3 bench
③Vertical support doesn’t come to bottom,
anchor repalcing advance
④Elimination of horizontal support on arch
foot and side wall
⑤Unequal paramters
Pre-design Elimination of
Anchor
+
+
modification Anchor replacing
Deep tunnel section
Elimination of Anchor
Unequal parameter
Elimination of Anchor
Unequal parameter

Pressure of surrounding rock monitoring
Rock mass and preliminary lining pressure(Shallow section)

Pressure of surrounding rock monitoring
Rock mass and preliminary lining pressure(Deep section)

Pressure of surrounding rock monitoring
Rock mass and preliminary lining pressure distribution (kPa)
Shallow tunnel section Deep tunnel section

Anchor force monitoring
Axial force-Time of Anchor (shallow tunnel section) Spot distribution

测点布置
Anchor force monitoring
Axial force-Time of Anchor (Deep tunnel section)

No. Value
MS-Z 294kN
MS-Y 332kN
Axial Force of Anchor(shallow tunnel section)
No. Value No. Value
1 355kN 5 407kN
2 370kN 6 236kN
3 239kN 7 404kN
4 421kN 8 306kN
Anchor force monitoring
Axial Force of Anchor(deep tunnel section)

Summary
1. Difficult (D) and Easy (E) space exist.
2. Force on anchor and Pressure on brace are
both small. Capacity of rock mass is good,
stability of tunnel could be ensured.

1. Shotcrete and steel band
(a) Hyperbola shape and (b) smooth shape of steel band.
Thickness of steel band could be 5cm, 8cm or 10cm; Thickness of shotcrete
could be 5cm, 10cm, 15cm; 1 hour shotcrete strength should no less than
5MPa, 24 hour shotcrete strength should no less than 10MPa.
(a) Hyperbola curve
Single lining
5 Exploration

1.Shotcrete and steel band
Single lining
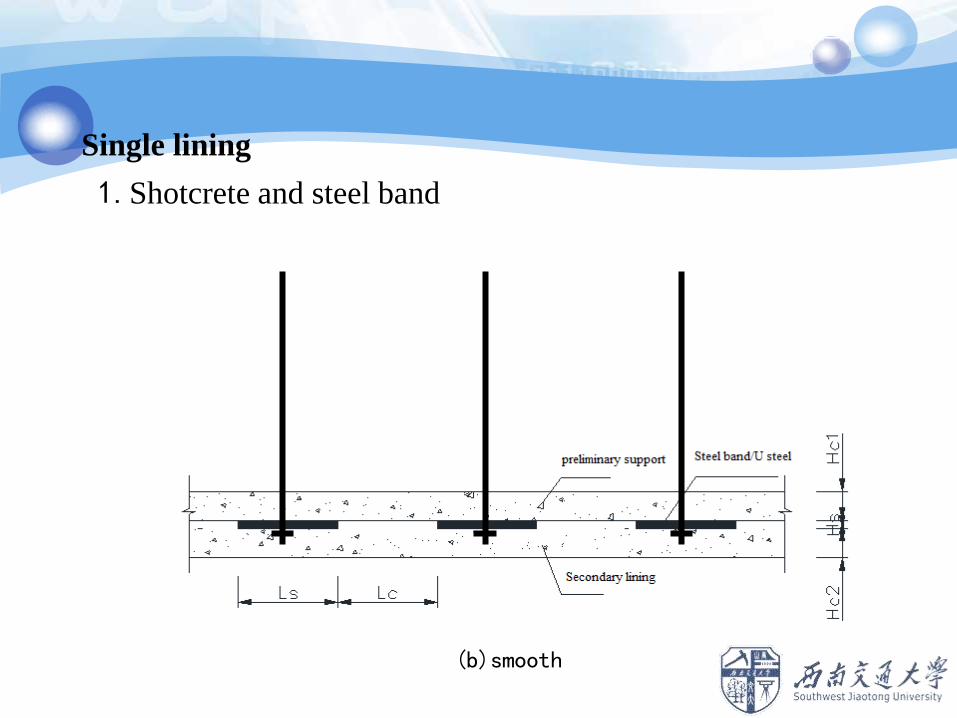
1.Shotcrete and steel band
(b)smooth
Single lining

2. Steel pipe arch and shotcrete
Single lining
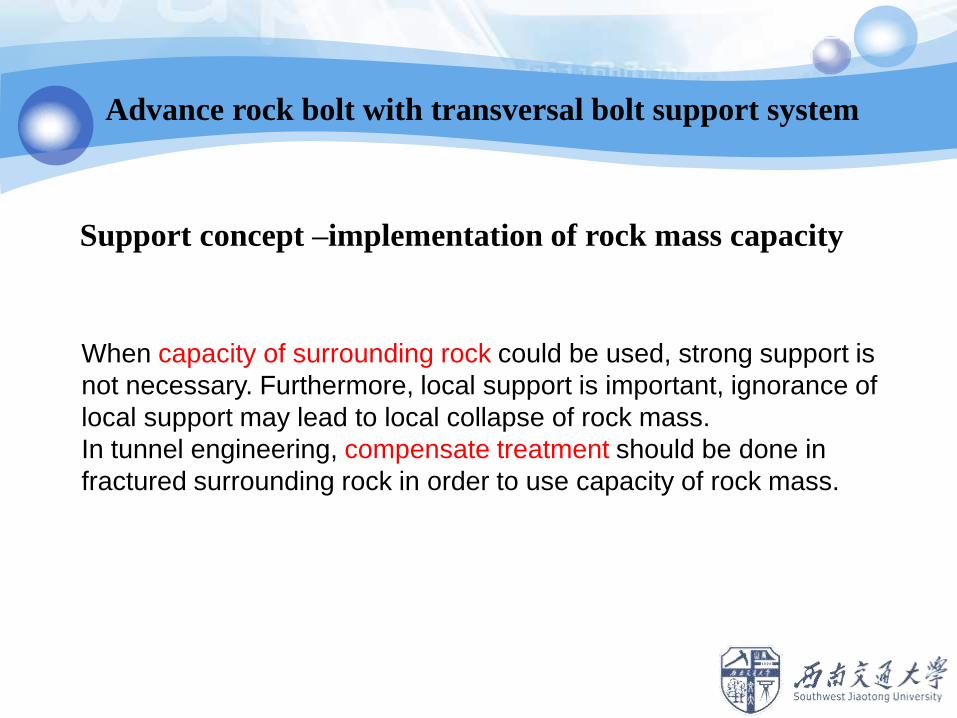
Support concept –implementation of rock mass capacity
When capacity of surrounding rock could be used, strong support is
not necessary. Furthermore, local support is important, ignorance of
local support may lead to local collapse of rock mass.
In tunnel engineering, compensate treatment should be done in
fractured surrounding rock in order to use capacity of rock mass.
Advance rock bolt with transversal bolt support system

Advance longitudinal rock bolt with transversal bolt support
system
For broken surrounding rock, advance
support is needed. And w steel band is
adopted to offer a stand for advance
support. Last, transversal bolt is used
to organize broken rock mass, to put
them into an intact pack of rock mass.

Circle Cross section
Trapezoid cross section
New type of support exploration
-broken rock/cobble in gabion material cage lining


F
S
JsfWi
iis
3106.37
E
hrd
Eh
rPdrrPrdrPW
22
0
322
0
2
0
2
JWc
31029.0
For same volume of RC lining, when it damages, external force would do work of amount:
6.129c
s
W
WSteel cage and RC lining energy absorption ratio:
(10e2 level)

Geometrical scale: 1:5
Lining diameter: 2m
Length of tunnel: 2m

Static conditions
Depth
0.5m
1.0m
1.5m
1.75m

Displacement and Pressure
Circle Cross-section Steel cage
Trapezoid Cross-section Steel cage
RC lining
depth
Arch displace
ment (mm)
Arch pressure (kPa)
0.5m 0.244 11
1.0m 0.499 23
1.5m 0.754 44
1.75m 1.009 56
depth
Arch displace
ment (mm)
Arch pressure (kPa)
0.5m 1.7 10
1.0m 3 18
1.5m 10 27.8
1.75m 26 31.68
depth
Arch displace
ment (mm)
Arch pressure (kPa)
0.5m 0.84 12
1.0m 1.31 29
1.5m 1.5 51
1.75m 3.77 57
Static conditions

Displacement-depth curve
Static conditions

Compressive stress-depth curve
Static conditions
Circular broken
rock/cobble in gabion
material cage lining
Trapezoid broken
rock/cobble in
gabion material
cage lining

Lining type Steel consumption
(kg)
1 RC lining 259.84
2 Circular broken rock/cobble in
gabion material cage 95.27
3 Trapezoid broken rock/cobble
in gabion material cage 75.15
Steel consumption comparison

Thank you!