Embed Size (px)
Citation preview

1©2016 IBM Corporation

2©2016 IBM Corporation
Financial OverviewMartin Schroeter
Senior Vice Presidentand Chief Financial Officer
IBMInvestorBriefing2016
2©2016 IBM Corporation

3©2016 IBM Corporation
Agenda
IBM Continuous Transformation
01Unit Focus• Software• Global Business Services
02Segments & IBM Model
03

4©2016 IBM Corporation
IBM Continuous Transformation
Last 10 Years ($9B) (1%) CAGR
Divestitures (~$13B) (~1.5pts)
Acquisitions ~$8B <1pt
Currency (~$5B) (>0.5pts)
Last 5 Years ($16B) (4%) CAGR
Divestitures (~$7B) (~1.5pts)
Acquisitions ~$4B <1pt
Currency (~$10B) (>2pts)
Key Drivers
2005 2006 2007 2008 2009 2010 2011 2012 2013 2014 2015
Revenue GP%
$91B $82B
40%
51%
Notes 1,2

5©2016 IBM Corporation
19% 19%26%
-2% -1% -1%
-7% -7% -11%
2013 2014 2015
Strategic Imperatives Total IBM Core Content
Performance Dynamics
Strategic Imperatives revenue mix:
2015 Gross Profit Margin
22% 35%27%
Revenue growth Yr/Yr
Strategic Imperatives: 53%
IBM: 51%
Core Content: 50%
Revenue Yr/Yr @CC from Continuing Ops; excluding divested businessesNote 3

6©2016 IBM Corporation
Strategic Imperatives Capabilities and Investments
New Capabilities
Analytics
Cloud
Engagement
>$6B Investment13 Acquisitions
200K Developers & 1,500 Partners
>$7B Investment 15 Acquisitions
46 Cloud Datacenters 1M Bluemix users
$3B Investment6 Acquisitions
~10K Mobile, Social, Security specialists
Reinventing the CoreOver the last 3 years
IBM Digital Practice
Hybrid Cloud
Investment = Development + Capex + Acquisition spendDevelopers include data scientists

7©2016 IBM Corporation
Over the last 10 years
Gross Profit Margin Performance
2005 Software Services Hardware /Other
as-a-Servicebuild out
2015
40%
51%
~5pts
~4pts(<1/2pt)~2pts
Note 2

8©2016 IBM Corporation
Gross Profit Margin Performance
2005 Software Services Hardware /Other
as-a-Servicebuild out
2015
40%
51%
~5pts
~4pts(<1/2pt)~2pts
Note 2

9©2016 IBM Corporation
Pre-tax Income
2005 2006 2007 2008 2009 2010 2011 2012 2013 2014 2015
Pre-tax Income Margin %
$13B
$18B
14%
22%
Last 10 Years ~$5B
Software & Services >$5B
Hardware (~$1.5B)
Currency <$1B
Last 5 Years (~$2.5B)
Hardware (>$1B)
Currency (<$1B)
Key Drivers
Note 4
10©2016 IBM Corporation
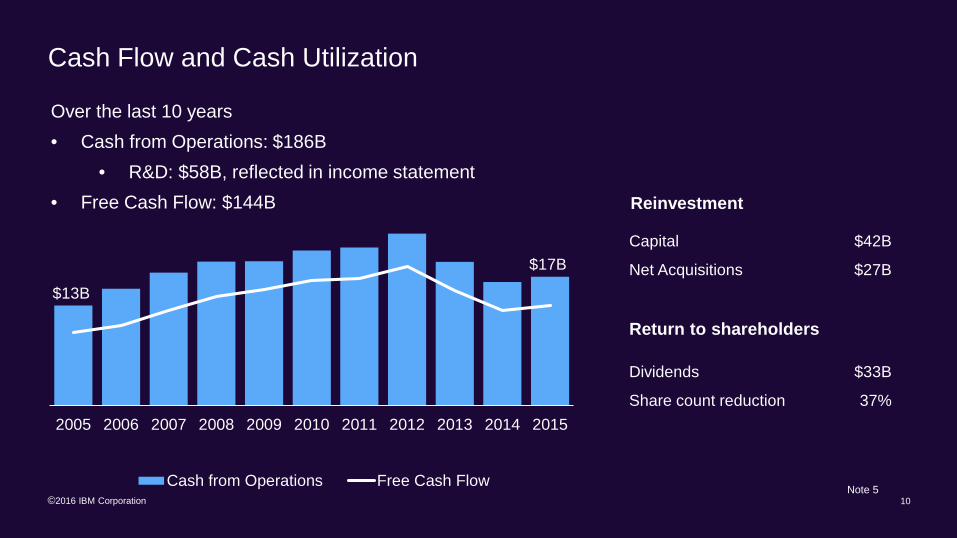
Cash Flow and Cash Utilization
Over the last 10 years• Cash from Operations: $186B
• R&D: $58B, reflected in income statement• Free Cash Flow: $144B Reinvestment
2005 2006 2007 2008 2009 2010 2011 2012 2013 2014 2015
Cash from Operations Free Cash Flow
$13B
$17BCapital $42B
Net Acquisitions $27B
Dividends $33B
Share count reduction 37%
Return to shareholders
Note 5

11©2016 IBM Corporation
~80% of IBM revenue is from clients who have deployed cross-IBM solutions
Industry Services
Technology Services
Security
Cognitive, Analytics, Data
Cloud / Systems
Partn
ersh
ips
Wat
son
Hea
lth
Wat
son
Inte
rnet
of T
hing
s
IBM Capabilities

12©2016 IBM Corporation
IBM Continuous Transformation Summary
• Significant IBM transformation over the last 10 years
• Stable revenue performance• Divested lower margin businesses
• Invested for higher value
• Cash flow supports both reinvestment and return to shareholders
Longer-term financial model
• Low single-digit revenue growth
• Mid single-digit pre-tax income growth
• High single-digit EPS growth withreturn to shareholders
• Free Cash Flow realization in the 90%’s

13©2016 IBM Corporation
02Unit Focus

14©2016 IBM Corporation
2015 Revenue by Segment
28%
21%
39%
9%2%
Global Technology Services1% Yr/Yr
Systems Hardware8% Yr/Yr
Global Financing2% Yr/Yr
Software(4%) Yr/Yr
Global Business Services(4%) Yr/Yr
Impacted by flexibility provided to clients
Engineered shift to Strategic Imperatives
Declined in 2015 Grew in 2015
$81.7B
Revenue Yr/Yr @CC from Continuing Ops; excluding divested businesses

15©2016 IBM Corporation
Software Flexibility Dynamics
• Individual product purchases and usage limits• Subscription & Support payment based on
full license deployment• Deployment model by country
Limited Flexibility High Flexibility
• Purchase provides access to a broad catalog• Subscription & Support payment based on
actual license deployment• Global deployment model
Software transaction performance impacted by flexibility provided to clients
• Annuity driven by deployment of licenses after the first year
• Licenses in use can grow without additional transactional revenue
Features of a high flexibility model
• Broader access to a catalog of products drives flexibility
• Tend to be larger clients with large transaction sizes

16©2016 IBM Corporation
2015 Software Performance
Revenue Yr/Yr @CC
Driven by deployment
Growth across the client base —Top 250 & Non-Top 250 ClientsIn aggregate, Top 250 clients’
revenue impacted by flexibility• >70% of the most flexible
contracts with the Top 250 clients
Non-Top 250 clients’ revenue growing low single digits
Transactional Revenue(14%) Yr/Yr Software Revenue
Annuity Revenue+1% Yr/Yr
~75%
~15%
~10%
Transactional—Top 250 clients
Transactional—Non-Top 250 clients
Annuity

17©2016 IBM Corporation
Engineered Shift: +15pts of mix
Global Business Services Transformation
70%55%
30%45%
Revenue Mix
2014 2015
Strategic Imperatives +44% Yr/YrCore Content (25%) Yr/Yr
2015 Revenue Yr/Yr
Strategic Imperatives
Core Content
$1.0B
($1.7B)
Total (~$0.8B)
Adjusted for currency
• Driving engineered shift to Strategic Imperatives
• Supported by aggressive skills shift
• Activity declining in traditional consulting areas
Consulting
Application Management
• Longer term nature of engagements drives stable performance
+30K Resources over the last 2 years• Re-skill / up-skill• Hiring• Attrition
Revenue Yr/Yr @CC from Continuing Ops; excluding divested businesses

18©2016 IBM Corporation
Unit Focus Summary
• 2015 software transactional performance impacted by additional flexibility
• Stable annuity revenue
• Enables long term client commitment to the platform
• Global Business Services performance driven by engineered shift to growth opportunities in consulting

19©2016 IBM Corporation
03Segments & IBM Model

20©2016 IBM Corporation
2016 Segment Structure
Global Technology Services
• Key Branded Middleware• Other Middleware• Operating Systems
Global Business Services
Software
Systems Hardware
Global Financing
2015 Structure

21©2016 IBM Corporation
2016 Segment Structure
Global Technology Services
• Key Branded Middleware• Other Middleware• Operating Systems
Global Business Services
Software
Systems Hardware
Global Financing
2015 Structure
• Solutions Software• Transaction Processing Software• Integration Software• Operating Systems
Software
Software valueshifting to new areas

22©2016 IBM Corporation
2016 Segment Structure2016 structure reflective of management system and consistent with IBM’s Platform & Solutions focus
Cog
nitiv
e So
lutio
ns &
In
dust
ry S
ervi
ces
• Systems Hardware• Operating Systems
• Global Technology Services• Integration Software
Technology Services & Cloud Platforms
Cognitive Solutions
Systems
Global Financing
2016 Structure
• Solutions Software• Transaction Processing Software
Global Business Services
Global Technology Services
• Key Branded Middleware• Other Middleware• Operating Systems
Global Business Services
Software
Systems Hardware
Global Financing
2015 Structure
• Solutions Software• Transaction Processing Software• Integration Software• Operating Systems
Software
Software valueshifting to new areas

23©2016 IBM Corporation
2016 Segment Disclosures
Global Business Services
• Consulting• Application Management• Global Process Services
Cognitive Solutions
Systems
Global Financing
New Segments
• Solutions Software• Transaction Processing
Software
• Systems Hardware• Operating Systems
RevenueDetails
Gross Profit Details
Additional Revenue Disclosures
• Total
• Total • Hardware• Software
• Total
• Total • Total
Cog
nitiv
e So
lutio
ns &
In
dust
ry S
ervi
ces
Pre-tax Income Details
• Total
• Total
• Total
• Total
• Strategic Imperatives• Cloud• as-a-Service run rate
• Strategic Imperatives• Cloud• as-a-Service run rate
• Strategic Imperatives• Cloud
• Not applicable
IBM – Additional Revenue Disclosures• Total Software• Total Strategic Imperatives, Analytics, Cloud, as-a-Service run rate, Security, Mobile, Social
Technology Services& Cloud Platforms
• Infrastructure Services• Technical Support Services• Integration Software
• Total • Services• Software
• Strategic Imperatives• Cloud• as-a-Service run rate
• Total

24©2016 IBM Corporation
New Segments: 2015 Results
Global Business Services
Cognitive Solutions
Systems
Global Financing
New Segments RevenueAdditional Revenue
Disclosures
Cog
nitiv
e So
lutio
ns &
In
dust
ry S
ervi
ces
Pre-tax Income, Margin
$17.2B
$17.8B
$9.5B
$1.8B
$2.6B, 14.7%
$7.2B, 36.1%
$1.7B, 16.7%
$2.4B, 52.8%
Strategic Imperatives: $7.7BCloud: $1.8Bas-a-Service run rate: $0.7B
Strategic Imperatives: $11.0BCloud: $1.4Bas-a-Service run rate: $1.2B
Strategic Imperatives: $4.0BCloud: $3.0B
Technology Services& Cloud Platforms
$35.1B $5.7B, 15.8%Strategic Imperatives: $6.3BCloud: $4.0Bas-a-Service run rate: $3.5B

25©2016 IBM Corporation
IBM Level Disclosures: 2015 Results
RevenueAdditional Revenue
DisclosurePre-tax Income,
Margin
$81.7B $17.7B, 21.6%Strategic Imperatives: $28.9BCloud: $10.2Bas-a-Service run rate: $5.3BSoftware: $24.5B
$28.9BAnalytics
~$18BCloud~$10B
Engagement~$6B
Mobile: ~$3BSocial: ~$1BSecurity: ~$2B
Strategic Imperatives

26©2016 IBM Corporation
Strategic Imperatives & Core Content Revenue by Segment
2015
$17.2B (4%) Yr/Yr
~55%
~45%
2015
$17.8B (3%) Yr/Yr
~40%
~60%
Revenue Yr/Yr @CC from Continuing Ops; excludes divested businesses
2015
$35.1B Flat Yr/Yr
~80%
~20%
2015
$9.5B 4% Yr/Yr
~60%
~40%
Strategic Imperatives Core Content
Technology Services & Cloud Platforms
• Strategic Imperatives driven by Infrastructure-as-a-Service –Public, Private and Hybrid Cloud offerings
Systems
• Hardware platforms repositioned for evolving client needs
• Mainframe for Mobile, Analytics, Cloud, Power for Linux, OpenPOWER, Flash & Object Storage
Cognitive Solutions
• Cognitive capabilities underpins Solutions software
• New industry opportunity –Health, Internet of Things, Education
Global Business Services
• Engineered shift to Strategic Imperatives
• Resource shift aligned with market opportunity
Note 6

27©2016 IBM Corporation
Strategic Imperatives & Core Content Revenue by Segment
2015
$17.2B
~55%
2015
$17.8B
~40%
+4pts
+15pts~45%
~60%
2015
$35.1B
~80%
2015
$9.5B
~60%
+7pts
+15pts
~20%
~40%
Strategic Imperatives Core Content
Technology Services & Cloud Platforms
• Strategic Imperatives driven by Infrastructure-as-a-Service –Public, Private and Hybrid Cloud offerings
Systems
• Hardware platforms repositioned for evolving client needs
• Mainframe for Mobile, Analytics, Cloud, Power for Linux, OpenPOWER, Flash & Object Storage
Cognitive Solutions
• Cognitive capabilities underpins Solutions software
• New industry opportunity –Health, Internet of Things, Education
Global Business Services
• Engineered shift to Strategic Imperatives
• Resource shift aligned with market opportunity
Note 6

28©2016 IBM Corporation
Strategic Imperatives & Core Content Revenue by Segment
2015
Strategic Imperatives Core Content Annuity
~55%
~45%
2015
~40%
~60%~75%
annuity
~30%annuity
$17.2B
$17.8B
2015
~80%
~20%
2015
~60%
~40%
~80%annuity
~15%annuity
$35.1B
$9.5B
Technology Services & Cloud Platforms
• Strategic Imperatives driven by Infrastructure-as-a-Service –Public, Private and Hybrid Cloud offerings
• Significant and stable annuity content
Systems
• Hardware platforms repositioned for evolving client needs
• Mainframe for Mobile, Analytics, Cloud, Power for Linux, OpenPOWER, Flash & Object Storage
• Operating systems drives annuity content
Cognitive Solutions
• Cognitive capabilities underpins Solutions software
• New industry opportunity –Health, Internet of Things, Education
• Significant and stable annuity content
Global Business Services
• Engineered shift to Strategic Imperatives
• Resource shift aligned with market opportunity
• Annuity content driven by Outsourcing activity
Note 6

29©2016 IBM Corporation
Cognitive Solutions Segment
Transaction Processing
Software(8%) Yr/Yr
2015 Performance 2015 Yr/Yr
Revenue $17.8 (3%)
Gross Margin 85.1% (2 pts)
PTI $7.2 (12%)
PTI Margin 36.1% (1 pt)
• Cognitive capabilities significantly expand market opportunity
• Building platforms for Watson, Watson Health and Watson Internet of things
2015 Strategic Imperatives Revenue
Revenue Yr/Yr
Strategic Imperatives $11.0 4%
Cloud $1.4 52%
as-a-Service run rate $1.2 $0.2
Revenue Yr/Yr @CC$ in billionsFor reconciliation to GAAP, refer to the Non-
GAAP Supplemental Materials
Solutions SoftwareFlat Yr/Yr
Segment Revenue Elements

30©2016 IBM Corporation
Global Business Services Segment
Application Management
+1% Yr/Yr
Consulting (8%) Yr/Yr
2015 Performance 2015 Yr/Yr
Revenue $17.2 (4%)
Gross Margin 28.2% (2 pts)
PTI $2.6 (22%)
PTI Margin 14.7% (2 pts)
Global Process Services (7%) Yr/Yr
Revenue Yr/Yr @CC from Continuing Ops; excluding divested businesses$ in billionsFor reconciliation to GAAP, refer to the Non-
GAAP Supplemental Materials
• Industry centric skills, depth of design thinking drives client value
• Lead with cognitive capabilities across offerings
Revenue Yr/Yr
Strategic Imperatives $7.7 44%
Cloud $1.8 83%
as-a-Service run rate $0.7 $0.5
2015 Strategic Imperatives RevenueSegment Revenue Elements

31©2016 IBM Corporation
2015 Performance 2015 Yr/Yr
Revenue $35.1 Flat
Gross Margin 42.7% (2 pts)
PTI $5.7 (20%)
PTI Margin 15.8% (2 pts)
Technology Services & Cloud Platforms Segment
Technical Support Services
+1% Yr/Yr
Infrastructure Services
+1% Yr/Yr
GTS +1%
Revenue Yr/Yr @CC from Continuing Ops; excluding divested businesses$ in billionsFor reconciliation to GAAP, refer to the Non-
GAAP Supplemental Materials
• Transforming GTS model from systems integration to services integration
• Enabling clients digital transformation through the cloud – Hybrid, Private, Public
• Software enabled to integrate with cloud platforms
Segment Revenue Elements
Revenue Yr/Yr
Strategic Imperatives $6.3 59%
Cloud $4.0 59%
as-a-Service run rate $3.5 $1.1
2015 Strategic Imperatives Revenue
Integration Software(2%) Yr/Yr

32©2016 IBM Corporation
Systems Segment
Systems Hardware+8% Yr/Yr
+35% Yr/Yr+4% Yr/Yr(7%) Yr/Yr
2015 Performance 2015 Yr/Yr
Revenue $9.5 4%
Gross Margin 55.8% 7 pts
PTI $1.7 24%
PTI Margin 16.7% 6 pts
Revenue Yr/Yr @CC from Continuing Ops; excluding divested businesses$ in billionsFor reconciliation to GAAP, refer to the Non-
GAAP Supplemental Materials
• Transforming Systems for growth –IBM OpenPOWER, IBM FlashSystem, IBM Spectrum Storage, Object Storage for cloud
• New cognitive and cloud centric capabilities
Revenue Yr/Yr
Strategic Imperatives $4.0 41%
Cloud $3.0 45%
as-a-Service run rate $0 -
2015 Strategic Imperatives RevenueOperating Systems(8%) Yr/Yr
Segment Revenue Elements
z Systems:Power:
Storage:

33©2016 IBM Corporation
Systems Hardware Transformation
Power z Systems Storage
Strategic ImperativesCore Content
~40% ~60%2015 ~55% ~45%2015 ~45% ~55%2015
Open innovation platform with Power8, Power for Linux, OpenPOWER
z13 Mainframe designed for mobile, analytics
and cloud
FlashSystem, Object Storage
Note 6

34©2016 IBM Corporation
IBM Financial Model
• 2016 segment structure reflective of management system and consistent with IBM’s platform and solutions focus
• Significant investment levels over the last couple of years to drive returns in the future
Longer-term financial model
• Low single-digit revenue growth
• Mid single-digit pre-tax income growth
• High single-digit EPS growth withreturn to shareholders
• Free Cash Flow realization in the 90%’s

35©2016 IBM Corporation

36©2016 IBM Corporation©2016 IBM Corporation 36
The company reaffirms 2016 Operating Earnings and Free Cash Flow guidance, including the quarterly earnings skew, as described in the January 2016 earnings call.
2016 Guidance
As discussed, not presented

37©2016 IBM Corporation©2016 IBM Corporation
Notes
Note 12010-2015 Revenue from Continuing Ops
Note 22006-2015 Operating GP%, 2010-2015 from Continuing Ops
Note 3Operating GP% from Continuing Ops - Strategic Imperatives & Core content margins are approximate
Note 42005-2015 Operating PTI, 2010-2015 from Continuing Ops
Note 5Cash from Operations excludes GF receivables. Share count reduction 2006 to 2015, reflects weighted average shares outstanding.RDE 2010-2015 from Continuing Ops
Note 6Strategic Imperatives & Core content revenue mix,mix points represents Yr/Yr change in mix

38©2016 IBM Corporation
These charts and the associated remarks and comments are integrally related, and they are intended to be presented and understood together.
In an effort to provide additional and useful information regarding the company’s financial results and other financial information as determined by generally accepted accounting principles (GAAP), certain materials presented during this event include non-GAAP information. The rationale for management’s use of this non-GAAP information, the reconciliation of that information to GAAP, and other related information is included in supplemental materials entitled “Non-GAAP Supplemental Materials” that are linked to the company’s investor relations web site at http://www.ibm.com/investor/events/investor0216.html. The Non-GAAP Supplemental Materials are also included as Attachment II to the company’s Forms 8-K dated January 19, 2016 and Attachment I to the company’s Form 8-K dated February 25, 2016.

39©2016 IBM Corporation 39©2016 IBM Corporation
Non-GAAP Supplemental Materials
IBMInvestorBriefing2016

40©2016 IBM Corporation
In an effort to provide investors with additional information regarding the company's results as determined by generally accepted accounting principles (GAAP), the company also discusses, in its Investor Briefing materials and presentations, the following Non-GAAP information which management believes provides useful information to investors.
Operating (Non-GAAP) and Related Income Statement ItemsManagement presents certain financial measures from continuing operations excluding the effects of certain acquisition-related charges, non-operating retirement-related costs and any related tax impacts. Management uses the term "operating" to describe this view of the company's financial results and other financial information. For acquisitions, these measures exclude the amortization of purchased intangible assets and acquisition-related charges such as in-process research and development, transaction costs, applicable restructuring and related expenses, and tax charges related to acquisition integration. For retirement-related costs, the company has characterized certain items as operating and others as non-operating. The company includes service cost, amortization of prior service cost and the cost of defined contribution plans in its operating results. Non-operating retirement-related costs include interest cost, expected return on plan assets, amortized actuarial gains/losses, the impacts of any plan curtailments/settlements, multi-employer plan costs, pension insolvency costs, and other costs. Non-operating costs primarily relate to changes in pension plan assets and liabilities which are tied to market performance, and management considers these costs to be outside the operational performance of the business. Management’s calculation of these operating measures, as presented, may differ from similarly titled measures reported by other companies.
Overall, management believes that providing investors with an operating view as described above provides increased transparency and clarity into both the operational results of the business and the performance of the company’s pension plans, improves visibility to management decisions and their impacts on operational performance, enables better comparison to peer companies, and allows the company to provide a long term strategic view of the business going forward. For its earnings per share guidance, the company is utilizing an operating view to establish its objectives and track its progress. The company’s segment financial results and performance reflect operating earnings, consistent with the company’s management and measurement system.
Non-GAAP Supplemental Materials

41©2016 IBM Corporation
Cash FlowManagement uses a free cash flow measure to evaluate the company’s operating results, plan share repurchase levels, evaluate strategic investments and assess the company’s ability and need to incur and service debt. The entire free cash flow amount is not necessarily available for discretionary expenditures. The company defines free cash flow as net cash from operating activities less the change in Global Financing receivables and net capital expenditures, including the investment in software. A key objective of the Global Financing business is to generate strong returns on equity, and increasing receivables is the basis for growth. Accordingly, management considers Global Financing receivables as a profit-generating investment, not as working capital that should be minimized for efficiency. Therefore, management includes presentations of both free cash flow and cash flow from operations that exclude the effect of Global Financing receivables.
Constant Currency Management refers to growth rates at constant currency or adjusting for currency so that certain financial results can be viewed without the impact of fluctuations in foreign currency exchange rates, thereby facilitating period-to-period comparisons of the company's business performance. Financial results adjusted for currency are calculated by translating current period activity in local currency using the comparable prior year period’s currency conversion rate. This approach is used for countries where the functional currency is the local currency. Generally, when the dollar either strengthens or weakens against other currencies, the growth at constant currency rates or adjusting for currency will be higher or lower than growth reported at actual exchange rates.
Customer Care Outsourcing and System x Business DivestituresWith respect to the sale of IBM's worldwide customer care outsourcing services business to SYNNEX, the initial closing date was January 31, 2014. With respect to the sale of IBM’s x86 server business to Lenovo, the initial closing date was October 1, 2014. Management believes that presenting financial information without either or both of these items is more representative of operational performance and provides additional insight into, and clarifies the basis for, historical and/or future performance, which may be more useful to investors.
Non-GAAP Supplemental Materials

42©2016 IBM Corporation
Non-GAAP Supplemental Materials
Reconciliation of Free Cash Flow (excluding GF Receivables)
$ Billions 2006 - 2015
Net Cash from Operations $181
Less: Global Financing Receivables (5)
Net Cash from Operations (excluding GF Receivables) 186
Net Capital Expenditures (42)
Free Cash Flow (excluding GF Receivables) $144
The above serves to reconcile the Non-GAAP financial information contained in “IBM Investor Briefing” contained in the “Financial Overview” presentation. For reconciliation to GAAP and other information, refer to FY 2015 non-GAAP measures of Gross Profit Margin from Continuing Operations, Pre-tax Income from Continuing Operations and Pre-tax Income Margin from Continuing Operations in Attachment II (Non-GAAP Supplemental Materials) in the Form 8-K submitted to the SEC on January 19, 2016. See the third slide in these supplemental materials for additional information on the use of these Non-GAAP financial measures.

43©2016 IBM Corporation
Non-GAAP Supplemental Materials
Reconciliation of Revenue Growth
GAAP @CC
@CC excl. Divested
Businesses GAAP @CC
@CC excl. Divested Businesses GAAP @CC
Strategic Imperatives 17% 24% 26% 16% 18% 19% 17% 19%
Total IBM (12%) (4%) (1%) (6%) (4%) (1%) (4%) (2%)
Core Content (22%) (15%) (11%) (12%) (10%) (7%) (9%) (7%)
FY15 Yr/Yr FY14 Yr/Yr FY13 Yr/Yr
The above serves to reconcile the Non-GAAP financial information contained in “IBM Investor Briefing” contained in the “Financial Overview” presentation. See the third slide in these supplemental materials for additional information on the use of these Non-GAAP financial measures.

44©2016 IBM Corporation
The above serves to reconcile the Non-GAAP financial information contained in “IBM Investor Briefing” contained in the “Financial Overview” presentation. See the third slide in these supplemental materials for additional information on the use of these Non-GAAP financial measures.
Non-GAAP Supplemental Materials
FY15 Yr/Yr GAAP @CC
Transactional (19%) (14%)
Annuity (6%) 1%
Reconciliation of Revenue Growth Software Performance

45©2016 IBM Corporation
The above serves to reconcile the Non-GAAP financial information contained in “IBM Investor Briefing” contained in the “Financial Overview” presentation.. See the third slide in these supplemental materials for additional information on the use of these Non-GAAP financial measures
Non-GAAP Supplemental Materials
FY15 Yr/Yr GAAP @CC
@CC excl. Divested
Businesses FY15 Yr/Yr GAAPAdjusted for
currency
Strategic Imperatives 32% 44% 44% Strategic Imperatives $0.5B $1.0B
Core Content (31%) (25%) (25%) Core Content ($1.9B) ($1.7B)
Cloud 71% 83% 83% Total ($1.4B) (~ $0.8B)
Reconciliation of Revenue Growth within Global Business Services Segment
Consulting

46©2016 IBM Corporation
The above serves to reconcile the Non-GAAP financial information contained in “IBM Investor Briefing” contained in the “Financial Overview” presentation. For reconciliation to GAAP and other information, refer to FY 2015 non-GAAP measures of Reconciliation of Revenue Growth by Segment in Attachment II (Non-GAAP Supplemental Materials) in the Form 8-K submitted to the SEC on January 19, 2016. See the third slide in these supplemental materials for additional information on the use of these Non-GAAP financial measures.
Non-GAAP Supplemental Materials
FY15 Yr/Yr GAAP @CC
@CC excl. Divested
Businesses FY15 Yr/Yr GAAP @CC
Technology Services & Cloud Platforms (10%) Flat Flat Cognitive Solutions (9%) (3%)
Systems (22%) (18%) 4%
Reconciliation of Revenue Growth by Segment

47©2016 IBM Corporation
The above serves to reconcile the Non-GAAP financial information contained in “IBM Investor Briefing” contained in the “Financial Overview” presentation. See the third slide in these supplemental materials for additional information on the use of these Non-GAAP financial measures.
Non-GAAP Supplemental Materials
FY15 Yr/Yr GAAP @CC
Strategic Imperatives (3%) 4%
Cloud 45% 52%
Reconciliation of Revenue Growth Cognitive Solutions Segment

48©2016 IBM Corporation
The above serves to reconcile the Non-GAAP financial information contained in “IBM Investor Briefing” contained in the “Financial Overview” presentation. See the third slide in these supplemental materials for additional information on the use of these Non-GAAP financial measures.
Non-GAAP Supplemental Materials
FY15 Yr/Yr GAAP @CC
@CC excl.Divested
Businesses
Strategic Imperatives 44% 59% 59%
Cloud 45% 59% 59%
Reconciliation of Revenue Growth Technology Services & Cloud Platforms Segment

49©2016 IBM Corporation
The above serves to reconcile the Non-GAAP financial information contained in “IBM Investor Briefing” contained in the “Financial Overview” presentation. See the third slide in these supplemental materials for additional information on the use of these Non-GAAP financial measures.
Non-GAAP Supplemental Materials
FY15 Yr/Yr GAAP @CC
@CC excl.Divested
Businesses
Strategic Imperatives 20% 27% 41%
Cloud 27% 35% 45%
Reconciliation of Revenue Growth Systems Segment

50©2016 IBM Corporation
Non-GAAP Supplemental MaterialsReconciliation of Revenue Growth
Integration SoftwareInfrastructure ServicesConsultingApplication ManagementSolutions SoftwareTransaction Processing SoftwareOperating Systems
GAAP(9%)
(10%)(15%)(8%)(6%)
(15%)(14%)
@CC (2%)1%
(8%)1%
Flat(8%)(8%)
Technical Support ServicesGlobal Process ServicesSystems Hardware
GAAP(10%)(15%)(24%)
@CC (1%)
(10%) (20%)
@CC excl. Divested
Businesses1%
(7%)8%
FY15 Yr/Yr
The above serves to reconcile the Non-GAAP financial information contained in “IBM Investor Briefing” contained in the “Financial Overview” presentation. For reconciliation to GAAP and other information, refer to FY 2015 non-GAAP measures of z Systems revenue at constant currency, Power revenue at constant currency and Storage revenue at constant currency, on page 33 of the company’s 2015 Annual Report, which is Exhibit 13 to the Form 10-K submitted to the SEC on February 23, 2016. See the third slide in these supplemental materials for additional information on the use of these Non-GAAP financial measures.
FY15 Yr/Yr

51©2016 IBM Corporation