Embed Size (px)
Citation preview

DOE/SC-ARM-16-056
2016 ANNUAL REPORT
Environmental Management

2 ARM Climate Research Facility ANNUAL REPORT – 20162 ARM Climate Research Facility ANNUAL REPORT – 2016

3
From the ARM Program Manager A Year of Progress Creating the Next-Generation ARM
In 2014, the Atmospheric Radiation Measurement (ARM) Climate Research Facility set forth a decadal vision to help ensure the next generation of climate researchers would have the measurements they need of cloud and aerosol properties and their impacts on Earth’s energy balance to continue to improve the scientific understanding of the atmosphere and the predictive capabilities of earth system models.
Fiscal year 2015 (FY2015) saw plans put in place to achieve the vision outlined in the Atmospheric Radiation Measurement Climate Research Facility Decadal Vision report. In FY2016, the ARM Facility made significant progress in implementing those plans. We are already starting to see results from combining ARM’s observational capabilities
with new high-resolution modeling capabilities, which makes us more confident than ever that the changes we are making will enhance ARM’s scientific impact.
This annual report showcases much of the progress that was made in implementing the Decadal Vision in FY2016, including:
• Completing the reconfiguration of the Southern Great Plains (SGP) atmospheric observatory in Oklahoma. Turning the SGP into a “megasite” required installing new instrumentation—some of it refurbished and redeployed from the former Tropical Western Pacific observatory. The added instrumentation will improve observations and data acquisition on temperature, water vapor, humidity, and wind in the planetary boundary layer. The reconfiguration was included in the Decadal Vision in response to user requests to enhance the scientific measurements relevant to understanding land-atmosphere interactions and shallow convection.
• Beginning routine collection of spatial information using unmanned aerial systems (UAS) and tethered balloon systems (TBS) at the North Slope of Alaska (NSA) observatory. The launch of the Inaugural Campaigns for ARM Research using Unmanned Systems, or ICARUS, an internal initiative at the third ARM Mobile Facility at Oliktok Point, Alaska, gathered data on surface radiation, heat fluxes, and vertical profiles of the basic atmospheric state (temperature, humidity, and horizontal wind), as well as turbulence, aerosol properties, and cloud properties. The routine TBS and UAS flights at Oliktok were identified as high-priority, short-term actions in both the 2013 Polar Research with Unmanned Aircraft and Tethered Balloons Workshop and the 2014 North Slope of Alaska Priorities Workshop.
• Releasing the first set of results from LASSO, or Large-Eddy Simulation (LES) ARM Symbiotic Simulation and Observation workflow, a two-year pilot project bringing measurements and models closer together by pairing ARM observations with LES output. Instead of researchers getting the measurements from ARM and then undergoing the laborious process of running their own models, atmospheric scientists can now access simulations that are pre-matched to the observational data sets, which provides a handy starting point for their research. LASSO is being developed with the input of the atmospheric science and climate modeling communities to ensure it meets researchers and models needs.
The Decadal Vision promised—and we are already starting to see the results—that the changes being implemented will result in even more comprehensive scientific data and the processes and tools for scientists to more easily use ARM data for climate model development. I’m excited to share our progress.
Sally McFarlane U.S. Department of Energy ARM Program Manager

4 ARM Climate Research Facility ANNUAL REPORT – 2016

5
6 Facility Overview7 The Importance of Clouds and Radiation
to Climate Change
8 ARM Climate Research Facility
10 Cooperation and Oversight Enable Success
11 Fiscal Year 2016 Budget Summary and Facility Statistics
12 Key Accomplishments13 Featured Field Campaigns
18 Campaign Results
22 Research Highlights
28 Infrastructure Achievements29 Site Operations
32 Data Advancements
34 Science Outreach
37 Field Campaign Summary
43 Value-Added Products
Table of CONTENTS

6 ARM Climate Research Facility ANNUAL REPORT – 20166 ARM Climate Research Facility ANNUAL REPORT – 2016
Facility OVERVIEW

7
The Importance of Clouds and Radiation to Climate Change The Earth’s surface temperature is determined in large part by the balance between incoming solar radiation and thermal (or infrared) radiation emitted by the Earth back to space. Changes in atmospheric composition, including greenhouse gases, clouds, and aerosols, can alter this balance and produce significant climate change. Global climate models are the primary tool for quantifying future climate change; however, significant uncertainties remain in the global climate models’ treatment of clouds, aerosol, and their effects on the Earth’s energy balance. In 1989, the U.S. Department of Energy (DOE) Office of Science created the Atmospheric Radiation Measurement (ARM) Program to address scientific uncertainties related to global climate change, with a specific focus on the crucial role of clouds and their influence on the transfer of solar and infrared radiation in the atmosphere.
Designated a national user facility in 2003, the ARM Climate Research Facility provides the climate research community with strategically located in situ and remote-sensing observatories designed to improve the understanding and representation in climate and earth system models of clouds and aerosols, as well as their interactions and coupling with the Earth’s surface. The scale and quality of the ARM Facility’s approach to climate research has resulted in ARM setting the standard for ground-based climate research observations.
Researchers use data collected from ARM ground-based and airborne instruments to study processes that affect aerosol and cloud formation, their properties, and their lifetime in the atmosphere and how those conditions affect incoming and outgoing radiative energy.
This report provides an overview of the ARM Facility and a sample of achievements for fiscal year 2016 (FY2016).
Strong collaborations between nine DOE national laboratories enable the ARM Facility to successfully operate in remote locations around the world. This unique partnership supports the DOE mission to provide for the energy security of the nation. Without the support of the following laboratories, the ARM Facility would not be the state-of-the-art facility that it is today.
Airborne Instruments
OUTGOING RADIATION
AEROSOL INTERACTIONS
REFLECTED RADIATION
INCOMING SOLAR
RADIATION
SurfaceInstruments
Researchers use data collected from ARM ground-based and airborne instruments to study the natural phenomena that occur in clouds and how those cloud conditions affect incoming and outgoing radiative energy.

8 ARM Climate Research Facility ANNUAL REPORT – 2016
ARM Climate Research Facility The ARM Facility consists of several long-term, highly instrumented ground-based atmospheric observatories, three mobile facilities, and an aerial facility for studying aerosol and cloud formation processes and their influence on radiative transfer, as well as measuring other parameters that determine the radiative properties of the atmosphere. The long-term observatories were chosen to represent a broad range of climate conditions and important climate processes:
• Southern Great Plains (SGP)—the first observatory established by ARM in 1992 includes a heavily instrumented Central Facility near Lamont, Oklahoma, and smaller satellite facilities covering a 150-kilometer- by-150-kilometer area in Oklahoma and Kansas.
• North Slope of Alaska (NSA)—includes a site at Barrow near the edge of the Arctic Ocean and a location in Oliktok Point, Alaska, where the Facility has secured special-use arctic airspace.
• Eastern North Atlantic (ENA)—only in operation since 2013, the newest ARM site is located on Graciosa Island in the Azores.
Each observatory operates advanced measurement systems to provide high-quality research data sets for the scientific community. The current generation of instruments includes three-dimensional cloud and precipitation radars, Raman lidar, infrared interferometers, aerosol observing systems, and several frequencies of microwave radiometers, among others.
Measurements obtained at the fixed atmospheric observatories are supplemented with data obtained from intensive field campaigns proposed by the scientific research community. Campaigns may use an ARM Mobile Facility (AMF), a collection of advanced measurement systems that can be deployed to locations around the world for six months to two years, or capabilities of the ARM Aerial Facility (AAF). Major campaigns in FY2016 collected ground-based data from Antarctica, at Ascension Island in the South Atlantic Ocean, and at Macquarie Island in the Southern Ocean, as well as aerial data over the SGP region. In addition, more than 35 smaller user-proposed intensive operational periods were conducted at either fixed or mobile facility locations. Once collected, the data from all of the ARM observatories are carefully reviewed for quality and stored in the ARM Data Archive for use by the atmospheric science community.
Using these data, scientists are studying the effects and interactions of sunlight, radiant energy, clouds, aerosols, and precipitation to understand their impact on temperature, weather, and climate. As part of this effort, ARM personnel apply scientific methods developed in the research community to create enhanced value-added data products. All ARM data products are made available for the science community via the ARM Data Archive (http://www.archive.arm.gov) to aid in further research.
ARM atmospheric observatories span the globe with fixed ground-based sites, mobile facilities, and an aerial facility. The map shows all the locations for active, previous, and upcoming deployments as of September 2016.

9
New Atmospheric Modeling Advisory Group Assembled
Translator Shuffle: ARM Staff Change RolesThe role of lead translator changed hands in fiscal year 2016 as Laura Riihimaki, Pacific Northwest National Laboratory, took over for Mike Jensen, Brookhaven National Laboratory, who stepped down after 11 years. Scott Giangrande, Brookhaven, also joined the translator team. In his role as lead translator, Jensen coordinated with both developers—ARM infrastructure staff who write the code for value-added products—and scientists to improve data product development. Riihimaki moves into the lead translator role after four years as a translator working on a wide range of data products. Giangrande had been working closely with ARM developers in his role at Brookhaven and has extensive experience in radar observation of clouds and precipitation.
William Gustafson Pacific Northwest National Laboratory
Andrew VogelmannBrookhaven National Laboratory
Graham FeingoldNational Oceanic and Atmospheric Administration Earth System Research Laboratory
Minghua ZhangStony Brook University
Chris GolazLawrence Livermore National Laboratory
Maike AhlgrimmEuropean Centre for Medium-Range Weather Forecasts
David TurnerNational Oceanic and Atmospheric Administration National Severe Storms Laboratory
Chris BrethertonUniversity of Washington
The Atmospheric Modeling Advisory Group reports to the ARM Technical Director Jim Mather, and includes:
In FY2016, the Facility made progress on a planned reconfiguration, including completing work to turn the Southern Great Plains and North Slope of Alaska observatories into “megasites.” In addition, the Eastern North Atlantic observatory expanded measurement capabilities with the installation of new instruments: aerosol and trace gas systems, atmospheric and boundary state systems, radars and lidars, radiometers, a hydrogen generation system, remote balloon launcher, scanning ARM cloud radar, and a two-dimensional video disdrometer. Routine operations of unmanned aerial systems and tethered balloon systems also began at Oliktok Point to augment ground measurements.
An important component of the next-generation ARM Facility is routine model simulations and associated joint analysis with observations. Significant progress was made
in a pilot project developing processes for using enhanced data from the Southern Great Plains megasite to constrain a large-eddy simulation (LES) model, a high-resolution mathematical model used to simulate atmospheric motions and cloud processes.
LASSO, or LES ARM Symbiotic Simulation and Observation workflow, released its first set of results in FY2016. This initial Alpha 1 release only covers five days from 2015, but includes 192 simulations totaling three terabytes of data. Users can access the data through the LASSO Bundle Browser, a convenient method for researchers to select only the data they find relevant. The Alpha 1 release is the first in what will be a library of routine high-resolution model simulations that, when combined with the detailed ARM observations, will provide powerful new research capabilities.
As part of its reconfiguration, the ARM Facility is tying together observation data and large-eddy simulation (LES) modeling to support the study of atmospheric processes, improvement of observational retrievals, and parameterizations of clouds, aerosols, and radiation in climate models. To support this, ARM formed the Atmospheric Modeling Advisory Group in April to represent research community interests and provide feedback to the LES ARM Symbiotic Simulation and Observation Workflow (LASSO) modeling project.
This group consists of six scientists, spanning the range of specialties that will benefit from LASSO, plus LASSO Principal Investigator William Gustafson, and Co-Principal Investigator Andrew Vogelmann. Terms of service extend through the LASSO pilot project phase, which ends in mid-2017.
Laura Riihimaki, Pacific Northwest National Laboratory (left), Scott Giangrande, Brookhaven National Laboratory (center), and Mike Jensen, Brookhaven National Laboratory (right)

10 ARM Climate Research Facility ANNUAL REPORT – 2016
Cooperation and Oversight Enable Success Nine DOE national laboratories and numerous government agencies, universities, private companies, and foreign organizations contribute to the ARM Facility. Each entity serves a vital role in managing and conducting the operation and administration of the user facility.
The ARM Facility is directed by DOE’s Office of Biological and Environmental Research, part of the Office of Science. An Infrastructure Management Board coordinates the scientific, operational, data, financial, and administrative functions of the ARM Facility. An 11-member Facility
Science Board, selected by the ARM Program Manager, serves as an independent review body to ensure appropriate scientific use of the ARM Facility. Scientific guidance for the Facility is provided by the science team of the Atmospheric System Research Program, a DOE-funded observation-based climate research program, as well as by scientists at other government, academic, and private organizations. A newly established ARM User Executive Committee provides feedback on the Facility’s activities and serves as the official voice of the user community in its interactions with ARM management.
User Executive Committee UpdateDuring nearly two years of virtual monthly meetings and two ‘live’ get-togethers since its formation in December 2014, ARM’s User Executive Committee (UEC) has steadily gone about its business of discussing and making recommendations on issues of concern to ARM users. Throughout, the UEC has remained true to its chartered function of enhancing the user experience by representing the voice of the user community to the ARM Infrastructure Management Board.
Doing Fewer Things Really Well. The UEC noted that the ARM Facility may be trying to do too much, which can have a negative impact on data quality. They suggested reviewing measurements and data products to determine which data should be run continuously or on an episodic basis. The committee asked for better communication between campaign science teams and ARM operations staff, as well as fewer campaigns for more campaign preparation.
Communicating Measurement Uncertainty. The committee suggested mentors and translators estimate random and systematic errors for uncertainty quantification in each of the observations and make this information available through a database of these values. Instrument documentation should include discussion of errors of various types and be easily found on the ARM website.
Joint Proposals for DOE User Facilities—ARM and EMSLThe ARM Facility and Environmental Molecular Sciences Laboratory (EMSL), both DOE user facilities, held a joint call for proposals to sponsor scientists to learn more about aerosols—tiny particles suspended in the atmosphere—and the role they play in weather and climate systems. Using samples from ARM’s Southern Great Plains atmospheric observatory and analytical instruments from EMSL, selected proposals will advance understanding of the molecular, physical, and/or optical properties of aerosol particles that influence and control macroscopic climate-relevant processes, such as cloud formation, radiation balance, and precipitation.
ARM Strengthens Collaborations with DOE Partners The DOE Office of Biological and Environmental Research (BER) strengthened collaborations between the ARM Facility and other DOE partners through two workshops and the launching of a new funding activity.
In 2015, a joint workshop brought together the ARM Facility and Atmospheric System Research (ASR) and Environmental System Science (ESS) researchers to identify high-priority science questions across the atmospheric and terrestrial science communities with aerial observation needs. The workshop report was published in October 2015.
A second workshop was convened with ASR and the Accelerated Climate Modeling for Energy (ACME) project—part of DOE’s Earth System Modeling (ESM) activity—to identify strategies for improving coordination between the atmospheric observational, process, and global climate modeling communities across BER. The ACME-ARM-ASR workshop report was released in March 2016. The new Climate Model Development and Validation activity launched by BER in 2016 funded three integrated atmospheric projects.

11
Fiscal Year 2016 Budget Summary and Facility Statistics
FY2016 infrastructure $65,141K
Operational Statistics for the Fixed ARM Observatories
FY2016 Q1 Q2 Q3 Q4
Goals (hours) 1987.20 1965.60 1965.60 1987.20
Actual (hours) 2134.40 2052.96 2052.96 2031.36
Site average is calculated for fixed sites only and reported quarterly.
User Statistics for the Period of October 1, 2015–September 30, 2016
Users by Affiliation for the Period of October 1, 2015–September 30, 2016
17%15%
18%
11%36%
3%
DOE Laboratories 203University 425Industrial 40Other Federal Agency 123Foreign 208Other 171
Description Users
On Site 96Off Site 148Data 926
Facility Access Type
Unique Scienti�c Users
8%13%
79%

12 ARM Climate Research Facility ANNUAL REPORT – 2016
Key ACCOMPLISHMENTS
12 ARM Climate Research Facility ANNUAL REPORT – 2016

13
A sun photometer measures direct solar irradiance and sky radiance at the Earth’s surface from West Antarctica.
Featured Field CampaignsIn addition to providing continuous data collections from its fixed observatories, the ARM Facility sponsors field campaigns for scientists to obtain specific data sets or to test and validate instruments. The following pages highlight key campaigns in FY2016; a summary of all campaigns in FY2016 is available later in the report.
ARM Fills a Five-Decade Gap in Measurements in Antarctica
Antarctica is the highest, driest, coldest, and windiest continent. It contains 90 percent of the ice on Earth—ice that could raise sea levels worldwide if it were to melt. Using satellite data, scientists discovered rapid changes in the West Antarctic region, yet no substantial atmospheric science or climatological field work has been conducted there since the 1950s. From the fall of 2015 to early 2017, the ARM West Antarctic Radiation Experiment (AWARE) is delivering data that could help scientists understand how clouds affect melting glaciers.
Using the second ARM Mobile Facility, researchers are measuring clouds, aerosols, and energy coming from the sun and Earth at McMurdo Station on the southern tip of Antarctica’s Ross Ice Shelf. An additional smaller suite of instruments was transported from McMurdo to the West Antarctic Ice Sheet (WAIS) for an intensive operational period
of 56 days between November 2015 and January 2016. By gathering data on the role of changing air masses on the surface energy balance, including all surface energy components and cloud radiative forcing, scientists are helping find the explanation for West Antarctic warming, which involves dynamical mechanisms that may vary from one season to the next and very likely have complex connections with subtropical and tropical latitudes.
“West Antarctica is losing ice mass rapidly,” Dan Lubin, AWARE principal investigator and Scripps Institution of Oceanography research physicist, explains. “Upper warm air intrudes from the Southern Ocean and we need to get our surface and upper air measurements right to figure out why the surface is melting. We’re trying to connect our work as much as possible to eventually help quantify the rise in sea level resulting from melting polar ice.”
Readings from both AWARE locations will provide a total of 14 months of data scientists can use to enhance understanding of the effects of clouds and aerosols on Antarctic warming in an area where no comprehensive explanation exists for the glacial movement and melting taking place. Collecting accurate data will help scientists understand the influence that aerosols and clouds have on climate in this under-studied region. AWARE’s data sets will help scientists improve the performance of global climate models over the Southern Ocean.
As featured in Nature, AWARE “aims to get the best data yet on clouds and aerosol particles above West Antarctica.”
From McMurdo Station, the second ARM Mobile Facility gathers sophisticated data with cloud radars and high spectral resolution lidar and a complete aerosol suite.

14 ARM Climate Research Facility ANNUAL REPORT – 2016
HI-SCALE filled the ARM Aerial Facility Gulfstream-1’s cabin with instruments to measure the clouds and aerosols above the Southern Great Plains.
Examining the Life Cycle of Clouds
Cumulus convection, or upwelling and mixing, plays a key role in the atmospheric radiation budget and hydrologic cycle over the Southern Great Plains and many other regions of the world, particularly during the summer growing season when surface fluxes of heat, moisture, and momentum control turbulent quantities in the daytime boundary layer up to the base of clouds. Despite their importance, the small size of shallow clouds has made them difficult to study—until now.
The field study Holistic Interactions of Shallow Clouds, Aerosols, and Land-Ecosystems (HI-SCALE) gathered data that will provide a closer look at the life cycle of shallow convective clouds. “In a nutshell,” HI-SCALE principal investigator and Pacific Northwest National Laboratory atmospheric scientist Jerome Fast explains, “we’re trying to uncover the secret life of clouds.”
In two intensive operational periods—one from April to May and a second from August through September— the campaign made use of the Southern Great Plains atmospheric observatory’s standard equipment as well as the ARM Aerial Facility’s Gulfstream-159 (G-1) aircraft,
loaded with instruments from ARM and collaborators like the University of Washington, Brookhaven National Laboratory, and the Environmental Molecular Sciences Laboratory (EMSL).
The campaign was designed to provide a detailed set of measurements needed to obtain a more complete understanding of the life cycle of shallow clouds by coupling cloud macrophysical and microphysical properties to land surface properties, ecosystems, and aerosols. The two observation periods took advantage of different stages and distributions of “greenness” of the vegetation around the site, an important part of looking at how land use, vegetation, and soil moisture interact with convective eddies and aerosol properties in the evolution of shallow clouds.
HI-SCALE will provide a coupling of ground- and aircraft- based data that will lead to a better understanding of how land-atmosphere interactions and boundary-layer properties influence the evolution of aerosol particles and shallow clouds. What sets HI-SCALE apart is the simultaneous study of multiple facets of the initiation and evolution of shallow clouds.
“In a nutshell, we’re trying to uncover the secret life of clouds.” —Jerome Fast, scientist at Pacific Northwest National Laboratory

15
The first ARM Mobile Facility is deployed from June 2016 to October 2017 to observe how smoke and clouds interact.
Studying African Smoke Blown Across the Atlantic
Over a thousand miles off the coast of Angola in West Africa is Ascension Island, a volcanic remnant that has 34 miles of land, 25 miles of paved roads, one school, and an airfield named Wideawake. But from June 1, 2016, through October 31, 2017, this tiny island in the South Atlantic Ocean is home to the Layered Atlantic Smoke Interactions with Clouds (LASIC) campaign. Midway between South America and Africa, the remote island is just the place for the first ARM Mobile Facility to gather data on how the properties of smoke evolve after long-range transport through the atmosphere. Ascension Island lies beneath the main Atlantic aerosol outflow pathway for smoke from wood and grassland fires in West and Southern Africa.
“Africa is the world’s largest emitter of smoke, with the smoke seasonally blowing westward over one of the largest low cloud decks on the planet,” says Paquita Zuidema, a University of Miami Rosenstiel School of Marine and Atmospheric Science scientist and principal investigator for LASIC. Smoke is lighter-colored than the ocean surface, but darker than clouds, meaning that it absorbs more
sunlight than clouds, but reflects more sunlight than the ocean. This means that smoke and clouds occurring together causes more heating of the atmosphere than if there were no clouds, but smoke over the ocean on an otherwise clear day causes less heating of the ocean surface than if there were no smoke.
Smoke, an aerosol, also impacts how clouds form. Figuring out the net impact of these different interactions, and how to accurately represent them in atmospheric models, requires detailed measurements both below and above the smoke layers. After LASIC’s 17 months of data have been collected, scientists will be able to use the results to improve the global aerosol models.
In addition to an ARM Mobile Facility deployment on Ascension Island, the National Aeronautics and Space Administration is flying a complementary aircraft campaign out of Namibia to obtain measurements within and above the smoke layers. The ARM LASIC team will collaborate with this international team of scientists from the United Kingdom, France, South Africa, and Namibia to study how smoke evolves and interacts with clouds as it moves across the Atlantic Ocean.
“Africa is the world’s largest emitter of smoke, with the smoke seasonally blowing westward over one of the largest low cloud decks on the planet.”
—Paquita Zuidema, scientist at University of Miami Rosenstiel School of Marine and Atmospheric Science
Smoke and Clouds Above the Atlantic: Biomass Burning Aerosol and Climate
From June 2016 through October 2017, scientists from five nations will investigate the little-known interplay of smoke and clouds over the southeastern Atlantic. University of Miami Atmospheric Scientist Paquita Zuidema is lead author of a paper that outlines the long-term study’s science, design, necessity, and coordinating players. It appeared in the July issue of the Bulletin of the American Meteorological Society.

16 ARM Climate Research Facility ANNUAL REPORT – 2016
The remote island’s regular inhabitants—including penguins, seals, and land crabs—have been joined by the MICRE campaign from March 2016 to March 2018.
ARM Makes Important Observations in Southern Ocean
While penguins and seals are the main inhabitants of Macquarie Island, a remote grassy outcrop which lies about half-way between New Zealand and Antarctica, they were joined in March 2016 by a suite of instruments from the ARM Facility. These instruments will measure surface radiative fluxes and cloud and aerosol properties at this locale for two years, providing vital information for climate scientists and meteorologists.
“Clouds over the Southern Ocean are poorly represented in current models and we want to understand why that is,” says Roger Marchand from the University of Washington, lead scientist of the Macquarie Island Cloud and Radiation Experiment (MICRE). “In particular, we need to understand characteristics such as how much water is in the cloud, and how big the particles are.”
The ARM instruments are being housed at a permanently manned research station on the island, which is operated by the Australian Antarctic Division. The experiment will be conducted in coordination with Australian Antarctic Division and Australian Bureau of Meteorology activities planned at this site, which include using radar and lidar to measure critical properties of clouds and aerosols.
Most of the existing knowledge of cloud and aerosol properties over the Southern Ocean relies heavily on satellite data sets; and uncertainty in satellite retrievals of cloud and aerosol properties, as well as estimates of surface shortwave and longwave fluxes based on these properties, are especially large for the Southern Ocean.
But it is not just the location that contributes to the uncertainty. Scientists believe that the clouds themselves over the Southern Ocean may be unique. Researchers know that these clouds contain much larger quantities
Instruments deployed to Macquarie Island are filling in the gap of ground-based measurements of clouds and aerosols over the Southern Ocean.
“Clouds over the Southern Ocean are poorly represented in current models and we want to understand why that is.”
—Roger Marchand, scientist at University of Washington

17
ARM-ACME VI Charts Changes in Greenhouse Gas Levels
Over the past year, a Cessna 206 aircraft leased by the ARM Aerial Facility swept through the skies several times per week, skimming 500 feet above the Earth’s surface and soaring up to 17,500 feet, allowing scientists to gain an accurate picture of trace gas concentrations in the atmosphere over the ARM Southern Great Plains atmospheric observatory. The flights allowed the ARM Airborne Carbon Measurements VI (ARM-ACME VI) team led by Sebastien Biraud of Lawrence Berkeley National Laboratory to inventory carbon dioxide, methane, and other greenhouse gases in the region. Building on results of previous ARM-ACME campaigns, the findings added to the detailed records of atmospheric changes in the region and are helping validate climate models and satellite measurements.
The ARM-ACME campaigns began in 2008 and ARM-ACME VI marked the final run. “What is really unique about this study is that we have been taking these highly accurate measurements over the course of so many years,” says Beat Schmid, ARM Aerial Facility Manager at the Pacific Northwest National Laboratory.
The primary objective of the ARM-ACME campaigns was to quantify trends and variability in greenhouse gas mixing ratios over the Southern Great Plains. These measurements form the foundation for understanding the carbon budget of North America and the processes that govern that budget; the sixth campaign contributed valuable data to that goal.
The ARM-ACME VI campaign took advantage of the Southern Great Plains atmospheric observatory, which houses some of the most comprehensive atmospheric instrument suites in the world.
The Cessna 206 provided important airborne measurements of greenhouse gases during one of its last operations as part of ARM-ACME VI.
of supercooled liquid water than clouds over the northern hemisphere. Consequently, the scientists are also measuring aerosol properties in the region, as aerosols can act as ice nuclei. The Southern Ocean is remote from most continental and man-made aerosols, a fact that can have a significant impact on cloud properties and ice properties.
The measurements taken during MICRE, and the associated satellite retrievals, will be used to address several scientific issues. Scientists plan to use the MICRE data to evaluate the seasonal cycle of
satellite-derived and climate-model-simulated surface radiative fluxes, along with cloud and aerosol properties over the Southern Ocean. They hope to isolate the factors that contribute to errors in the climate model simulations (e.g., errors in assumed or simulated boundary-layer structure or moisture, presence of supercooled water in clouds, aerosol concentrations, etc.) so that the representation of these processes can be improved in next-generation models.

18 ARM Climate Research Facility ANNUAL REPORT – 2016
Campaign ResultsThe vast majority of the research findings are realized several years after data are collected during a field campaign. In FY2016, these two past ARM field campaigns had a significant number of publications highlighting their scientific impact.
Researchers Care About Results from California Air Study
During June of 2010, a lot of people cared about the Carbonaceous Aerosols and Radiative Effects Study (CARES), a 26-day investigation of the composition, evolution, and fate of aerosols in an air transport region where both natural and urban emissions mix. Aerosols that contain carbon, the chief research target of CARES, undergo chemical and physical changes as these microscopic substances disperse through air. They heavily influence cloud formation, the lifespan of clouds, and the Earth’s radiation balance—how much sunlight the planet absorbs and reflects. At present, aerosols are one of the largest sources of uncertainty in global and regional climate models.
CARES was held in the outdoor laboratory of Sacramento, California, and its environs. The city shares an air transportation pathway with a largely uninhabited forest
about 50 kilometers downwind. In a plus for scientists studying atmospheric chemistry, summertime wind patterns in the Sacramento area have a predictable “flow regularity,” says CARES principal investigator Rahul Zaveri, an atmospheric scientist at Pacific Northwest National Laboratory. “It was quite attractive for the kind of sampling we wanted to do.”
Taking Care of Data
Six years later, a lot of scientists still care about CARES. The study and its publicly archived data have inspired more than 30 papers, sparked 600-plus citations, and spurred a second generation of lab-based studies—mostly air-chamber investigations trying to puzzle out some of the surprises that emerged from CARES.
CARES participants included investigators from all the collaborating entities: the ARM Facility, National Aeronautics and Space Administration, and a dozen universities. The ARM Aerial Facility deployed its Gulfstream-159 (G-1) research aircraft on 22 flights through the urban plume of pollutants welling into the air from Sacramento, and on across the Central Valley, to the sparsely inhabited foothills of the Sierra Nevada mountain range.
Research flights and ground-based instrumentation kept 60 technicians, engineers, pilots, and atmospheric scientists busy. Near Sacramento’s urban core, CARES instruments
The CARES campaign took place in Sacramento, California, where the city’s urban plume reaches a natural area nearby, allowing researchers to look at human-made and natural sources of aerosols.
“CARES data have inspired more than 30 papers, sparked 600-plus citations, and spurred a second generation of lab-based studies since the campaign’s completion in June 2010.”

19
were sited at American River College. A downwind site was located in rural terrain 52 kilometers to the northeast of the city at the Northside School in eponymously named Cool, California.
Caring About Aerosols
Many of the papers from CARES shed light on aerosol properties. One study (Cappa et al. 2012) used direct measurements from CARES to show that enhancements to light absorption by black carbon in the atmosphere are much lower, in the range of 6 percent not 100 percent as previously thought. Like many other CARES discoveries, the black carbon surprise has inspired lab-based studies of the aerosol’s light-absorption properties.
Other papers inspired by CARES note that previous models tended to under-predict secondary organic aerosol (SOA) formation in both the urban atmosphere and in the upper troposphere. It appears that mixing urban and natural emissions enhances SOA formation, “for reasons we don’t fully understand,” explains Zaveri. “But now we have more evidence of this phenomenon.”
One SOA paper (Shilling et al. 2013) drawing on ARM’s airborne measurements used isoprene as its signature of natural emission. This organic compound, made by plants, globally accounts for about a third of hydrocarbons emitted into the atmosphere. In the CARES study, the primary source of isoprene was oak trees, which (like other trees) emit isoprene to cope with heat stress and other non-biological environmental pressures.
Another SOA paper (Vaden et al. 2011) found that SOA evaporated much more slowly than models indicate, taking 10 to 20 hours to do so.
“That basically means we were modeling SOA incorrectly,” explains Zaveri, who authored a 2014 paper proposing a new framework for modeling SOA.
The discovery is still a controversial finding SOA researchers care about even six years after the last CARES instrument was packed up for another ARM campaign.
ReferencesCappa CD, TB Onasch, P Massoli, DR Worsnop, TS Bates, ES Cross, P Davidovits, J Hakala, KL Hayden, BT Jobson, KR Kolesar, DA Lack, BM Lerner, SM Li, D Mellon, I Nuaaman, JS Olfert, T Petäjä, PK Quinn, C Song, R Subramanian, EJ Williams, and RA Zaveri. 2012. “Radiative absorption enhancements due to the mixing state of atmospheric black carbon.” Science 337(6098):1078-81, doi:10.1126/science.1223447.
Shilling, JE, RA Zaveri, JD Fast, L Kleinman, ML Alexander, MR Canagaratna, E Fortner, JM Hubbe, JT Jayne, A Sedlacek, A Setyan, S Springston, DR Worsnop, and Q Zhang. 2013. “Enhanced SOA formation from mixed anthropogenic and biogenic emissions during the CARES campaign.” Atmospheric Chemistry and Physics 13:2091-2113, doi:10.5194/acp-13-2091-2013.
Vaden, TD, D Imre, J Beránek, M Shrivastava, and A Zelenyuk. 2011. “Evaporation kinetics and phase of laboratory and ambient secondary organic aerosol.” Proceedings of the National Academy of Sciences of the United States of America 108(6):2190-5, doi:10.1073/pnas.1013391108.
Zaveri, RA, RC Easter, JE Shilling, and JH Seinfeld. 2014. “Modeling kinetic partitioning of secondary organic aerosol and size distribution dynamics: representing effects of volatility, phase state, and particle-phase reaction.” Atmospheric Chemistry and Physics 14:5153-5181, doi:10.5194/acp-14-5153-2014.
Data gathered during the CARES campaign, from state-of-the-art instruments on the ground and in the air, such as this particle in liquid auto sampler, or PILS, are still being used by researchers to learn more about aerosols.

20 ARM Climate Research Facility ANNUAL REPORT – 2016
GoAmazon Continues to Go
Remote and mysterious, the vast Amazon basin is nearly as big as the entire continental United States, yet the pristine atmosphere over the rainforest has more in common with ocean regions in terms of aerosol conditions and types of clouds. That atmosphere is just one of the reasons the ARM Facility teamed with the DOE Atmospheric System Research Program and two Brazilian state funding agencies for a two- year campaign, Green Ocean Amazon or GoAmazon 2014/15.
Going Big
More than 20 researchers from U.S. and Brazilian government agencies and universities sought to quantify and understand how pollutant flow from the large tropical city of Manaus, Brazil, influenced aerosol and cloud life cycles in the particularly clean background of the surrounding rainforest. Manaus, a city of 2 million inhabitants, is also home to oil-burning energy plants, vehicles, and industrial sources that emit a year-round plume of pollution.
“The experiment focused on the complex links among vegetation, atmospheric chemistry, and aerosol production on the one hand and their connections to aerosols, clouds, and precipitation on the other, especially when altered by urban pollution,” shares Scot Martin, Harvard professor of environmental chemistry, who led the GoAmazon research team.
The experiments took place from January 1, 2014, to December 31, 2015, including intensive measurements during the wet and dry seasons of 2014. Research sites sampled the atmosphere upwind, downwind, within Manaus, and at a farm pasture 70 kilometers outside the city, where the ARM Mobile Facility was located. Scientists set up more than 100 ground instruments while ARM’s Gulfstream 159 (G-1) took measurements low in the Earth’s atmosphere. Scientists also used satellite images and data to track emissions from Manaus as well as biomass burning in the area.
Going Wide
The results of the work have generated dozens of presentations and a number of journal articles. Partway through the campaign, researchers gathered at Harvard to hear nearly 40 presentations on early data. One surprise was that lightning strikes are a hundred times more likely inside the Manaus pollution plume than outside of it.
Another early result focused on isoprene, a plant-emitted volatile organic compound (Liu et al. 2016). As reported in the Proceedings of the National Academy of Sciences, when oxidized by sunlight, isoprene can heavily influence atmospheric chemistry over forested areas.
“Until the GoAmazon campaign, we had little data on the fate of isoprene in the tropics,” says Martin. “Now we can clearly see that a shift in isoprene oxidized by
Indian Journal Features ARM CampaignA nine-month experiment involving the first ARM Mobile Facility in the Ganges River valley was outlined in an October 2016 special issue of Current Science, a prominent Indian journal. The Ganges Valley Aerosol Experiment (GVAX) gathered cloud, precipitation, and aerosol measurements from June 2011 through March 2012 and was the first large-scale joint field study on climate to be conducted in India. “This will be the standard data for atmospheric models in India,” says GVAX lead U.S. scientist V. Rao Kotamarthi, an atmospheric and climate scientist at the Argonne National Laboratory with funding from the DOE’s Atmospheric System Research Program.
“Green Ocean Amazon, or GoAmazon 2014/15, was featured in a special issue of Atmospheric Chemistry and Physics, jointly organized with Atmospheric Measurement Techniques, Geoscientific Instrumentation: Methods and Data Systems, and Geoscientific Model Development.”

21
The ARM Mobile Facility took measurements 70 kilometers outside Manaus during the GoAmazon 2014/15 campaign.
sunlight, sparked by human activities, suggests ongoing and possible future changes in the photochemistry over the Amazon rainforest.”
Another set of experiments measured the physical state of aerosols drifting over the Amazon rainforest (Bateman et al. 2016). While previous studies had indicated most aerosols were solid or semi-solid, researchers found that 80 percent of the time over the Amazon the aerosols were liquid. This understanding will help scientists enhance the accuracy of global climate models—because the aerosols’ physical state affects particle growth, size, and reactivity, as well as population size and composition.
Going Strong
Most recently, the campaign has been featured in a special issue of Atmospheric Chemistry and Physics, jointly organized with Atmospheric Measurement Techniques, Geoscientific Instrumentation: Methods and Data Systems, and Geoscientific Model Development. The online issue, organized by Martin, has published seven articles so far, with another four currently under review.
One of the papers (Alves et al. 2016) used data from GoAmazon to show that the seasonable variability of tropical rainforest emissions is higher than previously thought. The emissions changed with the amount of light available.
Another paper (Cecchini et al. 2016) looked at the differences between clouds that form over the pristine forest versus those that form over the city pollution. The
results showed that pollution significantly affects the properties of surrounding clouds by changing the initial distribution of water drop sizes. This distribution can influence how much precipitation, if any, falls from clouds. Scientists are now looking to see whether the same holds true in other areas of the world for ice.
With insights such as these, the results from GoAmazon will continue yielding value for some time to come.
ReferencesAlves EG, K Jardine, J Tota, A Jardine, A Maria Yãnez-Serrano, T Karl, J Tavares, B Nelson, D Gu, T Stavrakou, S Martin, P Artaxo, A Manzi, and A Guenther. 2016. “Seasonality of isoprenoid emissions from a primary rainforest in central Amazonia.” Atmospheric Chemistry and Physics 16:3903-3925, doi:10.5194/acp-16-3903-2016.
Cecchini MA, LAT Machado, JM Comstock, F Mei, J Wang, J Fan, JM Tomlinson, B Schmid, R Albrecht, ST Martin, and P Artaxo. 2016. “Impacts of the Manaus pollution plume on the microphysical properties of Amazonian warm-phase clouds in the wet season.” Atmospheric Chemistry and Physics 16:7029-7041, doi:10.5194/acp-16-7029-2016.
Liu Y, J Brito, MR Dorris, JC Rivera-Rios, R Seco, KH Bates, P Artaxo, S Duvoisin JR, FN Keutsch, S Kim, AH Goldstein, AB Guenther, AO Manzi, RA Souza, SR Springston, TB Watson, KA McKinney, ST Martin. 2016. “Isoprene photochemistry over the Amazon rainforest.” Proceedings of the National Academy of Sciences of the United States of America 113(22):6125-6130, doi:10.1073/pnas.1524136113.
Bateman, AP, Z Gong, P Liu, B Sato, G Cirino, Y Zhang, P Artaxo, AK Bertram, AO Manzi, LV Rizzo, RAF Souza, RA Zaveri, ST Martin. 2016. “Sub-micrometre particulate matter is primarily in liquid form over Amazon rainforest.” Nature Geoscience 9:34-37, doi:10.1038/ngeo2599.
From the ARM Gulfstream-1, Manaus, Brazil, is visible in the foreground and the Amazon River in the background. The prevailing trade winds carry the plume of urban pollution across the river toward the ARM Mobile Facility site.

22 ARM Climate Research Facility ANNUAL REPORT – 2016
Research HighlightsScientists around the world use data from the ARM Facility for their research. In FY2016, ARM data were cited in a total of 670 publications. Some of the most impactful papers are featured in this section. For more publications information, search the ARM Publications Database, http://www.arm.gov/publications.
When Secondary Becomes of Prime Importance
Atmospheric scientists have long known that air pollutants can be emitted from human sources such as vehicle exhaust and industrial discharges, as well as natural sources such as vegetation and biomass burning. These primary pollutants mix with sunlight, precipitation, and chemicals in the atmosphere to form secondary organic aerosols (SOAs). These SOAs can affect the radiative balance and may play a role in how clouds are formed. Simulating the complex processes that create SOAs has stymied many climate models, affecting estimates of atmospheric chemistry, climate, and air quality. Researchers recently demonstrated how missing SOA processes and better representation of primary pollutants could dramatically improve the modeling of these illusive secondary particles.
In one study (Shrivastava et al. 2016), researchers examined atmospheric processes in search of the ones most likely to affect the formation of SOAs. Using data from the Carbonaceous Aerosol and Radiative Effects Study (CARES), they evaluated
seven processes. The most influential one causes smaller molecules to combine and form larger molecules. This process, called rapid particle-phase oligomerization, is largely missing in most climate models. The statistical approach used in the study not only estimates the contribution of each process to model results, but also notes its statistical significance and quantifies the relative contribution. This approach can be applied to a broader set of model parameters.
Another study (Zhao et al. 2016) looked at how processes at the land surface affect SOA formation, particularly for certain types of volatile organic compounds found in nature. Plants, animals, microbes, and fungi can release as much as 3.4 million kilograms of these biogenic compounds a day at certain times of the year. Researchers developed a modeling framework that included biogenic volatile organic compounds as part of processes at the land surface. The framework results compared well to measurements taken during CARES and the California Nexus of Air Quality and Climate Experiment (CalNex). The study indicated that more accurate data on land cover would greatly improve climate and air-quality models in terms of simulating biogenic volatile organic compounds and SOA formation, further adding to the understanding of climate and the primary importance of these secondary aerosols.
ReferencesShrivastava M, C Zhao, RC Easter, Y Qian, A Zelenyuk, JD Fast, Y Liu, Q Zhang, and A Guenther. 2016. “Sensitivity analysis of simulated SOA loadings using a variance-based statistical approach.” Journal of Advances in Modeling Earth Systems doi:10.1002/2015MS000554. ONLINE.
2016 Publications Summary
Total 670Abstracts or Presentations
Technical Reports
Books
Conference Papers
Journal Articles249249
190
1
201
29

23
Zhao C, M Huang, JD Fast, LK Berg, Y Qian, A Guenther, D Gu, M Shrivastava, Y Liu, S Walters, G Pfister, J Jin, JE Shilling, and C Warneke. 2016. “Sensitivity of biogenic volatile organic compounds to land surface parameterizations and vegetation distributions in California.” Geoscientific Model Development 9(5), doi:10.5194/gmd-9-1959-2016.
Tiny Scales, Big Changes in Model Results
Physical processes such as the interaction of clouds with sunlight or the rate at which clouds produce rain depend on the amount of cloud water available locally. These small-scale processes cannot be represented directly in current climate models, yet they have a big impact on the accuracy of results. Atmospheric scientists are finding innovative ways to build these small-scale processes into models, improving how we view global climate.
One study used data from ARM observatories around the world to better understand how cloud water varies on small scales under different conditions. Researchers looked at five geographical regions over multiple years and seasons. Their assessment revealed that results depended on the cloud regime, with higher variability in the tropics and lower in the middle and high latitudes. This regime dependence is not currently captured in models.
“Observations from ARM sites around the world have improved our understanding of how the amount of water in clouds varies at small scales,” says Maike Ahlgrimm,
researcher at the European Center for Medium-Range Weather Forecasting, who led the study. “Based on these observations, we developed a new way of describing how cloud water varies with cloud regime for use in global weather and climate models.”
In another study, researchers from Stony Brook University used long-term measurements from ground radar at ARM’s Southern Great Plains, North Slope of Alaska, and Darwin, Australia, observatories to derive an algorithm that calculates the statistical distribution of cloud water variability at scales below those of model grids. The parameterization algorithm can be used to improve the statistical properties of the cloud liquid water distribution in the widely respected Community Earth System Model. Researchers found that this parameterization, which describes the degree of cloud water variability that affects radiation and microphysics processes in climate models, requires no tuning to remain accurate at different scales in the model. Changes based on their research have been made to advance the model.
ReferencesAhlgrimm M, and RM Forbes. 2016. “Regime dependence of cloud condensate variability observed at the Atmospheric Radiation Measurement sites.” Quarterly Journal of the Royal Meteorological Society 142(697):1605-1617, doi:10.1002/qj.2783. ONLINE.
Xie X, and M Zhang. 2015. “Scale-aware parameterization of liquid cloud inhomogeneity and its impact on simulated climate in CESM.” Journal of Geophysical Research – Atmospheres 120(16), doi:10.1002/2015JD023621.
ARM data were used to develop a new way to describe how cloud water varies by cloud type in models, for example, for shallow cumulus convection (top panel) and stratocumulus clouds (bottom panel).
“Observations from ARM sites around the world have improved our understanding of how the amount of water in clouds varies at small scales.”
—Maike Ahlgrimm, scientist at the European Center for Medium-Range Weather Forecasting

24 ARM Climate Research Facility ANNUAL REPORT – 2016
Data from shallow cumulus clouds measured during the ARM’s RACORO campaign over the Southern Great Plains are helping scientists understand the critical process of entrainment.
Boundary-layer convection clouds form a street over the Arctic Ocean north of ARM’s North Slope of Alaska observatory (marked by the black triangle). The red line shows the satellite track, the black line the coastline, and the white line the ice edge. B and C indicate measurement points.
Entrainment Parameters: More Is Better
Entrainment, or the way a cloud pulls in air from the environment around it, is one of the most uncertain processes in climate models. Entrainment of moist air may cause cumulus clouds to grow to the massive monsters associated with thunderstorms. Entrainment of dry air can limit cloud growth and suppress the formation of rain. Scientists have struggled for years to catch a glimpse of the variables that account for entrainment. Thanks to measurements taken during the Routine ARM Aerial Facility Clouds with Low Optical Water Depths (CLOWD) Optical Radiative Observations (RACORO) field campaign over the ARM Southern Great Plains observatory near Lamont, Oklahoma, researchers are one step closer to understanding this critical process.
The RACORO campaign, which ran from January to June 2009, focused on gaining a better understanding of thin clouds, whose properties are difficult to accurately measure with ground-based instruments. The data also provided a rich resource of information on entrainment rate.
Researchers used these data to study the relationships between entrainment rate and a number of variables, including how fast the entrained air moved upward, its buoyancy, and how quickly air turbulence dissipated in shallow cumulus clouds. They looked at both real-world measurements and the results of large-eddy simulation models. Their statistical analysis showed that, in both measured and simulated clouds, updraft velocity, buoyancy, and turbulent dissipation rate tended to decrease as entrainment rate increased and vice versa.
The analysis further showed that a combination of variables, rather than any single variable, can better capture entrainment rate accurately. The results will improve the way cloud and convection properties are represented in climate models.
ReferenceLu C, Y Liu, GJ Zhang, X Wu, S Endo, L Cao, Y Li, and X Guo. 2016. “Improving parameterization of entrainment rate for shallow convection with aircraft measurements and large-eddy simulations.” Journal of the Atmospheric Sciences 73(2), doi:10.1175/JAS-D-15-0050.1.
Navigating the Streets of Boundary- Layer Convection
Boundary-layer convection (BLC) clouds often develop where cold air flows out from a land mass or ice sheet over relatively warm water. In cold environments over open water, these clouds can grow rapidly to form a regular band or street. Though shallow clouds like these seldom bring precipitation, BLC streets can transport heavy snowfall to such places as the Great Lakes and Japan’s northwest coast. Recent studies indicate that these streets are becoming more common, yet they are largely unexplored except by satellite imagery because they develop offshore. Now data from ARM’s North Slope of Alaska observatories near Barrow are giving scientists a unique opportunity to walk down these BLC streets.
“With ARM’s profiling and scanning radars, backscatter lidars, and other instruments at this site, we have an unprecedented opportunity to describe BLC clouds and precipitation,” shares Yonggang Wang, atmospheric researcher at Texas Tech University, who with colleagues

25
authored a paper on the study. “The Facility is a great resource to examine cloud and precipitation characteristics of BLC with a continuous record that now exceeds a decade.”
Scientists studied changes in temperature, wind, precipitation rate, particle fall speed, and heights and bases of clouds to identify BLC streets using 10 years of data from 2004 to 2013. They discovered that BLC clouds were relatively common on the North Slope in a narrow window during October. Most occurrences were rather short, but some lasted longer than 20 hours. Surprisingly, almost all of the BLC clouds held measurable liquid water, contrary to previous estimates. Some generated heavy snowfall, though the mean snowfall rate for all cases was only 2.8 millimeters per hour.
This kind of information will help scientists better predict the occurrence of these cloud streets and their impact on weather and climate.
ReferenceWang, Y, B Geerts, and Y Chen. 2016. “Vertical structure of boundary layer convection during cold-air outbreaks at Barrow, Alaska.” Journal of Geophysical Research: Atmospheres 121:399-412, doi:10.1002/2015JD023506.
Getting Their Heads Around a Cloud
You might say atmospheric scientists spend life with their heads in the clouds. They study data about weather and climate, hypothesize how those data relate to each other,
test their theories using advanced models, and study some more. And sometimes that studying leads to revelations that change how we view the world.
Take the case of a low-level cloud over the North Slope of Alaska in March 2013. Finding a cloud that contains both water droplets and ice particles in the springtime in that area is not surprising. But, given that for this particular case the air grew colder over the 37 hours of the cloud’s life cycle, why would the ice portion of the cloud decrease rather than increase—and why did it change so rapidly?
That question inspired scientists in DOE’s Atmospheric System Research Cloud Life Cycle Working Group to dig deeper. Led by Heike Kalesse, atmospheric scientist at Germany’s Leibniz Institute for Tropospheric Research, the group combined measurements from the specialized instruments at the ARM Facility on the North Slope and high-horizontal-resolution (500-meters) simulations to tease out why the relative fractions of ice and water in the cloud changed so rapidly. They modeled the interplay between processes within the cloud and processes in the atmosphere to determine how these cloud-scale and larger-scale processes affected the relative amounts of ice and water.
What started as an intriguing question led to answers that can improve climate models. The group confirmed that the cloud’s life cycle was heavily influenced by changes in large-scale levels of humidity and the presence of air
Instruments such as the Ka-band ARM zenith-pointing radar at ARM’s North Slope observatory are helping scientists understand why clouds transition from one phase to another.
“The Facility is a great resource to examine cloud and precipitation characteristics of [boundary-layer convection] with a continuous record that now exceeds a decade.”
—Yonggang Wang, scientist at Texas Tech University

26 ARM Climate Research Facility ANNUAL REPORT – 2016
masses with different amounts of small airborne particles called aerosols. Changes in the sub-cloud region were also important. For example, if the cloud layer was decoupled from the ground, ice particles were more likely to sublimate, resulting in recirculation of ice nuclei back into the cloud layer, whereas if the cloud was coupled to the surface, the ice nuclei were more likely to be lost, resulting in a loss of cloud ice. These small-scale processes are very difficult to capture in climate models.
The results suggest important connections among cloud-aerosol interactions and cloud dynamics and thermodynamic processes. The work also pointed to a need to obtain observations of vertical profiles of cloud condensation nuclei and ice nuclei, which are subsets of aerosol particles on which cloud droplets and ice particles form, and the need to improve the representation of aerosol-cloud interactions in cloud-resolving models. Scientists will once again be putting their heads in the clouds to learn more.
ReferenceKalesse H, G DeBoer, A Solomon, M Oue, M Ahlgrimm, D Zhang, M Shupe, E Luke, and A Protat. 2016. “Understanding rapid changes in phase partitioning between cloud liquid and ice in stratiform mixed-phase clouds: An Arctic Case Study.” Monthly Weather Review doi:10.1175/MWR-D-16-0155.1. ONLINE.
Just a Growing Particle
Condensable vapors in the atmosphere can form the nuclei for tiny particles about 1 nanometer in diameter. These newborn aerosol particles can either grow to sizes at which
they affect climate, or they can coagulate on existing larger particles. Once aerosol particles grow to 50 to 100 nanometer in diameter, they can directly affect climate by efficiently scattering or absorbing radiation. They can also indirectly affect climate by acting as cloud condensation nuclei.
Particles (red dots) began to form on April 19, 2013, at the ARM Southern Great Plains atmospheric observatory. These measurements, along with detailed gas- and particle-phase chemical analyses, have helped researchers characterize the processes responsible for particle formation.
Recent studies have shown that several chemical processes in the atmosphere contribute to the growth of new particles, including condensation of sulfuric acid and reactions of organic acids with ammonia or amines. Global climate models generally only simulate condensation of sulfuric acid, the most-studied of these processes. Neglecting the other formation processes typically leads to underestimating the growth rate of these new particles. Scientists took measurements during ARM’s Southern Great Plains New Particle Formation Study to understand how both these processes contribute to particle growth.
Held from April 13 to May 24, 2013, the New Particle Formation Study provided an intensive look at the birth and growth of aerosol particles. New particle formation events occurred throughout the study; a recent publication by Hodshire et al. (2016) focused on three separate events, which differed in the concentrations of trace gasses and had air masses of different origins.
Particles (red dots) formed on April 19, 2013, at the ARM Southern Great Plains atmospheric observatory. These measurements along with detailed gas- and particle-phase chemical analyses helped researchers characterize the processes responsible for particle formation.

27
Winging Their Way Through Weather
More than 20 years of measurements at ARM’s Southern Great Plains observatory have been used to study such phenomena as the formation of ice nuclei, the fate of airborne organic particles, and the life cycle of clouds. But this year saw their use in a unique study to determine how weather plays a part in bird migration.
“Few studies have examined the effect of atmospheric jets on avian migration, and none have focused on the effect of the Great Plains low-level jet,” states Charlotte Wainwright, atmospheric scientist at the University of Oklahoma and lead researcher on the study. “Scientists suspected that this atmospheric feature plays a prominent role in defining migratory routes, but the birds’ flight strategies with respect to this jet hadn’t been examined until now.”
The Great Plains nocturnal low-level jet provides frequent strong southerly winds through a shallow layer of the atmosphere a kilometer or so above ground level. It starts at sunset and lasts through early morning. Located in the central flyway, it can double the flight speed of the millions of birds, bats, and insects heading north in the spring from the southern states, Mexico, and Central and South America. Likewise, it puts the brakes on those heading south in the fall. Because this journey can span several thousand kilometers, the animals develop migration strategies that make optimal use of the available atmospheric conditions.
The research team used ARM radar and lidar measurements taken at the Southern Great Plains observatory during two spring and two autumn migration seasons in 2012 and 2013.
“Unlike weather radar beams, the narrow Doppler lidar provides wind estimates that are unaffected by even heavy migration traffic, yielding true atmospheric motions,” said Wainwright. “And ARM’s other instrumentation routinely detects animals aloft.”
Over a relatively short time in a single location surrounded by relatively uniform terrain, it would be tempting to assume that new and growing particles would undergo similar growth processes and have a fairly uniform chemical composition. However, researchers found that particles from each of the separate events differed, as a result of undergoing different growth processes that were influenced by the background trace gasses and air-mass origin. Using a specialized process-based model that simulates particle growth from both condensation of vapors and growth from acid-base reactions, the scientific team accurately depicted the differences seen in measurements.
The study illustrates that it is important to capture the complexity of atmospheric chemistry to accurately model aerosol particle growth processes. These insights will improve future regional and global models used to assess the climate impacts of freshly nucleated, growing, and existing particles.
ReferenceHodshire AL, MJ Lawler, J Zhao, J Ortega, C Jen, T Yli-Juuti, JF Brewer, JK Kodros, KC Barsanti, DR Hanson, PH McMurry, JN Smith, and JR Pierce. 2016. “Multiple new-particle growth pathways observed at the US DOE Southern Great Plains field site.” Atmospheric Chemistry and Physics 16(14):9321-9348, doi:10.5194/acp-16-9321-2016..
Researchers relied on measurements from ARM’s Southern Great Plains observatory to determine how the Great Plains nocturnal low-level jet affects migrating birds, bats, and insects.
Wainwright and her colleagues found that, in general, migrating birds choose to fly within the jet in the spring, often concentrating where the favorable wind speed is at its highest. Autumn migrants typically flew below the jet, although some rapidly climbed to reach altitudes above the inhibiting winds. The number of birds migrating was fairly constant throughout the spring because of the predominantly favorable southerly jet. On the other hand, birds migrating in the fall were more apt to delay departure to wait for the relatively infrequent northerly winds.
“Migratory animals depend on reliable climate conditions,” says Wainwright.
The question will be how changes in climate will affect migrations in the future.
Reference: Wainwright CE, PM Stepanian, and KG Horton. 2016. “The role of the US Great Plains low-level jet in nocturnal migrant behavior.” International Journal of Biometeorology 60(10):1531- 1542, doi:10.1007/s00484-016-1144-9.

28 ARM Climate Research Facility ANNUAL REPORT – 2016
Infrastructure ACHIEVEMENTS
28 ARM Climate Research Facility ANNUAL REPORT – 2016

29
Maintaining multiple instrumented observatories around the world is no easy feat. The ARM Facility uses a team of science, engineering, and technical personnel to ensure effective operations, keep up with technology developments, deliver high-quality data, and provide outreach to a global audience.
ARM Monograph Chronicles Two Decades of Data Collection
During its more than two data-rich decades, the ARM Facility has offered important services to science, from its innovative approach to instruments and data collection to its organizational template for climate research across the world. The history of the first 20 years of the Facility are now collected in a monograph released in 2016.
The document, written by ARM veterans and published in April 2016 by the American Meteorological Society, covers how ARM evolved operationally and scientifically; how it expanded its fixed and mobile observatories; what it has contributed to climate change science; how it inspired international research analogs; what its data targets have been, from spectral radiation and aerosol optical properties to radiative fluxes and water vapor profiles; and ultimately what its impact has been on regional and large-scale climate models.
The monograph was released the week of the second joint meeting of ARM users and Atmospheric System Research principal investigators in Virginia. Five years in the making,
and with a print version now available, it is 30 chapters long: four are introductory; eight are about ARM infrastructure, including observatories, aircraft, and data systems; and 18 are technical, including overviews of water vapor, broadband radiometry, surface properties, aerosols in climate models, and other topics.
Southern Great Plains Upgraded with New Instruments
As part of the next-generation ARM Facility initiative set forth in the 2014 Decadal Vision, the Southern Great Plains (SGP) atmospheric observatory in Oklahoma has almost finished a reconfiguration to become a “megasite.”
Responding to user requests to enhance the scientific measurements relevant to understanding land-atmosphere interactions and shallow convection at the SGP observatory, the ARM Facility undertook the reconfiguration to improve observations of temperature, humidity, and wind in the planetary boundary layer along with observations of soil moisture. New instrumentation began arriving on site for installation in spring and summer of 2015, some of it refurbished and redeployed from the former Tropical Western Pacific sites.
Local SGP staff, led by John Schatz, SGP’s on-site manager, helped implement the reconfiguration in collaboration with instrument mentors associated with the instrument systems
Site Operations
Early photos from the first fixed observatories and a mobile facility deployment are shared in a monograph, which published the history of the first 20 years of ARM.

30 ARM Climate Research Facility ANNUAL REPORT – 2016
planned for expansion or upgrade. The on-site team includes electronic technicians, computing experts, facilities and administrative staff, and site monitors. Even with the added effort of turning the SGP into a megasite, staff members’ regular work continued during the reconfiguration.
In FY2016, the creation of the SGP megasite was essentially finished, except for the instrument module for a new Aerosol Observing System (AOS), which measures a host of attributes of atmospheric aerosols. The SGP AOS instrument module is currently being completed and will be installed this fall.
ARM Expands Use of Unmanned Aerial Systems, Tethered Balloons
Concerned about rapid changes in the Arctic, the ARM Facility procured a fleet of unmanned aerial systems (UAS) to expand the scope of climate research activities on Alaska’s North Slope and provide data to enhance the accuracy of numerical climate models. Four units called DataHawks developed by the University of Colorado-Boulder were obtained by ARM after being tested during the Evaluation of Routine Atmospheric Sounding Measurements Using Unmanned Systems (ERASMUS) campaign.
The ARM Facility also developed a tethered balloon system (TBS) at the third ARM Mobile Facility in Oliktok Point
to characterize the Arctic boundary layer under a range of conditions. Using a payload capacity in excess of 100 pounds, this system can autonomously collect airborne data at regular occurrences while operating safely in the extreme conditions present in the Arctic.
These UAS and TBS systems were deployed in a series of measurement periods from April to October 2016 in the Inaugural Campaigns for ARM Research using Unmanned Systems, or ICARUS. Although the ARM Facility had collaborated with external partners on UAS and TBS operations in the past, ICARUS was the Facility’s first foray into routine UAS and TBS operations to be managed by ARM staff using ARM instruments and measurement platforms as well as ARM measurement processing conventions. The DataHawk UAS were flown by pilots from the Pacific Northwest National Laboratory and a contract pilot from the University of Alaska–Fairbanks, while the TBS were operated by ARM staff based at Sandia National Laboratories.
The combination of these atmospheric observations with measurements from both the ground and over the Arctic Ocean will give researchers insight into details of the complicated relationships between surface conditions, atmospheric structure, and thermodynamics and aerosol and cloud processes in the Arctic.
Situated on top of a shipping container, this three-channel microwave radiometer (left) is one of the new profiling instruments added to the Southern Great Plains atmospheric observatory.
Unmanned aerial systems known as DataHawks were added to the ARM Aerial Facility fleet this year.
31
Improvements to the Eastern North Atlantic Observatory
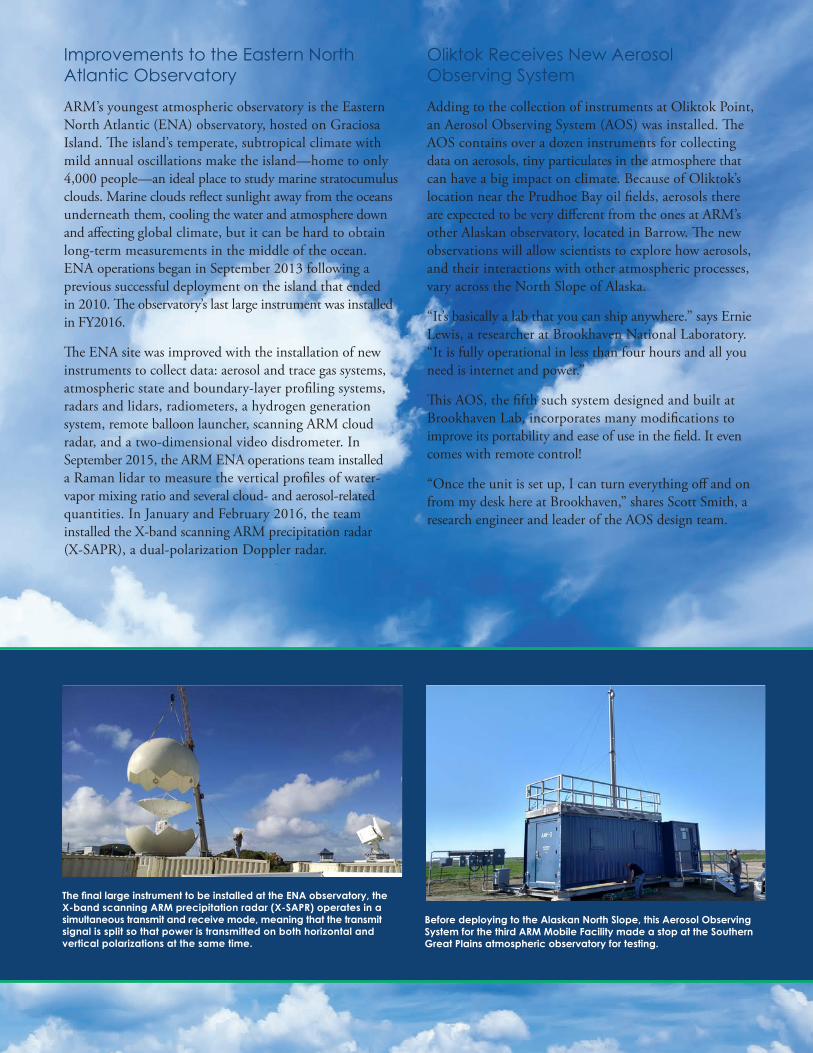
ARM’s youngest atmospheric observatory is the Eastern North Atlantic (ENA) observatory, hosted on Graciosa Island. The island’s temperate, subtropical climate with mild annual oscillations make the island—home to only 4,000 people—an ideal place to study marine stratocumulus clouds. Marine clouds reflect sunlight away from the oceans underneath them, cooling the water and atmosphere down and affecting global climate, but it can be hard to obtain long-term measurements in the middle of the ocean. ENA operations began in September 2013 following a previous successful deployment on the island that ended in 2010. The observatory’s last large instrument was installed in FY2016.
The ENA site was improved with the installation of new instruments to collect data: aerosol and trace gas systems, atmospheric state and boundary-layer profiling systems, radars and lidars, radiometers, a hydrogen generation system, remote balloon launcher, scanning ARM cloud radar, and a two-dimensional video disdrometer. In September 2015, the ARM ENA operations team installed a Raman lidar to measure the vertical profiles of water-vapor mixing ratio and several cloud- and aerosol-related quantities. In January and February 2016, the team installed the X-band scanning ARM precipitation radar (X-SAPR), a dual-polarization Doppler radar.
Oliktok Receives New Aerosol Observing System
Adding to the collection of instruments at Oliktok Point, an Aerosol Observing System (AOS) was installed. The AOS contains over a dozen instruments for collecting data on aerosols, tiny particulates in the atmosphere that can have a big impact on climate. Because of Oliktok’s location near the Prudhoe Bay oil fields, aerosols there are expected to be very different from the ones at ARM’s other Alaskan observatory, located in Barrow. The new observations will allow scientists to explore how aerosols, and their interactions with other atmospheric processes, vary across the North Slope of Alaska.
“It’s basically a lab that you can ship anywhere.” says Ernie Lewis, a researcher at Brookhaven National Laboratory. “It is fully operational in less than four hours and all you need is internet and power.”
This AOS, the fifth such system designed and built at Brookhaven Lab, incorporates many modifications to improve its portability and ease of use in the field. It even comes with remote control!
“Once the unit is set up, I can turn everything off and on from my desk here at Brookhaven,” shares Scott Smith, a research engineer and leader of the AOS design team.
The final large instrument to be installed at the ENA observatory, the X-band scanning ARM precipitation radar (X-SAPR) operates in a simultaneous transmit and receive mode, meaning that the transmit signal is split so that power is transmitted on both horizontal and vertical polarizations at the same time.
Before deploying to the Alaskan North Slope, this Aerosol Observing System for the third ARM Mobile Facility made a stop at the Southern Great Plains atmospheric observatory for testing.

32 ARM Climate Research Facility ANNUAL REPORT – 2016
Smith says the team designed the new AOS based on feedback from scientists and technicians with first-hand experience operating the previous versions of this system. Simple adjustments, like rearranging instrument racks, adding slide-out drawers, and incorporating back-up power systems, can make a big difference when something goes wrong at a remote location.
In March, the new AOS was shipped to the ARM Southern Great Plains atmospheric observatory in Oklahoma, where it underwent testing before being deployed to Oliktok Point, Alaska. As part of the ARM North Slope of Alaska atmospheric observatory, the AOS joined a suite of other meteorological instruments gathering data on clouds, precipitation, solar, and thermal energy, and basic weather patterns.
Oliktok Point Instruments Receive a Tune-Up
Before a radar site is “turned on” and data are made available to the public, the system has to be calibrated to ensure measurements are accurate. An entire suite of performance tests are run for the radars, and scientists provide feedback on the pattern that the radars scan to ensure the scan strategy supports their scientific goals. The third ARM Mobile Facility at Oliktok Point, Alaska, went through this procedure, called CGA for calibration, grooming, and alignment, in October 2015.
These tests are especially important for ARM radars, because of the radars’ numerous options for scanning patterns. While many of the parameters are fixed, several
can be modified to accommodate observational needs. For example, the speed at which the radar scans has to be optimized for the type of clouds being observed because a higher scan speed allows sampling of a larger volume while a slower scan speed allows detection of smaller particles. The remoteness of Oliktok Point also makes it important to test the radars, because the data from the instruments can’t normally be downloaded and analyzed until the hard drives are physically shipped to the lower 48 states.
Data AdvancementsFirst Results from LES-Modeling Project
After roping measurements and wrangling models for a year, LASSO released its first set of results, called the Alpha 1 release, in August 2016. LASSO, or Large-Eddy Simulation (LES) ARM Symbiotic Simulation and Observation workflow, is a two-year pilot project meant to bring measurements and models closer together by pairing ARM observations with LES output.
Instead of scientists getting measurements from the ARM Facility and then undergoing the process of running their own models, they can now access simulations that are pre-matched to the observational data sets, which provides a handy starting point for their own research. The initial research target for the LES capabilities is shallow convection—low-level, small puffy clouds. The representation of shallow convection is a perennial challenge for climate models
The Large-Eddy Simulation (LES) ARM Symbiotic Simulation and Observation workflow released its first data sets, including this example plot that shows observed versus simulated cloud fraction for August 1, 2015.
Radars at Oliktok Point were checked to make sure they were using optimal scan patterns and providing the best-quality data possible.

33
because the individual cloud elements are much smaller than a climate model grid box and can be susceptible to small changes in atmospheric or land-surface conditions.
Matched measurements and models are released together in comprehensive products called “data bundles.” Each data bundle has everything needed to reproduce and examine the simulations, including model inputs and outputs, ARM observations coincident with simulated values, model diagnostics and skill scores, and quicklook data plots of various fields.
The initial Alpha 1 release covers five days from 2015, but includes 192 simulations totaling three terabytes of data. Users can access the data through the LASSO Bundle Browser, which allows researchers to find relevant data.
Principal investigator Bill Gustafson, Pacific Northwest National Laboratory, and co-Principal Investigator Andrew Vogelmann, Brookhaven National Laboratory, released the Alpha 1 data set to give users a chance to use the data and offer any advice that would improve the product.
Data Storage Upgrades Future-Proof ARM Field Sites—For Now
Throughout 2016, Cory Stuart, ARM’s Site Data System and Cyber Security Manager, and his team at Argonne National Laboratory methodically visited all ARM observatories to upgrade the data systems—especially storage capacity. It began in early 2015 with the ARM site
data system team conducting capacity planning for all observatories to handle the reconfiguration at the Southern Great Plains; increase data storage capacity to deal with heavier data volumes from new radars; and maintain reliability, redundancy, and performance. A final goal was reducing the support effort, especially at remote locations.
ARM’s aim in this upgrade was to ensure adequate data capacity—from 16 terabytes (TB) of capacity at all locations to increasing the Southern Great Plains to 180 TB, ARM mobile facilities to 120 or 125 TB, Eastern North Atlantic to 120 TB, and North Slope of Alaska observatory to 58 TB—for the next five years. If more is required, the current solutions can be grown to meet the need.
Now, mainland facilities can hold six months of data, while mobile facilities can hold nine months. The first and second ARM mobile facilities each now boast a whopping 125 TB of usable disk space, about eight times what they had before. This “overkill capacity,” as Stuart terms it, is primarily to ensure disaster recovery, but it can also be used to allow for onsite processing.
By their last installation, completed at the Eastern North Atlantic observatory in the Azores on August 29, the team had their on-site time down to a mere two days. The secrets to such rapid-response deployments, which minimize data loss and cost, were preplanning, component testing, and up-front configuration at Argonne.
Cory Stuart, Site Data System and Cyber Security Manager, Argonne National Laboratory
“It’s easy to forget how unique this is. Basically, we’re running a complete enterprise data center in a seatainer. It’s hard to do this even in a purpose-built server room in downtown USA, much less in a steel box deployed to places as remote and potentially hostile as Antarctica or Ascension Island.”
—Cory Stuart, Site Data System and Cyber Security Manager, Argonne National Laboratory

34 ARM Climate Research Facility ANNUAL REPORT – 2016
ASR and ARM “Code Sprint” Produces Three New Data Products
A group of Atmospheric System Research scientists and ARM developers gathered at Stony Brook University, on Long Island, New York, from June 23 to July 1 for an intensive workshop. Together, they built three new beta-level ARM data products using observations from Scanning ARM Cloud Radars.
Without these new ARM data products, the Scanning ARM Cloud Radars produce raw data that are not immediately useful to most scientists. For example, the radar scans in a way that provides slices of information, but modeling uses a grid system. Basic radar measurements must also be transformed into atmospheric quantities used in research and modeling. Scientists need to translate the data using algorithms.
In the workshop—or “code sprint”—ARM data developers took algorithms that had been previously created and implemented them to run in a production environment. Instead of running the algorithms themselves, scientists will now be able to download usable data straight from the ARM Data Center. The code developers from Brookhaven National Laboratory were joined by the scientists who originally created the algorithms, and ARM Data Integrator staff at Pacific Northwest National Laboratory were available remotely to help with integrating the new programs.
The three data products provide quality-controlled, three-dimensional gridded radar moments and cloud fraction, quasi-vertical profiles of polarimetric variables, and profiles of the horizontal wind in the column over the radar.
With some final tweaks, the products became available shortly after the workshop. The data products are now making available years of radar data that were difficult for non-experts to use. Despite the long hours put in over the 10-day sprint, both scientists and developers left the workshop energized by their collaborative effort, thankful for the opportunity to focus their work on a single project and to produce results that exceeded their expectations.
Pavlos Kollias, Stony Brook University, and Eugene Clothiaux, Pennsylvania State University, spearheaded the organization of a “code sprint” workshop, bringing scientists, graduate students, postdocs, and developers together to create three ready-to-go radar data products.
Science OutreachWorkshop Features ARM Data
In November 2015, the First Workshop on Data Science, held in São Paulo, Brazil, was attended by 65 scientific experts to discuss national and international initiatives for data science that contribute to solving challenges in the context of open data science in Brazil.
During the two-day conference, Giri Prakash (formerly Palanisamy), ARM Data Services and Strategy Team Manager at Oak Ridge National Laboratory, hosted a training course on how to discover, access, and freely use ARM mobile and aerial data collected during the U.S.
Developers and scientists created new data products during an intensive “code sprint” at Stony Brook University.

35
Department of Energy’s Green Ocean Amazon 2014/15 (GoAmazon 2014/15) campaign. GoAmazon collected two years’ worth of data in Brazil’s Amazon Basin to study the coupled atmosphere-cloud-terrestrial tropical systems that drive tropical deep convection.
ARM Radar Technicians Trained at Southern Great Plains
At the end of September 2015, ARM hosted an intensive seven-day training course at the Southern Great Plains atmospheric observatory for site support staff members and radar technicians.
The ARM Facility currently operates 33 radars spread over six sites that stretch around the world, from Antarctica to the Arctic. These radars must operate in some of the most challenging environments and provide high-quality data to support scientific activities.
Maintaining this number of radars is challenging for the four ARM radar engineers in the Radar Engineering and Operations Group at Pacific Northwest National Laboratory. But, they don’t do this work alone, thanks to a mix of radar technicians and site support staff.
Covering a mix of theory and practice, the training course made sure that the staff members will be able to accurately detect and correct deviations from normal radar operational states. The topics ranged from system administration and maintenance of the many computer systems, to diagnosis
and replacement of the various radar sub-systems. The hands-on work had the technicians practicing to diagnose actual errors on the radars and fix them while on site under the tutelage of the radar mentors.
Courses like this give site staff members the training needed to accurately detect and correct deviations from normal radar operational states. The course was very helpful and just one of the many things the ARM Facility does to ensure that scientific users receive the highest-quality data.
ARM Attends 12th Annual IPC Conference
Every five years, the World Radiation Center/Physikalisch-Meteorologisches Observatorium Davos in Davos, Switzerland, hosts the International Pyrheliometer Comparison (IPC) Conference. Participants bring their instruments to the conference and receive the transferred World Radiometric Reference standard.
This year was the 12th annual conference and the fourth attended by ARM staff member Craig Webb, a calibration technician at the Southern Great Plains atmospheric observatory. The purpose of this conference is to provide participants with the World Radiometric Reference reduction factors for their absolute cavity radiometers, and other reference pyrheliometers, used throughout the world. Close to 90 people from about 40 countries attended the meeting.
Training attendees work to measure a signal on the top of an X-band scanning precipitation radar.
Maintaining data quality for the measurements from radiometers requires accurate and regular recalibration traceable to the World Radiometric Reference, the international standard of solar radiation measurement.

36 ARM Climate Research Facility ANNUAL REPORT – 2016
Joint Meeting between ARM Staff, ASR Scientists Moves Research Forward
To review progress from the past year and plan future research directions, about 240 Atmospheric System Research (ASR) scientists and ARM users and staff members met in May for the 2016 Joint User Facility/Principal Investigator Meeting in Tysons Corner, Virginia.
The three-and-a-half-day meeting included scientific presentations on everything from combining modeling and observations, to secondary organic aerosols, to ice nucleation. In total, there were 20 plenary presentations, 31 breakout sessions, and 169 science and facility posters.
Status of Value-Added Products for FY2016
Many of the scientific needs of the ARM Facility are met through the analysis and processing of existing data into value-added products (VAPs). These products provide an important translation between the instrumental measurements and the geophysical quantities needed for scientific analysis, particularly model parameterization and development. ARM VAPs pass through the stages of initiation, development, evaluation, and release.
At the evaluation stage, a VAP is provided to the larger scientific community for evaluation and feedback. After the evaluation period is complete, ARM quality control and data standards are applied, and the VAP data are moved to production status in the ARM Data Archive.
In FY2016, 7 new VAPs were initiated, 13 VAPs and 2 tools were released to production, and data for 12 VAPs were released to evaluation. Data were released to production because algorithms were updated, additional locations were added, or VAP processing code was moved to the ARM Data Integrator Library or a new operating system. See the Value-Added Product Descriptions section, located on page 43, for a list of VAPs that were initiated and released in 2016.
InitiationDesign and Approach
DevelopmentCode and Testing
EvaluationShare with Community
ReleaseProduction Status
There was also an ARM data booth to help ASR scientists and ARM users more effectively find and work with the data.
Key to the success of the Joint Meeting was two poster sessions to review research results, while breakout sessions addressed priority science and facility topics summarized in reports found on the meeting web page at http://asr.science.energy.gov/meetings/stm/2016/agenda. Plenary presentations by DOE program managers for ARM and ASR provided important DOE updates needed to keep scientists and users informed. Most importantly, the Joint Meeting gave the atmospheric research community an opportunity to interact and collaborate face to face.

37
Field Campaign SUMMARY
37

38 ARM Climate Research Facility ANNUAL REPORT – 2016 38
Field Campaign ActivitiesThe ARM Facility routinely hosts field campaigns at all its observatories, plus special data collection efforts and off-site campaigns. Many of these activities span several years. The pie chart here shows the total number of field campaigns, including ongoing efforts that occurred in FY2016. The subsequent table summarizes just those campaigns that began in FY2016. For more information, visit the field campaign web page at http://www.arm.gov/campaigns.
Field Campaign Total for FY2016
Dates Campaign Name Status Description
ARM Aerial Facility
October – September 2016
ARM Airborne Carbon Measurements (ARM-ACME VI)
Completed This research on atmospheric trace gases in the Southern Great Plains is contributing knowledge on regional carbon budgets, atmospheric dynamics, and satellite validation, generating 20 publications (18 published and 2 submitted) in the past 4 years. Research efforts using ARM-ACME data will continue to improve understanding of: (a) land-atmosphere carbon exchanges; (b) how carbon dioxide, methane, and associated water and energy fluxes influence carbon dioxide and methane concentrations; and (c) how greenhouse gases are transported on continental scales.
April 2016 – September 2016
Holistic Interactions of Shallow Clouds, Aerosols, and Land-Ecosystems (HI-SCALE)
Completed This campaign aims to provide detailed surface and aerial measurements to better understand the life cycle of shallow clouds by coupling cloud macrophysical and microphysical properties to land surface properties, ecosystems, and aerosols. HI-SCALE consists of two 4-week intensive observational periods, one in the spring and the other in the late summer, to take advantage of different stages and distribution of “greenness” for various types of vegetation near the ARM Southern Great Plains observatory as well as aerosol properties that vary during the growing season. Findings will be used to develop improved parameterizations for the next generation of climate models.
AMF - 6AAF - 2ENA - 4NSA - 9SGP - 11OFFSITE - 10
21%
14% 10%
26%
5%
24%

39
Dates Campaign Name Status Description
ARM Mobile Facility
November 2015 – January 2017
ARM West Antarctic Radiation Experiment (AWARE)
In Progress Rapid climate change on the West Antarctic Ice Sheet (WAIS) does not yet have a comprehensive explanation because no substantial atmospheric science or climatological field work has been done there since 1957. From McMurdo Station, which has a meteorological relationship with the WAIS, the second ARM Mobile Facility can gather sophisticated data with cloud radars, high spectral resolution lidar, and a complete aerosol suite. Beginning in late November 2015, a set of ARM equipment was deployed to the WAIS. The second ARM Mobile Facility deployed to McMurdo Station from January 2016 to January 2017 for a data set that will cover 14 months total from the two locations.
November 2015 – January 2017
ARM West Antarctic Radiation Experiment (AWARE): Filter Sampling Systems
In Progress This will be the first climate-related field campaign in West Antarctica in more than 40 years and will use advanced instrumentation to characterize and understand the abundance, origins, and chemical composition of Antarctic aerosols. AWARE filter samples will enable significant improvements to the characterization of aerosol impacts on Southern Ocean and Antarctic clouds and climate.
May 2016 – September 2017
Characterizing Potential Radiative Forcing on the North Slope of Alaska
In Progress This field campaign proposes to augment existing ARM instrumentation at the Barrow and Oliktok Point sites on the North Slope to improve determination of aerosol properties at the surface, including aerosol absorption by black carbon and brown carbon and chemical measurement of hygroscopic components. This 12-month campaign will make quantitative regional assessments of aerosol impacts on radiative forcing at the North Slope.
June 2016 – October 2017
Layered Atlantic Smoke Interactions with Clouds (LASIC)
In Progress Southern Africa is the world’s largest emitter of biomass-burning aerosols. Their westward transport over the remote southeast Atlantic Ocean co-locates some of the largest atmospheric loadings of absorbing aerosol with the least examined of the Earth’s major subtropical stratocumulus decks. LASIC is a strategy to improve understanding of aged carbonaceous aerosols and how clouds adjust to them. Instrumentation from the first ARM Mobile Facility is deployed to Ascension Island, located within the trade-wind shallow cumulus regime 3000 kilometers offshore of continental Africa. These measurements will span June 1, 2016 to October 31, 2017, encompassing two biomass-burning seasons and providing a stringent test for global aerosol models.
June 2016 – May 2017
Layered Atlantic Smoke Interactions with Clouds (LASIC): Supplemental Measurements
In Progress Supplementary measurements for the LASIC campaign will properly characterize the representativeness of the location of the first ARM Mobile Facility and the mobile aerosol observing system, address the island effect, and co-locate a microwave radiometer at the radiosonde launch site to constrain the radiosonde humidity profiles.

40 ARM Climate Research Facility ANNUAL REPORT – 2016
Dates Campaign Name Status Description
Off-Site Campaigns
January 2016 – June 2016
Dual Microwave Radiometer Experiment
Completed Passive microwave radiometers are the most commonly used and accurate instruments the ARM Facility has to retrieve cloud liquid water path, but microwave radiometer data are often contaminated by water on the radome. This experiment uses a pair of microwave radiometers—one operating normally, one under a roof—to study radome water contamination and investigate a potential solution.
January 2016 – August 2016
International Arctic Systems for Observing the Atmosphere (IASOA) Metadata Harvest for Oliktok Point Observations
Completed The IASOA was initiated as an International Polar Year project to address key atmospheric science questions through coordinating the observing assets at 10 pan-Arctic observatories. Cross-site data sharing through an IASOA-specific data access portal is a focus, including a vocabulary for data and a metadata standard. These efforts will increase the visibility and promote the use of currently archived DOE-ARM Arctic data.
February 2016 – March 2016
Deployment of ARM Aerial Facility (AAF) Scanning Mobility Particle Sizer in a Study of Cloud Condensation Nuclei Activity
Completed This campaign deployed the AAF scanning mobility particle sizer from February 8 to March 31, 2016 at the Pacific Northwest National Laboratory Environmental Simulation Chamber. This study extended an earlier project and focused on secondary organic aerosol formed from biogenic volatile organic compounds. These measurements provided cloud condensation nuclei spectrum and activation fraction for size-selected particles, allowing a clear separation of the impact of aerosol composition from size.
March 2016 – March 2018
Macquarie Island Cloud and Radiation Experiment (MICRE)
In Progress Clouds over the Southern Ocean are poorly represented in reanalysis products and global climate model simulations. In response, the ARM Facility deployed ground instrumentation to Macquarie Island (off the southern coast of New Zealand), which has a small research station operated by the Australian Antarctic Division and the Australian Bureau of Meteorology. This experiment will be conducted over two years in coordination with Australian Antarctic Division and Australian Bureau of Meteorology activities. The measurements obtained will be used to evaluate the seasonal cycle of surface radiative fluxes, along with cloud and aerosol properties over the Southern Ocean.
June 2106 – September 2016
Black Carbon at the Mount Bachelor Observatory
Completed Black carbon is a significant climate forcing agent. Observations at remote sites and in free-tropospheric air are sparse. Researchers used one of the ARM Aerial Facility’s single-particle soot photometers to measure refractory black carbon at the Mount Bachelor Observatory in Oregon for five months. This observatory experiences free tropospheric air at least 50 percent of the time and can frequently detect elevated concentrations of aerosols, carbon dioxide, nitrogen oxides, ozone, and other natural and anthropogenic pollution from long-range transport.

41
Dates Campaign Name Status Description
Off-Site Campaigns
September – September 2016
Biomass Burning Research Using the DOE ARM single-particle soot photometer
Completed During this laboratory study for the Biomass Burning Observation Project (BBOP), researchers sought to (a) characterize the physiochemical properties of laboratory-generated tar balls from BBOP-related fuel materials; (b) characterize and quantify BBOP measurements of tar balls by the single-particle soot photometer, Soot Particle Aerosol Mass Spectrometer, transmission electron microscope, and optical instrumentation with and without thermal denuding; and (c) compare laboratory results as a function of fuel type with field observations to investigate potential variations in formation, chemical compositions, phase, and particle volatilities.
Southern Great Plains
April 2016 – September 2017
Chemical Composition Newly Formed Organic Aerosols by Spot-Sampler Nano-Desorption Electrospray Ionization Mass Spectrometry
In Progress One challenge in explaining the role of atmospheric particles in global climate is to identify the chemical pathways by which nanometer-sized particles grow to become cloud condensation nuclei, and thereby influence the physical characteristics and lifetime of clouds. Of specific interest is the role of amines, sulfonated organic compounds, and other organic species. This campaign involves off-line characterization of ambient nanoparticle aerosol samples using the nano-Desorption Electrospray Ionization Mass Spectrometry at EMSL, the Environmental Molecular Sciences Laboratory. These data are used to elucidate how newly formed particles grow and to characterize differences between nucleation and non-nucleation periods.
April 2016 – September 2017
Growth of Newly Formed Particles and Formation of Cloud Condensation Nuclei
In Progress New particle formation in the atmosphere strongly influences the concentration of atmospheric aerosol particles, and therefore their impact on clouds and climate. This study will provide detailed information on organic species in growing ultrafine particles, and insight into the processes that drive the growth of newly formed particles and their formation of cloud condensation nuclei.
April 2016 – September 2017
Microscopic Observations of Aerosol Mixing State at the Southern Great Plains
In Progress Changes in chemical mixing state affect large-scale processes such as cloud formation and have created uncertainty in atmospheric models. Single-particle spectro-microscopy techniques such as computer-controlled scanning electron microscopy coupled with energy dispersive X-ray spectroscopy (CCSEM/EDX) have been used to characterize composition, size, and extent of internal mixing of aerosol particles from field campaigns. CCSEM/EDX provides elemental composition of aerosol particles, including the inorganic fraction. This study involves application of mixing-state parameterization at the Southern Great Plains observatory.

42 ARM Climate Research Facility ANNUAL REPORT – 2016
Dates Campaign Name Status Description
Southern Great Plains
April 2016 – September 2017
Chemical Imaging and Molecular Characterization of Solid Organic Particles Discovered in the Area of Southern Great Plains
In Progress Recent discovery of solid (glassy) atmospheric soil organic particles (ASOP), emitted through atmosphere-land surface interactions in the Southern Great Plains, suggests that ASOP may have a regional-scale impact. The objective of this project is in-depth chemical imaging of particles and molecular-level studies of physicochemical properties of ASOP typical for the Great Plains, with the ultimate goal of providing data necessary for parameterization of ASOP properties in atmospheric and climate models.
April 2016 – May 2016
Holistic Interactions of Shallow Clouds, Aerosols, and Land-Ecosystems (HI-SCALE): National Geospatial-Intelligence Agency Calibration Target Placements
Completed This experiment tested the feasibility of incorporating atmospheric models (to be run during HI-SCALE) to improve simulation algorithms of image collection. The simulation algorithms are being developed at the National Geospatial-Intelligence Agency. The agency’s simulations do not currently model changing atmospheric parameters at high spatial resolution. This experiment measured calibration objects placed on the ground during HI-SCALE to characterize the contribution of atmospheric effects to artifacts that appear in imagery.
August 2016 – September 2016
Holistic Interactions of Shallow Clouds, Aerosols, and Land-Ecosystems (HI-SCALE): Nano-Particle Number Concentrations
Completed During the second HI-SCALE intensive operational period from August 28 to September 26, 2016, this campaign deployed two newly developed nanoparticle water-based condensation particle counters (nano-WCPC). These nano-WCPC measure the number concentration of airborne particles as small as 1 or 2 nanometers based on activation of growth via water condensation. This data set will enable identification of particle nucleation events and examination of particle growth rates.
August 2016 – September 2016
Holistic Interactions of Shallow Clouds, Aerosols, and Land-Ecosystems (HI-SCALE): Nanoparticle Composition and Precursors
Completed A small suite of instruments were placed in the Guest Instrument Facility at the Southern Great Plains Central Facility in support of HI-SCALE during the second intensive operational period. The objectives were to fully characterize the formation and evolution of atmospheric aerosol particles through measurements of gas-phase precursor and ambient nanoparticle composition. This work, in turn, could create a comprehensive data set on new particle formation and growth for use in modeling.

43
Value-Added PRODUCTS
43

44 ARM Climate Research Facility ANNUAL REPORT – 201644 ARM Climate Research Facility ANNUAL REPORT – 2016
Value-Added Product UpdatesIn FY2016, 7 new value-added data products were approved for development, 13 data products and 2 tools were released to production, and data for 12 value-added products were released to evaluation. Significant development efforts are featured below.
Data Product and Tool Highlights
Aerosol Observing System (AOS) HarmonizationThe AOS harmonization is an effort to standardize the techniques used to process data from the AOS. The goal is to provide uniform AOS data files and products across ARM sites. Standardizing the processing workflow and configuration files will help streamline the conduit of information between the instrument mentors, Data Management Facility, and Data Quality Office.
Additional effort has focused on improving and standardizing the corrections, calibrations, and data-quality assessments used to process AOS measurements. This multi-year effort has harmonized aerosol optical property instruments including particle counters, impactors, wet and dry nephelometers, particle absorption, soot particle photometer, trace gases, and cloud condensation nuclei. Harmonized datastreams are available at the ARM Data Archive.
Radiative Flux Analysis (RADFLUX)An updated RADFLUX algorithm to estimate clear-sky shortwave and longwave surface radiative fluxes was developed and released to production. Historical data from all ARM sites were processed using calibrated, quality-controlled input data and released to the ARM Data Archive. Data from instruments at 43 locations, including extended facilities—and over 400 years of data—are now available at the ARM Data Archive.
Radar Contour Frequency by Altitude Diagrams (CFADs)CFADs are useful tools for evaluating model output using radar simulators. CFADs are frequency distributions of radar reflectivity as a function of height; daily diagrams were released for the Southern Great Plains atmospheric observatory for 2006 to 2010.
Python ARM Radar Toolkit (Py-ART)A new version of Py-ART (version 1.5.0) was released and is available at the GitHub open source repository. New features include new algorithms for reading Ka-band ARM Zenith Radar (KAZR) files, installers that run on the Windows™ operating system, circular statistics for computing radar fields that are prone to folding, and new methods for filtering gate data.
Released to Production
ARMBE2DGRID and ARMBESTNS: ARM Best Estimate Data ProductsARM Best Estimate 2-Dimensional Gridded Surface (ARMBE2DGRID) and Station-Based Surface (ARMBESTNS) value-added products merge together key surface measurements from the extended facilities at the Southern Great Plains atmospheric observatory and provide interpolated data on a two-dimensional grid. Data products were reprocessed and released to the ARM Data Archive for 2011 and 2012.
GRIDDEDSONDE and INTERPSONDE: Two Improved Sonde ProductsImproved gridded (GRIDDEDSONDE) and interpolated sonde (INTERPSONDE) products were released to production for use with historical data and current production. These data products are important inputs into the Merged Sonde value-added product.
KAZRARSCL and KAZRCOR: Ka ARM Zenith Radar Active Remotely-Sensed Cloud Locations and Radar CorrectionAutomated algorithms for both KAZRARSCL and KAZRCOR value-added products were released to production. The KAZRARSCL data product provides cloud boundaries and best-estimate time-height fields of radar moments. The KAZRCOR data product produces significant detection mask, corrects reflectivity for gaseous attenuation, and dealiases mean Doppler velocity.
MASC: Multi-Angle Snowflake Camera Value-Added ProductNew automated software for processing MASC images was released to production. The MASC instrument measures high-resolution, multi-angle images of hydrometeors. Primary output variables include images from three cameras, hydrometeor fall speed, max dimension, geometric cross section, area-equivalent radius, perimeter, orientation, and aspect ratio.

4545
QCRAD: Data Quality Assessment for ARM Radiation DataQCRAD provides quality-controlled broadband surface radiometer data. The updated algorithm was released to production. Data for the Oliktok Point, and Eastern North Atlantic facilities are available at the ARM Data Archive.
Data Released to Evaluation
CLDTYPE and SHALLOWCUMULUS: Cloud Classification Value-Added ProductsTwo cloud classification value-added products, CLDTYPE and SHALLOWCUMULUS, were developed to help identify cloud type using profiling instruments. These data are valuable for identifying shallow cloud cases for the LASSO modeling team. Several months of evaluation data, coinciding with the LASSO Alpha 1 release, are available for evaluation.
QCECOR: Quality-Controlled Eddy Correlation Flux Measurement Eddy correlation flux measurement systems provide surface turbulence flux measurements. Quality-controlled evaluation data were released for six locations at the Southern Great Plains atmospheric observatory and from the Green Ocean Amazon, or GoAmazon 2014/15, field campaign.
MWRRETv2: Microwave Radiometer Retrieval Version 2Liquid water path and precipitable water vapor retrievals from the 3-channel microwave radiometer are now available through the MWRRETv2 at the ARM Data Archive for 2015 from the Southern Great Plains observatory.
SACR-ADV-VAD: Scanning Radar ProductsA month of data are available for evaluation from the Scanning ARM Cloud Radar Advanced Velocity Azimuth Display, or SACR-ADV-VAD, value-added product for August 2012 at the Southern Great Plains observatory and for September 2012 from Cape Cod, Massachusetts, during the Two-Column Aerosol Project. SACR-ADV-VAD provides horizontal wind speed and direction derived from scanning cloud radars.
VARANAL: Variational Analysis Continuous Model Forcing DataThis variational analysis product provides large-scale forcing terms and evaluation fields for initializing single-column and cloud-resolving models. Continuous model forcing data at the Southern Great Plains observatory were released for 2012 and June to August 2015.
WACRARSCL: W-band ARM Cloud Radar Active Remote Sensing of Clouds WACRARSCL combines observations from the W-band cloud radar, micropulse lidar, and ceilometer to produce cloud boundaries and time-height profiles. Data from the AWARE, or ARM West Antarctic Radiation Experiment, in Antarctica were released for evaluation.
A month of evaluation data from two ARM locations for wind speed and direction was made available using the Scanning ARM Cloud Radar Advanced Velocity Azimuth Display, or SACR-ADV-VAD.
Combining data from the W-band cloud radar, micropulse lidar, and ceilometer results in better cloud boundary and time-height profiles; evaluation data for the ARM West Antarctica Radiation Experiment were processed.
AWR WACR-ARSCL Reflectivity Best Estimate 20160103 sgpkasacradvvadC1.c1 for 2D120801-2D120807

46 ARM Climate Research Facility ANNUAL REPORT – 2016
Long-Time ARM Data Archive Manager RetiresOne of Raymond McCord’s last acts as Archive Manager for the ARM Facility was to attend the 2016 ARM/Atmospheric System Research Joint User Group/Principal Investigator Meeting in Tysons Corner, Virginia, from May 2 to 5. This provided a fitting opportunity for ARM staff—and many in the wider atmospheric sciences community—to offer a heartfelt “thank you!” in saluting the long-time leader of the ARM Facility’s globally renowned data archive.
After 21 years of exemplary service, McCord, Oak Ridge National Laboratory, traded in the satisfactions and challenges of ARM’s ambitious climate measurement mission for the quieter pleasures of family and personal pursuits. He joined the Facility in 1995 as the second Data Archive Manager. McCord’s leadership helped establish ARM’s current archive at a time when online data discovery and distribution were relatively new.
46 ARM Climate Research Facility ANNUAL REPORT – 2016
Raymond McCord (left) speaks with conference attendees at an American Geophysical Union Fall Meeting.

4747
On the covers:
Front – Second ARM Mobile Facility in Antarctica A full moon rises above the ARM West Antarctic Radiation Experiment, known as AWARE. On the ice for a total of 14 months in two locations, the second ARM Mobile Facility collected critical data in this remote and harsh location. Photo credit: Anthony Powell, frozensouth.com
Back – Aurora Australis at the AWARE Site Overlooking McMurdo A laser beam pierces the night from the High Spectral Resolution Lidar, which provides information about cloud and aerosol layer microphysics. Photo credit: Joshua Swanson, United States Antarctic Program
47

www.arm.gov