Embed Size (px)
Citation preview
2016
Annual Activity
Report
Directorate General
for Agriculture and
Rural Development
Ref. Ares(2017)2290989 - 04/05/2017

agri_aar_2016 Page 2 of 114
Foreword
Dear stakeholders,
The Juncker Commission committed to foster a New Start for Europe with a clear agenda for Jobs, Growth, Fairness and Democratic Change, focussing action on those challenges where the EU can deliver real added value for our citizens.
My Annual Activity Report for 2016 sets out how DG AGRI has implemented this programme and how the Common Agricultural Policy contributes to the Commission priorities such as Jobs, Growth and Investment, Digital Single Market, Energy Union and Climate Change, and Balanced EU/US Trade.
You will find on the first dozen of pages an overview of the challenges as they arise, the actions DG AGRI has taken to respond and the impact observed on the ground.
In 2016, the year covered by this Annual Activity Report (AAR), the sector continued to be marked by a crisis in several of the markets for agricultural products and notably the dairy sector. DG AGRI responded to the ongoing price pressure in the dairy sector with two assistance packages. Dairy product prices began to recover during the year. DG AGRI also contributed to the important analysis of the functioning of the food supply chain via the Agricultural Markets Task Force. Building on a screening conducted in 2015, several simplifications have been introduced through Delegated and Implementing Acts. Further simplifications have been proposed to the 4 basic Acts in the framework of the 'Omnibus regulation' proposal. The Directorate-General tackled error rates through its audit missions.
2016 was the second year of full implementation of the Common Agricultural Policy (CAP) reform of 2013, including the new "greening" payment and the first year after the approval of the rural development programmes 2014-20. This allowed starting fact gathering and preparing for the public consultation on the modernization and simplification of the CAP post 2020, which was launched in 2017. In the field of international negotiations, the year enabled the successful conclusion of the CETA negotiations.
This report gives a fair and comprehensive overview of DG AGRI's activities and achievements in 2016 and I am confident that it will provide valuable information about the performance of the CAP and its practical and administrative functioning.
Let me close by expressing my respect and gratitude to all DG AGRI staff. I am grateful that they managed these challenges despite a progressive reduction of human resources and an increase in the general workload.
Jerzy Plewa Director-General

agri_aar_2016 Page 3 of 114
Table of Contents
THE DG IN BRIEF 4
EXECUTIVE SUMMARY 8
A) KEY RESULTS AND PROGRESS TOWARDS THE ACHIEVEMENT OF GENERAL AND SPECIFIC OBJECTIVES ............................................. 8 B) KEY PERFORMANCE INDICATORS (KPIS) ......................................................................................................................... 9 C) KEY CONCLUSIONS ON FINANCIAL MANAGEMENT AND INTERNAL CONTROL ......................................................................... 10 D) INFORMATION TO THE COMMISSIONER ........................................................................................................................ 11
1. KEY RESULTS AND PROGRESS TOWARDS THE ACHIEVEMENT OF GENERAL AND SPECIFIC OBJECTIVES12
1.1 COMMISSION GENERAL OBJECTIVE 1: JOBS, GROWTH AND INVESTMENT ................................................................... 13 1.2 COMMISSION GENERAL OBJECTIVE 2: DIGITAL SINGLE MARKET................................................................................ 25 1.3 COMMISSION GENERAL OBJECTIVE 3: ENERGY UNION AND CLIMATE CHANGE ............................................................ 27 1.4 COMMISSION GENERAL OBJECTIVE 6: A BALANCED EU-US FREE TRADE AGREEMENT .................................................. 35
2. ORGANISATIONAL MANAGEMENT AND INTERNAL CONTROL 39
2.1 FINANCIAL MANAGEMENT AND INTERNAL CONTROL ................................................................................................ 39 2.1.1 CONTROL RESULTS ........................................................................................................................................... 39 2.1.1.1 PAYMENTS EXECUTED IN 2016 FOR THE CAP ....................................................................................................... 39 2.1.1.2 CONTROL EFFECTIVENESS AS REGARDS LEGALITY AND REGULARITY ............................................................................. 40 2.1.1.3 HOW DG AGRI PROTECTS THE EU BUDGET ......................................................................................................... 74 2.1.1.4 COST-EFFECTIVENESS AND EFFICIENCY ................................................................................................................. 81 2.1.1.5 FRAUD PREVENTION AND DETECTION .................................................................................................................. 83 2.1.1.6 OTHER CONTROL OBJECTIVES: SAFEGUARDING OF ASSETS AND INFORMATION.............................................................. 84 2.1.2 AUDIT OBSERVATIONS AND RECOMMENDATIONS ................................................................................................... 85 2.1.2.1 INTERNAL AUDIT SERVICE (IAS) ......................................................................................................................... 85 2.1.2.2 EUROPEAN COURT OF AUDITORS: 2015 ANNUAL REPORT ...................................................................................... 87 2.1.2.3 EUROPEAN COURT OF AUDITORS: SPECIAL REPORTS .............................................................................................. 88 2.1.3 ASSESSMENT OF THE EFFECTIVENESS OF THE INTERNAL CONTROL SYSTEMS .................................................................. 90 2.1.4 CONCLUSIONS AS REGARDS ASSURANCE ................................................................................................................ 92 2.1.5 DECLARATION OF ASSURANCE AND RESERVATIONS ................................................................................................. 98
DECLARATION OF ASSURANCE 99
2.2 OTHER ORGANISATIONAL MANAGEMENT DIMENSIONS .......................................................................................... 109 2.2.1 HUMAN RESOURCE MANAGEMENT .................................................................................................................... 109 2.2.2 BETTER REGULATION ...................................................................................................................................... 110 2.2.3 INFORMATION MANAGEMENT ASPECTS .............................................................................................................. 111 2.2.4 EXTERNAL COMMUNICATION ACTIVITIES ............................................................................................................. 112 OTHER ORGANISATIONAL ACHIEVEMENTS IN 2016 .......................................................................................................... 113 EXAMPLES OF ECONOMY AND EFFICIENCY ....................................................................................................................... 114

agri_aar_2016 Page 4 of 114
THE DG IN BRIEF
Mission
The mission of the Directorate-General for Agriculture and Rural Development is to
promote the sustainable development of Europe's agriculture and to ensure the well-being of its rural areas.
Treaty obligations and competences of the EU
The Common Agricultural Policy (CAP) is a genuinely European policy as Member States pool resources to operate a single European policy with a single European budget.
The objectives of the CAP as laid out in Article 39 of the Treaty of the Functioning of the European Union (TFEU) are:
to increase agricultural productivity; to ensure a fair standard of living for the agricultural community;
to stabilise markets;
to assure the availability of supplies; to ensure that supplies reach consumers at reasonable prices.
The Treaty objectives, together with horizontal policy clauses (e.g. on the protection of the environment, consumer protection or animal welfare), provide the framework for all
EU initiatives and activities. Fulfilling these objectives in the light of changing internal and external challenges requires formulating political priorities which reflect the specific
needs of a given point in time. This is the case for the key strategic orientation at EU level as well as for the key aims any EU policy intends to achieve.
In the case of the CAP, to reach the TFEU objectives, three overarching objectives for
the CAP of • viable food production,
sustainable management of natural resources and climate action, and balanced territorial development
were set out in the Regulation on the financing, management and monitoring of the CAP1. The CAP sets out complementary measures designed to jointly achieve all three
objectives. They contribute to the headline targets (climate and energy, research and development, employment, social inclusion) and flagship initiatives (innovation, resource
efficiency, youth, digital agenda, new skills and jobs) of the EU 2020 Strategy2 and to
the fundamental Treaty objectives. In addition, the CAP participates in the Commission actions to implement the UN 2030 Agenda for Sustainable Development and meet the
Sustainable Development Goals (SDGs)3.
The contribution of the CAP to the political priorities of the Juncker Commission4 is
particularly significant towards the delivery of the following four Commission general objectives:
1. A New Boost for Jobs, Growth and Investment (Juncker priority 1)
2. A Connected Digital Single Market (Juncker priority 2)
3. A Resilient Energy Union with a Forward-Looking Climate Change Policy (Juncker
1 Regulation (EU) No 1306/2013 of the European Parliament and of the Council of 17 December 2013 on the
financing, management and monitoring of the common agricultural policy and repealing Council Regulations
(EEC) No 352/78, (EC) No 165/94, (EC) No 2799/98, (EC) No 814/2000, (EC) No 1290/2005 and (EC) No
485/2008. 2 https://ec.europa.eu/info/strategy/european-semester/framework/europe-2020-strategy_en and the
Communication from the Commission EUROPE 2020 - A strategy for smart, sustainable and inclusive growth
(COM(2010)2020) 3 Communication from the Commission to the European Parliament, the Council, the European Economic and
Social Committee and the Committee of the Regions - Next steps for a sustainable European future European
action for sustainability,22/11/2016, COM(2016)739. 4 The ten priorities of the Juncker Commission (http://ec.europa.eu/priorities/index_en)
agri_aar_2016 Page 5 of 114
priority 3)
4. A Reasonable and Balanced Free Trade Agreement with the U.S. (Juncker
priority 6).
In addition, DG AGRI's international cooperation activities contribute to the Commission general objective "A Stronger Global Actor" (Juncker priority 9). Some rural development
programmes provide support to migration issues and therefore contribute as well to Commission general objective " Towards a new policy on Migration" (Juncker priority 8).
Types of Commission intervention
DG AGRI acts through different types of interventions:
The overall policy conception and formulation of the CAP is based on policy and
economic analysis, evaluation and impact assessments.
DG AGRI is managing an allocation amounting to EUR 408.3 billion in commitments (in current prices) or around 37.7% of the overall amounts for the
programming period of the Multiannual Financial Framework (MFF) 2014-2020.
The CAP is financed through two funds, i.e. the European Agricultural
Guarantee Fund (EAGF) and the European Agricultural Fund for Rural Development (EAFRD). The EAFRD is part of the Common Strategic Framework5
(CSF) for ESI-funds 2014-2020, where Rural Development (RD) priorities translate and feed into the CSF thematic objectives.
DG AGRI also contributes to the Instrument for Pre-accession assistance (IPA II) for the part related to rural development (IPARD).
Furthermore, DG AGRI participates in the implementation of the Horizon 2020
Framework Programme for Research and Innovation for the part related to
securing sufficient supplies of safe and high quality food and other bio-based products.
By its assurance and audit activities, DG AGRI verifies that the conditions under
which controls and payments have been carried out by the Member States give reasonable assurance that the CAP expenditure has been effected in conformity
with EU rules and, where it is not the case, exclude the expenditure concerned
from EU financing.
DG AGRI contributes to the negotiation of international agreements touching upon areas of agricultural policy (trade in agricultural products, quality policy,
food security etc.), contributes to the implementation of such international agreements and manages the relations with third countries related to agriculture.
By its regulatory and enforcement actions, DG AGRI prepares legislative proposals, negotiates these with the other institutions and monitors their
implementation to ensure a harmonised application. The DG manages various Commission regulations laying down detailed implementing rules as well as their
adaptation over time. DG AGRI also deals with state aid/competition and infringements, control of implementation of the acquis, complaints and
Ombudsman inquiries.
Organisation and human resources
In 2016, the Directorate-General for Agriculture and Rural Development (DG AGRI) had a
5 The Common Strategic Framework (CSF) for 5 European Structural and Investment Funds (ESI Funds) was
adopted to enhance the coordination and complementarity between the EU's main funding instruments
(Regulation (EU) No 1303/2013 of the European Parliament and of the Council of 17 December 2013 laying
down common provisions on the European Regional Development Fund, the European Social Fund, the
Cohesion Fund, the European Agricultural Fund for Rural Development and the European Maritime and Fisheries
Fund and laying down general provisions on the European Regional Development Fund, the European Social
Fund, the Cohesion Fund and the European Maritime and Fisheries Fund and repealing Council Regulation (EC)
No 1083/2006).
agri_aar_2016 Page 6 of 114
staff of around 10006 and was made up of 11 directorates. Eight operational directorates were responsible for managing agricultural market measures, direct support, rural
development, research, pre-accession assistance, international relations and audit. Three
directorates were in charge of policy strategy and coordination – covering the design, implementation, enforcement and evaluation of the Common Agricultural Policy (CAP) –
and administrative support, including budget and financial management, and internal control.
2016 was the first year of delivery of the DG AGRI specific agreement on staff
reductions, concluded at political level and covering the period 2016-2018. This agreement will ultimately lead to a reduction of approximately 20% of DG AGRIs
workforce at the end of this period. As a consequence of these cuts, the organisational
structure needed to be adapted as from January 2017. The restructuring is the result of an extensive staff consultation process throughout 2016, with surveys and contributions
at all levels in the DG and leads to a reduction of six units, one directorate and the suppression of one Deputy Director General function from the beginning of 2017.
Budget implementation
In 2016, DG AGRI managed a budget of around EUR 54,6 billion in voted payment appropriations (which accounts for around 39% of the overall EU budget7), split between
nine activity areas: Administrative expenditure (ABB01), Interventions in agricultural markets (ABB02), Direct support (ABB03), Rural development (ABB04), Pre-accession
measures (ABB05), International aspects (ABB06), Audit (ABB07), Horizon 2020 — Research and innovation (ABB09) and Policy strategy and coordination (ABB08). The
three major activity areas ABB02, ABB03 and ABB04 (all executed under shared
management mode) accounted in total for EUR 53,9 billion8.
DG AGRI operates in three management modes:
Shared management (98,7%) for interventions in agricultural markets, direct
support and rural development: Implementation vis-à-vis final beneficiaries is delegated to the Member States, while the Commission is responsible for the
implementation of the overall legal framework, budget implementation and for Member States' supervision;
Indirect management (0,8%) for pre-accession measures: Implementation vis-
à-vis the final beneficiaries is delegated to the authorities of the beneficiary
country;
Direct management (0,5%) for other activities: contracts are concluded directly with third parties to supply the DG with studies, promotion activities and
information and communication activities. With the launch of Horizon 2020 – the Framework Programme for Research and Innovation (2014-2020) in 2014, DG
AGRI has delegated the entire operational management of its research activity to
the Research Executive Agency (REA). DG AGRI has also delegated an important part of the operational management of the promotion of agricultural products to
the Consumers, Health, Agriculture and Food Executive Agency (CHAFEA).
External factors that could impact on the achievement of the objectives and general risk environment
Agriculture, as the primary sector producing food, feed and biomass, depends on
economic developments, but it also interacts with nature and depends on natural resources and climate. It is also closely interlinked with the wider rural economy and its
development. The relative importance of these external factors differs across CAP instruments, agricultural sectors, as well as geographically.
6 DG AGRI staff (officials and external staff) on 01/01/2016: 1081 members of staff; on 01/01/2017: 992. 7 Execution 2015: 40.4% for CAP. 8 More detailed figures see section 2 Organisational management and internal control.
agri_aar_2016 Page 7 of 114
To be able to better interpret the impact and result indicators of the CAP, as part of the monitoring and evaluation framework a set of context indicators have been developed.
The CAP has more than eight million beneficiaries, supported under a variety of
different schemes. This entails a very high number of financial transactions.
Implementation takes place predominantly in shared management where DG AGRI relies on Member States' cooperation in taking all necessary measures to achieve the
CAP objectives and ensure effective as well as legal and regular implementation of the various support schemes.
The natural cycle of agricultural activities shapes the controls to be carried out (e.g. many on-the-spot checks to verify eligibility conditions can only take place in certain
periods of the year) and the frequency of payments to beneficiaries. Paying agencies account for payments to beneficiaries on an annual basis in their accounting and
declaration to the Commission. Expenditure declarations from the Member States are cleared by the Commission via an annual financial clearance of accounts exercise,
combined with conformity clearance procedure following up on errors, addressing weaknesses and leading to net financial corrections. In addition, a new legal framework
for interruptions, reductions and suspension of CAP payments to Member States entered
into force in 2014, which strengthens the Commission’s powers to protect the EU financial interest in cases where serious risks of irregular payments have been identified.
These features underpin the design of the CAP management and control system,
described in section 2 of the AAR.
The implementation of the 2013 CAP reform and its impact on the general risk
environment requires additional efforts in term of control activities and administrative capacity of the DG.

agri_aar_2016 Page 8 of 114
EXECUTIVE SUMMARY
The Annual Activity Report is a management report of the Director-General of DG Agriculture and Rural Development to the College of Commissioners. Annual Activity
Reports are the main instrument of management accountability within the Commission
and constitute the basis on which the College takes political responsibility for the decisions it takes as well as for the coordinating, executive and management functions it
exercises, as laid down in the Treaties9.
a) Key results and progress towards the achievement of
general and specific objectives
Overall, a difficult economic situation continued to press on the EU farm sector in 2016,
but DG AGRI responded with appropriate short-term tools. It also took further steps
needed for the long-term development of agriculture, the food sector and rural areas as a whole – by assisting in the implementation of remodelled direct payment schemes and
the new rural development programmes (RDPs), as well as through international negotiations.
With regard to the general objective "Jobs, growth and investment", the employment rate in rural areas has climbed past its pre-crisis level and the farm sector continues to
operate at prices close to world market prices. However, in spite of a constant increase in productivity (especially labour productivity), the sector's agricultural factor income has
been slowly decreasing over the last three years – largely because of price weakness in
some sectors, especially the dairy market.
In response to ongoing price pressure in the dairy sector, DG AGRI built on the work of
the previous year with two assistance packages. Dairy product prices began to recover during the year. More generally, the Commission contributed to important analysis of the
functioning of the food supply chain via the Agricultural Markets Task Force. The Commission's ongoing assistance in the implementation of direct payment schemes and
RDPs was important for employment and growth because of the contribution that these policy instruments make to farm income and development, business start-ups,
knowledge-building, innovation and general investment.
With regard to the general objective "Digital Single Market", broadband access in rural areas continues to improve, with 93 % of rural homes benefiting from basic coverage
and 40 % from Next-Generation Access – partly thanks to relevant CAP support through RDPs. In 2016 DG AGRI worked with DGs REGIO and CONNECT to set up Broadband
Competence Offices in Member States, which will help businesses and individuals to access related EU funds more easily.
With regard to the general objective "Energy Union and climate change", greenhouse gas emissions from EU agriculture continue to fall. In addition, the area farmed
organically steadily increases and a large portion of agricultural area is being farmed
according to specific eco-friendly practices : the new "greening" layer of the direct payments system now covers 77 % of utilised agricultural area (UAA), and the 2014-
2020 RDPs build on this by supporting more demanding practices. In 2016 DG AGRI supported these achievements through a review of the greening system, through ongoing
assistance of implementation of direct payments and the new RDPs, and more broadly through contributions to international climate-related negotiations and to the EU 2030
Climate and Energy Framework.
With regard to the general objective "A balanced EU-US free trade agreement", the
EU is growing its agri-food trade with the US (+6.5 %) and total EU agri-food exports
continue to increase – thanks in part to the CAP's focus on building a market-responsive
9 Article 17(1) of the Treaty on European Union.

agri_aar_2016 Page 9 of 114
and competitive farm sector, through fair and efficient policy tools. Progress on the Transatlantic Trade and Investment Partnership (TTIP) has halted, but DG AGRI played
an active role in other trade negotiations, including the Comprehensive Economic and
Trade Agreement – CETA – with Canada, signed in 2016.
b) Key Performance Indicators (KPIs)
The four key indicators which monitor the core aspects of the CAP are:
The CAP Key Performance Indicators
Baseline Target Impact/Result
1. Agricultural factor
income (see p. 15)
14 585 €/AWU
(2012)10 To increase
stable 14 808 €/AWU
(2015)
2. EU commodity prices compared to world prices
(see p. 14)
1.19
(2013)11
Close to each other
(ratio 1.00)
close 1.05
(2015)
3. Minimum share of land with specific environmental
practices/commitments12 (see p. 28-29)
- Share of agricultural area under greening practices
75 % (2015)
To increase
Increasing
77 % (2016)
4. Rural employment rate
(see p. 13)
63.4%
(2012) To increase
Increasing
65.0% (2015)
10 Values have changed compared to figures published in 2015 AAR because Eurostat has updated figures. 11 Following a change in the definition of time series, i.e. accounting for the Brazilian beef price instead of the
US price, the figure deviates slightly from 2015 report. 12 This KPI includes also the following indicators: Share of area under organic farming; % of agricultural land
under management contracts supporting biodiversity and/or landscapes; % of forest area/other wooded land
under management contracts supporting biodiversity; % of agricultural land under management contracts to
improve water management; % of forestry land under management contracts to improve water management;
% of agricultural land under management contracts to prevent soil erosion and to improve soil management; %
of forestry land under management contracts to prevent soil erosion and to improve soil management; % of LU
concerned by investments in livestock management in view of reducing greenhouse gas and/or ammonia
emissions; % of agricultural land under management contracts targeting reduction of greenhouse gas and/or
ammonia emissions.

agri_aar_2016 Page 10 of 114
The key indicator linked to the achievement of the internal control objectives is:
5. Error Rate and corrective capacity (see p. 39 ff)
KPI 5 is calculated on the same basis as in previous years, to ensure comparability. To reflect all relevant expenditure, including pre-financing amounts paid in previous years
and cleared in 2016, other indicators are presented in assurance section of the report (see table 2.1.1.2.2-18).
c) Key conclusions on Financial management and
Internal control
In accordance with the governance statement of the European Commission, DG AGRI
conducts its operations in compliance with the applicable laws and regulations, working in an open and transparent manner and meeting the expected high level of professional and
ethical standards.
The Commission has adopted a set of internal control standards, based on international good practice, aimed to ensure the achievement of policy and operational objectives. The
financial regulation requires that the organisational structure and the internal control systems used for the implementation of the budget are set up in accordance with these
standards. DG AGRI has assessed the internal control systems during the reporting year and has concluded that the internal control standards are implemented and function as
intended. However, Internal Control Standard 8 Processes and procedures, including exceptions to procedures and non-compliance events is not fully implemented and
functioning as intended and consequently further improvements are needed. Please refer
to AAR section 2.1.3 for further details.
In addition, DG AGRI has systematically examined the available control results and
indicators, including those aimed to supervise entities to which it has entrusted budget implementation tasks, as well as the observations and recommendations issued by
internal auditors and the European Court of Auditors. These elements have been assessed to determine their impact on the management's assurance as regards the
achievement of control objectives. Please refer to Section 2.1 for further details.
In conclusion, management has reasonable assurance that, overall, suitable controls are
in place and working as intended; risks are being appropriately monitored and mitigated;
and necessary improvements and reinforcements are being implemented. The Director General, in his capacity as Authorising Officer by Delegation has signed the Declaration of
Assurance, albeit qualified by the following reservations:
financial corrections recoveries total
m EUR m EUR m EUR m EUR m EUR
0501 Administrative expenditure 20.74 0.04% 1.000% 0.207
0502 Interventions in Agricultural Markets 3 127.90 5.51% 2.850% 89.145 168.759
0503 Direct Aids 40 808.73 71.85% 1.996% 814.395 626.497
EAGF 43 936.63 77.36% 2.056% 903.540 795.255 106.564 901.819
0504 Rural Development 12 365.00 21.77% 3.533% 436.875 162.226 109.334 271.560
0505 Pre-accession Measures 339.24 0.60% 0.069% 0.234
0506 International Aspects 4.40 0.01% 1.000% 0.044
0507 Audit 102.32 0.18% 0.000% 0.000
0508 Policy Strategy and Coordination 25.62 0.05% 1.000% 0.256
0509 Horizon 2020 - Research & Innovation 0.00 0.00% 0.000% 0.000
CAP Total 56 793.96 100.00% 2.361% 1 341.156 957.481 215.898 1 173.38
Corrective capacityTitle 05 Agriculture and Rural Development
DG AGRI annual
accounts (Annex 3)
% of CAP
budgetAmount at riskAdjusted error rate

agri_aar_2016 Page 11 of 114
ABB02 – Expenditure on Market Measures: 7 aid schemes, comprising 8 Member States (14 elements of reservation): Belgium, France (for 4 aid
schemes), Greece (for 2 aid schemes), Hungary, Italy (for 2 aid schemes), the
Netherlands, Poland (for 2 aid schemes) and Spain.
ABB03 – Expenditure on Direct payments: 18 Paying Agencies,
comprising 12 Member States: Bulgaria, Cyprus, Denmark, France, Hungary, Italy (7 Paying Agencies), Poland, Portugal, Romania, Spain, Sweden and the
United Kingdom and one unquantified reservation for voluntary coupled support in 8 Member States: France, Greece, Ireland, Italy, Lithuania, Malta,
Poland and Romania.
ABB04 – Rural development expenditure: 20 Paying Agencies, comprising
19 Member States: Belgium, Bulgaria, Czech Republic, Denmark, France, Germany, Greece, Hungary, Ireland, Italy (2 Paying Agencies), Lithuania, The
Netherlands, Poland, Portugal, Romania, Slovakia, Spain, Sweden and the United
Kingdom.
d) Information to the Commissioner
In the context of the regular meetings during the year between the DG and the
Commissioner on management matters, also the main elements of this report and assurance declaration, including the reservations envisaged, have been brought to the
attention of Commissioner Hogan, responsible for Agriculture and Rural Development, on
25 April 2017.

agri_aar_2016 Page 12 of 114
1. KEY RESULTS AND PROGRESS TOWARDS THE ACHIEVEMENT OF GENERAL AND SPECIFIC OBJECTIVES
This section presents key results and progress in terms of the general objectives of the
Juncker Commission.
It should be recalled here that, in line with Art. 110 of Regulation (EU) No 1306/2013 of
the European Parliament and of the Council, the performance of the CAP is also assessed in relation to the following objectives, conventionally referred to as "CAP common
objectives":
viable food production, with a focus on agricultural income, agricultural
productivity and price stability;
sustainable management of natural resources, and climate action, with a focus on greenhouse gas emissions, biodiversity, soil and water;
balanced territorial development, with a focus on rural employment, growth and poverty in rural areas.
These objectives are clearly linked with the Commission general objectives13. One point deserves particular mention. The very substantial action of the CAP in the domain of the
environment and the climate certainly includes policy measures relevant to the explicit content of Commission general objective 3 – Energy Union and Climate Change – but at
the same time also ranges more widely (e.g. to influence biodiversity, soil quality and
water quality). So that this important policy activity is not lost from view, it too has been mentioned in connection with Commission general objective 3.
With regard to each of the chosen Commission general objectives, the key quantified facts are presented together, before an explanation of significance, cause and general
context is offered. This approach should give the reader a rapid, easily accessible overview of the essential information for each objective.
Long-term trends in the key indicators for the CAP are the most useful means of assessing the policy's achievement of its objectives. This is because of the long lag
effects of the policy's operation. With regard to the various indicators presented, the
most recent available values are used. In many cases these predate 2016; it nevertheless makes sense to present them in AAR 2016 as they are more recent than the
information presented in AAR 2015, and the relevant trends thus continue to unfold. The choice of a baseline year for any given indicator depends on how recent the latest data
are and on the period over which observation is necessary in order to discern genuine trends. A full set of objectives and indicators is presented in Annex 12; 2016 evaluation
information is presented in Annex 9. Observations on performance by the Court of Auditors are presented under point 2.1.2.
13 The CAP objective of a viable food production is directly linked to the Commission general objective 1 "A new
boost for jobs, growth and investment" as a large number of jobs in agriculture, together with food processing,
food retail and food services, depends on it. Promoting the sustainable management of natural resources and
climate action ensures to keep the basis for agricultural jobs sustainable. A key tool for boosting employment,
growth and investment is the fostering of a balanced territorial development including rural areas. Through this
objective,the CAP also contributes to the Commission general objective 2 " A Connected Digital Single Market":
closing the digital divide between urban and rural areas is an important enabler for businesses to remain
competitive, for rural communities to deploy their potential and for the EU farm sector to reap the benefits that
ICT represents in terms of economic and environmental performance as well as climate change. The
Commission general objective 6 “A Reasonable and Balanced free Trade Agreement with the U.S.” is connected
to the CAP common objective of a viable food production with DG AGRI active role in trade negotiations, leading
to an increase in two-way trade, without compromising our high food safety standards.

agri_aar_2016 Page 13 of 114
1.1 Commission General Objective 1: Jobs, Growth And Investment
What are the key achievements to be reported?
1. Employment in the EU's rural areas has climbed past its pre-crisis level.
In 2015 (the most recent year for which data are available), 65.0% of the
working-age population (aged 15 to 64) were in jobs. The employment level has thus recovered strongly from the trough of 62.5% reached in 2011 (as a result of
the economic crisis), and has topped the level of 64.8% recorded in 2008.
Employment rate for the population aged 15-64 in rural areas14
Source: Eurostat – Labour Force Survey
14 Values have changed compared to figures published in 2015 AAR because Eurostat has updated figures.
64,8
62,8 62,7 62,5
63,4 63,5
64,3
65,0
61,0
61,5
62,0
62,5
63,0
63,5
64,0
64,5
65,0
65,5
2008 2009 2010 2011 2012 2013 2014 2015
% Employment rate in rural areas, EU-28
KPI 4

agri_aar_2016 Page 14 of 114
2. The farm sector continues to operate at prices close to world market prices15.
In 2016, a weighted average of the EU market prices of various commodities was
at 105 % of equivalent world market prices – compared with 119% in the baseline
year of 2012. This is in line with the target of getting generally closer to world market prices. It is not intended that the EU market should exactly match or track
world market prices, but the two should be more aligned than in the past as this indicates that EU farmers are growing more internationally competitive – while
receiving non-trade-distorting support16. (For information on the EU's agri-food export performance in 2016, see section
1.4).
Source: DG Agriculture and Rural Development, based on European Commission, USDA, World Bank, IGC,
London International Financial Futures and Options Exchange, National sources.
15 Following a change in the definition of time series, i.e. accounting for the Brazilian beef price instead of the
US price, the above displayed graph deviates slightly from 2015 presentation. 16 Compared to Pacific prices (US and Australia), EU prices were very competitive in 2015 because of the
exchange rate effect but also because US demand drove significant price increases. If the comparison would be
made with Brazil for meat especially, the increase in EU competitiveness would be less pronounced. With the
successive CAP reforms, EU prices were brought closer to world prices especially in the cereal and dairy sectors.
In the meat sector, there are several world reference markets, namely the Atlantic (e.g. Brazil) and Pacific
(USA, Australia) markets. For beef, the gap between the EU and the world market prices is closing as illustrated
below with Australia, in addition the US lost competitiveness because of a the surge in beef prices in 2014-15.
By contrast, Brazil remained much more competitive. In the poultry sector, the EU gained competitiveness over
the US but lost compared to Brazil (recession). By contrast, after the drop in 2014-15, the EU pigmeat price
increased relatively more compared to the US and Brazil because of Chinese demand (the US and Brazilian
pigmeat exports to China are limited because they use ractopamine).
0,80
0,90
1,00
1,10
1,20
1,30
1,40
1,50
2005 2006 2007 2008 2009 2010 2011 2012 2013 2014 2015 2016
Ratio between EU and World agricultural commodity prices
KPI 2
agri_aar_2016 Page 15 of 114
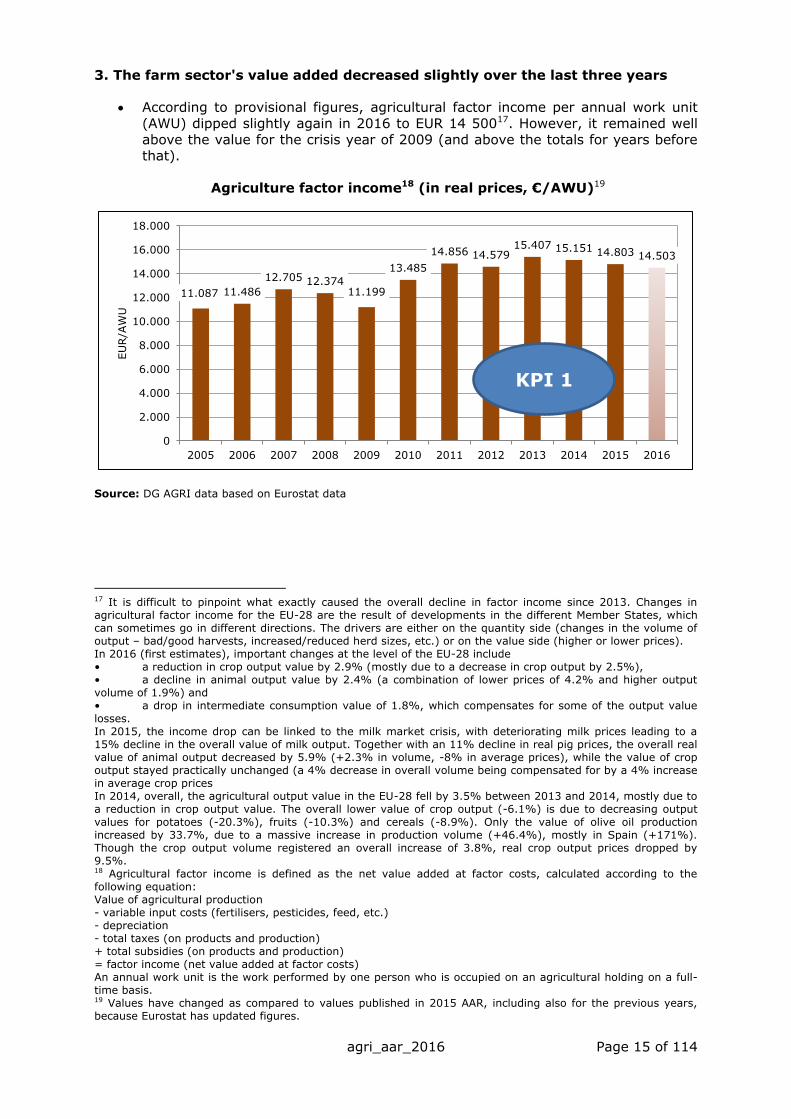
3. The farm sector's value added decreased slightly over the last three years
According to provisional figures, agricultural factor income per annual work unit
(AWU) dipped slightly again in 2016 to EUR 14 50017. However, it remained well
above the value for the crisis year of 2009 (and above the totals for years before that).
Agriculture factor income18 (in real prices, €/AWU)19
Source: DG AGRI data based on Eurostat data
17 It is difficult to pinpoint what exactly caused the overall decline in factor income since 2013. Changes in
agricultural factor income for the EU-28 are the result of developments in the different Member States, which
can sometimes go in different directions. The drivers are either on the quantity side (changes in the volume of
output – bad/good harvests, increased/reduced herd sizes, etc.) or on the value side (higher or lower prices).
In 2016 (first estimates), important changes at the level of the EU-28 include
• a reduction in crop output value by 2.9% (mostly due to a decrease in crop output by 2.5%),
• a decline in animal output value by 2.4% (a combination of lower prices of 4.2% and higher output
volume of 1.9%) and
• a drop in intermediate consumption value of 1.8%, which compensates for some of the output value
losses.
In 2015, the income drop can be linked to the milk market crisis, with deteriorating milk prices leading to a
15% decline in the overall value of milk output. Together with an 11% decline in real pig prices, the overall real
value of animal output decreased by 5.9% (+2.3% in volume, -8% in average prices), while the value of crop
output stayed practically unchanged (a 4% decrease in overall volume being compensated for by a 4% increase
in average crop prices
In 2014, overall, the agricultural output value in the EU-28 fell by 3.5% between 2013 and 2014, mostly due to
a reduction in crop output value. The overall lower value of crop output (-6.1%) is due to decreasing output
values for potatoes (-20.3%), fruits (-10.3%) and cereals (-8.9%). Only the value of olive oil production
increased by 33.7%, due to a massive increase in production volume (+46.4%), mostly in Spain (+171%).
Though the crop output volume registered an overall increase of 3.8%, real crop output prices dropped by
9.5%. 18 Agricultural factor income is defined as the net value added at factor costs, calculated according to the
following equation:
Value of agricultural production
- variable input costs (fertilisers, pesticides, feed, etc.)
- depreciation
- total taxes (on products and production)
+ total subsidies (on products and production)
= factor income (net value added at factor costs)
An annual work unit is the work performed by one person who is occupied on an agricultural holding on a full-
time basis. 19 Values have changed as compared to values published in 2015 AAR, including also for the previous years,
because Eurostat has updated figures.
11.087 11.486
12.705 12.374 11.199
13.485
14.856 14.579 15.407 15.151 14.803 14.503
0
2.000
4.000
6.000
8.000
10.000
12.000
14.000
16.000
18.000
2005 2006 2007 2008 2009 2010 2011 2012 2013 2014 2015 2016
EU
R/A
WU
KPI 1

agri_aar_2016 Page 16 of 114
4. The farm sector's productivity remains on a healthy long-term course
Measured with rolling three-year averages, the sector's total factor productivity20
has been climbing (reaching 108.7 % of its 2005 value in 2013-2015, up from
106.2 % in 2012-2014).
Total Factor Productivity and partial productivity growth in the EU-28
(index 2005 = 100, 3-year moving average)
Source: DG AGRI, https://ec.europa.eu/agriculture/sites/agriculture/files/mp-mb-010_en.pdf
20 Total factor productivity compares total outputs relative to the total inputs used in production of the output
(both output and inputs are expressed in term of volumes).
80
85
90
95
100
105
110
115
120
125
130
2002
2003
2004
2005
2006
2007
2008
2009
2010
2011
2012
2013
2014
2015
TFP Labour Land Capital Int. cons.

agri_aar_2016 Page 17 of 114
Trends in the distribution of direct payments
A political agreement on the reform of the Common Agricultural policy (CAP) was reached in 2013 after almost two years of negotiations between the Commission, the European Parliament and the Council. New rules for direct payments to farmers21 are in place for the period 2014-2020, with the effect mainly from 2015. The CAP provides much greater flexibility to Member States22. The new elements foster that direct payments are distributed more fairly, are "greener" to promote sustainability and combat climate change, and are better targeted for example towards young farmers, small farmers or farmers in areas with natural constraints.
Provisions addressing the issue of a fairer distribution of direct aids per hectare to farmers are a key element of the new system.
Every year, DG AGRI publishes the breakdown of direct payments by Member State and size of payment. In financial year 2016 (claim year 2015), direct payments reached EUR 40.8 billion and represented 72% of the whole CAP; 88.9% of them were decoupled.
Structural adjustments in the agricultural holdings of the EU have reduced the number of small farms; as a result, the number of beneficiaries of direct payments has also decreased (-22% in the EU-15, -8% in the EU-N10 since 2005, -24% Bulgaria and Romania since 2008) but it has increased in Croatia (+3% since 2014). The net effect is a smaller share of beneficiaries receiving low amounts of direct payments and thus in a higher average amount per beneficiary).
As direct payments are granted per hectare of eligible area, there is a strong correlation between the distribution of direct payments and the distribution of area between farmers. This results in larger farms concentrating the largest amounts of support23 and in a high number of very small beneficiaries, merely reflecting the high fragmentation of the farm sector in the EU and the relative contribution of these farm groups to the economics of the sector. For financial year 2016, 51% of the beneficiaries of direct payments were granted less than EUR 1 250 amounting to a total of 4% of the total Direct Payments granted in the EU (see graph "Share of beneficiaries and direct payments (cumulative) - EU 2016" below).
The 2013 CAP reform introduced several provisions for redistributing direct payments between beneficiaries. Member States must reduce the differences between per-hectare payment levels to beneficiaries on their respective territories (this is referred to as "internal convergence"). There is also a provision to gradually adjust the envelopes per Member State in order to bring average levels of payments closer to one another between countries ("external convergence"). A new active farmer clause has been put in place to exclude from support those who have only a marginal agricultural activity.
In addition, Member States must also reduce by at least 5 % the receipts above EUR 150 000 which any beneficiary obtains from the basic payment scheme or the single area payment scheme. They may even cap these receipts (9 Member States have decided to apply a capping as from 2015). Besides, Member States have the option to redistribute up to 30% of their direct payments national envelope to the first ha on every farm ("redistributive payment"). In 2015, 9 Member States have implemented this scheme, using on average 7.5% of their total expenditure for direct payments.
A more detailed analysis of recent figures is ongoing and will be made available in the autumn 2017.
21 Regulation (EU) n° 1307/2013 of the European Parliament and of the Council of 17 December 2013
establishing rules for direct payments to farmers under support schemes within the framework of the Common
Agricultural Policy and repealing Council Regulation (EC) n° 637/2008 and Council Regulation (EC) n° 73/2009. 22 The options chosen by MS for the direct payments 2015-2020 are summarised in the information note
available on Europa website: https://ec.europa.eu/agriculture/sites/agriculture/files/direct-support/direct-
payments/docs/simplementation-decisions-ms-2016_en.pdf 23 Although to a lesser extent than for the land.

agri_aar_2016 Page 18 of 114
Why are these achievements important?
Boosting overall employment is one of the Commission's top priorities – not only for cities but also for the countryside, where large numbers of people live and work.
The above trends in prices, income and productivity specifically concerning the farm
sector are important for the agricultural sector, but also for the other economic activities connected to it. Even though agriculture is gradually taking a lower share of overall
employment, almost 11 million farms still provide work for roughly 22 million people24. Together with food processing, food retail and food services, agriculture makes up a
sector providing about 44 million jobs25 in the EU. It also has strong links to various other upstream and downstream sectors, as well as to other (local) rural businesses.
24 Full and part-time jobs. Source of data: Eurostat Farm Structure Survey 2013. 25 Figures are for 2012-2013 (agriculture, food industry and retail food services) and 2009 (other sectors).
Sources: Joint Research Centre, ‘The bioeconomy in the EU in numbers’, 2015; Eurostat, Structural Business
Statistics, 2015; Eurostat, Farm Structure Survey, 2013. In the case of input figures: industry sources.See
https://ec.europa.eu/agriculture/sites/agriculture/files/cap-overview/2016_en.pdf.

agri_aar_2016 Page 19 of 114
As the farm sector moves away from trade-distorting support, it must be in a position to operate successfully at prices close to those on the world market. Long-term productivity
gains are also an important part of remaining economically viable, and are in line with
the CAP's Treaty objectives.
Higher productivity can gradually lead to job losses in the farm sector as capital is
substituted for labour, but it also tends to make the remaining jobs more economically sustainable (and therefore more likely to attract new entrants). Furthermore, if the right
conditions are set for job creation in other, related sectors, the net effect on employment can be positive (as the first graph on rural employment indicates).
How closely are the achievements linked to the CAP?26
The CAP is strongly linked to these achievements through the ways in which it acts within the farm sector and food supply chain, and within rural areas more generally.
With regard to the farm sector: on the one hand, its commercial success, productivity
and general economic performance are always strongly influenced by factors other than policy – such as supply and demand in agricultural markets but also broader
macroeconomic developments, input costs and political events. For much of 2016, ongoing price pressure in the global dairy market – due to relatively high production and
weaker Asian demand – was a major influence. The ongoing Russian trade ban still made itself felt but has been at least partly mitigated as EU suppliers have developed other
export markets.
Likewise, total rural employment is – like urban employment - affected by various
macroeconomic forces as well as other policies.
The CAP exerts a strong positive influence through the following instruments:
Direct payments provide a basic protection of farmers' income against the particular
pressures (e.g. price- and weather-related) to which agriculture is exposed. They make up a roughly stable share of farmers' income27 (46% in the EU-27 in 2015). They are
now better targeted thanks to new payment "layers" addressing the particular needs of young farmers, smaller farmers, specific sectors or regions in difficulties, and the
environment. These changes to the structure of the direct payments system – along with provisions addressing redistribution more specifically – should lead to a more equitable
payment distribution. As direct payments are mostly decoupled from production, farmers
base production decisions essentially on market signals rather than attempts to maximise support payments.
Direct payments' stabilising effect is supplemented by market instruments – which now operate at a "safety net" level, instead of frequently steering the EU market as they once
did.
Rural development policy lifts the economic resilience of both the farm sector and non-
agricultural businesses through support for: setting up in business; business development and diversification, building knowledge; making investments; establishing
(and getting connected to) infrastructure and services (including in relation to ICTs – see
section 1.2); pursuing innovation; and working with others in new ways.
The Study on the implementation of the European Innovation Partnership (EIP) on
Agricultural Productivity and Sustainability28 found that the EIP’s premise on incentivising
26 These achievements cannot be "attributed" solely to the CAP; nevertheless, the CAP makes a strong
contribution to them. 27 Estimated on the basis of agricultural entrepreneurial income. 28 https://bookshop.europa.eu/en/evaluation-study-of-the-implementation-of-the-european-innovation-

agri_aar_2016 Page 20 of 114
innovative farming practices to foster a competitive and sustainable agriculture and forestry sector is seen as valid and important. Innovation actors, especially farmers and
forest managers, emphasised a need for projects linking research and practice. The EIP is
found to be a flexible tool that is addressing this in in a way that can be adapted to divergent circumstances and policy contexts. Farmers are more likely to become involved
in the innovation process under the EIP as compared with other funding streams for innovation in the agricultural sector.
Key targets aggregated from the 2014-2020 rural development programmes (RDPs) include the following:
• 3.8 million training places to be funded;
• 15 000 co-operation projects to be supported;
• 333 000 holdings to invest in restructuring or modernisation;
• 178 000 holdings to set up or to further develop;
• 310 000 farms to become involved in quality schemes, short supply chains,
local markets or producer groups/organisations;
• 646 000 farms to be covered by risk management schemes;
• 113 000 non-agricultural jobs to be created, of which:
o 79 000 from the creation, diversification and other development of small
businesses;
o 44 000 through the LEADER approach to local development;
• 50 million rural citizens to benefit from improved services.
Share of total agricultural holdings supported for productive investments
through RDPs, 2014-202029
partnership-for-agricultural-productivity-and-sustainability-pbKF0216023. See also Annex 9. 29 This chart gives an overview of the share of the EAFRD envelope that Member States have allocated to
productive investments to restructure and modernise their farm sectors (focus area 2a), as well as the target
for the percentage of farms that will receive investment support to restructure and modernise. As the chart
illustrates, some MS put greater emphasis on investment support than others. The percentage of farms
receiving investment support should be seen in the light of the structure of the farm sector in the given Member
States. Where there are many small farms, the percentage is evidently affected.

agri_aar_2016 Page 21 of 114
What supporting steps did the DG take in 2016?
In 2016 DG AGRI took action through many of the main instruments of the CAP, but in
particular through market stabilisation tools.
It remained necessary to steady the EU dairy market, which was still hit by crisis. The Commission built on the work of the previous year with two assistance packages, made
available in March and July. Between them, these involved incentives to reduce production, "conditional adjustment aid" (to be spent on measures designed by MS to
assist the sector), and more favourable conditions for the CAP-funded buying-up of surplus product (for public intervention stocks or private storage), among other things.
Dairy product prices began to recover during the year.
agri_aar_2016 Page 22 of 114
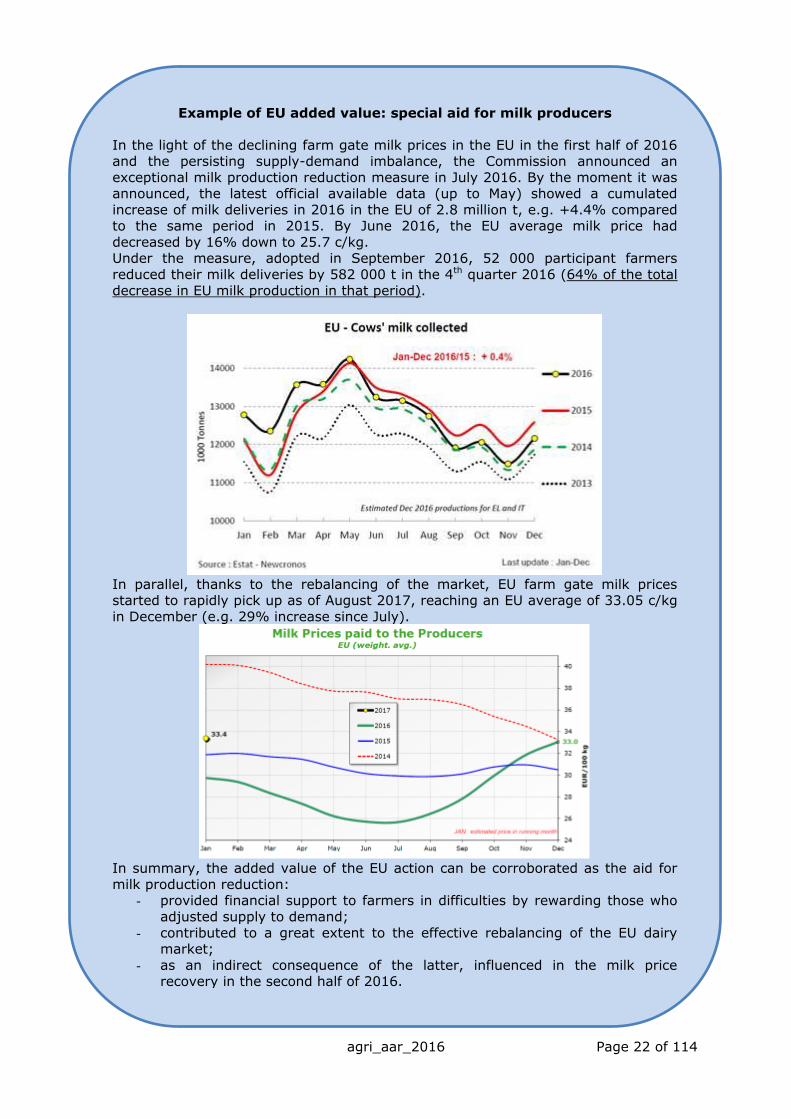
Example of EU added value: special aid for milk producers
In the light of the declining farm gate milk prices in the EU in the first half of 2016 and the persisting supply-demand imbalance, the Commission announced an
exceptional milk production reduction measure in July 2016. By the moment it was announced, the latest official available data (up to May) showed a cumulated
increase of milk deliveries in 2016 in the EU of 2.8 million t, e.g. +4.4% compared to the same period in 2015. By June 2016, the EU average milk price had
decreased by 16% down to 25.7 c/kg. Under the measure, adopted in September 2016, 52 000 participant farmers
reduced their milk deliveries by 582 000 t in the 4th quarter 2016 (64% of the total
decrease in EU milk production in that period).
In parallel, thanks to the rebalancing of the market, EU farm gate milk prices started to rapidly pick up as of August 2017, reaching an EU average of 33.05 c/kg
in December (e.g. 29% increase since July).
In summary, the added value of the EU action can be corroborated as the aid for
milk production reduction: - provided financial support to farmers in difficulties by rewarding those who
adjusted supply to demand;
- contributed to a great extent to the effective rebalancing of the EU dairy market;
- as an indirect consequence of the latter, influenced in the milk price recovery in the second half of 2016.

agri_aar_2016 Page 23 of 114
Another important activity in 2016 in relation to agricultural markets was the substantial
support which DG AGRI gave to the Agricultural Markets Task Force. The Task Force's
mandate was to examine the functioning of the food supply chain and provide advice on how to improve the position of farmers therein. The Task Force presented its final
report30 in November, with the following recommendations: the Commission should
- Take further steps to increase market transparency so as to foster effective
conditions of competition along the supply chain.
- Make the EU's risk management toolkit more attractive and coherent with
instruments set up by Member States so as to enable farmers to manage risk ex ante.
- Raise awareness on Futures markets.
- Introduce framework legislation to cover unfair trading practices.
- Facilitate the cooperation in the supply chain via ‘contractualisation’.
- Clarify the rules as regards producer cooperation.
- Encourage the roll-out of pilot projects by the European Investment Bank (EIB)
for the agriculture sector, facilitating access to finance for farmers.
With regard to direct payments, the main supporting work carried out by DG AGRI in
2016 consisted of ongoing guidance to Member States – provided partly through workshops – to help them implement effectively the various layers of the direct
payments system. The DG also gathered monitoring data31 on the first year of implementation of the reformed system. Their analysis allowed to draw certain lessons
from the reform and, to a certain extent, to quantify progress towards objectives (on
aspects such as internal convergence of payment rates, uptake of the Small Farmers' Scheme and Young Farmers' Scheme, and the likely effects of the "active farmer"
clause)32. For example:
- The reform has allowed covering an important part of the "naked land"33.
- The internal convergence effect is clearly visible34.
Similarly, in relation to rural development policy, DG AGRI supported the above-
mentioned achievements mainly by assisting Member States and regions with implementation – as the RDPs had been approved in 2014 and 2015. Part of this
assistance came in the form of workshops and reports provided through the European
Network for Rural Development (ENRD) and the EIP-AGRI Network35. The workshops and reports covered various topics of relevance to Commission general objective 1 – e.g.
"smart and competitive supply chains", "financing opportunities for projects – the Investment Plan for Europe" and "new entrants into farming".
The Cork 2.0 Conference on Rural Development, held in Ireland in September and organised by DG AGRI, also provided insights with regard to CAP implementation, though
30 Improving Market Outcomes – Enhancing the position of the farmers in the food supply chain,
http://ec.europa.eu/agriculture/sites/agriculture/files/agri-markets-task-force/improving-markets-
outcomes_en.pdf. 31 On the basis of one year implementation, it is not possible to assess all effects and these reports are
essentially factual. They provide key data for all schemes (number of beneficiaries, area coverage, share in
envelopes, etc.) and for all Member States. 32 With regard to the report on "greening", see section 1.3. 33 The "naked land" is the share of the land at the disposal of the beneficiaries of the basic payment scheme
(BPS) that complies with the definition of "eligible hectare" but for which the beneficiaries do not hold a
payment entitlement. 34 When taking projections for 2019, but in certain countries, there will still be important differences in the
values of payment entitlements in 2019. 35 The ENRD provides support with regard to implementation of RDPs, whereas the EIP-AGRI network assists
specifically with implementation of the European Innovation Partnership for Agricultural Productivity and
Sustainability. The activities of the two networks have a natural thematic overlap.
agri_aar_2016 Page 24 of 114
it focused on discussion of policy orientations for the future36.
Agricultural research funded under the Horizon 2020 framework programme, notably
Societal Challenge 2, aims to promote innovation in the agricultural sector and thus
stimulate economic growth and jobs. Within the research budget managed by DG AGRI, about 15 projects launched in 2016 focused on growth-related topics, such as business
development and business strategy innovation.
For instance, the research project AGROinLOG aims to help agro-industries willing to
deploy new business lines in their facilities to open new markets in bio-commodities and to develop synergies. This can have a positive impact on the competitiveness of the agro-
industries and contribute towards employment stability, rural development and bio-economy goals.
The corresponding financial support related to the abovementioned 15 projects amounted to roughly € 63 million.
36 See the Cork 2.0 declaration "A better life in rural areas": https://ec.europa.eu/agriculture/events/rural-
development-2016_en.
agri_aar_2016 Page 25 of 114
1.2 Commission General Objective 2: Digital Single Market
What are the key achievements to be reported?
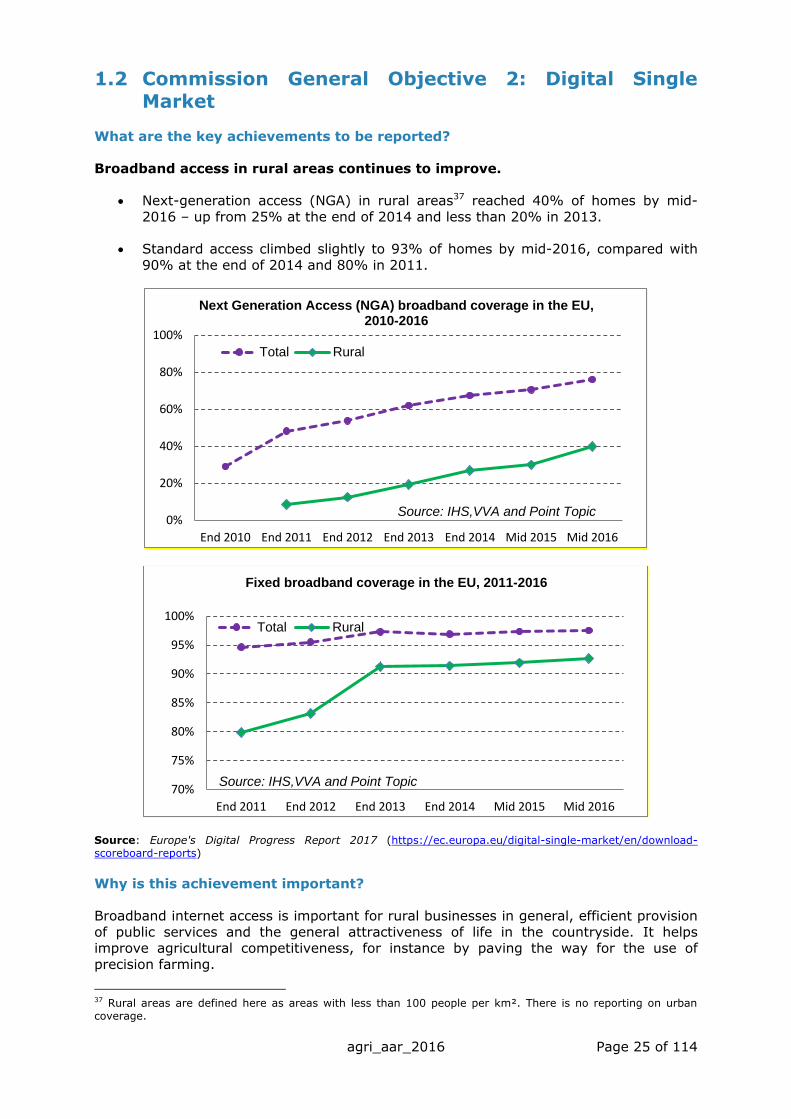
Broadband access in rural areas continues to improve.
Next-generation access (NGA) in rural areas37 reached 40% of homes by mid-
2016 – up from 25% at the end of 2014 and less than 20% in 2013.
Standard access climbed slightly to 93% of homes by mid-2016, compared with
90% at the end of 2014 and 80% in 2011.
Source: Europe's Digital Progress Report 2017 (https://ec.europa.eu/digital-single-market/en/download-
scoreboard-reports)
Why is this achievement important?
Broadband internet access is important for rural businesses in general, efficient provision
of public services and the general attractiveness of life in the countryside. It helps improve agricultural competitiveness, for instance by paving the way for the use of
precision farming.
37 Rural areas are defined here as areas with less than 100 people per km². There is no reporting on urban
coverage.
0%
20%
40%
60%
80%
100%
End 2010 End 2011 End 2012 End 2013 End 2014 Mid 2015 Mid 2016
Total Rural
Next Generation Access (NGA) broadband coverage in the EU, 2010-2016
Source: IHS,VVA and Point Topic
70%
75%
80%
85%
90%
95%
100%
End 2011 End 2012 End 2013 End 2014 Mid 2015 Mid 2016
Total Rural
Fixed broadband coverage in the EU, 2011-2016
Source: IHS,VVA and Point Topic

agri_aar_2016 Page 26 of 114
How closely is the achievement linked to the CAP?
The level of broadband access depends significantly on general developments in telecoms
markets (and finance from other policy tools – including the European Regional Development Fund). The CAP plays its part – offering explicit support for setting up,
expanding and improving broadband infrastructure, as well as for the provision of broadband internet access (i.e. improved connections to infrastructure), and access to e-
government. According to targets aggregated from the 2014-2020 RDPs, in the current programming period the CAP will help 18 million people living in rural areas to benefit
from improved access to ICT services and infrastructure.
What supporting steps did the DG take in 2016?
In 2016 DG AGRI worked closely with DGs REGIO and CONNECT to set up Broadband
Competence Offices (BCOs) within Member States, as well as a Brussels-based Support
Facility. In essence, the BCO network will help businesses and individuals to access more easily the various support possibilities offered by EU funds under the umbrella of the
Digital Single Market. Specifically, one of the stated aims of the network is to widen next-generation broadband access in rural areas. The Support Facility has gone live following
the signature of the necessary contracts by the DGs concerned at the end of 2016.

agri_aar_2016 Page 27 of 114
1.3 Commission General Objective 3: Energy Union And Climate Change
What are the key achievements to be reported?
1. Net greenhouse gas emissions from EU agriculture continue to fall.
Emissions in 2014 were just over 516 million tonnes of CO2 equivalent, down from
nearly 522 million tonnes in the baseline year of 2012.
Emissions have thus kept on their positive long-term trend, having fallen by 24%
since 1990 in the EU-28 (i.e. at an average annual rate of 1.13%).
Net greenhouse gas emissions from agriculture (in 1000 t of CO2 equivalent)
Source: Annual European Union GHG inventory. The inventory is based on national submissions to the UNFCCC
and to the EU Monitoring Mechanism of CO2 and other GHG emissions. It is compiled and held by the European
Environment Agency (EEA) and the European Topic Centre on Air and Climate Change (ETC/ACC).
400.000
450.000
500.000
550.000
600.000
650.000
700.000
19
90
19
91
19
92
19
93
19
94
19
95
19
96
19
97
19
98
19
99
20
00
20
01
20
02
20
03
20
04
20
05
20
06
20
07
20
08
20
09
20
10
20
11
20
12
20
13
20
14
kt C
O2
eq
uiv
ale
nt
Average annual rate of decline (1990-2014): -1.13%

agri_aar_2016 Page 28 of 114
2. The area being farmed organically continues to rise38.
In 2015, 6.2% of the EU's utilised agricultural area (UAA) was being farmed
organically – up from 10.1 million ha (5.6%) in the baseline year of 2012.
Evolution of the share of the organic area in the UAA in the EU
Source: Facts and figures on organic agriculture in the European Union, DG AGRI, December 2016 (https://ec.europa.eu/agriculture/sites/agriculture/files/rural-area-
economics/briefs/pdf/014_en.pdf)
3. A large portion of EU agricultural area is being farmed according to specific eco-friendly practices.
The new "greening" layer of the direct payments system39, first implemented in 2015, is intended to ensure that a majority of EU agricultural area is farmed
according to basic environment- and climate-friendly practices. In 2015, 75% of UAA was subject to at least one of the greening obligations. The estimated total
for 2016 is 77%40.
The 2014-2020 RDPs build on the effect of greening by supporting more
demanding, voluntary, multi-annually programmed practices. According to
updated targets from the programmes, the following proportions of farmland41 and forest area will be covered by funded contracts concerning such practices:
o biodiversity - 17.7% of farmland, 3.5% of forest area;
o water management – 15.1% of farmland, 4.3% of forest area;
o soil management – 14.3% of farmland, 3.6% of forest area;
o reducing emissions of greenhouse gases and ammonia - 7.7% of farmland
38 The figures and graphs in this sub-section refer to the area devoted to organic farming, irrespective of
whether the area in question is benefiting from CAP payments or not. By contrast, sub-section 3 concerns only
areas subject to various kinds of environmentally related CAP support (for organic farming and various other
farming systems or practices). 39 In full: "Payment for agricultural practices beneficial for the climate and the environment", as provided for in
Arts. 43-47 of Regulation (EU) No 1307/2013. 40 The deadline for the relevant notifications by Member States is 15 December each year. The figure presented
above for 2015 is based on notifications from all Member States except France. The provisional results for 2016
are calculated on the basis of information from 19 Member States. 41 On much of the farmland in question, "greening" requirements also apply – i.e. there is an "overlap" between
figures. In those cases, the contracts funded by rural development policy build on the environmental benefits of
the greening requirements. Likewise, the area figures concerned by rural development support overlap with
each other.
0%
1%
2%
3%
4%
5%
6%
7%
8%
2000 2001 2002 2003 2004 2005 2006 2007 2008 2009 2010 2011 2012 2013 2014 2015
EU-15
EU-28
EU-N13
agri_aar_2016 Page 29 of 114
in the RDPs concerned.
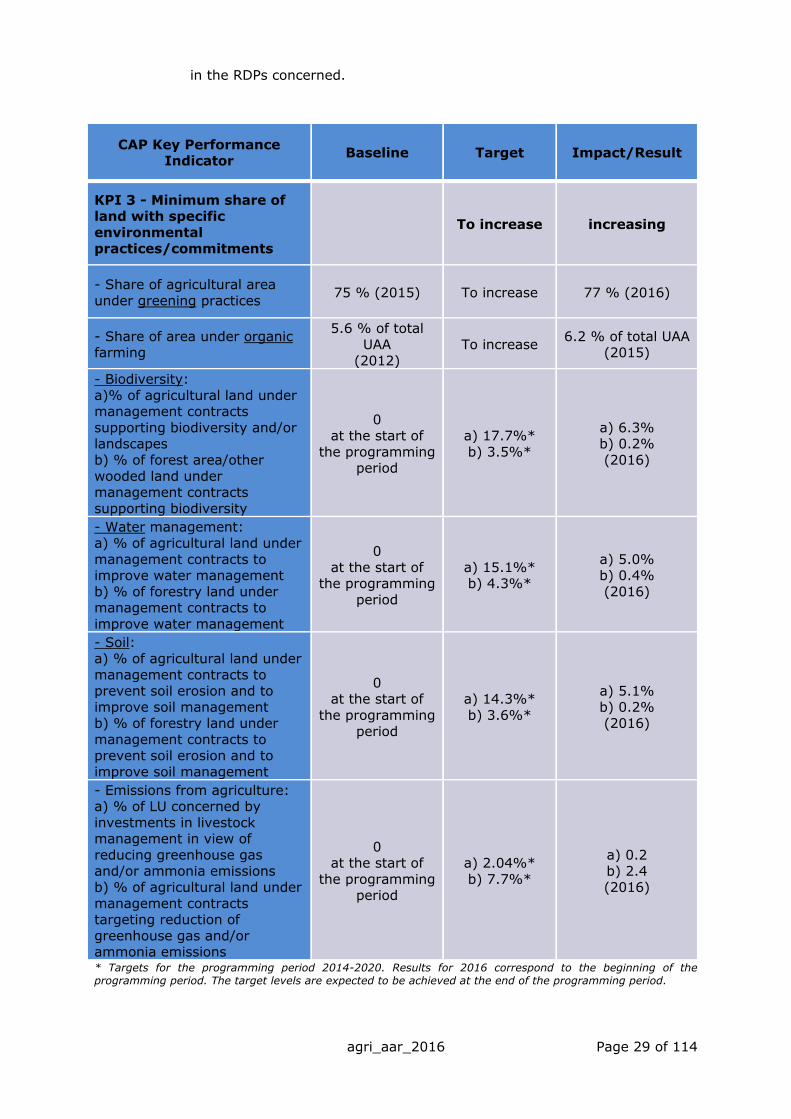
CAP Key Performance Indicator
Baseline Target Impact/Result
KPI 3 - Minimum share of land with specific
environmental practices/commitments
To increase increasing
- Share of agricultural area
under greening practices 75 % (2015) To increase 77 % (2016)
- Share of area under organic farming
5.6 % of total
UAA
(2012)
To increase 6.2 % of total UAA
(2015)
- Biodiversity:
a)% of agricultural land under management contracts
supporting biodiversity and/or landscapes
b) % of forest area/other
wooded land under management contracts
supporting biodiversity
0 at the start of
the programming period
a) 17.7%*
b) 3.5%*
a) 6.3% b) 0.2%
(2016)
- Water management:
a) % of agricultural land under
management contracts to improve water management
b) % of forestry land under management contracts to
improve water management
0
at the start of the programming
period
a) 15.1%* b) 4.3%*
a) 5.0% b) 0.4%
(2016)
- Soil:
a) % of agricultural land under
management contracts to prevent soil erosion and to
improve soil management b) % of forestry land under
management contracts to prevent soil erosion and to
improve soil management
0 at the start of
the programming
period
a) 14.3%*
b) 3.6%*
a) 5.1%
b) 0.2% (2016)
- Emissions from agriculture: a) % of LU concerned by
investments in livestock management in view of
reducing greenhouse gas and/or ammonia emissions
b) % of agricultural land under
management contracts targeting reduction of
greenhouse gas and/or ammonia emissions
0 at the start of
the programming period
a) 2.04%*
b) 7.7%*
a) 0.2 b) 2.4
(2016)
* Targets for the programming period 2014-2020. Results for 2016 correspond to the beginning of the
programming period. The target levels are expected to be achieved at the end of the programming period.
agri_aar_2016 Page 30 of 114
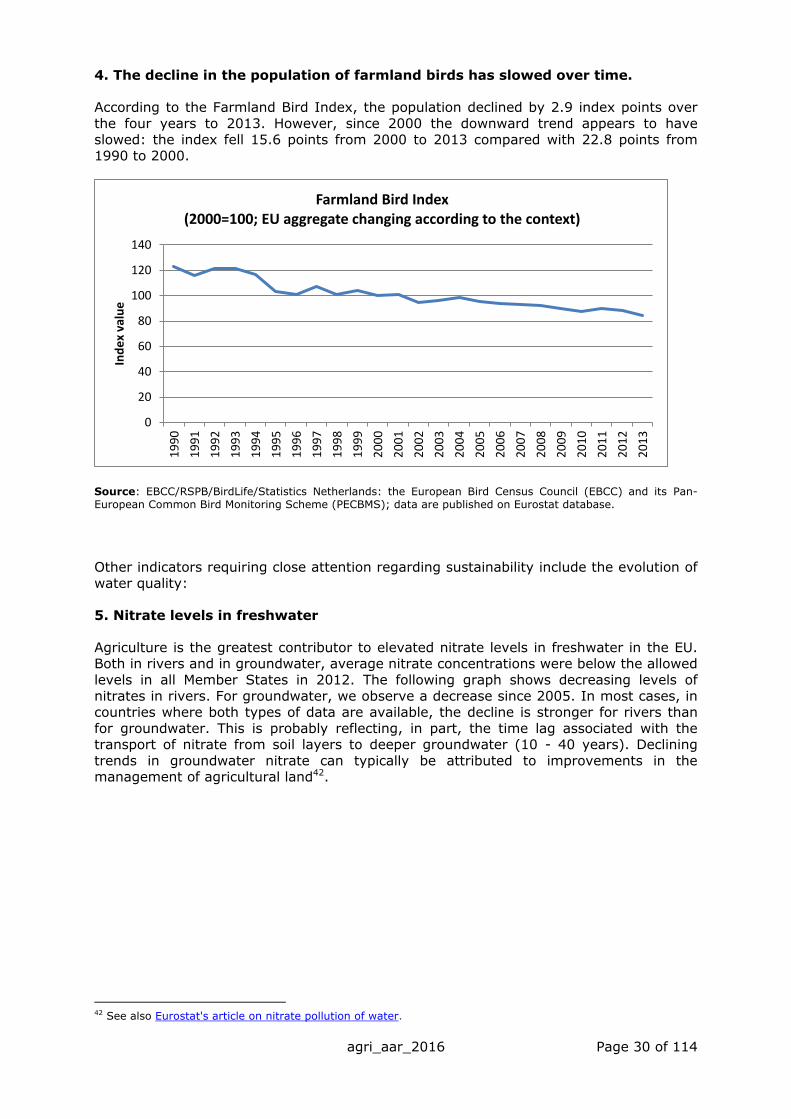
4. The decline in the population of farmland birds has slowed over time.
According to the Farmland Bird Index, the population declined by 2.9 index points over
the four years to 2013. However, since 2000 the downward trend appears to have
slowed: the index fell 15.6 points from 2000 to 2013 compared with 22.8 points from 1990 to 2000.
Source: EBCC/RSPB/BirdLife/Statistics Netherlands: the European Bird Census Council (EBCC) and its Pan-
European Common Bird Monitoring Scheme (PECBMS); data are published on Eurostat database.
Other indicators requiring close attention regarding sustainability include the evolution of
water quality:
5. Nitrate levels in freshwater
Agriculture is the greatest contributor to elevated nitrate levels in freshwater in the EU. Both in rivers and in groundwater, average nitrate concentrations were below the allowed
levels in all Member States in 2012. The following graph shows decreasing levels of
nitrates in rivers. For groundwater, we observe a decrease since 2005. In most cases, in countries where both types of data are available, the decline is stronger for rivers than
for groundwater. This is probably reflecting, in part, the time lag associated with the transport of nitrate from soil layers to deeper groundwater (10 - 40 years). Declining
trends in groundwater nitrate can typically be attributed to improvements in the management of agricultural land42.
42 See also Eurostat's article on nitrate pollution of water.
0
20
40
60
80
100
120
140
19
90
19
91
19
92
19
93
19
94
19
95
19
96
19
97
19
98
19
99
20
00
20
01
20
02
20
03
20
04
20
05
20
06
20
07
20
08
20
09
20
10
20
11
20
12
20
13
Ind
ex
valu
e
Farmland Bird Index (2000=100; EU aggregate changing according to the context)

agri_aar_2016 Page 31 of 114
Trends of concentration of nitrates in rivers and groundwater
3-year moving average, base 1992-1994 = 100, 1992-2012
Source: European Environmental Agency (EEA) – Nutrients in freshwater: Data voluntary reported by MSs via
the WISE/SOE data flow annually.
Why are these achievements important?
Agriculture accounts for about 10% of the EU's total greenhouse gas emissions, and must contribute to their reduction. On the other side of the carbon balance sheet, agricultural
soils and forests are major carbon pools. A wide range of practices in farming (and forestry) are important for delivering benefits in terms of soil, water, air and biodiversity
in line with the EU's needs and expectations, which is why one of the CAP's key performance indicators is the proportion of agricultural land farmed according to specific
environmentally friendly practices.
One of the farming systems that can deliver broad environmental benefits (some related
to climate change) is organic farming, for which reason its continued spreading is
encouraging. The continued decline in farmland bird populations indicates that action over biodiversity remains as important as ever.
How closely are the achievements linked to the CAP?
The CAP makes a substantial contribution to the achievements mentioned above, as well
as to general environmental integrity in rural areas.
In the period 2007-2013 the system of cross-compliance already linked all direct
payments (as well as some wine market payments and some rural development payments) to a number of legal requirements related to the environment and climate
change. In addition to that, from 2015 onwards the "greening" layer of the direct
payments system has rewarded farmers for diversifying their crop rotations, conserving permanent grassland and caring for ecologically beneficial zones ("ecological focus
areas").
80
85
90
95
100
105
110
115
1993 1994 1995 1996 1997 1998 1999 2000 2001 2002 2003 2004 2005 2006 2007 2008 2009 2010 2011
Rivers - EU (17 countries) Groundwaters - EU (13 countries)

agri_aar_2016 Page 32 of 114
Rural development policy continues to offer for the period 2014-2020 – as it did in 2007-201343 – various types of area-related payments linked with requirements for
management practices that have a proven positive impact on biodiversity, soil, water,
and air in both the farm and forest sectors. Among other things, support is available for providing environmental benefits through organic farming. During 2007-2013, farmers
received support to convert to organic farming – or maintain it – on 7.7 million hectares. For the period 2014-2020 the target area has grown to 10.4 million hectares.
Furthermore, the target area for coverage by the Agri-environment-climate measure for 2014-2020 is 31.7 million ha44. Support for knowledge-building, investments, co-
operation and innovation also contribute strongly to environmental improvements. According to targets, the 2014-2020 RDPs will help to bring about investments of EUR
2.9 billion in energy efficiency and EUR 2.7 billion in renewable energy production – in the farm and forestry sectors and in rural areas overall.
What supporting steps did the DG take in 2016?
With regard to the implementation of "greening", in 2016 DG AGRI carried out a review of how the system had been applied in its first year45. This review identified weaknesses
that held the greening system back from achieving its full potential, and considered possible remedies. DG AGRI subsequently proposed various improvements to the
relevant regulation46 which are intended to apply as of direct payments claim year 2018 (2017 for those Member States which so wish).
43 From one budgetary period to the next, rural development measures have been refined and their architecture
modified, but much of the content remains the same. In the 2007-2013 period, support for delivering
environmental benefits through organic farming was paid through the Agri-environment measure, whereas now
it is paid through a distinct measure explicitly intended for organic farming. 44 The fact that this figure is lower than the total for the 2007-2013 period should be understood in light of
three developments. First, some of the practices covered by the Agri-environment measure in the period 2007-
2013 are now covered by the “greening” requirements of the direct payments system or by the newly separate
Organic farming measure. Secondly, the Agri-environment-climate measure of the new period is funding many
contracts which deliver greater environmental benefit per hectare (with correspondingly higher cost).
45 Originally the review was to centre on "ecological focus area", as this reflected the commitment made by the
Commission when the 2013 CAP reform was adopted. However, in the end the review acquired a broader scope
– encompassing all the elements of greening - within the framework of general simplification of the CAP. It
resulted in Commission Staff Working Document SWD(2016)218 of 23/06/2016. 46 Commission Delegated Regulation (EU) No 639/2014

agri_aar_2016 Page 33 of 114
In the case of rural development policy, DG AGRI assisted the implementation of the RDPs by contributing to the work of the ENRD and the EIP-AGRI Network (see also
section 1.1). Topics covered by workshops or reports and of relevance to Commission general objective 3 included "promoting the transition to the green economy", "agri-
environment-climate measures" and "reducing [greenhouse gas] emissions from cattle".
DG AGRI also carried out work relevant to objective 3 which was not specifically linked to
any single CAP instrument:
- It spearheaded preparations for agriculture-related negotiations at the 22nd
Conference of the Parties of the UNFCCC47, held in Marrakesh in November. The
resulting Marrakesh Proclamation acknowledged the importance of agriculture with regard to climate change and called on all parties to take appropriate action
in this domain.
- DG AGRI also helped to prepare the legislative proposals for the EU 2030 Climate
and Energy Framework – especially the regulations on Effort-Sharing (ES) as well as Land Use, Land Use Change and Forestry (LULUCF) – which the Commission
adopted in July 2016. This work ensured that agriculture was appropriately addressed in the EU's greenhouse gas emission reduction targets.
47 United Nations Framework Convention on Climate Change
Greening practices have been designed as simple, generalised, non-contractual
and annual obligations for farmers, that go beyond cross-compliance and enhance agro-environmental measures under rural development by allowing them to finance
more demanding activities targeted at specific environmental and climate-related needs. Greening is intended to have a wide coverage to deliver environmental
effects on a large share of EU farm land and sets standard practices that yield potential environmental benefits. Farmers are rewarded for undertaking
environment-friendly practices, which do not necessarily entail a change in every
farm. Where these practices are already applied, the Ecological Focus Area obligation guarantees their maintenance against the competitive pressures facing
farmers. Where they are not present, they have to be put in place. For the sake of simplification and to highlight the joint provision of public and private goods,
besides prescribing standard practices, greening payments are set as a percentage (30%) of direct payments and are therefore paid per hectare for the three measures
as a whole.
The preliminary assessment of green direct payments shows a significant
reinforcement in the environmental ambition of the CAP: this concerns most notably
the wide area coverage of this new instrument, which represents — in addition to the rules under cross-compliance — a basic layer of environmental practices
across most agricultural land in the EU (77% of agricultural area in the EU is subject to greening in 2016). This wide coverage - supported by the basic
legislation which provided the necessary flexibility to take into consideration the various climatic conditions and agronomic practices across the 28 Member States -
means that the green direct payment scheme has the potential to have a significant positive environmental impact. For example, compared to the
compulsory minimum of 5%, in average 14% of arable land has been declared as
being covered with areas such as fallow land, leguminous crops, buffer strips and hedges favourable for biodiversity on farms (Ecological Focus Area). Implementation
by Member States and farmers has been further eased with several waves of simplifications based on opinions received from administrations and stakeholders.
agri_aar_2016 Page 34 of 114
Agricultural research also played a significant role in fostering innovation towards more sustainable, resource-efficient and climate-friendly agricultural practices. Within the
budget managed by DG AGRI, about 15 research projects launched in 2016 relate to
these objectives.
For instance, the research project IWMPRAISE aims at more developing sustainable
cropping systems, both from the agronomic and environmental point of view, which are resilient to external impacts without jeopardising profitability or the steady supply of
food, feed and biomaterials.
The corresponding financial support related to the abovementioned 15 projects amounted
to roughly € 90 million.
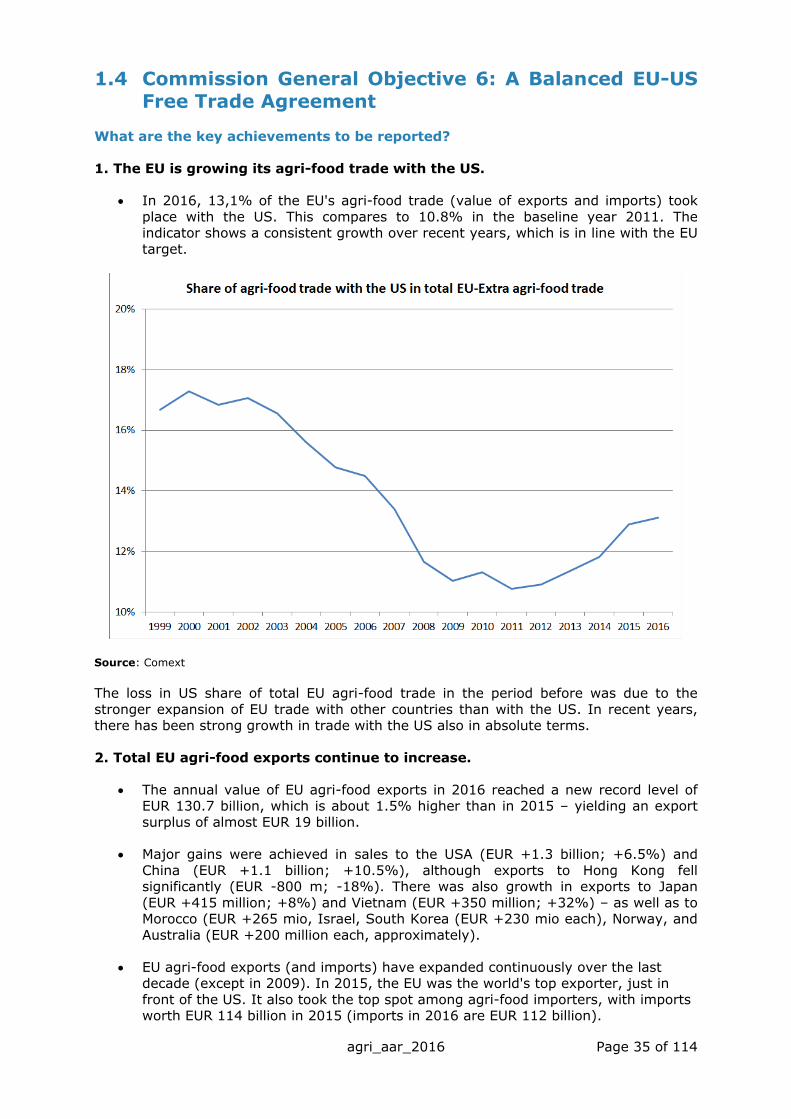
agri_aar_2016 Page 35 of 114
1.4 Commission General Objective 6: A Balanced EU-US Free Trade Agreement
What are the key achievements to be reported?
1. The EU is growing its agri-food trade with the US.
In 2016, 13,1% of the EU's agri-food trade (value of exports and imports) took
place with the US. This compares to 10.8% in the baseline year 2011. The indicator shows a consistent growth over recent years, which is in line with the EU
target.
Source: Comext
The loss in US share of total EU agri-food trade in the period before was due to the
stronger expansion of EU trade with other countries than with the US. In recent years, there has been strong growth in trade with the US also in absolute terms.
2. Total EU agri-food exports continue to increase.
The annual value of EU agri-food exports in 2016 reached a new record level of EUR 130.7 billion, which is about 1.5% higher than in 2015 – yielding an export
surplus of almost EUR 19 billion.
Major gains were achieved in sales to the USA (EUR +1.3 billion; +6.5%) and
China (EUR +1.1 billion; +10.5%), although exports to Hong Kong fell significantly (EUR -800 m; -18%). There was also growth in exports to Japan
(EUR +415 million; +8%) and Vietnam (EUR +350 million; +32%) – as well as to Morocco (EUR +265 mio, Israel, South Korea (EUR +230 mio each), Norway, and
Australia (EUR +200 million each, approximately).
EU agri-food exports (and imports) have expanded continuously over the last decade (except in 2009). In 2015, the EU was the world's top exporter, just in
front of the US. It also took the top spot among agri-food importers, with imports worth EUR 114 billion in 2015 (imports in 2016 are EUR 112 billion).

agri_aar_2016 Page 36 of 114
Source: COMEXT and EUROSTAT
Why are these achievements important?
As is well known, progress on the Transatlantic Trade and Investment Partnership (TTIP) has halted for political reasons. However, the importance of the US to the EU agri-food
sector – in 2016 the US was the EU's largest export market for agri-food products and the second-largest source of imports – underlines the fact that EU producers are eager to
make the most of openings across the Atlantic.
In more general terms, healthy exports are an important source of revenue and jobs for
the EU farm and agri-food sectors. These sectors are well placed to help meet growing and diverse global demand without neglecting domestic supply.
According to an independent study48 carried out on behalf of the European Commission in
2016, trade agreements have helped to boost EU agricultural exports and have supported jobs in the agri-food sector and other sectors of the economy. Trade
agreements with three countries – Mexico, South Korea and Switzerland – were studied in detail. The study shows that the agreements contributed to increased trade in both
directions, with increased EU exports and increased imports of products from these three countries, giving EU consumers and business greater access to agri-food products. The
study finds that the trade agreements with Mexico, South Korea and Switzerland have increased EU agri-food exports to these countries by more than EUR 1 bn and raised
value added in the agri-food sector by EUR 600 m. The increased exports have supported
almost 20 000 jobs in the agri-food sector, of which 13 700 jobs are in primary
48 Study on the impact of free trade agreements on EU agriculture: https://bookshop.europa.eu/en/impacts-of-
eu-trade-agreements-on-the-agricultural-sector-pbKF0116070. See also Annex 9.

agri_aar_2016 Page 37 of 114
agriculture. The export increase has also benefited other actors in the agri-food supply chain. Importantly, the study suggests that increased imports have little impact on
domestic EU production. Instead, they reflect mainly a replacement of imports from other
third countries or an increase in EU consumption.
How closely are the achievements linked to the CAP?
The EU no longer offers agricultural export refunds. However, with fairness and economic efficiency, the CAP strengthens the farm and agri-food sectors' ability to compete on
overseas as well as domestic markets in the ways set out in section 1.1.
In addition, a now-reinforced promotion policy and certain EU labelling schemes49 help to
cement recognition of EU products around the world.
What supporting steps did the DG take in 2016?
DG AGRI played an active role in trade negotiations which reached various stages in
2016, including:
• scoping exercises (e.g. for Australia and New Zealand);
• the launch of bilateral negotiations (e.g. with the Philippines and Indonesia);
• ongoing talks, both multilateral (in the WTO) and bilateral (e.g. with Japan,
Mercosur and the US – though this last set of negotiations is now on hold);
• the signature of an agreement (the Comprehensive Economic and Trade
Agreement – CETA – with Canada).
The DG also organised high-level visits of Commissioner Hogan to non-EU countries with
49 e.g. Protected Designation of Origin (PDO) and Protected Geographical Indication (PGI)
Example of EU added value: Promotion campaigns
Some campaigns selected or implemented in 2016 with a good European message
and/or wide impacts could be quoted as examples:
- AOP IGP fraises kwi asperges kaki: "l'Europe signe les produits de ses
terroirs": http://www.aop-igp.fr/en/. The programme evaluation report shows a clear improvement in the public
awareness of Protected Denominations of Origin and Protected Geographical
Indications.
- "Cheeses of Europe: make it magnifique": http://thecheesesofeurope.com.
Agricultural policy is a European policy. Instead of having 28 separate agricultural policies, the Member States pool their resources in order to pursue a European policy
with a common budget. Agriculture is the only sector governed by a common policy with common rules - including on the matter of promotion - laid down by the Treaty.
In particular, in an internal market any action at EU level will have an important leverage effect in terms of (a) making it easier to set up generic information
programmes which, by their very nature, are rarely implemented by the Member
States or companies, particularly in the current context of economic crisis, and (b) implementing multi-country programmes which will give rise to an exchange of
experiences between Member States and to economies of scale.

agri_aar_2016 Page 38 of 114
strong potential for EU agricultural exports – e.g. China, Japan, Mexico, Colombia, Vietnam and Indonesia, in which he was accompanied by business delegations
representing key sectors in the EU agri-food business. The visits helped to identify export
opportunities and secure business deals.
Executive agencies
REA
The Research Executive Agency (REA) has been implementing its mandate since 2014.
In 2016, REA performed its tasks in an effective, efficient and cost-effective way.
For the operational budget 2016, the execution in commitments progressed according to schedule.
Evaluations and grant preparations (GAP) progressed according to plan. The Time-To-Grant performance was fully satisfactory for all calls. The
performance was supported by the electronic grant agreement signature which
allowed for a reduced duration of the granting process.
The Time-To-Pay performance for all types of payments was also very high,
including time-to-pay for experts.
The validation of participants and the extended mandate of the Legal Entity
Authorised Representatives (LEARs) continued at a high rate, without generating problems regarding the respect of the 8-months deadline for signing
grant agreements.
CHAFEA
In 2016 – the first year of the implementation of the reformed promotion policy (Regulation (EU) No 1144/2014), the Consumers, Health, Agriculture and Food
Executive Agency (hereafter Chafea) has been entrusted by the Commission with the management of certain parts of the information provision and
promotion measures concerning agricultural products implemented in the internal market and in third countries, notably the evaluation of the proposals
submitted for simple and multi programmes following the publications the calls for proposals. With the assistance of 49 external experts, 60 simple
programmes and 6 multi programmes have been selected from 199 and 27
proposals submitted respectively. In this regard, Chafea produced Call evaluation reports for both calls as well as the necessary documentation for the
ISC for the adoption of Commission Implementing Decision on selecting proposals for simple programmes.
Additionally, Chafea actively contributed to the communication of the reform: notably it participated in the Infoday in Bruxelles and, for the technical support,
a service contractor has been hired to create a web portal on promotion policy which is to be launched in the beginning of 2017.
Chafea also organized a High Level Mission with business delegations to Vietnam
(42 participants), Singapore (36 participants) and Indonesia (38 participants) in November 2016 and produced 3 market reports for the countries visited.

agri_aar_2016 Page 39 of 114
2. ORGANISATIONAL MANAGEMENT AND INTERNAL CONTROL
This section answers the question how the achievements described in the previous
section were delivered by the DG. This section is divided in two subsections.
The first subsection reports the control results and all other relevant information that
support management's assurance on the achievement of the financial management and internal control objectives. It includes any additional information necessary to establish
that the available evidence is reliable, complete and comprehensive; appropriately covering all activities, programmes and management modes relevant for the DG.
The second subsection deals with the other components of organisational management: human resources, better regulation principles, information management and external
communication.
2.1 Financial management and internal control
Assurance is an objective examination of evidence for the purpose of providing an
assessment of the effectiveness of risk management, control and governance processes.
This examination is carried out by management, who monitors the functioning of the
internal control systems on a continuous basis, and by internal and external auditors. Its results are explicitly documented and reported to the Director-General.
This section reports the control results and other relevant elements that support management's assurance. It is structured into (2.1.1) Control results, (2.1.2) Audit
observations and recommendations, (2.1.3) Assessment of the effectiveness of the
internal control system, and resulting in (2.1.4) Conclusions as regards assurance.
2.1.1 Control results
This section reports and assesses the elements identified by management that support the assurance on the achievement of the internal control objectives50. The DG's
assurance building and materiality criteria are outlined in the AAR Annex 4. Annex 5 outlines the main risks together with the control processes aimed to mitigate them and
the indicators used to measure the performance of the control systems.
2.1.1.1 Payments executed in 2016 for the CAP
In 2016, total EU outturn on payment appropriations51 under DG AGRI responsibility was
EUR 56 794 million. Of this, EUR 56 382 million (99.28% of CAP budget) was under shared management. Payments executed under the EAGF amounted to
EUR 44 036 million. Payments executed under the EAFRD amounted to EUR 12 345 million. Direct management and indirect management accounted altogether
for only around 0.7% of total EU expenditure under DG AGRI responsibility.
The table below shows the payment appropriations executed broken down by activity and
by management mode:
50 Effectiveness, efficiency and economy of operations; reliability of reporting; safeguarding of assets and information; prevention, detection, correction and follow-up of fraud and irregularities; and adequate management of the risks relating to the legality and regularity of the underlying transactions, taking into account the multiannual character of programs as well as the nature of the payments (FR Art 32). 51 Including assigned revenue.

agri_aar_2016 Page 40 of 114
Table 2.1.1.1-1
The detailed financial data and the draft annual accounts are presented in Annex 3.
Annex 10 to this report sets out in detail the management and control system in place for shared management funds and demonstrates how assurance is obtained with regard to
legality and regularity in respect of each of the three principal ABB activities for which the Directorate General is responsible, ABB02, ABB03 and ABB04, which together account for
99.1% of the CAP spending in 2016.
The principal conclusions in respect of each of these are summarised in section 2.1.1.2.2
below (ABB02 – Market Measures, ABB03 – Direct Payments and ABB04 – Rural Development).
2.1.1.2 Control effectiveness as regards legality and regularity
DG AGRI has set up internal control processes aimed to ensure the adequate management of the risks relating to the legality and regularity of the underlying
transactions, taking into account the multiannual character of programmes as well as the nature of the payments concerned.
The control systems are explained in more detail in part 2 (on the functioning of the Paying Agencies and the role of the Certification Bodies) and part 3 (which deals
separately with each of the ABBs) of Annex 10.
The following section describe the key elements which are taken into consideration for building assurance at Commission level as regards the legality and regularity of
operations at Paying Agency level.
2.1.1.2.1 Control framework as regards legality and regularity
With more than eight million beneficiaries of the CAP EAGF and EAFRD expenditure is
implemented under shared management through a comprehensive management and control system (described in detail in Annex 10 of the report) which is designed to ensure
the legality and regularity of the underlying transactions at the level of the final beneficiaries. Where the Commission implements the budget under shared management,
implementation tasks are shared with the Member States. The latter are required to take all the necessary measures to ensure that actions financed from the EU budget are
implemented correctly and effectively and in accordance with EU rules. They are obliged to have systems in place which prevent, detect and correct irregularities and fraud. The
CAP legislation provides that they shall accredit Paying Agencies which are dedicated
bodies responsible for the management and control of Union funds, notably payments to beneficiaries and financial reporting to the Commission. There were 80 such Paying
Agencies at the end of 2016. Certification Bodies designated by Member States shall
Title 05 Agriculture and rural developmentShared
management (EUR)
Direct
management (EUR)
Indirect
management (EUR)Total (EUR) % of CAP budget
0501 Administrative expenditure 20 738 156 20 738 156 0,04%
0502 Interventions in agricultural markets 3 126 439 493 1 463 065 3 127 902 558 5,51%
0503 Direct aids 40 808 728 092 40 808 728 092 71,85%
0504 Rural development 12 345 006 691 19 991 948 12 364 998 639 21,77%
0505 Instrument for Pre-accession Assistance 339 242 762 339 242 762 0,60%
0506 International aspects 4 403 542 4 403 542 0,01%
0507 Audit 102 323 671 102 323 671 0,18%
0508 Policy strategy and coordination 25 624 568 25 624 568 0,05%
0509 Horizon 2020 - Research and innovation - - 0,00%
56 382 497 947 72 221 278 339 242 762 56 793 961 987 100,00%
99,28% 0,13% 0,60% 100,00%
Total
% of Title 5
agri_aar_2016 Page 41 of 114
provide every year an opinion covering the completeness, accuracy and veracity of the annual accounts of the Paying Agency concerned, the proper functioning of its internal
control system and since 2015 the legality and regularity of the expenditure declared
to the Commission.
The EAGF (1st pillar) is funded only by the EU budget. It is managed on an annual basis
and commitment and payment appropriations match (almost entirely non-differentiated appropriations). Aid measures and schemes are legislated at EU level and specify EU-
wide rules.
The EAFRD (2nd pillar) is co-funded by the EU and national budgets. It is managed on
the basis of national or regional multiannual programmes where measures can be tailored at national and regional level in order to meet specific objectives. The
appropriations are differentiated in order to reconcile the principle of annuality with the need to manage multi-annual operations.
However a single set of specific financial management, control rules and
assurance on legality and regularity apply to both pillars of the CAP52. The results of controls under the responsibility of the Paying Agencies (control data and statistics)
are provided to the Commission in respect of the financial year which is being reported upon. An adjusted error rate (which extrapolates Member States’ reported error rates, as
validated and adjusted by DG AGRI on the basis of all available information, to the non-controlled population – see Annex 4) is calculated in respect of the 2016 expenditure.
Since 2015, in the framework of the annual financial clearance exercise the Certification Bodies have been auditing, at the level of each Paying Agency, the legality and regularity
of the expenditure and expressed an opinion thereon. This additional audit evidence
allows DG AGRI to consolidate and/or fine-tune its adjustments of the error rates reported by the Paying Agencies. With further experience gained by all the actors
concerned, the opinion of the Certification Bodies on legality and regularity progressively becomes, where the audit work of the Certification Bodies is done in accordance with the
applicable regulations and guidelines, the key element of the assurance model of the CAP expenditure. In parallel, annual accounts are declared by the Paying Agencies, certified
by the Certification Bodies and are cleared (financial clearance procedure) by the Commission, without prejudice to future net financial corrections to be decided by the
Commission resulting from DG AGRI own audit activities pursuant to the conformity
clearance.
The following flow chart sets out the CAP shared management model:
52 Regulation (EU) No 1306/2013 of the European Parliament and of the Council on the financing,
managing and monitoring of the common agricultural policy, (OJ. L 347 of 20/12/2013).

agri_aar_2016 Page 42 of 114
The Commission has set up processes designed to ensure the adequate management of the risks related to the legality and regularity of the underlying transactions, taking into
account the annual nature of the payments and the very large number (more than 8
million) of beneficiaries. The assurance objective is to ensure that the remaining risk to the EU budget does not exceed 2%.
The Commission is of the view that the corrective capacity in the years after the year of expenditure of its net financial corrections imposed on Member States and of the
amounts recovered from beneficiaries by the Member States and reimbursed to the EU budget must also be considered. It is not until this corrective capacity has been taken
into account that the picture of the risk to the EU budget is complete and it is possible to assess the remaining financial risk to the EU budget (error rate at closure).
As the three principal ABB activities (ABB02 – Market Measures, ABB03 – Direct
Payments and ABB04 – Rural Development) are dealt with under shared management with the Member States, the Commission (DG AGRI) cannot, on its own, reduce the level
of error. While DG AGRI is fully assuming its responsibilities, the detection and correction of errors is first and foremost in the hands of the Member States. The latter are
responsible for the management and controls at beneficiary level and, as repeatedly pointed out by the European Court of Auditors, they are primarily responsible for the
errors which occur. They are also responsible for implementing the necessary actions to remedy to control system deficiencies identified by the Certification Bodies and/or the
Commission. In cases where Member States fail to implement action plans in due time
the Commission may decide to reduce or suspend its payments, to prevent further risks to the EU budget.
DG AGRI carried out 155 audit missions in 2016 to the Member States in order to check that EU rules, and in case of the EAFRD also national rules, are complied with by the
Paying Agencies when making payments to beneficiaries or recovering undue payments. As a result of the conformity clearance procedure, the Commission imposes net financial
corrections to the Member States by which they reimburse to the EU budget the amounts corresponding to those corrections.
agri_aar_2016 Page 43 of 114
In 2016 DG AGRI also visited and audited 16 Certification Bodies, to check the quality of their audit work and consequently consolidate assurance on the reliability of their opinion
on legality and regularity of the expenditure.
It is recalled that Article 32(5) of the Financial Regulation No. 966/2012 states:
"If, during implementation, the level of error is persistently high, the Commission shall
identify the weaknesses in the control systems, analyse the costs and benefits of possible corrective actions and take or propose appropriate action, such as simplification of the
applicable provisions, improvements of the control systems and re-design of the programme or delivery systems."
The Commission recently published a Communication to the Council and the European Parliament in 2017 analysing the root causes of errors and actions taken53 for several
policy areas, including the CAP. The following sections and Annex 10 of this report present in details weaknesses found in the control systems, remedial actions being taken
and how the multiannual control system of the CAP protects the EU financial interest.
2.1.1.2.2 Assessment of the amount at risk for shared management
Given the annual declaration cycle and financial clearance of accounts procedure, the
necessary information on the results of the controls carried out for financial year N is received in sufficient time to be used in the AAR for that year. In line with the detailed
materiality criteria set out in Annex 4, reservations are made as a general rule for Paying Agencies for which the annual adjusted error rate exceeds 2%. However, for those for
which the adjusted error rate falls between 2 and 5%, the existence of sufficient mitigating factors may justify not making a reservation. Full details are presented in
Annex 10, Part 3.
53 Communication from the Commission to the Council and the European Parliament - Root causes of
errors and actions taken (Article 32(5) of the Financial Regulation) - COM(2017) 124 final, 28 February 2017.

agri_aar_2016 Page 44 of 114
ABB02 – Market Measures
Market measures, at EUR 3 127.9 million, accounted for 5.51% of the CAP budget in
2016. There are some 50 very diverse measures split over 13 sectors, the most
important of which are fruit & vegetables and wine:
Chart 2.1.1.2.2-1

agri_aar_2016 Page 45 of 114
The following table sets out the expenditure in 2016 for ABB02 by budget article (by sector). A measure by measure approach has been taken for assurance purposes in order
to estimate, as precisely as possible, the adjusted error rates and amounts at risk.
Table 2.1.1.2.2-2
Control statistics are available in respect of 75.73% of the expenditure covering
EUR 2 374.76 million. For a further EUR 761 million, DG AGRI's auditors consider that they have assurance on the basis of an examination of all available information on the
schemes concerned and have used their judgement to estimate the maximum amount at
risk in that expenditure.
Both the quantitative (where control statistics were available) and the qualitative
approaches are set out in Annex 10 – part 3.1 (ABB02).
This assessment process led to a number of adjustments being proposed by DG AGRI to
the error rates calculated by the Member States, based on its own audits and on the assessment of the Certification Bodies.
As a result, in 14 cases the adjusted error rate is above 2%. In line with its materiality criteria in Annex 4, 10 cases – where the error rate is above 5 % – were
automatically subject to a reservation (1 measure in Belgium, Hungary, Italy and the
Netherlands, 2 measures in France, Greece and Poland).
Each case where the adjusted error rate was between 2% and 5% was examined in order
to determine if risk mitigation conditions existed and if a reservation should be made. In all 4 cases a reservation was made (1 measure in Spain and Italy and 2 measures in
France).
Finally, for 8 Member States (Austria, Bulgaria, Denmark, France, Portugal, Romania and
Expenditure(1) Risk Expenditure(1) Risk
050204 Food Aid -968 -968 -968 -28
050205 Sugar - - - -
050206 Olive Oil 45 989 114 45 989 114 45 989 114 1 307 173
050207 Textile Plants 6 134 000 6 134 000 6 134 000 174 350
050208 Fruit and Vegetables 1 172 724 419 1 043 772 204 38 043 433 128 952 215 121 013 276 12 101 311 7 938 939 225 653
050209 Wine 1 027 130 938 1 026 982 789 11 033 114 148 150 148 150 - - -
050210 Promotion (shared management only) 62 587 884 62 587 884 29 960 012 3 099 755 32 627 872 927 399
050211 Other plant products and POSEI 242 007 764 239 567 593 3 086 074 2 440 170 2 440 170 69 358
050212 Milk and Milk Products 406 577 659 64 436 427 1 554 854 342 141 232 34 291 339 3 850 563 307 849 893 8 750 179
050213 Beef and Veal 30 206 396 30 206 396 30 206 396 858 572
050214 Sheepmeat and goatmeat 1 836 787 1 836 787 1 836 787 52 208
050215 Pigmeat, eggs, poultry & apiculture 140 601 812 140 601 812 140 601 812 3 996 399
Total 3 135 795 805 2 374 759 013 53 717 474 761 036 792 185 412 777 19 051 629 575 624 015 16 361 263
ExpenditureAmount at
risk% coverage Error rate
2 374 759 013 53 717 474 75.73%
185 412 777 19 051 629 5.91%
2 560 171 789 72 769 103 81.64%
2.84%
575 624 015 16 361 263
3 135 795 805 89 130 366
-9 356 312 -
3 126 439 492 89 130 366 2.85%
1 463 065 14 631 1.00%
3 127 902 558 89 144 997 2.85%
Footnote:
Measure risk assessed by
auditors
No statistics
available
EUR
Risk
EURExpenditure(1)
EUR
Overall assessment of risk for ABB02 - Market Measures
Expenditure for which no control statistics are availableExpenditure covered by
statisticsExpenditure (1)
EURSector
Budget
itemABB02 error rate applied*
2.85%
(2) Suspension of payments made in respect of financial year 2016 for Poland. The amounts corresponding to payments suspended have been declared by the
Paying Agency to the Commission in its monthly declarations (i.e. no recovery order issued for the amounts concerned) but the the amounts are suspended and
not reimbursed to the Member State by the Commission.
Total ABB 02 - payments made
Expenditure covered by control statistics
Expenditure for which there are no statistics but for which risk assessment carried out
Risk for expenditure covered by statistics and by risk assessment
*Error rate used on expenditure covered by statisitcs and risk assessed
Extrapolated risk for non-risk assessed expenditure
ABB02 - direct management - payments made on Promotion measures - direct payments by the Union
ABB02 - shared management - monthly declaration
Suspension of payments (2)
ABB02 - shared management - payments made
(1) Monthly declaration of expenditure affected by Paying Agencies.
agri_aar_2016 Page 46 of 114
Sweden, United Kingdom) for 16 cases, the amount at risk is below DG AGRI's de minimis threshold of EUR 1 million as established in Annex 4 therefore no reservation
was necessary.
The results of this analysis are set out for each case in Annex 10 – part 3.1 (ABB02).
The overall outcome of this exercise is that 14 reservations are necessary at measure level:
Fruit and Vegetables: Operational programmes for producer organisations (Belgium, Spain, France, Greece, Italy and The Netherlands);
Fruit and Vegetables: Pre-recognition of producer groups (Poland);
Temporary exceptional support measures in the fruit and vegetables sector
(Poland);
Temporary exceptional measures for milk and milk products (France);
Wine (France and Hungary);
Promotion measures (Greece and Italy);
Posei (France).
Annex 10 provides information on the corrective actions which are envisaged in each case that a reservation is made.
The following table summarises the situation at Member State level for ABB02 Expenditure under shared management. Annex 10 – Part 3.1 (ABB02) provides the full
details per main sector.

agri_aar_2016 Page 47 of 114
Table 2.1.1.2.2-3
The total amount at risk for ABB02 is estimated at EUR 89.13 million corresponding to an error rate of 2.85%.
Table 2.1.1.2.2-3 indicates an amount of EUR 1 394 million as being the expenditure managed by Paying Agencies for which a reservation is issued. It is emphasised that of
this amount, EUR 66.16 million was assessed to be at risk under reservation. It is also noted that the EUR 1 394 million referred is under close scrutiny by DG AGRI as
described in the reservation set out. Close scrutiny means an on-going conformity
clearance procedure and monitoring by DG AGRI of the remedial actions to be taken by the Member State where appropriate.
Member
State
N° of Aid
schemes subject
to reservation
Expenditure(1)
2016Reservations (by aid schemes) - shared management
Adjusted
error rate
Amunt under
reservation
EUR
Amount at Risk
EUR
2016
Expenditure
managed by
Paying
Agencies with
reservation
AT 35 318 811 - - 1 252 762 -
BE 1 77 388 582 Fruit and Vegetables - Operational Programmes for Producer Organisations 5.31% 3 019 894 3 513 362 56 861 325
BG 37 579 798 - - 833 670 -
CY 8 254 490 - - 32 579 -
CZ 27 735 175 - - 404 975 -
DE 186 484 774 - - 2 757 068 -
DK 23 076 933 - - 828 777 -
EE 9 543 211 - - 233 146 -
ES 1 604 886 277 Fruit and Vegetables - Operational Programmes for Producer Organisations 3.57% 9 021 819 10 456 423 252 667 017
FI 16 300 797 - - 278 781 -
Fruit and Vegetables - Operational Programmes for Producer Organisations 5.78% 5 828 149 100 807 023
Wine 2.29% 6 427 890 280 544 985
Temporary Exceptional Measures - Milk and milk products 11.23% 3 850 563 34 291 339
Posei 2.43% 3 050 919 125 422 712
GB 86 240 206 - - 1 264 305 -
Fruit and Vegetables - Operational Programmes for Producer Organisations 5.00% 1 445 695 28 913 896 Promotion 10.00% 1 196 498 11 964 976
HR 10 306 727 - - 163 915 -
HU 1 55 249 839 Wine 5.32% 1 547 102 1 887 688 29 103 000
IE 23 052 726 - - 502 044 -
Promotion 25.00% 1 890 854 7 563 416
Fruit and Vegetables - Operational Programmes for Producer Organisations 2.81% 6 783 045 241 698 099
LT 30 476 884 - - 806 564 -
LU 1 103 836 - - 19 343 -
LV 11 811 268 - - 252 656 -
MT 492 638 - - 3 591 -
NL 1 87 893 883 Fruit and Vegetables - Operational Programmes for Producer Organisations 8.82% 3 498 811 4 722 920 39 682 278
Fruit and Vegetables -Prerecognition of Producer Groups and Fruit and Vegetables 10.27% 6 500 320 63 296 480
Temporary Exceptional Measures - Fruit and vegetables 10.00% 12 099 650 120 996 503
PT 110 960 753 - - 1 175 273 -
RO 47 073 600 - - 1 357 181 -
SE 22 342 774 - - 1 139 784 -
SI 8 655 918 - - 80 086 -
SK 10 416 965 - - 85 723 -
Total 14 3 135 795 805
-9 356 312
3 126 439 493 2.85% 66 161 207 89 130 366 1 393 813 049
Footnote:
Total ABB02 - paymens made
Suspension of payments (2)
(1) Monthly declaration of expenditure affected by Paying Agencies.(2) Suspension of payments made in respect of financial year 2016 for Poland. The amounts corresponding to payments suspended have been declared by the Paying Agency to the
Commission in its monthly declarations (i.e. no recovery order issued for the amounts concerned) but the the amounts are suspended and not reimbursed to the Member State by
the Commission.
20 717 742
PL 19 793 620
IT 661 591 898 11 460 4102
GR 80 040 084 3 105 9772
2 263 329 797
FR 4 598 187 161
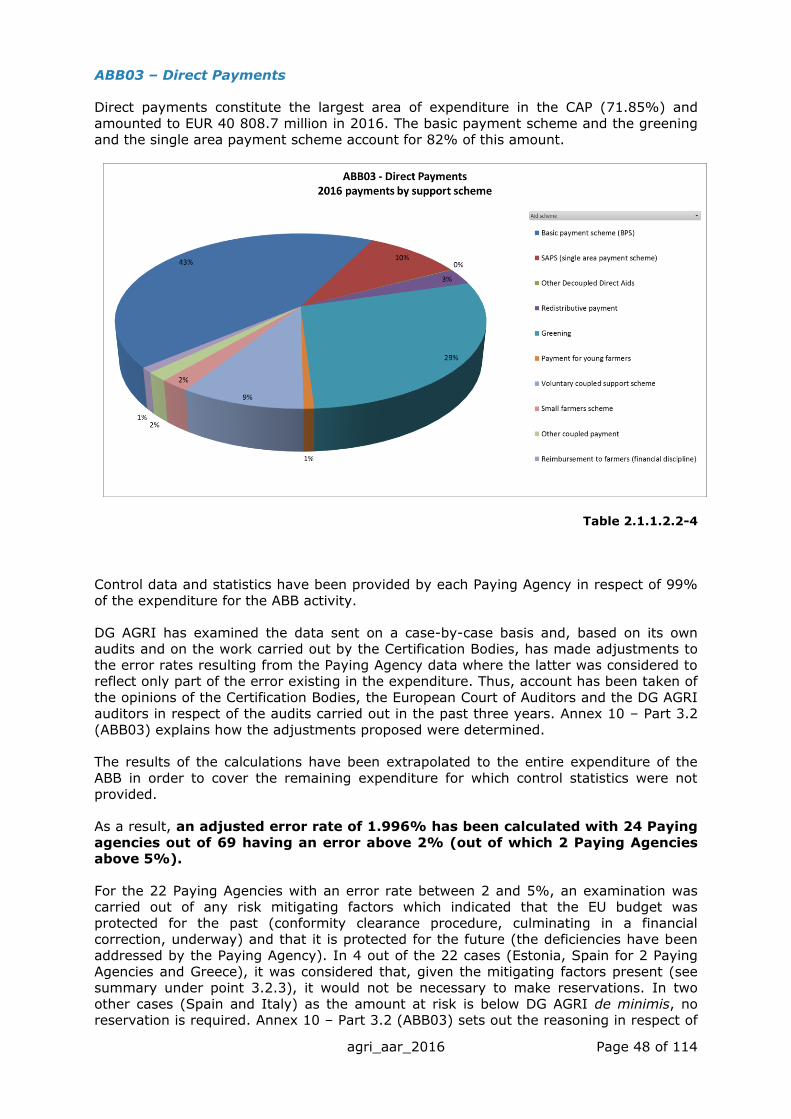
agri_aar_2016 Page 48 of 114
ABB03 – Direct Payments
Direct payments constitute the largest area of expenditure in the CAP (71.85%) and
amounted to EUR 40 808.7 million in 2016. The basic payment scheme and the greening
and the single area payment scheme account for 82% of this amount.
Table 2.1.1.2.2-4
Control data and statistics have been provided by each Paying Agency in respect of 99%
of the expenditure for the ABB activity.
DG AGRI has examined the data sent on a case-by-case basis and, based on its own audits and on the work carried out by the Certification Bodies, has made adjustments to
the error rates resulting from the Paying Agency data where the latter was considered to reflect only part of the error existing in the expenditure. Thus, account has been taken of
the opinions of the Certification Bodies, the European Court of Auditors and the DG AGRI auditors in respect of the audits carried out in the past three years. Annex 10 – Part 3.2
(ABB03) explains how the adjustments proposed were determined.
The results of the calculations have been extrapolated to the entire expenditure of the
ABB in order to cover the remaining expenditure for which control statistics were not
provided.
As a result, an adjusted error rate of 1.996% has been calculated with 24 Paying
agencies out of 69 having an error above 2% (out of which 2 Paying Agencies above 5%).
For the 22 Paying Agencies with an error rate between 2 and 5%, an examination was carried out of any risk mitigating factors which indicated that the EU budget was
protected for the past (conformity clearance procedure, culminating in a financial correction, underway) and that it is protected for the future (the deficiencies have been
addressed by the Paying Agency). In 4 out of the 22 cases (Estonia, Spain for 2 Paying
Agencies and Greece), it was considered that, given the mitigating factors present (see summary under point 3.2.3), it would not be necessary to make reservations. In two
other cases (Spain and Italy) as the amount at risk is below DG AGRI de minimis, no reservation is required. Annex 10 – Part 3.2 (ABB03) sets out the reasoning in respect of

agri_aar_2016 Page 49 of 114
each case.
The overall outcome of this exercise is that 18 reservations are necessary at
Paying Agency level:
7 reservations for 7 Paying Agencies in Italy Bulgaria
Cyprus Denmark
France (Posei) Hungary
Poland Portugal
Romania Spain
Sweden
United Kingdom
The following table presents the situation at Member State level for ABB03. Annex 10 – Part 3.2 (ABB03) provides the full picture per Paying Agency.
Table 2.1.1.2.2-5
Member StatesExpenditure(1)
2016
N° of Paying
Agencies
N° of
Paying Agencies under
reservation
Adjusted error rate Amount at riskAmount at risk covered
by reservation
2016 Expenditure
managed by
Paying Agencies
with a reservation
AT 686 377 880 1 0 0.53% 3 613 238 0 0
BE 522 629 362 2 0 1.10% 5 730 706 0 0
BG 705 306 488 1 1 4.42% 31 162 984 31 162 984 705 306 488
CY 49 788 828 1 1 4.14% 2 059 857 2 059 857 49 558 299
CZ 834 008 540 1 0 0.36% 2 970 187 0 0
DE 4 875 100 790 13 0 1.00% 48 899 504 0 0
DK 852 260 873 1 1 2.97% 25 338 972 25 338 972 852 260 844
EE 112 835 661 1 0 2.02% 2 281 596 0 0
ES 5 045 592 153 17 1 1.60% 80 699 838 10 075 857 108 552 092
FI 522 194 621 1 0 0.67% 3 488 434 0 0
FR 7 093 197 137 2 1 0.44% 30 270 345 2 894 717 138 841 478
GB 3 036 266 175 4 1 1.42% 43 171 384 15 547 294 521 935 709
GR 2 072 079 443 1 0 2.63% 54 400 662 0 0
HR 179 801 123 1 0 0.75% 1 349 105 0 0
HU 1 267 308 687 1 1 3.24% 41 099 691 41 099 691 1 266 105 244
IE 1 208 736 460 1 0 0.24% 2 868 250 0 0
IT 3 833 819 861 9 7 2.39% 91 682 707 91 000 743 3 801 979 598
LT 409 894 533 1 0 0.81% 3 301 588 0 0
LU 33 245 345 1 0 0.48% 159 453 0 0
LV 177 864 441 1 0 1.80% 3 204 895 0 0
MT 5 037 777 1 0 1.87% 94 232 0 0
NL 725 516 364 1 0 1.38% 9 980 051 0 0
PL 3 339 889 763 1 1 4.30% 143 680 889 143 680 889 3 339 740 242
PT 646 509 144 1 1 2.66% 17 229 300 17 229 300 646 504 891
RO 1 521 315 445 1 1 9.24% 140 575 256 140 575 256 1 521 253 536
SE 666 608 665 1 1 3.08% 20 527 150 20 527 150 666 608 665
SI 137 618 722 1 0 0.78% 1 066 659 0 0
SK 425 429 925 1 0 0.82% 3 488 121 0 0
Total 40 986 234 205 69
-2 102 757 Amounts reimbursed to DG AGRI by Coordinating Bodies
-175 403 355
Total ABB 03 -
Payments made40 808 728 092 69 18 1.996% 814 395 052 541 192 709 13 618 647 086
Footnote: (1) Monthly declaration of expenditure affected by Paying Agencies.(2) Suspension of payments made in respect of financial year 2016 for France. The amounts corresponding to payments suspended have
been declared by the Paying Agency to the Commission in its monthly declarations (i.e. no recovery order issued for the amounts
concerned) but the the amounts are suspended and not reimbursed to the Member State by the Commission.
Suspension of payment (2)
agri_aar_2016 Page 50 of 114
27 Member States have decided to apply the new voluntary coupled support (VCS), and farmers could apply for this aid for the first time in claim year 2015 (financial year
2016). The MS decisions on VCS measures were not subject to prior approval by the
Commission. However, DG AGRI ensured an extensive review of the notifications.
Following assessments of the Member States' notifications and further correspondence
with Member States concerned DG AGRI has opened conformity audits on the risk of non-compliance in 8 Member States.
This is a very specific situation linked to the implementation of a new measure. The specific risk is not at all linked to the legality and regularity of the farmers' claims or the
effectiveness of the management and control system applied by the Paying Agencies, and is not quantifiable at this stage of the on-going conformity procedures.
An unquantified reservation covering the 8 Member States concerned (FR, GR, IE, IT, LT, MT, PL and RO) is therefore necessary. The detailed result of this analysis is set
out in Annex 10 – part 3.2 (ABB03).
As recommended by IAS (see section 2.1.2) DG AGRI will further strengthen the monitoring of the VCS measures presenting the highest risks of not meeting the
scheme's objectives and/or most likely at risk of distorting agricultural markets.
The error rate for ABB03 is 1.996% with an amount at risk of EUR 814.4 million.
Table 2.1.1.2.2-5 indicates an amount of EUR 13 618.6 million as being the expenditure managed by Paying Agencies for which a reservation is issued. It is emphasised that of
this amount, EUR 814.4 million was assessed to be at risk. It is also noted that the EUR 13 618.6 million referred is under close scrutiny by DG AGRI as described in the
reservation set out in chapter 3. Close scrutiny means an on-going conformity clearance
procedure and/or monitoring by DG AGRI of the remedial actions to be taken by the Member State where appropriate.

agri_aar_2016 Page 51 of 114
ABB04 – Rural Development
In 2016, EUR 12 365 million was paid to Member States in respect of rural development
which represents 21.77% of the CAP spending.
Table 2.1.1.2.2-6
Control statistics have been provided by each Paying Agency in respect of 100% of the
expenditure financed under 2007-2013 and 2014-2020 Rural Development Programmes amounting to EUR 8 643 million. An amount of EUR 1 000.6 million was paid as pre-
financing under the 2014-2020 Rural Development programming period.
The following chart sets out 2016 expenditure declared by Member States for the Rural
Development Programmes divided among the IACS and non-IACS measures as well as
Technical Assistance (see Annex 10-3.3.2 for more information).
Management
typeChapter
Budget
itemDescription
Payments
(EUR)
05040114 Completion of rural development financed by the EAGGF
Guarantee Section - Programming period 2000 to 2006
-1 048 601
05040201 Completion of the European Agricultural Guidance and
Guarantee Fund, Guidance Section - Objective 1 regions (2000
to 2006)40 410 348
Rural development programmes 2007-20134 495 770 025
Interim payments 2007-2013
1 833 639 985
Final balance2 662 130 040
Promoting sustainable rural development, a more
territorially and environmentally balanced, climate-
friendly and innovative Union agricultural sector7 809 874 920
Interim payments for promoting sustainable rural development,
a more territorially and environmentally balanced, climate-
friendly and innovative Union agricultural sector 2014-2020
6 809 283 936
Pre-financing for promoting sustainable rural development, a
more territorially and environmentally balanced, climate-friendly
and innovative Union agricultural sector 2014-20201 000 590 984
05040206 Completion of Leader (2000 to 2006)7 437 218
05046002 Operational technical assistance 2014-202012 554 730
12 364 998 639
Direct
Management
Shared
Management
Total
Payments reimbursed by DG AGRI to the Member States in 2016
0504
05040501
05046001

agri_aar_2016 Page 52 of 114
Table 2.1.1.2.2-7
DG AGRI has examined the data sent on a case-by-case basis and has made adjustments to the error rates resulting from the Paying Agency data where the latter was considered
to reflect only part of the error existing in the expenditure, based on its own audits and on the assessment of the Certification Bodies. Thus, account has been taken of the
opinions of the Certification Bodies, the European Court of Auditors and the DG AGRI auditors in respect of the audits carried out in the past three years. Annex 10 – part 3.3
(ABB04) explains in detail the assessment process and how the adjustments proposed
were determined.
As a result of the adjustments made, 26 out of 72 Paying Agencies have an adjusted
error rate above 2% (of which 10 were above 5%: Belgium (Wallonie), Bulgaria, Czech Republic, France (ASP), United Kingdom (Scotland), Italy (Trento), Lithuania, Portugal,
Slovakia and Sweden.
In line with its materiality criteria in Annex 4, 9 cases where the error rate is above
5% (Belgium (Wallonie), Bulgaria, Czech Republic, France (ASP), United Kingdom (Scotland), Lithuania, Portugal, Slovakia and Sweden) were automatically subject to a
reservation. In all of these cases, the high adjusted error rate was determined further
to assessment and adjustment of the error rate by DG AGRI, based on its own audits and on the assessment of the Certification Bodies, or due to the system assessment given by
the ECA. In one case (Trento (IT)), the amount at risk is below DG AGRI's de minimis threshold of EUR 1 million as established in Annex 4 (materiality criteria) therefore no
reservation was necessary.
For 16 Paying Agencies with an error rate between 2% and 5%, DG AGRI examined the
situation for each Paying Agency concerned to determine if risk mitigation conditions existed rendering it unnecessary to make a reservation. In 3 cases (Germany, United
Kingdom – North Ireland and Estonia) it was considered that, given the mitigating factors
present it would not be necessary to make reservations. For 2 Paying Agencies (Germany 21 and France 18) the amount at risk is below DG AGRI's de minimis threshold of EUR 1
million as established in Annex 4 (materiality criteria) therefore no reservation was necessary. For the remaining 11 Paying Agencies a reservation was deemed necessary.
As regards reservations from 2015, in 10 cases (Austria, Germany (MS, Mecklenburg-Vorpommern), Spain (MS, Madrid, Valencia) Italy (Toscana, Emilia-Romagna), United
Kingdom - England and Latvia it was not considered necessary to carry over reservations from the 2015 AAR with regard to 2016 expenditure. The reasons for each decision are
agri_aar_2016 Page 53 of 114
detailed in Annex 10 – part 3.3.
In total 16 reservations from 2015 are repeated in 2016 as the remedial action plans are
still underway while 4 new reservations are introduced (Germany (Niedersachsen),
Lithuania, Poland and Slovakia).
The overall outcome of this exercise is that 20 reservations are necessary at Paying Agency level.
Belgium Bulgaria
Czech Republic Germany (Niedersachsen)
Denmark Spain (Andalucía)
France (ASP)
The United Kingdom (Scotland) Greece
Hungary Ireland
Italy (AGEA, Calabria) Lithuania
The Netherlands Poland
Portugal
Romania Sweden
Slovakia
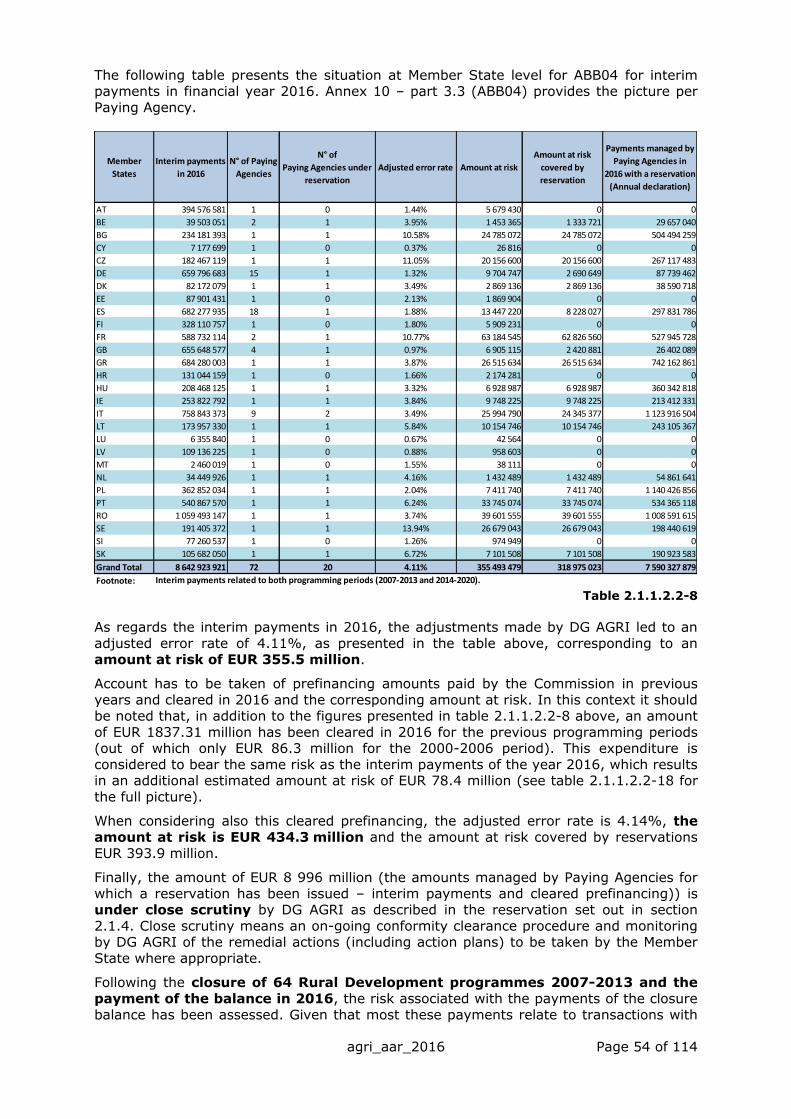
agri_aar_2016 Page 54 of 114
The following table presents the situation at Member State level for ABB04 for interim payments in financial year 2016. Annex 10 – part 3.3 (ABB04) provides the picture per
Paying Agency.
Table 2.1.1.2.2-8
As regards the interim payments in 2016, the adjustments made by DG AGRI led to an
adjusted error rate of 4.11%, as presented in the table above, corresponding to an amount at risk of EUR 355.5 million.
Account has to be taken of prefinancing amounts paid by the Commission in previous
years and cleared in 2016 and the corresponding amount at risk. In this context it should be noted that, in addition to the figures presented in table 2.1.1.2.2-8 above, an amount
of EUR 1837.31 million has been cleared in 2016 for the previous programming periods (out of which only EUR 86.3 million for the 2000-2006 period). This expenditure is
considered to bear the same risk as the interim payments of the year 2016, which results in an additional estimated amount at risk of EUR 78.4 million (see table 2.1.1.2.2-18 for
the full picture).
When considering also this cleared prefinancing, the adjusted error rate is 4.14%, the
amount at risk is EUR 434.3 million and the amount at risk covered by reservations
EUR 393.9 million.
Finally, the amount of EUR 8 996 million (the amounts managed by Paying Agencies for
which a reservation has been issued – interim payments and cleared prefinancing)) is under close scrutiny by DG AGRI as described in the reservation set out in section
2.1.4. Close scrutiny means an on-going conformity clearance procedure and monitoring by DG AGRI of the remedial actions (including action plans) to be taken by the Member
State where appropriate.
Following the closure of 64 Rural Development programmes 2007-2013 and the
payment of the balance in 2016, the risk associated with the payments of the closure
balance has been assessed. Given that most these payments relate to transactions with
Member
States
Interim payments
in 2016
N° of Paying
Agencies
N° of
Paying Agencies under
reservation
Adjusted error rate Amount at risk
Amount at risk
covered by
reservation
Payments managed by
Paying Agencies in
2016 with a reservation
(Annual declaration)
AT 394 576 581 1 0 1.44% 5 679 430 0 0
BE 39 503 051 2 1 3.95% 1 453 365 1 333 721 29 657 040
BG 234 181 393 1 1 10.58% 24 785 072 24 785 072 504 494 259
CY 7 177 699 1 0 0.37% 26 816 0 0
CZ 182 467 119 1 1 11.05% 20 156 600 20 156 600 267 117 483
DE 659 796 683 15 1 1.32% 9 704 747 2 690 649 87 739 462
DK 82 172 079 1 1 3.49% 2 869 136 2 869 136 38 590 718
EE 87 901 431 1 0 2.13% 1 869 904 0 0
ES 682 277 935 18 1 1.88% 13 447 220 8 228 027 297 831 786
FI 328 110 757 1 0 1.80% 5 909 231 0 0
FR 588 732 114 2 1 10.77% 63 184 545 62 826 560 527 945 728
GB 655 648 577 4 1 0.97% 6 905 115 2 420 881 26 402 089
GR 684 280 003 1 1 3.87% 26 515 634 26 515 634 742 162 861
HR 131 044 159 1 0 1.66% 2 174 281 0 0
HU 208 468 125 1 1 3.32% 6 928 987 6 928 987 360 342 818
IE 253 822 792 1 1 3.84% 9 748 225 9 748 225 213 412 331
IT 758 843 373 9 2 3.49% 25 994 790 24 345 377 1 123 916 504
LT 173 957 330 1 1 5.84% 10 154 746 10 154 746 243 105 367
LU 6 355 840 1 0 0.67% 42 564 0 0
LV 109 136 225 1 0 0.88% 958 603 0 0
MT 2 460 019 1 0 1.55% 38 111 0 0
NL 34 449 926 1 1 4.16% 1 432 489 1 432 489 54 861 641
PL 362 852 034 1 1 2.04% 7 411 740 7 411 740 1 140 426 856
PT 540 867 570 1 1 6.24% 33 745 074 33 745 074 534 365 118
RO 1 059 493 147 1 1 3.74% 39 601 555 39 601 555 1 008 591 615
SE 191 405 372 1 1 13.94% 26 679 043 26 679 043 198 440 619
SI 77 260 537 1 0 1.26% 974 949 0 0
SK 105 682 050 1 1 6.72% 7 101 508 7 101 508 190 923 583
Grand Total 8 642 923 921 72 20 4.11% 355 493 479 318 975 023 7 590 327 879
Footnote: Interim payments related to both programming periods (2007-2013 and 2014-2020).

agri_aar_2016 Page 55 of 114
beneficiaries in 2015, the adjusted error rates estimated for each individual Paying Agency concerned for financial year 2015 has been used to estimate the amount at risk.
This results in an overall 3.05% adjusted error rate for the closure balance and a
corresponding amount at risk of EUR 81.18 million. As these programmes have been closed, no remedial actions by Member States are needed, deficiencies in the
management and control systems will be followed up where necessary via conformity clearance procedures. No reservation is entered.
When considering the expenditure related to the interim payments made by the Commission to Member States for the 2007-2013 and 2014-2020 rural development
programmes and the payment of the closure balance, the adjusted error rate is 3.86%.
In addition, a significant amount of EUR 1000.6 million has been paid as prefinancing for the 2014-2020 rural development programmes. This expenditure is considered to be
risk free and therefore has an associated error rate of 0%.
When taking into account all payments made by DG AGRI in 2016, the overall situation
for the ABB04 is as follows:
Table 2.1.1.2.2-9
The adjusted error rate for ABB04 is 3.53% and the total amount at risk is
EUR 436.9 million (see table 2.1.1.2.2-9).
Finally, with the purpose of estimating a final amount at risk at Commission's corporate level for ABB 04, account has to be taken of all amounts reimbursed by the
Commission, excluding the prefinancing, including the cleared prefinancing amounts and the closure balances paid in 2016 i.e. the relevant expenditure. This results in an overall
estimated amount at risk at payment of EUR 515.1 million corresponding to an adjusted error rate of 3.908 % (see table 2.1.1.2.2-18 for the details).
Overall assessment of the functioning of the management and control systems
Article 66 of the Financial Regulation requires the Director General to report in his Annual Activity Report on whether, except as otherwise specified in any reservations, he has
reasonable assurance that, inter alia, the control procedures put in place give the necessary guarantees concerning the legality and regularity of the underlying
transactions.
In this chapter, the previous sections set out the situation with regard to the functioning
of the management and control systems for ABB02 – Market Measures, ABB03 – Direct Payments and ABB04 – Rural Development expenditure.
Budget item Expenditure Risk Amount at risk
05040501
05046001
05040114-1 048 601 0.00% 0
05040201
40 410 348 0.00% 0
05040501 2 662 130 040 3.05% 81 181 58105046001
1 000 590 984 0.00% 0
05040206 7 437 218 1.00% 74 37205046002 12 554 730 1.00% 125 547
12 364 998 639 3.53% 436 874 979
Shared management
Direct management
Closure Balance of the Rural development programmes 2007-2013
8 642 923 921 4.11% 355 493 479Programming period 2007-2013 and 2014-2020
Other payments
Description
Interim payments
Total ABB 04
Operational technical assistance 2014-2020
Completion of rural development financed by the EAGGF Guarantee Section -
Programming period 2000 to 2006
Completion of the European Agricultural Guidance and Guarantee Fund, Guidance
Section -
Objective 1 regions (2000 to 2006)
Pre-financing for promoting sustainable rural development, a more territorially
and environmentally balanced,
climate-friendly and innovative Union agricultural sector 2014-2020
Completion of Leader (2000 to 2006)

agri_aar_2016 Page 56 of 114
In delivering the conclusions in each case, DG AGRI has based itself on the four level structure of management and control which is described in Annex 10, part 1 and on the
reports and indicators which emanate from those levels. DG AGRI shares the
management of the CAP expenditure with 80 Paying Agencies in the 28 Member States and reports extensively in Annex 10, part 2 on the annual management
declarations which are delivered by those Paying Agencies as well as on the opinion delivered by the Certification Bodies. DG AGRI also, via its various forms of
follow-up including on-the-spot audits, checks that the Paying Agencies respect the strict accreditation criteria which regulates them as well as the quality of the work carried out
by the Certification Bodies.
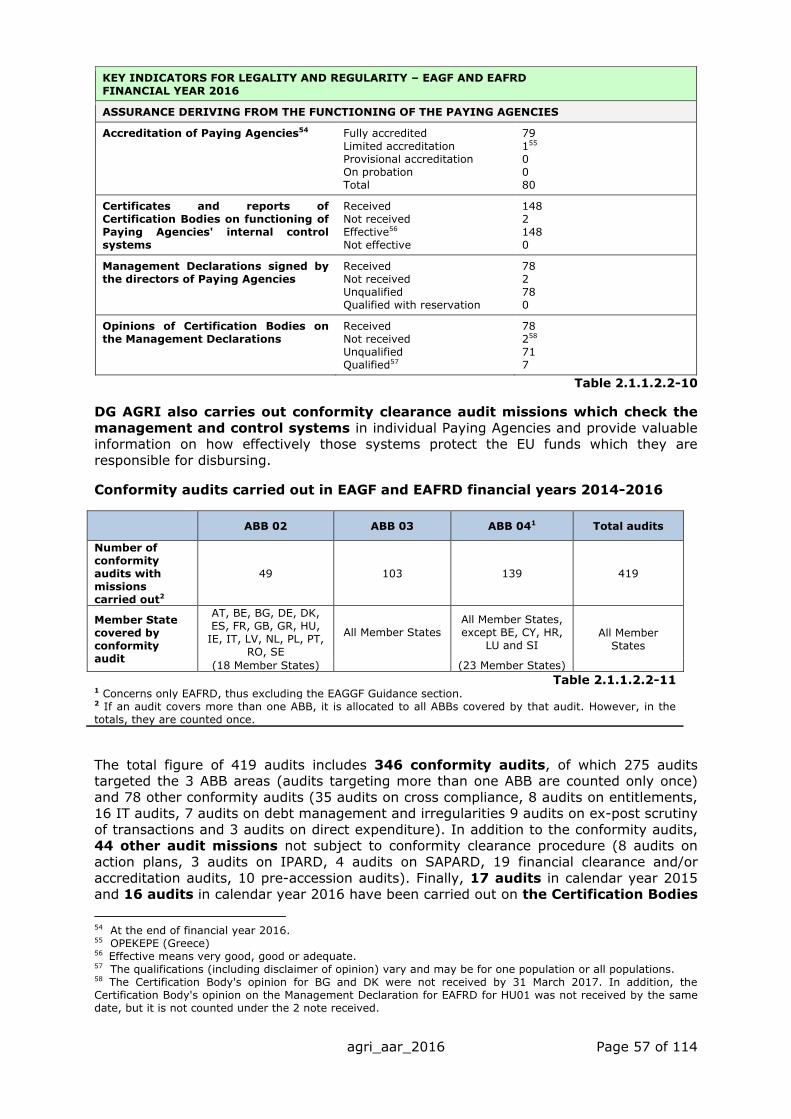
agri_aar_2016 Page 57 of 114
KEY INDICATORS FOR LEGALITY AND REGULARITY – EAGF AND EAFRD
FINANCIAL YEAR 2016
ASSURANCE DERIVING FROM THE FUNCTIONING OF THE PAYING AGENCIES
Accreditation of Paying Agencies54 Fully accredited
Limited accreditation
Provisional accreditation
On probation
Total
79
155
0
0
80
Certificates and reports of
Certification Bodies on functioning of
Paying Agencies' internal control
systems
Received
Not received
Effective56
Not effective
148
2
148
0
Management Declarations signed by
the directors of Paying Agencies
Received
Not received
Unqualified
Qualified with reservation
78
2
78
0
Opinions of Certification Bodies on
the Management Declarations
Received
Not received
Unqualified
Qualified57
78
258
71
7
Table 2.1.1.2.2-10
DG AGRI also carries out conformity clearance audit missions which check the
management and control systems in individual Paying Agencies and provide valuable information on how effectively those systems protect the EU funds which they are
responsible for disbursing.
Conformity audits carried out in EAGF and EAFRD financial years 2014-2016
ABB 02 ABB 03 ABB 041 Total audits
Number of
conformity
audits with
missions
carried out2
49 103 139 419
Member State
covered by
conformity
audit
AT, BE, BG, DE, DK,
ES, FR, GB, GR, HU,
IE, IT, LV, NL, PL, PT,
RO, SE
All Member States
All Member States,
except BE, CY, HR,
LU and SI All Member
States
(18 Member States) (23 Member States)
Table 2.1.1.2.2-11 1 Concerns only EAFRD, thus excluding the EAGGF Guidance section. 2 If an audit covers more than one ABB, it is allocated to all ABBs covered by that audit. However, in the
totals, they are counted once.
The total figure of 419 audits includes 346 conformity audits, of which 275 audits targeted the 3 ABB areas (audits targeting more than one ABB are counted only once)
and 78 other conformity audits (35 audits on cross compliance, 8 audits on entitlements, 16 IT audits, 7 audits on debt management and irregularities 9 audits on ex-post scrutiny
of transactions and 3 audits on direct expenditure). In addition to the conformity audits, 44 other audit missions not subject to conformity clearance procedure (8 audits on
action plans, 3 audits on IPARD, 4 audits on SAPARD, 19 financial clearance and/or
accreditation audits, 10 pre-accession audits). Finally, 17 audits in calendar year 2015 and 16 audits in calendar year 2016 have been carried out on the Certification Bodies
54 At the end of financial year 2016. 55 OPEKEPE (Greece) 56 Effective means very good, good or adequate. 57 The qualifications (including disclaimer of opinion) vary and may be for one population or all populations. 58 The Certification Body's opinion for BG and DK were not received by 31 March 2017. In addition, the
Certification Body's opinion on the Management Declaration for EAFRD for HU01 was not received by the same
date, but it is not counted under the 2 note received.

agri_aar_2016 Page 58 of 114
as regards legality and regularity.
Conformity audits carried out in EAGF and EAFRD financial year 2016
ABB 02 ABB 03 ABB 041 Total audits
Number of
conformity
audits with
missions
carried out2
19 31 56 155
Member State
covered by
conformity
audit
AT, BE, DE, DK, ES,
FR, IE, IT, PL, RO, SE
AT, BG, DE, DK,
ES, FR, GB, GR,
HU, IT, PL, PT, SE
AT, BG, CZ, DE,
DK, EE, ES, FI, FR,
GB, GR, HU, IE, IT,
LT, LV, NL, PL, PT,
RO, SE, SK
All Member States
except CY, MT
and SI
(11 Member States) (13 Member States) (22 Member States)
Expenditure
2016,
- total, m EUR3 3 136.7 40 984.0 11 264.7 55 385.4
- covered4, m
EUR
1 120.0 52 738.4 8 155.9 62 014.3
Table 2.1.1.2.2-12 1 Concerns only EAFRD, thus excluding the EAGGF Guidance section. 2 If an audit covers more than one ABB, it is allocated to all ABBs covered by that audit. However, in the
totals, they are counted once. 3 As declared by the Paying Agencies in their annual declarations. 4 Based on expenditure declared by the Paying Agency (x-table data) during the 24 months prior to the date
of DG AGRI's letter of finding/closure letter
The total figure of 155 audits includes 130 conformity audits, of which 102 audits
targeted the 3 ABBs areas (audits targeting more than one ABBs are counted only once) and 30 other conformity audits (11 audits on cross compliance, 6 audits on entitlements,
7 IT audits, 2 audits on debt management and irregularities and 4 audits on ex-post scrutiny of transactions). In addition to the conformity audits, 16 audits on the
Certification Bodies as regards legality and regularity have been carried out and 7 other audit missions not subject to conformity clearance procedure (2 audits on
action plans, 1 audit on IPARD, 1 financial clearance and/or accreditation audit and 3 pre-accession audits).
Those audits also result, through the ensuing conformity clearance procedures, where deficiencies in the management and control systems are detected, in net financial
corrections. It is noted that audits carried out in 2017 and 2018 will also cover the 2016 expenditure ("24 months rule"59).
The Paying Agencies are required to send statistical data reporting on the outcome of the controls which they have performed and this enables DG AGRI to
calculate the level of error detected at Paying Agency level. The following table shows the percentage of expenditure for which the Member States send statistical data on the
results of the controls carried out.
59 In accordance with the provisions of Article 52(4) of Regulation (EU) No 1306/2013, the conformity clearance covers expenditure incurred up to 24 months before the Commission officially notifies the Member State of its audit findings (i.e. the receipt by the Member State of the Letter of findings in its national language).

agri_aar_2016 Page 59 of 114
Table 2.1.1.2.2-13
As mentioned in Section 2.1.1.2.1, the Certification Bodies also assess the proper functioning of the Paying Agencies' internal control system and gives an opinion on the
legality and regularity of the expenditure declared to the Commission.
In addition, DG AGRI carries out a thorough validation and evaluation of the data.
Consequently, it takes into account all available relevant information notably the assessment of the Certification Bodies and the results of its own audit findings and
European Court of Auditors'. This process is explained in detail in Annex 4 (materiality criteria) as well as in Annex 10 – parts 3.1 (Market Measures), 3.2 (Direct Payments) and
3.3 (Rural Development).
This allows DG AGRI to make adjustments on a case-by-case basis at the appropriate
level (Paying Agency for ABB03 and ABB04 and measure level per Member State for ABB02) in order to arrive at its best estimate, using its professional judgement, of the
"real" level of error in each case – the adjusted error rate.
Following this assessment stage and taking into account the adjusted error rate, the
Paying Agencies for ABB03 and ABB04 and aid measures per Member State for ABB02 are classified into four categories in accordance with the level of assurance that they
provide as to the legality and regularity of payments made during the reporting year.
These categories are set out in the following table (2.1.1.2.2-14) which summarises the situation for each of the ABB activities:
Table 2.1.1.2.2-14
All aid schemes/Paying Agencies falling under the categories 'limited assurance – medium
risk’ and ‘limited assurance – high risk' in the above table are subject to a reservation. Therefore, reservations are necessary in respect of:
Expenditure covered
by control statistics
(EUR)
% ABB covered by
control statistics
% Fund covered by
control statistics
% CAP covered by
control statistics
ABB02 3 126 439 493 2 374 759 013 76%
ABB03 40 808 728 092 40 537 938 593 99% 98%
ABB04 12 345 006 691 12 305 644 944 100% 100%
CAP 56 280 174 276 55 218 342 550 98%
Expenditure under shared
management (EUR)
ABB02 ABB03 ABB04 Total ABB02 ABB03 ABB04 Total ABB02 ABB03 ABB04 Total
Reasonable assurance
(= adjusted error rate below 2%)
Reasonable assurance
with low risk
(= adjusted error rate between 2% and
5%, mitigating factors)
Limited assurance
with medium risk
(= adjusted error rate between 2% and
5%, no mitigating factors)
Limited assurance
with high risk
(= adjusted error rate above 5%)
Grand Total 137 69 72 278 46.5% 25.5% 28.0% 100.0% 100.00% 100.00% 100.00% 100.00%
57.5% 31.8%
Impact on the Declaration of
Assurance
(based on the functioning of systems,
materiality and legality and
regularity criteria
Coverage
N° of
aid schemes/Paying Agencies
as % of
aid schemes/Paying Agencies
Payments to aid schemes/Paying Agencies in
question as % of expenditure 2015
83 47 48 178 46.6%
8.3% 8.3% 100.0% 20.8%
26.4% 27.0% 100.0% 34.8%
40 4 4 48 83.3%
14 2 9 25 56.0% 23.9%
100.0% 0.0% 29.2% 41.4%
8.0% 36.0% 100.0% 44.4% 4.0% 9.6%
29.5%
8.9%
51.9%
9.3% 3.0%
0 16 11 27 0.0% 59.3% 40.7%
agri_aar_2016 Page 60 of 114
ABB02: 14 elements comprising 7 aid schemes in 8 Member States
ABB03: 18 Paying Agencies in 12 Member States and one unquantified reservation
for VCS in 8 MS
ABB04: 20 Paying Agencies in 19 Member States
Tables 2.1.1.2.2-15, 2.1.1.2.2-16 and 2.1.1.2.2-17 set out the situation underlying the
above table 2.1.1.2.2-14 on the risk assessments for each of the three ABB activities. These tables show for ABB02, ABB03 and ABB04, the classification of expenditure,
following management assessment, into four categories of the level of assurance that they provide as to the legality and regularity of payments made during the reporting
year.
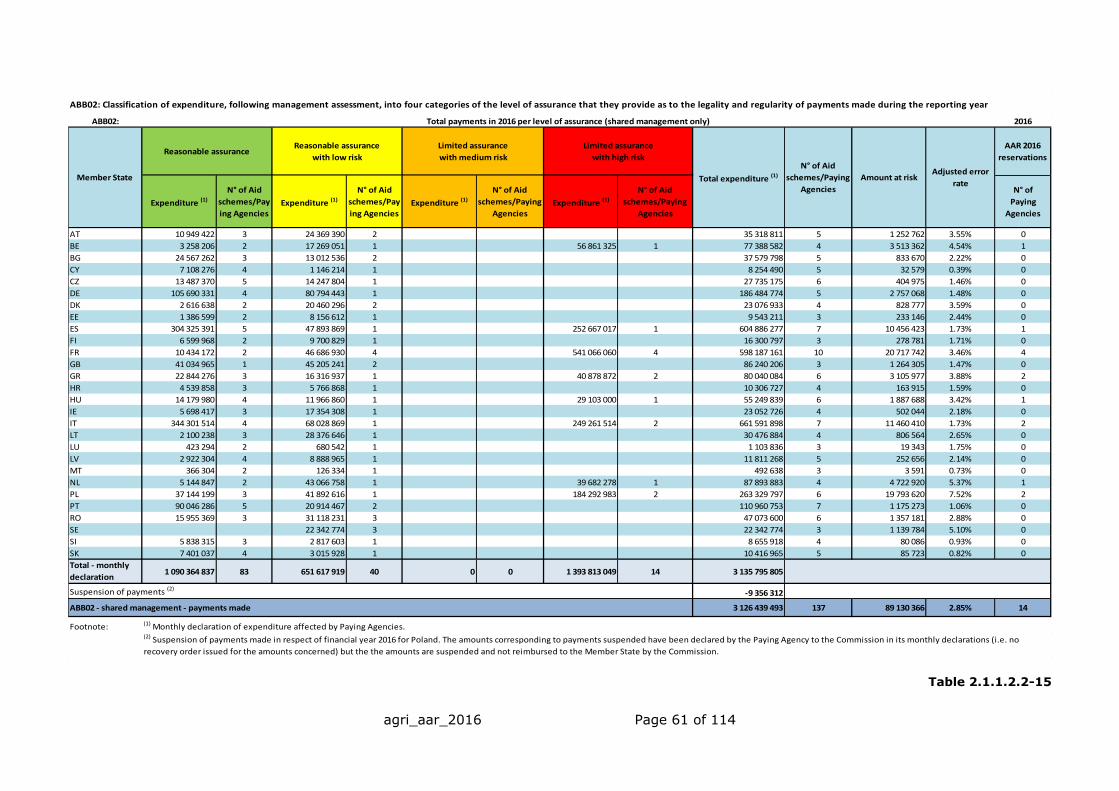
agri_aar_2016 Page 61 of 114
Table 2.1.1.2.2-15
ABB02: 2016
AAR 2016
reservations
Expenditure (1)
N° of Aid
schemes/Pay
ing AgenciesExpenditure (1)
N° of Aid
schemes/Pay
ing AgenciesExpenditure (1)
N° of Aid
schemes/Paying
AgenciesExpenditure (1)
N° of Aid
schemes/Paying
Agencies
N° of
Paying
Agencies
AT 10 949 422 3 24 369 390 2 0,00 0 35 318 811 5 1 252 762 3.55% 0
BE 3 258 206 2 17 269 051 1 56 861 325 1 77 388 582 4 3 513 362 4.54% 1
BG 24 567 262 3 13 012 536 2 0,00 0 37 579 798 5 833 670 2.22% 0
CY 7 108 276 4 1 146 214 1 0,00 0 8 254 490 5 32 579 0.39% 0
CZ 13 487 370 5 14 247 804 1 0,00 0 27 735 175 6 404 975 1.46% 0
DE 105 690 331 4 80 794 443 1 0,00 0 186 484 774 5 2 757 068 1.48% 0
DK 2 616 638 2 20 460 296 2 0,00 0 23 076 933 4 828 777 3.59% 0
EE 1 386 599 2 8 156 612 1 0,00 0 9 543 211 3 233 146 2.44% 0
ES 304 325 391 5 47 893 869 1 252 667 017 1 604 886 277 7 10 456 423 1.73% 1
FI 6 599 968 2 9 700 829 1 0,00 0 16 300 797 3 278 781 1.71% 0
FR 10 434 172 2 46 686 930 4 541 066 060 4 598 187 161 10 20 717 742 3.46% 4
GB 41 034 965 1 45 205 241 2 0,00 0 86 240 206 3 1 264 305 1.47% 0
GR 22 844 276 3 16 316 937 1 40 878 872 2 80 040 084 6 3 105 977 3.88% 2
HR 4 539 858 3 5 766 868 1 0,00 0 10 306 727 4 163 915 1.59% 0
HU 14 179 980 4 11 966 860 1 29 103 000 1 55 249 839 6 1 887 688 3.42% 1
IE 5 698 417 3 17 354 308 1 0,00 0 23 052 726 4 502 044 2.18% 0
IT 344 301 514 4 68 028 869 1 249 261 514 2 661 591 898 7 11 460 410 1.73% 2
LT 2 100 238 3 28 376 646 1 0,00 0 30 476 884 4 806 564 2.65% 0
LU 423 294 2 680 542 1 0,00 0 1 103 836 3 19 343 1.75% 0
LV 2 922 304 4 8 888 965 1 0,00 0 11 811 268 5 252 656 2.14% 0
MT 366 304 2 126 334 1 0,00 0 492 638 3 3 591 0.73% 0
NL 5 144 847 2 43 066 758 1 39 682 278 1 87 893 883 4 4 722 920 5.37% 1
PL 37 144 199 3 41 892 616 1 184 292 983 2 263 329 797 6 19 793 620 7.52% 2
PT 90 046 286 5 20 914 467 2 0,00 0 110 960 753 7 1 175 273 1.06% 0
RO 15 955 369 3 31 118 231 3 0,00 0 47 073 600 6 1 357 181 2.88% 0
SE 0,00 0 22 342 774 3 0,00 0 22 342 774 3 1 139 784 5.10% 0
SI 5 838 315 3 2 817 603 1 0,00 0 8 655 918 4 80 086 0.93% 0
SK 7 401 037 4 3 015 928 1 0,00 0 10 416 965 5 85 723 0.82% 0
Total - monthly
declaration1 090 364 837 83 651 617 919 40 0 0 1 393 813 049 14 3 135 795 805
-9 356 312
ABB02 - shared management - payments made 3 126 439 493 137 89 130 366 2.85% 14
Footnote: (2) Suspension of payments made in respect of financial year 2016 for Poland. The amounts corresponding to payments suspended have been declared by the Paying Agency to the Commission in its monthly declarations (i.e. no
recovery order issued for the amounts concerned) but the the amounts are suspended and not reimbursed to the Member State by the Commission.
Suspension of payments (2)
Amount at risk Adjusted error
rate
(1) Monthly declaration of expenditure affected by Paying Agencies.
ABB02: Classification of expenditure, following management assessment, into four categories of the level of assurance that they provide as to the legality and regularity of payments made during the reporting year
Total payments in 2016 per level of assurance (shared management only)
Member State
Reasonable assuranceReasonable assurance
with low risk
Limited assurance
with medium risk
Limited assurance
with high risk
Total expenditure (1)
N° of Aid
schemes/Paying
Agencies

agri_aar_2016 Page 62 of 114
Table 2.1.1.2.2-16
ABB03: 2016
AAR 2016
reservations
Expenditure (1) N° of Paying
AgenciesExpenditure (1) N° of Paying
AgenciesExpenditure (1) N° of Paying
AgenciesExpenditure (1) N° of Paying
Agencies
N° of
Paying
Agencies
AT 686 377 880 1 0,00 0 0,00 0 0,00 0 686 377 880 1 3 613 238 0.53% 0
BE 522 629 362 2 0,00 0 0,00 0 0,00 0 522 629 362 2 5 730 706 1.10% 0
BG 0,00 0 0,00 0 705 306 488 1 0,00 0 705 306 488 1 31 162 984 4.42% 1
CY 0,00 0 0,00 0 49 788 828 1 0,00 0 49 788 828 1 2 059 857 4.14% 1
CZ 834 008 540 1 0,00 0 0,00 0 0,00 0 834 008 540 1 2 970 187 0.36% 0
DE 4 875 100 790 13 0,00 0 0,00 0 0,00 0 4 875 100 790 13 48 899 504 1.00% 0
DK 0,00 0 0,00 0 852 260 873 1 0,00 0 852 260 873 1 25 338 972 2.97% 1
EE 0,00 0 112 835 661 1 0,00 0 0,00 0 112 835 661 1 2 281 596 2.02% 0
ES 3 326 184 800 14 1 610 845 993 2 0,00 0 108 561 360 1 5 045 592 153 17 80 699 838 1.60% 1
FI 522 194 621 1 0,00 0 0,00 0 0,00 0 522 194 621 1 3 488 434 0.67% 0
FR 6 954 355 659 1 0,00 0 138 841 478 1 0,00 0 7 093 197 137 2 30 270 345 0.44% 1
GB 2 513 006 182 3 0,00 0 523 259 993 1 0,00 0 3 036 266 175 4 43 171 384 1.42% 1
GR 0,00 0 2 072 079 443 1 0,00 0 0,00 0 2 072 079 443 1 54 400 662 2.63% 0
HR 179 801 123 1 0,00 0 0,00 0 0,00 0 179 801 123 1 1 349 105 0.75% 0
HU 0,00 0 0,00 0 1 267 308 687 1 0,00 0 1 267 308 687 1 41 099 691 3.24% 1
IE 1 208 736 460 1 0,00 0 0,00 0 0,00 0 1 208 736 460 1 2 868 250 0.24% 0
IT 35 436 143 2 0,00 0 3 798 383 717 7 0,00 0 3 833 819 861 9 91 682 707 2.39% 7
LT 409 894 533 1 0,00 0 0,00 0 0,00 0 409 894 533 1 3 301 588 0.81% 0
LU 33 245 345 1 0,00 0 0,00 0 0,00 0 33 245 345 1 159 453 0.48% 0
LV 177 864 441 1 0,00 0 0,00 0 0,00 0 177 864 441 1 3 204 895 1.80% 0
MT 5 037 777 1 0,00 0 0,00 0 0,00 0 5 037 777 1 94 232 1.87% 0
NL 725 516 364 1 0,00 0 0,00 0 0,00 0 725 516 364 1 9 980 051 1.38% 0
PL 0,00 0 0,00 0 3 339 889 763 1 0,00 0 3 339 889 763 1 143 680 889 4.30% 1
PT 0,00 0 0,00 0 646 509 144 1 0,00 0 646 509 144 1 17 229 300 2.66% 1
RO 0,00 0 0,00 0 0,00 0 1 521 315 445 1 1 521 315 445 1 140 575 256 9.24% 1
SE 0,00 0 0,00 0 666 608 665 1 0,00 0 666 608 665 1 20 527 150 3.08% 1
SI 137 618 722 1 0,00 0 0,00 0 0,00 0 137 618 722 1 1 066 659 0.78% 0
SK 425 429 925 1 0,00 0 0,00 0 0,00 0 425 429 925 1 3 488 121 0.82% 0
Subtotal 23 572 438 666 47 3 795 761 097 4 11 988 157 635 16 1 629 876 806 2 40 986 234 205
-2 102 757
-175 403 355
TOTAL 40 808 728 092 69 814 395 052 1.996% 18
Footnote:
(2) Suspension of payments made in respect of financial year 2016 for France. The amounts corresponding to payments suspended have been declared by the Paying Agency to the Commission in its monthly declarations (i.e. no
recovery order issued for the amounts concerned) but the the amounts are suspended and not reimbursed to the Member State by the Commission.
(1) Monthly declaration of expenditure effected by Paying Agencies.
Amounts reimbursed to DG AGRI by Coordinating Bodies
ABB03: Classification of expenditure, following management assessment, into four categories of the level of assurance that they provide as to the legality and regularity of payments made during the reporting year
Reasonable assuranceReasonable assurance
with low risk
Limited assurance
with medium risk
Limited assurance
with high risk
Total payments in 2016 per level of assurance
Member State Total expenditure (1)
Total N° of
Paying
Agencies
Adjusted error
rateAmount at risk
Suspension of payment (2)

agri_aar_2016 Page 63 of 114
Table 2.1.1.2.2-17
ABB04: 2016
AAR 2016
reservations
Interim paymentsN° of Paying
AgenciesInterim payments
N° of Paying
AgenciesInterim payments
N° of Paying
AgenciesInterim payments
N° of Paying
Agencies
N° of
Paying Agencies
AT 394 576 581 1 0.00 0.00 0.00 0.00 0.00 0.00 394 576 581 1 5 679 430 1.44% 0
BE 14 837 399 1 0.00 0.00 0.00 0.00 24 665 652 1 39 503 051 2 1 453 365 3.95% 1
BG 0.00 0.00 0.00 0.00 0.00 0.00 234 181 393 1 234 181 393 1 24 785 072 10.58% 1
CY 7 177 699 1 0.00 0.00 0.00 0.00 0.00 0.00 7 177 699 1 26 816 0.37% 0
CZ 0.00 0.00 0.00 0.00 0.00 0.00 182 467 119 1 182 467 119 1 20 156 600 11.05% 1
DE 532 182 785 13 50 792 902 1 76 820 996 1 0.00 0.00 659 796 683 15 9 704 747 1.32% 1
DK 0.00 0.00 0.00 0.00 82 172 079 1 0.00 0.00 82 172 079 1 2 869 136 3.49% 1
EE 0.00 0.00 87 901 431 1 0.00 0.00 0.00 0.00 87 901 431 1 1 869 904 2.13% 0
ES 406 634 775 16 66 691 655 1 208 951 505 1 0.00 0.00 682 277 935 18 13 447 220 1.88% 1
FI 328 110 757 1 0.00 0.00 0.00 0.00 0.00 0.00 328 110 757 1 5 909 231 1.80% 0
FR 7 230 536 1 0.00 0.00 0.00 0.00 581 501 578 1 588 732 114 2 63 184 545 10.77% 1
GB 573 922 413 2 49 794 728 1 0.00 0.00 31 931 436 1 655 648 577 4 6 905 115 0.97% 1
GR 0.00 0.00 0.00 0.00 684 280 003 1 0.00 0.00 684 280 003 1 26 515 634 3.87% 1
HR 131 044 159 1 0.00 0.00 0.00 0.00 0.00 0.00 131 044 159 1 2 174 281 1.66% 0
HU 0.00 0.00 0.00 0.00 208 468 125 1 0.00 0.00 208 468 125 1 6 928 987 3.32% 1
IE 0.00 0.00 0.00 0.00 253 822 792 1 0.00 0.00 253 822 792 1 9 748 225 3.84% 1
IT 154 902 472 7 0.00 0.00 603 940 902 2 0.00 0.00 758 843 373 9 25 994 790 3.49% 2
LT 0.00 0.00 0.00 0.00 0.00 0.00 173 957 330 1 173 957 330 1 10 154 746 5.84% 1
LU 6 355 840 1 0.00 0.00 0.00 0.00 0.00 0.00 6 355 840 1 42 564 0.67% 0
LV 109 136 225 1 0.00 0.00 0.00 0.00 0.00 0.00 109 136 225 1 958 603 0.88% 0
MT 2 460 019 1 0.00 0.00 0.00 0.00 0.00 0.00 2 460 019 1 38 111 1.55% 0
NL 0.00 0.00 0.00 0.00 34 449 926 1 0.00 0.00 34 449 926 1 1 432 489 4.16% 1
PL 0.00 0.00 0.00 0.00 362 852 034 1 0.00 0.00 362 852 034 1 7 411 740 2.04% 1
PT 0.00 0.00 0.00 0.00 0.00 0.00 540 867 570 1 540 867 570 1 33 745 074 6.24% 1
RO 0.00 0.00 0.00 0.00 1 059 493 147 1 0.00 0.00 1 059 493 147 1 39 601 555 3.74% 1
SE 0.00 0.00 0.00 0.00 0.00 0.00 191 405 372 1 191 405 372 1 26 679 043 13.94% 1
SI 77 260 537 1 0.00 0.00 0.00 0.00 0.00 0.00 77 260 537 1 974 949 1.26% 0
SK 0.00 0.00 0.00 0.00 0.00 0.00 105 682 050 1 105 682 050 1 7 101 508 6.72% 1
Total 2 745 832 196 48 255 180 717 4 3 575 251 509 11 2 066 659 500 9 8 642 923 921 72 355 493 479 4.11% 20
05040114-1 048 601 0 0.00%
0504020140 410 348 0 0.00%
05040501 2 662 130 040 81 181 581 3.05%
050460011 000 590 984 0 0.00%
05040206 7 437 218 74 372 1.00%
05046002 12 554 730 125 547 1.00%
3 722 074 718 81 381 500
12 364 998 639 436 874 979 3.53%
Footnote:
Completion of Leader (2000 to 2006)Direct
management
Shared
management
Pre-financing for promoting sustainable rural development, a more territorially and environmentally balanced,
climate-friendly and innovative Union agricultural sector 2014-2020
Operational technical assistance 2014-2020
Sub-total
Total ABB 04
(1) Cleared prefinancing is not included
Other payments
Completion of rural development financed by the EAGGF Guarantee Section - Programming period 2000 to 2006
Completion of the European Agricultural Guidance and Guarantee Fund, Guidance Section -
Objective 1 regions (2000 to 2006)
Closure Balance of the Rural development programmes 2007-2013
ABB04: Classification of expenditure (1)
, following management assessment, into four categories of the level of assurance that they provide as to the legality and regularity of payments made during the reporting year
Reasonable assuranceReasonable assurance
with low risk
Limited assurance
with medium risk
Limited assurance
with high risk
Member State
Total interim payments in 2016 per level of assurance
Amount at risk Adjusted
error rate
Total N° of
Paying
Agencies
Total interim
payments

agri_aar_2016 Page 64 of 114
In the context of the protection of the EU budget, at the Commission's corporate level,
the DGs' estimated overall amounts at risk and their estimated future corrections are
consolidated.
For the CAP, the estimated overall amount at risk at payment60 for the 2016 payments made is EUR 1 419.57 million. This is the AOD's best, conservative estimation of the
amount of relevant expenditure61 during the year (EUR 57 552.75 million) not in conformity with the applicable contractual and regulatory provisions at the time the
payment is made.
The 2016 expenditure will subsequently be subject to ex-post controls and audits, following which financial corrections and recoveries will be made. The corrective
capacity62 amounts to EUR 1 173.38 million. This is the best estimate of irregular
amounts paid in 2016 which will be reimbursed to the EU budget in subsequent years.
The difference between the overall amount at risk at payment and the corrective capacity leads to the estimated final amount at risk when all corrections will have been applied of
EUR 246.19 million. The estimated final amount at risk used by DG AGRI corresponds to the estimated overall amount at risk at closure used by other DGs for expenditure where
the Commission cannot apply corrections after the closure of the multiannual programmes.
60 In order to calculate the weighted average error rate (AER) for the total relevant expenditure in the reporting year, the adjusted error rates have been used. 61 For the purpose of calculating the final amount at risk, "relevant expenditure" during the year = payments made (including balance payments at closure of programmes 2007-2013), minus new pre-financing paid out, plus previous pre-financing cleared. "Expenditure" in the text of the report and its annexes corresponds to payments reimbursed by the Commission. 62 The corrective capacity is calculated as the 5 years historic average of recoveries and financial corrections, which is the best available indication of the corrective capacity of the ex-post control systems implemented DG AGRI and the Member States. See section 2.1.1.3. for further detailed explanation.
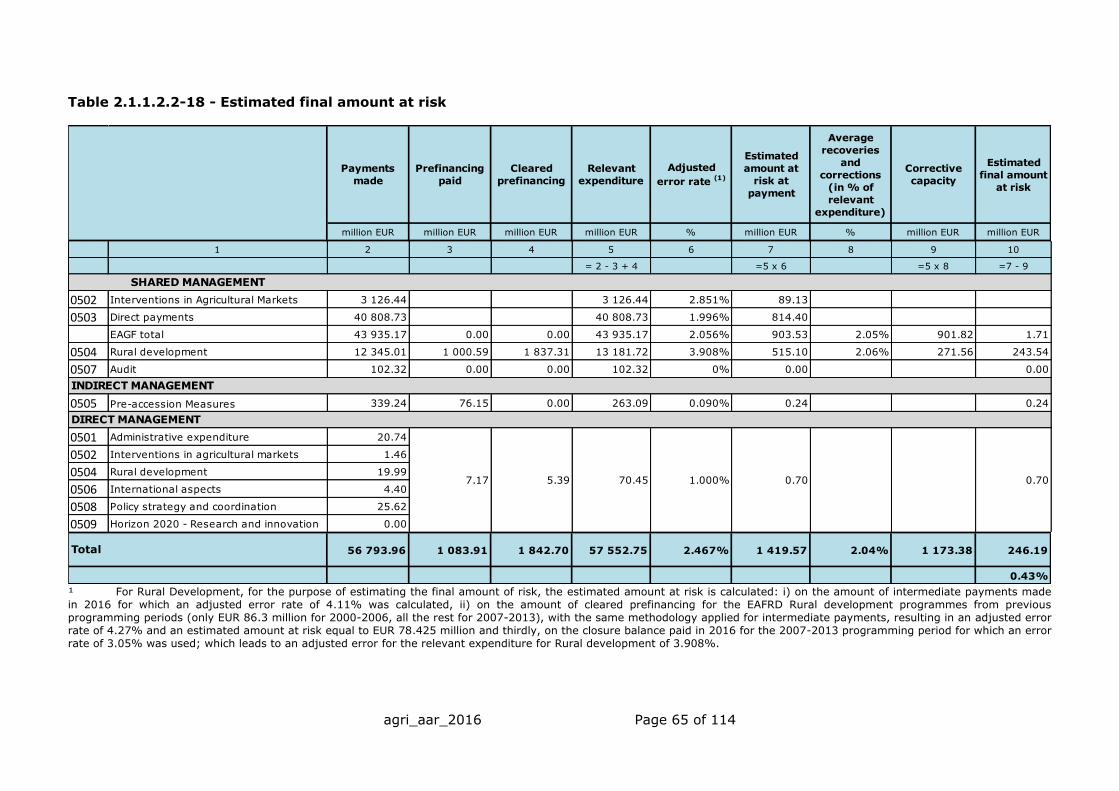
agri_aar_2016 Page 65 of 114
Table 2.1.1.2.2-18 - Estimated final amount at risk
¹ For Rural Development, for the purpose of estimating the final amount of risk, the estimated amount at risk is calculated: i) on the amount of intermediate payments made
in 2016 for which an adjusted error rate of 4.11% was calculated, ii) on the amount of cleared prefinancing for the EAFRD Rural development programmes from previous
programming periods (only EUR 86.3 million for 2000-2006, all the rest for 2007-2013), with the same methodology applied for intermediate payments, resulting in an adjusted error
rate of 4.27% and an estimated amount at risk equal to EUR 78.425 million and thirdly, on the closure balance paid in 2016 for the 2007-2013 programming period for which an error
rate of 3.05% was used; which leads to an adjusted error for the relevant expenditure for Rural development of 3.908%.
million EUR million EUR million EUR million EUR % million EUR % million EUR million EUR
1 2 3 4 5 6 7 8 9 10
= 2 - 3 + 4 =5 x 6 =5 x 8 =7 - 9
0502 Interventions in Agricultural Markets 3 126.44 3 126.44 2.851% 89.13
0503 Direct payments 40 808.73 40 808.73 1.996% 814.40
EAGF total 43 935.17 0.00 0.00 43 935.17 2.056% 903.53 2.05% 901.82 1.71
0504 Rural development 12 345.01 1 000.59 1 837.31 13 181.72 3.908% 515.10 2.06% 271.56 243.54
0507 Audit 102.32 0.00 0.00 102.32 0% 0.00 0.00
0505 Pre-accession Measures 339.24 76.15 0.00 263.09 0.090% 0.24 0.24
0501 Administrative expenditure 20.74
0502 Interventions in agricultural markets 1.46
0504 Rural development 19.99
0506 International aspects 4.40
0508 Policy strategy and coordination 25.62
0509 Horizon 2020 - Research and innovation 0.00
56 793.96 1 083.91 1 842.70 57 552.75 2.467% 1 419.57 2.04% 1 173.38 246.19
0.43%
Average
recoveries
and
corrections
(in % of
relevant
expenditure)
Corrective
capacity
Payments
made
Prefinancing
paid
Cleared
prefinancing
1.000% 0.707.17
Relevant
expenditure
Adjusted
error rate (1)
Estimated
final amount
at risk
SHARED MANAGEMENT
INDIRECT MANAGEMENT
DIRECT MANAGEMENT
0.70
Estimated
amount at
risk at
payment
Total
5.39 70.45

agri_aar_2016 Page 66 of 114
2.1.1.2.3 Assessment of the amount at risk for indirect management63
SAPARD and IPARD expenditure are managed by DG AGRI under the decentralised64 or indirect65 management mode.
Description of the management and control system
For both SAPARD and IPARD funds, the assurance is obtained based on a management
and control system for programmes established in line with both the principles of the agricultural funds and the relevant external aid provisions of the Financial Regulation.
In particular, for both SAPARD and IPARD, the management and control system has a
structure similar to the one applicable under EAGF and EAFRD, with however some more stringent conditions. The main ones are the following:
The accreditation of the structures at national level only is not sufficient to enable
the management and control systems in the beneficiary countries to start
operating. In accordance with the rules established in the Financial Regulation for
indirect management, following the setup of the management and control system
by the national authorities, the Commission needs to formally entrust the
implementing tasks to the beneficiary countries, after having verified their level
of preparedness;
Once budget implementations tasks have been entrusted, substantial changes to
the management and control procedures need the prior approval of DG AGRI
before they can be put into operation;
More extensive control procedures and stricter conditions for payments to the
final beneficiaries apply, compared to the same measures in EAFRD.
Audit work by DG AGRI
The Framework and Sectoral Agreements for IPARD provide for financial and conformity audits. Following the above agreements, principles and procedures similar to EAGF and
EAFRD apply with however some important differences as described above.
For both SAPARD and IPARD funds, the audit work by DG AGRI focuses on the
verification of compliance with the conditions laid down in the legal framework, as set out
in the applicable regulations and agreements signed between each beneficiary country and the Commission.
The last payments to final beneficiaries under the SAPARD programmes were made in 2009. Consequently, the audit work aims at verifying that the information put in the
debtors' ledger is complete and correctly recorded until the end of 2016, which is the ultimate date by which debts resulting from ex-post checks should be written-off.
As regards IPARD, the audit work is about assessing the procedures and structures of the entities in charge of the implementation of the IPARD component prior to
entrustment/conferral of management (entrustment audits)66, ex-post audits (conformity
audits) and the audit work conducted by independent Audit Authorities67 at national level
63 Article 214 (a) of the Financial Regulation (Regulation (EU) No 966/2012) stipulates that the indirect management mode is applicable for commitments made as of 1 January 2014. Thus, in financial year 2014 all expenditure declared under IPARD 2007 – 2013 was managed under decentralised management according to the previous financial regulation (Council Regulation (EC,) No 1605/2002). The budget
allocation made in 2014 for IPARD 2014 – 2020 will be managed under indirect management according to the new Financial Regulation. 64 Council Regulation (EC, Euratom) No 1605/2002 of 25 June 2002 on the Financial Regulation applicable to
the general budget of the European Communities 65 Regulation (EU, Euratom) No 966/2012 of the European Parliament and of the Council of 25 October 2012 on
the financial rules applicable to the general budget of the Union and repealing Council Regulation (EC, Euratom)
No 1605/2002 66 The "conferral of management powers" in IPARD 2007-2013 corresponds to the "Entrustment of budget
implementation tasks" in IPARD 2014-2020. 67 The Audit Authorities in IPARD correspond to the Certification Bodies in EAGF/EAFRD.

agri_aar_2016 Page 67 of 114
(whose results are used in the financial clearance) as well as audit work to verify the
proper functioning of the said Audit Authorities (Verifications audits).
Explanatory box 2.1.1.2.3-1
IPARD, based on the experience gained under SAPARD, continues to operate under
indirect management without ex-ante controls by the Commission. This approach
was deliberately chosen by the Commission in view of the potentially large number of small projects to be implemented under the programmes which would require a
considerable number of additional staff in the EU delegations. This form of management is also considered to be the best preparation for acceding countries for the
implementation of rural development funds after accession.
Two out of the three countries currently benefiting from IPARD (the former Yugoslav
Republic of Macedonia (MK) and Turkey (TR)) have not yet implemented area or animal-based support measures and therefore the IACS (Integrated Administration and Control
System) is not yet operational. Turkey is however expected to start the Agri-
environmental measure in 2017 on a pilot scale. Since 1 November 2014, Croatia implements the funds received from the Commission under the IACS measures of the
Rural Development Programme regime (EAFRD).68
Similar to the SAPARD experience, it took some time for the IPARD beneficiary countries
to put in place an effective management and control system. As IPARD funds can only flow after management powers have actually been conferred, the absorption rate has
initially been low. However, as management for some measures has now been conferred for all three beneficiary countries, the overall uptake of IPARD funds is moving in an
upward direction and is expected to improve substantially as these countries continue to
gain experience in the implementation of IPARD.
SAPARD
SAPARD (Special Accession Programme for Agriculture and Rural Development) helped countries of Central and Eastern Europe deal with the problems of the structural
adjustment in their agricultural sectors and rural areas, as well as in the implementation of the acquis communautaire concerning the Common Agricultural Policy (CAP) and
related legislation.
Compliance with accreditation criteria and compliance of management and control
systems
Even though the last payments under SAPARD ended in 2009, during the five years after the final payment for the project, the beneficiary countries were obliged to
continue to verify that the projects did not undergo a substantial modification, as stated in Article 4(4) of Section B of the Multiannual Financing Agreement ('MAFA').
Audit work as regards financial clearance
During 2016, the SAPARD accounts of Bulgaria and Romania for financial year 2009 were cleared, following the finalisation of conformity clearance procedures.
Conclusion for SAPARD
The last payments under the SAPARD Programme for Romania, Bulgaria and Croatia
68 Please note that the amount at risk is calculated on the basis of amounts paid from the Commission to the
beneficiary countries in 2016.

agri_aar_2016 Page 68 of 114
were made in December 2009. The expenditure effected in 2009 had been subject to a number of audits carried out between 2010 and 2015 in order to ensure that during the
five years after the final payment, the projects did not undergo a substantial modification
and that a debtors' ledger continued to be used until the end of 2016. A number of recommendations were issued as a result of these audits, not only for the SAPARD
Programme but also for the EAFRD Axis I, II and III measures. All recommendations were taken into account and implemented. No financial corrections were applied following
the above mentioned audits.
By the end of 2016, the SAPARD accounts, for all countries and all years, were cleared.
This will allow for the calculation of the final balance and the closure of the last three programmes (Bulgaria, Croatia and Romania) in 2017.
IPARD I (2007-2013)
IPARD (Instrument for Pre-accession Assistance in Rural Development) is a pre-accession
Programme of the EU for the period 2007-2013, the implementation of which is still on-
going. It is an integral part of the IPA (Instrument for Pre-accession Assistance), of which the main objectives are to assist candidate and potential candidate countries in their
harmonisation and implementation of the EU acquis, as well as preparation for the management of the future EU funds. The objectives of IPARD are to provide assistance
for the implementation of the acquis concerning the Common Agricultural Policy and to contribute to the sustainable adaptation of the agricultural sector and rural areas in the
candidate country.
In 2016, the Commission has reimbursed EUR 19.0 million to Croatia, EUR 1.2 million to
the former Yugoslav Republic of Macedonia and EUR 139.9 million to Turkey. As table
2.1.1.2.3-2 shows, the countries paid IPARD subsidies under selected measures.
Croatia and Turkey could make payments under IPARD I until 31 December 2016.
Following a request from the former Yugoslav Republic of Macedonia, the Sectoral Agreement was amended in order to allow the use of the IPARD I funds until 31
December 2017. After the time limit for payments, the national authorities need to check ex-post for another five years. Subsequently they need to keep debts in the debtors'
ledger for two years.
Table 2.1.1.2.3-2
In 2016, one conformity enquiry was carried out in Croatia, which resulted in a proposed financial correction of EUR 233 628.55.
Measures HR MK TR Total
101 Investments in agricultural holdings 13 740 356 2 168 169 125 335 978
103 Investment in processing and marketing of agriculture and
fishery products6 646 465 143 932 51 362 573
202 Preparation and implementation of local rural
development strategies1 981 387
301 Improvement and development of rural infrastructure 11 445 282
302 Diversification and development of rural economic
activities3 378 289 79 818 46 498 685
501 Technical assistance 181 722 125 751
Pre-financing 76 154 354
Total 37 373 502 2 391 919 299 477 341 339 242 762
IPARD I expenditure paid in 2016 in EUR

agri_aar_2016 Page 69 of 114
Audit work as regards financial clearance
Under IPARD I, the beneficiary countries have to send the Accounts, the Statement of
Assurance (Management Declaration) and the Audit Authority opinion and report
on the management and control system as well as on the expenditure declared to the Commission.
DG AGRI assesses the above documents and, by 15 July N+1, has to inform the countries on the result of the clearance of accounts exercise. In case the conditions to
clear the accounts are met, the Commission adopts a decision by 30 September N+1.
In 2016, DG AGRI cleared the 2015 accounts for Croatia and the former Yugoslav
Republic of Macedonia. The 2015 accounts of Turkey were disjoined, due to the presence of a material error. For the same reason, the 2013 and 2014 accounts will
remain disjoined, until the ongoing conformity clearance procedures have been completed.
Conclusion for IPARD I (2007-2013)
The expenditure declared by IPARD beneficiary countries (Croatia, the former Yugoslav Republic of Macedonia and Turkey) continues to be monitored by means of audit missions
and the clearance of accounts procedure, including audit work conducted by independent Audit Authorities at national level.
As regards expenditure implemented under indirect management (ABB05), DG AGRI estimates that the overall adjusted error rate for IPARD I expenditure is very low.
Table 2.1.1.2.3-3
The financial impact for 2016 of the deficiencies found in Croatia (EUR 233 628.55) is not
material for IPARD as a whole.
Therefore, it is not necessary to issue a reservation for IPARD I expenditure (ABB05) for
financial year 2016.
Table 2.1.1.2.3-4
Measures Expenditure Adjusted error rate Amount at risk Reservation follow-up
101 Investments in agricultural holdings 13 740 356
103 Investment in processing and marketing of agriculture and
fishery products6 646 465
202 Preparation and implementation of local rural
development strategies1 981 387
301 Improvement and development of rural infrastructure 11 445 282
302 Diversification and development of rural economic
activities3 378 289
501 Technical assistance 181 722
Total 37 373 502 0,63% 233 628
IPARD I expenditure paid to and its related level of error in Croatia in 2016 in EUR
5% on measure 302 233 628
The error is low and does
not require a reservation.
The issues will be followed-
up in the context of the
conformity clearance
procedure
Country Expenditure (EUR) Adjusted error rate Amount at risk (EUR)
HR 37 373 502 0,63% 233 628
MK 2 391 919
TR 223 322 987
Total interim payments ABB 05 263 088 408 0,09% 233 628
Prefinancing 76 154 354 0,00% -
GRAND TOTAL ABB 05 339 242 762 0,07% 233 628
Overall adjusted error rate as regards IPARD I expenditure (ABB 05) in 2016

agri_aar_2016 Page 70 of 114
IPARD II (2014-2020)
No expenditure has yet been incurred under IPARD II. The preparatory work has however
progressed allowing the entrustment of IPARD II implementation to be granted to the
former Yugoslav Republic of Macedonia and to Turkey in the first months of 2017.
Audit work has also been conducted in three new countries, Albania, Montenegro and
Serbia. This activity has included both desk work and missions. Issues have been identified and recommendations have been made, whose implementation is currently
followed-up by DG AGRI. Once the three countries' systems meet the IPARD II requirements, the countries will be granted entrustment of budget implementations
tasks.
2.1.1.2.4 Assessment of the amount at risk for direct management
For the EUR 72.2 million managed directly by DG AGRI, the maximum amount at risk is estimated at 0.722 million EUR with an adjusted error rate of 1%. Table 2.1.1.2.4-1
shows the expenditure spent for each budget item under direct management, as well as the estimated amount at risk.
Table 2.1.1.2.4-1
2.1.1.2.5 Budget implementation tasks entrusted to other DGs and
Agencies
Executive agencies
Council Regulation (EC) 58/2003 requires the Commission to supervise the
implementation of the Community programmes entrusted to Executive Agencies. The guidelines for the establishment and operation of executive agencies financed by the
general budget of the Union69 conclude that the Commission's supervision through appointment of the director and members of the steering committee, the secondment of
staff to positions of responsibility, and the legal review of the EA's acts as well as audits performed by the IAS and the ECA are a solid foundation on which parent DG's build
additional supervision arrangements.
Research activities (REA)
2016 is now the second full year of delegated implementation by REA of DG AGRI's
Horizon 2020 activity under Societal Challenge 2. The main elements of DG AGRI's supervision strategy for the Research Executive Agency are the preparation and
participation in the Steering Committee meetings, the regular coordination meetings both at Director and at working level, the annual planning and reporting cycle from the AWP to
the AAR (including the Interim reporting), and the budget cycle and management
69 C(2014)9109 of 02/12/2014.
Title 05 Agriculture and rural developmentDirect management
(EUR)Adjusted error rate Amount at risk (EUR)
0501 Administrative expenditure 20 738 156 1,00% 207 382
0502 Interventions in agricultural markets 1 463 065 1,00% 14 631
0504 Rural development 19 991 948 1,00% 199 919
0506 International aspects 4 403 542 1,00% 44 035
0508 Policy strategy and coordination 25 624 568 1,00% 256 246
0509 Horizon 2020 - Research and innovation - 1,00% -
72 221 278 1,00% 722 213 Total

agri_aar_2016 Page 71 of 114
reporting.
DG AGRI as parent DG participates in REA's Steering Committee which thus constitutes
the main supervision mechanism allowing for the appropriate monitoring of the Agency's
activities. In 2016 four Steering Committees took place and for which the meeting documents have been analysed. The examination of the flash reports yielded no
particular comments nor called for further specific actions. Furthermore, for Societal Challenge 2 two coordination meetings at Director level were held with a further number
of meetings held at operational level between REA and its parent DGs AGRI and RTD to ensure the monitoring and follow-up of delegated activities. Moreover, four SC2
budgetary follow-up meetings tracking the yearly budgetary cycle were organised in addition to frequent contacts between the relevant budgetary Units. DG AGRI is also
member of the Research Budget Network and participated in the four meetings chaired by DG RTD in 2016. DG AGRI participated in 13 CLAR meetings (Client in Audit Research)
chaired by the Common Audit Service (CAS) and in 3 specific workshops on the ex-ante
control strategy. Finally, DG AGRI participated in two coordination meetings of the Executive Agencies and Parent DGs chaired by DG RTD as lead parent DG.
In the framework of the annual planning and reporting cycle and the Steering Committees the programming documents such as the AWP and the AAR were scrutinised
and commented upon in view of DG AGRI's participation. Both the 2015 AAR as well as the 2016 Interim report covering the first six months have been duly analysed and
comments shared with DG RTD as lead parent DG. There are no major difficulties to be reported and some elements worth following-up have been fed into the supervision cycle
through the meetings in particular with the budgetary Unit of REA. Comments to REA's
draft AWP 2017 have also been prepared and sent to DG RTD in advance of the last Steering Committee of the year.
Through close collaboration with REA, full execution of the relevant part of the 2016 operational budget under its responsibility was ensured, both in commitments and
payments [CA: € 185 987 699.61 (100%) - PA: € 61 515 937.99 (100 %)].
Agricultural Promotion (CHAFEA)
By Commission Decision C(2014)9594 the Consumers, Health, Agriculture and Food
Executive Agency (CHAFEA) was entrusted i.a. with the management of specific tasks in
relation to the management of the information provision and promotion measures concerning agricultural products implemented in the internal market and in third
countries.
The agreed transfer dates for the delegation of the concerned activities to CHAFEA for the
management of tasks related to the agricultural promotion programme are 1 February 2016 for tasks relating to promotion programmes and technical support services and 15
March 2016 for tasks relating to organisation of promotion events and campaigns.
During the year under review DG AGRI continued its active contribution to the
preparation of the Memorandum of Understanding of CHAFEA with the parent DGs which
was eventually signed on 07/12/2016.
DG AGRI participates in CHAFEA's Steering Committee as parent DG. This again
constitutes the main supervision mechanism allowing for the appropriate monitoring of the Agency's activities. In 2016 four Steering Committees chaired by DG SANTE were
attended by DG AGRI's Member. DG AGRI's activities are so far in a start-up phase with the first calls handled by CHAFEA this year. Corresponding KPIs will be examined in the
course of 2017.

agri_aar_2016 Page 72 of 114
Conclusion
Based on the draft AARs presented by both Executive Agencies REA and CHAFEA at their
respective Steering Committee meetings, it would appear that there are no reservations
nor critical risks which would have been identified, except for the FP7 actions under REA's remit but which do not concern the H2020 programme hosting the activity 'Societal
Challenge 2' delegated by DG AGRI.
Cross-delegations
When the Authorising Officer by Delegation (cross) subdelegates the management of a
budget line or part of a line to one or several Directors-General or Heads of Service, the Authorising Officers by cross-subdelegation shall report back to the Authorising Officer by
Delegation on the implementation of the amounts subdelegated.
In their reports, they have to provide assurance that the programmes, operations and
actions were implemented in respect of the powers (cross) sub-delegated to them. In
this respect, they shall inform in writing of the management problems encountered and the solutions proposed to remedy them.
In order to implement its 2016 budget, DG AGRI sub-delegated the management of several projects to others Directorates-General. The Directorates-General concerned are:
ESTAT, NEAR, JRC, EMPL, REGIO, SANTE, ENV. As regards the subdelegation to DG NEAR, the subdelegated powers cover only recoveries.
For each report provided by the respective DGs, the Heads of Unit of DG AGRI in charge of the cross subdelegated activities and budget lines have been consulted. None of the
DG’s concerned have reported important issues or anomalies.
Regarding the report sent by ESTAT, under-implementation of payments appropriations on budget line 05.0802 is reported but no reservation has been made.
The cross subdelegations are summarised in this table:

agri_aar_2016 Page 73 of 114
2.1.1.2.6 Financial instruments
Under the EAFRD and at the end of 2016, the planned budget for financial
instruments (FI) in rural development programmes 2014-2020 is EUR 423.1 million, with EUR 22.8 million already declared to the Commission. In 2016 three Funding Agreements
have been signed by the EAFRD Managing Authorities, with one of these financial instruments starting operations already in 2016. Additional programme modifications
introducing financial instruments are ongoing. Managing authorities continued their
efforts on undertaking ex-ante assessments and for 28 programmes these were finalised by the end of 2016, while for other 16 programmes they were still ongoing. DG AGRI
carried out 4 EAFRD-specific conferences on FIs (Madrid, Rome, Warszawa, Brussels) and launched a specific EAFRD – EFSI Initiative together with the EIF/EIB. DG AGRI continued
the development of activities under the technical assistance programme fi-compass in co-operation with the EIB (such as studies, brochures, videos, trainings, etc.). In this
context, the work programme for 2014-2016 was successfully closed down and a new one, for the period 2016-2018 was adopted. DG AGRI and fi-compass launched specific
targeted coaching on financial instruments for EAFRD managing authorities to raise their
capacity and 6 cases were already finalised by end 2016, while other 4 were ongoing. A methodological handbook on financial instruments for agriculture under the EAFRD was
developed, which was widely disseminated.
With regards the relationships with the EIB Group in total 18 coordination meetings took
place, with two schemes by EIF, for guarantee funds and risk sharing loan funds, now available for agriculture.
Work on EFSI has also advanced, in particular with the preparation of the new legal basis under EFSI 2.0 where agriculture is now given a greater visibility.
Crossed Subdeleg.
To:JRC SANTE REGIO ENV
Budget Line
(Differentiated
Credits):
05.088000 05.080200 05.080300 05.040502 05.046002 05.046002 05.046002
Transferred
Comm. Credit 3.527,88 528.478,00 4.800.000,00 1.300.000,00
Transferred
Pay. Credit 805.000,00 3.924.687,77 1.085.970,00 326.665,88 2.198.478,94 0,00
Consumed
Comm. Credit 3.527,88 528.478,00 4.800.000,00 1.300.000,00
Consumed
Pay. Credit537.837,74 3.423.744,10 1.082.938,57 326.665,88 2.198.478,94 0,00
Budget Line
(Non-Differentiated
Credit):
05.080600 05.010404.11
Transferred
Non-Diff. Credit0,00 200.000,00
Consumed
Non-Diff. Credit0,00 0,00
Cross delegationsIn 2016, DG AGRI has cross delegated activities to six DGs (JRC, ESTAT, EMPL, SANTE, REGIO and ENV). In addition, a sub
delegation was given to DG NEAR only to allow recoveries in a specific file (no credits involved so not included in the table).
ESTAT EMPL
B2016 credits transferred by DG AGRI (receiver Abac appropriations BGUE-B2016-05.XXXXXX-C1-AGRI/XXX):
Remark: If no credit transferred, cross subdelegations remain open for RAL (C8) consumptions.
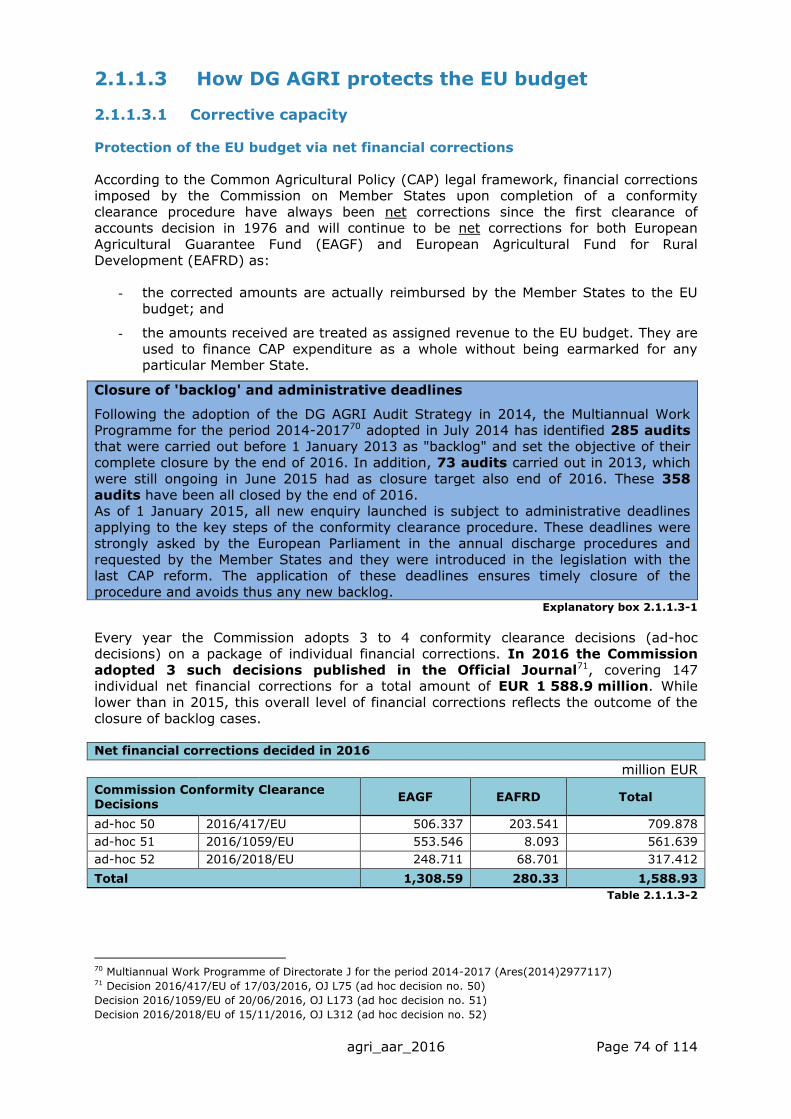
agri_aar_2016 Page 74 of 114
2.1.1.3 How DG AGRI protects the EU budget
2.1.1.3.1 Corrective capacity
Protection of the EU budget via net financial corrections
According to the Common Agricultural Policy (CAP) legal framework, financial corrections imposed by the Commission on Member States upon completion of a conformity
clearance procedure have always been net corrections since the first clearance of accounts decision in 1976 and will continue to be net corrections for both European
Agricultural Guarantee Fund (EAGF) and European Agricultural Fund for Rural
Development (EAFRD) as:
- the corrected amounts are actually reimbursed by the Member States to the EU
budget; and
- the amounts received are treated as assigned revenue to the EU budget. They are
used to finance CAP expenditure as a whole without being earmarked for any particular Member State.
Closure of 'backlog' and administrative deadlines
Following the adoption of the DG AGRI Audit Strategy in 2014, the Multiannual Work Programme for the period 2014-201770 adopted in July 2014 has identified 285 audits
that were carried out before 1 January 2013 as "backlog" and set the objective of their complete closure by the end of 2016. In addition, 73 audits carried out in 2013, which
were still ongoing in June 2015 had as closure target also end of 2016. These 358
audits have been all closed by the end of 2016. As of 1 January 2015, all new enquiry launched is subject to administrative deadlines
applying to the key steps of the conformity clearance procedure. These deadlines were strongly asked by the European Parliament in the annual discharge procedures and
requested by the Member States and they were introduced in the legislation with the last CAP reform. The application of these deadlines ensures timely closure of the
procedure and avoids thus any new backlog. Explanatory box 2.1.1.3-1
Every year the Commission adopts 3 to 4 conformity clearance decisions (ad-hoc decisions) on a package of individual financial corrections. In 2016 the Commission
adopted 3 such decisions published in the Official Journal71, covering 147 individual net financial corrections for a total amount of EUR 1 588.9 million. While
lower than in 2015, this overall level of financial corrections reflects the outcome of the
closure of backlog cases.
Net financial corrections decided in 2016
million EUR
Commission Conformity Clearance Decisions
EAGF EAFRD Total
ad-hoc 50 2016/417/EU 506.337 203.541 709.878
ad-hoc 51 2016/1059/EU 553.546 8.093 561.639
ad-hoc 52 2016/2018/EU 248.711 68.701 317.412
Total 1,308.59 280.33 1,588.93
Table 2.1.1.3-2
70 Multiannual Work Programme of Directorate J for the period 2014-2017 (Ares(2014)2977117) 71 Decision 2016/417/EU of 17/03/2016, OJ L75 (ad hoc decision no. 50)
Decision 2016/1059/EU of 20/06/2016, OJ L173 (ad hoc decision no. 51)
Decision 2016/2018/EU of 15/11/2016, OJ L312 (ad hoc decision no. 52)

agri_aar_2016 Page 75 of 114
Is the amount executed in a given year the same as the amount adopted in the same year?
For EAGF, financial corrections are executed by deducting the amounts concerned from
the monthly payments made by the Commission in the second month following the Commission decision on a financial correction to the Member State concerned. For
EAFRD, the financial corrections are executed through a recovery order requesting the Member State concerned to reimburse these amounts to the EU budget mostly executed
by set-off in the reimbursement in the following quarter. It therefore occurs that decisions adopted in the end of year N are only executed at the beginning of year N+1.
Furthermore, the execution of the decision may be delayed due to instalment and deferral decsions.
This is particularly the case since 2010 when, due to the financial and economic crisis, Member States requested more frequently the benefit of an existing provision in the
legislation allowing reimbursement of financial corrections via annual instalments (rather
than a one-off payment): if the amount to be reimbursed by the Member State is more than 0.01% of its GDP, it may request that the deductions are made in annual
instalments (maximum 3) instead of all at once. Up to end of 2016, instalment decisions had been adopted in respect of EUR 3.3 billion of financial corrections
(see Annex 10 – 4.8 for details).
In 2015 a new deferral decision under Commission Implementing Regulation 908/2014
Article 34(8a) was adopted for Greece. This decision allows deferring the execution date for financial corrections for a period of 24 months from the date of the adoption. After
the expiry of the deferral period the corrections are required to be executed in five
annual instalments. The deferral granted to Greece will expire on 22 June 2017. So far the EUR 506.6 million were deferred (see Annex 10 –4.11 for details).
Tables giving details of the various instalments and their repayment schedules as well as the two deferral decisions (see Annex 10 – 4.9 and 4.10 for details) can be found in
Annex 10 – part 4 which give more information on net financial corrections and explains the clearance of accounts system.
Does the amount of financial corrections decided in a given year correspond to
the expenditure of the same year?
In general there is a time-lag between expenditure which is incurred in the Member State, the Commission's detection of the error and the decision on and eventual
execution of the financial corrections. In addition, very often a financial corrections covers two or more expenditure years.
Protection of the EU budget via Recoveries
It is not only the Commission which acts to recover ineligible expenditure from the Member States and thus, protect the EU budget. Member States also take steps to
recover amounts from beneficiaries.
Under shared management it is entirely the responsibility of the Member State to recover from beneficiaries. Amounts paid to beneficiaries which the Member States themselves
have identified as being ineligible shall be recovered from the beneficiaries and reimbursed to the EU budget. Annex 10 – part 5 explains the legal framework and
provides detailed information on recovered amounts.
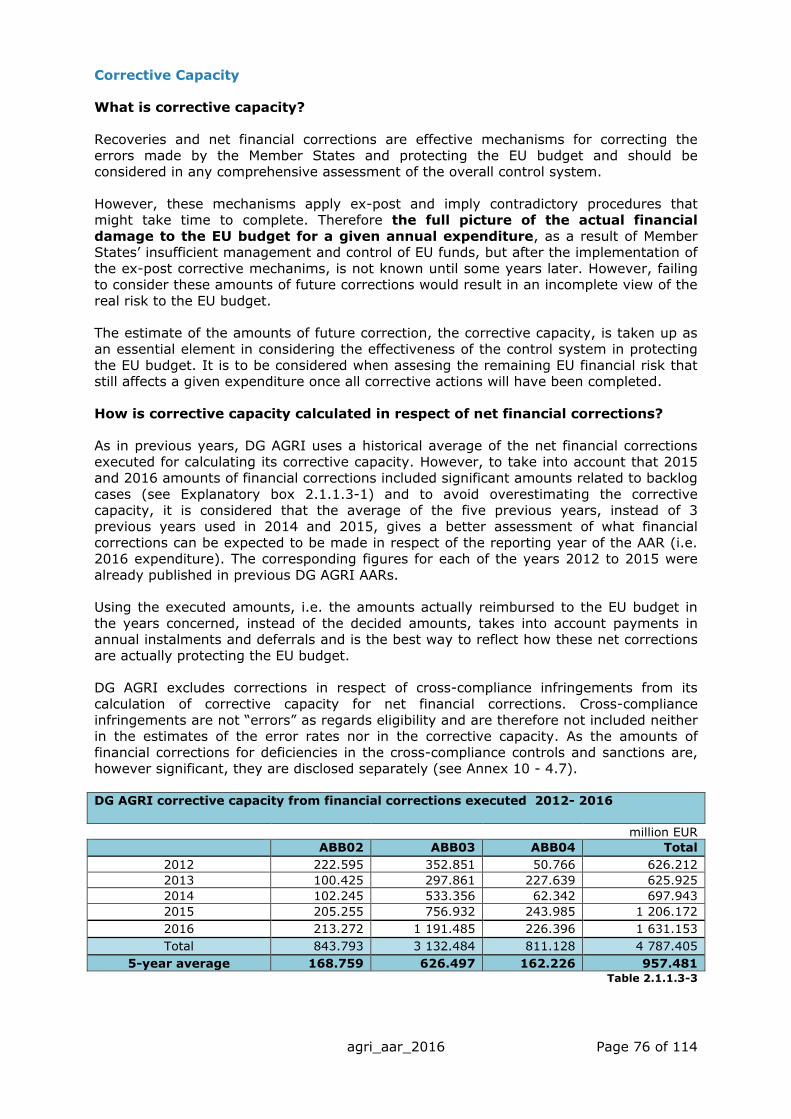
agri_aar_2016 Page 76 of 114
Corrective Capacity
What is corrective capacity?
Recoveries and net financial corrections are effective mechanisms for correcting the
errors made by the Member States and protecting the EU budget and should be considered in any comprehensive assessment of the overall control system.
However, these mechanisms apply ex-post and imply contradictory procedures that might take time to complete. Therefore the full picture of the actual financial
damage to the EU budget for a given annual expenditure, as a result of Member States’ insufficient management and control of EU funds, but after the implementation of
the ex-post corrective mechanims, is not known until some years later. However, failing to consider these amounts of future corrections would result in an incomplete view of the
real risk to the EU budget.
The estimate of the amounts of future correction, the corrective capacity, is taken up as
an essential element in considering the effectiveness of the control system in protecting
the EU budget. It is to be considered when assesing the remaining EU financial risk that still affects a given expenditure once all corrective actions will have been completed.
How is corrective capacity calculated in respect of net financial corrections?
As in previous years, DG AGRI uses a historical average of the net financial corrections
executed for calculating its corrective capacity. However, to take into account that 2015 and 2016 amounts of financial corrections included significant amounts related to backlog
cases (see Explanatory box 2.1.1.3-1) and to avoid overestimating the corrective capacity, it is considered that the average of the five previous years, instead of 3
previous years used in 2014 and 2015, gives a better assessment of what financial
corrections can be expected to be made in respect of the reporting year of the AAR (i.e. 2016 expenditure). The corresponding figures for each of the years 2012 to 2015 were
already published in previous DG AGRI AARs.
Using the executed amounts, i.e. the amounts actually reimbursed to the EU budget in
the years concerned, instead of the decided amounts, takes into account payments in annual instalments and deferrals and is the best way to reflect how these net corrections
are actually protecting the EU budget.
DG AGRI excludes corrections in respect of cross-compliance infringements from its
calculation of corrective capacity for net financial corrections. Cross-compliance
infringements are not “errors” as regards eligibility and are therefore not included neither in the estimates of the error rates nor in the corrective capacity. As the amounts of
financial corrections for deficiencies in the cross-compliance controls and sanctions are, however significant, they are disclosed separately (see Annex 10 - 4.7).
DG AGRI corrective capacity from financial corrections executed 2012- 2016
million EUR
ABB02 ABB03 ABB04 Total
2012 222.595 352.851 50.766 626.212
2013 100.425 297.861 227.639 625.925
2014 102.245 533.356 62.342 697.943
2015 205.255 756.932 243.985 1 206.172
2016 213.272 1 191.485 226.396 1 631.153
Total 843.793 3 132.484 811.128 4 787.405
5-year average 168.759 626.497 162.226 957.481 Table 2.1.1.3-3

agri_aar_2016 Page 77 of 114
How is corrective capacity calculated in respect of recoveries?
As is the case for net financial corrections, corrective capacity for recoveries is calculated
on the basis of an average of the previous five years. Again, it is considered that this
period gives the closest assessment of the recoveries which can be expected to be made in respect of the reporting year of the AAR. DG AGRI also excludes recovered amounts in
respect of cross-compliance infringements from its calculation of corrective capacity for recoveries (the total recoveries are disclosed in Annex 10, part 6). Since the entry into
force of Regulation 908/2014 (implementing Regulation for Regulation 1306/2013), Paying Agencies are required to record the budget code of the amounts recovered.
However, this requirement is only applicable to new debt cases (as per Article 41 (5) of regulation (EU) No 907/2014). Consequently, since Paying Agencies are still presently
reporting old debts cases, it is still not possible to provide a breakdown of recovered amounts at ABB level and this is why the corrective capacity continues to be reported at
Fund level.
DG AGRI corrective capacity from recoveries 2012 - 2016
million EUR
EAGF EAFRD Total
2012 127.990 66.194 194.184
2013 113.134 98.824 211.959
2014 112.359 121.899 234.258
2015 96.732 124.140 220.872
2016 82.604 135.613 218.217
Total 532.820 546.671 1 079.491
5-year average 106.564 109.334 215.898
Table 2.1.1.3-4
Conclusion
The total corrective capacity in respect of the EAGF and EAFRD funds in shared management is calculated to be EUR 1 173.4 million. This amount is the DG AGRI's best
estimate of what will be recovered to the EU budget via net financial corrections and recoveries in respect of 2016 expenditure.
agri_aar_2016 Page 78 of 114
2.1.1.3.2 Interruptions, reductions and suspensions
In 2016 DG AGRI continued to apply the interruptions and reductions/suspensions of monthly payments (EAGF) and interim payments (EAFRD) in order to safeguard the EU
financial interest. This preventive mechanism existed before; however, the Commission powers have been significantly reinforced with the entry into force of the CAP financing
Regulation 1306/2013 (and the Common Provisions Regulation 1303/2013) in 2013. This allows DG AGRI to efficiently interrupt payment for the second pillar (EAFRD) and to
reduce or suspend the payments for both pillars (EAGF and EAFRD).
The EAFRD payments deadline may be interrupted under Article 22 of Commission Implementing Regulation 908/2014 for verifications due to inconsistent, incomplete or
unclear information If there is a clear indication of a deficiency in management and control system or that the expenditure is linked to an irregularity having serious financial
consequences the expenditure may be interrupted - as for other structural funds - based on Article 83 of the Common Provisions Regulation.
The payments for both pillars may be reduced or suspended based on Article 41 of Regulation 1306/2013 when the payments were not effected in accordance with EU rules,
or there is an evidence of a deficiency in the national management and control or
recovery systems.
In particular, according to Article 41 (1), if the declarations of expenditure or the annual
accounts enable the Commission to establish that expenditure has been effected by bodies which are not accredited paying agencies, that payment periods or financial
ceilings set by Union law have not been respected or that expenditure has otherwise not been effected in accordance with Union rules, the Commission may reduce or suspend
the monthly or interim payments to the Member State, after giving the Member State an opportunity to submit its comments.
Where the declarations of expenditure or the annual accounts do not enable the
Commission to establish that the expenditure has been effected in accordance with Union rules, the Commission shall ask the Member State concerned to supply further
information and comments within 30 days. If the Member State fails to respond within this period or if the response is unsatisfactory or demonstrates that the expenditure has
not been effected in accordance with Union rules, the Commission may reduce or suspend the monthly or interim payments to the Member State.
Article 41 (2) refers to deficiencies of the national control system. The Commission may reduce or suspend the monthly or interim payments to a Member State if one or more of
the key components of such control system do not exist or are not effective due to the
gravity or persistence of the deficiencies found, or if there are similar serious deficiencies in the system for the recovery of irregular payments and either these deficiencies are of
a continuous nature or the Commission concludes that the Member State is not in a position to implement in the immediate future the necessary remedial measures in
accordance with an action plan. Before acting, the Commission informs the Member State concerned of its intention and asks it to react within 30 days.
Reductions and suspensions shall be applied in accordance with the principle of proportionality and shall be without prejudice to the application of the conformity
clearance procedures.
In order to ensure a consistent and timely treatment of cases for both pillars, in 2014 DG AGRI established the Suspension Board, an advisory body to the Director General, co-
chaired by two Deputy Directors-General responsible for the 1st pillar and 2nd pillar. The Board meets on a monthly basis to take into account the rhythm of interim payments
(monthly payments for EAGF and quarterly payments for EAFRD). In urgent cases, the Board has been consulted by an ad hoc written consultation.

agri_aar_2016 Page 79 of 114
The interruptions and reductions/suspensions are provisional. When relevant these could be accompanied by an audit of DG AGRI audit service. If the deficiency is confirmed, the
relevant expenditure is definitely excluded from EU financing by application of a financial
correction.
An overview of interruptions and reductions/suspension applied in 2016 for each of the
funds (EAGF and EAFRD) is provided below.
EAGF
Reductions/Suspensions of payments in respect of EAGF declarations of expenditure reimbursed in 2016.
The reductions made in 2016 concerned 19 Member States and a total amount of EUR 11 649 265.35. There were no reductions in the monthly payments due to
deficiencies in the control system in 2016. The reductions concern overruns of ceilings, deadlines and other eligibility issues. There were 79 operations in total related to the
reductions.
Suspensions of payments for deficiencies in the control system were made for the first time for a total amount of EUR 184 759 667.17 (France: EUR 175 403 355.08 and
Poland: EUR 9 356 312.09)
The following table shows the amounts and number of cases reduced/suspended for each
Member State.
Summary of reductions and payment suspensions executed during the financial year 2016
M.S. Reductions
(see Annex I) Number of cases
Payment suspension
(see Annex II)
Number of cases
BE 21 356.07 1
DK 10 619.34 1
DE 22 007.53 4
IE 233 089.76 1
EL 14 323.91 1
ES 3 648 890.76 6
FR 175 403 355.08 20
HR 59 931.23 1
IT 364 743.63 2
LT 19 074.25 1
HU 2 291 236.12 27
NL 501 741.06 1
AT 483.40 1
PL 3 363 780.69 3 9 356 312.09 8
PT 670 497.93 13
RO 388 216.92 2
SK 815.68 1
FI 11 610.57 7
SE 12 921.93 2
UK 13 924.57 4
Total MS 11 649 265.35 79 184 759 667.17 28
The detailed list of reductions/suspensions applied on EAGF payments in 2016, including

agri_aar_2016 Page 80 of 114
reductions for overrun of ceilings, deadlines and eligibility issues, is attached as Annex 13 to the present report.
EAFRD
Interruptions and reductions/suspensions of payments in respect of EAFRD declarations of expenditure for financial year 2016.
The interruptions and reductions/suspensions of EAFRD payments concerned 3 out of 92 Rural Development Programmes (RDPs) from the 2007-2013 programming period and 2
out of 115 RDPs from the 2014-2020 programming period.
The following table shows the cases of interruptions and reductions/suspensions by
Member State, programming period and quarter with the amounts and measures involved. It covers the quarterly declarations of expenditure received and processed
during the budget year 2016. The Q4 2015 data corresponds to payments made as from 01/02/2016 based on declarations received by 31/01/2016. The Q3 2016 data
corresponds to declarations received by 10/11/2016 and executed by 31/12/2016.
PROGRAMMING PERIOD 2007-2013
MS Quarter Type Amount interrupted Amount reduced
/suspended Measure
Bulgaria 2015Q4 interruption 104 874 940.28 214
Bulgaria 2015Q4 interruption 15 114 505.34 311
Bulgaria 2015Q4 interruption 10 042 371.60 312
Poland 2015Q4 interruption 28 936 054.07 113
Romania 2015Q4 interruption 85 746 479.26 215
Romania 2015Q4 reduction 8 584 818.55 215
Total 244 714 350.55 8 584 818.55
PROGRAMMING PERIOD 2014-2020
MS Quarter Type Amount interrupted Amount reduced
/suspended Measure
Bulgaria 2016Q1 interruption 10 785 052.18 11
Romania 2016Q3 interruption 31 715 890.63 14
Romania 2016Q3 interruption 392 006.74 14
Total 42 892 949.55 -
The following table shows the number of interruption and reduction/suspension cases
related to EAFRD declarations of expenditure reimbursed in 2016 for the Member states concerned. It should be noted that, in the case of Bulgaria, an issue leading to
interruption and reduction/suspension in one quarter has led to further interruptions or
reductions/suspensions in the following quarters and therefore, increased the number of cases for the concerned MS.
MS Number of
interruptions Number of
reductions/suspensions
Bulgaria 4 -
Poland 1
Romania 3 1
Totals 8 1

agri_aar_2016 Page 81 of 114
2.1.1.4 Cost-effectiveness and efficiency
Based on an assessment of the most relevant key indicators and control results, DG AGRI
has assessed the cost-effectiveness and the efficiency of the control system and reached
a positive conclusion.
Cost-effectiveness
For the EAGF and the EAFRD, the two main funds managed by DG AGRI representing 99.5% of the CAP budget, the following indicators can be reported:
Indicator 2016
Cost of management and control of the Commission (as a % of
2016 payment appropriations executed by the Commission for shared management)
0.1%
Cost of management and control of the Member States –i.e. the 'delivery cost' (as a % of 2016 total public expenditure)
4.8%
Table 2.1.1.4-1
The annual overall Commission cost for managing the management and control systems
in place for shared management was estimated at around EUR 51 million, corresponding to 0.1% of total payments in 2016. A comparison of the results indicates
that the results are in line with the results obtained for earlier reporting exercises (EUR 50 million in 2015). DG AGRI considers this overall cost to appear very reasonable and
very cost effective.
The costs have been calculated using the common methodology developed by the Commission to measure the cost of controls. The data used result from a survey
performed in the services in 2014 and 2015 and updated for 2016. They relate for around one third to the staff involved in audit activities. The remaining costs relate to
staff in the operational directorates and to staff involved in the financial management of the funds. In addition, staff responsible for evaluation, legal affairs and IT systems is also
included in the calculation, following an apportionment estimated by the concerned units.
The delivery costs at the level of the Member States and ABBs are related to all the
activities of the Paying Agencies for managing and controlling the CAP expenditure, from
providing to all potential beneficiaries the necessary means to lodge an application and including controls, payments, accounts, and their reporting to the Commission.
DG AGRI carries out a survey on the delivery cost in the Paying Agencies on a bi-annual basis. The last one was done in 2015. On the basis of this latest survey, the overall
delivery cost of managing and controlling CAP expenditure for the Member States was estimated at around EUR 2 654 million, corresponding to 4.8% of the CAP expenditure
for financial year 2016. The delivery costs are borne by the Member States.
Member States Management and Control Costs1 (EUR million)
in % of 2016 expenditure
Agricultural markets (ABB02) 640.2 20.0%
Direct support (ABB03) 889.7 2.2%
Rural development (ABB04) 1 124.7 6.7%2
Total 2 654.6 4.8%3
Table 2.1.1.4-2 1 As provided by Member States in 2015 2 In % of 2016 expenditure including total public expenditure 3 In % of 2016 CAP expenditure (annual declaration)
DG AGRI considers that this is a reasonable amount, especially when taking into account
the relatively small size of most of the payments to beneficiaries, the necessity of

agri_aar_2016 Page 82 of 114
protecting the EU financial interest and the overall performance of the policy. Still DG AGRI also considers there is possibly a scope for improving even further the cost-
effectiveness at the level of the Member States.
The quantifiable benefits of the delivery costs in the Member States and Commission control costs mainly relate to the detection and correction by Member States of undue
amounts claimed and the recoveries by Member States from beneficiaries after payment, and to the financial corrections decided by the Commission following DG AGRI's audit
work. The total of quantifiable benefits consequently amounts to EUR 1 811.5 million:
Net Financial Corrections1
(EUR million)
Undue claimed amounts
detected and corrected by
Member States
prior to payment2
(EUR million)
Member States'
recoveries from
beneficiaries after
payment3 (EUR
million)
Total (EUR million)
Total in % of
expenditure
ABB02 168.8 64.8
106.6 1398.7 3.2%
ABB03 626.5 431.9
EAGF 795.3 496.8
ABB04 162.2 141.4 109.3 412.9 3.3%
Total 957.5 638.1 215.9 1811.5 3.2% Table 2.1.1.4-3
1 See corrective capacity 2 As reported in the 2016 control statistics
3 See corrective capacity
Also, there are a number of not precisely quantifiable benefits resulting from the controls
operated throughout the various control stages. This includes notably (but not exclusively) the deterrent effects of controls as well as an increased level of assurance
resulting from, for instance, improvements in the management and control systems implemented at DG AGRI request and DG AGRI's adjustments made on the error rates
reported by Member States.
Overall, CAP support is delivered to beneficiaries in a way that protects the EU financial
interest as evidenced by the Director General's conclusion that he has assurance for almost 98% of the resources assigned to him, with the remaining overall financial risk,
after all corrective action will have taken place, being significantly below materiality (see
Section 2.1.4.3 of this report).
Efficiency
Indicator 2016 2015
% of Rural Development Programmes (RDP) approved
(2014-2020 period)
100% 100%
Average time to adopt/approve a RDP Not applicable 5 months
% of Paying Agencies accredited 100% 100%
% of Commission payments within target (EAGF) Time-to-payment (EAFRD):
Period 2007/2013
Period 2014/2020
100%
36
23
100%
42.7 days
16 days Table 2.1.1.4-4
For the reporting year, no programmes needed approval as all remaining programmes were already adopted as per 31/12/2015. Also, all Paying Agencies were already
accredited by end 2015 with no Paying Agencies under probation or having a provisional
accreditation.

agri_aar_2016 Page 83 of 114
In view of the results indicators mentioned above, DG AGRI considers that the relative level of efficiency of the controls operated is adequate.
2.1.1.5 Fraud prevention and detection
Indicator 2015 2016
Number of cases (allegations of fraud) detected and transferred to OLAF.
14 10
Throughout 2015, DG AGRI has referred 10 allegations of fraud and other irregularities to
OLAF, 9 of which related to the EAFRD. At the end of 2016, 32 OLAF investigations and coordination cases dealing with possible fraud against the CAP budget and pre-accession
funds were on-going. This confirms the steady decrease of OLAF cases in relation to the
CAP (end 2014: 76 cases on-going, end 2015: 47). 27 of the 32 on-going cases concern allegations of fraud in the EAFRD. This confirms past observations that RD investment
projects in particular are exposed a risk of fraud or serious irregularities higher than all other areas of CAP spending.
Anti-fraud strategy (AFS)
DG AGRI has developed and implemented its own AFS since September 2012, elaborated
inter alia on the basis of the methodology provided by OLAF. It has been updated on three occasions. Its last modification dates from December 2015. In 2016, the ASF did
not need further update.
IAS audit on DG AGRI's Anti-Fraud Strategy (AFS)
In 2015, the IAS had finalised its multi-DG audit (five DGs) on the adequacy and
effective implementation of DGs' Anti-fraud Strategies (AFS). The IAS identified weaknesses as to the design and implementation of AFS and governance, risk
management and control process. In its follow-up audit in 2016, the IAS has confirmed that its recommendations have been implemented by DG AGRI.
Anti-fraud seminars and awareness raising actions
Throughout the year 2016, 12 seminars on the prevention, detection and correction of
fraud and irregularities have been held, namely for all Paying Agencies in Germany, for
the Paying Agency of Catalonia and the IPARD Paying Agencies of Montenegro and Albania.
In addition, DG AGRI has provided all Member States with a document of the assessment of the risk of fraud and other serious irregularities to the detriment of the budget of the
CAP, translated into all official languages of the EU. This document aims at assisting Member States to conduct their specific fraud risk assessments at national or regional
level.
agri_aar_2016 Page 84 of 114
2.1.1.6 Other control objectives: safeguarding of assets and information
DG AGRI has set up a full range of measures to ensure the adequate safeguarding of its
IT systems. In particular:
- All Information Systems are protected from unauthorized access through
advanced access rights mechanisms and a thorough review of the access rights is performed once a year. The local infrastructure where Information Systems are
hosted is segregated from the rest of EC internal network by a firewall. Security plans have been defined for the key DG AGRI Information Systems, for the
implementation of specific security measures: for instance, DG AGRI implemented some specific security features to ensure full confidentiality of data during the
sensitive phases of communication (embargo period) for Member States
notifications.
- The databases are also duplicated with immediate synchronisation on a backup
site to prevent from data loss.
- The Business Continuity Plan is kept up to date, with a Disaster Recovery exercise
being tested on a yearly basis to ensure continuity of operations in case of incident.
- End-user IT equipment is managed centrally by DG DIGIT: all workstations are safeguarded with technical means that protect them from security threats; laptop
computers are encrypted and secure e-mail is made available for the exchange of
sensitive information.
- The DG AGRI LISO intervenes each time a security threat is detected. Quarterly
reports are provided to the DG AGRI Director R and to the DG AGRI Security Committee. In 2016, no significant security threat had to be reported.

agri_aar_2016 Page 85 of 114
2.1.2 Audit observations and recommendations
This section reports and assesses the observations, opinions and conclusions reported by
auditors in their reports as well as the limited conclusion of the Internal Auditor on the
state of control, which could have a material impact on the achievement of the internal control objectives, and therefore on assurance, together with any management measures
taken in response to the audit recommendations. The section is subdivided in three subsections: the Internal Audit Service (IAS), the 2015 Annual Report of the European
Court of Auditors (ECA), and the ECA's Special Reports issued for 2016.72
2.1.2.1 Internal Audit Service (IAS)
In 2016, the IAS finalised three audit reports involving DG AGRI and issued a total of 8 very important (VI) audit recommendations. DG AGRI's management accepted all the
auditors’ recommendations and submitted action plans which were assessed favourably
by the IAS. The various management measures included in these action plans are being implemented as expected.
The following very important issues were identified in these audits:
1) The design of DG AGRI's performance measurement system for CAP 2014-2020
The IAS pointed out to weaknesses regarding the quality of objectives, indicators and intervention logic. Also, the IAS observed weaknesses regarding the consistency and
completeness of the Common Monitoring and Evaluation Framework (CMEF). Finally, the audit found that DG AGRI faces continued problems in obtaining reliable data for
calculating the values of certain CMEF indicators, in particular for environmental indicators due to a strong resistance from MS to provide additional data due to the
costs involved.
2) DG AGRI's management and control system for Voluntary Coupled Support
The IAS found weaknesses in the follow-up of the VCS notification assessments,
indicating there is currently no formalised typology used to categorise the detected
issues according to their nature, scope, frequency and seriousness. In addition, there is no clear approach on how to follow up these issues through appropriate
available tools. The IAS also identified shortcomings in the monitoring and control of the 2015 financial ceilings, the ceilings not always being clearly specified.
Furthermore, for the claim year 2015, although the general VCS ceiling per MS is systematically controlled on a monthly basis by the EAGF financial unit, this is not
the case for the measure-specific ceilings. DG AGRI needs therefore to further improve the working arrangements that were being developed in this regard from an
effectiveness and efficiency viewpoint. Finally, the IAS recommended further
strengthening the monitoring of the VCS measures presenting the highest risks of not meeting the scheme's objectives and/or most likely at risk of distorting
agricultural markets. For these measures, DG AGRI should strengthen the current
72 The period to be considered according to the AAR standing instructions is 01/02/2016 – 31/01/2017.
Audit field Title Final report # VI
Recs
Performance The design of DG AGRI's performance measurement system for the
CAP 2014-2020 22/04/2016 3
VCS DG AGRI's management and control system for Voluntary Coupled
Support (VCS) 19/09/2016 3
Multi-DG audit The processes for managing and sharing data on agri-
environmental-climate issues in DG AGRI, DG CLIMA and DG ENV 12/01/2017 2

agri_aar_2016 Page 86 of 114
monitoring arrangements, for example by making more use of available complementary data and analysis.
3) The processes for managing and sharing data on agri-environmental-climate
issues in DG AGRI, DG CLIMA and DG ENV (multi-DG audit)
The IAS pointed out to the lack of a comprehensive and coordinated inventory of
information needs together with a list of already available agri-environmental-climate data. It also identified an insufficient coordination by the three services concerned of
the Member States reporting requirement concerning agri-environmental-climate data as well as insufficient re-use of collected data.
Follow-up of open recommendations
DG AGRI management closely monitors the implementation of the audit recommendations. All action plans are being implemented as foreseen, with no significant
difficulties or delays. The implementation of the audit recommendations is also monitored by the IAS who
performed follow-up audit work on outstanding IAS recommendations in 2016 as well
as a number of follow-up engagements of outstanding recommendations from the former IAC of DG AGRI which had been reported as implemented. At the end of 201673, there
were 20 IAS audit recommendations (issued from 7 audits) addressed to DG AGRI that were still assessed as 'In progress' by the IAS. All recommendations made by the former
IAC audits and followed up by the IAS have been closed by 31 December 2016. One originally "Very Important" recommendation was overdue for more than six months
at the end of 2016 ("guidance to avoid double funding for forestry measures", originating from a 2015 IAS audit on greening). However, as a result of its follow-up work
performed, the IAS downgraded this recommendation from "Very Important" to
"Important" in January 2017 given the low take-up of agroforestry and afforested areas as EFAs, observed after the first year of implementation of the greening payment and
hence a limited related risk of double funding.
IAS limited conclusion
On the basis of the audit work undertaken by the IAS in the period 2014-2016 as well as by the former IAC of DG AGRI over the same period and taking into account the fact that
for the accepted recommendations made by internal auditors in 2014-2016, management
has adopted plan to implement them which the IAS considers adequate to address the residual risks, that the implementation of these plans is monitored by management and
the IAS and that management has not rejected any critical and/or very important recommendations, the Internal Auditor issued his conclusion on the state of internal
control in DG AGRI in February 2017. The IAS concluded that the internal control systems audited are overall working satisfactorily, although a number of Very
Important findings remain to be addressed in line with the agreed action plans. He highlighted that particular attention should be given to the combined effect of a number
of open recommendations related to performance monitoring so that AGRI can effectively
ensure regular and systematic critical assessments of the outcome and impact of the policy it manages.
Conclusion
DG AGRI's management considers that the current state-of-play does not lead to
assurance-related concerns and concludes that it has reasonable assurance.
73 State of play as reported by the IAS per 2 February 2017 (based on data reported in IssueTrack).
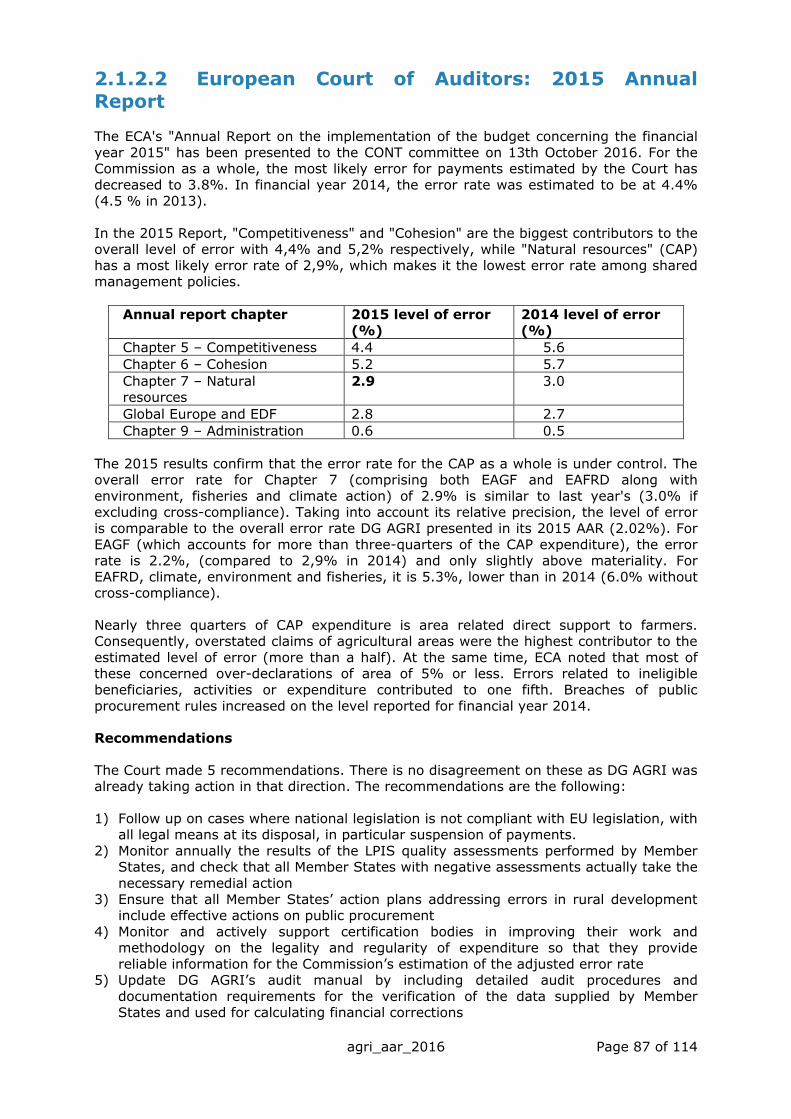
agri_aar_2016 Page 87 of 114
2.1.2.2 European Court of Auditors: 2015 Annual Report
The ECA's "Annual Report on the implementation of the budget concerning the financial
year 2015" has been presented to the CONT committee on 13th October 2016. For the Commission as a whole, the most likely error for payments estimated by the Court has
decreased to 3.8%. In financial year 2014, the error rate was estimated to be at 4.4% (4.5 % in 2013).
In the 2015 Report, "Competitiveness" and "Cohesion" are the biggest contributors to the overall level of error with 4,4% and 5,2% respectively, while "Natural resources" (CAP)
has a most likely error rate of 2,9%, which makes it the lowest error rate among shared management policies.
Annual report chapter
2015 level of error
(%)
2014 level of error
(%)
Chapter 5 – Competitiveness
4.4 5.6
Chapter 6 – Cohesion
5.2 5.7
Chapter 7 – Natural resources
2.9 3.0
Global Europe and EDF
2.8 2.7
Chapter 9 – Administration
0.6 0.5
The 2015 results confirm that the error rate for the CAP as a whole is under control. The overall error rate for Chapter 7 (comprising both EAGF and EAFRD along with
environment, fisheries and climate action) of 2.9% is similar to last year's (3.0% if excluding cross-compliance). Taking into account its relative precision, the level of error
is comparable to the overall error rate DG AGRI presented in its 2015 AAR (2.02%). For
EAGF (which accounts for more than three-quarters of the CAP expenditure), the error rate is 2.2%, (compared to 2,9% in 2014) and only slightly above materiality. For
EAFRD, climate, environment and fisheries, it is 5.3%, lower than in 2014 (6.0% without cross-compliance).
Nearly three quarters of CAP expenditure is area related direct support to farmers. Consequently, overstated claims of agricultural areas were the highest contributor to the
estimated level of error (more than a half). At the same time, ECA noted that most of these concerned over-declarations of area of 5% or less. Errors related to ineligible
beneficiaries, activities or expenditure contributed to one fifth. Breaches of public
procurement rules increased on the level reported for financial year 2014.
Recommendations
The Court made 5 recommendations. There is no disagreement on these as DG AGRI was already taking action in that direction. The recommendations are the following:
1) Follow up on cases where national legislation is not compliant with EU legislation, with all legal means at its disposal, in particular suspension of payments.
2) Monitor annually the results of the LPIS quality assessments performed by Member States, and check that all Member States with negative assessments actually take the
necessary remedial action
3) Ensure that all Member States’ action plans addressing errors in rural development include effective actions on public procurement
4) Monitor and actively support certification bodies in improving their work and methodology on the legality and regularity of expenditure so that they provide
reliable information for the Commission’s estimation of the adjusted error rate 5) Update DG AGRI’s audit manual by including detailed audit procedures and
documentation requirements for the verification of the data supplied by Member States and used for calculating financial corrections

agri_aar_2016 Page 88 of 114
Systems assessment and examination of 2015 DG AGRI's annual activity report
The Court found that the Commission's audit work was overall satisfactory and that it
could rely on the Commission's assessment of the Member States' systems. The Court
also acknowledged the efforts in clearing the backlog of open audit enquiries.
For the Member States' systems related to regularity of transactions, the Court found
that there is still scope of further improvement in the area of public procurement. The Court also found some of the key control functions they examined to be affected by
weaknesses, still acknowledging significant contribution of IACS in preventing and reducing the level of error.
The Court again found that the methodology for calculating the adjusted error rate for the CAP expenditure in DG AGRI's AAR was sound, despite mentioning in its assessment
of the new role of the Certification Bodies, that 'in 2015, DG AGRI could use the opinions of the certification bodies on the legality and regularity only to a very limited extent due
to significant weaknesses in methodology and implementation.'74
Performance
The Court provides for a specific assessment of performance in a separate chapter. A
part of this chapter covers performance reporting at the level of the 'Natural Resources' family, for which the Court reviewed the 2015 programme statements, management plan
and annual activity report.
In its conclusion for all four DGs reviewed (DG AGRI, DG CLIMA, DG ENV, DG MARE), the
Court noted that many of the objectives used in MPs and AARs were taken directly from policy or legislative documents and were therefore at too high a level for management
purposes. They also observed progress for the indicators used to measure performance
although some shortcomings remain. For DG AGRI in particular, the Court considers that indicators presented as result indicators were instead input-oriented. The Commission
accepts all Court's recommendations.
2.1.2.3 European Court of Auditors: Special Reports
The ECA published 5 special reports concerning DG AGRI's activities:
1. Special Report 1/2016: Is the Commission's system for performance
measurement in relation to farmers' incomes well designed and based on sound
data?
2. Special Report 18/2016: The EU system for the certification of sustainable biofuels
3. Special Report 25/2016: The Land Parcel Identification System: A useful tool to
determine the eligibility of agricultural land – but its management could be further improved
4. Special Report 26/2016: Making cross-compliance more effective and achieving simplification remains challenging
5. Special Report 31/2016: Spending at least one euro in every five from the EU budget on climate action: ambitious work underway, but a serious risk of falling
short.
Further information on these special reports is presented in Annex 14.
The ECA also launched the following audits which are still on-going:
74 See point 7.54 of the "Annual report of the Court of Auditors on the implementation of the budget concerning
the financial year 2015, together with the institutions' replies" (OJ 2016/C 375/01)

agri_aar_2016 Page 89 of 114
1. Simplified cost options (SCO) 2. Basic Payment Scheme for Farmers – Has it been successfully introduced?
3. Generational shift in agriculture
4. Renewable energy in rural areas 5. High-speed broadband
6. Can greening enhance the environmental and climate performance of the CAP?
Finally, the ECA also published a special report on Governance ('Governance at the
European Commission – Best Practice') in October 2016 in which the ECA
recommends the Commission to further strengthen its governance structure and in particular to perform more audit work on high-level governance and align the
Commission internal control framework with the international principles.
Conclusion
DG AGRI's management considers that the current state-of-play does not lead to
assurance-related concerns and concludes that it has reasonable assurance.

agri_aar_2016 Page 90 of 114
2.1.3 Assessment of the effectiveness of the internal
control systems
The Commission has adopted a set of internal control standards, based on international good practice, aimed to ensure the achievement of policy and
operational objectives. In addition, as regards financial management, compliance with these standards is a compulsory requirement.
DG AGRI has put in place the organisational structure and the internal control systems suited to the achievement of the policy and control objectives, in
accordance with the standards and having due regard to the risks associated with the environment in which it operates.
DG AGRI internal control system is based on the clear definition of roles and
responsibilities for the effective implementation of the control standards. The assessment is carried out based on a desk review of specific actions implemented by the units chef de
file for each standard/actions. This is complemented by information from other channels and tools (management supervision reports, risk assessment exercises, follow-up of audit
recommendations, reported instances of exceptions and non-compliance events) to verify that the DG key control systems are working as intended
In 2016, DG AGRI had foreseen a number of measures to improve the effective implementation of the following standards:
ICS 3 - Staff allocation and mobility policy and ICS 4 (training): the
implementation of the specific agreement that DG AGRI concluded at Cabinet level in April 2016 with horizontal services was a major priority in 2016. The new organisational
chart, to enter into force on 1 January 2017, was prepared, not without difficulties, to accommodate staff reduction targets while still ensuring optimal alignment of DG AGRI
structure to its main objectives. This reorganisation had to be prepared in parallel with structural changes required in the context of the new service delivery model for human
resources and logistics. In 2016, HR initiatives focussed therefore on activities communicating and facilitating the changes ahead. For example, the first DG AGRI
Career Weeks (a programme spread over 4 weeks with around 350 enrolments to over
40 different group trainings and individual sessions) were organised in October 2016 to support in a positive way the mobility of staff in the framework of the planned
reorganisation. As the review of the financial circuits was a main element of the reorganisation, a series of trainings was also organised for the operational initiating
agents in the direct management mode. The staff cuts had a direct effect on the availability of vacant posts, therefore, initiatives to implement and follow-up the
compulsory mobility policy within DG AGRI had to be put on hold, while external mobility was encouraged via the organisation of two targeted calls for interest (AD and AST).
Improvements took place for ICS 14 - Evaluation of activities, in particular for the
evaluation planning. The procedure for the preparation of the DG AGRI studies and evaluation plan was substantially modified introducing an earlier launch of the planning
process and a stronger involvement of senior management.
For ICS 5 – Objectives and Performance indicators: enhancing the implementation
of the performance culture, the work is now producing tangible results. Thanks to the work of the working group on performance reporting, the presentation of section 1 of the
Annual Activity Report has been improved and clarifies the links between the DG/policy and the results on the ground. DG AGRI also contributed actively to the "Budget focused
on results" initiative.
In 2016 DG AGRI has also started some pilot awareness actions in the area of leakage of documents and use of social media (ethics, ICS 2). These pilot awareness actions will

agri_aar_2016 Page 91 of 114
continue in 2017.
DG AGRI has assessed the internal control systems during the reporting year and has
concluded that the internal control standards are implemented and functioning as
intended. However, Internal Control Standard 8 Processes and procedures, including exceptions to procedures and non-compliance events is not fully
implemented and functioning as intended and consequently further improvements are needed. The remedial measures envisaged are: the modification of the AGRI process and
procedures to put them in line with the new organisational structure and the organisation of awareness actions in the area of exceptions to procedures and non-compliance events.
During 2017, it will be also necessary for the Directorate-General to align to the new internal control framework.

agri_aar_2016 Page 92 of 114
2.1.4 Conclusions as regards assurance
This section reviews the assessment of the elements reported above (in Sections 2.1.1,
2.1.2 and 2.1.3) and draws conclusions supporting the declaration of assurance and
whether it should be qualified with reservations.
2.1.4.1 Review of the elements supporting assurance
The information reported in Part 2 stems from the results of management and auditor monitoring contained in the reports listed. These reports result from a systematic
analysis of the evidence available. This approach provides sufficient guarantees as to the
completeness and reliability of the information reported and results in a complete coverage of the budget delegated to the Director-General of DG AGRI.
The Commission gives the highest priority to the exercise of its responsibilities for implementing the budget under Article 317 of the EC Treaty.
DG AGRI has assessed the effectiveness of its key internal control systems during the reporting year (part 2.1.3) and identified areas for improvements, although in no case
the weaknesses identified were of a nature to call into question the reasonable assurance.
In addition, DG AGRI has systematically examined the available control results and
indicators, including the results of the assessment of the Certification Bodies and its own audits, those aimed to supervise entities to which it has entrusted budget
implementation tasks, as well as the observations and recommendations issued by internal auditors and the European Court of Auditors. These elements have been
assessed to determine their impact on the management's assurance as regards the achievement of control objectives (Part 2).
Follow-up of 2015 reservations
In the 2015 AAR, DG AGRI issued reservations at the level of Paying Agency or measure.
This led to a total of 44 reservations.
Member States were requested to submit action plans to remedy the weaknesses underlying the reservations where necessary. Those action plans were then assessed to
check whether they would, if properly implemented, actually remedy the identified deficiencies in due time.
Member States are responsible for the actual implementation of an action plan. DG AGRI monitors the implementation on the basis of the reporting done by Member States, i.e.
verifies that the Member State is providing its progress report in a complete manner and on time. The Certification Bodies are also supposed to report on progress on action plans.
The audit directorate of the DG offers its opinion and checks on-the-spot at appropriate
times the implementation of an action plan in accordance with its audit work programme.
In the framework of the establishment of the Annual Activity Report, DG AGRI assessed
the effectiveness of the remedial actions that have already been taken by the Member State. The detailed conclusions are available in Annex 10 for reservations issued under
shared management for ABB02, ABB03 and ABB04.
The risk for the EU budget is systematically covered by the conformity clearance
procedure and net financial corrections.
agri_aar_2016 Page 93 of 114
Sound Financial Management
With 99.5% of the CAP expenditure being implemented in shared management, its sound
management is based on Member States' compliance with the rules set down in the
legislation, which is then audited by DG AGRI. The CAP legislation imposes compulsory administrative structures (Paying Agencies) in the Member States with strict accreditation
criteria applying in particular to control and the payment functions. Annual accounts are required to be sent to the Commission and the Certification Body is required to certify
them. The Certification Body is required to certify whether it has gained reasonable assurance that the accounts transmitted to the Commission are true, complete and
accurate and, for the second time in financial year 2016, gives an opinion on the legality and regularity of the expenditure.
The Paying Agencies carry out ex-ante administrative checks on each payment as well as on-the-spot checks for at least 5 % of beneficiaries of Direct payments and Rural
Development expenditure. For Market Measure the level of checks is higher with up to
100 % control rates required for certain schemes. The CAP legislation also imposes strict payment deadlines on the Paying Agencies. Those which do not respect these deadlines
are subject to penalties where a significant part of payments are made late.
Weaknesses detected by DG AGRI via its own audits are systematically subject to net
financial corrections through the clearance of accounts procedures in order to protect the EU financial interests.
Resources used for the intended purposes
While deficiencies are found in the management and control systems of some Paying
Agencies, for the almost totality of the EAGF and EAFRD, no evidence has come to light
that significant resources have been diverted from the intended purpose. In particular, while DG AGRI identified a number of deficiencies and errors, in most cases these errors
concerned formal and procedural mistakes while the funds were still effectively used for the stated objectives.
Legality and regularity
Part 2 sets out in detail the processes in place to ensure the management of the risk
relating to legality and regularity of the funds managed under the Common Agricultural Policy. It demonstrates that when taking into account the corrective capacity, i.e. the
estimated amount related to the CAP expenditure 2016 that will be reimbursed by
Member States to the EU budget by net financial corrections as well as by the recoveries effected by the Member States and reimbursed to the EU budget, there is sufficient
assurance that the remaining risk to the EU budget is significantly below 2%.
In the framework of shared management, the detection and correction of errors is in the
direct responsibility of the Member States. Each time deficiencies are found in the management and control system, conformity procedures are opened and, at the same
time, Member States are requested to take remedial action. The latter are closely monitored, failures to implement them may lead to interruption, reduction or suspension
of the EU payments for the measure concerned.
DG AGRI has thoroughly examined all relevant available information, including the certification bodies' opinions on legality and regulatory of the expenditure, and used its
professional judgement to identify as precisely as possible the amounts at risk for the EU budget. Three reservations are made on each of the ABB activities in shared
management, covering 53 reservations at Paying Agency level or Member States. This careful examination enables the Director-General to consider that he has reasonable
assurance as to the legality and regularity of the expenditure effected in 2016 with a qualification in respect of the 3 reservations made for ABB activities as detailed in the
following section.

agri_aar_2016 Page 94 of 114
2.1.4.2 Conclusion on assurance and reservations
The Director General for Agriculture and Rural Development considers it necessary to enter three reservations in respect of 2016 expenditure in shared management (interim
payments and cleared prefinancing for ABB04) with the Member States.
No Title Type
2016 amount at
risk under
reservation
(in million
EUR)
ABB amount
covered i.e. scope (in million EUR)
1
ABB02 – Payments made on Market Measures:
7 aid schemes,
comprising 8 Member States (14 elements of
reservation): Belgium, France (for 4 aid
schemes), Greece (for 2 aid schemes), Hungary,
Italy (for 2 aid schemes), the Netherlands, Poland
(for 2 aid schemes) and
Spain.
Financial EUR 66.1 million
For the aid schemes
covered by the reservations in the
Member States concerned, the
expenditure under
reinforced scrutiny is EUR 1 394 million
2
ABB03 – Payments made
on Direct Payments:
18 Paying Agencies, comprising 12 Member
States: Bulgaria, Cyprus, Denmark, France,
Hungary, Italy (7 Paying Agencies), Poland,
Portugal, Romania, Spain, Sweden and the United
Kingdom and one
unquantified reservation for voluntary coupled
support in 8 Member States: France, Greece,
Ireland, Italy, Lithuania, Malta, Poland and
Romania
Financial EUR 541.2 million
For the Paying
Agencies covered by the reservations in the
Member States concerned, the
expenditure under
reinforced scrutiny is EUR 13 618.6 million
3
ABB04 – Payments made on Rural development:
20 Paying Agencies, comprising 19 Member
States: Belgium,
Bulgaria, Czech Republic, Germany (1 Paying
Agency), Denmark, Spain (1 Paying Agency),
France, UK (1 Paying Agency), Greece,
Financial EUR 393.9
million
For the Paying
Agencies covered by the reservations in the
Member States concerned, the
expenditure (interim payments and cleared
prefinancing) under reinforced scrutiny is
EUR 8 996 million
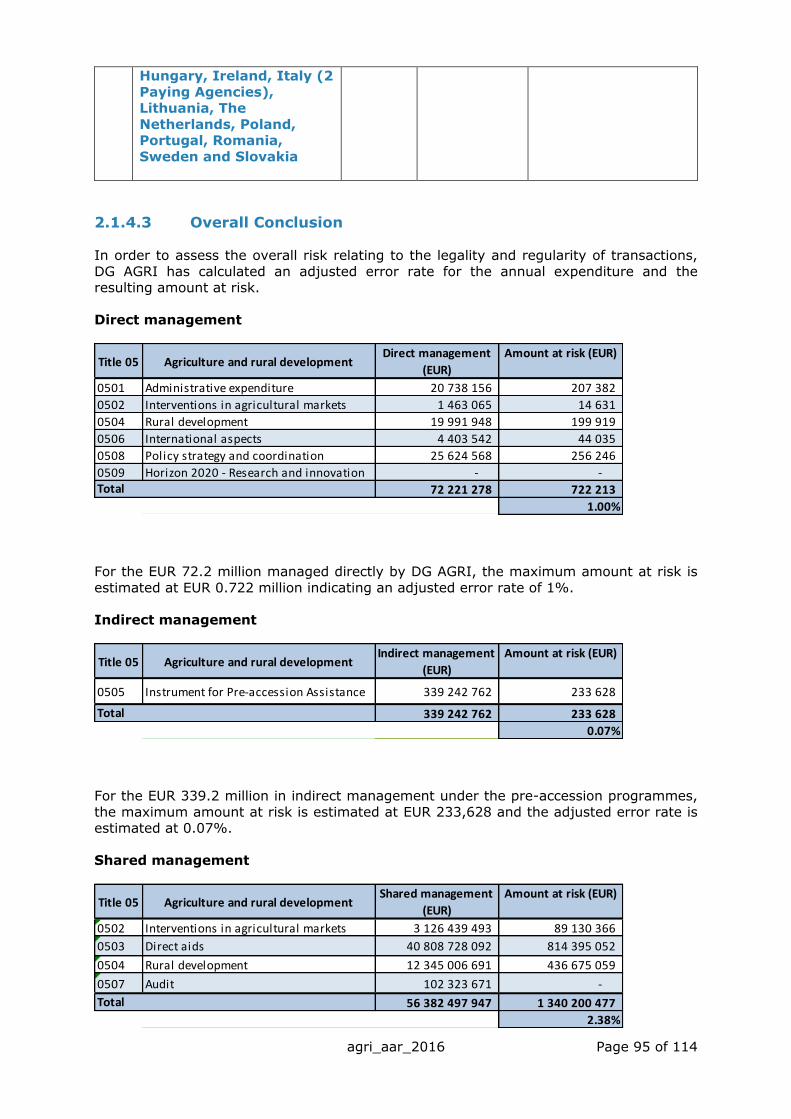
agri_aar_2016 Page 95 of 114
Hungary, Ireland, Italy (2
Paying Agencies), Lithuania, The
Netherlands, Poland, Portugal, Romania,
Sweden and Slovakia
2.1.4.3 Overall Conclusion
In order to assess the overall risk relating to the legality and regularity of transactions,
DG AGRI has calculated an adjusted error rate for the annual expenditure and the resulting amount at risk.
Direct management
For the EUR 72.2 million managed directly by DG AGRI, the maximum amount at risk is
estimated at EUR 0.722 million indicating an adjusted error rate of 1%.
Indirect management
For the EUR 339.2 million in indirect management under the pre-accession programmes,
the maximum amount at risk is estimated at EUR 233,628 and the adjusted error rate is estimated at 0.07%.
Shared management
Title 05 Agriculture and rural developmentDirect management
(EUR)
Amount at risk (EUR)
0501 Administrative expenditure 20 738 156 207 382
0502 Interventions in agricultural markets 1 463 065 14 631
0504 Rural development 19 991 948 199 919
0506 International aspects 4 403 542 44 035
0508 Policy strategy and coordination 25 624 568 256 246
0509 Horizon 2020 - Research and innovation - -
72 221 278 722 213
1.00%
Total
Title 05 Agriculture and rural developmentIndirect management
(EUR)
Amount at risk (EUR)
0505 Instrument for Pre-accession Assistance 339 242 762 233 628
339 242 762 233 628
0.07%
Total
Title 05 Agriculture and rural developmentShared management
(EUR)
Amount at risk (EUR)
0502 Interventions in agricultural markets 3 126 439 493 89 130 366
0503 Direct aids 40 808 728 092 814 395 052
0504 Rural development 12 345 006 691 436 675 059
0507 Audit 102 323 671 -
56 382 497 947 1 340 200 477
2.38%
Total
agri_aar_2016 Page 96 of 114
The amount at risk for the funds under shared management is estimated at
EUR 1 340.2 million, corresponding to an adjusted error rate of 2.38%. This amount at
risk is the Director General's best, conservative estimate of the amount of expenditure authorised in 2016 which may relate to underlying transactions made by the Member
States which are not in conformity with the applicable regulatory provisions.
In addition, a reservation related to the compliance of some voluntary coupled support
measures implemented in 8 Member States reflects the specificities of this issue which shall be distinguished from the overall assurance established on the effectiveness of the
control systems implemented by the Paying Agencies. At this stage of the on-going conformity clearance procedures the reservation cannot be quantified.
Reservations are targeted at the Paying Agencies or aid schemes where the specific deficiencies have been identified. In total there are 53 targeted reservations (14 for
Market Measures, 19 for Direct Payments, 20 for Rural Development and none for
IPARD). In all cases, the expenditure by the Paying Agencies concerned is placed under reinforced scrutiny by DG AGRI: conformity clearance procedures to ultimately protect
the EU budget, monitoring of the implementation of remedial actions to be taken by Member States and, where necessary, interruption or reduction/suspension of payments
to the Member States. This systematic and precisely targeted approach enables the Director General to state that he has sufficient assurance that the situation is under
control: there are some problems in the payments to the beneficiaries, but they have been identified, are being tackled and ultimately the EU budget is protected.

agri_aar_2016 Page 97 of 114
CAP
Based on the relevant expenditure, which includes pre-financing amounts paid by the
Commission in previous years but cleared in 2016, and excluding the prefinancing paid
by the Commission in 2016, the overall situation is as follows75:
Extract from table 2.1.1.2.2.-18
For both EAGF and EAFRD, action plans by Member States have proven to be an effective
tool to remedy the weaknesses identified in management and control systems. The Commission will continue to encourage and support Member States in their
implementation in all areas of the CAP, and to reduce or suspend payments in cases where Member States fail in implementing them.
For direct payments, the increase compared to last year in the adjusted error rate (from
1.37 % to 1.996%) and the number of Paying Agencies under reservation (from 10 to 18) results from some difficulties experienced by Member States with the first year of
implementation of the new direct payments, including greening. However, the overall result confirms that, even in such challenging circumstances with higher inherent risks,
the Integrated Administration and Control System (IACS), when implemented in accordance with applicable rules and guidelines, limits effectively the risk of irregular
expenditure.
Rural Development remains an area which merits very close scrutiny with an error rate of
3.533% for payments to Member States in 2016. When considering only the EU
expenditure related to Member States payments to beneficiaries76, including closure balances paid in 2016 for the 2017-2013 programming period, the adjusted error rate
would be 3.863%. When also including the pre-financing amounts paid in previous years and cleared in 2016, the adjusted error rate for the relevant expenditure is 3.908 %.
Taking into account the need to balance legality and regularity with the achievements of policy objectives while bearing in mind the delivery costs, it cannot be expected with any
real certainty that an error rate for payments to beneficiaries below 2% would be attainable with reasonable efforts for Rural Development. However, when taking into
75 The overall situation for CAP when using Key Performance Indicator No 5 on error rate and corrective
capacity is presented in Part 3.4 of Annexe 10. 76 Pre-financing amounts paid by the Commission to the Member States in 2016 are excluded from the
calculation as they do not entail any risk.
million EUR % million EUR % million EUR million EUR
0502 Interventions in Agricultural Markets 3 126.44 2.851% 89.13
0503 Direct payments 40 808.73 1.996% 814.40
EAGF total 43 935.17 2.056% 903.53 2.05% 901.82 1.71
0504 Rural development 13 181.72 3.908% 515.10 2.06% 271.56 243.54
0507 Audit 102.32 0% 0.00 0.00
0505 Pre-accession Measures 263.09 0.090% 0.24 0.24
0501 Administrative expenditure
0502 Interventions in agricultural markets
0504 Rural development
0506 International aspects
0508 Policy strategy and coordination
0509 Horizon 2020 - Research and innovation
57 552.75 2.467% 1 419.57 2.04% 1 173.38 246.19
0.43%
Average
recoveries and
corrections (in
% of relevant
expenditure)
Corrective
capacity
1.000% 0.70
Relevant
expenditure
Adjusted
error rate
Estimated
final amount
at risk
SHARED MANAGEMENT
INDIRECT MANAGEMENT
DIRECT MANAGEMENT
0.70
Estimated
amount at risk
at payment
Total
70.45

agri_aar_2016 Page 98 of 114
account the corrective capacity, there is sufficient assurance that the residual risk to the EU budget is below materiality.
For the overall CAP expenditure, the corrective capacity from net financial corrections by
the Commission and recoveries by the Member States is estimated at EUR 1 173.4 million or 2.04% of 2016 relevant expenditure. It allows the Director General to conclude
with sufficient assurance that with the adjusted error rate for the CAP being at 2.467% the remaining overall financial risk to the EU budget, after all corrective action will have
taken place, is significantly below materiality.
When considering all identified risks on relevant expenditure, including pre-financing
amounts paid in previous years and cleared in 2016, and after deducting the corrective capacity of ex-post controls by Member States and financial corrections by the
Commission, the final error rate (or "error rate at closure") is estimated at 0.43 %.
In conclusion, management has reasonable assurance that, overall, suitable controls are
in place and working as intended; risks are being appropriately monitored and mitigated;
and necessary improvements and reinforcements are being implemented. The Director General, in his capacity as Authorising Officer by Delegation has signed the Declaration of
Assurance albeit qualified by reservations.
2.1.5 Declaration of Assurance and reservations

agri_aar_2016 Page 99 of 114
DECLARATION OF ASSURANCE
I, the undersigned, Jerzy Plewa
Director-General of the Directorate-general for Agriculture and Rural Development
In my capacity as authorising officer by delegation
Declare that the information contained in this report gives a true and fair view77.
State that I have reasonable assurance that the resources assigned to the activities
described in this report have been used for their intended purpose and in accordance with the principles of sound financial management, and that the control procedures put in
place give the necessary guarantees concerning the legality and regularity of the underlying transactions.
This reasonable assurance is based on my own judgement and on the information at my disposal, such as the results of the self-assessment, ex-post controls, the limited
conclusion of the Internal Auditor on the state of control, the observations of the Internal
Audit and the lessons learnt from the reports of the Court of Auditors for years prior to the year of this declaration.
Confirm that I am not aware of anything not reported here which could harm the interests of the institution.
However the following reservations should be noted:
ABB02 – Expenditure on Market Measures: 7 aid schemes, comprising 8
Member States (14 elements of reservation): Belgium, France (for 4 aid schemes), Greece (for 2 aid schemes), Hungary, Italy (for 2 aid schemes), the
Netherlands, Poland (for 2 aid schemes) and Spain
ABB03 – Expenditure on Direct payments: 18 Paying Agencies, comprising 12 Member States: Bulgaria, Cyprus, Denmark, France, Hungary,
Italy (7 Paying Agencies), Poland, Portugal, Romania, Spain, Sweden and the United Kingdom and one unquantified reservation for voluntary coupled
support in 8 Member States: France, Greece, Ireland, Italy, Lithuania, Malta, Poland and Romania
ABB04 – Rural development expenditure: 20 Paying Agencies, comprising 19 Member States: Belgium, Bulgaria, Czech Republic, Germany (1 Paying
Agency), Denmark, Spain (1 Paying Agency), France, UK (1 Paying Agency),
Greece, Hungary, Ireland, Italy (2 Paying Agencies), Lithuania, The Netherlands, Poland, Portugal, Romania, Sweden and Slovakia
Brussels, 4 May 2017
Jerzy PLEWA
77 True and fair in this context means a reliable, complete and correct view on the state of affairs in the DG.

agri_aar_2016 Page 100 of 114
Reservation 1 ABB02 – Expenditure on Market Measures: 7 aid schemes, comprising 8 Member States (14 elements of reservation): Belgium, France (for
4 aid schemes), Greece (for 2 aid schemes), Hungary, Italy (for 2 aid schemes),
the Netherlands, Poland (for 2 aid schemes) and Spain
DG Agriculture and Rural Development
Title of the reservation, including its
scope
Expenditure on Market Measures for fruit and vegetables operational
programmes for producer organisations in Belgium, France, Italy,
Greece, Netherlands and Spain; pre-recognition for producer groups in Poland; temporary exceptional support measures in the fruit and
vegetables sector in Poland; temporary exceptional measure for milk and milk products in France; promotion measures in Greece and Italy;
wine measures in Hungary and France; POSEI measures in France.
Domain Shared Management – European Agricultural Guarantee Fund
Programme and amount affected
(="scope")
ABB02: Market Measures
Expenditure in 2016 was EUR 3 127.9 million.
The amount managed by the Member States with a reservation and
put under reinforced scrutiny is EUR 1 394 million. The actual exposure/amount at risk for the expenditure under
reservation is EUR 66.1 million.
Reason for the reservation
The reservation is made due to the significant occurrence of weaknesses in the underlying transactions (legality and regularity).
In the case of the 6 reservations for fruit and vegetable operational programmes, problems have been identified by the DG AGRI audit
services in the recognition criteria applied by the Member States concerned (Belgium, France, Greece, Italy, Netherlands and
Spain) resulting in ineligible expenditure.
For the fruit and vegetables aid for producer groups, DG AGRI audit services have detected serious structural deficiencies in the approval
procedures applied by Poland.
For the temporary exceptional support measures in the fruit and
vegetables sector in Poland, DG AGRI audit services detected, in 2016, deficiencies in the checks on withdrawal operations as well as on
eligibility of operations.
For the temporary exceptional support measures for milk and milk
products, the Certification Body identified errors in France.
In the case of two reservations for promotion measures, DG AGRI services identified deficiencies pertaining to controls on the selection
procedure of implementing bodies (Greece) and non-compliance with procurement procedures (Italy).
In the case of two reservations (Hungary and France) for investment
measures for wine, the Certification Body has reported errors for wine restructuring.
For POSEI measures, the Certification Body identified errors in respect of local support measures in France.
Materiality criterion/criteria
DG AGRI's materiality criteria related to the legality and regularity of
the transactions was breached in the above cases.
In the cases where the error rate is above 5% (17) they were
automatically subject to reservation except where (in 7 out of the 17
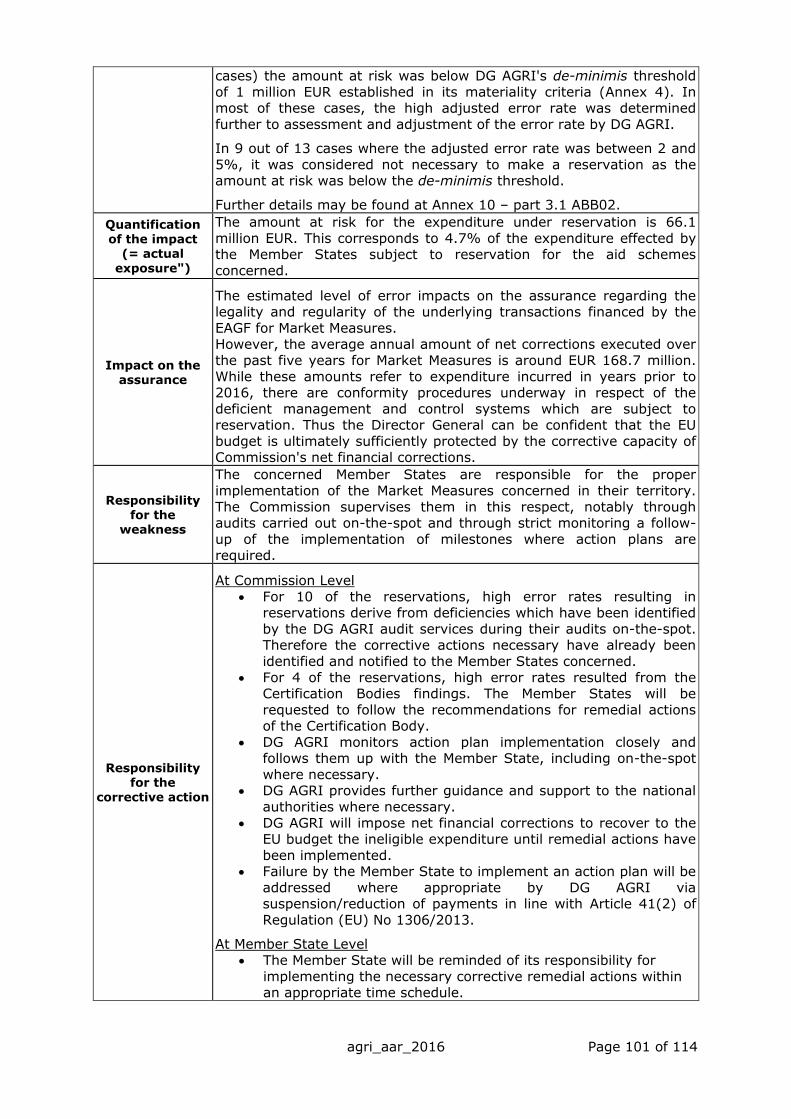
agri_aar_2016 Page 101 of 114
cases) the amount at risk was below DG AGRI's de-minimis threshold
of 1 million EUR established in its materiality criteria (Annex 4). In most of these cases, the high adjusted error rate was determined
further to assessment and adjustment of the error rate by DG AGRI.
In 9 out of 13 cases where the adjusted error rate was between 2 and
5%, it was considered not necessary to make a reservation as the amount at risk was below the de-minimis threshold.
Further details may be found at Annex 10 – part 3.1 ABB02.
Quantification
of the impact (= actual
exposure")
The amount at risk for the expenditure under reservation is 66.1
million EUR. This corresponds to 4.7% of the expenditure effected by the Member States subject to reservation for the aid schemes
concerned.
Impact on the assurance
The estimated level of error impacts on the assurance regarding the legality and regularity of the underlying transactions financed by the
EAGF for Market Measures. However, the average annual amount of net corrections executed over
the past five years for Market Measures is around EUR 168.7 million.
While these amounts refer to expenditure incurred in years prior to 2016, there are conformity procedures underway in respect of the
deficient management and control systems which are subject to reservation. Thus the Director General can be confident that the EU
budget is ultimately sufficiently protected by the corrective capacity of Commission's net financial corrections.
Responsibility for the
weakness
The concerned Member States are responsible for the proper
implementation of the Market Measures concerned in their territory.
The Commission supervises them in this respect, notably through audits carried out on-the-spot and through strict monitoring a follow-
up of the implementation of milestones where action plans are required.
Responsibility for the
corrective action
At Commission Level
For 10 of the reservations, high error rates resulting in reservations derive from deficiencies which have been identified
by the DG AGRI audit services during their audits on-the-spot. Therefore the corrective actions necessary have already been
identified and notified to the Member States concerned.
For 4 of the reservations, high error rates resulted from the Certification Bodies findings. The Member States will be
requested to follow the recommendations for remedial actions of the Certification Body.
DG AGRI monitors action plan implementation closely and follows them up with the Member State, including on-the-spot
where necessary. DG AGRI provides further guidance and support to the national
authorities where necessary.
DG AGRI will impose net financial corrections to recover to the EU budget the ineligible expenditure until remedial actions have
been implemented. Failure by the Member State to implement an action plan will be
addressed where appropriate by DG AGRI via suspension/reduction of payments in line with Article 41(2) of
Regulation (EU) No 1306/2013.
At Member State Level
The Member State will be reminded of its responsibility for
implementing the necessary corrective remedial actions within an appropriate time schedule.
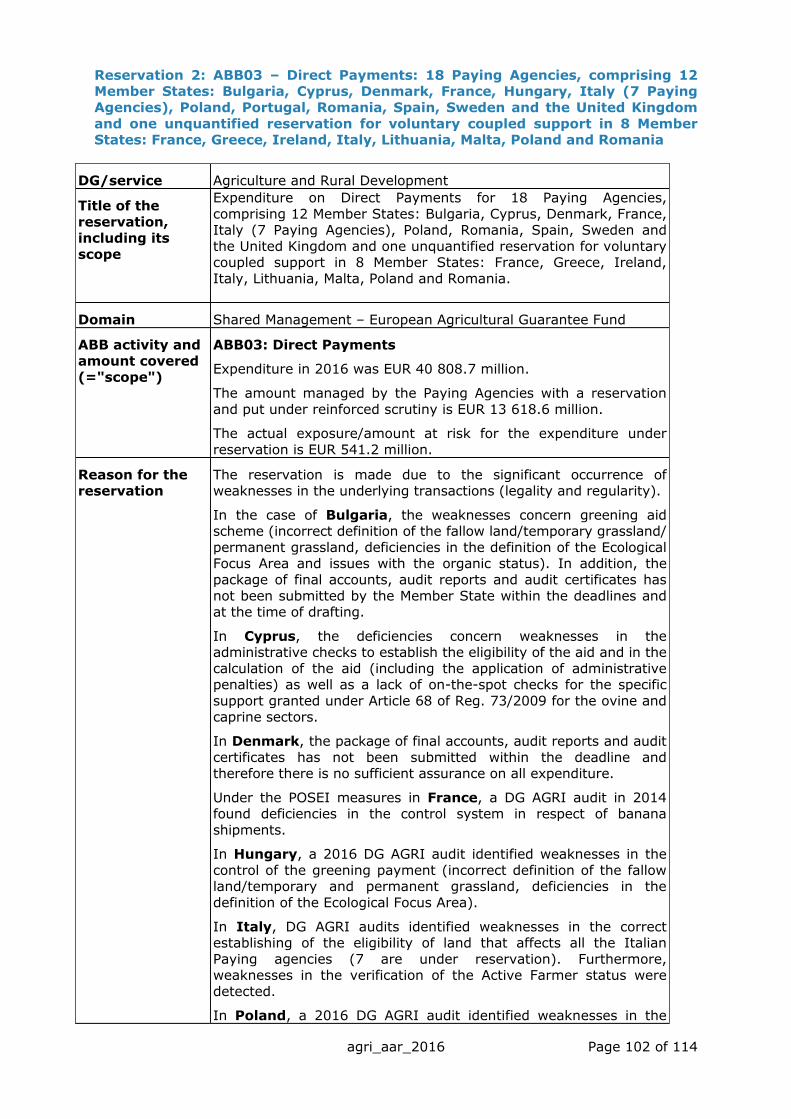
agri_aar_2016 Page 102 of 114
Reservation 2: ABB03 – Direct Payments: 18 Paying Agencies, comprising 12 Member States: Bulgaria, Cyprus, Denmark, France, Hungary, Italy (7 Paying
Agencies), Poland, Portugal, Romania, Spain, Sweden and the United Kingdom
and one unquantified reservation for voluntary coupled support in 8 Member States: France, Greece, Ireland, Italy, Lithuania, Malta, Poland and Romania
DG/service Agriculture and Rural Development
Title of the
reservation, including its
scope
Expenditure on Direct Payments for 18 Paying Agencies,
comprising 12 Member States: Bulgaria, Cyprus, Denmark, France, Italy (7 Paying Agencies), Poland, Romania, Spain, Sweden and
the United Kingdom and one unquantified reservation for voluntary coupled support in 8 Member States: France, Greece, Ireland,
Italy, Lithuania, Malta, Poland and Romania.
Domain Shared Management – European Agricultural Guarantee Fund
ABB activity and amount covered
(="scope")
ABB03: Direct Payments
Expenditure in 2016 was EUR 40 808.7 million.
The amount managed by the Paying Agencies with a reservation
and put under reinforced scrutiny is EUR 13 618.6 million.
The actual exposure/amount at risk for the expenditure under
reservation is EUR 541.2 million.
Reason for the reservation
The reservation is made due to the significant occurrence of weaknesses in the underlying transactions (legality and regularity).
In the case of Bulgaria, the weaknesses concern greening aid scheme (incorrect definition of the fallow land/temporary grassland/
permanent grassland, deficiencies in the definition of the Ecological Focus Area and issues with the organic status). In addition, the
package of final accounts, audit reports and audit certificates has
not been submitted by the Member State within the deadlines and at the time of drafting.
In Cyprus, the deficiencies concern weaknesses in the administrative checks to establish the eligibility of the aid and in the
calculation of the aid (including the application of administrative penalties) as well as a lack of on-the-spot checks for the specific
support granted under Article 68 of Reg. 73/2009 for the ovine and caprine sectors.
In Denmark, the package of final accounts, audit reports and audit
certificates has not been submitted within the deadline and therefore there is no sufficient assurance on all expenditure.
Under the POSEI measures in France, a DG AGRI audit in 2014 found deficiencies in the control system in respect of banana
shipments.
In Hungary, a 2016 DG AGRI audit identified weaknesses in the
control of the greening payment (incorrect definition of the fallow land/temporary and permanent grassland, deficiencies in the
definition of the Ecological Focus Area).
In Italy, DG AGRI audits identified weaknesses in the correct establishing of the eligibility of land that affects all the Italian
Paying agencies (7 are under reservation). Furthermore, weaknesses in the verification of the Active Farmer status were
detected.
In Poland, a 2016 DG AGRI audit identified weaknesses in the

agri_aar_2016 Page 103 of 114
control of the greening payments.
In Portugal, a 2015 DG AGRI audit identified weaknesses in the correct establishing of the eligibility of the land.
In Romania, a 2016 DG AGRI audit found that the two estimated
amounts per hectare to be granted to the farmers is not properly justified. Deficiencies were also found in the ceiling for the
redistributive payments. Based on the Certification Body's report the error amount was adjusted.
In the United Kingdom (Scotland), a 2016 audit by DG AGRI found weaknesses in the management of the national reserve.
Furthermore, the Certification Body did not confirm the control statistics.
In the case of the Spain (Valencia) reservation the adjusted error
rate is only based on the control data reported by the Member State.
In Sweden, a 2016 DG AGRI audit identified weaknesses in the correct establishing of the eligibility of the land. A further DG AGRI
audit identified weakness in the performance of the administrative and on the spot controls for the support granted in the bovine
sector under the VCS schemes.
In the cases of France, Greece, Ireland, Italy, Lithuania,
Malta, Poland and Romania, review of the notifications of
voluntary coupled support measures has raised questions on their compliance with the condition that such support can only be
granted to sectors or regions in difficulties and to the extent necessary to maintain the level of production. DG AGRI has opened
8 conformity clearance procedures but at this stage the EU financial risk is not quantified.
Materiality
criterion/criteria DG AGRI's materiality criteria related to the legality and regularity
of the transactions was breached in the above cases.
Two Paying Agencies had an adjusted error rate above 5%.
For the 22 Paying Agencies with an error rate between 2 and 5%,
an examination was carried out of any risk mitigating factors. In 6 out of the 22 cases it was considered that it would not be
necessary to make reservations, because remedial actions had been taken by the Member State in due time (Greece), the
amount at risk is below de minimis threshold (Italy Trento, Spain Baleares) and because the Member State is addressing the causes
underlying the error rate reported in the control statistics (Estonia, Spain - Andalucía and FOGGA).
Further details may be found at Annex 10 – part 3.2 ABB03.
Quantification of
the impact (= actual
exposure")
The amount at risk for the expenditure under reservation is 541.2
million EUR. This corresponds to 4% of the expenditure effected by the Paying Agencies subject to reservation for the entire ABB
activity.
Impact on the assurance
The estimated level of error impacts on the assurance regarding the legality and regularity of the underlying transactions financed
by the EAGF for Direct Payments.
However, the average annual amount of net corrections executed
over the past five years for direct aid was EUR 626.5 million. While
these amounts refer to expenditure incurred in years prior to 2016, there are conformity procedures underway in respect of the

agri_aar_2016 Page 104 of 114
deficient management and control systems which are subject to
reservation. Thus the Director General can be confident that the EU budget is ultimately sufficiently protected by the corrective
capacity of Commission's net financial corrections.
Responsibility
for the weakness The concerned Member States and Paying Agencies are responsible
for the proper implementation of the Direct Payments schemes concerned in their territory. The Commission supervises them in
this respect, notably through audits carried out on-the-spot and through strict monitoring a follow-up of the implementation of
milestones where action plans are required.
Responsibility for the
corrective action
At Commission level
For all of the Paying Agencies concerned by the
reservations, the deficiencies concerned had already been
identified by the DG AGRI audit services during their audits on-the-spot. Therefore the corrective actions necessary
have already been identified and notified to the Member States concerned.
DG AGRI monitors action plan implementation closely and follows them up with the Member State, including on-the-
spot where necessary.
DG AGRI provides further guidance and support to the
national authorities where necessary
DG AGRI will impose net financial corrections to recover to the EU budget the ineligible expenditure until remedial
actions have been implemented.
Failure by the Member State to implement an action plan
will be addressed where appropriate by DG AGRI via suspension/reduction of payments in line with Article 41(2)
of Regulation 1306/2013.
At Member State level
The Member State is responsible for implementing the
necessary corrective actions within an appropriate time schedule.
The Member State is required to report regularly on progress milestones in line with the agreed schedule.
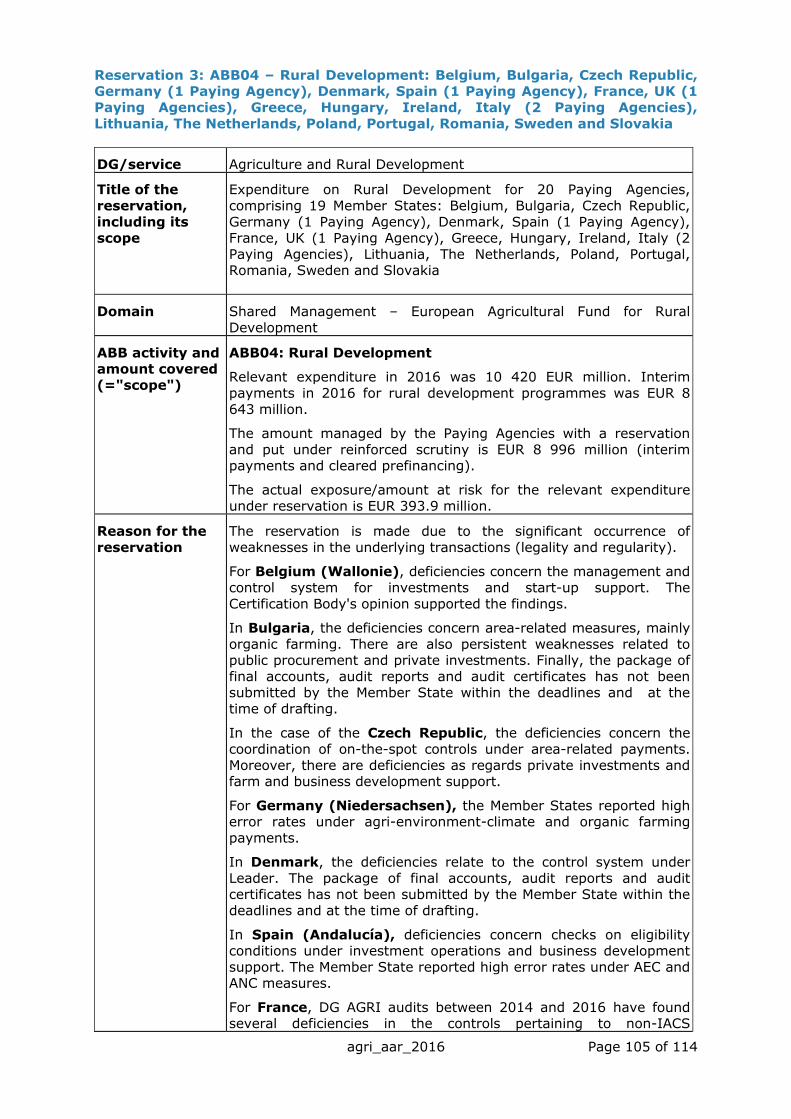
agri_aar_2016 Page 105 of 114
Reservation 3: ABB04 – Rural Development: Belgium, Bulgaria, Czech Republic, Germany (1 Paying Agency), Denmark, Spain (1 Paying Agency), France, UK (1
Paying Agencies), Greece, Hungary, Ireland, Italy (2 Paying Agencies),
Lithuania, The Netherlands, Poland, Portugal, Romania, Sweden and Slovakia
DG/service Agriculture and Rural Development
Title of the
reservation,
including its scope
Expenditure on Rural Development for 20 Paying Agencies,
comprising 19 Member States: Belgium, Bulgaria, Czech Republic,
Germany (1 Paying Agency), Denmark, Spain (1 Paying Agency), France, UK (1 Paying Agency), Greece, Hungary, Ireland, Italy (2
Paying Agencies), Lithuania, The Netherlands, Poland, Portugal, Romania, Sweden and Slovakia
Domain Shared Management – European Agricultural Fund for Rural
Development
ABB activity and amount covered
(="scope")
ABB04: Rural Development
Relevant expenditure in 2016 was 10 420 EUR million. Interim
payments in 2016 for rural development programmes was EUR 8
643 million.
The amount managed by the Paying Agencies with a reservation
and put under reinforced scrutiny is EUR 8 996 million (interim payments and cleared prefinancing).
The actual exposure/amount at risk for the relevant expenditure under reservation is EUR 393.9 million.
Reason for the
reservation The reservation is made due to the significant occurrence of
weaknesses in the underlying transactions (legality and regularity).
For Belgium (Wallonie), deficiencies concern the management and
control system for investments and start-up support. The
Certification Body's opinion supported the findings.
In Bulgaria, the deficiencies concern area-related measures, mainly
organic farming. There are also persistent weaknesses related to public procurement and private investments. Finally, the package of
final accounts, audit reports and audit certificates has not been submitted by the Member State within the deadlines and at the
time of drafting.
In the case of the Czech Republic, the deficiencies concern the
coordination of on-the-spot controls under area-related payments.
Moreover, there are deficiencies as regards private investments and farm and business development support.
For Germany (Niedersachsen), the Member States reported high error rates under agri-environment-climate and organic farming
payments.
In Denmark, the deficiencies relate to the control system under
Leader. The package of final accounts, audit reports and audit certificates has not been submitted by the Member State within the
deadlines and at the time of drafting.
In Spain (Andalucía), deficiencies concern checks on eligibility conditions under investment operations and business development
support. The Member State reported high error rates under AEC and ANC measures.
For France, DG AGRI audits between 2014 and 2016 have found several deficiencies in the controls pertaining to non-IACS
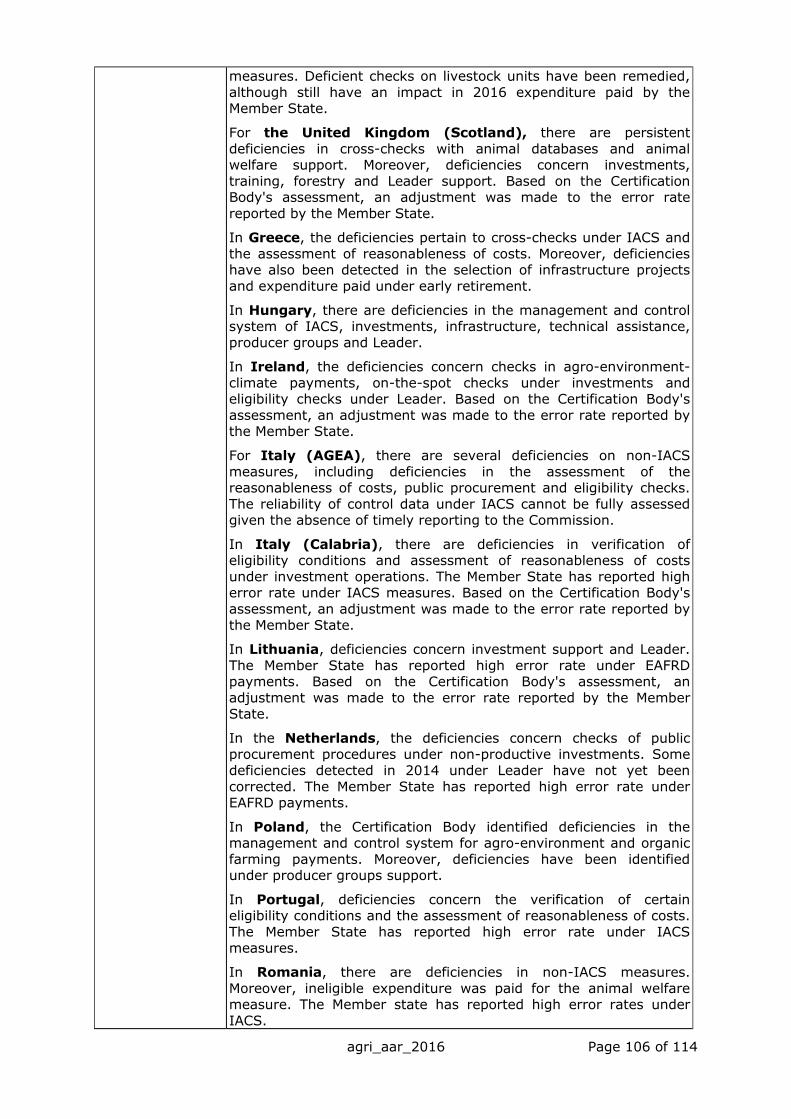
agri_aar_2016 Page 106 of 114
measures. Deficient checks on livestock units have been remedied,
although still have an impact in 2016 expenditure paid by the Member State.
For the United Kingdom (Scotland), there are persistent
deficiencies in cross-checks with animal databases and animal welfare support. Moreover, deficiencies concern investments,
training, forestry and Leader support. Based on the Certification Body's assessment, an adjustment was made to the error rate
reported by the Member State.
In Greece, the deficiencies pertain to cross-checks under IACS and
the assessment of reasonableness of costs. Moreover, deficiencies have also been detected in the selection of infrastructure projects
and expenditure paid under early retirement.
In Hungary, there are deficiencies in the management and control system of IACS, investments, infrastructure, technical assistance,
producer groups and Leader.
In Ireland, the deficiencies concern checks in agro-environment-
climate payments, on-the-spot checks under investments and eligibility checks under Leader. Based on the Certification Body's
assessment, an adjustment was made to the error rate reported by the Member State.
For Italy (AGEA), there are several deficiencies on non-IACS
measures, including deficiencies in the assessment of the reasonableness of costs, public procurement and eligibility checks.
The reliability of control data under IACS cannot be fully assessed given the absence of timely reporting to the Commission.
In Italy (Calabria), there are deficiencies in verification of eligibility conditions and assessment of reasonableness of costs
under investment operations. The Member State has reported high error rate under IACS measures. Based on the Certification Body's
assessment, an adjustment was made to the error rate reported by
the Member State.
In Lithuania, deficiencies concern investment support and Leader.
The Member State has reported high error rate under EAFRD payments. Based on the Certification Body's assessment, an
adjustment was made to the error rate reported by the Member State.
In the Netherlands, the deficiencies concern checks of public procurement procedures under non-productive investments. Some
deficiencies detected in 2014 under Leader have not yet been
corrected. The Member State has reported high error rate under EAFRD payments.
In Poland, the Certification Body identified deficiencies in the management and control system for agro-environment and organic
farming payments. Moreover, deficiencies have been identified under producer groups support.
In Portugal, deficiencies concern the verification of certain eligibility conditions and the assessment of reasonableness of costs.
The Member State has reported high error rate under IACS
measures.
In Romania, there are deficiencies in non-IACS measures.
Moreover, ineligible expenditure was paid for the animal welfare measure. The Member state has reported high error rates under
IACS.
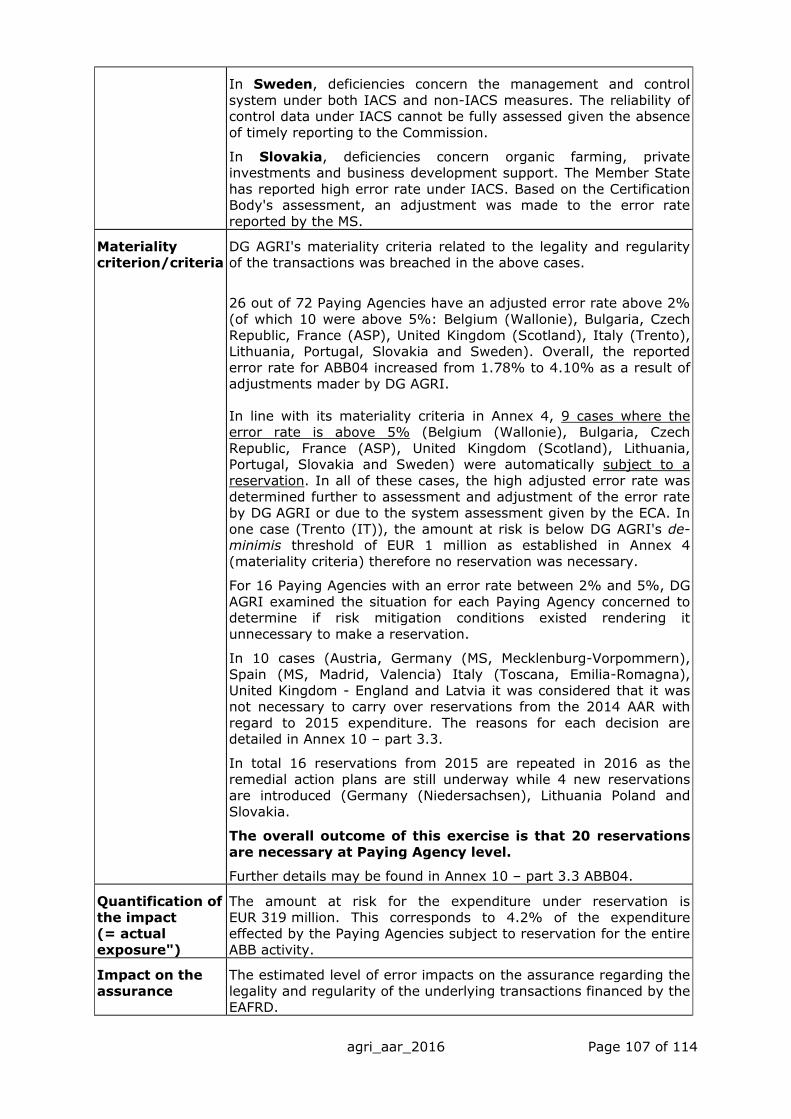
agri_aar_2016 Page 107 of 114
In Sweden, deficiencies concern the management and control
system under both IACS and non-IACS measures. The reliability of control data under IACS cannot be fully assessed given the absence
of timely reporting to the Commission.
In Slovakia, deficiencies concern organic farming, private investments and business development support. The Member State
has reported high error rate under IACS. Based on the Certification Body's assessment, an adjustment was made to the error rate
reported by the MS.
Materiality criterion/criteria
DG AGRI's materiality criteria related to the legality and regularity of the transactions was breached in the above cases.
26 out of 72 Paying Agencies have an adjusted error rate above 2%
(of which 10 were above 5%: Belgium (Wallonie), Bulgaria, Czech
Republic, France (ASP), United Kingdom (Scotland), Italy (Trento), Lithuania, Portugal, Slovakia and Sweden). Overall, the reported
error rate for ABB04 increased from 1.78% to 4.10% as a result of adjustments mader by DG AGRI.
In line with its materiality criteria in Annex 4, 9 cases where the error rate is above 5% (Belgium (Wallonie), Bulgaria, Czech
Republic, France (ASP), United Kingdom (Scotland), Lithuania, Portugal, Slovakia and Sweden) were automatically subject to a
reservation. In all of these cases, the high adjusted error rate was
determined further to assessment and adjustment of the error rate by DG AGRI or due to the system assessment given by the ECA. In
one case (Trento (IT)), the amount at risk is below DG AGRI's de-minimis threshold of EUR 1 million as established in Annex 4
(materiality criteria) therefore no reservation was necessary.
For 16 Paying Agencies with an error rate between 2% and 5%, DG
AGRI examined the situation for each Paying Agency concerned to determine if risk mitigation conditions existed rendering it
unnecessary to make a reservation.
In 10 cases (Austria, Germany (MS, Mecklenburg-Vorpommern), Spain (MS, Madrid, Valencia) Italy (Toscana, Emilia-Romagna),
United Kingdom - England and Latvia it was considered that it was not necessary to carry over reservations from the 2014 AAR with
regard to 2015 expenditure. The reasons for each decision are detailed in Annex 10 – part 3.3.
In total 16 reservations from 2015 are repeated in 2016 as the remedial action plans are still underway while 4 new reservations
are introduced (Germany (Niedersachsen), Lithuania Poland and
Slovakia.
The overall outcome of this exercise is that 20 reservations
are necessary at Paying Agency level.
Further details may be found in Annex 10 – part 3.3 ABB04.
Quantification of
the impact (= actual
exposure")
The amount at risk for the expenditure under reservation is
EUR 319 million. This corresponds to 4.2% of the expenditure effected by the Paying Agencies subject to reservation for the entire
ABB activity.
Impact on the
assurance The estimated level of error impacts on the assurance regarding the
legality and regularity of the underlying transactions financed by the EAFRD.

agri_aar_2016 Page 108 of 114
However, DG AGRI considers that consideration shall also be given
to the corrective capacity of the net financial corrections applied to claw back undue expenditure to the EU-budget. The average annual
amount of net corrections executed over the past five years for
Rural Development is around EUR 162.2 million. While these amounts refer to expenditure incurred in years prior to 2016, there
are conformity procedures underway in respect of the deficient management and control systems which are subject to reservation.
Additionally, average annual amount of recoveries from beneficiaries over the past five years for Rural Development is
EUR 109.3million.
Responsibility for the
weakness
The concerned Paying Agencies are responsible for the proper implementation of the rural development programmes in their
territory. The Commission supervises them in this respect, notably
through audits carried out on-the-spot and through strict monitoring a follow-up of the implementation of milestones where action plans
are required.
Responsibility for the
corrective action
Commission level
DG AGRI monitors action plan implementation closely and
follows them up with the Member State, including on-the-spot where necessary.
DG AGRI provides further guidance and support to the
national authorities where necessary.
DG AGRI will impose net financial corrections to recover to
the EU budget the ineligible expenditure until remedial actions have been implemented.
Where necessary DG AGRI will interrupt payments as provided by Article 36(7) of Regulation 1306/2013.
Failure by the Member State to implement an action plan will be addressed where appropriate by DG AGRI via
suspension/reduction of payments in line with Article 41(2)
of Regulation 1306/2013.
At Member State level
The Member State is responsible for implementing the necessary corrective actions within an appropriate time
schedule.
The Member State is required to report regularly on progress milestones in line with the agreed schedule.

agri_aar_2016 Page 109 of 114
2.2 Other organisational management dimensions
2.2.1 Human resource management
This year's achievements and performance needs to be seen in the context of the
Communication on Synergies and Efficiencies adopted in April 2016. It introduced substantial changes to the way that human resources and logistics services will be
delivered in the future. The New Service Delivery Model foresees reducing to a minimum staff and activities maintained in local DGs while transferring implementation of
processes and transactions to central services. 2016 was thus the last year that core HR activities such as organisation of the local learning and development offer, the
management of leave and absences, the support provided to units for the recruitment of officials and external staff, or the organisation of the yearly appraisal exercise or
welcoming newcomers were designed and implemented by the local HR unit. While DG
AGRI did not participate in the first pilot phase in 2016, the changes had to be anticipated and reflected in the design of the new organisation chart (cf. below).
As new priorities arise, pressure on resources increases. In line with the Commission decision on staff allocation in the Commission, a specific agreement was concluded in
March 2016 at political level, spelling out the conditions and components of staff reduction targets for DG AGRI until the end of 2018. The agreement also includes
further inter-DG synergy efforts, such as the transfer of staff with their activities and loans to other Commission services.
As a consequence of these cuts, the organisational structure needed to be adapted as
from January 2017. The reorganisation proposal is the result of an extensive staff consultation process with surveys at individual and unit level, contributions from staff
and management and substantial discussions at all levels. The restructuring leads to a reduction of six units and one directorate and the suppression of one DDG function in DG
AGRI. It streamlines the DG's structure and resources around core activities and aims at reaching efficiency gains through the rationalisation of certain administrative support
activities. A review of the financial management organisation in the DG and the centralisation of the organisation and meeting logistics will already put into practice on-
going discussions at corporate level on further synergies and efficiencies in these areas.
This reorganisation will allow DG AGRI to return the number of posts as agreed in the specific staff reduction agreement. The efforts made in 2016 were substantial, but first
instalments have been paid on time and the schedule agreed until end 2018 will be respected.
The situation for DG AGRI is challenging and staff reductions applied since 2012 are having a concrete and direct impact on workload and staff morale. Although staff
engagement figures in 2016 continue to be above the Commission average (65.5% in 2016 versus 64% in 2014), they are decreasing compared to past years and the
difference to the Commission average is less important. The implementation of the action
plan adopted following the 2014 staff survey remains therefore a priority, and 2016 has seen several initiatives in this context, for example the organisation of the very popular
DG AGRI Health Days.
The reduced job market within DG AGRI resulting from a low number of vacancies, and
targeted calls for DGs with reinforcement needs (e.g. HOME, ECHO) temporarily put on hold DG AGRI's internal mobility policy and accompanying measures planned for 2016.
Instead, the focus was put on supporting staff in their career development e.g. with the organisation of the very successful DG AGRI Career Weeks.
2016 was also the first exercise of the inter-DG mobility for middle managers. Five
Heads of unit were closely accompanied in their search for a new posting in another DG. Correspondingly, five units had to be identified for recruiting Heads of unit from another
DG. This was a particular challenge in the context of the reorganisation. Particular attention was put on the evolution of DG AGRI's female representation rate in
management. The positive trend (29.8% on 31/12/2016 versus 24% on 1/11/2014) could lead towards achievement of DG AGRI's target in 2019 (35% of female middle

agri_aar_2016 Page 110 of 114
management) under the condition that this momentum is maintained after the reorganisation and during the second inter-DG mobility exercise for middle managers.
2.2.2 Better regulation
During 2016, further progress has been made in the completion of the Monitoring and
Evaluation framework of the CAP. First datasets have been published, and gradually more information will become available. These data will feed into the evaluations carried out
for DG AGRI.
Moreover, the DG AGRI multi-annual studies and evaluation plan has been thoroughly
revised. The scope and planned content for all studies and evaluations in the plan were screened and where necessary adjustments for were made to ensure a better fit with the
political priorities of the Commission, the work of DG AGRI and the better regulation
guidelines. This work led to the replacement and/or rescheduling of some studies and evaluations foreseen for 2016 and following years. More details can be found in
Annex 9.
Moreover, to facilitate procurement and ensure methodological consistency across
different evaluations, calls for tenders were launched for 4 framework contracts.
No evaluations were finalised in 2016, yet, several studies78 were finalised:
- Mapping and analysis of the implementation of the CAP
- Study of the implementation of the European Innovation Partnership (EIP) for
agricultural productivity and sustainability
- Study on the impacts of EU trade agreements on the agricultural sector
- Study on the distribution of the added value of the organic food chain
- Study on agricultural interbranch organisations in the EU
- Study on state of play of processing technologies and the absorption of water in
poultrymeat
- Preparatory action on EU plant and animal genetic resources.
The summary of these studies is available in Annex 9.
Simplification
As a follow up of the 2015 screening exercise of the entire agricultural acquis, in 2016
several simplification changes have been introduced in Delegated and Implementing Acts, in particular:
With regard to the IACS, the following simplifications were carried out (among others):
- introduction of preventive preliminary cross checks;
- improved conditions for reducing on-the-spot checks;
- improved sample selection to reduce the number of on-the-spot checks; and
- introduction of a 'yellow card' system within the BPS and the SAPS for first-time
78 The studies "mapping and analysis of the implementation of the CAP" and "implementation of the European
Innovation Partnership (EIP) for agricultural productivity and sustainability were initially scheduled as
"evaluation", yet following the adoption of the better regulation guidelines rescheduled as study. They are
indeed forward-looking focus, screening exercises rather than analysis of past performance.
agri_aar_2016 Page 111 of 114
offenders79.
In the area of the CMO, several sector-specific rules have been simplified (e.g. in relation
to public intervention, private storage and trade mechanisms – licences). These
simplifications have been carried out in the framework of the alignment of the Commission-level regulations to the Lisbon Treaty. The alignment exercise will help to
cut the number of regulations from more than 200 to 40. At this stage 19 new legal acts have been published in the Official Journal, 30 regulations have been repealed as a
consequence of the above activity and 57 regulations have been declared obsolete.
Changes to the 4 basic acts of the CAP for the purpose of simplification (including
flexibility and subsidiarity) were proposed in the framework of the Proposal for a Regulation of the European Parliament and of the Council on the financial rules applicable
to the general budget of the Union (the so called "Omnibus Regulation"). These proposals directly follow from the comprehensive screening of the CAP legislation in 2015 and
concentrate on support for rural development (e.g. to boost the use of financial
instruments), and on direct payments (with simplifications of the rules on active farmers and young farmers).
A review of certain "greening" rules after the first year of their application was carried out during 2016, in order to identify inter alia needs for simplification.
The work of the REFIT-Platform which adopted 5 Opinions in the area of Agriculture in 2016 was also closely followed up.
2.2.3 Information management aspects
Where information sharing within the DG and throughout the Commission is concerned, AGRI has continued to raise awareness on the need to protect sensitive
information by the use of markings in order to reinforce restrictions on sensitive documents and improve security.
An awareness-raising campaign on the prevention of leakage of documents and information has taken place, in order to promote awareness about the rules and foster
appropriate behaviour among all colleagues through brainstorming sessions in several unit meetings. A presentation on this topic has been made in DG AGRI's communication
correspondents' network meeting and all units were requested to include the point in
their unit meeting agendas.
Knowledge Management is also one of the key axes of the 'DG AGRI 2016-2020 IT
strategy', to foster efficient usage of expertise and hence decreasing the effect of staff reduction and turnover.
In this context, a single documentation tool to manage knowledge on all relevant EAFRD Regulations, guidance fiches, Q&A and interpretation within the RDIS2 system has been
extended to unleash collaboration between policy officers around the elaboration of EAFRD guidance documents, interpretations and clarifications, making them accessible
online in one place.
Important focus has also been given to the Data Management aspects. In order to support a more efficient and effective organisation, an exercise was launched in 2016 to
coordinate the improvement of data management in DG AGRI in a pragmatic and low resource-consuming way. This exercise involved all Directorates and resulted in the
identification of key actions, which have been included where appropriate in the relevant IT project work plans.
79 Under this system, in the case of a minor over-declaration the administrative penalty is reduced by 50%.
agri_aar_2016 Page 112 of 114
2.2.4 External communication activities
All external communications actions included in DG AGRI's 2016 External Communication
Plan (Ares(2016)2021459) have been implemented as foreseen.
In particular:
- 18 grants have been awarded following the annual call for proposals for
information measures on the CAP conducted by third parties which act as multipliers in reaching in particular the general public;
- two major Conferences have been organised, one on the "future of the Rural Development component of the CAP-Cork II" and a second one on the "EU
agricultural outlook";
- DG AGRI participated in 3 major agricultural fairs with a joint stand with DG
SANTE and MARE;
- the Ag-press networking activities and the media and web based communication have been consolidated and enhanced;
- an "edutainment pack" on agriculture and the CAP for school children has been produced;
- DG AGRI participated in the development and implementation of the DG COMM 2016 corporate communication campaign;
- DG AGRI also participated in the work on the digital transformation of the European Commission web presence.
For an extensive reporting on all components of this part 2.2, please refer to Annex 2.
agri_aar_2016 Page 113 of 114
Other organisational achievements in 2016
Closure of 2007-2013 Rural Development Programmes
In 2016 DG AGRI succeeded to close 64 out of 92 rural development programmes of the 2007-2013 programming period. As set out in Annex III of Commission Implementing
Decision (EU) 2016/2113, for 58 programmes the final balance was positive, in total by € 2.66 billion, which were all reimbursed to the Member States by the end of 2016. For six
programmes the final balance was negative, in total by € 22 million, to be recovered from the Member States concerned.
The average financial implementation rate for the 64 closed programmes reached outstanding 99.1%, where € 64.2 billion out of € 64.8 billion of available funds for the
programmes concerned were consumed. This shows that the rural development
programmes were well planned and struck an excellent balance with the available funding.
In its special report No 36/2016 "an assessment of the arrangements for closure of the
2007-2013 cohesion and rural development programmes" the European Court of Auditors largely recognised that DG AGRI was well prepared for the closure process.
DG AGRI will continue in 2017 its efforts with the Member States authorities to clear all the remaining annual accounts and close the last 28 programmes as soon as possible.
Greening implementation at full speed
2016 is the second year in which the new structure of direct payments (including the
greening payment) is implemented. On the administrative level, the Commission services
have since 2014 actively assisted Member States in the challenge of preparing and implementing direct payments with guidance documents for instance on permanent
grassland, technical discussions in expert group meetings and by delivering exhaustive replies to Member States queries. Different notifications from the 28 Member States (on
EFA, equivalence and permanent grassland,) have undergone a thorough assessment and led to sending concerned Member States feedback. In the 1st quarter of 2016 the
Commission had the opportunity to use expert groups as a forum to share best practices between Member States as regards implementation. An ad-hoc expert group was organized
before the greening review to have an exchange with Member States on simplification.

agri_aar_2016 Page 114 of 114
Examples of economy and efficiency
e-Market Dashboards Initiative
Access to accurate information, transparency and prompt publication are key elements to make informed decisions and deal better with agricultural markets’
volatility. With ISAMM (Information System for Agricultural Market Management and
Monitoring), DG AGRI has focused on the development of a robust, sound and user
friendly price and market monitoring information & reporting IT tool through the e-Market Dashboards initiative.
The e-Market Dashboards initiative's aim is the communication of agricultural data, the provision of access to accurate information and the promotion of transparency
and prompt publication of all available market data for external users. The agriculture dashboards offer full access to all available market data through a
single page. In one screenshot, the dashboards gather all the useful available data important to farmers, producers, stakeholders and interested citizens in order to
make informed choices. These dashboards are made and updated on an almost
daily basis by experts from DG AGRI using the latest national, European and international data. It saves interested parties time. By standardizing the output
and by making updates regularly, it also saves time for experts making updates and colleagues who have the task of uploading the information.
Shared database of standards for good agricultural and environmental
condition (GAEC)
Access to information on the implementation by MS of the GAEC standards is
crucial to check compliance of national definitions with the EU framework and to
assess properly the baseline on the basis of which Rural Development measures are to be set as well as the environmental ambition of MS. For these purposes, the
GAEC database developed by the JRC has been amended in order to ensure that it contains the appropriate level of detail and to ease the search for information. This
updated GAEC database, shared with colleagues and experts, saves them time, reduces the number of solicitations to MS and enhances the level of Information
between interested parties.
Development of a “rural development wiki” IT tool for the treatment of
technical clarifications on rural development programming
In June 2016 DG AGRI Launched a "RD-Wiki" application, which is since then the
privileged tool to channel and treat requests for clarification originating in the field of rural development programming. RD-Wiki represents an online platform
allowing contributions and facilitating the discussions between relevant units in DG AGRI. The tool has permitted to increase significantly the efficiency in the
assessment of clarification questions, as well as to enhance consistency and cross-learning. In addition, RD-Wiki is becoming the unique repository for relevant
documentation on relevant thematic and procedural subjects in relation to rural
development, thus facilitating a quick and up-to-date access to information by colleagues concerned.
Electronically signed on 04/05/2017 11:07 (UTC+02) in accordance with article 4.2 (Validity of electronic documents) of Commission Decision 2004/563