Embed Size (px)
Citation preview

2015 Volunteer Water Quality Monitoring Report
Report prepared by:
Shawn White
March 1, 2016 [Type
text]
The Monitoring Team
The Chittenden County Stream Team (CCST) is a program to engage citizens across an eight-
town area to implement projects to reduce non-point source pollution and stormwater volume at the
local level. The participating towns are Burlington, Essex, Essex Junction, Milton, Shelburne, South
Burlington, Williston, and Winooski. The project is managed by the Chittenden County Regional
Planning Commission, and run by the Winooski Natural Resource Conservation District and the Friends
of the Winooski River. This report describes the results of the forth year of a stream water quality
monitoring effort by the CCST.
When, Where, and What We Monitor
During the summers of 2012-2015, the CCST has collected biweekly water quality samples at
fourteen sites on eight area streams. These urban or suburban streams suffer from sedimentation,
excessive nutrient loads, high temperatures, bacteria, and other pollutants. In 2015, samples were
collected on a total of six sampling dates and analyzed for turbidity, total phosphorous, and chloride.
These parameters were also sampled at five of the sites during a rain event on 8/11. The specific
sampling sites and their locations are listed in Table 1 and a map of the sites is shown in Figure 1.
Table 1. Chittenden County Stream Team 2015 Water Quality Sampling Sites
Location Waterbody Site ID Lat / Long
Grove Street in Burlington Centennial Brook Cent 10 44.48453 / -73.18423
Champlain School Comm. Gardens Englesby Brook Englesby 10 44.45627 / -73.21394
Essex High School Indian Brook Indian 10 44.49668 / -73.11093
Lang Farm in Essex Indian Brook Indian 20 44.50442 / -73.09190
McMullen Road Malletts Creek Milton 10 44.60779/ -73.20103
Route 7 and Bay Road Monroe Brook Monroe 10 44.38987/ -73.21730
Spear & Webster Intersection Monroe Brook Monroe 20 44.38984 / -73.20103
Landry Park Winooski Morehouse Brook Morehouse 10 44.50037 / -73.19370
River Cove Road in Williston Muddy Brook Muddy 10 44.47293 / -73.13505
Marshall Avenue in South Burlington Muddy Brook Muddy 20 44.45340 / -73.13833
Van Sicklen Road in Williston Muddy Brook Muddy 30 44.42823 / -73.14622
Kindness Court in South Burlington Potash Brook Potash 10 44.44572 / -73.21348
Farrell Street in South Burlington Potash Brook Potash 20 44.44660 / -73.20415
Dorset Street in South Burlington Potash Brook Potash 30 44.45150 / -73.17849
Wheeler Nature Park, S. Burlington Potash Brook Trib Wheeler 10 44.44188 / -73.16740
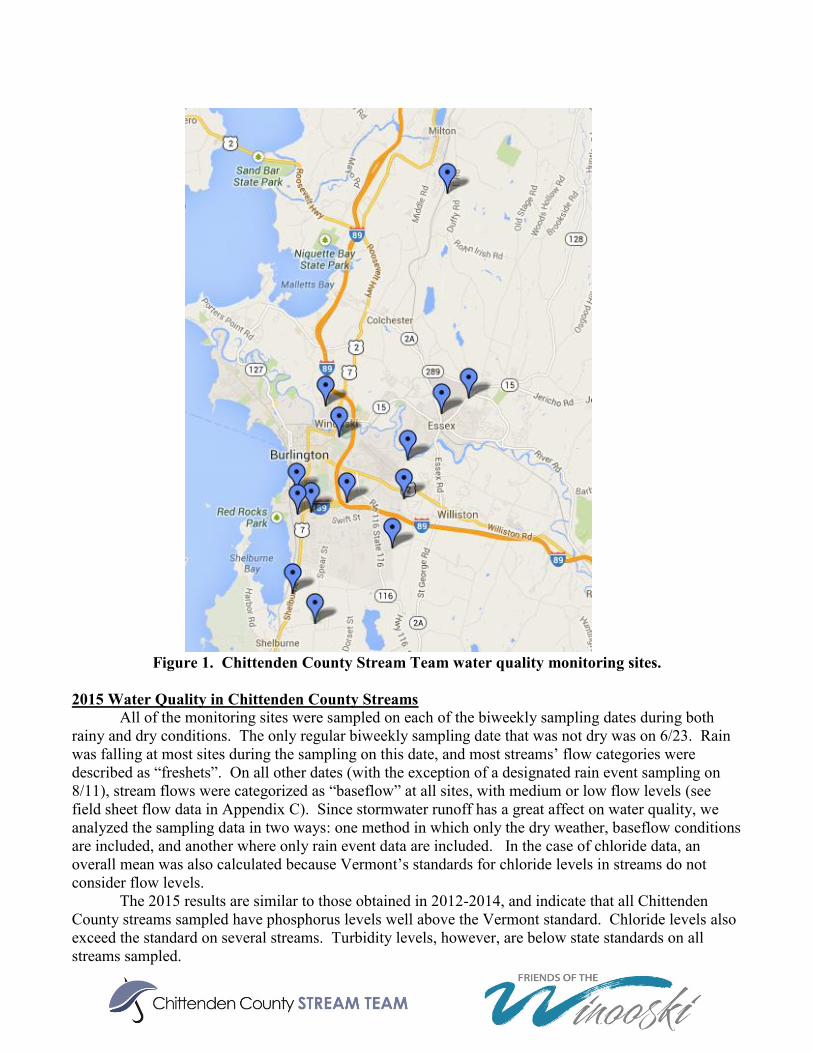
Figure 1. Chittenden County Stream Team water quality monitoring sites.
2015 Water Quality in Chittenden County Streams
All of the monitoring sites were sampled on each of the biweekly sampling dates during both
rainy and dry conditions. The only regular biweekly sampling date that was not dry was on 6/23. Rain
was falling at most sites during the sampling on this date, and most streams’ flow categories were
described as “freshets”. On all other dates (with the exception of a designated rain event sampling on
8/11), stream flows were categorized as “baseflow” at all sites, with medium or low flow levels (see
field sheet flow data in Appendix C). Since stormwater runoff has a great affect on water quality, we
analyzed the sampling data in two ways: one method in which only the dry weather, baseflow conditions
are included, and another where only rain event data are included. In the case of chloride data, an
overall mean was also calculated because Vermont’s standards for chloride levels in streams do not
consider flow levels.
The 2015 results are similar to those obtained in 2012-2014, and indicate that all Chittenden
County streams sampled have phosphorus levels well above the Vermont standard. Chloride levels also
exceed the standard on several streams. Turbidity levels, however, are below state standards on all
streams sampled.

Chloride Results
A summary of 2015 chloride data for CCST streams is shown in Table 2. Mean chloride levels
were high in Centennial, Englesby, and Potash Brooks, where they exceeded the proposed state standard
of 230 mg/L. While a low level of chloride in streams can originate from natural sources, higher levels
are usually due to the use of road salt. Chloride levels in Chittenden County streams were generally
highest during dry conditions. This is a typical pattern seen in streams affected by chloride in the
groundwater with rain having a diluting effect resulting in lower chloride readings. Raw chloride data
can be found in Appendix C.
Site ID
Min
Chloride
Mean
Chloride
Mean Chloride,
Dry Conditions
Only
Mean Chloride,
Rain Events Max Chloride
Centennial 10 433.8 520.5 525.5 508.0 582.3
Engelsby 10 99.9 278.5 314.3 99.9 423.5
Indian 10 45.7 161.2 182.0 109.0 286.2
Indian 20 11.7 67.1 77.8 13.4 183.6
Milton 10 17.6 30.7 33.3 17.6 48.4
Monroe 10 43.9 79.5 85.8 48.1 152.9
Monroe 20 18.0 27.9 29.4 20.0 43.0
Morehouse 10 42.3 80.8 84.1 72.7 103.0
Muddy 10 54.1 77.2 79.7 65.0 111.8
Muddy 20 49.3 68.8 70.1 65.7 104.5
Muddy 30 23.9 25.5 25.6 25.1 27.5
Potash 10 185.0 327.8 380.0 185.0 424.0
Potash 20 205.7 339.6 361.9 315.1 424.4
Potash 30 161.8 260.3 291.5 161.8 313.2
Wheeler 10 21.1 50.6 56.5 21.1 68.6
Table 2. 2015 CCST Chloride Results Summary: Minimum, mean, and maximum chloride levels in
Chittenden County Streams. Mean values are given for all samples, samples taken only during dry, low
flow conditions, and samples taken during rain events. Overall mean values exceeding the Vermont
chronic chloride standard of 230 mg/L are highlighted in orange. Note that the mean rain event values
were calculated based on only one or two samples.
Chloride levels in Chittenden County Streams 2012-2015
A comparison of the mean levels of chloride at each of the sampling sites for sampling years
2012-2105 are shown in Figure 2. Centennial and Potash Brooks had mean chloride levels that exceeded
the EPA chronic criterion of 230 mg/L in all years. In 2014 and 2015, mean chloride levels exceeded
this standard in Englesby Brook as well. Chloride levels in these three problem streams were higher in
2014 than in other years, likely due to the drier summer that year. None of the individual samples for
any of the CCST monitoring sites in any year had chloride levels that exceeded the EPA’s acute
standard, which is 860 mg chloride/L.

Figure 2. Mean chloride levels in Chittenden County Streams 2012-2015. Chloride levels in
samples collected in all weather conditions were used to calculate the mean. The EPA and Vermont
standard for 4-day average chloride levels (230 mg/L) is shown by the dotted line. This is the
concentration of chloride above which chronic health effects have been observed in of aquatic species.
The high chronic levels of chloride in Centennial, Potash, and Engelsby Brooks are of major
concern since sustained elevated chloride can interfere with the survival and reproduction of freshwater
aquatic organisms. The EPA, when recommending the 230mg/L criterion, stated, “Freshwater aquatic
organisms and their uses should not be affected unacceptably if the four-day average concentration of
dissolved chloride, when associated with sodium, does not exceed 230 mg/L more than once every three
years on the average.” In 2015 Centennial Brook had the highest average chloride value of all four
years of sampling by the CCST. Of the 26 samples the CCST has collected in Centennial Brook over
the past four years, only 3 have had chloride levels below 230mg/L. Potash and Englesby Brook are
similarly affected, and while their chloride levels are somewhat lower than those of Centennial Brook,
most of the samples collected from both brooks in 2014 and 2015 are well over 230mg/L, and chloride
levels in these streams appears to be on an upward trend.

Phosphorus Results
A summary of the 2015 phosphorus results in shown in Table 3. Mean phosphorus levels
exceeded the proposed Vermont state standard of 27ug/L in all samples at all sites in 2015 and were
especially high on Muddy Brook. All streams had total phosphorus levels well above 10ug/L, the target
phosphorus concentration for Lake Champlain (Main Lake). Raw data is presented in Appendix C.
Site ID
Min
Phosphorus
Mean
Phosphorus
Mean Phosphorus,
Dry Conditions Only
Mean
Phosphorus,
Rain Event(s)
Max
Phosphorus
Centennial 10 65.7 94.1 84.7 117.4 164.0
Engelsby 10 41.7 106.6 56.6 357.0 357.0
Indian 10 32.7 47.9 38.7 71.0 78.5
Indian 20 26.9 44.7 43.3 51.4 62.7
Milton 10 23.5 35.1 35.0 35.9 47.2
Monroe 10 37.0 48.0 45.6 59.8 59.8
Monroe 20 38.2 75.0 50.2 199.0 199.0
Morehouse 10 27.4 65.1 31.3 149.8 208.0
Muddy 10 66.4 79.2 75.7 96.5 96.5
Muddy 20 57.4 90.8 92.1 87.7 114.0
Muddy 30 56.7 106.7 116.2 58.9 165.0
Potash 10 23.5 39.7 30.7 83.1 83.1
Potash 20 26.6 35.5 31.7 46.5 58.3
Potash 30 50.9 56.3 57.6 56.8 67.4
Wheeler 10 35.3 56.5 46.1 108.0 108.0
Table 3. 2015 CCST Phosphorus Results Summary: Minimum, mean, and maximum phosphorus
levels in Chittenden County Streams. Mean values are given for all samples, samples taken only during
dry/low flow conditions, and samples taken during rain events (freshet flows). Overall mean values
exceeding the Vermont chronic chloride standard of 27 ug/L are highlighted in orange. Note that the
mean rain event values were calculated based on only one or two samples.
Phosphorous Levels in Chittenden County Streams 2012-2015 The state of Vermont’s base-flow phosphorous standard is 27 ug/L for class B, “warm water
medium-gradient streams” and 15 ug/L for “medium (sized) high-gradient streams.” We are assuming
most of the streams monitored by the CCST would fall under the first category, although the streams
monitored are not listed as warm-water streams in the 2014 Vermont Water Quality Standards. This
concentration is indicated by a dotted line in Figure 3, which shows a comparison of the mean
phosphorus levels during dry conditions for all four years of CCST monitoring.
Mean phosphorous levels in dry, base-flow conditions at the majority of the sites sampled were
well above the 27ug/L standard. 2014 and 2015 phosphorus levels were generally lower than in 2012
and 2013, probably because both years were relatively dry, and phosphorus enters streams when
fertilizers, animal waste, sediment, etc., get washed into streams via surface runoff. Muddy Brook,
which forms the border between South Burlington and Williston, had particularly high levels in all
years, especially at the most upstream site (Muddy 30). The Muddy Brook watershed upstream from
Muddy 30 includes the Vermont National Country Club, Shelburne Pond, agricultural farmland, and
suburban development.
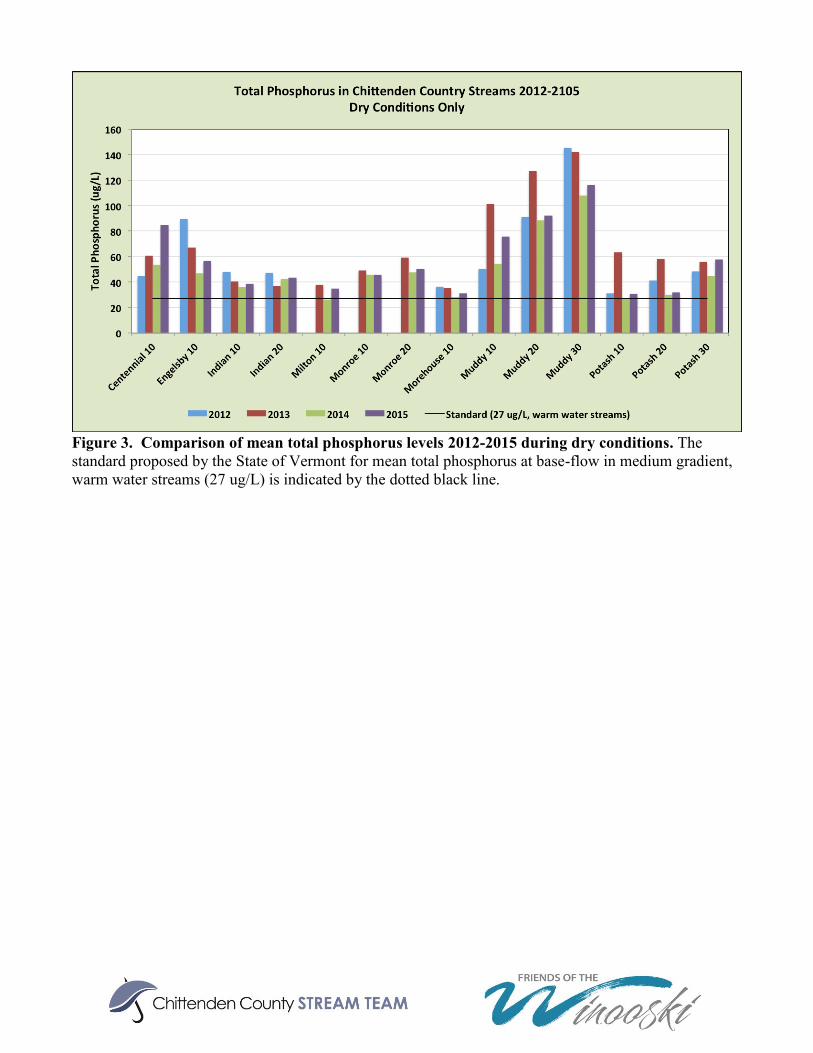
Figure 3. Comparison of mean total phosphorus levels 2012-2015 during dry conditions. The
standard proposed by the State of Vermont for mean total phosphorus at base-flow in medium gradient,
warm water streams (27 ug/L) is indicated by the dotted black line.

Turbidity Results
None of the 2015 mean turbidity values from any of the sampled streams exceeded the
VT Water Quality standard for turbidity of 25 nephelometric units (NTU) for warm-water fish habitat.
However, average turbidity levels in Centennial, Indian, and Muddy Brooks were above the 10 NTU
standard for cold-water fish habitat, and turbidity levels at some sites were quite high after rain events.
Site ID
Min
Turbidity
Mean
Turbidity
Mean Turbidity,
Dry Conditions
Only
Mean
Turbidity,
Rain Events
Max
Turbidity
Centennial 10 7.0 24.4 21.1 32.5 58.0
Engelsby 10 5.0 22.5 6.7 101.4 101.4
Indian 10 6.8 9.5 7.5 14.4 20.3
Indian 20 4.6 12.0 10.8 17.7 19.5
Milton 10 3.2 6.1 5.9 7.1 8.2
Monroe 10 3.8 8.6 8.0 11.5 11.5
Monroe 20 3.9 10.4 6.0 32.5 32.5
Morehouse 10 3.2 27.5 5.9 81.7 137.2
Muddy 10 6.6 14.4 11.1 30.8 30.8
Muddy 20 8.4 11.8 10.9 14.0 15.9
Muddy 30 4.6 7.8 8.0 6.7 12.3
Potash 10 2.6 5.0 2.7 15.8 15.8
Potash 20 1.3 3.1 1.9 6.6 10.6
Potash 30 6.3 7.3 7.6 6.8 9.3
Wheeler 10 2.9 8.8 4.6 29.8 29.8
Table 4. 2015 CCST Phosphorus Results Summary: Minimum, mean, and maximum phosphorus
levels in Chittenden County Streams. Mean values are given for all samples, samples taken only during
dry/low flow conditions, and samples taken during rain events (freshet flows). Note that the mean rain
event values were calculated based on only one or two samples, while the dry condition values are based
on 5 data points.
Turbidity Levels in Chittenden County Streams 2012-2015
Figure 4 shows a comparison of turbidity levels from all four years of CCST sampling. Mean
values in all four years fell below the VT standard for warm-water streams of 25 NTU (Nephelometric
Turbidity Units) but exceeded the standard for cold-water streams at several sites.

Figure 4. Comparison of mean turbidity levels 2012-2015 during dry conditions. The standard
proposed by the State of Vermont for mean turbidity at base-flow in medium gradient, warm water
streams (25 NTU) is indicated by the dotted black line.
E. coli Results
The presence of E. coli in surface waters is used as an indicator of fecal contamination. Sources
of fecal matter in streams include leaks or overflows from sewer or septic systems, pet waste, and
wildlife. While not necessarily a health hazard per se, the presence of E. coli is often associated with the
presence of pathogenic bacteria or viruses that can cause illness in humans. In 2015 the Chittenden
County Stream Team began E. coli sampling at Wheeler Brook at the request of one of its volunteers.
The results of the 2015 E. coli sampling is shown in Table 5.
The Vermont standard for E. coli is a geometric mean of <126 mpn/100mL over a 60-day
“representative period”, with no more than 10% of samples above 235 mpn/100mL. The geometric
mean levels of E. coli at the Wheeler Brook sampling site in 2015 was 594 mpn/mL, and 83% of the
samples had E. coli counts of over 235 mpn/mL– well over the standard with both criteria.
Site ID
Min
E.coli
Geometric
Mean, All
Conditions
GeoMean E.coli,
Dry Conditions
Only
Max E.coli % of samples above
235 mpn/100mL
Wheeler 10 98.4 750.6 594.0 >2419.6 83
Table 5. 2015 CCST E. coli Results Summary: Minimum, geometric mean, and maximum E. coli
levels in Chittenden County Streams. Geometric mean values exceeding the Vermont chronic E. coli
standard of 126 mpn/mL are highlighted in orange.

Conclusion The Chittenden County Stream Team has monitored chloride, phosphorus, and turbidity in
Burlington area streams for the past four years (2012-2015). Phosphorus levels in these mainly urban
and suburban streams are consistently above the 2014 Vermont water quality standard of 27 ug/L, even
in dry summers like that of 2014. Muddy Brook had especially high levels, with one site averaging
concentrations of over 100 ug/L in all sampling years. Centennial and Englesby Brooks also had
particularly high phosphorus concentrations.
Chloride levels are also a problem in several streams, most notably Centennial, Engelsby, and
Potash Brooks. 2014 and 2015 Chloride levels in these streams were significantly higher than in the
past two years of CCST monitoring, and are likely to be causing a negative impact on aquatic organisms
in those streams. Turbidity levels, while slightly elevated in Indian, Monroe, and Muddy Brooks, do not
seem to be as much of a concern. As expected, concentrations of phosphorus were much higher during
rain events, especially in Centennial, Englesby, Monroe, and Morehouse Brooks, perhaps indicating that
these streams are more susceptible to the effects of stormwater runoff.
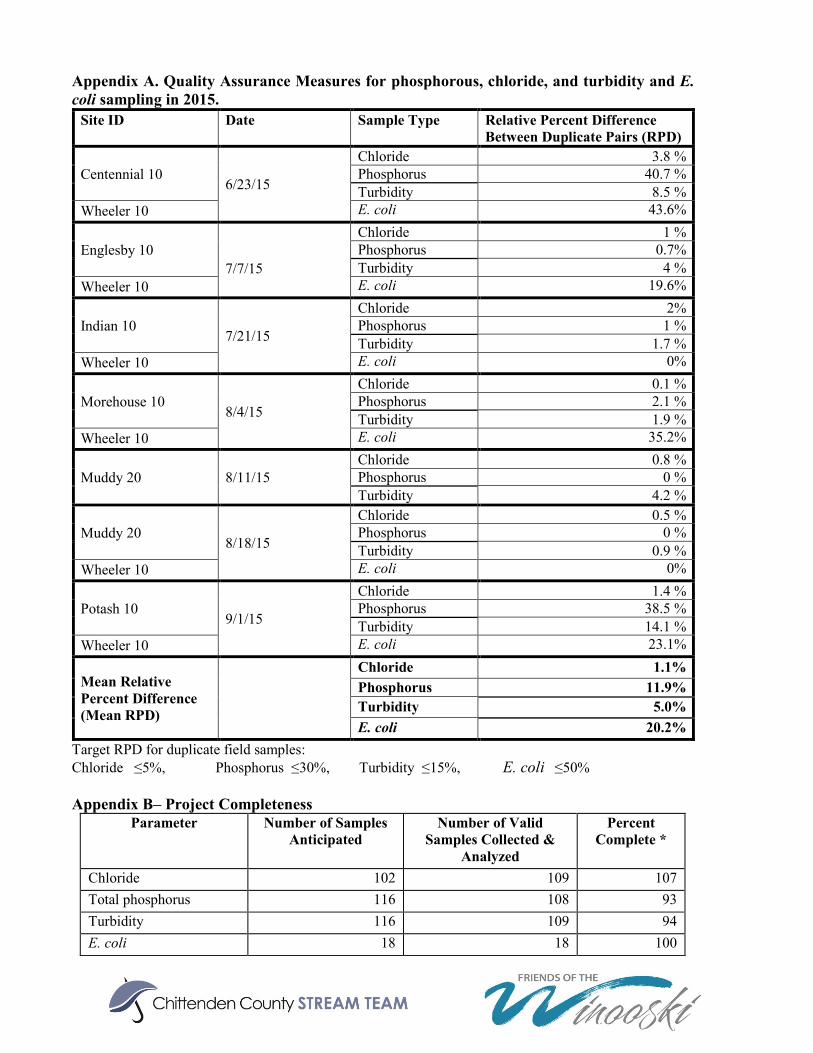
Appendix A. Quality Assurance Measures for phosphorous, chloride, and turbidity and E.
coli sampling in 2015.
Site ID Date Sample Type Relative Percent Difference
Between Duplicate Pairs (RPD)
Centennial 10 6/23/15
Chloride 3.8 %
Phosphorus 40.7 %
Turbidity 8.5 %
Wheeler 10 E. coli 43.6%
Englesby 10
7/7/15
Chloride 1 %
Phosphorus 0.7%
Turbidity 4 %
Wheeler 10 E. coli 19.6%
Indian 10 7/21/15
Chloride 2%
Phosphorus 1 %
Turbidity 1.7 %
Wheeler 10 E. coli 0%
Morehouse 10 8/4/15
Chloride 0.1 %
Phosphorus 2.1 %
Turbidity 1.9 %
Wheeler 10 E. coli 35.2%
Muddy 20 8/11/15
Chloride 0.8 %
Phosphorus 0 %
Turbidity 4.2 %
Muddy 20 8/18/15
Chloride 0.5 %
Phosphorus 0 %
Turbidity 0.9 %
Wheeler 10 E. coli 0%
Potash 10 9/1/15
Chloride 1.4 %
Phosphorus 38.5 %
Turbidity 14.1 %
Wheeler 10 E. coli 23.1%
Mean Relative
Percent Difference
(Mean RPD)
Chloride 1.1%
Phosphorus 11.9%
Turbidity 5.0%
E. coli 20.2%
Target RPD for duplicate field samples:
Chloride ≤5%, Phosphorus ≤30%, Turbidity ≤15%, E. coli ≤50%
Appendix B– Project Completeness
Parameter Number of Samples
Anticipated
Number of Valid
Samples Collected &
Analyzed
Percent
Complete *
Chloride 102 109 107
Total phosphorus 116 108 93
Turbidity 116 109 94
E. coli 18 18 100

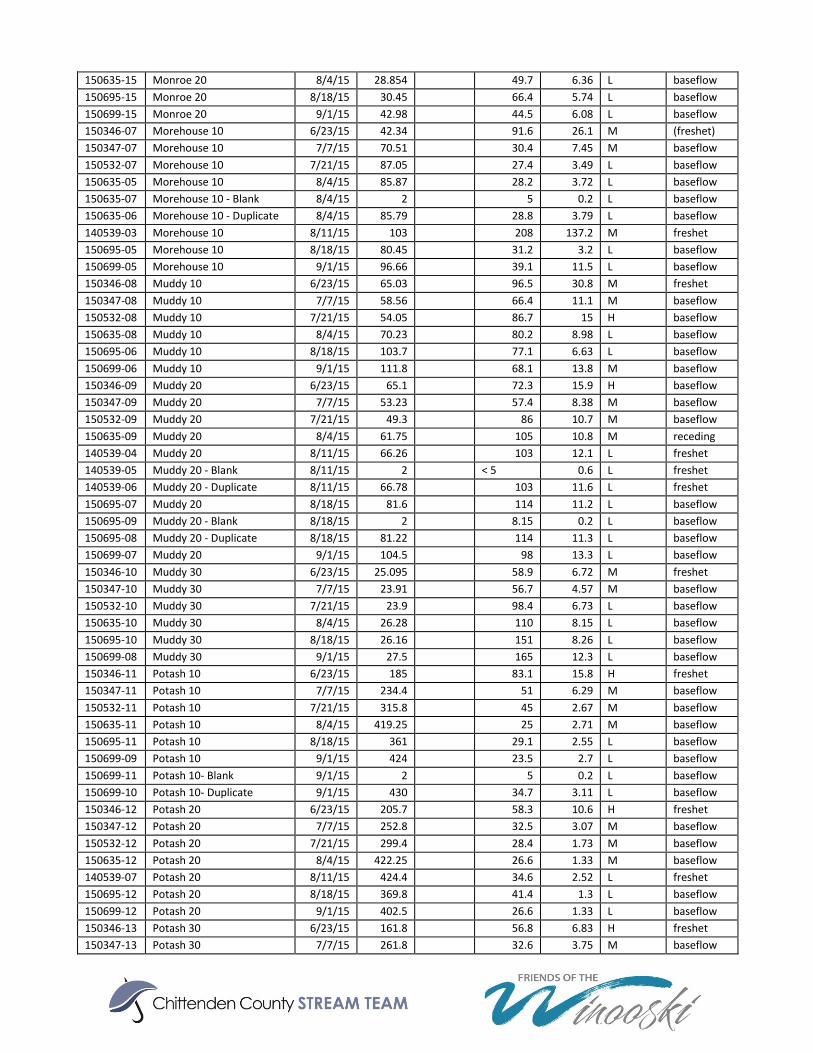
Appendix C – Individual Sample Results Sample Number
Location Date Chloride (mg/L)
E. coli (mpn/
100 ml)
TP (ug P/L)
Turbidity (NTU)
Flow level from field
sheet
Fiow category from field sheet*
150346-01 Cent 10 6/23/15 433.75 70.8 7 H freshet
150346-03 Cent 10 - Blank 6/23/15 2 5 0.2 H freshet
150346-02 Cent 10 - Duplicate 6/23/15 450.4 107 7.62 H freshet
150347-01 Cent 10 7/7/15 481.5 65.7 12.2 L baseflow
150532-01 Cent 10 7/21/15 528.25 68.5 16.8 M baseflow
150635-01 Cent 10 8/4/15 565.5 101 29.6 M baseflow
140539-01 Cent 10 8/11/15 582.25 164 58 M baseflow
150695-01 Cent 10 8/18/15 500.75 99.9 24.3 L freshet
150699-01 Cent 10 9/1/15 551.5 88.6 22.8 L baseflow
150346-04 Engelsby 10 6/23/15 99.93 357 101.4 H freshet
150347-02 Engelsby 10 7/7/15 187.02 57.8 4.95 M baseflow
150347-04 Engelsby 10 - Blank 7/7/15 2 5 0.2 M baseflow
150347-03 Engelsby 10 - Duplicate 7/7/15 185.08 58.2 5.15 M baseflow
150532-02 Engelsby 10 7/21/15 254 61.5 5.41 L baseflow
150635-02 Engelsby 10 8/4/15 337.75 67.3 9.57 M baseflow
150695-02 Engelsby 10 8/18/15 369 54.5 6.95 L baseflow
150699-02 Engelsby 10 9/1/15 423.5 41.7 6.71 L baseflow
150346-05 Indian 10 6/23/15 45.74 78.5 20.3 H freshet
150347-05 Indian 10 7/7/15 55.1 32.7 7.35 M baseflow
150532-03 Indian 10 7/21/15 123.8 39.6 7.45 M (baseflow)
150532-05 Indian 10 - Blank 7/21/15 2 5 0.2 M (baseflow)
150532-04 Indian 10 - Duplicate 7/21/15 124.1 40 7.58 M (baseflow)
150635-03 Indian 10 8/4/15 202 38.1 6.8 L baseflow
140539-02 Indian 10 8/11/15 172.32 63.5 8.54 M freshet
150695-03 Indian 10 8/18/15 243 40.6 7.28 L baseflow
150699-03 Indian 10 9/1/15 286.2 42.6 8.6 L baseflow
150346-06 Indian 20 6/23/15 13.39 51.4 17.7 H freshet
150347-06 Indian 20 7/7/15 11.72 26.9 4.55 M baseflow
150532-06 Indian 20 7/21/15 29.46 62.7 15.2 M freshet
150635-04 Indian 20 8/4/15 64.46 52.5 19.5 L baseflow
150695-04 Indian 20 8/18/15 99.82 41.7 7.8 L baseflow
150699-04 Indian 20 9/1/15 183.6 32.8 7.11 L baseflow
150346-16 Milton 10 6/23/15 17.6 35.9 7.14 M baseflow
150347-16 Milton 10 7/7/15 17.62 23.5 3.23 L baseflow
150532-16 Milton 10 7/21/15 26.97 33.3 8.22 L baseflow
150635-16 Milton 10 8/4/15 34.95 32.6 6.49 L baseflow
150695-16 Milton 10 8/18/15 38.7 47.2 4.07 L baseflow
150699-16 Milton 10 9/1/15 48.4 38.3 7.69 L baseflow
150346-14 Monroe 10 6/23/15 48.05 59.8 11.5 M freshet
150347-14 Monroe 10 7/7/15 43.89 38 7.98 M baseflow
150532-14 Monroe 10 7/21/15 53.75 54.9 11.2 L baseflow
150635-14 Monroe 10 8/4/15 84.04 46.7 10.8 M baseflow
150695-14 Monroe 10 8/18/15 94.46 51.4 6.33 L baseflow
150699-14 Monroe 10 9/1/15 152.9 37 3.83 L baseflow
150346-15 Monroe 20 6/23/15 20.02 199 32.5 H freshet
150347-15 Monroe 20 7/7/15 18.03 38.2 3.93 M baseflow
150532-15 Monroe 20 7/21/15 26.755 52.3 7.94 L baseflow
150635-15 Monroe 20 8/4/15 28.854 49.7 6.36 L baseflow
150695-15 Monroe 20 8/18/15 30.45 66.4 5.74 L baseflow
150699-15 Monroe 20 9/1/15 42.98 44.5 6.08 L baseflow
150346-07 Morehouse 10 6/23/15 42.34 91.6 26.1 M (freshet)
150347-07 Morehouse 10 7/7/15 70.51 30.4 7.45 M baseflow
150532-07 Morehouse 10 7/21/15 87.05 27.4 3.49 L baseflow
150635-05 Morehouse 10 8/4/15 85.87 28.2 3.72 L baseflow
150635-07 Morehouse 10 - Blank 8/4/15 2 5 0.2 L baseflow
150635-06 Morehouse 10 - Duplicate 8/4/15 85.79 28.8 3.79 L baseflow
140539-03 Morehouse 10 8/11/15 103 208 137.2 M freshet
150695-05 Morehouse 10 8/18/15 80.45 31.2 3.2 L baseflow
150699-05 Morehouse 10 9/1/15 96.66 39.1 11.5 L baseflow
150346-08 Muddy 10 6/23/15 65.03 96.5 30.8 M freshet
150347-08 Muddy 10 7/7/15 58.56 66.4 11.1 M baseflow
150532-08 Muddy 10 7/21/15 54.05 86.7 15 H baseflow
150635-08 Muddy 10 8/4/15 70.23 80.2 8.98 L baseflow
150695-06 Muddy 10 8/18/15 103.7 77.1 6.63 L baseflow
150699-06 Muddy 10 9/1/15 111.8 68.1 13.8 M baseflow
150346-09 Muddy 20 6/23/15 65.1 72.3 15.9 H baseflow
150347-09 Muddy 20 7/7/15 53.23 57.4 8.38 M baseflow
150532-09 Muddy 20 7/21/15 49.3 86 10.7 M baseflow
150635-09 Muddy 20 8/4/15 61.75 105 10.8 M receding
140539-04 Muddy 20 8/11/15 66.26 103 12.1 L freshet
140539-05 Muddy 20 - Blank 8/11/15 2 < 5 0.6 L freshet
140539-06 Muddy 20 - Duplicate 8/11/15 66.78 103 11.6 L freshet
150695-07 Muddy 20 8/18/15 81.6 114 11.2 L baseflow
150695-09 Muddy 20 - Blank 8/18/15 2 8.15 0.2 L baseflow
150695-08 Muddy 20 - Duplicate 8/18/15 81.22 114 11.3 L baseflow
150699-07 Muddy 20 9/1/15 104.5 98 13.3 L baseflow
150346-10 Muddy 30 6/23/15 25.095 58.9 6.72 M freshet
150347-10 Muddy 30 7/7/15 23.91 56.7 4.57 M baseflow
150532-10 Muddy 30 7/21/15 23.9 98.4 6.73 L baseflow
150635-10 Muddy 30 8/4/15 26.28 110 8.15 L baseflow
150695-10 Muddy 30 8/18/15 26.16 151 8.26 L baseflow
150699-08 Muddy 30 9/1/15 27.5 165 12.3 L baseflow
150346-11 Potash 10 6/23/15 185 83.1 15.8 H freshet
150347-11 Potash 10 7/7/15 234.4 51 6.29 M baseflow
150532-11 Potash 10 7/21/15 315.8 45 2.67 M baseflow
150635-11 Potash 10 8/4/15 419.25 25 2.71 M baseflow
150695-11 Potash 10 8/18/15 361 29.1 2.55 L baseflow
150699-09 Potash 10 9/1/15 424 23.5 2.7 L baseflow
150699-11 Potash 10- Blank 9/1/15 2 5 0.2 L baseflow
150699-10 Potash 10- Duplicate 9/1/15 430 34.7 3.11 L baseflow
150346-12 Potash 20 6/23/15 205.7 58.3 10.6 H freshet
150347-12 Potash 20 7/7/15 252.8 32.5 3.07 M baseflow
150532-12 Potash 20 7/21/15 299.4 28.4 1.73 M baseflow
150635-12 Potash 20 8/4/15 422.25 26.6 1.33 M baseflow
140539-07 Potash 20 8/11/15 424.4 34.6 2.52 L freshet
150695-12 Potash 20 8/18/15 369.8 41.4 1.3 L baseflow
150699-12 Potash 20 9/1/15 402.5 26.6 1.33 L baseflow
150346-13 Potash 30 6/23/15 161.8 56.8 6.83 H freshet
150347-13 Potash 30 7/7/15 261.8 32.6 3.75 M baseflow

150532-13 Potash 30 7/21/15 263.4 56 7.48 M baseflow
150635-13 Potah 30 8/4/15 313.2 50.9 7.14 M baseflow
150695-13 Potash 30 8/18/15 295.8 67.4 6.68 L baseflow
150699-13 Potash 30 9/1/15 293.4 55.9 9.27 L baseflow
150346-17 Wheeler 10 6/23/15 21.07 2419.57 108 29.8 H freshet
150346-18 Wheeler 10 - Blank 6/23/15 1 H freshet
150346-19 Wheeler 10 - Duplicate 6/23/15 1553.12 H freshet
150347-17 Wheeler 10 7/7/15 45.33 98.42 35.3 2.93 M baseflow
150347-18 Wheeler 10 - Blank 7/7/15 1 M baseflow
150347-19 Wheeler 10 - Duplicate 7/7/15 119.83 M baseflow
150532-17 Wheeler 10 7/21/15 51.45 365.4 41.8 4 M baseflow
150532-18 Wheeler 10 - Blank 7/21/15 1 M baseflow
150532-19 Wheeler 10 - Duplicate 7/21/15 365.4 M baseflow
150635-17 Wheeler 10 8/4/15 68.63 980.39 40 3.33 L baseflow
150635-18 Wheeler 10 - Blank 8/4/15 1 L baseflow
150635-19 Wheeler 10 - Duplicate 8/4/15 686.67 L baseflow
150695-17 Wheeler 10 8/18/15 64.25 2419.6 76.3 7.04 L baseflow
150695-18 Wheeler 10 - Blank 8/18/15 1 L baseflow
150695-19 Wheeler 10 - Duplicate 8/18/15 2419.6 L baseflow
150699-17 Wheeler 10 9/1/15 52.95 866.44 37.3 5.89 L baseflow
150699-18 Wheeler 10 - Blank 9/1/15 1 L baseflow
150699-19 Wheeler 10 - Duplicate 9/1/15 686.67 L baseflow