Embed Size (px)
Citation preview
1. Title and Approval Page
SOUTHERN CALIFORNIA MARINE INSTITUTE VOLUNTEER MONITORING
QUALITY ASSURANCE PROJECT PLAN
PREPARED BY: SOUTHERN CALIFORNIA MARINE INSTITUTE
refer correspondence to: Kerry Flaherty
Coordinator of Environmental Monitoring Southern California Marine Institute
820 S. Seaside Ave. Terminal Island, CA 90731
Approvals:
State Water Resources Control Board – William Ray, QA Officer
Signature: __________________________________________Date: ____________
Los Angeles Regional Water Quality Control Board - Michael Lyons Signature: __________________________________________Date: ____________
Los Angeles Regional Water Quality Control Board – Nancy Ngugi, Project Manager
Signature: __________________________________________Date: ____________ Southern California Marine Institute - Richard Pieper, Director/QA officer
Signature: __________________________________________Date: ____________
Southern California Marine Institute – Kerry Flaherty, Project Manager Signature: __________________________________________Date: ____________

2. Table of Contents
Page 1. Title and Approval Page 1
2. Table of Contents 2
3. Distribution List 3
4. Project Organization 3
5. Problem Definition / Background 3
6. Project and Task Description 5
7. Data Quality Objectives 6
8. Training Requirements 9
9. Documentation and Records 10
10. Sampling Process Design 10
11. Sampling Method Requirements 11
12. Sample Handling and Custody Procedures 12
13. Analytical Methods Requirements 13
14. Quality Control Requirements 15
15. Instrument / Equipment Testing, Inspection, and Maintenance 18
16. Instrument Calibration / Standardization and Frequency 18
17. Inspection / Acceptance Requirements 19
18. Data Acquisition Requirements 19
19. Data Management 20
20. Assessment and Response Actions 20
21. Reports 21
22. Validation and Verification Methods 21
APPENDICES
Appendix A Description of the Participating Organizations 22
Appendix B Data Sheets and Forms 27
Appendix C Map of Volunteer Sampling Stations 36
Final QAPP, 10/27/03, page 2 of 37
3. Distribution List All group leaders, and technical advisors will receive copies of this Quality Assurance Project Plan (QAPP), and any approved revisions of this plan. Once approved, this QAPP will be available to any interested parties by requesting a copy from the project management.
4. Project Organization The Southern California Marine Institute Volunteer Monitoring Project is a multi-organization project. Nine volunteer monitoring groups will monitor and assess natural streams, storm drains, harbors, estuaries, and nearshore ocean waters in the Los Angeles Basin. These organizations are:
1. Algalita Marine Research Non-Profit Foundation, 2. Bolsa Chica Conservancy, 3. Cabrillo Marine Aquarium (CMA), 4. Divers Involved Voluntarily in Environmental Rehabilitation and Safety (D.I.V.E.R.S.), 5. Heal the Bay, 6. Santa Monica BayKeeper, 7. Southern California Marine Institute (SCMI), 8. Surfrider- Huntington/Seal Beach Chapter, and 9. Surfrider- Long Beach Chapter
See Appendix A for a “Description of the Participating Organizations”. Several resource agencies have assisted in the development of this project from its conception. Additional partnerships will be developed to ensure adequate technical support to all participating volunteer monitoring groups. The QAPP reflects the diversity of monitoring and organizational support involved in this project. For the elements of this QAPP, we have addressed aspects that are shared with all groups as well as those aspects that are unique to individual groups. While the goals of monitoring may vary, the data quality objectives are consistent allowing us to compare data collected by different organizations.
4.1. Technical Advisory Committee for all Groups Erick Burres, State Water Resources Control Board Rick Pieper, Southern California Marine Institute Rich Gossett, CRG Marine Labs
5. Problem Definition/Background 5.1 Problem Statement Many volunteer monitoring organizations exist in the Los Angeles Region. Prior to SCMI’s involvement in citizen monitoring efforts, there had been little or no coordination between these organizations regarding sampling methods, parameters, sampling locations, data sharing, and other aspects. Education and coordination between all citizen monitors and regulatory agencies is necessary to provide valuable data and to maximize the results of monitoring efforts. SCMI has and will continue to coordinate citizen monitoring group efforts by holding training sessions, Quality Assurance/Quality Control (QA/QC) sessions, helping with data collection and upload to the state water board, and any other aspect that becomes necessary to maximize efficiency between groups.
Final QAPP, 10/27/03, page 3 of 37

5.1.1. Citizen Monitoring and Goals 5.1.1.1 Mission The mission of citizen monitoring is to produce environmental information which is needed to protect California’s watersheds and aquatic resources. Citizen monitoring will also inform and engage the community in effective watershed stewardship. 5.1.1.2 Program Goals To provide an illustrated field guide for sampling and analysis performed by citizen monitors. This
field guide will be patterned after the model provided by the Heal the Bay Stream Team Field Guide. To encourage and increase public involvement, and to standardize data quality from citizens in citizen
monitoring programs. SCMI will provide training, guidance, field consultations, and quality assurance sessions open to all of the region’s citizen monitoring organizations.
To expand and coordinate seasonal water monitoring “snapshot” efforts. The existing citizen
monitoring effort within Region 4 of the State Water Resources Control Board (SWRCB) would be restructured and expanded in order to assess and report water quality on the same day in all the region’s watersheds, which include: Los Angeles River watershed, San Gabriel River watershed, Dominguez Channel watershed and Santa Monica Bay Water Management Area (WMA). Several of these snapshot efforts will be performed per year. At least two seasonal snapshots and one near the timing of the first flush will be planned.
To assist groups in data entry and transmittal, thereby assisting the Los Angeles Regional Water
Quality Control Board (LARWQCB) staff in their water quality assessment and Total Maximum Daily Load (TMDL) efforts. All credible data collected by participating citizen groups and lead agency, in all of the local watersheds will be entered on a Microsoft Excel database and transmitted to the LARWQCB via email.
To increase public awareness and stewardship of our water resources, thereby altering behavior and
unsustainable land use practices, and resulting in lower pollution levels over time. Recommend revisions to the Southern California Volunteer Monitoring Quality Assurance Project
Plan (QAPP). 5.2. Intended Usage of Data The data will be used by the Southern California Marine Institute for general watershed assessment purposes. Assessment of this data will be useful in providing information for watershed management and pollution prevention. The data will be made public for watershed education. It will also be made available to regulatory and resource management agencies to supplement their existing data collection efforts. One potential application of the data will be to provide information to the Regional and State Boards for their use, if they so choose, in Clean Water Act Section 305(b) reporting. Data will be collected and shared with the State Water Resources Control Board, the LARWQCB, and upon request to other state, federal, and local agencies and organizations. The main database will be maintained at Southern California Marine Institute at 820 S. Seaside Ave., Terminal Island, CA 90731.
Final QAPP, 10/27/03, page 4 of 37
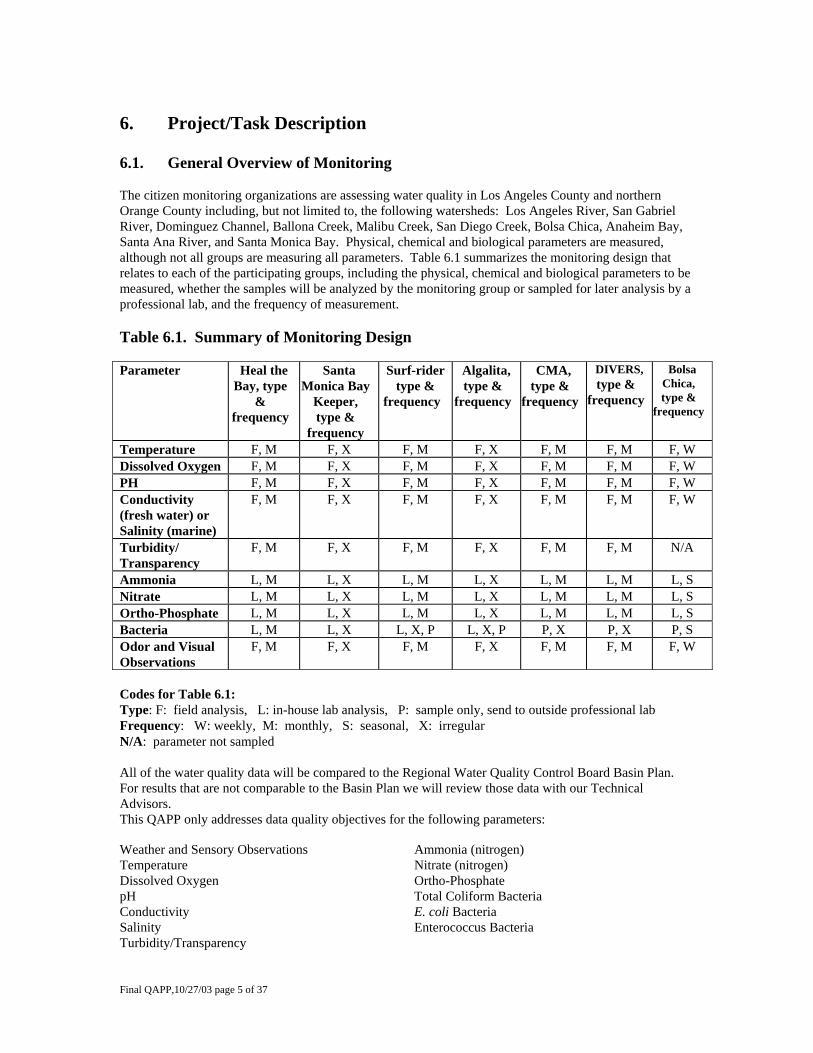
6. Project/Task Description 6.1. General Overview of Monitoring The citizen monitoring organizations are assessing water quality in Los Angeles County and northern Orange County including, but not limited to, the following watersheds: Los Angeles River, San Gabriel River, Dominguez Channel, Ballona Creek, Malibu Creek, San Diego Creek, Bolsa Chica, Anaheim Bay, Santa Ana River, and Santa Monica Bay. Physical, chemical and biological parameters are measured, although not all groups are measuring all parameters. Table 6.1 summarizes the monitoring design that relates to each of the participating groups, including the physical, chemical and biological parameters to be measured, whether the samples will be analyzed by the monitoring group or sampled for later analysis by a professional lab, and the frequency of measurement. Table 6.1. Summary of Monitoring Design Parameter Heal the
Bay, type &
frequency
Santa Monica Bay
Keeper, type &
frequency
Surf-rider type &
frequency
Algalita, type &
frequency
CMA, type &
frequency
DIVERS, type &
frequency
Bolsa Chica, type &
frequency
Temperature F, M F, X F, M F, X F, M F, M F, W Dissolved Oxygen F, M F, X F, M F, X F, M F, M F, W PH F, M F, X F, M F, X F, M F, M F, W Conductivity (fresh water) or Salinity (marine)
F, M F, X F, M F, X F, M F, M F, W
Turbidity/ Transparency
F, M F, X F, M F, X F, M F, M N/A
Ammonia L, M L, X L, M L, X L, M L, M L, S Nitrate L, M L, X L, M L, X L, M L, M L, S Ortho-Phosphate L, M L, X L, M L, X L, M L, M L, S Bacteria L, M L, X L, X, P L, X, P P, X P, X P, S Odor and Visual Observations
F, M F, X F, M F, X F, M F, M F, W
Codes for Table 6.1: Type: F: field analysis, L: in-house lab analysis, P: sample only, send to outside professional lab Frequency: W: weekly, M: monthly, S: seasonal, X: irregular N/A: parameter not sampled All of the water quality data will be compared to the Regional Water Quality Control Board Basin Plan. For results that are not comparable to the Basin Plan we will review those data with our Technical Advisors. This QAPP only addresses data quality objectives for the following parameters: Weather and Sensory Observations Ammonia (nitrogen) Temperature Nitrate (nitrogen) Dissolved Oxygen Ortho-Phosphate pH Total Coliform Bacteria Conductivity E. coli Bacteria Salinity Enterococcus Bacteria Turbidity/Transparency
Final QAPP,10/27/03 page 5 of 37
Chemical, physical, and bacterial parameters will be monitored using protocols outlined in a Field Guide based on Heal the Bay Stream Team Field Guide-hereafter referred to as the Field Guide.
Final QAPP,10/27/03 page 6 of 37
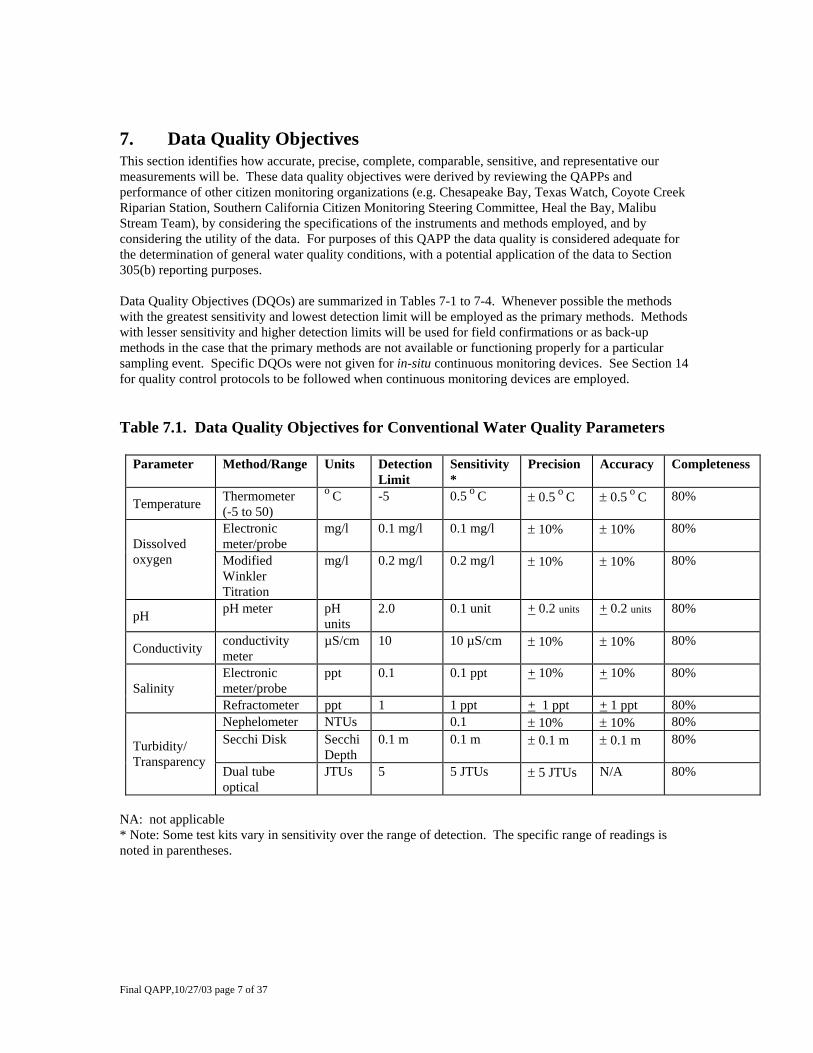
7. Data Quality Objectives This section identifies how accurate, precise, complete, comparable, sensitive, and representative our measurements will be. These data quality objectives were derived by reviewing the QAPPs and performance of other citizen monitoring organizations (e.g. Chesapeake Bay, Texas Watch, Coyote Creek Riparian Station, Southern California Citizen Monitoring Steering Committee, Heal the Bay, Malibu Stream Team), by considering the specifications of the instruments and methods employed, and by considering the utility of the data. For purposes of this QAPP the data quality is considered adequate for the determination of general water quality conditions, with a potential application of the data to Section 305(b) reporting purposes. Data Quality Objectives (DQOs) are summarized in Tables 7-1 to 7-4. Whenever possible the methods with the greatest sensitivity and lowest detection limit will be employed as the primary methods. Methods with lesser sensitivity and higher detection limits will be used for field confirmations or as back-up methods in the case that the primary methods are not available or functioning properly for a particular sampling event. Specific DQOs were not given for in-situ continuous monitoring devices. See Section 14 for quality control protocols to be followed when continuous monitoring devices are employed. Table 7.1. Data Quality Objectives for Conventional Water Quality Parameters
Parameter Method/Range Units Detection Limit
Sensitivity*
Precision Accuracy Completeness
Temperature Thermometer (-5 to 50)
o C -5 0.5 o C ± 0.5 o C ± 0.5 o C 80%
Electronic meter/probe
mg/l 0.1 mg/l 0.1 mg/l ± 10% ± 10% 80% Dissolved oxygen
Modified Winkler Titration
mg/l 0.2 mg/l 0.2 mg/l ± 10% ± 10% 80%
pH pH meter
pH units
2.0 0.1 unit + 0.2 units + 0.2 units 80%
Conductivity conductivity meter
µS/cm 10 10 µS/cm ± 10% ± 10% 80%
Electronic meter/probe
ppt 0.1 0.1 ppt + 10% + 10% 80% Salinity
Refractometer ppt 1 1 ppt + 1 ppt + 1 ppt 80% Nephelometer NTUs 0.1 ± 10% ± 10% 80% Secchi Disk Secchi
Depth 0.1 m 0.1 m ± 0.1 m ± 0.1 m 80% Turbidity/
Transparency Dual tube optical
JTUs 5 5 JTUs ± 5 JTUs N/A 80%
NA: not applicable * Note: Some test kits vary in sensitivity over the range of detection. The specific range of readings is noted in parentheses.
Final QAPP,10/27/03 page 7 of 37
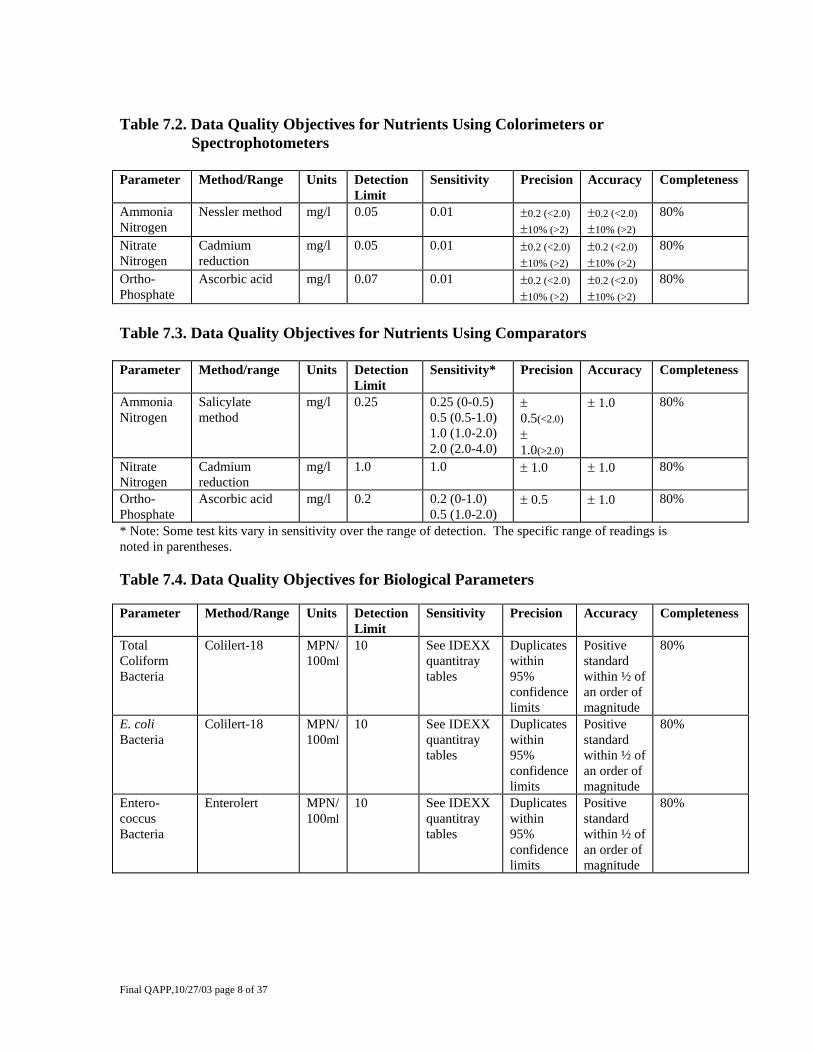
Table 7.2. Data Quality Objectives for Nutrients Using Colorimeters or
Spectrophotometers Parameter Method/Range Units Detection
Limit Sensitivity Precision Accuracy Completeness
Ammonia Nitrogen
Nessler method mg/l 0.05 0.01 ±0.2 (<2.0) ±10% (>2)
±0.2 (<2.0) ±10% (>2)
80%
Nitrate Nitrogen
Cadmium reduction
mg/l 0.05 0.01 ±0.2 (<2.0) ±10% (>2)
±0.2 (<2.0) ±10% (>2)
80%
Ortho-Phosphate
Ascorbic acid mg/l 0.07 0.01 ±0.2 (<2.0) ±10% (>2)
±0.2 (<2.0) ±10% (>2)
80%
Table 7.3. Data Quality Objectives for Nutrients Using Comparators Parameter Method/range Units Detection
Limit Sensitivity* Precision Accuracy Completeness
Ammonia Nitrogen
Salicylate method
mg/l 0.25 0.25 (0-0.5) 0.5 (0.5-1.0) 1.0 (1.0-2.0) 2.0 (2.0-4.0)
± 0.5(<2.0) ± 1.0(>2.0)
± 1.0 80%
Nitrate Nitrogen
Cadmium reduction
mg/l 1.0 1.0 ± 1.0 ± 1.0 80%
Ortho-Phosphate
Ascorbic acid mg/l 0.2 0.2 (0-1.0) 0.5 (1.0-2.0)
± 0.5 ± 1.0 80%
* Note: Some test kits vary in sensitivity over the range of detection. The specific range of readings is noted in parentheses. Table 7.4. Data Quality Objectives for Biological Parameters Parameter Method/Range Units Detection
Limit Sensitivity Precision Accuracy Completeness
Total Coliform Bacteria
Colilert-18 MPN/ 100ml
10 See IDEXX quantitray tables
Duplicates within 95% confidence limits
Positive standard within ½ of an order of magnitude
80%
E. coli Bacteria
Colilert-18 MPN/ 100ml
10 See IDEXX quantitray tables
Duplicates within 95% confidence limits
Positive standard within ½ of an order of magnitude
80%
Entero-coccus Bacteria
Enterolert MPN/ 100ml
10 See IDEXX quantitray tables
Duplicates within 95% confidence limits
Positive standard within ½ of an order of magnitude
80%
Final QAPP,10/27/03 page 8 of 37
7.1 Accuracy 7.1.1. Chemical and Physical Parameters Accuracy describes how close the measurement is to its true value. Accuracy is the measurement of a sample of known concentration and comparing the known value against the measured value. The accuracy of measurements and analyses will be checked by performing tests on standards and spiked samples at the quality control sessions held twice a year. A standard is a known concentration of a specific solution. Standards can be purchased from chemical or scientific supply companies. Standards can also be prepared by a professional partner, e.g. a commercial or research laboratory. The concentration of the standards, known to the volunteer leader, will be unknown to the monitors until after measurements are determined. The concentration of the standards should be within the mid-range of the equipment. The Data Quality Form: Accuracy, found in the Appendix, will be used to record accuracy and all QA data will be captured as per the Clean Water Team’s (CWT) Data Quality Management (DQM) Guide. 7.1.2. Biological Parameters Accuracy for bacteria will be determined by analyzing a positive control sample twice annually. A positive control is similar to a standard, except that a specific discreet value is not assigned to the bacterial concentrations in the sample. This is because bacteria are living, reproducing organisms, with variable mortality rates. Instead of a specific value, an approximate target value of the bacterial concentration is assigned to the sample by the laboratory preparing the positive control sample. Split samples will be taken amongst the different groups and with certified labs. 7.2. Comparability Comparability is the direct correlation of collected data to similar studies. Uniformity in data collection is essential for the utility of the data in the state database. Citizen monitoring groups will use the methods described in the following resource documents to ensure that their data can be compared to others: • U.S. EPA’s Volunteer Monitoring Manuals for Streams, Lakes or Estuaries, • SWRCB Clean Water Team Compendium for Water Quality Monitoring and Assessment, and • California’s Department of Fish and Game’s (CDFG) California Stream Bioassessment Protocol
(CSBP) for Citizen Monitors. • Heal the Bay’s Malibu Creek Stream Team Pilot Project, Shattering the Myths of Volunteer
Monitoring • San Francisco Estuary Institute’s Volunteer Monitoring Protocols. Before modifying these methods, or developing alternative or additional methods, technical advisors will evaluate and review the effects of the potential modification. It will be important to address their concerns about data quality before proceeding with the monitoring program. Conformity of data is an essential part of citizen monitoring programs. 7.3. Completeness Completeness is the fraction of planned data that must be collected. There are no statistical criteria that require minimal data. However, it is expected that 80% of all measurements could be taken when anticipated. This accounts for adverse weather conditions, safety concerns, and equipment problems. Completeness is determined by comparing the number of measurements planned on being collected compared to the number of measurements actually collected, also deemed valid. An invalid measurement would be one that does not meet the sampling methods requirements and the data quality objectives. Completeness results will be checked quarterly.
Final QAPP,10/27/03 page 9 of 37
This will allow for the identification and correction of problems. The Data Quality Completeness Form, found in Appendix B6, will be used to record completeness. It will alsocontribute to statewide data conformity and utility. 7.4. Precision 7.4.1. Chemical and Physical Parameters The precision objectives apply to duplicate and split samples taken as part of a QC session or as part of periodic in-field QC checks. Precision describes how well repeated measurements agree. The evaluation of precision described here relates to repeated measurements taken by either different volunteers on the same sample (at quality control sessions) or the same volunteer analyzing replicate samples (in the field). Sampling variability will not be covered in this section. The Data Quality Precision Form, found in Appendix B6, will be used to record precision. 7.4.2. Biological Parameters Precision for bacterial parameters will be determined by having the same analyst complete the procedure for laboratory duplicates of the same sample. At a minimum this should be done once per day, or run duplicates on a minimum of 5% of the samples if there are over 20 samples run per day. The results of the duplicates should be within the confidence limits supplied by the manufacturer. 7. 5. Representativeness Representativeness describes how relevant the data are to the actual environmental condition. Problems can occur if: • Samples are taken in a stream reach that does not describe the area of interest (e.g. a headwaters
sample should not be taken downstream of a point source), • Samples are taken in an unusual habitat type (e.g. a stagnant backwater instead of in the flowing
portion of the creek), • Samples are not analyzed or processed appropriately, causing conditions in the sample to change (e.g.
water chemistry measurements are not taken immediately). Representativeness will be ensured by processing the samples in accordance with Section 10, 11 and 12, by following the established methods, and by obtaining approval of this document. 7. 6. Method Detection Limit and Sensitivity The Method Detection Limit is the lowest detectable concentration for the instrument, chemical procedure, or equipment. This is important because it can never be determined if a pollutant was not present, only that it was not detected. Sensitivity refers to the detectable differences in concentration for test instruments. Thus, the sensitivity is the number of decimal places that are useable and repeatable. Detection Limits and Sensitivities are noted in Tables 7.1. - 7.5.
8. Training Requirements All citizen monitoring leaders must participate in a minimum of three days of hands-on training sessions on water quality monitoring conducted by the Clean Water Team of the State Water Resources Control Board or equivalent.
Final QAPP,10/27/03 page 10 of 37

In addition to completion of the above described training course, the citizen monitoring leaders must participate in semi-annual Quality Control Sessions. These Quality Control Sessions will be supervised by Quality Control Trainers and will provide an opportunity for citizen monitors to check the accuracy and precision of their equipment and techniques. Quality Control Trainers are defined as water quality professionals from the U.S. Environmental Protection Agency, the State Water Resources Control Board, and the Regional Water Quality Control Boards. Additional qualified trainers may be recruited and designated by the above agencies from experienced citizen monitoring organizations, universities and colleges, commercial analytical laboratories, and other federal, state, and local agencies. The volunteer leaders will bring their equipment to the Quality Control Session. Monitors will conduct duplicate tests on all analyses and meet the data quality objectives described in Section 7. If a monitor does not meet the objectives, the trainers will re-train and re-test the monitor. If there is insufficient time at the QC session to re-train and re-test monitors, the monitor will be scheduled for an additional training sessions as required. The volunteer leader will be encouraged to discontinue monitoring for the analysis of concern until training is completed. The Quality Control Trainers (Trainers) will examine kits for all of components: date, condition, and supply of reagents, and whether the equipment is in good repair. The Trainers will check data quality by testing equipment against blind standards. The Trainers will also ensure that monitors are reading instruments and recording results correctly. Sampling and safety techniques will also be evaluated. The Trainer will make noted recommendations to the volunteers to improve sampling or safety procedures. The citizen monitoring leader is responsible for the follow-up reports. Certificates of completion will be provided once all corrective action has been completed or the data quality objective is obtained (see Appendix B-5). Refresher courses after initial training will be provided as needed, or when methodology changes.
9. Documentation and Records All field results will be recorded at the time of collection using the field data sheets (see Appendix B-1). Data sheets will be reviewed for outliers and omissions before volunteers leave the sample site. Data sheets will be signed after review by the citizen monitoring leader. Data sheets will be stored in hard copy form at the location as specified in Section 5.2. Field data sheets are to be archived for three years from the time they were collected. If data entry is ever performed at another location, duplicate data sheets will be used, with the originals remaining at the headquarters site. Hard copies of all data as well as computer back-up disks are maintained at headquarters, and a second copy is to be kept at a different location.
10. Sampling Process Design 10.1. Rationale for Selection of Sampling Sites Sampling sites vary by group. The following criteria were evaluated when choosing sampling locations: • access is safe, • permission to cross private or posted public property is granted, • sample can be taken in main river current or where homogeneous mixing of water occurs, • sample is representative of the part of the water body of interest, • location complements or supplements historical data, and • location represents an area that possesses unique value for fish and wildlife or recreational use. Reference sites are chosen upstream of any potential impact. A site chosen to reflect the impact of a particular discharge, tributary or land use is located downstream of the impact where the impact is completely integrated with the water, but upstream of any secondary discharge or disturbance.
Final QAPP,10/27/03 page 11 of 37
Prior to final site selection, permission to access the water body was obtained from all property owners except publicly accessable water bodies. If access to the site becomes a problem, the citizen monitoring leader will select a new site following the site selection criteria identified in Section 10.1. Safety concerns are discussed in the field guide. Sample sites will be reviewed by the leader before sending citizen monitors out to the site. The monitoring leader will document permission and terms obtained from landowners. 10.2. Sample Design Logistics Citizen monitors are instructed to work in teams of at least two people. If a scheduled team cannot conduct the sampling, the team captain is instructed to contact the citizen monitoring leader so that arrangements can be made for a substitute trained citizen monitor. Safety measures will be discussed with all citizen monitors. No instream sampling will be conducted if there are small creek flood warnings or advisories, marine or small boat craft advisories, or storm advisories. It is the responsibility of the citizen monitoring organization to ensure the safety of their citizen monitor monitors. Safety issues are included in the Field Guide. 11. Sampling Method Requirements The Field Guide describes the appropriate sampling procedure for collecting samples for water chemistry. Water sampling apparatus may include Van Dorn Samplers, Niskin Bottles, Kemmerer Tubes, LaMotte Oxygen Samplers. In those cases where glass bottles are required in Table 11.1, plastic samplers are allowed as long as the hold time in the sampling device is minimal before transfer to the glass sample bottle. Sampling devices and sample bottles (that are not pre-sterilized and do not contain preservatives/fixing agents) will be rinsed three times with sample water prior to collecting each sample. For sterile bottles, whirl-paks, and sample bottles which contain preservatives/fixing agents (e.g., acids, etc.) never rinse with sample water prior to collecting the sample. Also, never use a sample bottle containing preservatives/fixing agents for sampling; in these cases always use a sampling device to collect the sample prior to transferring the sample into the bottle. Whenever possible, the collector will sample from a bridge so that the water body is not disturbed from wading. All samples are to be taken approximately in mid-stream, at least one inch below the surface. If it is necessary to wade into the water, the sample collector stands downstream of the sample, taking a sample upstream. If the collector disturbs sediment when wading, the collector will wait until the effect of disturbance is no longer present before taking the sample.
Final QAPP,10/27/03 page 12 of 37
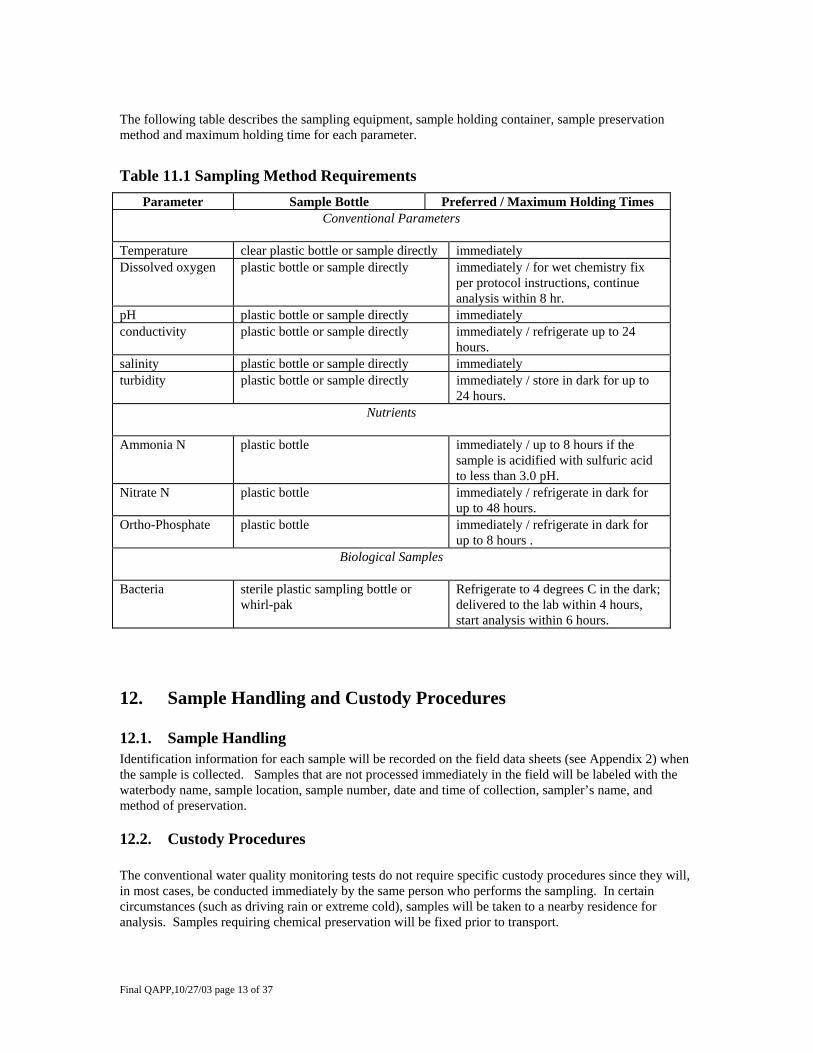
The following table describes the sampling equipment, sample holding container, sample preservation method and maximum holding time for each parameter.
Table 11.1 Sampling Method Requirements Parameter Sample Bottle Preferred / Maximum Holding Times
Conventional Parameters Temperature clear plastic bottle or sample directly immediately Dissolved oxygen plastic bottle or sample directly immediately / for wet chemistry fix
per protocol instructions, continue analysis within 8 hr.
pH plastic bottle or sample directly immediately conductivity plastic bottle or sample directly immediately / refrigerate up to 24
hours. salinity plastic bottle or sample directly immediately turbidity plastic bottle or sample directly immediately / store in dark for up to
24 hours. Nutrients
Ammonia N plastic bottle immediately / up to 8 hours if the
sample is acidified with sulfuric acid to less than 3.0 pH.
Nitrate N plastic bottle immediately / refrigerate in dark for up to 48 hours.
Ortho-Phosphate plastic bottle immediately / refrigerate in dark for up to 8 hours .
Biological Samples Bacteria sterile plastic sampling bottle or
whirl-pak Refrigerate to 4 degrees C in the dark; delivered to the lab within 4 hours, start analysis within 6 hours.
12. Sample Handling and Custody Procedures
12.1. Sample Handling Identification information for each sample will be recorded on the field data sheets (see Appendix 2) when the sample is collected. Samples that are not processed immediately in the field will be labeled with the waterbody name, sample location, sample number, date and time of collection, sampler’s name, and method of preservation.
12.2. Custody Procedures The conventional water quality monitoring tests do not require specific custody procedures since they will, in most cases, be conducted immediately by the same person who performs the sampling. In certain circumstances (such as driving rain or extreme cold), samples will be taken to a nearby residence for analysis. Samples requiring chemical preservation will be fixed prior to transport.
Final QAPP,10/27/03 page 13 of 37
When samples are transferred from one citizen monitor to another member of the same organization for analysis, or from the citizen monitoring group to an outside professional laboratory, then a Chain of Custody Form should be used. This form identifies the waterbody name, sample location, sample number, date and time of collection, sampler’s name, and method used to preserve sample (if any). It also indicates the date and time of transfer, and the name and signature of the sampler and the sample recipient. In cases where the sample remains in the custody of the monitoring organization, then the field data sheet may be allowed to double as the chain of custody form. It is recommended that when a sample leaves the custody of the monitoring group, then the Chain of Custody Form used be the one provided by the outside professional laboratory. Similarly, when quality control checks are performed by a professional lab, their samples will be processed under their chain of custody procedures with their labels and documentation procedures.
12.3. Disposal All analyzed samples or spent chemicals (except for waste from the nitrate/cadmium reduction test and the Nessler ammonia test) including used reagents, buffers or standards will be collected in a plastic bottle clearly marked “Waste” or “Poison”. This waste material will be disposed of according to appropriate state and local laws and regulations. This will usually mean disposal into a drain connected to a sewage treatment plant. Liquid waste from the cadmium reduction nitrate test will be kept separate and disposed of at a facility that is permitted to handle, transport, or dispose cadmium (Cd) waste. Liquid waste from the Nessler ammonia test (which contains mercury) will likewise be kept separate and disposed of at a facility that is permitted to handle, transport, or dispose mercury (Hg) waste. Waste from the salicylate ammonia test can be held in the regular waste container and disposed of as described in the previous paragraph. Whenever possible, if waste includes reagents from the detergent test, these wastes will be poured down a drain underneath a flume hood.
13. Analytical Methods Requirements Water chemistry is to be monitored using protocols outlined in the Field Guide. The methods were chosen based on the following criteria: • capability of citizen monitors to use methods, • provide data of known quality, • ease of use, • methods can be compared to professional methods in Standard Methods1. If modifications of methods are needed, comparability will be determined by side-by-side comparisons with a US EPA or APHA Standard Method on no less than 50 samples. If the results meet the same precision and accuracy requirements as the approved method, the new method will be accepted.
1 Standard Methods for the Examination of Water and Wastewater is a comprehensive reference that covers all aspects of water and wastewater analysis techniques. A joint publication of the American Public Health Association, the American Water Works Association, and the Water Environment Federation, the most recent Standard Methods, 20th Edition was published in 1998.
Final QAPP,10/27/03 page 14 of 37
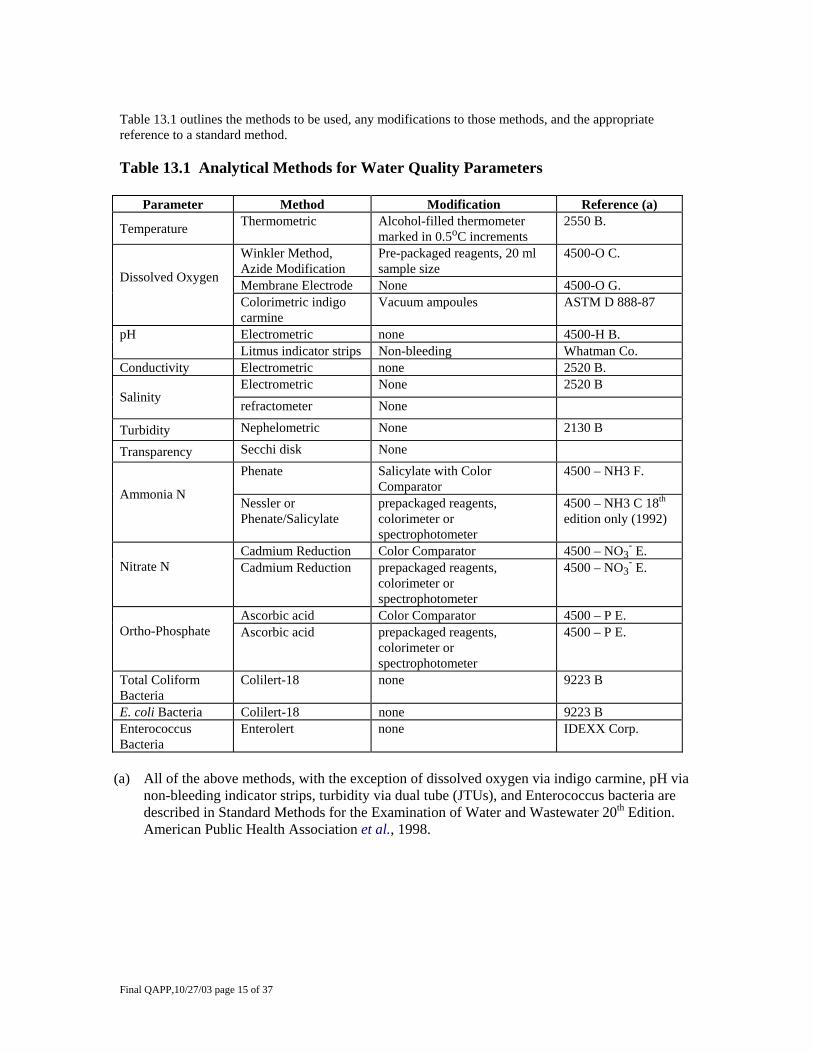
Table 13.1 outlines the methods to be used, any modifications to those methods, and the appropriate reference to a standard method. Table 13.1 Analytical Methods for Water Quality Parameters
Parameter Method Modification Reference (a)
Temperature Thermometric Alcohol-filled thermometer marked in 0.5oC increments
2550 B.
Winkler Method, Azide Modification
Pre-packaged reagents, 20 ml sample size
4500-O C.
Membrane Electrode None 4500-O G. Dissolved Oxygen
Colorimetric indigo carmine
Vacuum ampoules ASTM D 888-87
Electrometric none 4500-H B. pH Litmus indicator strips Non-bleeding Whatman Co. Conductivity Electrometric none 2520 B.
Electrometric None 2520 B Salinity
refractometer None
Turbidity Nephelometric None 2130 B
Transparency Secchi disk None Phenate Salicylate with Color
Comparator 4500 – NH3 F.
Ammonia N Nessler or
Phenate/Salicylate prepackaged reagents, colorimeter or spectrophotometer
4500 – NH3 C 18th edition only (1992)
Cadmium Reduction Color Comparator 4500 – NO3- E.
Nitrate N
Cadmium Reduction prepackaged reagents, colorimeter or spectrophotometer
4500 – NO3- E.
Ascorbic acid Color Comparator 4500 – P E. Ortho-Phosphate
Ascorbic acid prepackaged reagents, colorimeter or spectrophotometer
4500 – P E.
Total Coliform Bacteria
Colilert-18 none 9223 B
E. coli Bacteria Colilert-18 none 9223 B Enterococcus Bacteria
Enterolert none IDEXX Corp.
(a) All of the above methods, with the exception of dissolved oxygen via indigo carmine, pH via
non-bleeding indicator strips, turbidity via dual tube (JTUs), and Enterococcus bacteria are described in Standard Methods for the Examination of Water and Wastewater 20th Edition. American Public Health Association et al., 1998.
Final QAPP,10/27/03 page 15 of 37
14. Quality Control Requirements Quality control samples will be taken to ensure valid data are collected. Depending on the parameter, quality control samples will consist of blanks (field, trip and laboratory), replicate samples, and split samples. The temperature of the sample transport container will also be measured. In addition, quality control sessions (a.k.a. intercalibration exercises) will be held twice a year to verify the proper working order of equipment, refresh citizen monitors in monitoring techniques and insure data quality objectives are met.
14.1. Cautions Regarding Test Procedures 14.1.1. Winkler Method for Dissolved Oxygen The Winkler method is not appropriate for highly alkaline waters. Other citizen monitoring groups have noted problems with short shelf-life of the sodium thiosulfate reagent. Field measurements should be evaluated immediately to determine whether they are reasonable. The validity of the dissolved oxygen test will also be assured by taking these steps: • Care is taken not to aerate water samples during collection, • Water is added gently to the dissolved oxygen bottle, • No air bubbles are present in the sample, • The titration sample will be measured carefully with a graduated cylinder, • The sample is swirled thoroughly after each drop of titrant, If the endpoint is overrun, another 20 ml. of the sample will be titrated.
14.1.2. Nutrients The nitrate test measures nitrite as well as nitrate. Therefore the results for the nitrate test are actually mg/l Nitrite + Nitrate Nitrogen. When mixing nitrate reagents citizen monitors should take care not to agitate samples aggressively. Phosphate reagents (the LaMotte chemical test kits) have been shown to degrade well within their listed shelf life once opened.
14.1.3. Urban Pollutants The tests for detergent, chlorine, and phenol should not be conducted on saline waters. Suspended matter and algae may give false positive results for detergent. The low sensitivity of the copper test may preclude detecting copper as most falls out of solution forming copper carbonate.
14.2. Blanks, Replicates, Split Samples, and Standardization Field/Trip/Laboratory Blanks: In our testing, a field blank will be distilled water exposed to the sampling environment at the sample site, a trip blank will be distilled water taken from the laboratory and into the field and returned to the lab unopened, and a lab blank will be distilled water put through the entire lab procedure and analysis. For all conventional water quality analyses, except temperature, dissolved oxygen and pH, field and trip blanks will be analyzed once daily. For nutrients using comparators, a field blank will be analyzed every sampling trip. Color can sometimes appear in these nutrient blanks, suggesting that the real samples may be overestimating the true nutrient concentration. When colorimeters or spectrophotometers are used at the group’s facility for nutrient analysis, a laboratory reagent blank will be analyzed and recorded for each day of analysis. For urban pollutants, field and trip blanks will be run daily. For bacterial analysis performed at a group’s facility, a laboratory blank will be performed for each sampling/analysis event.
Final QAPP,10/27/03 page 16 of 37

Instructions for Field, Trip, and Lab Blanks: Distilled water is taken into the field or used in the laboratory and handled just like a sample. It will be poured into the sample container and then analyzed. When reagents are used in a test method, then the reagents are added to the distilled water and these types of blanks are referred to as reagent blanks. Field blanks are recorded on the field data sheet. For nutrients measured with comparators, results from the field reagent blanks should be “not detected”. If nutrients are detected, corrective action will be taken to eliminate the problem. For nutrients measured with colorimeters, the lab reagent blanks should be less than 0.05 ppm and the specific value should be recorded and subtracted from the field sample result. For bacterial analysis, the reagents are added to distilled water (in the same manner as for a field sample) and that blank is then sealed in a quantitray and incubated along with the field samples. The blank should be below detection limits (i.e., no positive wells) at the end of the incubation period. Field Confirmations: When a second method for measuring temperature, dissolved oxygen, pH, turbidity, and salinity is available in the field, then the monitors are encouraged to perform both measurements on a split sample at least once daily. Examples of this sort of redundant measurement would be: For temperature, the use of a thermistor (or electronic thermometer) (such as those that are built into
dissolved oxygen meters) and an armored thermometer; For dissolved oxygen, the use of an oxygen meter and an indigo carmine colorimetric kit; For pH, a meter and a non-bleeding indicator strip, For turbidity, a nephelometer and a Secchi disk, For salinity, an electrode (such as those built into dissolved oxygen meters) and a refractometer.
This will serve to provide backup capability if the more sensitive electronic meters fail, and will provide additional confidence as to the quality of the data. The results of both measurements will be recorded along with the procedure used on the field data sheet. If both results are comparable, then the result produced using the method of greater sensitivity will be the one entered in the final data set by the data manager in consultation with the monitoring leader. If the two results are inconsistent, then the monitoring leader will note on the data sheet which of the results will be entered on the final data set by the data manager. Replicate Samples: Replicate samples are two or more samples collected at the same time and place. When there are only two replicates then these are referred to as duplicates. For conventional water quality, nutrients, and urban pollutant analyses duplicate field samples will be taken once every 20 samples, or quarterly whichever comes first. Duplicate samples will be collected as soon as possible after the initial sample has been collected, and will be subjected to identical handling and analysis. For bacterial analysis, lab duplicates will be run at least once per sampling day, and when there are more than 20 samples run per day then there will be a minimum 5% of the samples analyzed in duplicate. Split Samples: Twice a year, split spiked samples (standards) will be analyzed as part of the Quality Control Session. The split standard is one sample, containing a known concentration of an analyte, that is divided equally into two or more sample containers. Split standards will be analyzed by the citizen monitors, and sent to a professional laboratory (except for dissolved oxygen, temperature, and pH), before the maximum sample handling time is exceeded. Citizen monitors will analyze the split standard normally and will perform at least three analyses on that same sample. From these results accuracy and precision will be determined. The professional laboratory will analyze the sample using the method referenced in Table 13.1 For turbidity using the dual tube (JTU) method, split field samples will be analyzed as part of the Quality Control Session. The laboratory receiving the split sample will analyze it using the nephelometric method, even though these results are not strictly comparable to the visual JTU comparators. The results of turbidity using the two methods will be plotted to determine if there is a linear correlation. If this correlation is significant, then it will be used to estimate and compare results of the turbidity tubes with nephlometric results. The Technical Advisory Committee for all groups will use the product-moment correlation coefficient (r) to determine the adequacy of the correlation.
Final QAPP,10/27/03 page 17 of 37
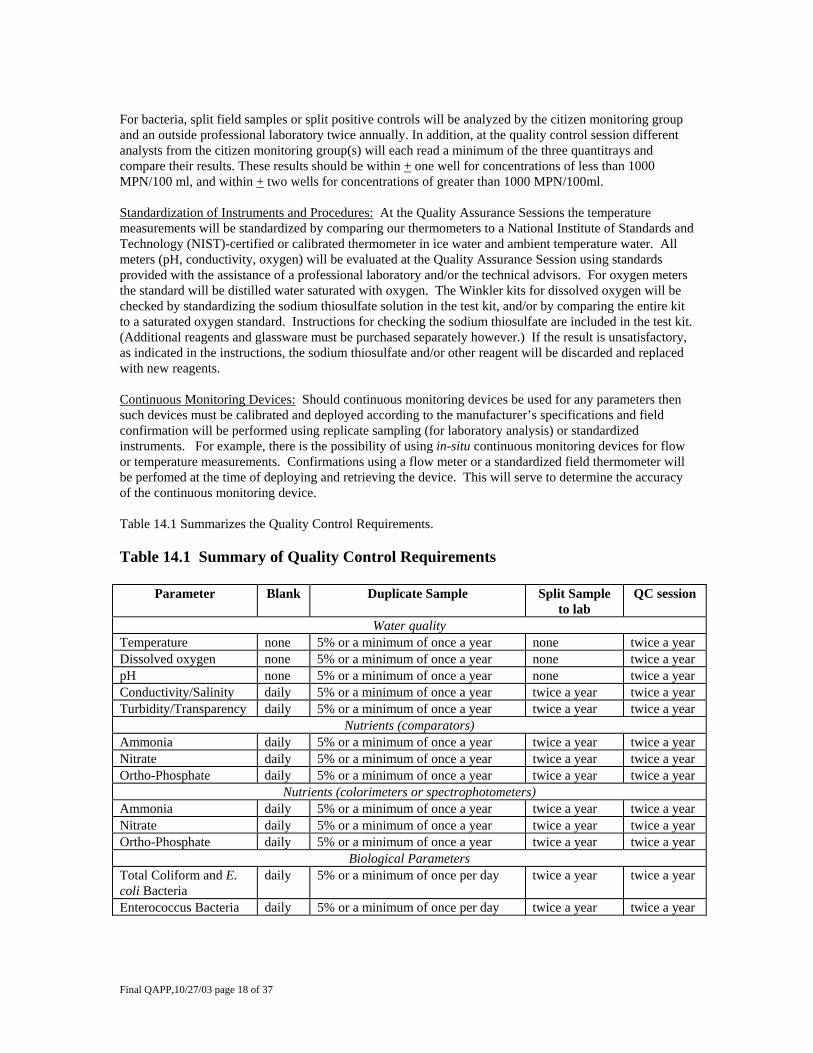
For bacteria, split field samples or split positive controls will be analyzed by the citizen monitoring group and an outside professional laboratory twice annually. In addition, at the quality control session different analysts from the citizen monitoring group(s) will each read a minimum of the three quantitrays and compare their results. These results should be within + one well for concentrations of less than 1000 MPN/100 ml, and within + two wells for concentrations of greater than 1000 MPN/100ml. Standardization of Instruments and Procedures: At the Quality Assurance Sessions the temperature measurements will be standardized by comparing our thermometers to a National Institute of Standards and Technology (NIST)-certified or calibrated thermometer in ice water and ambient temperature water. All meters (pH, conductivity, oxygen) will be evaluated at the Quality Assurance Session using standards provided with the assistance of a professional laboratory and/or the technical advisors. For oxygen meters the standard will be distilled water saturated with oxygen. The Winkler kits for dissolved oxygen will be checked by standardizing the sodium thiosulfate solution in the test kit, and/or by comparing the entire kit to a saturated oxygen standard. Instructions for checking the sodium thiosulfate are included in the test kit. (Additional reagents and glassware must be purchased separately however.) If the result is unsatisfactory, as indicated in the instructions, the sodium thiosulfate and/or other reagent will be discarded and replaced with new reagents. Continuous Monitoring Devices: Should continuous monitoring devices be used for any parameters then such devices must be calibrated and deployed according to the manufacturer’s specifications and field confirmation will be performed using replicate sampling (for laboratory analysis) or standardized instruments. For example, there is the possibility of using in-situ continuous monitoring devices for flow or temperature measurements. Confirmations using a flow meter or a standardized field thermometer will be perfomed at the time of deploying and retrieving the device. This will serve to determine the accuracy of the continuous monitoring device. Table 14.1 Summarizes the Quality Control Requirements. Table 14.1 Summary of Quality Control Requirements
Parameter Blank Duplicate Sample Split Sample to lab
QC session
Water quality Temperature none 5% or a minimum of once a year none twice a year Dissolved oxygen none 5% or a minimum of once a year none twice a year pH none 5% or a minimum of once a year none twice a year Conductivity/Salinity daily 5% or a minimum of once a year twice a year twice a year Turbidity/Transparency daily 5% or a minimum of once a year twice a year twice a year
Nutrients (comparators) Ammonia daily 5% or a minimum of once a year twice a year twice a year Nitrate daily 5% or a minimum of once a year twice a year twice a year Ortho-Phosphate daily 5% or a minimum of once a year twice a year twice a year
Nutrients (colorimeters or spectrophotometers) Ammonia daily 5% or a minimum of once a year twice a year twice a year Nitrate daily 5% or a minimum of once a year twice a year twice a year Ortho-Phosphate daily 5% or a minimum of once a year twice a year twice a year
Biological Parameters Total Coliform and E. coli Bacteria
daily 5% or a minimum of once per day twice a year twice a year
Enterococcus Bacteria daily 5% or a minimum of once per day twice a year twice a year
Final QAPP,10/27/03 page 18 of 37
15. Instrument/Equipment Testing, Inspection, and Maintenance
15.1. Temperature Before each use, thermometers are to be checked for breaks in the column. If a break is observed, the alcohol thermometer will be placed in hot water causing the alcohol to expand and fill the column. Verify accuracy by comparing with a calibrated or certified thermometer.
15.2. Dissolved oxygen Dissolved Oxygen Winkler Titration: Before each use, bottles, droppers, and color comparators are checked to see if they are clean and in good working order. If the pH is high (alkaline), alternative testing methods should be used. Reagents are replaced annually according to manufacturer’s recommendation. Dissolved Oxygen Meters: Membranes and solutions should be replaced according to manufacturer’s specifications, but at least quarterly. Membranes should be checked for bubbles after replacement. Before each use, D.O. meters are checked to see if they are clean and in good working order.
15.3. Conductivity and pH Before each use, conductivity and pH meters are checked to see if they are clean and in good working order. Conductivity and pH meters are calibrated before each use. Conductivity standards and pH buffers are replaced at least annually. Conductivity standards are stored with the cap firmly in place and in a dry place kept away from extreme heat. Do not re-use pH or conductivity standards.
15.4. Turbidity and Transparency Secchi: Meter measurements on the Secchi disk line should be checked for accuracy. Two measurements should be taken, one when the disk just disappears, and one when the disk just reappears. Dual Tube Turbidity (JTU’s): Before each use, turbidity tubes are checked to ensure that they are clean. The turbidity standard will be replaced annually. Nephelometers: Meters and tubes should be checked for cleanliness and proper operation. The tubes should not be smudged or scratched.
15.5. Nutrients and Urban Pollutants Before each use, test kits are checked to ensure that droppers, sample containers, and color comparators are clean and in working condition. Colorimeter tubes should be checked to make sure they are clean and are not scratched. Reagents are replaced annually or according to manufacturer’s instructions.
16. Instrument Calibration / Standardization and Frequency Instruments will be calibrated and reagents checked against standards accordingly to the following schedule. Standards will be purchased from a chemical supply company or prepared by (or with the assistance of) a professional laboratory. Calibration records will be kept in the maintenance log at the headquarters location (described in Section 5.2.) where it can be easily accessed before and after equipment use. Calibrations that are performed by monitors in the field are recorded on the field data sheets, also archived at the headquarters. The frequency of calibration is described in Table 16.1.
Final QAPP,10/27/03 page 19 of 37
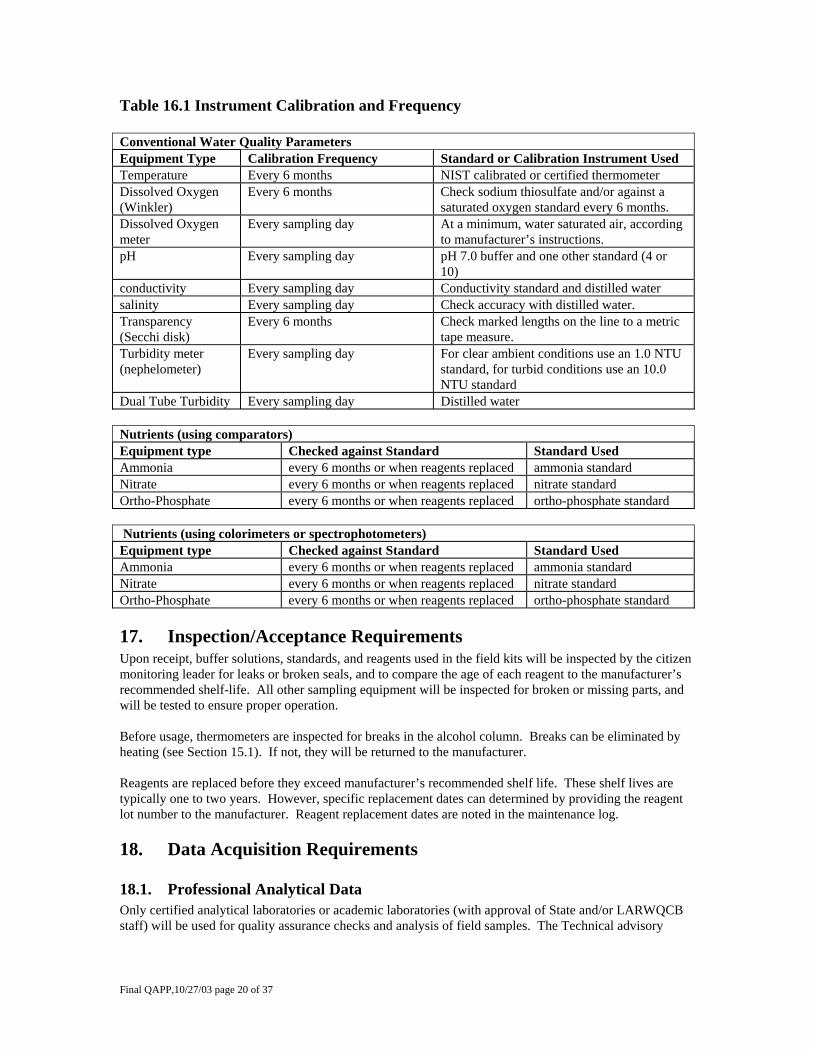
Table 16.1 Instrument Calibration and Frequency Conventional Water Quality Parameters Equipment Type Calibration Frequency Standard or Calibration Instrument Used Temperature Every 6 months NIST calibrated or certified thermometer Dissolved Oxygen (Winkler)
Every 6 months Check sodium thiosulfate and/or against a saturated oxygen standard every 6 months.
Dissolved Oxygen meter
Every sampling day At a minimum, water saturated air, according to manufacturer’s instructions.
pH Every sampling day pH 7.0 buffer and one other standard (4 or 10)
conductivity Every sampling day Conductivity standard and distilled water salinity Every sampling day Check accuracy with distilled water. Transparency (Secchi disk)
Every 6 months Check marked lengths on the line to a metric tape measure.
Turbidity meter (nephelometer)
Every sampling day For clear ambient conditions use an 1.0 NTU standard, for turbid conditions use an 10.0 NTU standard
Dual Tube Turbidity Every sampling day Distilled water Nutrients (using comparators) Equipment type Checked against Standard Standard Used Ammonia every 6 months or when reagents replaced ammonia standard Nitrate every 6 months or when reagents replaced nitrate standard Ortho-Phosphate every 6 months or when reagents replaced ortho-phosphate standard Nutrients (using colorimeters or spectrophotometers) Equipment type Checked against Standard Standard Used Ammonia every 6 months or when reagents replaced ammonia standard Nitrate every 6 months or when reagents replaced nitrate standard Ortho-Phosphate every 6 months or when reagents replaced ortho-phosphate standard
17. Inspection/Acceptance Requirements Upon receipt, buffer solutions, standards, and reagents used in the field kits will be inspected by the citizen monitoring leader for leaks or broken seals, and to compare the age of each reagent to the manufacturer’s recommended shelf-life. All other sampling equipment will be inspected for broken or missing parts, and will be tested to ensure proper operation. Before usage, thermometers are inspected for breaks in the alcohol column. Breaks can be eliminated by heating (see Section 15.1). If not, they will be returned to the manufacturer. Reagents are replaced before they exceed manufacturer’s recommended shelf life. These shelf lives are typically one to two years. However, specific replacement dates can determined by providing the reagent lot number to the manufacturer. Reagent replacement dates are noted in the maintenance log.
18. Data Acquisition Requirements
18.1. Professional Analytical Data Only certified analytical laboratories or academic laboratories (with approval of State and/or LARWQCB staff) will be used for quality assurance checks and analysis of field samples. The Technical advisory
Final QAPP,10/27/03 page 20 of 37
Committee (TAC) or technical advisors will review these laboratories’ data as well as the citizen monitors. They may also review the lab’s own quality control data to ensure data validity.
18.2. Geographical Information/ Mapping United States Geologic Survey (USGS) maps will be used to verify watershed boundaries and river courses. National Oceanographic and Atmospheric Administration (NOAA) navigation charts can be used for mapping marine sampling sites. Additional information on distribution of natural resources will be obtained from the National Park Service (NPS) and the California Department of Fish and Game (CDFG) Biodiversity database. Land use information will be obtained from local planning offices. When information is requested, the agency will be asked to provide appropriate megadata and any information on data limitations. This information will be maintained with the data files.
19. Data Management Field data sheets are checked and signed in the field by the citizen monitoring leader. The citizen monitoring leader will identify any results where holding times have been exceeded, sample identification information is incorrect, samples were inappropriately handled, or calibration information is missing or inadequate. Such data will be marked as unacceptable by the monitoring leader and will not be entered into the electronic data base. As part of standard field protocols, any sample readings out of the expected range will be reported to the citizen monitoring leader. A second sample will be taken as soon as possible to verify the condition. If the data is invalid, then the data will be noted (flagged) on the data sheet. We will take further actions to trace the sources of error, and to correct those problems. If the error is a result of improper monitoring procedures, then we may re-train monitors until their performance is acceptable. It is the responsibility of the citizen monitoring leader to re-train citizen monitors until performance is acceptable. Independent laboratories will report their results to the citizen monitoring leader. The leader will verify sample identification information, review the chain-of-custody forms, and identify the data appropriately in the database. These data are also reviewed by the technical advisors quarterly. The data management coordinator will review the field sheets and enter the data deemed acceptable by the citizen monitoring leader and the technical advisors. Range checks and other QA/QC methods will be performed before accepting the data set and data analysis. Upon entering the data the data management coordinator will sign and archive the field data sheets. Data will be entered into a spreadsheet (MS Excel) or a database (MS Access) in a way that will be compatible with EPA’s STORET2 and the Regional WQCB’s database guidelines. Following initial data entry the data coordinator will review electronic data, compare to the original data sheets and correct entry errors. After performing data checks, and ensuring that data quality objectives have been met, data analysis will be performed. Raw data will be provided to the State WQCB and Regional WQCB in electronic form at least once every two years so that it can be included in the 305(b) report. Appropriate quality assurance information may be provided on request.
20. Assessment and Response Actions Review of all field and data activities is the responsibility of the citizen monitoring leader, with the assistance of the technical advisory committee. Citizen monitors will be accompanied by the citizen monitoring leader, or a technical advisor on at least one of their first 5 sampling trips. If possible, citizen
2 EPA’s STORET (short for STOrage and RETrieval) is a repository for water quality, biological, and physical data and is used by state environmental agencies, EPA and other federal agencies, universities, private citizens, and many others.
Final QAPP,10/27/03 page 21 of 37

monitors in need of performance improvement will be retrained on-site. All citizen monitors must attend a refresher course offered by the citizen monitoring group. If errors in sampling technique are consistently identified, retraining may be scheduled more frequently.
21. Reports Raw data screened by the Quality Assurance (QA) officer will be made available to data users per request. The citizen monitoring organization(s) will report their data to its (their) constituents only after QA/QC standards have been reviewed and approved by their technical advisors. Every effort will be made to submit data and/or a report to the State and/or LARWQCB staff in a fashion timely for their data uses, e.g. 305(b) reports.
22. Validation and Verification Methods As part of standard field protocols, any sample readings out of the expected range will be reported to the citizen monitoring leader. A second sample will be taken as soon as possible to verify the condition. If the data is invalid, then the data will be noted (flagged) on the data sheet. We will take further actions to trace the sources of error, and to correct those problems. If the error is a result of improper monitoring procedures, then we may re-train monitors until their performance is acceptable. It is the responsibility of the citizen monitoring leader to re-train citizen monitors until performance is acceptable.
Final QAPP,10/27/03 page 22 of 37
APPENDICES Appendix A − Description of the Participating Organizations
1.0 Algalita Marine Research Non-Profit Foundation (AMRF) AMRF's focus is on nearshore marine habitat and recreational waters affected by urban runoff. Currently, proliferation of marine dinoflagellates in Long Beach Harbor is causing a permanent red tide heretofore unknown in these waters. The relationship of urban runoff to red tide has been one focus of AMRF research since 1995. The possibility of toxic dinoflagellate proliferation is an important consideration in our research. Like the algae blooms that plague European seaports and those that kill Florida manatees, our permanent red tide may be yet another sign that humans are changing coastal environments in ways that could have serious consequences for wildlife and people.
Technical Advisors Bill Yanko, LA County Sanitation Chuck Mitchell, Marine Biological Consultants Dr. Balchandra Bave, Consultech Walton Wright, professional environmental consultant
Group Leaders Charles Moore, Algalita Marine Research Non-Profit Foundation
2.0 Bolsa Chica Conservancy The Bolsa Chica Conservancy is a non-profit, non-political organization whose mission is to advocate the restoration and preservation of the Bolsa Chica Wetlands through public outreach, participation, education and leadership. We are a coalition of responsible community leaders from science, business, education, and government. In summary: We restore. We educate. We advocate. Technical Advisors To be announced. Group Leaders Claire Grozinger, Bolsa Chica Conservancy Rick Wojciechowski, Bolsa Chica Conservancy
3.0 Cabrillo Marine Aquarium Cabrillo Marine Aquarium interprets the marine life of southern California and is a facility of the City of Los Angeles Department of Recreation and Parks. Located by the Los Angeles Harbor, over 400,000 visitors come to the Aquarium annually and approximately 1 million visitors spend time at the surrounding coastal habitats of sandy beaches, rocky shore and salt marsh. The mission of the Aquarium is to provide education, research, conservation and recreation opportunities for the visitors. Over 400 volunteers assist the staff with interpretation during tours, classes and public programs. Additional volunteers assist with
Final QAPP,10/27/03 page 23 of 37

animal husbandry and environmental monitoring including ongoing research surveys. Volunteers are trained to use field equipment in conducting surveys, to collect data and to help with maintaining a database. These results are shared with visitors to the aquarium and will be used to get a long term profile of the health of the surrounding habitats.
Technical Advisors Technical advisor, Michael Shaadt, Cabrillo Aquarium
Group Leaders Linda Chilton, Cabrillo Marine Aquarium
4.0 Divers Involved Voluntarily in Environmental Rehabilitation and Safety (D.I.V.E.R.S.)
D.I.V.E.R.S. focus is on near shore marine habitat and recreational waters affected by urban runoff. Our study proposes to identify characteristics of pollutants and effluent of city streets and storm drains with respect to their effect on the locale specific to Main Beach in Laguna Beach.
Technical Advisors Technical advisors to be recruited.
Group Leaders Dawn Marcova Martin Carreon
5.0 Heal the Bay Heal the Bay’s goal is to work with the California Coastal Conservancy to implement a pilot Malibu Creek Watershed Citizen Monitoring Program. The objective of the pilot program is to create the foundations for watershed “watchdogs” that will result in citizen stewardship of the watershed. Watchdogs, ultimately, are those who can singly or collectively, identify problems in the watershed. Heal the Bay believes that stewardship will lead to greater awareness of pollution problems, an eventual reduction of pollutant loads to the watershed, and greater protection of the Malibu Creek Watershed’s beneficial uses-- habitat for fish and wildlife, and swimming, diving, and surfing. Heal the Bay would like to see as part of the overall goals of volunteer monitoring the formation of a standardized data format within watersheds such as the use of Geographic Information Systems to map and display results of the monitoring. Heal the Bay feels that a standardized format will make integrating and analyzing data easier and more useful to the public and decision makers.
Technical Advisors Dr. Mark Gold, Executive Director, Heal the Bay, D.Env., Environmental Science and Engineering: UCLA 1994. M.A., Biology: UCLA, 1986. B.S., Biology: UCLA, 1984 Dr. Randal Orton, , D.Env., Environmental Science and Engineering: UCLA, 1992. Ph D. Population genetics: UCLA 1989. M.A., Marine Biology: San Francisco State University, 1983. B.S. Biology: UCLA, 1979.
Group Leaders Lisa L. Dobbins, Program Director, Heal the Bay. Mark Abramson, Malibu Creek Watershed Volunteer Monitoring Project Coordinator, Heal the Bay.
Final QAPP,10/27/03 page 24 of 37

6.0 Santa Monica BayKeeper The primary mission of the Santa Monica BayKeeper is to continually survey the environmental health of the Santa Monica Bay, San Pedro Bay and adjacent coastal waters and watersheds; to alert the public to potential hazards and expose those who contribute in any way to the degradation of this ecosystem. Storm drain pollution contributes largely to the degradation of the Santa Monica Bay. The pollutants in the Santa Monica Bay come from thousands of different sources and from communities throughout Los Angeles County. The trash, used oil and other toxic materials that are dumped into gutters, or discarded on streets all over the county are eventually washed by rains into storm drains and flow directly into the Bay. Volunteer monitoring enables the BayKeeper to monitor each of the 350 storm drains that flow into the bay so that we may identify and stop pollution sources. In our most recent wet weather sampling we were able to identify a drain that had unusually high levels of particular contaminants. The BayKeeper traced the runoff to a point source and found that there was a facility whose runoff was washing directly into a gutter that flowed out where the sample was taken. After working with the polluter they have changed their facility drastically so as to eliminate the runoff.
Technical Advisors Ladan Mohajerani, Santa Monica BayKeeper Jim Noblet, PhD, Santa Monica BayKeeper
Group Leaders Kris Haddad, Santa Monica BayKeeper Terry Tamminen, Santa Monica BayKeeper Angie Bera, Santa Monica BayKeeper
7.0 Southern California Marine Institute (SCMI)
Technical Advisors Rich Gossett, CRG Marine Labs Rick Pieper, Director, SCMI
Group Leaders Kerry Flaherty For EMP: Carrie Wolfe, and participating teachers For Yacht Clubs: Tom Eskridge, Long Beach Yacht Club
8.0 Surfrider - Huntington/Seal Beach Chapter The goals of the Surfrider monitoring program in Orange County are to identify pollutants or contaminants and pollution sources to Orange County beach waters.
Technical Advisors Technical advisors will be recruited.
Group Leaders Don Schulz
Final QAPP,10/27/03 page 25 of 37
9.0 Surfrider – Long Beach Chapter The goals of the Surfrider monitoring program in Long Beach are to identify pollutants or contaminants and pollution sources to Long Beach waters. Technical Advisors Rich Gossett, CRG Marine Labs Group Leaders Emiko Kobiashie
Final QAPP,10/27/03 page 26 of 37
Appendix B – Data Sheets and Forms
1 – Field Data Sheet 2 – Volunteer Water Quality Monitoring Sign in Sheet
3 – Volunteer Monitors Inter-Calibration and QA Session Chemical and Physical Parameters
4 – Citizen Monitor Training Evaluation Form 5 – Certificate of Completion
6 – Data Quality Forms (Accuracy, Precision, Completeness)
Final QAPP,10/27/03 page 27 of 37
Appendix C – Map of Volunteer Sampling Stations
Final QAPP, 10/27/03, page 36 of 37