Embed Size (px)
Citation preview
St George State School Queensland State School Reporting 2015 School Annual Report
Postal address PO Box 231 St George 4487
Phone (07) 4620 8333
Fax (07) 4620 8300
Email [email protected]
Webpages Additional reporting information pertaining to Queensland state schools is located on the My School website and the Queensland Government data website.
Contact person Mrs Debbie Kings/Mrs Michelle Strugnell
Principal’s foreword Introduction
The St George State School provides the young people of St George with high quality learning and skilling focused on preparing them with the knowledge, skills and confidence to participate effectively in the community.
The School’s key strategic priorities that guide us in the pursuit of our vision of “Caring, Learning, Achieving Together” are the cornerstones of School operations:
Implementing the Australian Curriculum. Implementing whole School pedagogical practices. Using data to inform teaching practice. Developing instructional leadership. Developing productive partnerships. Improving School performance.
School progress towards its goals in 2015
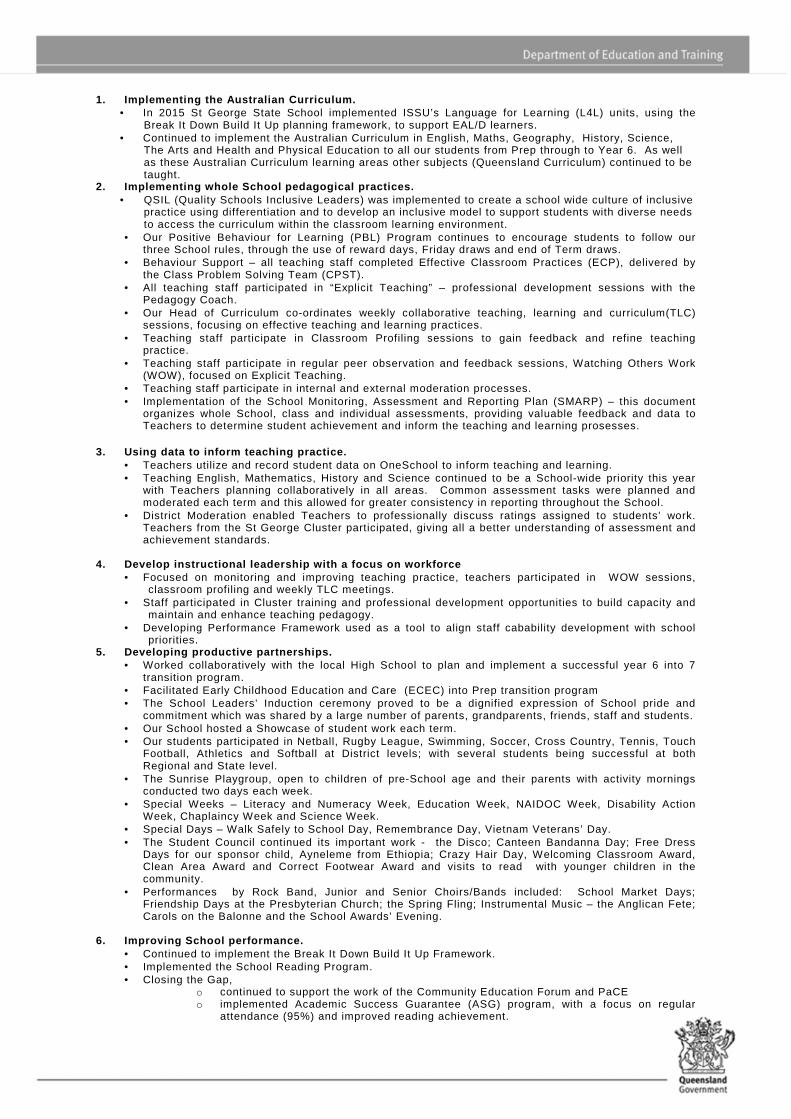
1. Implementing the Australian Curriculum. • In 2015 St George State School implemented ISSU’s Language for Learning (L4L) units, using the
Break It Down Build It Up planning framework, to support EAL/D learners. • Continued to implement the Australian Curriculum in English, Maths, Geography, History, Science,
The Arts and Health and Physical Education to all our students from Prep through to Year 6. As well as these Australian Curriculum learning areas other subjects (Queensland Curriculum) continued to be taught.
2. Implementing whole School pedagogical practices. • QSIL (Quality Schools Inclusive Leaders) was implemented to create a school wide culture of inclusive
practice using differentiation and to develop an inclusive model to support students with diverse needs to access the curriculum within the classroom learning environment.
• Our Positive Behaviour for Learning (PBL) Program continues to encourage students to follow our three School rules, through the use of reward days, Friday draws and end of Term draws.
• Behaviour Support – all teaching staff completed Effective Classroom Practices (ECP), delivered by the Class Problem Solving Team (CPST).
• All teaching staff participated in “Explicit Teaching” – professional development sessions with the Pedagogy Coach.
• Our Head of Curriculum co-ordinates weekly collaborative teaching, learning and curriculum(TLC) sessions, focusing on effective teaching and learning practices.
• Teaching staff participate in Classroom Profiling sessions to gain feedback and refine teaching practice.
• Teaching staff participate in regular peer observation and feedback sessions, Watching Others Work (WOW), focused on Explicit Teaching.
• Teaching staff participate in internal and external moderation processes. • Implementation of the School Monitoring, Assessment and Reporting Plan (SMARP) – this document
organizes whole School, class and individual assessments, providing valuable feedback and data to Teachers to determine student achievement and inform the teaching and learning prosesses.
3. Using data to inform teaching practice.
• Teachers utilize and record student data on OneSchool to inform teaching and learning. • Teaching English, Mathematics, History and Science continued to be a School-wide priority this year
with Teachers planning collaboratively in all areas. Common assessment tasks were planned and moderated each term and this allowed for greater consistency in reporting throughout the School.
• District Moderation enabled Teachers to professionally discuss ratings assigned to students’ work. Teachers from the St George Cluster participated, giving all a better understanding of assessment and achievement standards.
4. Develop instructional leadership with a focus on workforce • Focused on monitoring and improving teaching practice, teachers participated in WOW sessions,
classroom profiling and weekly TLC meetings. • Staff participated in Cluster training and professional development opportunities to build capacity and
maintain and enhance teaching pedagogy. • Developing Performance Framework used as a tool to align staff cabability development with school
priorities. 5. Developing productive partnerships.
• Worked collaboratively with the local High School to plan and implement a successful year 6 into 7 transition program.
• Facilitated Early Childhood Education and Care (ECEC) into Prep transition program • The School Leaders’ Induction ceremony proved to be a dignified expression of School pride and
commitment which was shared by a large number of parents, grandparents, friends, staff and students. • Our School hosted a Showcase of student work each term. • Our students participated in Netball, Rugby League, Swimming, Soccer, Cross Country, Tennis, Touch
Football, Athletics and Softball at District levels; with several students being successful at both Regional and State level.
• The Sunrise Playgroup, open to children of pre-School age and their parents with activity mornings conducted two days each week.
• Special Weeks – Literacy and Numeracy Week, Education Week, NAIDOC Week, Disability Action Week, Chaplaincy Week and Science Week.
• Special Days – Walk Safely to School Day, Remembrance Day, Vietnam Veterans’ Day. • The Student Council continued its important work - the Disco; Canteen Bandanna Day; Free Dress
Days for our sponsor child, Ayneleme from Ethiopia; Crazy Hair Day, Welcoming Classroom Award, Clean Area Award and Correct Footwear Award and visits to read with younger children in the community.
• Performances by Rock Band, Junior and Senior Choirs/Bands included: School Market Days; Friendship Days at the Presbyterian Church; the Spring Fling; Instrumental Music – the Anglican Fete; Carols on the Balonne and the School Awards’ Evening.
6. Improving School performance. • Continued to implement the Break It Down Build It Up Framework. • Implemented the School Reading Program. • Closing the Gap,
o continued to support the work of the Community Education Forum and PaCE o implemented Academic Success Guarantee (ASG) program, with a focus on regular
attendance (95%) and improved reading achievement.
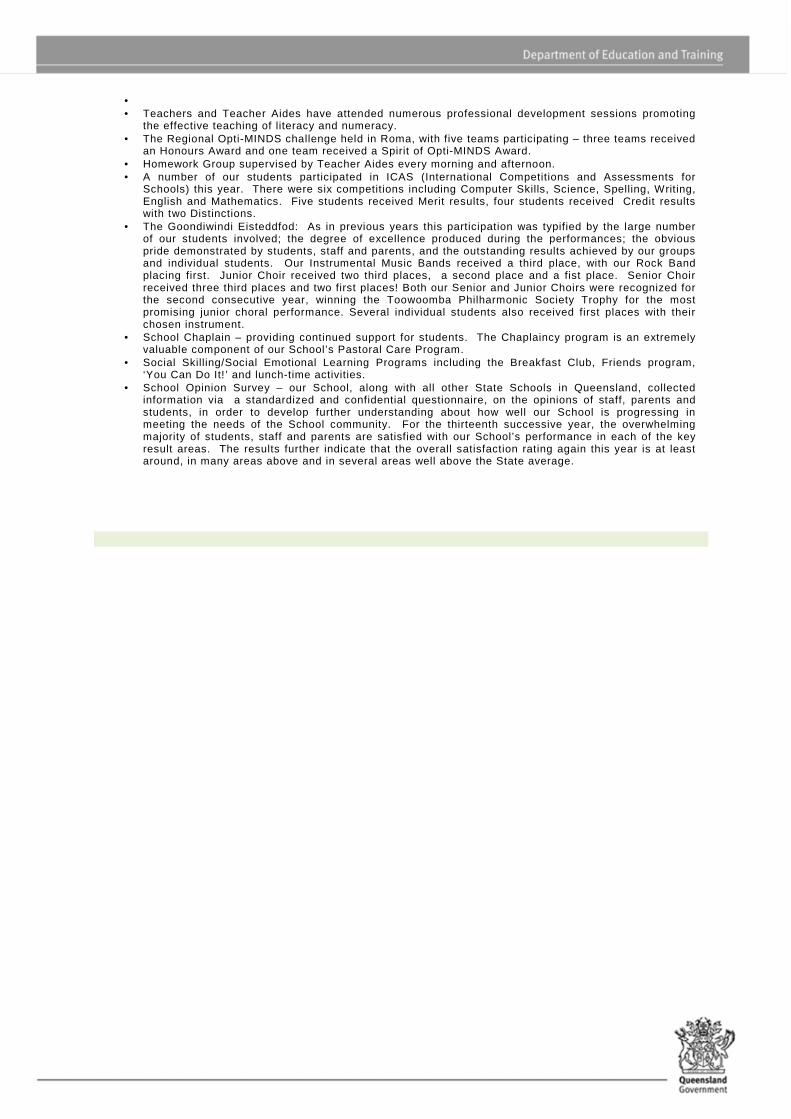
• • Teachers and Teacher Aides have attended numerous professional development sessions promoting
the effective teaching of literacy and numeracy. • The Regional Opti-MINDS challenge held in Roma, with five teams participating – three teams received
an Honours Award and one team received a Spirit of Opti-MINDS Award. • Homework Group supervised by Teacher Aides every morning and afternoon. • A number of our students participated in ICAS (International Competitions and Assessments for
Schools) this year. There were six competitions including Computer Skills, Science, Spelling, Writing, English and Mathematics. Five students received Merit results, four students received Credit results with two Distinctions.
• The Goondiwindi Eisteddfod: As in previous years this participation was typified by the large number of our students involved; the degree of excellence produced during the performances; the obvious pride demonstrated by students, staff and parents, and the outstanding results achieved by our groups and individual students. Our Instrumental Music Bands received a third place, with our Rock Band placing first. Junior Choir received two third places, a second place and a fist place. Senior Choir received three third places and two first places! Both our Senior and Junior Choirs were recognized for the second consecutive year, winning the Toowoomba Philharmonic Society Trophy for the most promising junior choral performance. Several individual students also received first places with their chosen instrument.
• School Chaplain – providing continued support for students. The Chaplaincy program is an extremely valuable component of our School’s Pastoral Care Program.
• Social Skilling/Social Emotional Learning Programs including the Breakfast Club, Friends program, ‘You Can Do It! ’ and lunch-time activities.
• School Opinion Survey – our School, along with all other State Schools in Queensland, collected information via a standardized and confidential questionnaire, on the opinions of staff, parents and students, in order to develop further understanding about how well our School is progressing in meeting the needs of the School community. For the thirteenth successive year, the overwhelming majority of students, staff and parents are satisfied with our School’s performance in each of the key result areas. The results further indicate that the overall satisfaction rating again this year is at least around, in many areas above and in several areas well above the State average.
Future outlook
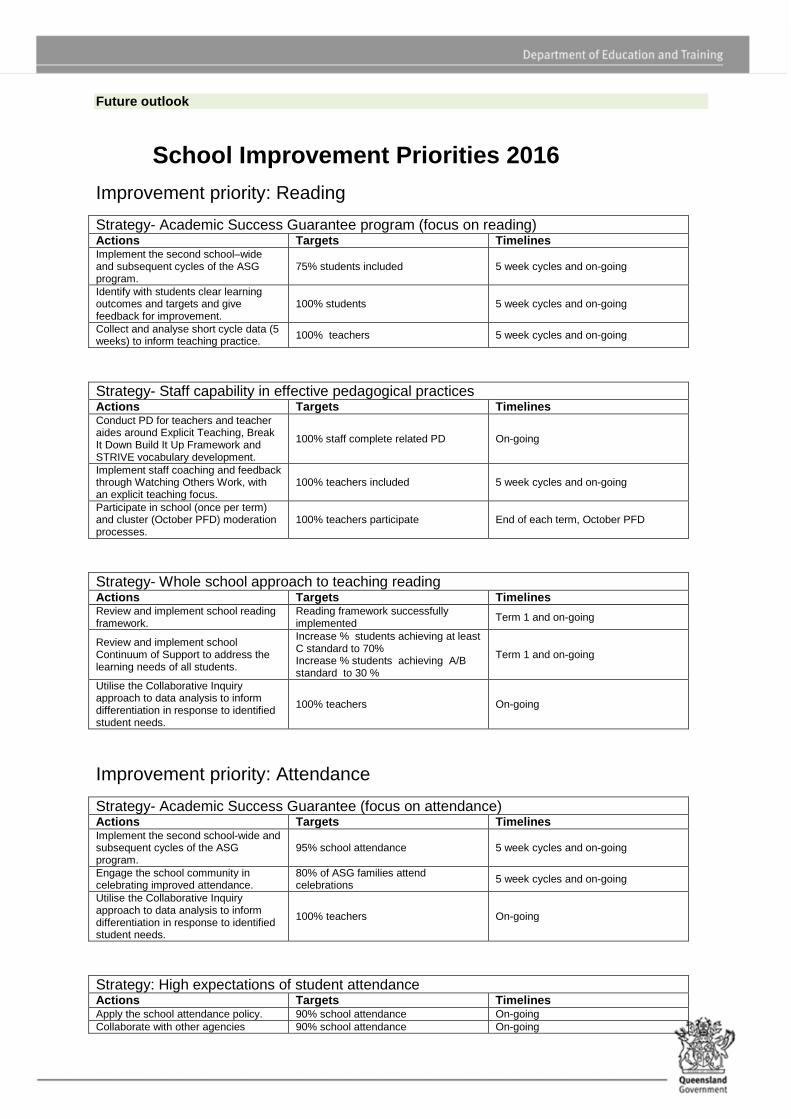
School Improvement Priorities 2016
Improvement priority: Reading
Strategy- Academic Success Guarantee program (focus on reading) Actions Targets Timelines Implement the second school–wide and subsequent cycles of the ASG program.
75% students included 5 week cycles and on-going
Identify with students clear learning outcomes and targets and give feedback for improvement.
100% students 5 week cycles and on-going
Collect and analyse short cycle data (5 weeks) to inform teaching practice. 100% teachers 5 week cycles and on-going
Strategy- Staff capability in effective pedagogical practices Actions Targets Timelines Conduct PD for teachers and teacher aides around Explicit Teaching, Break It Down Build It Up Framework and STRIVE vocabulary development.
100% staff complete related PD On-going
Implement staff coaching and feedback through Watching Others Work, with an explicit teaching focus.
100% teachers included 5 week cycles and on-going
Participate in school (once per term) and cluster (October PFD) moderation processes.
100% teachers participate End of each term, October PFD
Strategy- Whole school approach to teaching reading Actions Targets Timelines Review and implement school reading framework.
Reading framework successfully implemented Term 1 and on-going
Review and implement school Continuum of Support to address the learning needs of all students.
Increase % students achieving at least C standard to 70% Increase % students achieving A/B standard to 30 %
Term 1 and on-going
Utilise the Collaborative Inquiry approach to data analysis to inform differentiation in response to identified student needs.
100% teachers On-going
Improvement priority: Attendance
Strategy- Academic Success Guarantee (focus on attendance) Actions Targets Timelin es Implement the second school-wide and subsequent cycles of the ASG program.
95% school attendance 5 week cycles and on-going
Engage the school community in celebrating improved attendance.
80% of ASG families attend celebrations 5 week cycles and on-going
Utilise the Collaborative Inquiry approach to data analysis to inform differentiation in response to identified student needs.
100% teachers On-going
Strategy: High expectations of student attendance Actions Targets Timelines Apply the school attendance policy. 90% school attendance On-going Collaborate with other agencies 90% school attendance On-going

( Police, Lifeline) to support individual students and families around attendance.
Improvement priority: Behaviour
Strategy- Positive Behaviour for Learning Actions Targets Timelines Implement PBL to build a positive environment for students’ academic and social success.
Problem student behaviours reduce by 20% On-going
Build students’ emotional and social wellbeing through implementing ‘Team Time’ and the ‘You Can Do It’ program, and collaborating with other agencies (Allied Health, Goondir Health).
Positive student behaviours increase by 20% On-going
Strategy- Staff capability in effective classroom practices Actions Targets Timelines Conduct PD for teachers and teacher aides- Effective Classroom Practices suite.
100% of teachers and TAs complete PD Term 1 and on-going
Implement Profiling as informed by classroom behaviour data. 100% of teachers On-going
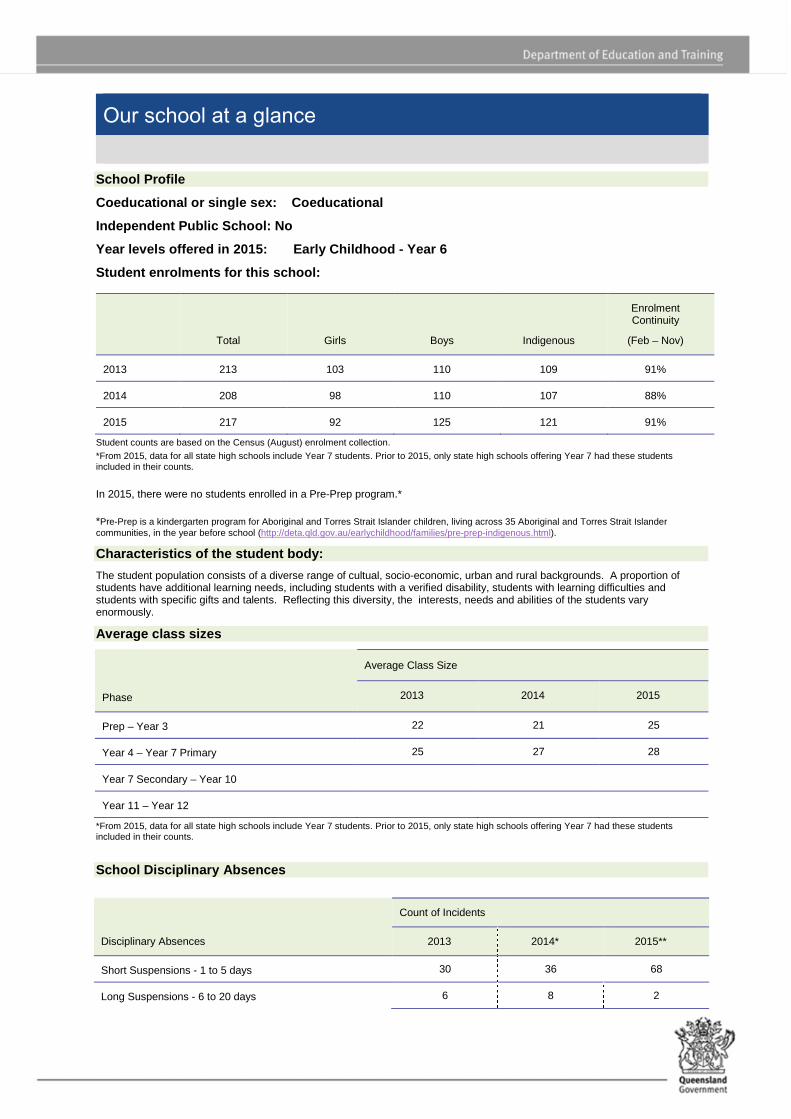
Our school at a glance
School Profile
Coeducational or single sex: Coeducational
Independent Public School: No
Year levels offered in 2015: Early Childhood - Year 6
Student enrolments for this school:
Total Girls Boys Indigenous
Enrolment Continuity
(Feb – Nov)
2013 213 103 110 109 91%
2014 208 98 110 107 88%
2015 217 92 125 121 91%
Student counts are based on the Census (August) enrolment collection.
*From 2015, data for all state high schools include Year 7 students. Prior to 2015, only state high schools offering Year 7 had these students included in their counts.
In 2015, there were no students enrolled in a Pre-Prep program.* *Pre-Prep is a kindergarten program for Aboriginal and Torres Strait Islander children, living across 35 Aboriginal and Torres Strait Islander communities, in the year before school (http://deta.qld.gov.au/earlychildhood/families/pre-prep-indigenous.html).
Characteristics of the student body:
The student population consists of a diverse range of cultual, socio-economic, urban and rural backgrounds. A proportion of students have additional learning needs, including students with a verified disability, students with learning difficulties and students with specific gifts and talents. Reflecting this diversity, the interests, needs and abilities of the students vary enormously.
Average class sizes
Phase
Average Class Size
2013 2014 2015
Prep – Year 3 22 21 25
Year 4 – Year 7 Primary 25 27 28
Year 7 Secondary – Year 10
Year 11 – Year 12
*From 2015, data for all state high schools include Year 7 students. Prior to 2015, only state high schools offering Year 7 had these students included in their counts.
School Disciplinary Absences
Disciplinary Absences
Count of Incidents
2013 2014* 2015**
Short Suspensions - 1 to 5 days 30 36 68
Long Suspensions - 6 to 20 days 6 8 2
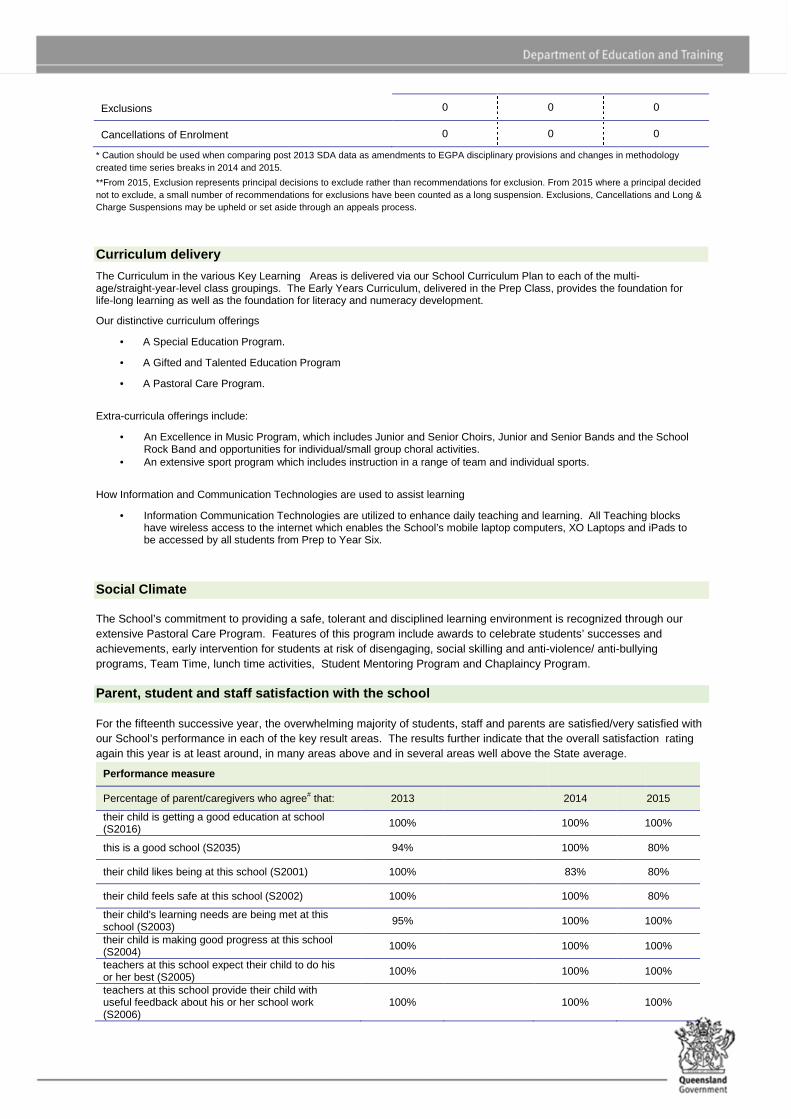
* Caution should be used when comparing post 2013 SDA data as amendments to EGPA disciplinary provisions and changes in methodology created time series breaks in 2014 and 2015.
**From 2015, Exclusion represents principal decisions to exclude rather than recommendations for exclusion. From 2015 where a principal decided not to exclude, a small number of recommendations for exclusions have been counted as a long suspension. Exclusions, Cancellations and Long & Charge Suspensions may be upheld or set aside through an appeals process.
Curriculum delivery
The Curriculum in the various Key Learning Areas is delivered via our School Curriculum Plan to each of the multi-age/straight-year-level class groupings. The Early Years Curriculum, delivered in the Prep Class, provides the foundation for life-long learning as well as the foundation for literacy and numeracy development.
Our distinctive curriculum offerings
• A Special Education Program.
• A Gifted and Talented Education Program
• A Pastoral Care Program.
Extra-curricula offerings include:
• An Excellence in Music Program, which includes Junior and Senior Choirs, Junior and Senior Bands and the School Rock Band and opportunities for individual/small group choral activities.
• An extensive sport program which includes instruction in a range of team and individual sports.
How Information and Communication Technologies are used to assist learning
• Information Communication Technologies are utilized to enhance daily teaching and learning. All Teaching blocks have wireless access to the internet which enables the School’s mobile laptop computers, XO Laptops and iPads to be accessed by all students from Prep to Year Six.
Social Climate
The School’s commitment to providing a safe, tolerant and disciplined learning environment is recognized through our extensive Pastoral Care Program. Features of this program include awards to celebrate students’ successes and achievements, early intervention for students at risk of disengaging, social skilling and anti-violence/ anti-bullying programs, Team Time, lunch time activities, Student Mentoring Program and Chaplaincy Program.
Parent, student and staff satisfaction with the sch ool For the fifteenth successive year, the overwhelming majority of students, staff and parents are satisfied/very satisfied with our School’s performance in each of the key result areas. The results further indicate that the overall satisfaction rating again this year is at least around, in many areas above and in several areas well above the State average.
Performance measure
Percentage of parent/caregivers who agree# that: 2013 2014 2015
their child is getting a good education at school (S2016) 100% 100% 100%
this is a good school (S2035) 94% 100% 80%
their child likes being at this school (S2001) 100% 83% 80%
their child feels safe at this school (S2002) 100% 100% 80%
their child's learning needs are being met at this school (S2003) 95%
100% 100%
their child is making good progress at this school (S2004) 100% 100% 100%
teachers at this school expect their child to do his or her best (S2005) 100%
100% 100%
teachers at this school provide their child with useful feedback about his or her school work (S2006)
100%
100% 100%
Exclusions 0 0 0
Cancellations of Enrolment 0 0 0
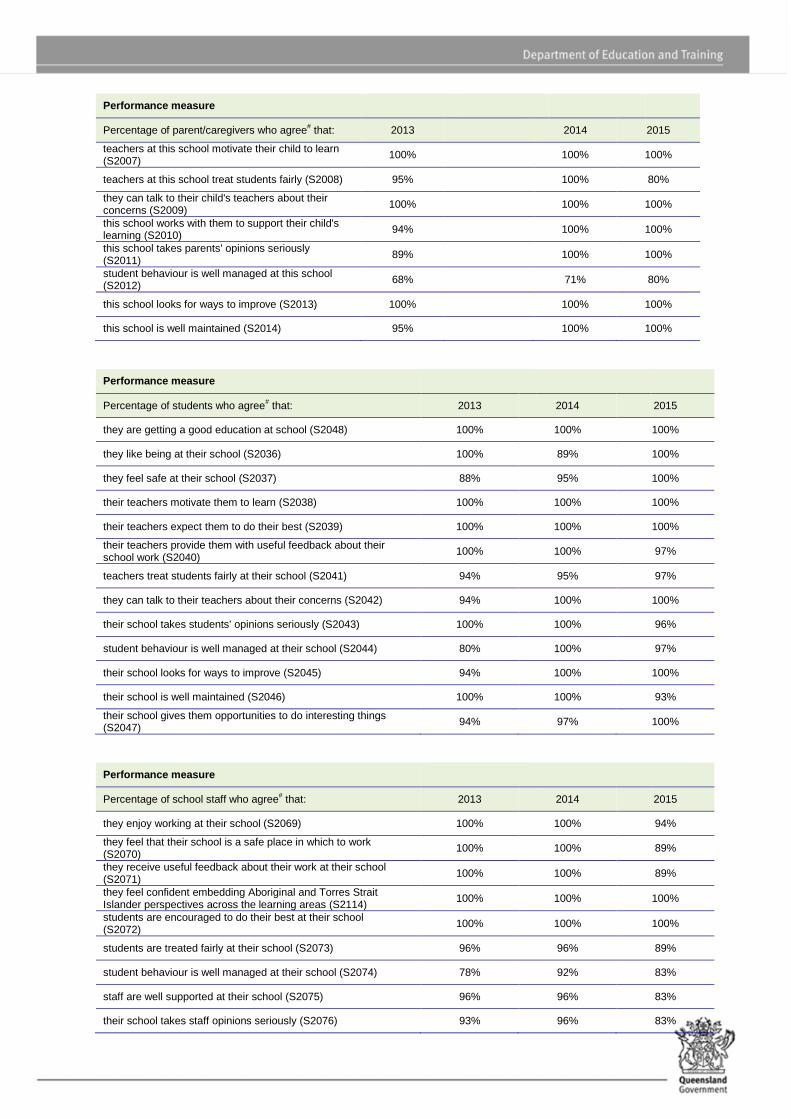
Performance measure
Percentage of parent/caregivers who agree# that: 2013 2014 2015
teachers at this school motivate their child to learn (S2007)
100% 100% 100%
teachers at this school treat students fairly (S2008) 95% 100% 80%
they can talk to their child's teachers about their concerns (S2009) 100%
100% 100%
this school works with them to support their child's learning (S2010) 94% 100% 100%
this school takes parents' opinions seriously (S2011) 89%
100% 100%
student behaviour is well managed at this school (S2012) 68% 71% 80%
this school looks for ways to improve (S2013) 100% 100% 100%
this school is well maintained (S2014) 95% 100% 100%
Performance measure
Percentage of students who agree# that: 2013 2014 2015
they are getting a good education at school (S2048) 100% 100% 100%
they like being at their school (S2036) 100% 89% 100%
they feel safe at their school (S2037) 88% 95% 100%
their teachers motivate them to learn (S2038) 100% 100% 100%
their teachers expect them to do their best (S2039) 100% 100% 100%
their teachers provide them with useful feedback about their school work (S2040)
100% 100% 97%
teachers treat students fairly at their school (S2041) 94% 95% 97%
they can talk to their teachers about their concerns (S2042) 94% 100% 100%
their school takes students' opinions seriously (S2043) 100% 100% 96%
student behaviour is well managed at their school (S2044) 80% 100% 97%
their school looks for ways to improve (S2045) 94% 100% 100%
their school is well maintained (S2046) 100% 100% 93%
their school gives them opportunities to do interesting things (S2047) 94% 97% 100%
Performance measure
Percentage of school staff who agree# that: 2013 2014 2015
they enjoy working at their school (S2069) 100% 100% 94%
they feel that their school is a safe place in which to work (S2070)
100% 100% 89%
they receive useful feedback about their work at their school (S2071) 100% 100% 89%
they feel confident embedding Aboriginal and Torres Strait Islander perspectives across the learning areas (S2114)
100% 100% 100%
students are encouraged to do their best at their school (S2072) 100% 100% 100%
students are treated fairly at their school (S2073) 96% 96% 89%
student behaviour is well managed at their school (S2074) 78% 92% 83%
staff are well supported at their school (S2075) 96% 96% 83%
their school takes staff opinions seriously (S2076) 93% 96% 83%
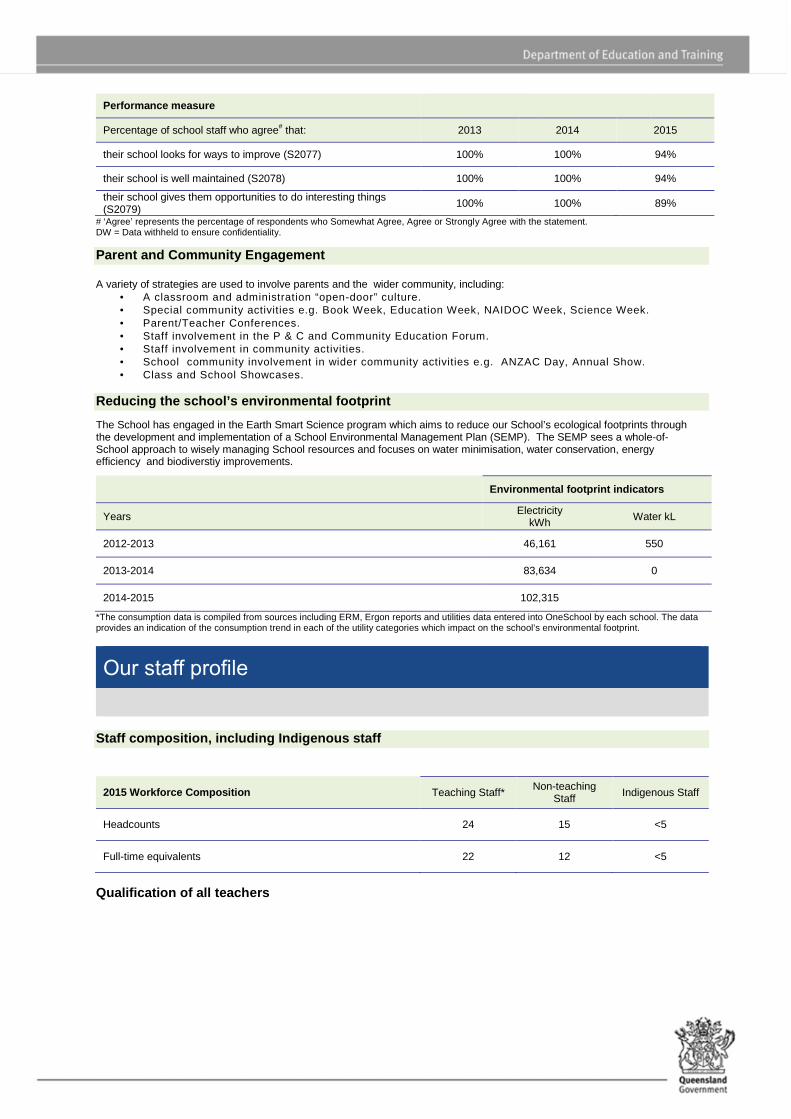
Performance measure
Percentage of school staff who agree# that: 2013 2014 2015
their school looks for ways to improve (S2077) 100% 100% 94%
their school is well maintained (S2078) 100% 100% 94%
their school gives them opportunities to do interesting things (S2079) 100% 100% 89%
# ‘Agree’ represents the percentage of respondents who Somewhat Agree, Agree or Strongly Agree with the statement. DW = Data withheld to ensure confidentiality.
Parent and Community Engagement
A variety of strategies are used to involve parents and the wider community, including: • A classroom and administration “open-door” culture. • Special community activities e.g. Book Week, Education Week, NAIDOC Week, Science Week. • Parent/Teacher Conferences. • Staff involvement in the P & C and Community Education Forum. • Staff involvement in community activities. • School community involvement in wider community activities e.g. ANZAC Day, Annual Show. • Class and School Showcases.
Reducing the school’s environmental footprint
The School has engaged in the Earth Smart Science program which aims to reduce our School’s ecological footprints through the development and implementation of a School Environmental Management Plan (SEMP). The SEMP sees a whole-of-School approach to wisely managing School resources and focuses on water minimisation, water conservation, energy efficiency and biodiverstiy improvements.
Environmental footprint indicators
Years Electricity kWh Water kL
2012-2013 46,161 550
2013-2014 83,634 0
2014-2015 102,315
*The consumption data is compiled from sources including ERM, Ergon reports and utilities data entered into OneSchool by each school. The data provides an indication of the consumption trend in each of the utility categories which impact on the school’s environmental footprint.
Our staff profile
Staff composition, including Indigenous staff
2015 Workforce Composition Teaching Staff* Non-teaching
Staff Indigenous Staff
Headcounts 24 15 <5
Full-time equivalents 22 12 <5
Qualification of all teachers

Highest level ofattainment
Number of Teaching Staff *
Certificate 0
Diploma 3
Advanced Diploma 0
Bachelor Degree 15
Graduate Diploma etc.** 5
Masters 2
Doctorate 0
Total 25
0
3
0
15
5
2
00
2
4
6
8
10
12
14
16
*Teaching staff includes School Leaders
**Graduate Diploma etc. includes Graduate Diploma, Bachelor Honours Degree, and Graduate Certificate.
Expenditure on and teacher participation in profess ional development
The total funds expended on teacher professional development in 2015 were $ 11069
The community of St George State School believes that, when the opportunity is given, all staff (School Leaders, Teachers and Support Staff) seek to develop their skills, knowledge and performance throughout their careers. They do this to achieve personal satisfaction, as well as to improve the educational outcomes of St George State School students. St George State School’s approach to Professional Development has been adopted to suit the needs of individuals, the school, and the wider St George Community.
The major professional development initiatives are as follows:
• P-12 Curriculum, Assessment and Reporting Framework (CARF) • Whole School Curriculum Plan. • Reading Program. • Spelling: a whole school approach. • English as an additional language/dialect; Break in Down, Build it Up Framework (EAL/D;BIDBIU). • OneSchool. • Behaviour Management Essential Skills for Classroom Management (ESCM); Positive Behaviour for Learning. • Dimensions of Teaching and Learning (DOTaL). • Australian Curriculum. • The Three Pillars: Explicit Teaching, Purposeful Use of Data, Coaching and Feedback.
The proportion of the teaching staff involved in professional development activities during 2015 was 100 %.
Average staff attendance 2013 2014 2015
Staff attendance for permanent and temporary staff and school leaders. 96% 97% 96%
Proportion of staff retained from the previous scho ol year
From the end of the previous school year, 94% of staff was retained by the school for the entire 2015 school year.
School income broken down by funding source
School income broken down by funding source is available via the My School website at http://www.myschool.edu.au/.
To access our income details, click on the My School link above. You will then be taken to the My School website with the following ‘Find a school’ text box.
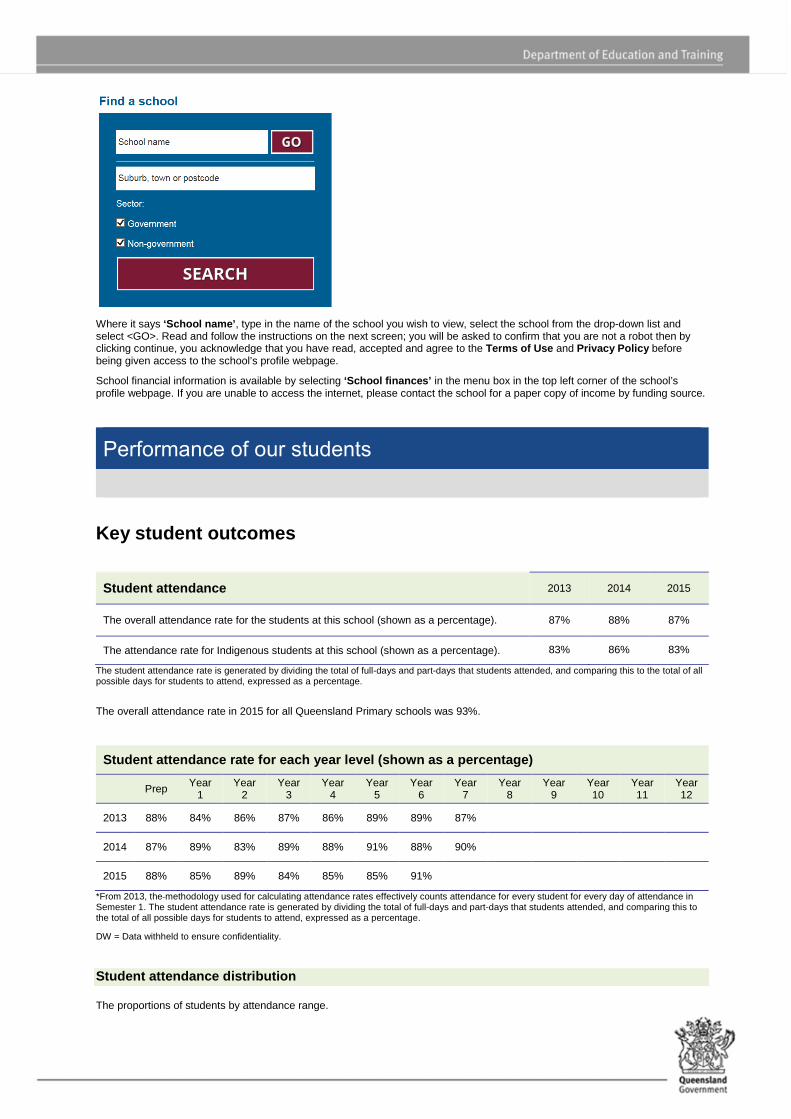
Where it says ‘School name’ , type in the name of the school you wish to view, select the school from the drop-down list and select <GO>. Read and follow the instructions on the next screen; you will be asked to confirm that you are not a robot then by clicking continue, you acknowledge that you have read, accepted and agree to the Terms of Use and Privacy Policy before being given access to the school’s profile webpage.
School financial information is available by selecting ‘School finances’ in the menu box in the top left corner of the school’s profile webpage. If you are unable to access the internet, please contact the school for a paper copy of income by funding source.
Performance of our students
Key student outcomes
Student attendance 2013 2014 2015
The overall attendance rate for the students at this school (shown as a percentage). 87% 88% 87%
The attendance rate for Indigenous students at this school (shown as a percentage). 83% 86% 83%
The student attendance rate is generated by dividing the total of full-days and part-days that students attended, and comparing this to the total of all possible days for students to attend, expressed as a percentage.
The overall attendance rate in 2015 for all Queensland Primary schools was 93%.
Student attendance rate for each year level (shown as a percentage)
Prep Year 1
Year 2
Year 3
Year 4
Year 5
Year 6
Year 7
Year 8
Year 9
Year 10
Year 11
Year 12
2013 88% 84% 86% 87% 86% 89% 89% 87%
2014 87% 89% 83% 89% 88% 91% 88% 90%
2015 88% 85% 89% 84% 85% 85% 91%
*From 2013, the methodology used for calculating attendance rates effectively counts attendance for every student for every day of attendance in Semester 1. The student attendance rate is generated by dividing the total of full-days and part-days that students attended, and comparing this to the total of all possible days for students to attend, expressed as a percentage.
DW = Data withheld to ensure confidentiality.
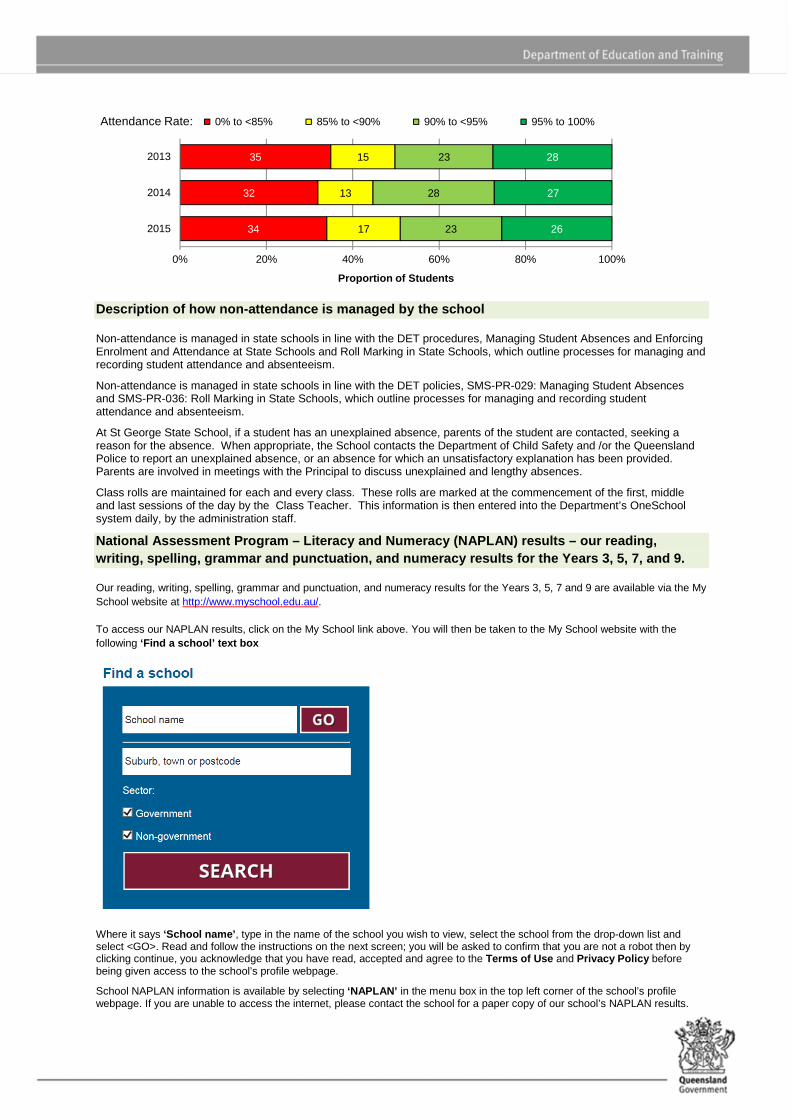
Student attendance distribution
The proportions of students by attendance range.
Description of how non-attendance is managed by the school
Non-attendance is managed in state schools in line with the DET procedures, Managing Student Absences and Enforcing Enrolment and Attendance at State Schools and Roll Marking in State Schools, which outline processes for managing and recording student attendance and absenteeism.
Non-attendance is managed in state schools in line with the DET policies, SMS-PR-029: Managing Student Absences and SMS-PR-036: Roll Marking in State Schools, which outline processes for managing and recording student attendance and absenteeism.
At St George State School, if a student has an unexplained absence, parents of the student are contacted, seeking a reason for the absence. When appropriate, the School contacts the Department of Child Safety and /or the Queensland Police to report an unexplained absence, or an absence for which an unsatisfactory explanation has been provided. Parents are involved in meetings with the Principal to discuss unexplained and lengthy absences.
Class rolls are maintained for each and every class. These rolls are marked at the commencement of the first, middle and last sessions of the day by the Class Teacher. This information is then entered into the Department’s OneSchool system daily, by the administration staff.
National Assessment Program – Literacy and Numeracy (NAPLAN) results – our reading, writing, spelling, grammar and punctuation, and num eracy results for the Years 3, 5, 7, and 9.
Our reading, writing, spelling, grammar and punctuation, and numeracy results for the Years 3, 5, 7 and 9 are available via the My School website at http://www.myschool.edu.au/.
To access our NAPLAN results, click on the My School link above. You will then be taken to the My School website with the following ‘Find a school’ text box
Where it says ‘School name’ , type in the name of the school you wish to view, select the school from the drop-down list and select <GO>. Read and follow the instructions on the next screen; you will be asked to confirm that you are not a robot then by clicking continue, you acknowledge that you have read, accepted and agree to the Terms of Use and Privacy Policy before being given access to the school’s profile webpage.
School NAPLAN information is available by selecting ‘NAPLAN’ in the menu box in the top left corner of the school’s profile webpage. If you are unable to access the internet, please contact the school for a paper copy of our school’s NAPLAN results.
34
32
35
17
13
15
23
28
23
26
27
28
0% 20% 40% 60% 80% 100%
2015
2014
2013
Proportion of Students
Attendance Rate: 0% to <85% 85% to <90% 90% to <95% 95% to 100%