Embed Size (px)
Citation preview
2015 Oregon NHMP, DRAFT, v.03, 08/01/2014 7
2015 Oregon Natural Hazard Mitigation Plan
Risk Assessment
* DRAFT * v.03, 08/01/2014
Chapter 2
RISK ASSESSMENT
2015 Oregon NHMP, DRAFT, v.03, 08/01/2014 9
Table of Contents
A. In This Chapter B. Introduction C. Executive Summary D. State Risk Assessment
1. Oregon Hazards a. Overview b. Introduction to Climate Change c. Hazards (per hazard)
i. Analysis and Characterization ii. Historical Events
iii. Probability 2. Oregon Vulnerabilities
a. Overview b. Local Vulnerability Assessments c. State Vulnerability Assessments (per hazard) d. Local and State Vulnerability Assessments Comparison e. State-Owned Facilities and Critical and Essential Facilities Loss Estimates f. Seismic Lifeline Vulnerabilities
3. Future Enhancements to State Risk Assessment a. Climate Change b. New Risk Assessment Methodology c. Cultural Resources
E. Regional Risk Assessments (per region) 1. Regional Summary 2. Regional Profile 3. Regional Hazards and Vulnerability (per hazard)
a. Characteristics b. Significant Events c. Probability
i. Local ii. State
d. Vulnerability i. Local
ii. State iii. State-Owned Facilities/ Critical and Essential Facilities Loss Estimates
(as applicable) iv. Lifeline Vulnerabilities (earthquake only)
In This Chapter The Oregon NHMP Risk Assessment is divided into four sections: 1) introduction, 2) executive summary, 3) state risk assessment and 4) regional risk assessment. Following is a description of each section.
1. Introduction: States the purpose of the risk assessment and understanding risk.
2. Executive Summary: Summarizes the analysis and findings in the State and Regional Profiles.
3. State Risk Assessment: Includes the following components:
o Oregon Hazards: Profiles each of Oregon’s hazards by identifying each hazard, its generalized location and presidentially declared disasters; introduces how the state is impacted by climate change; characterizing each hazard that impacts Oregon; listing historic events; identifying the probability of future events; and introducing how climate change is predicted to impact each hazard statewide.
o Oregon Vulnerabilities: Includes an overview and analysis of the State’s vulnerability to each hazard by identifying which communities are most vulnerable to each hazard based on local and state vulnerability assessments; providing loss estimates for State owned or leased facilities and critical or essential facilities located in hazard areas; and identifying seismic lifeline vulnerabilities.
o Future Enhancements: Describes ways in which Oregon is planning to improve future state risk assessments.
4. Regional Risk Assessment: Includes the following components:
o Regional Summary: Summarizes the OEM Natural Hazard Region’s statistical profile, hazard and vulnerability analysis; and projected impacts of climate change on hazards in the region.
o Regional Profile: Provides an overview of the region’s unique characteristics, including a natural environment profile, social /demographic profile, economic profile, infrastructure profile, and built environment profile.
o Regional Hazards and Vulnerability: Further describes the hazards in each region by charactering how each hazard presents itself in the region; listing historic hazard events in the region; and identifying probability of future events based on local and state analysis. Also includes an overview and analysis of the region’s vulnerability to each hazard; identifies which communities in the region are most vulnerable to each hazard based on local and state analysis; provides loss estimates for State owned or leased facilities and critical or essential facilities located in hazard areas; and identifies the region’s seismic lifeline vulnerabilities.
2015 Oregon NHMP, DRAFT, v.03, 08/01/2014 11
Introduction
Purpose
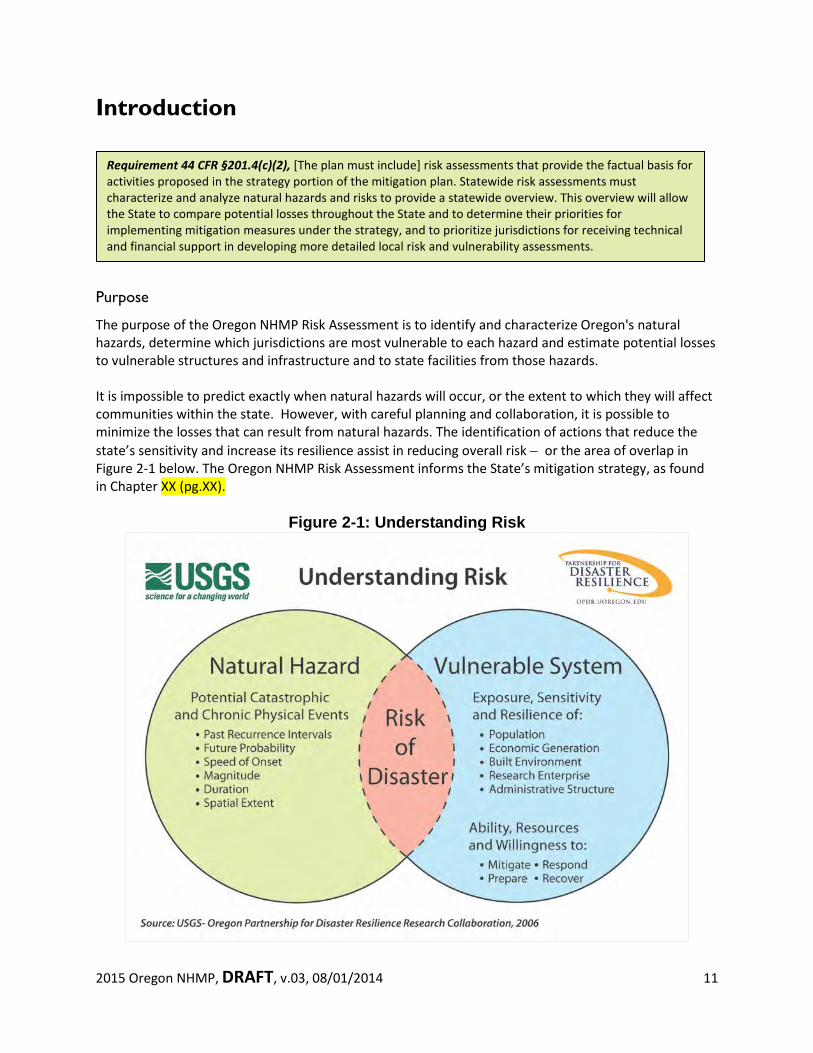
The purpose of the Oregon NHMP Risk Assessment is to identify and characterize Oregon's natural hazards, determine which jurisdictions are most vulnerable to each hazard and estimate potential losses to vulnerable structures and infrastructure and to state facilities from those hazards. It is impossible to predict exactly when natural hazards will occur, or the extent to which they will affect communities within the state. However, with careful planning and collaboration, it is possible to minimize the losses that can result from natural hazards. The identification of actions that reduce the state’s sensitivity and increase its resilience assist in reducing overall risk − or the area of overlap in Figure 2-1 below. The Oregon NHMP Risk Assessment informs the State’s mitigation strategy, as found in Chapter XX (pg.XX).
Figure 2-1: Understanding Risk
Requirement 44 CFR §201.4(c)(2), [The plan must include] risk assessments that provide the factual basis for activities proposed in the strategy portion of the mitigation plan. Statewide risk assessments must characterize and analyze natural hazards and risks to provide a statewide overview. This overview will allow the State to compare potential losses throughout the State and to determine their priorities for implementing mitigation measures under the strategy, and to prioritize jurisdictions for receiving technical and financial support in developing more detailed local risk and vulnerability assessments.
Assessing the state’s level of risk involves three components: characterizing natural hazards, assessing vulnerabilities and analyzing risk. Characterizing natural hazards involves determining hazards’ causes and characteristics, documenting historic impacts, and identifying future probabilities of hazards occurring throughout the State. The section in this risk assessment titled Oregon Hazards characterizes each of the state’s natural hazards.
A vulnerability assessment combines information from the hazard characterization with an inventory of the existing (or planned) property and population exposed to a hazard, and attempts to predict how different types of property and population groups will be affected by each hazard. Vulnerability is determined by a community’s exposure, sensitivity, and resilience to natural hazards, as well as its ability to mitigate, prepare for, respond to, and recover from a disaster. The section Oregon Vulnerabilities identifies and assesses the state’s vulnerabilities to each hazard identified in the Oregon Hazards section of this risk assessment.
Finally, a risk analysis involves estimating the damages, injuries, and costs likely to be incurred in a geographic area over a period of time. Risk has two measurable components: (1) the magnitude of the harm that may result, defined through vulnerability assessments, and (2) the likelihood or probability of the harm occurring, defined in the hazard characterization. Together, the Oregon Hazards and Oregon Vulnerabilities sections form the state’s risk analysis.
2015 Oregon NHMP, DRAFT, v.03, 08/01/2014 13
Executive Summary
< Placeholder for Executive Summary >

State Risk Assessment
2015 Oregon NHMP, DRAFT, v.03, 08/01/2014 15
Oregon Hazards Overview
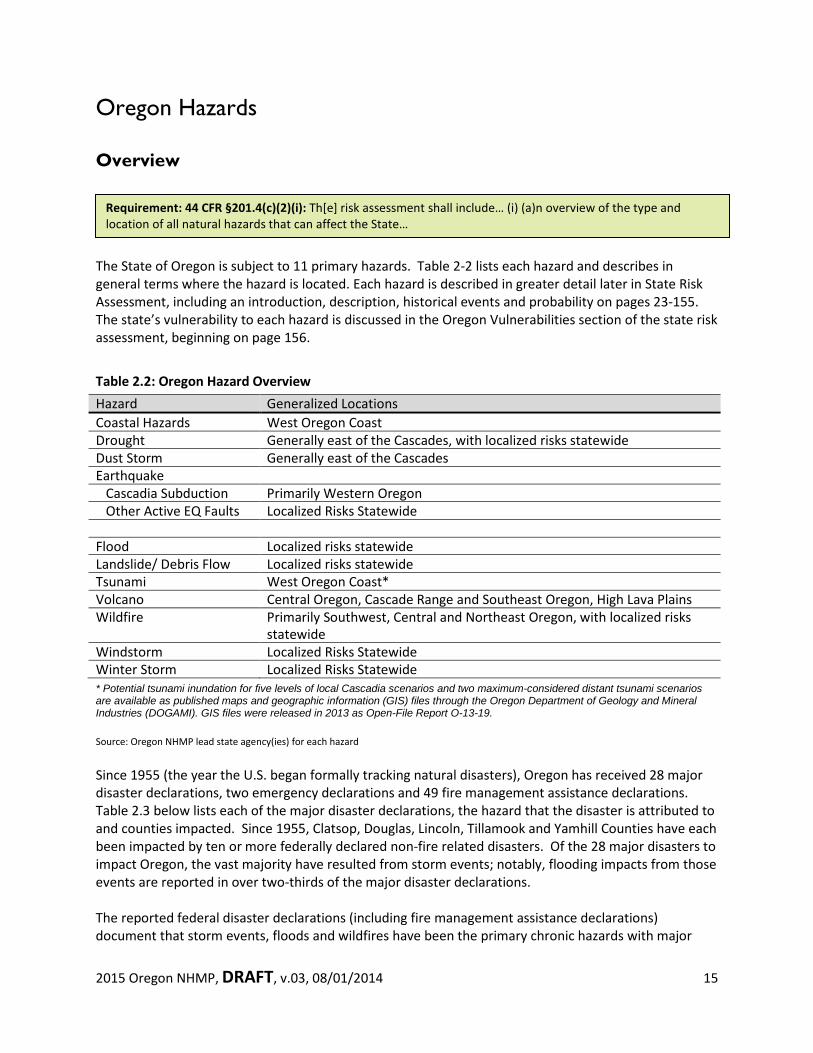
The State of Oregon is subject to 11 primary hazards. Table 2-2 lists each hazard and describes in general terms where the hazard is located. Each hazard is described in greater detail later in State Risk Assessment, including an introduction, description, historical events and probability on pages 23-155. The state’s vulnerability to each hazard is discussed in the Oregon Vulnerabilities section of the state risk assessment, beginning on page 156. Table 2.2: Oregon Hazard Overview Hazard Generalized Locations Coastal Hazards West Oregon Coast Drought Generally east of the Cascades, with localized risks statewide Dust Storm Generally east of the Cascades Earthquake Cascadia Subduction Primarily Western Oregon Other Active EQ Faults Localized Risks Statewide Flood Localized risks statewide Landslide/ Debris Flow Localized risks statewide Tsunami West Oregon Coast* Volcano Central Oregon, Cascade Range and Southeast Oregon, High Lava Plains Wildfire Primarily Southwest, Central and Northeast Oregon, with localized risks
statewide Windstorm Localized Risks Statewide Winter Storm Localized Risks Statewide * Potential tsunami inundation for five levels of local Cascadia scenarios and two maximum-considered distant tsunami scenarios are available as published maps and geographic information (GIS) files through the Oregon Department of Geology and Mineral Industries (DOGAMI). GIS files were released in 2013 as Open-File Report O-13-19.
Source: Oregon NHMP lead state agency(ies) for each hazard Since 1955 (the year the U.S. began formally tracking natural disasters), Oregon has received 28 major disaster declarations, two emergency declarations and 49 fire management assistance declarations. Table 2.3 below lists each of the major disaster declarations, the hazard that the disaster is attributed to and counties impacted. Since 1955, Clatsop, Douglas, Lincoln, Tillamook and Yamhill Counties have each been impacted by ten or more federally declared non-fire related disasters. Of the 28 major disasters to impact Oregon, the vast majority have resulted from storm events; notably, flooding impacts from those events are reported in over two-thirds of the major disaster declarations. The reported federal disaster declarations (including fire management assistance declarations) document that storm events, floods and wildfires have been the primary chronic hazards with major
Requirement: 44 CFR §201.4(c)(2)(i): Th[e] risk assessment shall include… (i) (a)n overview of the type and location of all natural hazards that can affect the State…
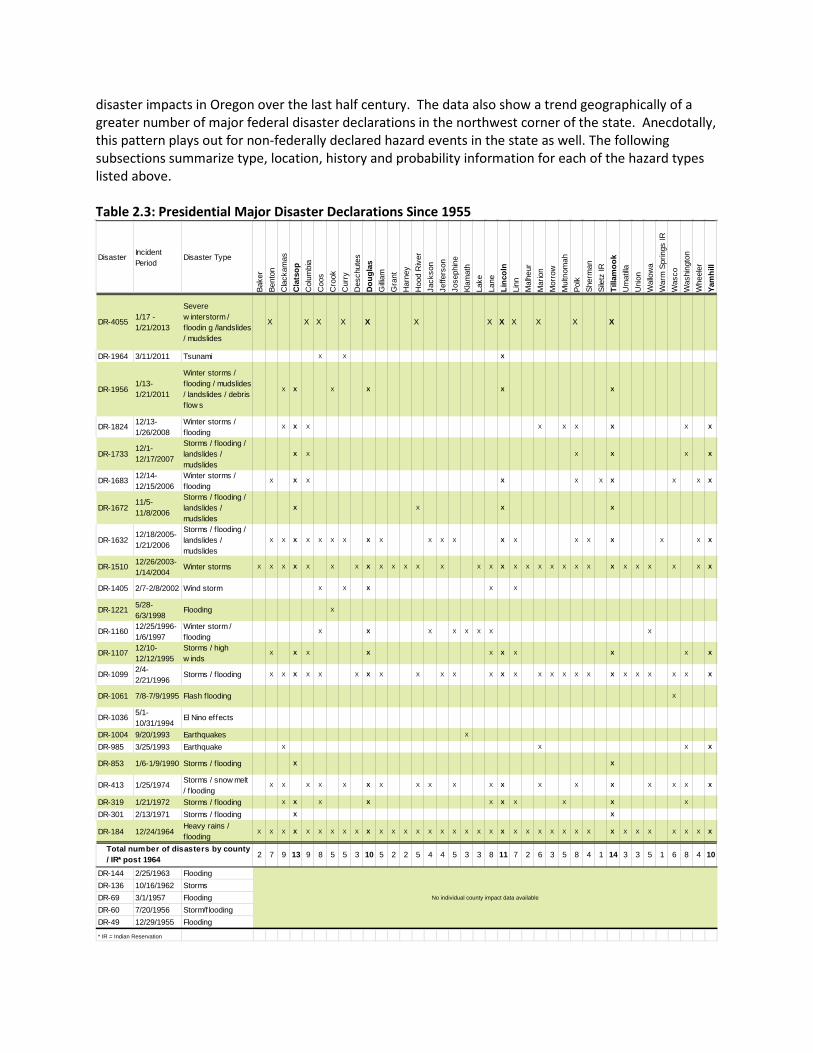
disaster impacts in Oregon over the last half century. The data also show a trend geographically of a greater number of major federal disaster declarations in the northwest corner of the state. Anecdotally, this pattern plays out for non-federally declared hazard events in the state as well. The following subsections summarize type, location, history and probability information for each of the hazard types listed above. Table 2.3: Presidential Major Disaster Declarations Since 1955
Disaster Incident Period
Disaster TypeBa
ker
Bent
onC
lack
amas
Cla
tsop
Col
umbi
aC
oos
Cro
okC
urry
Des
chut
esD
ougl
asG
illiam
Gra
ntH
arne
yH
ood
Riv
erJa
ckso
nJe
ffers
onJo
seph
ine
Klam
ath
Lake
Lane
Linc
oln
Linn
Mal
heur
Mar
ion
Mor
row
Mul
tnom
ahPo
lkSh
erm
anSi
letz
IRTi
llam
ook
Um
atilla
Uni
onW
allo
wa
War
m S
prin
gs IR
Was
coW
ashi
ngto
nW
heel
erYa
mhi
ll
DR-4055 1/17 - 1/21/2013
Severe w interstorm / f loodin g /landslides / mudslides
X X X X X X X X X X X X
DR-1964 3/11/2011 Tsunami X X X
DR-19561/13-1/21/2011
Winter storms / f looding / mudslides / landslides / debris f low s
X X X X X X
DR-1824 12/13-1/26/2008
Winter storms / f looding
X X X X X X X X X
DR-173312/1-12/17/2007
Storms / f looding / landslides / mudslides
X X X X X X
DR-1683 12/14-12/15/2006
Winter storms / f looding
X X X X X X X X X X
DR-167211/5-11/8/2006
Storms / f looding / landslides / mudslides
X X X X
DR-163212/18/2005-1/21/2006
Storms / f looding / landslides / mudslides
X X X X X X X X X X X X X X X X X X X X
DR-1510 12/26/2003-1/14/2004
Winter storms X X X X X X X X X X X X X X X X X X X X X X X X X X X X X X
DR-1405 2/7-2/8/2002 Wind storm X X X X X
DR-1221 5/28-6/3/1998
Flooding X
DR-1160 12/25/1996-1/6/1997
Winter storm / f looding
X X X X X X X X
DR-1107 12/10-12/12/1995
Storms / high w inds
X X X X X X X X X X
DR-1099 2/4-2/21/1996
Storms / f looding X X X X X X X X X X X X X X X X X X X X X X X X X X
DR-1061 7/8-7/9/1995 Flash f looding X
DR-1036 5/1-10/31/1994
El Nino effects
DR-1004 9/20/1993 Earthquakes X
DR-985 3/25/1993 Earthquake X X X X
DR-853 1/6-1/9/1990 Storms / f looding X X
DR-413 1/25/1974 Storms / snow melt / f looding
X X X X X X X X X X X X X X X X X X X
DR-319 1/21/1972 Storms / f looding X X X X X X X X X X
DR-301 2/13/1971 Storms / f looding X X
DR-184 12/24/1964Heavy rains / f looding
X X X X X X X X X X X X X X X X X X X X X X X X X X X X X X X X X X X X
2 7 9 13 9 8 5 5 3 10 5 2 2 5 4 4 5 3 3 8 11 7 2 6 3 5 8 4 1 14 3 3 5 1 6 8 4 10
DR-144 2/25/1963 FloodingDR-136 10/16/1962 StormsDR-69 3/1/1957 FloodingDR-60 7/20/1956 Storm/floodingDR-49 12/29/1955 Flooding
* IR = Indian Reservation
No individual county impact data available
Total number of disasters by county / IR* post 1964
2015 Oregon NHMP, DRAFT, v.03, 08/01/2014 17
Source: Oregon Emergency Management, 2013
Introduction to Climate Change
This section presents an overview of climate change in Oregon. Climate is an important element in certain natural hazards, even though in itself, climate is not a distinct natural hazard.
In broad terms, climate in the Pacific Northwest is characterized by variability, and that variability is largely dominated by the interaction between the atmosphere and ocean in the tropical Pacific Ocean that is responsible for El Niño and La Niña. Human activities are changing the climate, particularly temperature, beyond natural variability. Climate change is already affecting Oregon communities and resources, and needs to be recognized in various planning efforts as an important stressor that significantly influences the incidence—and in some cases the location—of natural hazards and hazard events. Climate change is anticipated to affect the frequency and/or magnitude of some kinds of natural hazards in Oregon. A brief review of some of the observed changes in Oregon or the Pacific Northwest will give some idea of the influence of climate on natural hazards. First, temperatures increased across the Pacific Northwest by 1.3˚F in the period from 1895-2011 (the observed record). In that same timeframe, Cascade Mountain snowpacks have declined, and higher temperatures are causing earlier spring snowmelt and spring peak streamflows. On the coast, increasing deep-water wave heights in recent decades are likely to have increased the frequency of coastal flooding and erosion. In Oregon’s forested areas, large areas have been impacted by disturbances that include wildfire in recent years, and climate change is probably one major factor. Closer to home for some Oregonians, a three-fold increase in heat-related illness has been documented in Oregon with each 10 ˚F rise in daily maximum temperature. (Dalton et al 2013, OCCRI 2010). Oregon Responses to Climate Change The human influence on the climate is clear (IPCC 2013). Global greenhouse gas emissions will determine the amount of warming both globally and here in Oregon. On that basis, Oregon and other states and local communities have undertaken measures to reduce greenhouse gas emissions as a way to slow the warming trend. Similarly, states and local communities are beginning to implement measures to adapt to future climate conditions that cannot be avoided. The global climate has considerable inertia, so the changes that can be anticipated today are largely a result of conditions that occurred up to several decades, almost a century ago. Inertia in the global climate system cannot be immediately influenced, so states and communities are beginning to do ‘climate adaptation planning’ on local and regional scales. In many cases, planning for climate change—or adaptation planning—quickly comes down to improved planning for natural hazards, since many of the anticipated effects of climate change will be experienced in the form of natural hazard events. That said, planning to adapt to climate change and planning to mitigate natural hazards are not entirely the same thing, although there is considerable overlap. Planning for climate change also includes planning for public health and natural resource protection. In 2010, the State of Oregon produced the Oregon Climate Adaptation Framework. This framework identifies 11 climate-related risks for which the state must plan for. Five of those eleven climate risks—drought, coastal erosion, fire, flood, and landslides— are directly identified in the Oregon NHMP. In addition, three other hazards in the Oregon NHMP —wind storms, winter storms, and dust storms—have an underlying climate component.
Oregon and the Pacific Northwest have been rich in climate impacts research over the last eighteen years. In 2007, the Oregon Legislature created the Oregon Climate Change Research Institute (OCCRI) under HB3543 (OCCRI). Much of the material in this section is drawn from two reports from OCCRI: the 2010 Oregon Climate Assessment Report (OCCRI 2010) and the 2013 Northwest Climate Assessment Report (Dalton et al. 2013), both found at http://occri.net/reports. This section is not meant to be a comprehensive assessment of climate change and impacts in Oregon or an all-encompassing overview of each hazard. Rather, it presents future projections of temperature and precipitation, and describes some of the effects of such future conditions based on the frequency and magnitude of natural hazards in Oregon.
Past and Future Climate in Oregon (Mote et al, 2013) Historical (1895-present)
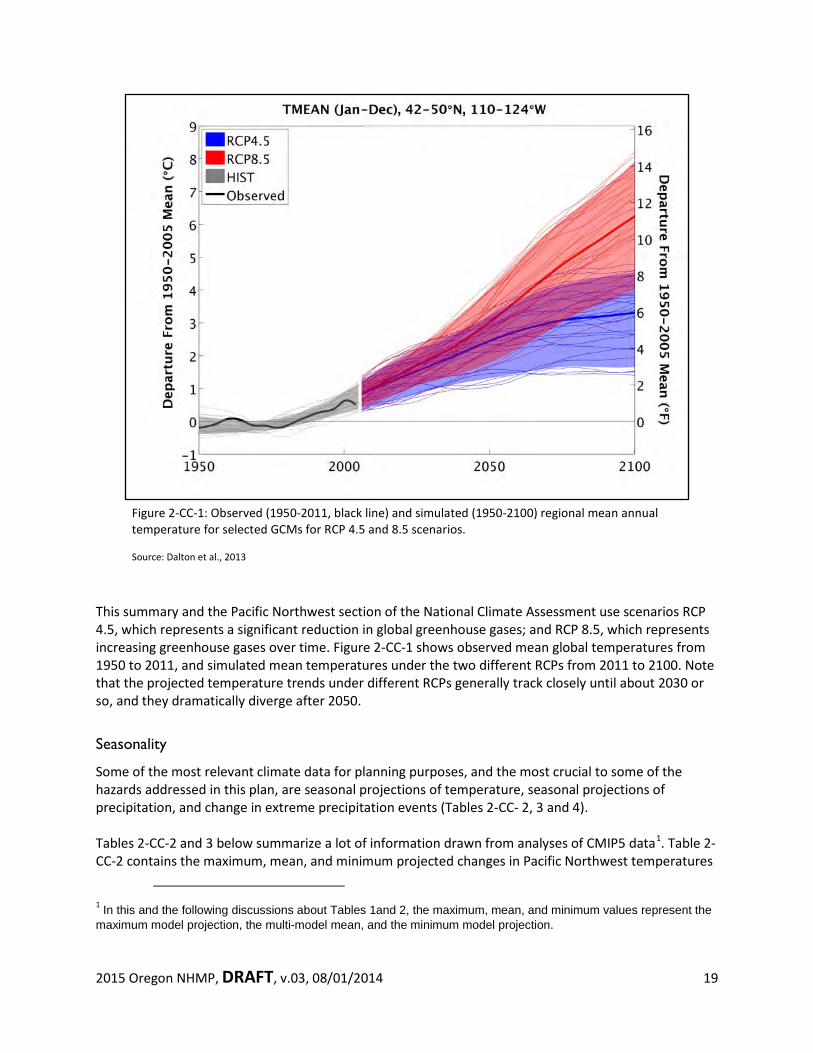
The impacts of climate change in Oregon are largely driven by temperature and precipitation. Temperatures in the Pacific Northwest increased 1.3 ˚F over the historical period (1895-2011 observed period). Over the last 30 years, temperatures in Oregon have generally been above the 20th century average (Figure 2-CC-1). The average annual temperatures in all but two years since 1998 have been above the average annual temperatures for the 20th century. Within the same historical time period, annual precipitation amounts fall within the normal range of natural annual variability. Future climate
Climate modeling is mostly performed at global to regional scales because of the computational power required. The temperature and precipitation projections relied on for this summary use data from the grid cells covering the Pacific Northwest in Global Climate Models. Since the Pacific Northwest region is relatively homogenous in its climate, Global Climate Model projections for the Pacific Northwest are relevant for planning in Oregon.
A number of research centers around the world run computerized Global Climate Models (GCMs), which provide scientists and decision makers with simulations of future global climate for comparison purposes. One such project, the Coupled Model Intercomparison Project (CMIP), involves many of these modeling centers worldwide. CMIP offers many simulations for scientists to use to assess the range of future climate projections for the globe. The latest CMIP experiment is the 5th phase of the project and is thus referred to as the CMIP5. CMIP5 simulations of the 21st century climate are driven by what are called “representative concentration pathways” (RCPs). RCPs represent the total amount of extra energy (in watts/m2) entering the climate system throughout the 21st century and beyond.
2015 Oregon NHMP, DRAFT, v.03, 08/01/2014 19
This summary and the Pacific Northwest section of the National Climate Assessment use scenarios RCP 4.5, which represents a significant reduction in global greenhouse gases; and RCP 8.5, which represents increasing greenhouse gases over time. Figure 2-CC-1 shows observed mean global temperatures from 1950 to 2011, and simulated mean temperatures under the two different RCPs from 2011 to 2100. Note that the projected temperature trends under different RCPs generally track closely until about 2030 or so, and they dramatically diverge after 2050.
Seasonality
Some of the most relevant climate data for planning purposes, and the most crucial to some of the hazards addressed in this plan, are seasonal projections of temperature, seasonal projections of precipitation, and change in extreme precipitation events (Tables 2-CC- 2, 3 and 4). Tables 2-CC-2 and 3 below summarize a lot of information drawn from analyses of CMIP5 data1. Table 2-CC-2 contains the maximum, mean, and minimum projected changes in Pacific Northwest temperatures
1 In this and the following discussions about Tables 1and 2, the maximum, mean, and minimum values represent the maximum model projection, the multi-model mean, and the minimum model projection.
Figure 2-CC-1: Observed (1950-2011, black line) and simulated (1950-2100) regional mean annual temperature for selected GCMs for RCP 4.5 and 8.5 scenarios.
Source: Dalton et al., 2013
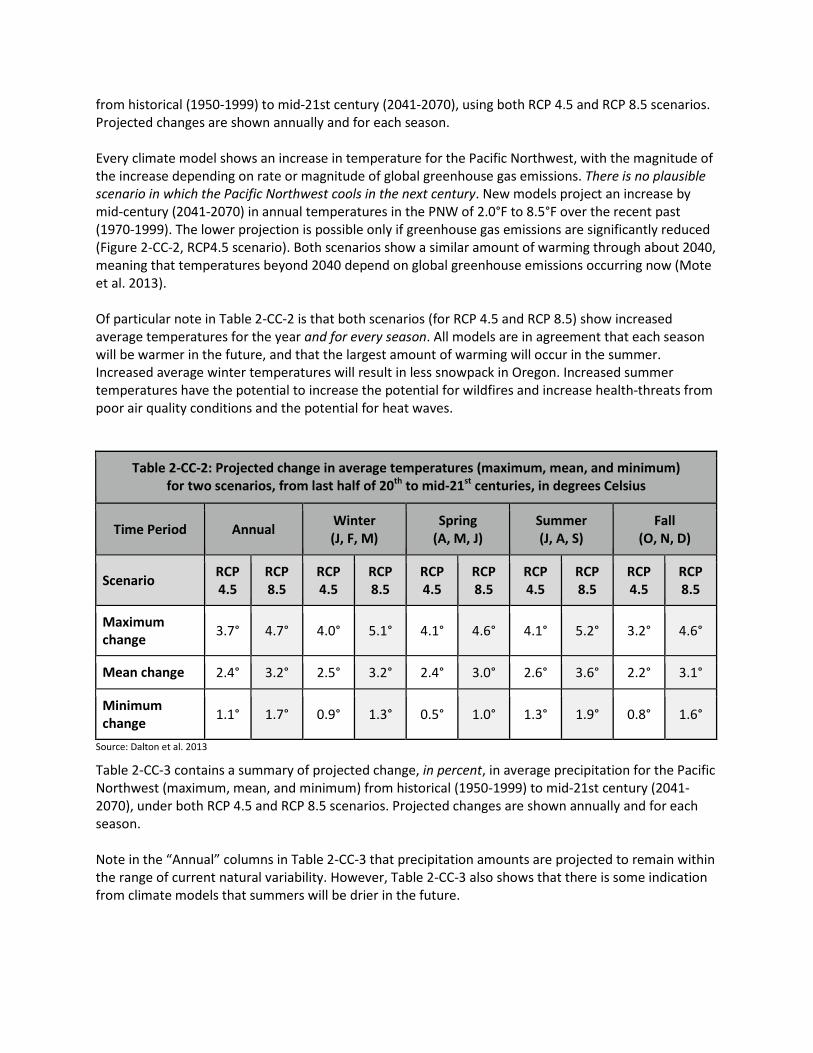
from historical (1950-1999) to mid-21st century (2041-2070), using both RCP 4.5 and RCP 8.5 scenarios. Projected changes are shown annually and for each season. Every climate model shows an increase in temperature for the Pacific Northwest, with the magnitude of the increase depending on rate or magnitude of global greenhouse gas emissions. There is no plausible scenario in which the Pacific Northwest cools in the next century. New models project an increase by mid-century (2041-2070) in annual temperatures in the PNW of 2.0°F to 8.5°F over the recent past (1970-1999). The lower projection is possible only if greenhouse gas emissions are significantly reduced (Figure 2-CC-2, RCP4.5 scenario). Both scenarios show a similar amount of warming through about 2040, meaning that temperatures beyond 2040 depend on global greenhouse emissions occurring now (Mote et al. 2013). Of particular note in Table 2-CC-2 is that both scenarios (for RCP 4.5 and RCP 8.5) show increased average temperatures for the year and for every season. All models are in agreement that each season will be warmer in the future, and that the largest amount of warming will occur in the summer. Increased average winter temperatures will result in less snowpack in Oregon. Increased summer temperatures have the potential to increase the potential for wildfires and increase health-threats from poor air quality conditions and the potential for heat waves.
Table 2-CC-2: Projected change in average temperatures (maximum, mean, and minimum) for two scenarios, from last half of 20th to mid-21st centuries, in degrees Celsius
Time Period Annual Winter (J, F, M)
Spring (A, M, J)
Summer (J, A, S)
Fall (O, N, D)
Scenario RCP 4.5
RCP 8.5
RCP 4.5
RCP 8.5
RCP 4.5
RCP 8.5
RCP 4.5
RCP 8.5
RCP 4.5
RCP 8.5
Maximum change 3.7° 4.7° 4.0° 5.1° 4.1° 4.6° 4.1° 5.2° 3.2° 4.6°
Mean change 2.4° 3.2° 2.5° 3.2° 2.4° 3.0° 2.6° 3.6° 2.2° 3.1°
Minimum change 1.1° 1.7° 0.9° 1.3° 0.5° 1.0° 1.3° 1.9° 0.8° 1.6°
Source: Dalton et al. 2013
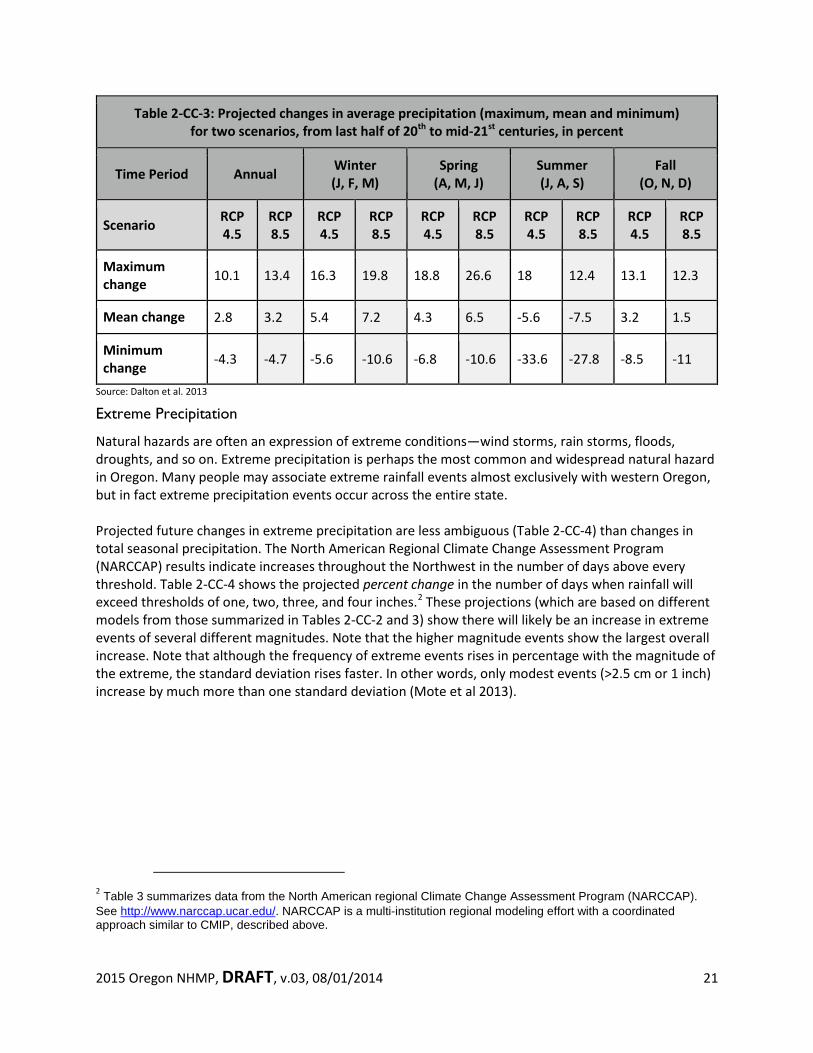
Table 2-CC-3 contains a summary of projected change, in percent, in average precipitation for the Pacific Northwest (maximum, mean, and minimum) from historical (1950-1999) to mid-21st century (2041-2070), under both RCP 4.5 and RCP 8.5 scenarios. Projected changes are shown annually and for each season. Note in the “Annual” columns in Table 2-CC-3 that precipitation amounts are projected to remain within the range of current natural variability. However, Table 2-CC-3 also shows that there is some indication from climate models that summers will be drier in the future.
2015 Oregon NHMP, DRAFT, v.03, 08/01/2014 21
Table 2-CC-3: Projected changes in average precipitation (maximum, mean and minimum) for two scenarios, from last half of 20th to mid-21st centuries, in percent
Time Period Annual Winter (J, F, M)
Spring (A, M, J)
Summer (J, A, S)
Fall (O, N, D)
Scenario RCP 4.5
RCP 8.5
RCP 4.5
RCP 8.5
RCP 4.5
RCP 8.5
RCP 4.5
RCP 8.5
RCP 4.5
RCP 8.5
Maximum change 10.1 13.4 16.3 19.8 18.8 26.6 18 12.4 13.1 12.3
Mean change 2.8 3.2 5.4 7.2 4.3 6.5 -5.6 -7.5 3.2 1.5
Minimum change -4.3 -4.7 -5.6 -10.6 -6.8 -10.6 -33.6 -27.8 -8.5 -11
Source: Dalton et al. 2013
Extreme Precipitation
Natural hazards are often an expression of extreme conditions—wind storms, rain storms, floods, droughts, and so on. Extreme precipitation is perhaps the most common and widespread natural hazard in Oregon. Many people may associate extreme rainfall events almost exclusively with western Oregon, but in fact extreme precipitation events occur across the entire state. Projected future changes in extreme precipitation are less ambiguous (Table 2-CC-4) than changes in total seasonal precipitation. The North American Regional Climate Change Assessment Program (NARCCAP) results indicate increases throughout the Northwest in the number of days above every threshold. Table 2-CC-4 shows the projected percent change in the number of days when rainfall will exceed thresholds of one, two, three, and four inches.2 These projections (which are based on different models from those summarized in Tables 2-CC-2 and 3) show there will likely be an increase in extreme events of several different magnitudes. Note that the higher magnitude events show the largest overall increase. Note that although the frequency of extreme events rises in percentage with the magnitude of the extreme, the standard deviation rises faster. In other words, only modest events (>2.5 cm or 1 inch) increase by much more than one standard deviation (Mote et al 2013).
2 Table 3 summarizes data from the North American regional Climate Change Assessment Program (NARCCAP). See http://www.narccap.ucar.edu/. NARCCAP is a multi-institution regional modeling effort with a coordinated approach similar to CMIP, described above.
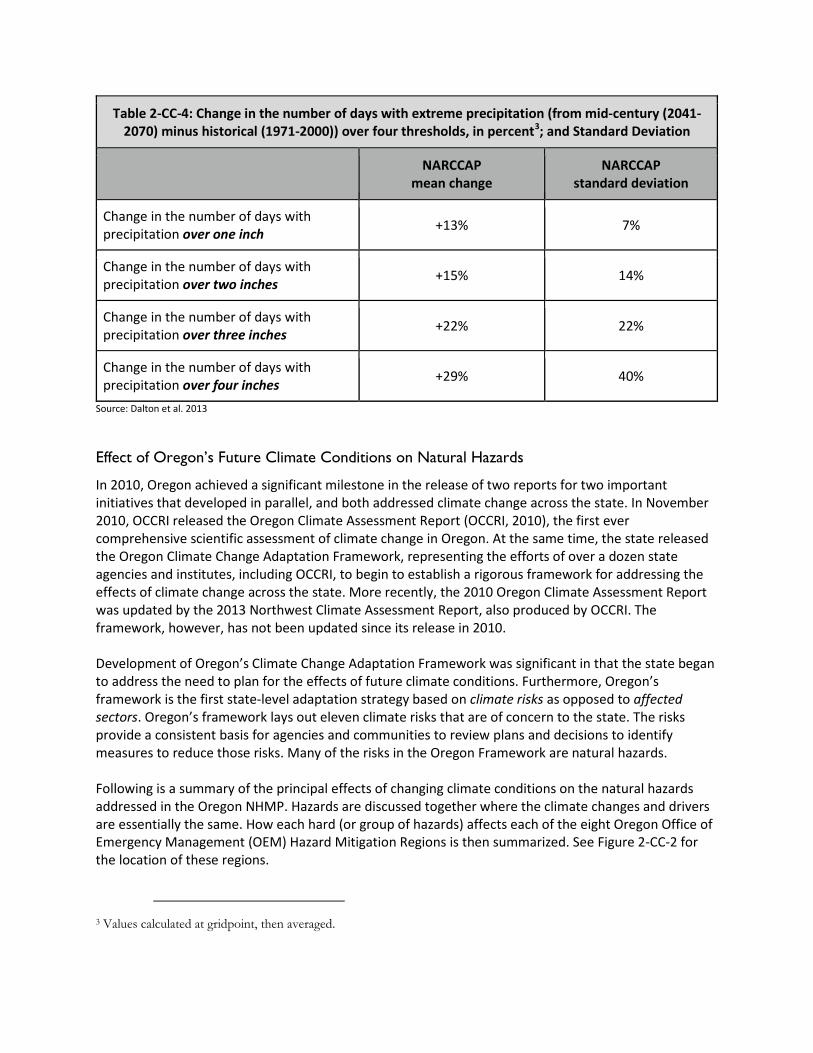
Table 2-CC-4: Change in the number of days with extreme precipitation (from mid-century (2041-2070) minus historical (1971-2000)) over four thresholds, in percent3; and Standard Deviation
NARCCAP mean change
NARCCAP standard deviation
Change in the number of days with precipitation over one inch +13% 7%
Change in the number of days with precipitation over two inches +15% 14%
Change in the number of days with precipitation over three inches +22% 22%
Change in the number of days with precipitation over four inches +29% 40%
Source: Dalton et al. 2013
Effect of Oregon’s Future Climate Conditions on Natural Hazards
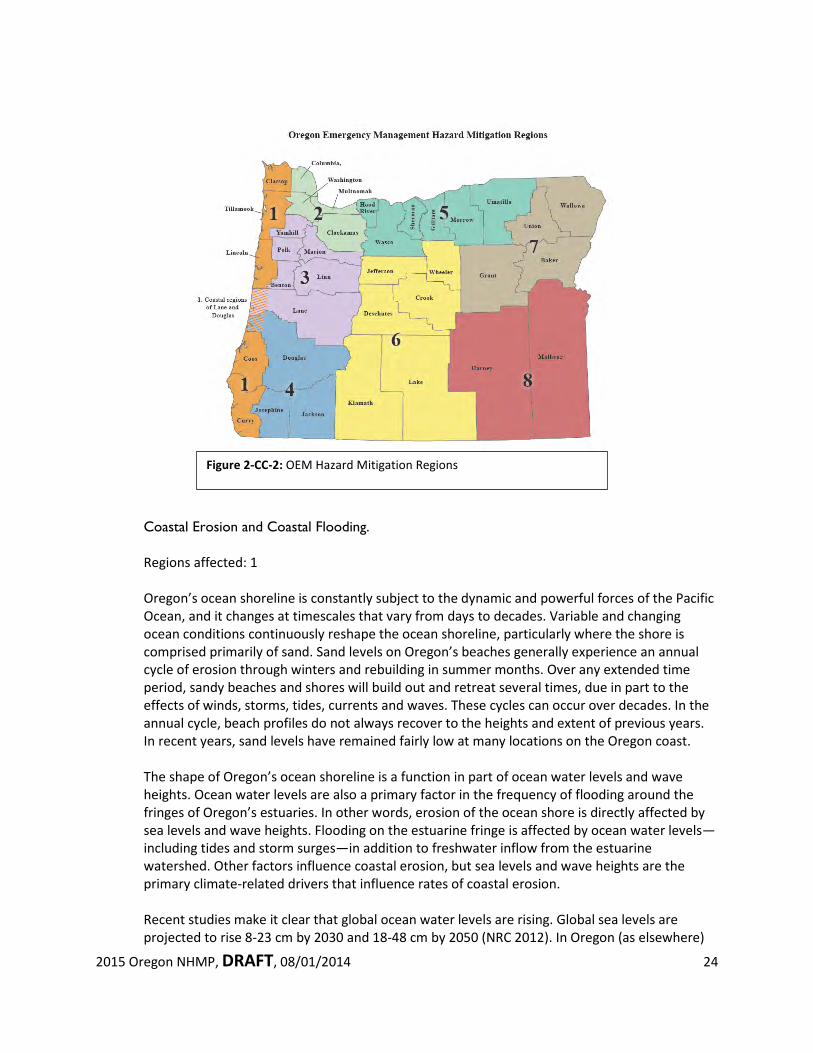
In 2010, Oregon achieved a significant milestone in the release of two reports for two important initiatives that developed in parallel, and both addressed climate change across the state. In November 2010, OCCRI released the Oregon Climate Assessment Report (OCCRI, 2010), the first ever comprehensive scientific assessment of climate change in Oregon. At the same time, the state released the Oregon Climate Change Adaptation Framework, representing the efforts of over a dozen state agencies and institutes, including OCCRI, to begin to establish a rigorous framework for addressing the effects of climate change across the state. More recently, the 2010 Oregon Climate Assessment Report was updated by the 2013 Northwest Climate Assessment Report, also produced by OCCRI. The framework, however, has not been updated since its release in 2010. Development of Oregon’s Climate Change Adaptation Framework was significant in that the state began to address the need to plan for the effects of future climate conditions. Furthermore, Oregon’s framework is the first state-level adaptation strategy based on climate risks as opposed to affected sectors. Oregon’s framework lays out eleven climate risks that are of concern to the state. The risks provide a consistent basis for agencies and communities to review plans and decisions to identify measures to reduce those risks. Many of the risks in the Oregon Framework are natural hazards. Following is a summary of the principal effects of changing climate conditions on the natural hazards addressed in the Oregon NHMP. Hazards are discussed together where the climate changes and drivers are essentially the same. How each hard (or group of hazards) affects each of the eight Oregon Office of Emergency Management (OEM) Hazard Mitigation Regions is then summarized. See Figure 2-CC-2 for the location of these regions.
3 Values calculated at gridpoint, then averaged.
2015 Oregon NHMP, DRAFT, v.03, 08/01/2014 23
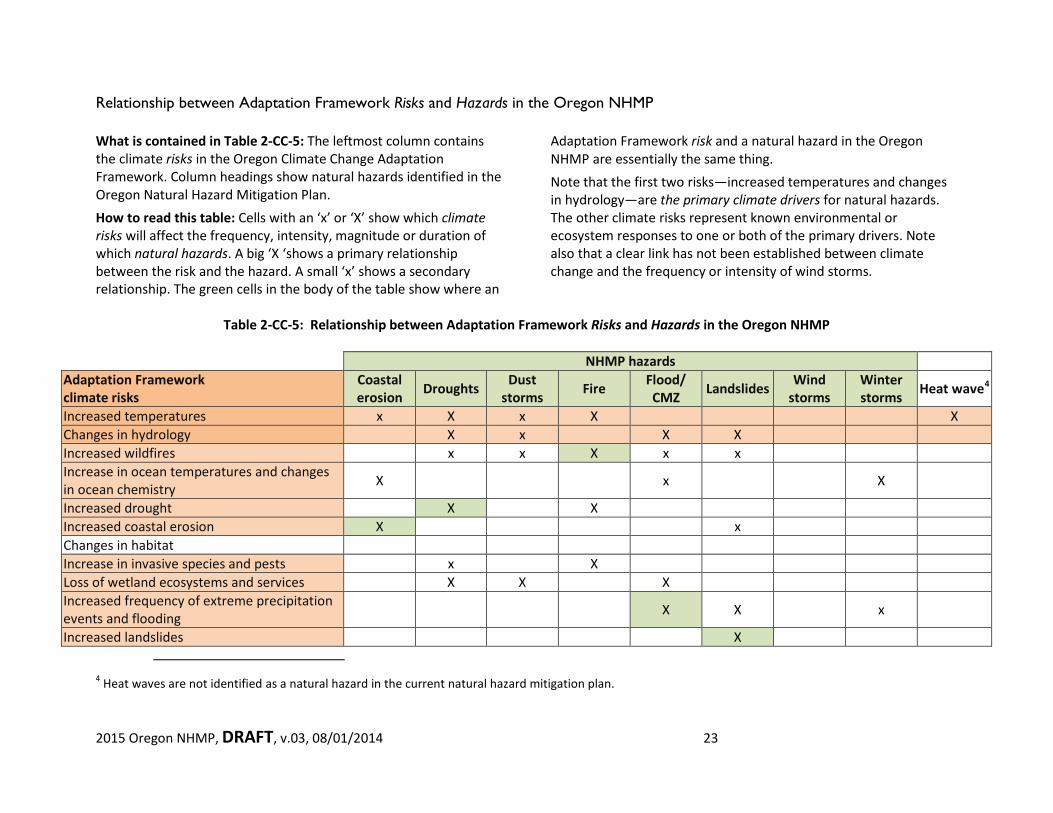
Relationship between Adaptation Framework Risks and Hazards in the Oregon NHMP What is contained in Table 2-CC-5: The leftmost column contains the climate risks in the Oregon Climate Change Adaptation Framework. Column headings show natural hazards identified in the Oregon Natural Hazard Mitigation Plan. How to read this table: Cells with an ‘x’ or ‘X’ show which climate risks will affect the frequency, intensity, magnitude or duration of which natural hazards. A big ‘X ‘shows a primary relationship between the risk and the hazard. A small ‘x’ shows a secondary relationship. The green cells in the body of the table show where an
Adaptation Framework risk and a natural hazard in the Oregon NHMP are essentially the same thing. Note that the first two risks—increased temperatures and changes in hydrology—are the primary climate drivers for natural hazards. The other climate risks represent known environmental or ecosystem responses to one or both of the primary drivers. Note also that a clear link has not been established between climate change and the frequency or intensity of wind storms.
Table 2-CC-5: Relationship between Adaptation Framework Risks and Hazards in the Oregon NHMP
NHMP hazards Adaptation Framework climate risks
Coastal erosion Droughts Dust
storms Fire Flood/ CMZ Landslides Wind
storms Winter storms Heat wave4
Increased temperatures x X x X X Changes in hydrology X x X X Increased wildfires x x X x x Increase in ocean temperatures and changes in ocean chemistry X x X
Increased drought X X Increased coastal erosion X x Changes in habitat Increase in invasive species and pests x X Loss of wetland ecosystems and services X X X Increased frequency of extreme precipitation events and flooding X X x
Increased landslides X
4 Heat waves are not identified as a natural hazard in the current natural hazard mitigation plan.
2015 Oregon NHMP, DRAFT, 08/01/2014 24
Coastal Erosion and Coastal Flooding. Regions affected: 1 Oregon’s ocean shoreline is constantly subject to the dynamic and powerful forces of the Pacific Ocean, and it changes at timescales that vary from days to decades. Variable and changing ocean conditions continuously reshape the ocean shoreline, particularly where the shore is comprised primarily of sand. Sand levels on Oregon’s beaches generally experience an annual cycle of erosion through winters and rebuilding in summer months. Over any extended time period, sandy beaches and shores will build out and retreat several times, due in part to the effects of winds, storms, tides, currents and waves. These cycles can occur over decades. In the annual cycle, beach profiles do not always recover to the heights and extent of previous years. In recent years, sand levels have remained fairly low at many locations on the Oregon coast. The shape of Oregon’s ocean shoreline is a function in part of ocean water levels and wave heights. Ocean water levels are also a primary factor in the frequency of flooding around the fringes of Oregon’s estuaries. In other words, erosion of the ocean shore is directly affected by sea levels and wave heights. Flooding on the estuarine fringe is affected by ocean water levels—including tides and storm surges—in addition to freshwater inflow from the estuarine watershed. Other factors influence coastal erosion, but sea levels and wave heights are the primary climate-related drivers that influence rates of coastal erosion. Recent studies make it clear that global ocean water levels are rising. Global sea levels are projected to rise 8-23 cm by 2030 and 18-48 cm by 2050 (NRC 2012). In Oregon (as elsewhere)
Figure 2-CC-2: OEM Hazard Mitigation Regions
2015 Oregon NHMP, DRAFT, 08/01/2014 25
the rates of relative sea level rise are not the same as rates of change in global sea levels, because of a number of factors related to ocean conditions and vertical movement of the land. Oregon’s western edge is rising, so the rates of sea level rise in Oregon are not as high as rates seen in other west coast locations. But even after factoring in local conditions, sea levels along Oregon’s coast are rising. For more information on coastal erosion and see level rise, see the Coastal Hazards section of this Plan, beginning on page 24. Recent research also indicates that significant wave heights off Oregon are increasing. Increasing significant wave heights may be a factor in the observed increase of coastal flooding events in Oregon. During El Niño events, sea levels can rise up to about 1.5 feet (0.5 meters) higher over extended periods (seasons). Rising sea levels and increasing wave heights are both expected to increase coastal erosion and coastal flooding. One of the climate risks discussed in the Oregon Climate Adaptation Framework is “Increased coastal erosion and risk of inundation from increasing wave heights and storm surges.” The executive summary of the Adaptation Framework provides a summary of various challenges associated with increased coastal erosion:
Increased wave heights, storm surges, and sea levels can lead to loss of natural buffering functions of beaches, tidal wetlands, and dunes. Accelerating shoreline erosion has been documented, and is resulting in increased applications for shore protective structures. Shoreline alterations typically reduce the ability of beaches, tidal wetlands, and dunes to adjust to new conditions. Increasing sea levels, wave heights and storm surges will increase coastal erosion and likely increase damage to private property and infrastructure situated on coastal shorelands. Coastal erosion and the common response to reduce shoreland erosion can lead to long-term loss of natural buffering functions of beaches and dunes. Applications for shoreline alteration permits to protect property and infrastructure are increasing, but in the long term they reduce the ability of shore systems to adjust to new conditions.
Drought, Wildfire, and Dust Storms. Regions affected: 1-8 All eight regions in the Oregon NHMP are potentially affected by increasing incidence of drought and wildfire. Moreover, areas that have historically been both hotter and drier than the statewide average—southwest Oregon counties and central and eastern Oregon—are at somewhat higher risk of increased drought and wildfire than the state overall. There is no current research available on the direct effects of future climate conditions on the incidence of dust storms. However, because drought conditions have the effect of reducing wetlands and drying soils, droughts can increase the amount of soil particulate matter available to be entrained in high winds, in particular where agriculture practices include tilling. This correlation between drought conditions and dust storms means that an increase in future
2015 Oregon NHMP, DRAFT, 08/01/2014 26
droughts could increase the incidence of dust storms, even though the drought is unrelated to the storm. Droughts, fires, and dust storms are addressed as separate hazards in this plan. However, the underlying climate mechanism is similar for each. These hazards all occur in conjunction with warmer and drier conditions. Virtually all climate models project warmer, drier summers for Oregon, with mean projected seasonal increases in summer temperatures of 2.6 to 3.6 ˚C by mid-century, and a decline in mean summer precipitation amounts of 5.6 to 7.5 percent by mid-century. These summer conditions will be coupled with by projected decreases in mountain snowpack due to warmer winter temperatures. Models project a mean increase in winter temperatures of 2.5 to 3.2 ˚C by mid-century. This combination of factors exacerbates the likelihood of drought, which in turn often leads to an increase in the incidence and likelihood of wildfires and dust storms. Two climate risks that are somewhat prominent in the framework are “Increase in wildfire frequency and intensity” and “Increased incidence of drought.” Dust storms were not addressed in the framework as a climate risk; at the time the framework was developed, research literature on the climatic conditions behind dust storms was scarce or nonexistent. The executive summary of Oregon’s Climate Change Adaptation Framework provides a summary of challenges associated with increased incidence of both wildfires and drought, as follows.
Wildfire Increased temperatures, the potential for reduced precipitation in summer months, and accumulation of fuels in forests due to insect and disease damage (particularly in eastside forests5) present high risk for catastrophic fires. An increase in frequency and intensity of wildfire will damage larger areas, and likely cause greater ecosystem and habitat damage. Larger and more frequent wildfires will increase human health risks due to exposure to smoke. Increased risk of wildfire will result in increased potential for economic damage at the urban-wildland interface. Wildfires destroy property, infrastructure, commercial timber, recreational opportunities, and ecosystem services. Some buildings and infrastructure subject to increased fire risk may not be adequately insured against losses due to fire. Increased fire danger will increase the cost to prevent, prepare for, and respond to wildfires.
Drought
Longer and drier growing seasons and drought will result in increased demand on ground water resources and increased consumption of water for irrigation, which will have potential consequences for natural systems. Droughts affect wetlands, stream systems, and aquatic habitats. Drought will result in drier forests and increase likelihood of wildfire.
5 Forests east of the crest of the Cascade Range.
2015 Oregon NHMP, DRAFT, 08/01/2014 27
Droughts will cause significant economic damage to the agriculture industry through reduced yields and quality of some crops. Droughts can increase irrigation-related water consumption, and thus increase irrigation costs. Drought conditions can also have a significant effect on the supply of drinking water.
Winter Storms, Flooding, and Landslides Regions affected: 1-4 Flooding and landslides are projected to occur more frequently throughout western Oregon, in Oregon NHMP Regions 1 through 4. While winter storms affect all areas of the state, there is no current research available indicating any change in the incidence of winter storms due to changing climate conditions. The increase in extreme precipitation that is projected to occur at all thresholds from 1 to 4 inches per day (see Table 2-CC-4) is expected to result in a greater risk of flooding in certain basins. Changes in flood risk are strongly associated with the dominant form of precipitation in a basin, with mixed rain-snow basins in Washington and Oregon already seeing increases in flood risk. Generally, western Oregon basins are projected to experience increased flood risk in future decades. Increased flood risk involves both an increased incidence of flooding of a certain magnitude and an increase in the magnitude of floods of a certain return interval. In other areas of the state, flood risk may decrease in some basins and increase in others. Landslides in Oregon are strongly correlated with rainfall, so increased rainfall— particularly in extreme events—will likely trigger increased landslides. The executive summary of Oregon’s Climate Change Adaptation Framework provides a summary of challenges associated with both flooding and landslides: Floods:
Extreme precipitation events have the potential to cause localized flooding due partly to inadequate capacity of storm drain systems. Extreme events can damage or cause failure of dam spillways. Increased incidence and magnitude of flood events will increase damage to property and infrastructure, and will increase the vulnerability of areas that already experience repeated flooding. Areas thought to be outside the floodplain may begin to experience flooding. Many of these areas have improvements that are not built to floodplain management standards and are not insured against flood damage; therefore being more vulnerable to flood events. Finally, increased flooding will increase flood-related transportation system disruptions, thereby affecting the distribution of water, food, and essential services. Landslides
Increased landslides will cause increased damage to property and infrastructure, and will disrupt transportation and the distribution of water, food, and essential services. Widespread damaging landslides that accompany intense rainstorms (such as
2015 Oregon NHMP, DRAFT, 08/01/2014 28
“pineapple express” winter storms) and related floods occur during most winters. Particularly high-consequence events occur about every decade; recent examples include those in February 1996, November 2006 and December 2007.
Windstorms Regions affected: Unknown There is little research on changing wind in the Pacific Northwest as a result of climate change.
___________ IPCC 2013. Summary for Policymakers. In: Climate Change 2013: The Physical Science Basis. Contribution of Working Group I to the Fifth Assessment Report of the Intergovernmental Panel on Climate Change [Stocker, T.F., D. Qin, G.-K. Plattner, M. Tignor, S. K. Allen, J. Boschung, A. Nauels, Y. Xia, V. Bex and P.M. Midgley (eds.)]. Cambridge University Press, Cambridge, United Kingdom and New York, NY, USA
OCCRI 2010. The Oregon Climate Assessment Report, K.D. Dello and P.W. Mote (eds). College of Oceanic and Atmospheric Sciences, Oregon State University, Corvallis OR.
Dalton, M.M., P.W. Mote, A.K. Snover (eds.) 2013. Climate Change in the Northwest: Implications for Our Landscapes, Waters and Communities. Washington DC: Island Press.
Mote, P.W, J.T. Abatzoglou, K.E. Kunkel (2013). Variability and Change in the Past and Future. In Climate Change in the Northwest: Implications for Our Landscapes, Waters and Communities. Washington DC: Island Press.
2015 Oregon NHMP, DRAFT, 08/01/2014 29
Hazards
Requirement: 44 CFR §201.4(c)(2)(i): Th[e] risk assessment shall include… (i) (a)n overview of the type and location of all natural hazards that can affect the State, including information on previous occurrences of hazard events, as well as the probability of future hazard events, using maps where appropriate;
2015 Oregon NHMP, DRAFT, 08/01/2014 30
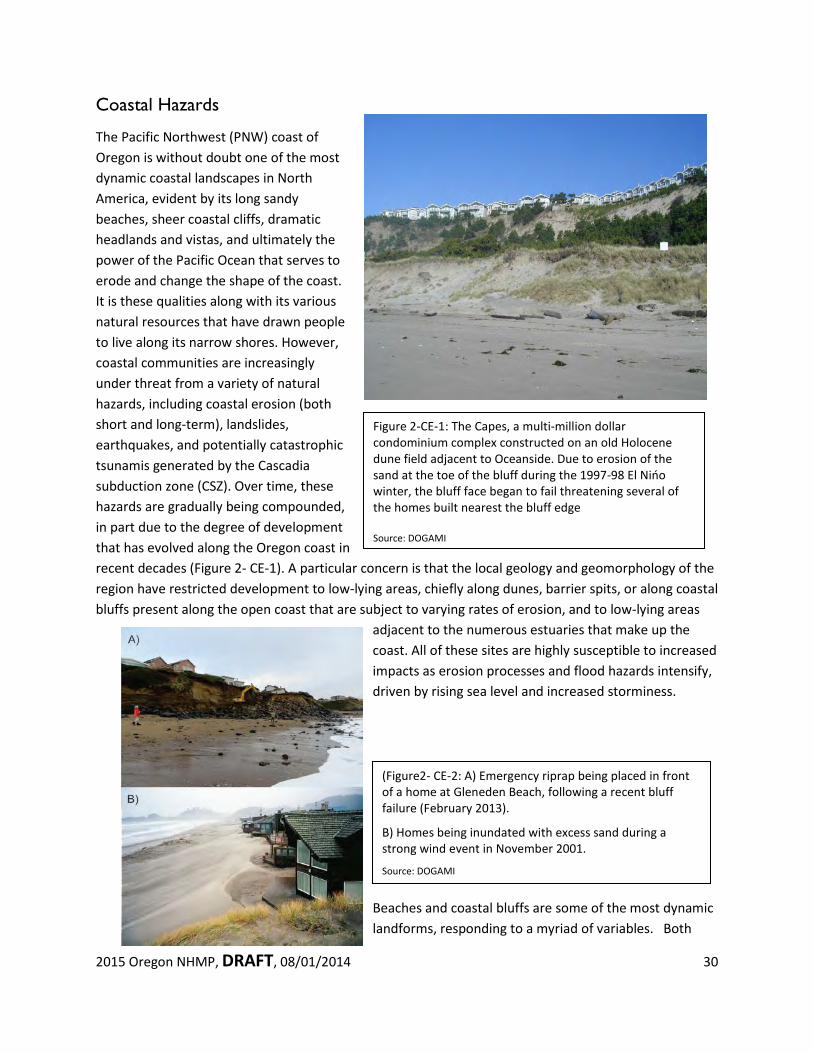
Figure 2-CE-1: The Capes, a multi-million dollar condominium complex constructed on an old Holocene dune field adjacent to Oceanside. Due to erosion of the sand at the toe of the bluff during the 1997-98 El Nińo winter, the bluff face began to fail threatening several of the homes built nearest the bluff edge Source: DOGAMI
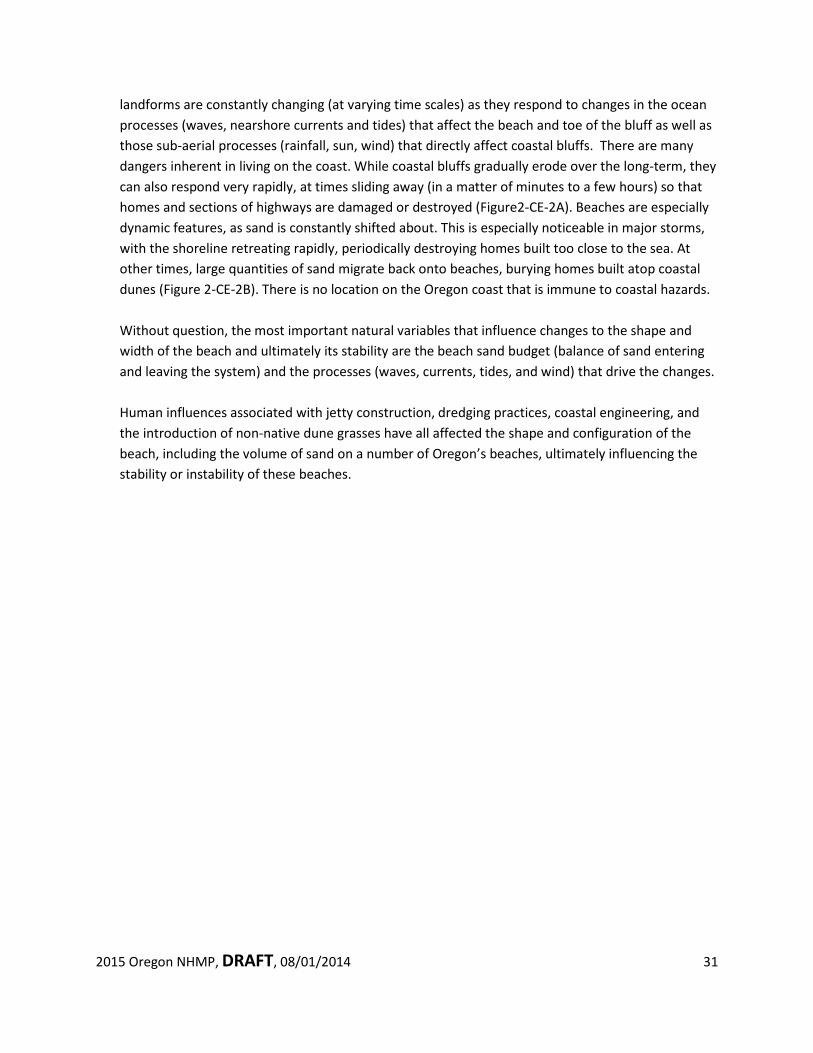
(Figure2- CE-2: A) Emergency riprap being placed in front of a home at Gleneden Beach, following a recent bluff failure (February 2013).
B) Homes being inundated with excess sand during a strong wind event in November 2001.
Source: DOGAMI
Coastal Hazards
The Pacific Northwest (PNW) coast of Oregon is without doubt one of the most dynamic coastal landscapes in North America, evident by its long sandy beaches, sheer coastal cliffs, dramatic headlands and vistas, and ultimately the power of the Pacific Ocean that serves to erode and change the shape of the coast. It is these qualities along with its various natural resources that have drawn people to live along its narrow shores. However, coastal communities are increasingly under threat from a variety of natural hazards, including coastal erosion (both short and long-term), landslides, earthquakes, and potentially catastrophic tsunamis generated by the Cascadia subduction zone (CSZ). Over time, these hazards are gradually being compounded, in part due to the degree of development that has evolved along the Oregon coast in recent decades (Figure 2- CE-1). A particular concern is that the local geology and geomorphology of the region have restricted development to low-lying areas, chiefly along dunes, barrier spits, or along coastal bluffs present along the open coast that are subject to varying rates of erosion, and to low-lying areas
adjacent to the numerous estuaries that make up the coast. All of these sites are highly susceptible to increased impacts as erosion processes and flood hazards intensify, driven by rising sea level and increased storminess.
Beaches and coastal bluffs are some of the most dynamic landforms, responding to a myriad of variables. Both
2015 Oregon NHMP, DRAFT, 08/01/2014 31
landforms are constantly changing (at varying time scales) as they respond to changes in the ocean processes (waves, nearshore currents and tides) that affect the beach and toe of the bluff as well as those sub-aerial processes (rainfall, sun, wind) that directly affect coastal bluffs. There are many dangers inherent in living on the coast. While coastal bluffs gradually erode over the long-term, they can also respond very rapidly, at times sliding away (in a matter of minutes to a few hours) so that homes and sections of highways are damaged or destroyed (Figure2-CE-2A). Beaches are especially dynamic features, as sand is constantly shifted about. This is especially noticeable in major storms, with the shoreline retreating rapidly, periodically destroying homes built too close to the sea. At other times, large quantities of sand migrate back onto beaches, burying homes built atop coastal dunes (Figure 2-CE-2B). There is no location on the Oregon coast that is immune to coastal hazards.
Without question, the most important natural variables that influence changes to the shape and width of the beach and ultimately its stability are the beach sand budget (balance of sand entering and leaving the system) and the processes (waves, currents, tides, and wind) that drive the changes. Human influences associated with jetty construction, dredging practices, coastal engineering, and the introduction of non-native dune grasses have all affected the shape and configuration of the beach, including the volume of sand on a number of Oregon’s beaches, ultimately influencing the stability or instability of these beaches.
2015 Oregon NHMP, DRAFT, 08/01/2014 32
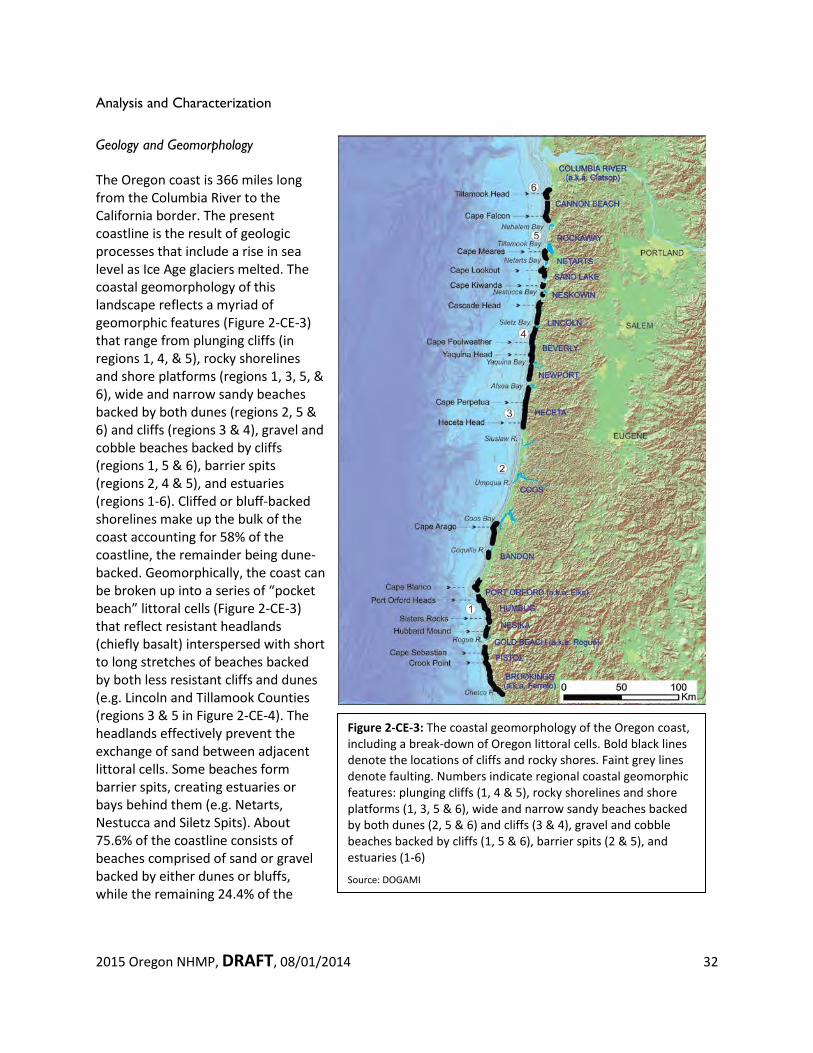
Figure 2-CE-3: The coastal geomorphology of the Oregon coast, including a break-down of Oregon littoral cells. Bold black lines denote the locations of cliffs and rocky shores. Faint grey lines denote faulting. Numbers indicate regional coastal geomorphic features: plunging cliffs (1, 4 & 5), rocky shorelines and shore platforms (1, 3, 5 & 6), wide and narrow sandy beaches backed by both dunes (2, 5 & 6) and cliffs (3 & 4), gravel and cobble beaches backed by cliffs (1, 5 & 6), barrier spits (2 & 5), and estuaries (1-6)
Source: DOGAMI
Analysis and Characterization
Geology and Geomorphology
The Oregon coast is 366 miles long from the Columbia River to the California border. The present coastline is the result of geologic processes that include a rise in sea level as Ice Age glaciers melted. The coastal geomorphology of this landscape reflects a myriad of geomorphic features (Figure 2-CE-3) that range from plunging cliffs (in regions 1, 4, & 5), rocky shorelines and shore platforms (regions 1, 3, 5, & 6), wide and narrow sandy beaches backed by both dunes (regions 2, 5 & 6) and cliffs (regions 3 & 4), gravel and cobble beaches backed by cliffs (regions 1, 5 & 6), barrier spits (regions 2, 4 & 5), and estuaries (regions 1-6). Cliffed or bluff-backed shorelines make up the bulk of the coast accounting for 58% of the coastline, the remainder being dune-backed. Geomorphically, the coast can be broken up into a series of “pocket beach” littoral cells (Figure 2-CE-3) that reflect resistant headlands (chiefly basalt) interspersed with short to long stretches of beaches backed by both less resistant cliffs and dunes (e.g. Lincoln and Tillamook Counties (regions 3 & 5 in Figure 2-CE-4). The headlands effectively prevent the exchange of sand between adjacent littoral cells. Some beaches form barrier spits, creating estuaries or bays behind them (e.g. Netarts, Nestucca and Siletz Spits). About 75.6% of the coastline consists of beaches comprised of sand or gravel backed by either dunes or bluffs, while the remaining 24.4% of the
2015 Oregon NHMP, DRAFT, 08/01/2014 33
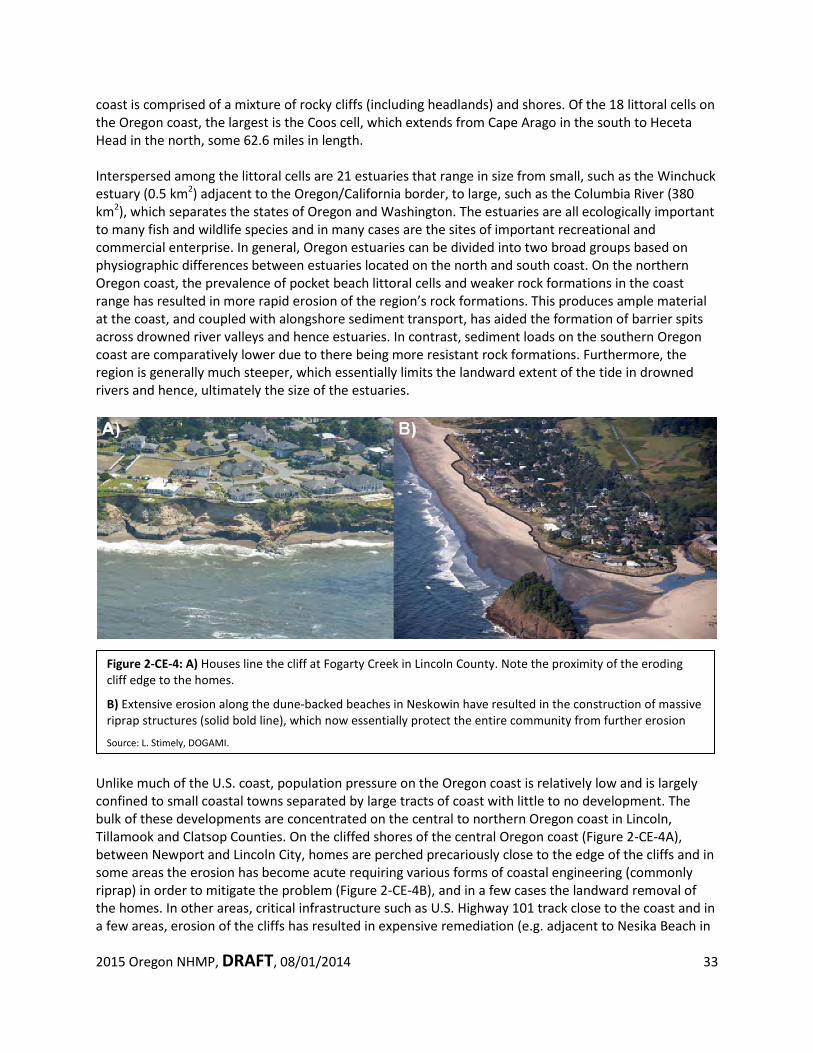
Figure 2-CE-4: A) Houses line the cliff at Fogarty Creek in Lincoln County. Note the proximity of the eroding cliff edge to the homes.
B) Extensive erosion along the dune-backed beaches in Neskowin have resulted in the construction of massive riprap structures (solid bold line), which now essentially protect the entire community from further erosion
Source: L. Stimely, DOGAMI.
coast is comprised of a mixture of rocky cliffs (including headlands) and shores. Of the 18 littoral cells on the Oregon coast, the largest is the Coos cell, which extends from Cape Arago in the south to Heceta Head in the north, some 62.6 miles in length. Interspersed among the littoral cells are 21 estuaries that range in size from small, such as the Winchuck estuary (0.5 km2) adjacent to the Oregon/California border, to large, such as the Columbia River (380 km2), which separates the states of Oregon and Washington. The estuaries are all ecologically important to many fish and wildlife species and in many cases are the sites of important recreational and commercial enterprise. In general, Oregon estuaries can be divided into two broad groups based on physiographic differences between estuaries located on the north and south coast. On the northern Oregon coast, the prevalence of pocket beach littoral cells and weaker rock formations in the coast range has resulted in more rapid erosion of the region’s rock formations. This produces ample material at the coast, and coupled with alongshore sediment transport, has aided the formation of barrier spits across drowned river valleys and hence estuaries. In contrast, sediment loads on the southern Oregon coast are comparatively lower due to there being more resistant rock formations. Furthermore, the region is generally much steeper, which essentially limits the landward extent of the tide in drowned rivers and hence, ultimately the size of the estuaries.
Unlike much of the U.S. coast, population pressure on the Oregon coast is relatively low and is largely confined to small coastal towns separated by large tracts of coast with little to no development. The bulk of these developments are concentrated on the central to northern Oregon coast in Lincoln, Tillamook and Clatsop Counties. On the cliffed shores of the central Oregon coast (Figure 2-CE-4A), between Newport and Lincoln City, homes are perched precariously close to the edge of the cliffs and in some areas the erosion has become acute requiring various forms of coastal engineering (commonly riprap) in order to mitigate the problem (Figure 2-CE-4B), and in a few cases the landward removal of the homes. In other areas, critical infrastructure such as U.S. Highway 101 track close to the coast and in a few areas, erosion of the cliffs has resulted in expensive remediation (e.g. adjacent to Nesika Beach in
2015 Oregon NHMP, DRAFT, 08/01/2014 34
Curry County). While the processes driving coastal erosion on bluff-backed shores are entirely a function of the delicate balance between the assailing forces (waves, tides, and currents) and properties of the rock (rock type, bedding, strength, etc.), increasing development pressure, weak land-use regulations, a lack of quantitative information, and ignorance of the physical processes have certainly contributed to the need for remediation in many coastal areas.
Elsewhere, significant development is typically located along the seaward most dune (foredune) system (Figure 2-CE-2B and 5B), as developers seek to capitalize on ocean views and proximity to the beach. However, major storms, especially in the late 1990s have resulted in extensive erosion, with many communities (e.g. Neskowin and Rockaway Beach in Tillamook County) having to resort to major coastal engineering in order to safeguard individual properties. The magnitude and extent of these erosion events have now left entire communities entirely dependent on the integrity of the structures.
Sand Budget
The beach sand budget is the rate at which sand is brought into the coastal system versus the rate at which sand leaves the system. A negative balance means that more sand is leaving than is arriving and results in erosion of that segment of shoreline. A positive balance means that more sand is arriving than is leaving, enabling that segment of shoreline to gain sand and accrete and potentially advance seaward. Along the Oregon coast, potential sources of sand include rivers, bluffs, dunes, and the inner shelf. Potential sand sinks include, bays (estuaries), dunes, dredging around the mouths of estuaries, and mining of sand.
Attention is often focused on the effects of beach and dune erosion. Yet, there are segments of Oregon's coast where periodically the concern is excess sand build-up, as has occurred in places like Pacific City (Figure 2-CE-2B), Manzanita, Bayshore Spit, Nedonna and Cannon Beach. Classifying Coastal Hazards Natural hazards that affect coastal regions can be divided into two general classes, chronic and catastrophic:
Chronic hazards are those we can see clear evidence of along the shore: beach, dune, and bluff erosion, landslides, slumps, and flooding of low-lying lands during major storms. The damage caused by chronic hazards is usually gradual and cumulative. However, storms that produce large winter waves, heavy rainfall and/or high winds may result in very rapid erosion or other damage that can affect properties and infrastructure over a matter of hours. The regional, oceanic, and climatic environments that result in intense winter storms determine the severity of chronic hazards along the Oregon coast. Chronic hazards are typically local in nature, and the threats to human life and property that arise from them are generally less severe than those associated with catastrophic hazards. However, the wide distribution and frequent occurrence of chronic hazards makes them a more immediate concern.
Catastrophic hazards are regional in scale and scope. Cascadia Subduction Zone earthquakes, and the ground shaking, subsidence, landsliding, liquefaction, and tsunamis that accompany them are catastrophic hazards. Tsunamis generated from distant earthquakes can also cause substantial damage in some coastal areas. The processes associated with earthquakes, tsunamis, floods, and landslides are discussed later in this chapter.
2015 Oregon NHMP, DRAFT, 08/01/2014 35
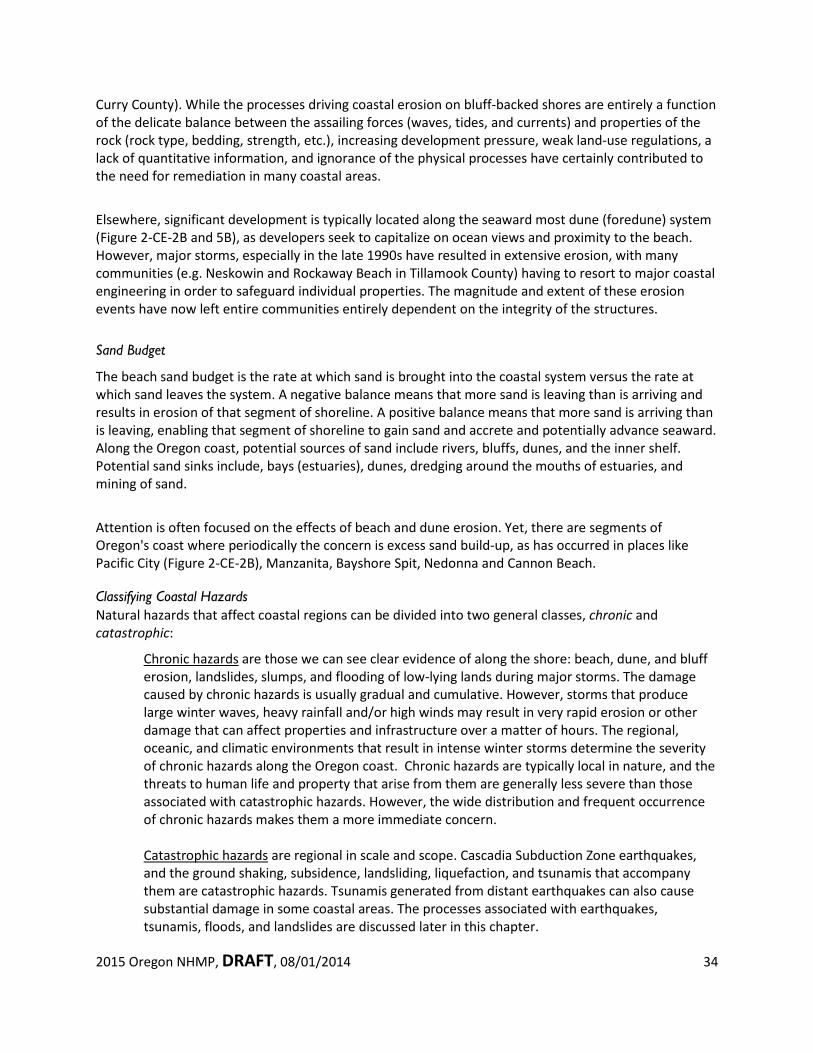
Figure CE-5: Patterns of sediment transport during “normal” and El Nino years
Source: Komar, 1986.
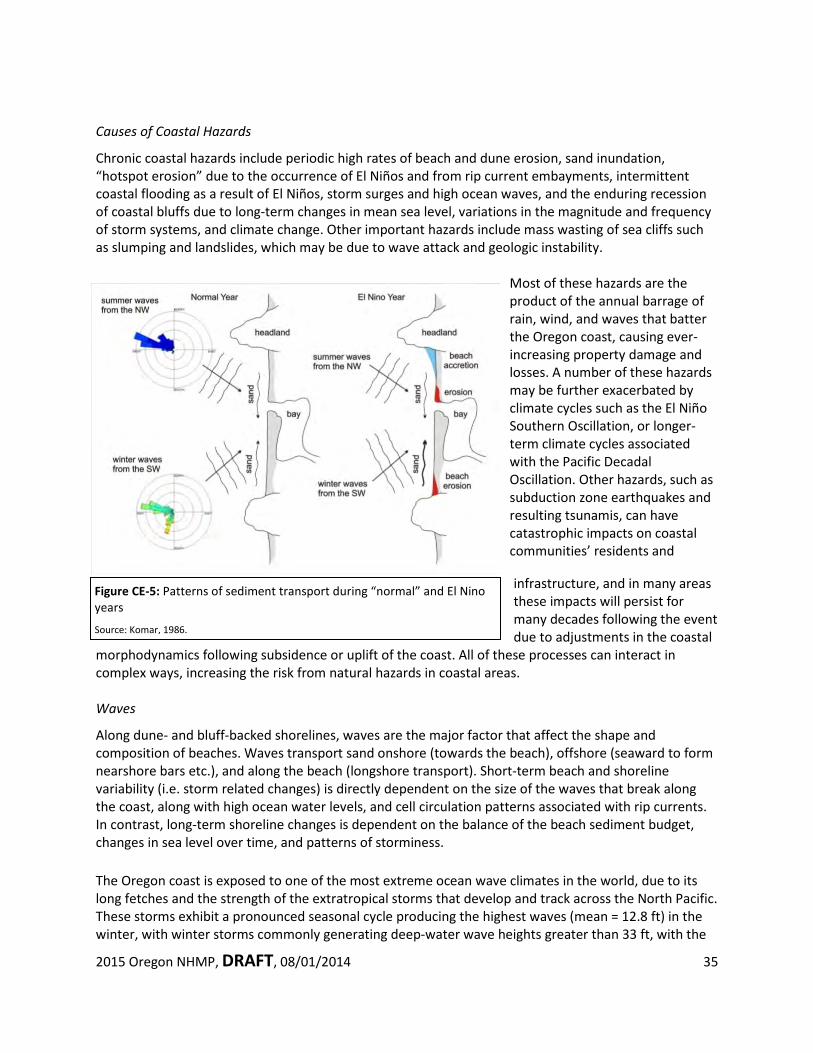
Causes of Coastal Hazards
Chronic coastal hazards include periodic high rates of beach and dune erosion, sand inundation, “hotspot erosion” due to the occurrence of El Niños and from rip current embayments, intermittent coastal flooding as a result of El Niños, storm surges and high ocean waves, and the enduring recession of coastal bluffs due to long-term changes in mean sea level, variations in the magnitude and frequency of storm systems, and climate change. Other important hazards include mass wasting of sea cliffs such as slumping and landslides, which may be due to wave attack and geologic instability.
Most of these hazards are the product of the annual barrage of rain, wind, and waves that batter the Oregon coast, causing ever-increasing property damage and losses. A number of these hazards may be further exacerbated by climate cycles such as the El Niño Southern Oscillation, or longer-term climate cycles associated with the Pacific Decadal Oscillation. Other hazards, such as subduction zone earthquakes and resulting tsunamis, can have catastrophic impacts on coastal communities’ residents and
infrastructure, and in many areas these impacts will persist for many decades following the event due to adjustments in the coastal
morphodynamics following subsidence or uplift of the coast. All of these processes can interact in complex ways, increasing the risk from natural hazards in coastal areas. Waves
Along dune- and bluff-backed shorelines, waves are the major factor that affect the shape and composition of beaches. Waves transport sand onshore (towards the beach), offshore (seaward to form nearshore bars etc.), and along the beach (longshore transport). Short-term beach and shoreline variability (i.e. storm related changes) is directly dependent on the size of the waves that break along the coast, along with high ocean water levels, and cell circulation patterns associated with rip currents. In contrast, long-term shoreline changes is dependent on the balance of the beach sediment budget, changes in sea level over time, and patterns of storminess. The Oregon coast is exposed to one of the most extreme ocean wave climates in the world, due to its long fetches and the strength of the extratropical storms that develop and track across the North Pacific. These storms exhibit a pronounced seasonal cycle producing the highest waves (mean = 12.8 ft) in the winter, with winter storms commonly generating deep-water wave heights greater than 33 ft, with the
2015 Oregon NHMP, DRAFT, 08/01/2014 36
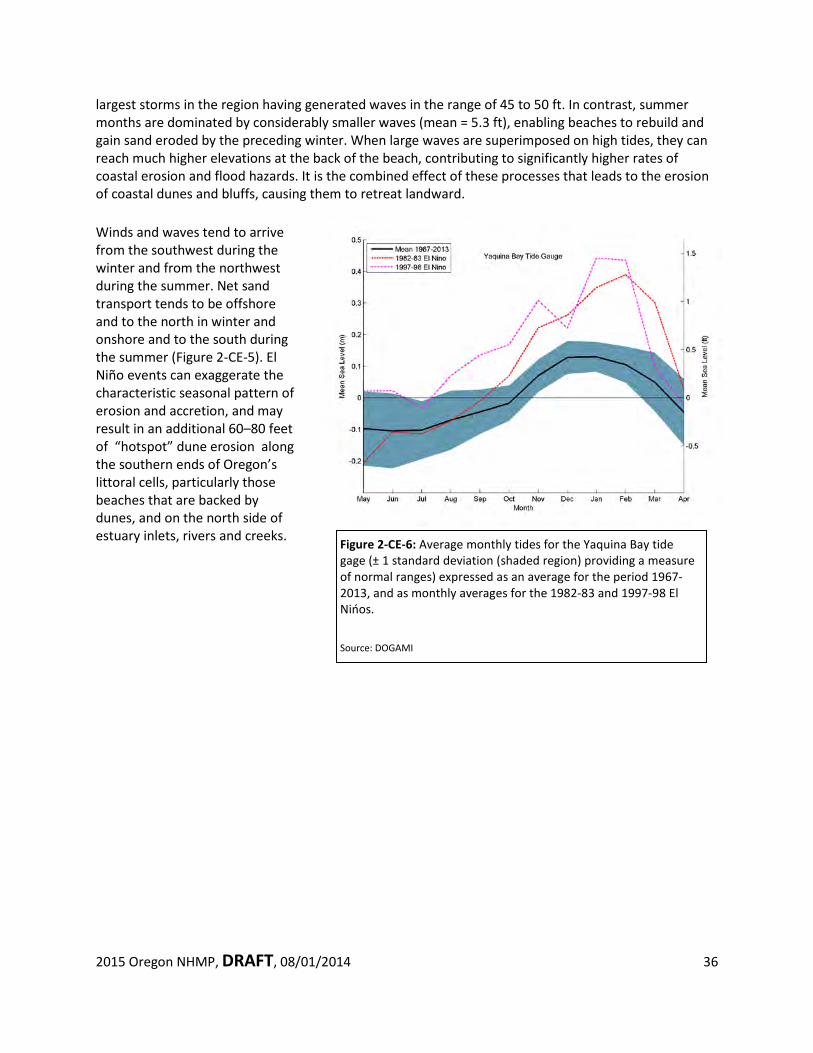
Figure 2-CE-6: Average monthly tides for the Yaquina Bay tide gage (± 1 standard deviation (shaded region) providing a measure of normal ranges) expressed as an average for the period 1967-2013, and as monthly averages for the 1982-83 and 1997-98 El Nińos.
Source: DOGAMI
largest storms in the region having generated waves in the range of 45 to 50 ft. In contrast, summer months are dominated by considerably smaller waves (mean = 5.3 ft), enabling beaches to rebuild and gain sand eroded by the preceding winter. When large waves are superimposed on high tides, they can reach much higher elevations at the back of the beach, contributing to significantly higher rates of coastal erosion and flood hazards. It is the combined effect of these processes that leads to the erosion of coastal dunes and bluffs, causing them to retreat landward. Winds and waves tend to arrive from the southwest during the winter and from the northwest during the summer. Net sand transport tends to be offshore and to the north in winter and onshore and to the south during the summer (Figure 2-CE-5). El Niño events can exaggerate the characteristic seasonal pattern of erosion and accretion, and may result in an additional 60–80 feet of “hotspot” dune erosion along the southern ends of Oregon’s littoral cells, particularly those beaches that are backed by dunes, and on the north side of estuary inlets, rivers and creeks.
2015 Oregon NHMP, DRAFT, 08/01/2014 37
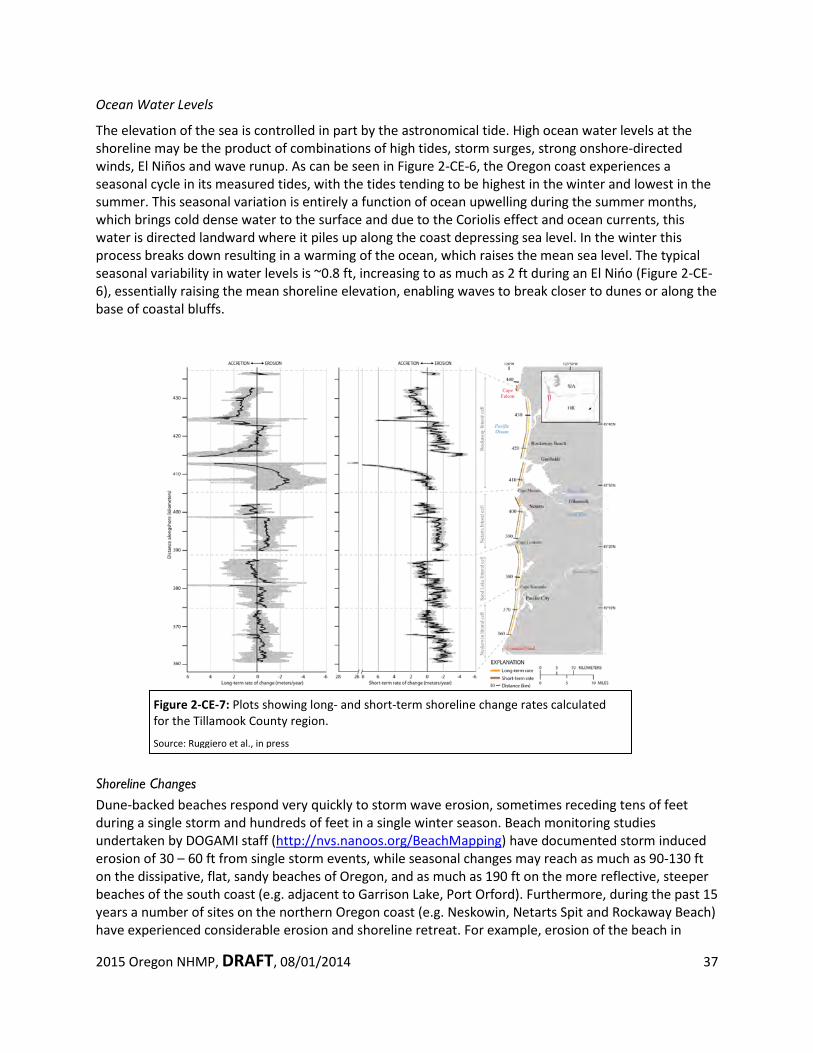
Figure 2-CE-7: Plots showing long- and short-term shoreline change rates calculated for the Tillamook County region.
Source: Ruggiero et al., in press
Ocean Water Levels
The elevation of the sea is controlled in part by the astronomical tide. High ocean water levels at the shoreline may be the product of combinations of high tides, storm surges, strong onshore-directed winds, El Niños and wave runup. As can be seen in Figure 2-CE-6, the Oregon coast experiences a seasonal cycle in its measured tides, with the tides tending to be highest in the winter and lowest in the summer. This seasonal variation is entirely a function of ocean upwelling during the summer months, which brings cold dense water to the surface and due to the Coriolis effect and ocean currents, this water is directed landward where it piles up along the coast depressing sea level. In the winter this process breaks down resulting in a warming of the ocean, which raises the mean sea level. The typical seasonal variability in water levels is ~0.8 ft, increasing to as much as 2 ft during an El Nińo (Figure 2-CE-6), essentially raising the mean shoreline elevation, enabling waves to break closer to dunes or along the base of coastal bluffs.
Shoreline Changes Dune-backed beaches respond very quickly to storm wave erosion, sometimes receding tens of feet during a single storm and hundreds of feet in a single winter season. Beach monitoring studies undertaken by DOGAMI staff (http://nvs.nanoos.org/BeachMapping) have documented storm induced erosion of 30 – 60 ft from single storm events, while seasonal changes may reach as much as 90-130 ft on the dissipative, flat, sandy beaches of Oregon, and as much as 190 ft on the more reflective, steeper beaches of the south coast (e.g. adjacent to Garrison Lake, Port Orford). Furthermore, during the past 15 years a number of sites on the northern Oregon coast (e.g. Neskowin, Netarts Spit and Rockaway Beach) have experienced considerable erosion and shoreline retreat. For example, erosion of the beach in
2015 Oregon NHMP, DRAFT, 08/01/2014 38
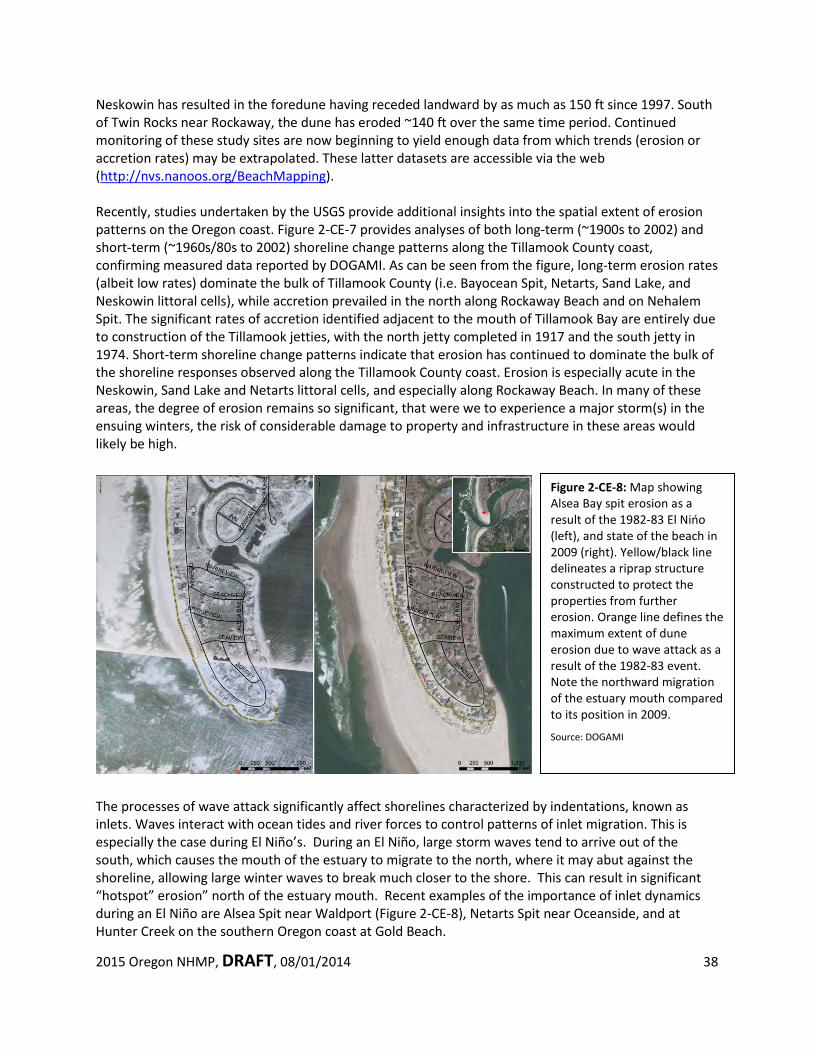
Figure 2-CE-8: Map showing Alsea Bay spit erosion as a result of the 1982-83 El Nińo (left), and state of the beach in 2009 (right). Yellow/black line delineates a riprap structure constructed to protect the properties from further erosion. Orange line defines the maximum extent of dune erosion due to wave attack as a result of the 1982-83 event. Note the northward migration of the estuary mouth compared to its position in 2009.
Source: DOGAMI
Neskowin has resulted in the foredune having receded landward by as much as 150 ft since 1997. South of Twin Rocks near Rockaway, the dune has eroded ~140 ft over the same time period. Continued monitoring of these study sites are now beginning to yield enough data from which trends (erosion or accretion rates) may be extrapolated. These latter datasets are accessible via the web (http://nvs.nanoos.org/BeachMapping). Recently, studies undertaken by the USGS provide additional insights into the spatial extent of erosion patterns on the Oregon coast. Figure 2-CE-7 provides analyses of both long-term (~1900s to 2002) and short-term (~1960s/80s to 2002) shoreline change patterns along the Tillamook County coast, confirming measured data reported by DOGAMI. As can be seen from the figure, long-term erosion rates (albeit low rates) dominate the bulk of Tillamook County (i.e. Bayocean Spit, Netarts, Sand Lake, and Neskowin littoral cells), while accretion prevailed in the north along Rockaway Beach and on Nehalem Spit. The significant rates of accretion identified adjacent to the mouth of Tillamook Bay are entirely due to construction of the Tillamook jetties, with the north jetty completed in 1917 and the south jetty in 1974. Short-term shoreline change patterns indicate that erosion has continued to dominate the bulk of the shoreline responses observed along the Tillamook County coast. Erosion is especially acute in the Neskowin, Sand Lake and Netarts littoral cells, and especially along Rockaway Beach. In many of these areas, the degree of erosion remains so significant, that were we to experience a major storm(s) in the ensuing winters, the risk of considerable damage to property and infrastructure in these areas would likely be high.
The processes of wave attack significantly affect shorelines characterized by indentations, known as inlets. Waves interact with ocean tides and river forces to control patterns of inlet migration. This is especially the case during El Niño’s. During an El Niño, large storm waves tend to arrive out of the south, which causes the mouth of the estuary to migrate to the north, where it may abut against the shoreline, allowing large winter waves to break much closer to the shore. This can result in significant “hotspot” erosion” north of the estuary mouth. Recent examples of the importance of inlet dynamics during an El Niño are Alsea Spit near Waldport (Figure 2-CE-8), Netarts Spit near Oceanside, and at Hunter Creek on the southern Oregon coast at Gold Beach.
2015 Oregon NHMP, DRAFT, 08/01/2014 39
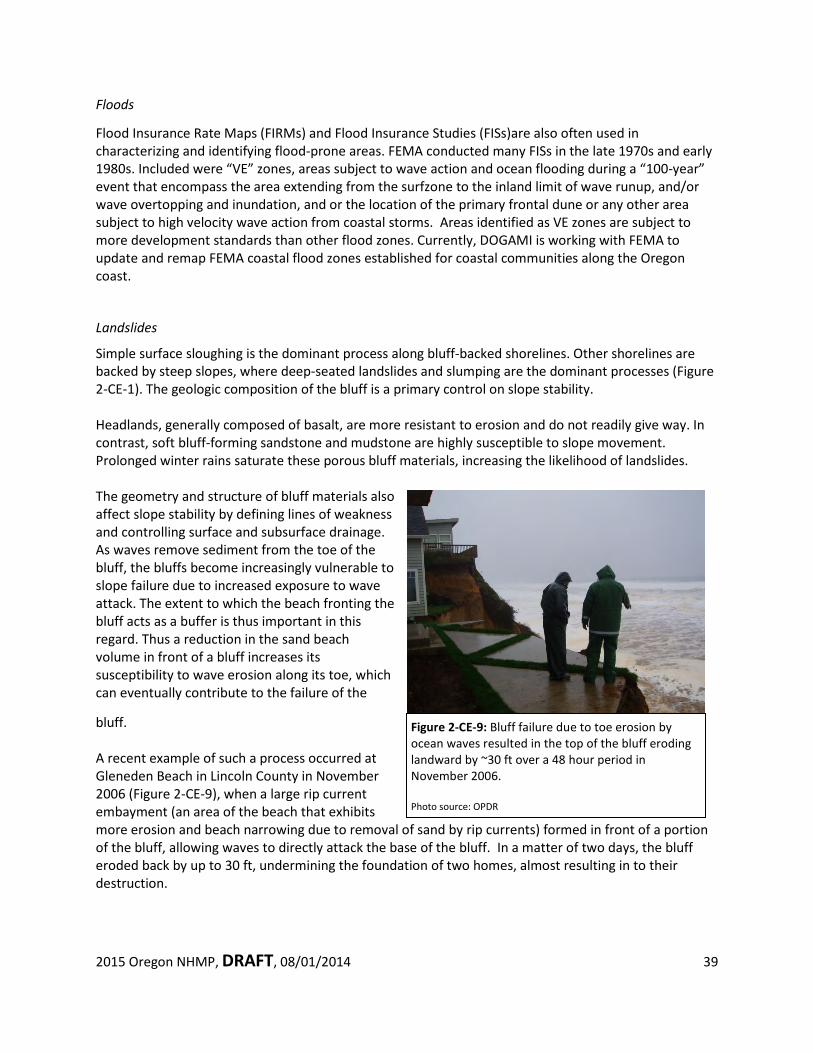
Figure 2-CE-9: Bluff failure due to toe erosion by ocean waves resulted in the top of the bluff eroding landward by ~30 ft over a 48 hour period in November 2006. Photo source: OPDR
Floods
Flood Insurance Rate Maps (FIRMs) and Flood Insurance Studies (FISs)are also often used in characterizing and identifying flood-prone areas. FEMA conducted many FISs in the late 1970s and early 1980s. Included were “VE” zones, areas subject to wave action and ocean flooding during a “100-year” event that encompass the area extending from the surfzone to the inland limit of wave runup, and/or wave overtopping and inundation, and or the location of the primary frontal dune or any other area subject to high velocity wave action from coastal storms. Areas identified as VE zones are subject to more development standards than other flood zones. Currently, DOGAMI is working with FEMA to update and remap FEMA coastal flood zones established for coastal communities along the Oregon coast.
Landslides
Simple surface sloughing is the dominant process along bluff-backed shorelines. Other shorelines are backed by steep slopes, where deep-seated landslides and slumping are the dominant processes (Figure 2-CE-1). The geologic composition of the bluff is a primary control on slope stability. Headlands, generally composed of basalt, are more resistant to erosion and do not readily give way. In contrast, soft bluff-forming sandstone and mudstone are highly susceptible to slope movement. Prolonged winter rains saturate these porous bluff materials, increasing the likelihood of landslides. The geometry and structure of bluff materials also affect slope stability by defining lines of weakness and controlling surface and subsurface drainage. As waves remove sediment from the toe of the bluff, the bluffs become increasingly vulnerable to slope failure due to increased exposure to wave attack. The extent to which the beach fronting the bluff acts as a buffer is thus important in this regard. Thus a reduction in the sand beach volume in front of a bluff increases its susceptibility to wave erosion along its toe, which can eventually contribute to the failure of the
bluff. A recent example of such a process occurred at Gleneden Beach in Lincoln County in November 2006 (Figure 2-CE-9), when a large rip current embayment (an area of the beach that exhibits more erosion and beach narrowing due to removal of sand by rip currents) formed in front of a portion of the bluff, allowing waves to directly attack the base of the bluff. In a matter of two days, the bluff eroded back by up to 30 ft, undermining the foundation of two homes, almost resulting in to their destruction.
2015 Oregon NHMP, DRAFT, 08/01/2014 40
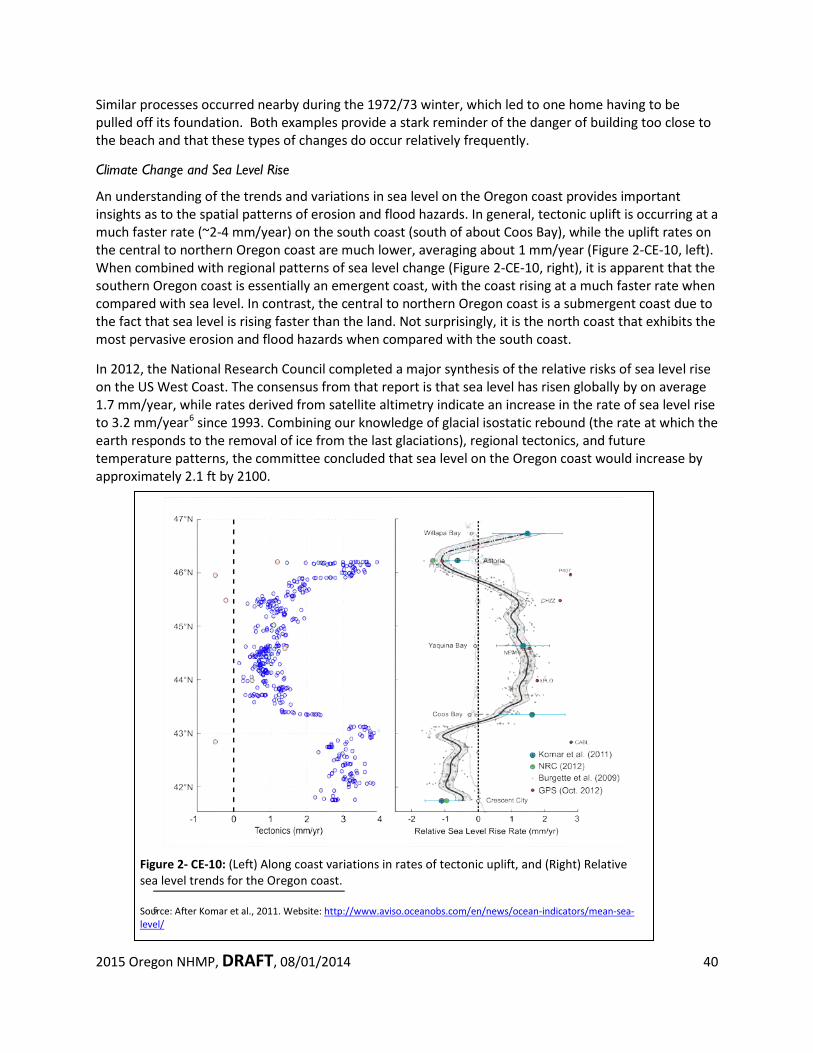
Figure 2- CE-10: (Left) Along coast variations in rates of tectonic uplift, and (Right) Relative sea level trends for the Oregon coast. Source: After Komar et al., 2011. Website: http://www.aviso.oceanobs.com/en/news/ocean-indicators/mean-sea-level/
Similar processes occurred nearby during the 1972/73 winter, which led to one home having to be pulled off its foundation. Both examples provide a stark reminder of the danger of building too close to the beach and that these types of changes do occur relatively frequently.
Climate Change and Sea Level Rise
An understanding of the trends and variations in sea level on the Oregon coast provides important insights as to the spatial patterns of erosion and flood hazards. In general, tectonic uplift is occurring at a much faster rate (~2-4 mm/year) on the south coast (south of about Coos Bay), while the uplift rates on the central to northern Oregon coast are much lower, averaging about 1 mm/year (Figure 2-CE-10, left). When combined with regional patterns of sea level change (Figure 2-CE-10, right), it is apparent that the southern Oregon coast is essentially an emergent coast, with the coast rising at a much faster rate when compared with sea level. In contrast, the central to northern Oregon coast is a submergent coast due to the fact that sea level is rising faster than the land. Not surprisingly, it is the north coast that exhibits the most pervasive erosion and flood hazards when compared with the south coast.
In 2012, the National Research Council completed a major synthesis of the relative risks of sea level rise on the US West Coast. The consensus from that report is that sea level has risen globally by on average 1.7 mm/year, while rates derived from satellite altimetry indicate an increase in the rate of sea level rise to 3.2 mm/year6 since 1993. Combining our knowledge of glacial isostatic rebound (the rate at which the earth responds to the removal of ice from the last glaciations), regional tectonics, and future temperature patterns, the committee concluded that sea level on the Oregon coast would increase by approximately 2.1 ft by 2100.
6
2015 Oregon NHMP, DRAFT, 08/01/2014 41
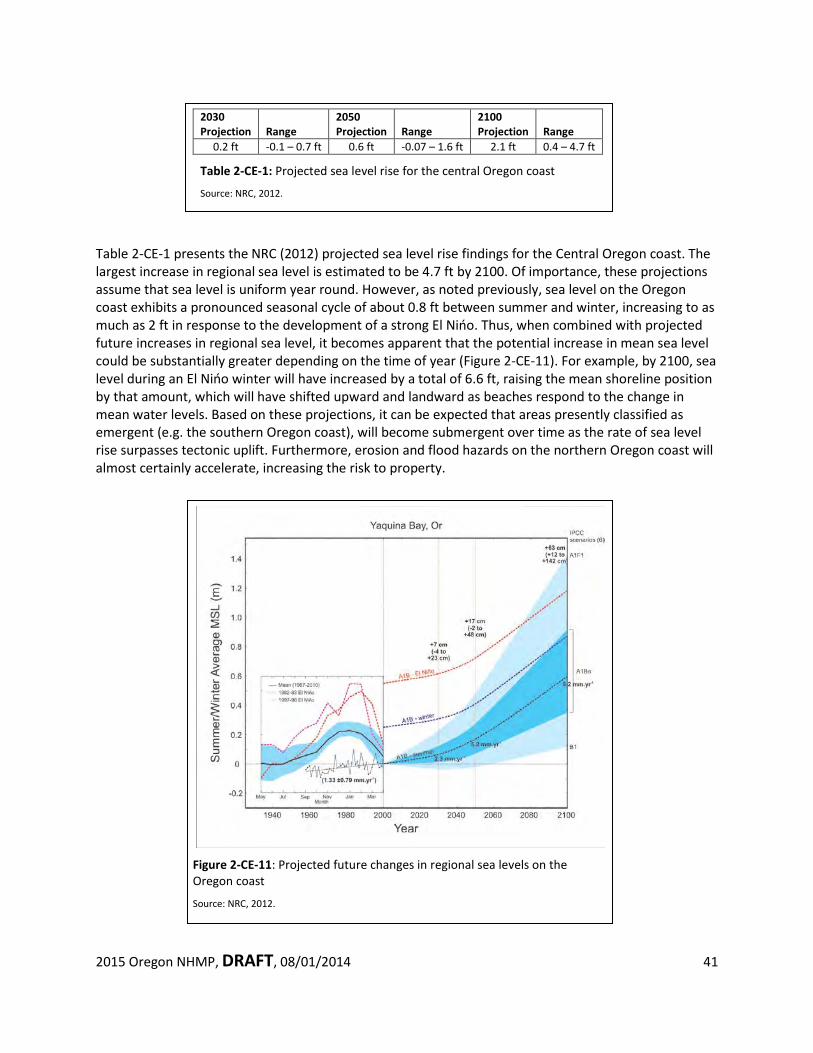
Figure 2-CE-11: Projected future changes in regional sea levels on the Oregon coast
Source: NRC, 2012.
2030 Projection
Range
2050 Projection
Range
2100 Projection
Range
0.2 ft -0.1 – 0.7 ft 0.6 ft -0.07 – 1.6 ft 2.1 ft 0.4 – 4.7 ft
Table 2-CE-1: Projected sea level rise for the central Oregon coast
Source: NRC, 2012.
Table 2-CE-1 presents the NRC (2012) projected sea level rise findings for the Central Oregon coast. The largest increase in regional sea level is estimated to be 4.7 ft by 2100. Of importance, these projections assume that sea level is uniform year round. However, as noted previously, sea level on the Oregon coast exhibits a pronounced seasonal cycle of about 0.8 ft between summer and winter, increasing to as much as 2 ft in response to the development of a strong El Nińo. Thus, when combined with projected future increases in regional sea level, it becomes apparent that the potential increase in mean sea level could be substantially greater depending on the time of year (Figure 2-CE-11). For example, by 2100, sea level during an El Nińo winter will have increased by a total of 6.6 ft, raising the mean shoreline position by that amount, which will have shifted upward and landward as beaches respond to the change in mean water levels. Based on these projections, it can be expected that areas presently classified as emergent (e.g. the southern Oregon coast), will become submergent over time as the rate of sea level rise surpasses tectonic uplift. Furthermore, erosion and flood hazards on the northern Oregon coast will almost certainly accelerate, increasing the risk to property.
2015 Oregon NHMP, DRAFT, 08/01/2014 42
Human Activities
Human activities affect the stability of all types of shoreline. Large-scale human activities such as jetty construction and maintenance dredging have a long-term effect on large geographic areas. This is particularly true along dune-backed and inlet-affected shorelines such as the Columbia River and Rockaway littoral cells (Figure 2-CE-3). The planting of European beachgrass (Ammophila arenaria) since the early 1900s, and more recently American beachgrass (Ammophila breviligulata) has locked up sand in the form of high dunes. Such a process can contribute to a net loss in the beach sand budget and may help drive coastal erosion. Residential and commercial development can affect shoreline stability over shorter time periods and smaller geographic areas. Activities such as grading and excavation, surface and subsurface drainage alterations, vegetation removal, and vegetative as well as structural shoreline stabilization can all affect shoreline stability. While site-specific coastal engineering efforts such as the construction of riprap revetments is less likely to cause direct adverse impacts to the beach, the cumulative effect of constructing many of these structures along a particular shore (e.g. as has occurred along the communities of Gleneden Beach, Siletz Spit, Lincoln City, Neskowin, Pacific City, and Rockaway) will almost certainly decrease the volume of sediment being supplied to the beach system, potentially affecting the beach sediment budget and hence the stability of beaches within those littoral cells. Heavy recreational use in the form of pedestrian and vehicular traffic can affect shoreline stability over shorter time frames and smaller spaces. Because these activities may result in the loss of fragile vegetative cover, they are a particular concern along dune-backed shorelines. Graffiti carving along bluff-backed shorelines is another byproduct of recreational use that can damage fragile shoreline stability.
2015 Oregon NHMP, DRAFT, 08/01/2014 43
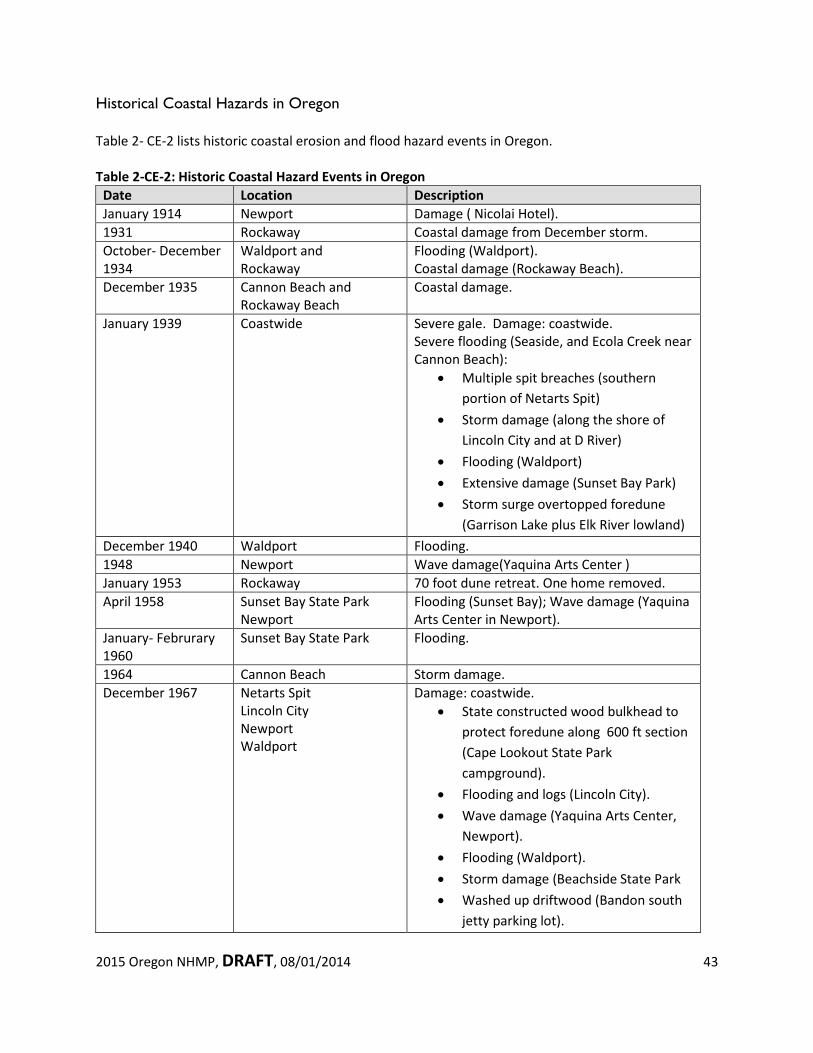
Historical Coastal Hazards in Oregon Table 2- CE-2 lists historic coastal erosion and flood hazard events in Oregon. Table 2-CE-2: Historic Coastal Hazard Events in Oregon
Date Location Description January 1914 Newport Damage ( Nicolai Hotel). 1931 Rockaway Coastal damage from December storm. October- December 1934
Waldport and Rockaway
Flooding (Waldport). Coastal damage (Rockaway Beach).
December 1935 Cannon Beach and Rockaway Beach
Coastal damage.
January 1939 Coastwide Severe gale. Damage: coastwide. Severe flooding (Seaside, and Ecola Creek near Cannon Beach):
• Multiple spit breaches (southern portion of Netarts Spit)
• Storm damage (along the shore of Lincoln City and at D River)
• Flooding (Waldport) • Extensive damage (Sunset Bay Park) • Storm surge overtopped foredune
(Garrison Lake plus Elk River lowland) December 1940 Waldport Flooding. 1948 Newport Wave damage(Yaquina Arts Center ) January 1953 Rockaway 70 foot dune retreat. One home removed. April 1958 Sunset Bay State Park
Newport Flooding (Sunset Bay); Wave damage (Yaquina Arts Center in Newport).
January- Februrary 1960
Sunset Bay State Park Flooding.
1964 Cannon Beach Storm damage. December 1967 Netarts Spit
Lincoln City Newport Waldport
Damage: coastwide. • State constructed wood bulkhead to
protect foredune along 600 ft section (Cape Lookout State Park campground).
• Flooding and logs (Lincoln City). • Wave damage (Yaquina Arts Center,
Newport). • Flooding (Waldport). • Storm damage (Beachside State Park • Washed up driftwood (Bandon south
jetty parking lot).
2015 Oregon NHMP, DRAFT, 08/01/2014 44
Date Location Description 1971-73 Siletz Spit • High tide line eroded landward by 300
ft. • February 1973, one home completely
destroyed. Spit almost breached. • Logs through Sea Gypsy Motel (Nov.
1973). 1982-83 Alsea Spit Northward migration of Alsea Bay mouth.
Severe erosion. 1997-98 Lincoln and Tillamook
Counties El Nino winter (second strongest on record). Erosion: considerable.
1999 Coastwide Five storms between January and March. Coastal erosion: extensive, including:
• Significant erosion (Neskowin, Netarts Spit, Oceanside, Rockaway beach);
• Overtopping and flooding (Cape Meares)
• Significant erosion along barrier beach (Garrison Lake); overtopping 27ft high barrier.
December 2007 Tillamook and Clatsop Counties
Wind storm.
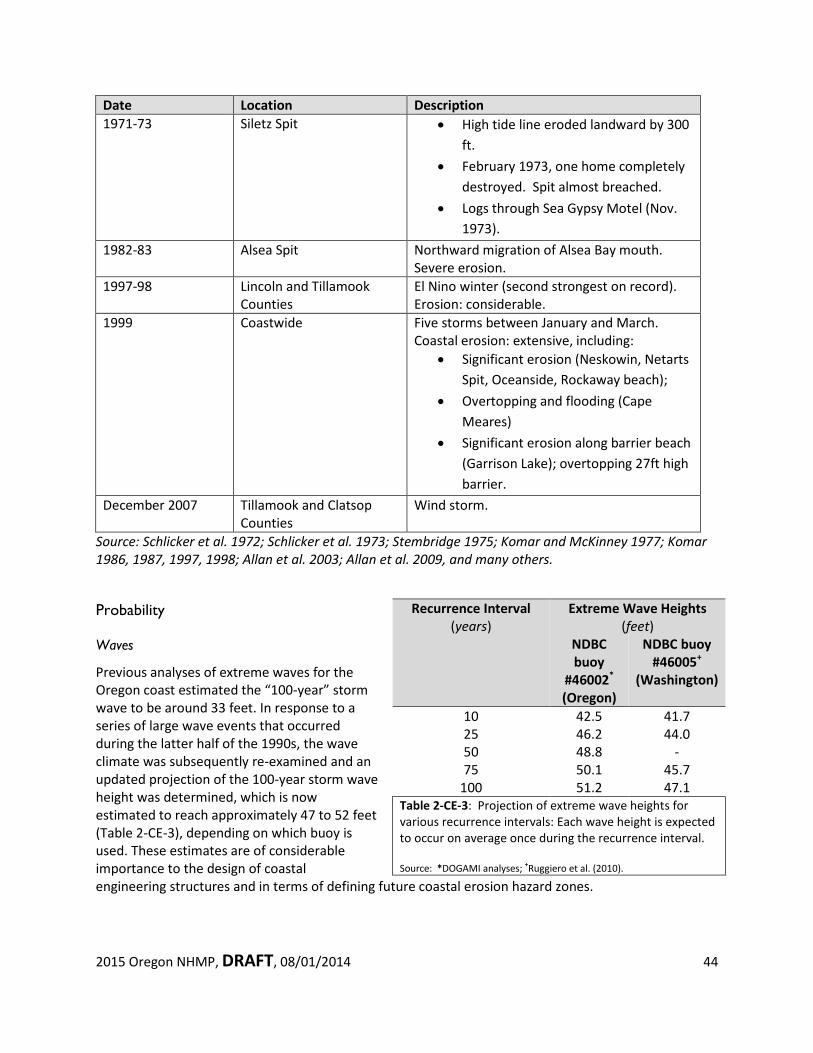
Source: Schlicker et al. 1972; Schlicker et al. 1973; Stembridge 1975; Komar and McKinney 1977; Komar 1986, 1987, 1997, 1998; Allan et al. 2003; Allan et al. 2009, and many others. Probability Waves
Previous analyses of extreme waves for the Oregon coast estimated the “100-year” storm wave to be around 33 feet. In response to a series of large wave events that occurred during the latter half of the 1990s, the wave climate was subsequently re-examined and an updated projection of the 100-year storm wave height was determined, which is now estimated to reach approximately 47 to 52 feet (Table 2-CE-3), depending on which buoy is used. These estimates are of considerable importance to the design of coastal engineering structures and in terms of defining future coastal erosion hazard zones.
Recurrence Interval (years)
Extreme Wave Heights (feet)
NDBC buoy
#46002* (Oregon)
NDBC buoy #46005+
(Washington)
10 42.5 41.7 25 46.2 44.0 50 48.8 - 75 50.1 45.7
100 51.2 47.1 Table 2-CE-3: Projection of extreme wave heights for various recurrence intervals: Each wave height is expected to occur on average once during the recurrence interval.
Source: *DOGAMI analyses; +Ruggiero et al. (2010).
2015 Oregon NHMP, DRAFT, 08/01/2014 45
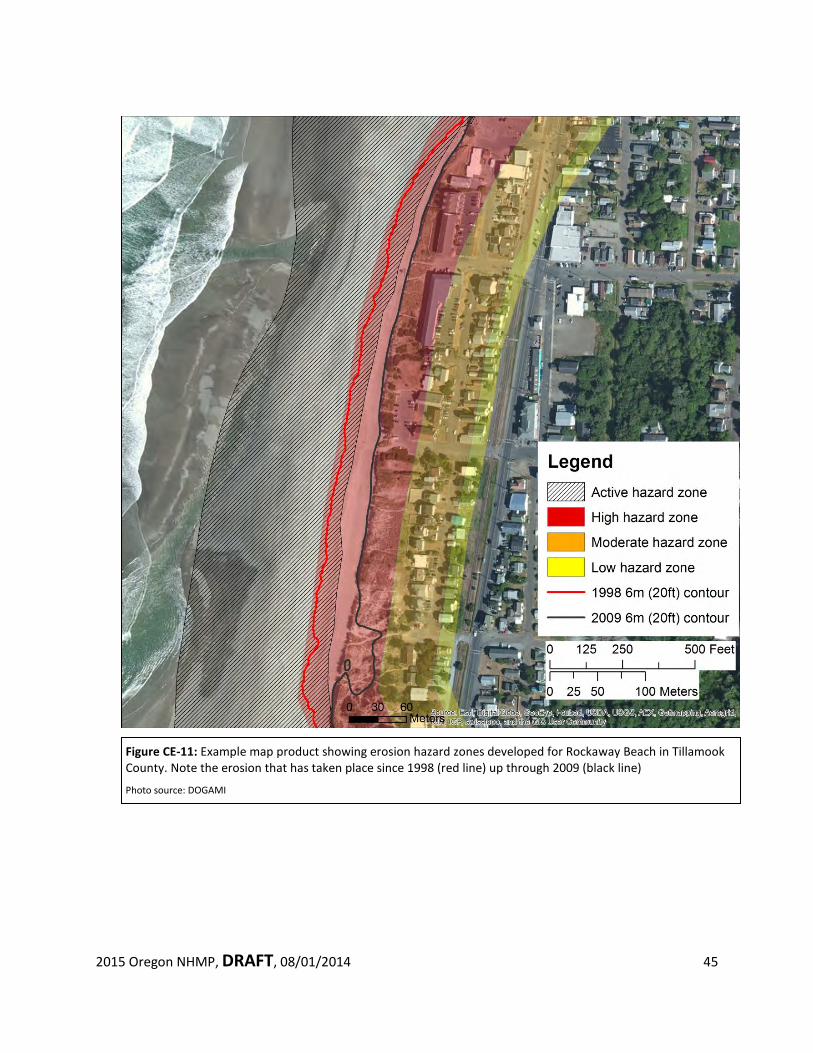
Figure CE-11: Example map product showing erosion hazard zones developed for Rockaway Beach in Tillamook County. Note the erosion that has taken place since 1998 (red line) up through 2009 (black line)
Photo source: DOGAMI
2015 Oregon NHMP, DRAFT, 08/01/2014 46
Coastal Erosion Hazard Zones For the purposes of providing erosion hazard information for the Oregon coast, DOGAMI has completed coastal erosion hazard maps for Lincoln, Tillamook and Clatsop Counties, as well in the Nesikka Beach area in Curry County. Maps were completed for these areas mainly because these areas contain the largest concentration of people living along the coastal strip, and in the case of Nesika Beach in response to a specific request by the Department of Land Conservation and Development agency. In all cases, the maps depict erosion hazard zones that fall into four categories (Figure CE-11):
1. Active Hazard Zone (AHZ): For dune-backed shorelines, the AHZ encompasses the active beach
to the top of the first vegetated foredune, and includes those areas subject to large morphological changes adjacent to the mouths of the bays due to inlet migration. On bluff-backed shorelines the AHZ includes actively eroding coastal bluff escarpments and active or potentially active coastal landslides.
2. High Hazard Zones (HHZ): This scenario is based on a large storm wave event (wave heights
~47.6 ft high) occurring over the cycle of an above average high tide, coincident with a 3.3 ft storm surge. The wave heights associated with this scenario have an expected recurrence interval of 50-60 years or a 2% chance in any given year.
3. Moderate Hazard Zones (MHZ): This scenario is based on an extremely severe storm event
(waves ~52.5 ft high) and may or may not encompass a long-term rise in sea level (depends on the coastal region). As with the HHZ, the wave event occurs over the cycle of an above average high tide, coincident with a 5.6 ft storm surge. The wave heights associated with this scenario have an expected recurrence interval of 100 years or a 1% chance in any given year.
4. Low Hazard Zones (LHZ): This scenario is analogous to the MHZ scenario described previously,
with the addition of a 3.3 ft coseismic subsidence of the coast.
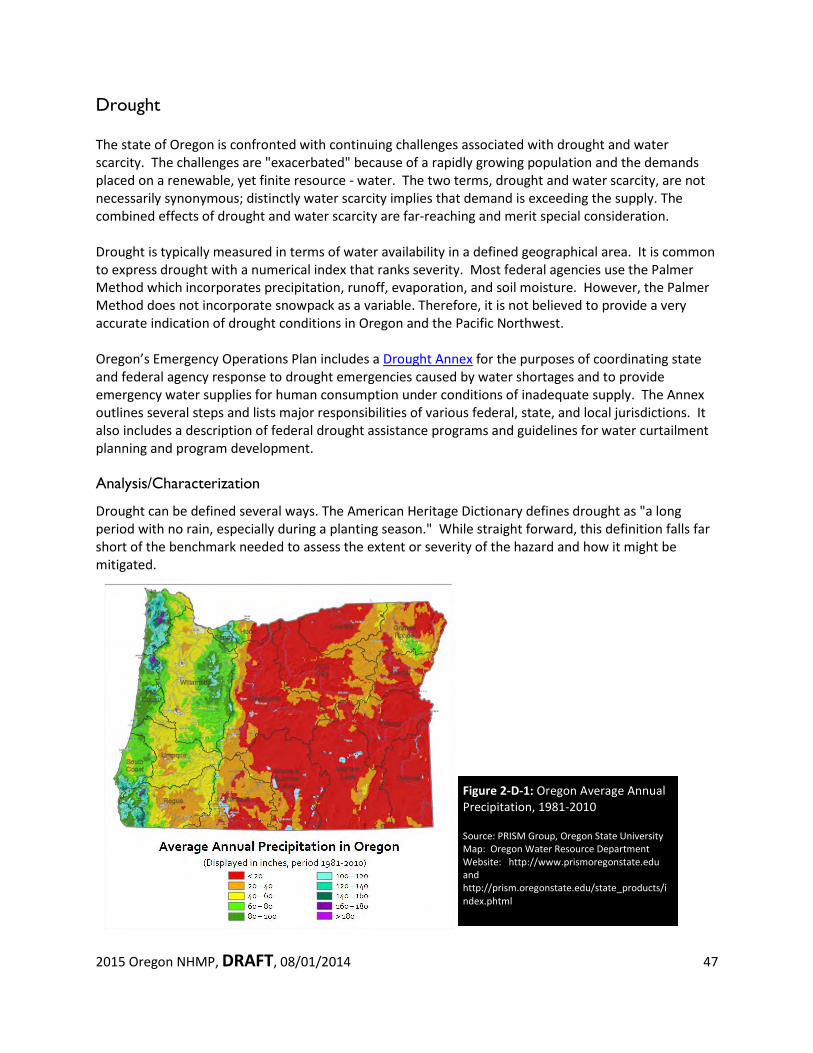
2015 Oregon NHMP, DRAFT, 08/01/2014 47
Drought The state of Oregon is confronted with continuing challenges associated with drought and water scarcity. The challenges are "exacerbated" because of a rapidly growing population and the demands placed on a renewable, yet finite resource - water. The two terms, drought and water scarcity, are not necessarily synonymous; distinctly water scarcity implies that demand is exceeding the supply. The combined effects of drought and water scarcity are far-reaching and merit special consideration. Drought is typically measured in terms of water availability in a defined geographical area. It is common to express drought with a numerical index that ranks severity. Most federal agencies use the Palmer Method which incorporates precipitation, runoff, evaporation, and soil moisture. However, the Palmer Method does not incorporate snowpack as a variable. Therefore, it is not believed to provide a very accurate indication of drought conditions in Oregon and the Pacific Northwest. Oregon’s Emergency Operations Plan includes a Drought Annex for the purposes of coordinating state and federal agency response to drought emergencies caused by water shortages and to provide emergency water supplies for human consumption under conditions of inadequate supply. The Annex outlines several steps and lists major responsibilities of various federal, state, and local jurisdictions. It also includes a description of federal drought assistance programs and guidelines for water curtailment planning and program development. Analysis/Characterization
Drought can be defined several ways. The American Heritage Dictionary defines drought as "a long period with no rain, especially during a planting season." While straight forward, this definition falls far short of the benchmark needed to assess the extent or severity of the hazard and how it might be mitigated.
Figure 2-D-1: Oregon Average Annual Precipitation, 1981-2010 Source: PRISM Group, Oregon State University Map: Oregon Water Resource Department Website: http://www.prismoregonstate.edu and http://prism.oregonstate.edu/state_products/index.phtml
2015 Oregon NHMP, DRAFT, 08/01/2014 48
In the early 1980's, researchers with the National Drought Mitigation Center and the National Center for Atmospheric Research located more than 150 published definitions of drought. There clearly was a need to categorize the hazard by "type of drought.” The following definitions are a response to that need: Meteorological or climatological droughts usually are defined in terms of the departure from a normal precipitation pattern and the duration of the event. Drought is a slow-onset phenomenon that usually takes at least three months to develop and may last for several seasons or years. Agricultural droughts link the various characteristics of meteorological drought to agricultural impacts. The focus is on precipitation shortages and soil-water deficits. Agricultural drought is largely the result of a deficit of soil moisture. A plant's demand for water is dependent on prevailing weather conditions, biological characteristics of the specific plant, its stage of growth, and the physical and biological properties of the soil.
Hydrological droughts refer to deficiencies in surface water and sub-surface water supplies. It is measured as stream flow, and as lake, reservoir, and ground water levels. Hydrological measurements are not the earliest indicators of drought. When precipitation is reduced or deficient over an extended period of time, the shortage will be reflected in declining surface and sub-surface water levels.
Socioeconomic droughts occur when physical water shortage begins to affect people, individually and collectively. Most socioeconomic definitions of drought associate it with supply, demand, and economic good. One could argue that a physical water shortage with no socio-economic impacts is a policy success.
History of Droughts in Oregon
Oregon records, dating back to the late 1800s, clearly associate drought with a departure from expected rainfall. Concern for mountain snowpack, which feeds the streams and rivers, came later. Some Oregon droughts were especially significant during the period of 1928-1994.2 The period from 1928 to 1941 was a prolonged drought that caused major problems for agriculture. The only area spared was the northern coast, which received abundant rains in 1930-33. The three Tillamook burns (1933, 1939, and 1945) were the most significant results of this very dry period. During 1959-1962 stream flows were low throughout eastern Oregon, but areas west of the Cascades had few problems. Ironically, the driest period in western Oregon was the summer following the benchmark 1964 flood. Low streamflows prevailed in western Oregon during the period from 1976-81, but the worst year, by far, was 1976-77, the single driest year of the century. The Portland Airport received only 7.19 inches of precipitation between October 1976 and February 1977, only 31 percent of the average 23.16 inches for that period. The 1985-94 drought was not as severe as the 1976-77 drought in any single year, but the cumulative effect of ten consecutive years with mostly dry conditions caused statewide problems. The peak year of the drought was 1992, when a drought emergency was declared for all Oregon counties. Forests throughout the state suffered from a lack of moisture. Fires were common and insect pests, which attacked the trees, flourished.
In 2001 and 2002, Oregon experienced drought conditions, affecting 6 out of 8 regions. During the 2005 drought, the Governor issued declarations for thirteen counties, all east of the Cascades, and the USDA issued three drought declarations, overlapping two of the Governor’s. State declarations were made for Baker, Wallowa, Wheeler, Crook, Deschutes, Klamath, Lake, Hood River, Wasco, Sherman, Gilliam, Morrow, and Umatilla counties. Federal declarations were made in Coos, Klamath, and Umatilla
2015 Oregon NHMP, DRAFT, 08/01/2014 49
counties. Federal drought declarations by the USDA provide accessibility to emergency loans for crop losses. Since 2001, the Governor has declared a drought every year, with the exception of 2006, 2009, and 2011, in at least one Oregon county. Most of these declarations have involved one or more counties in Regions 5-8.
Impacts
Droughts are not just a summer-time phenomenon; winter droughts can have a profound impact on the state's agricultural sector, particularly east of the Cascade Mountains. Also, below average snowfall in Oregon's higher elevations has a far-reaching effect on the entire state, especially in terms of hydroelectric power generation, irrigation, recreation, and industrial uses. In March of 2014, Mt. Ashland Ski Resort in Southern Oregon announced that it would be unable to open due to the lack of snow7. The lack of snow has affected other regions of the state. In the Klamath Basin, the Natural Resources Conservation Service reports that the mountains are generally snow-free below 5000 feet. The Taylor Butte SNOTEL site at elevation 5030 feet was snow-free on March 1, 2014 for the first time since it was installed in 1979. Five long-term snow measurement sites in the Klamath basin set new record lows for March 1 snowpack. The lack of snow and precipitation during the winter months led Governor Kitzhaber to declare a drought for 4 Oregon counties – Klamath, Lake, Harney, and Malheur – in February 2014. As of March 18, 2014, the U.S. Drought Monitor reports that nearly half of Oregon is experiencing a severe drought (Figure 2-D-2).
7 http://www.oregonlive.com/travel/index.ssf/2014/03/mount_ashland_gearing_up_to_ce.html
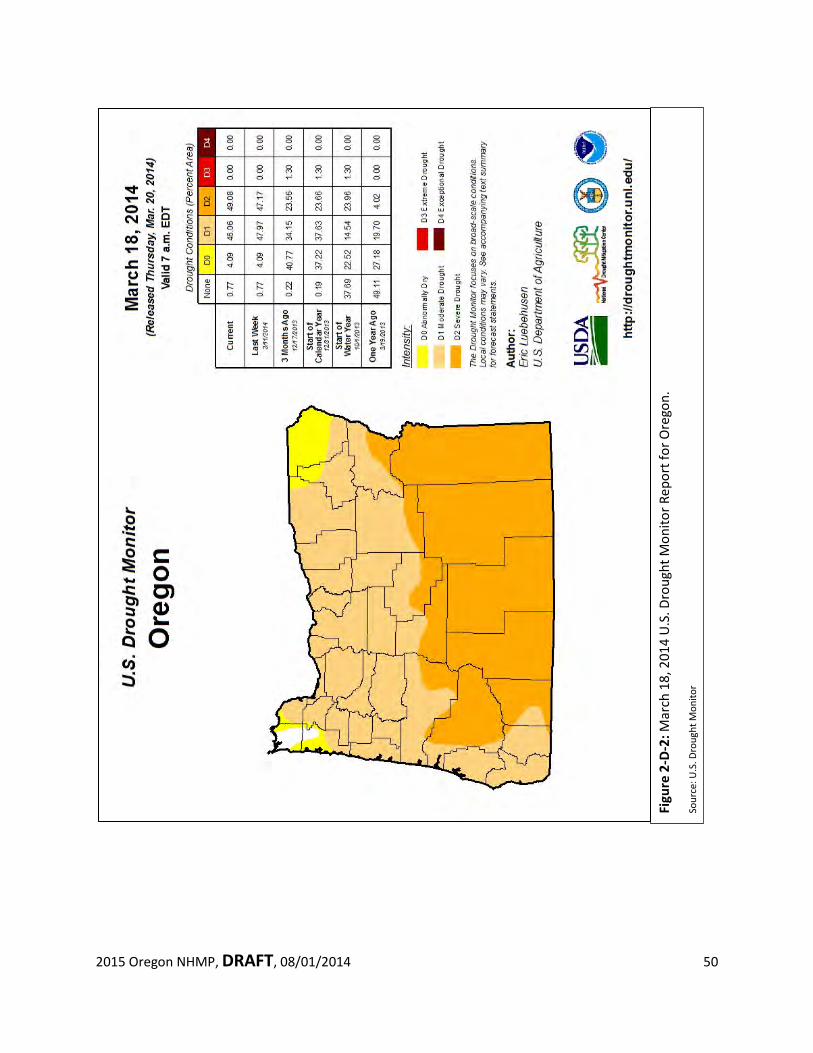
2015 Oregon NHMP, DRAFT, 08/01/2014 50
Figu
re 2
-D-2
: Mar
ch 1
8, 2
014
U.S
. Dro
ught
Mon
itor R
epor
t for
Ore
gon.
So
urce
: U.S
. Dro
ught
Mon
itor
2015 Oregon NHMP, DRAFT, 08/01/2014 51
There also are environmental consequences. A prolonged drought in Oregon's forests promotes an increase of insect pests, which in turn, damage trees already weakened by a lack of water. In the Willamette Valley, for example, there has been an unusual pattern of tree mortality involving Douglas-fir, grand fir, and western red cedar. Water stress brought on by drought and other factors is the central cause in these mortality events. A moisture-deficient forest constitutes a significant fire hazard (see the Wildfire section of this Plan, pg. xx). In addition, drought and water scarcity add another dimension of stress to imperiled species. The following information addresses the impact of a severe or prolonged drought on the population, infrastructure, facilities, the economy, and environment of Oregon: Population: Drought can affect all segments of Oregon's population, particularly those employed in water-dependent activities (e.g., agriculture, hydroelectric generation, recreation, etc.). Also, domestic water-users may be subject to stringent conservation measures (e.g., rationing) and could be faced with significant increases in electricity rates. Infrastructure: Infrastructure such as highways, bridges, energy conveyance systems, etc., are typically unaffected by drought; however drought can cause structural damage. 5 An example would include areas of severe soil shrinkage. In these uncommon situations, soil shrinkage would affect the foundation upon which the infrastructure was built. In addition, water-borne transportation systems (e.g., ferries, barges, etc.) could be impacted by periods of low water. Critical/Essential Facilities: Facilities affected by drought conditions include communications facilities, hospitals, and correctional facilities that are subject to power failures. Storage systems for potable water, sewage treatment facilities, water storage for firefighting, and hydroelectric generating plants also are vulnerable. Low water also means reduced hydroelectric production especially as the habitat benefits of water compete with other beneficial uses. State Owned or Operated Facilities: There are a variety of state owned or operated facilities that could be affected by a prolonged drought. The most obvious include schools, universities, office buildings, health-care facilities, etc. Power outages always are a concern. Maintenance activities (e.g., grounds, parks, etc.) may be curtailed during periods of drought. Economy: Drought has an impact on a variety of economic sectors. These include water-dependent activities and economic activities requiring significant amounts of hydroelectric power. The agricultural sector is especially vulnerable as are some recreation-based economies (e.g., boating, fishing, water or snow skiing). Whole communities can be affected. This was particularly evident during 2001 water year when many Oregon counties sought relief through state and federal drought assistance programs.
5 Some clay soils (e.g., containing bentonite) have significant shrink-swell properties. Prolonged drought can shrink these soils resulting in structural damage. Although these soils occur in Oregon, their geographical extent is limited.
2015 Oregon NHMP, DRAFT, 08/01/2014 52
The years 2000 and 2001 were the second driest years in Oregon's climate history. Marion County's recreation community of Detroit suffered economic hardships when adjacent reservoir levels became too low to support normal summer activities. In addition, the drought directly affected over 200,000 irrigated acres in the Klamath River Basin. Farmers were among the first to be affected, followed by local agricultural support industries (e.g., pesticides, fertilizer, farm equipment, etc.), as well as Native American Tribes which depend on local fisheries. There were also endangered species considerations. Environment: Oregon has several fish species listed as threatened or endangered under the Endangered Species Act (ESA). Some of these species have habitat requirements that jeopardized by the needs or desires of the human environment. For example, in times of scarcity, the amount of water necessary to maintain certain fish species may conflict with the needs of consumptives uses of water. . The state of Oregon is committed to implementation of the ESA and the viability of a productive economic base. There are no easy solutions, only continuous work to resolve difficult drought situations.
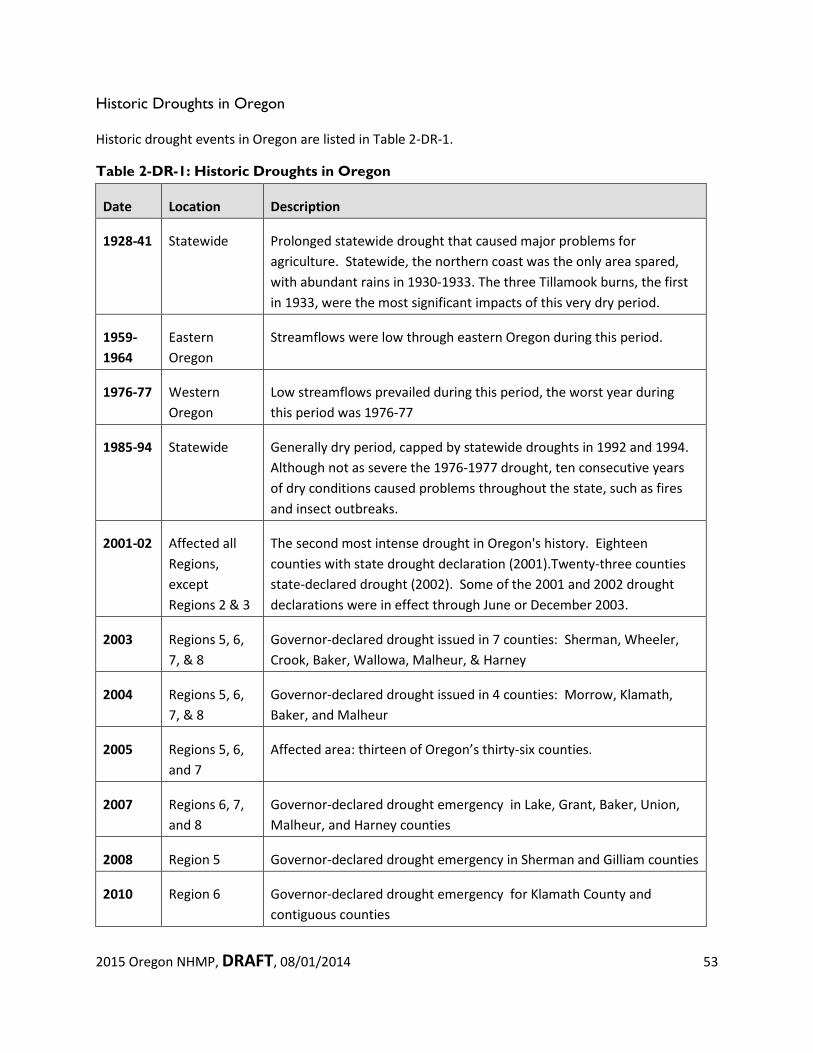
2015 Oregon NHMP, DRAFT, 08/01/2014 53
Historic Droughts in Oregon
Historic drought events in Oregon are listed in Table 2-DR-1.
Table 2-DR-1: Historic Droughts in Oregon
Date Location Description
1928-41 Statewide Prolonged statewide drought that caused major problems for agriculture. Statewide, the northern coast was the only area spared, with abundant rains in 1930-1933. The three Tillamook burns, the first in 1933, were the most significant impacts of this very dry period.
1959-1964
Eastern Oregon
Streamflows were low through eastern Oregon during this period.
1976-77 Western Oregon
Low streamflows prevailed during this period, the worst year during this period was 1976-77
1985-94 Statewide Generally dry period, capped by statewide droughts in 1992 and 1994. Although not as severe the 1976-1977 drought, ten consecutive years of dry conditions caused problems throughout the state, such as fires and insect outbreaks.
2001-02 Affected all Regions, except Regions 2 & 3
The second most intense drought in Oregon's history. Eighteen counties with state drought declaration (2001).Twenty-three counties state-declared drought (2002). Some of the 2001 and 2002 drought declarations were in effect through June or December 2003.
2003 Regions 5, 6, 7, & 8
Governor-declared drought issued in 7 counties: Sherman, Wheeler, Crook, Baker, Wallowa, Malheur, & Harney
2004 Regions 5, 6, 7, & 8
Governor-declared drought issued in 4 counties: Morrow, Klamath, Baker, and Malheur
2005 Regions 5, 6, and 7
Affected area: thirteen of Oregon’s thirty-six counties.
2007 Regions 6, 7, and 8
Governor-declared drought emergency in Lake, Grant, Baker, Union, Malheur, and Harney counties
2008 Region 5 Governor-declared drought emergency in Sherman and Gilliam counties
2010 Region 6 Governor-declared drought emergency for Klamath County and contiguous counties
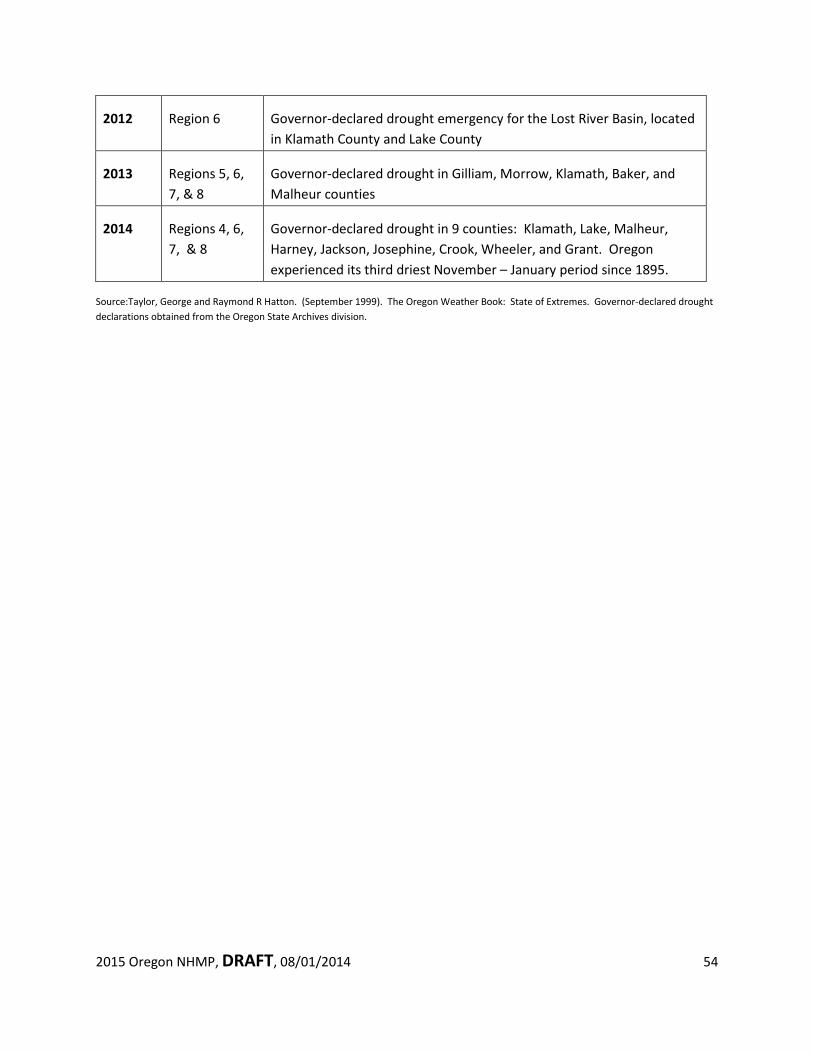
2015 Oregon NHMP, DRAFT, 08/01/2014 54
2012 Region 6 Governor-declared drought emergency for the Lost River Basin, located in Klamath County and Lake County
2013 Regions 5, 6, 7, & 8
Governor-declared drought in Gilliam, Morrow, Klamath, Baker, and Malheur counties
2014 Regions 4, 6, 7, & 8
Governor-declared drought in 9 counties: Klamath, Lake, Malheur, Harney, Jackson, Josephine, Crook, Wheeler, and Grant. Oregon experienced its third driest November – January period since 1895.
Source:Taylor, George and Raymond R Hatton. (September 1999). The Oregon Weather Book: State of Extremes. Governor-declared drought declarations obtained from the Oregon State Archives division.
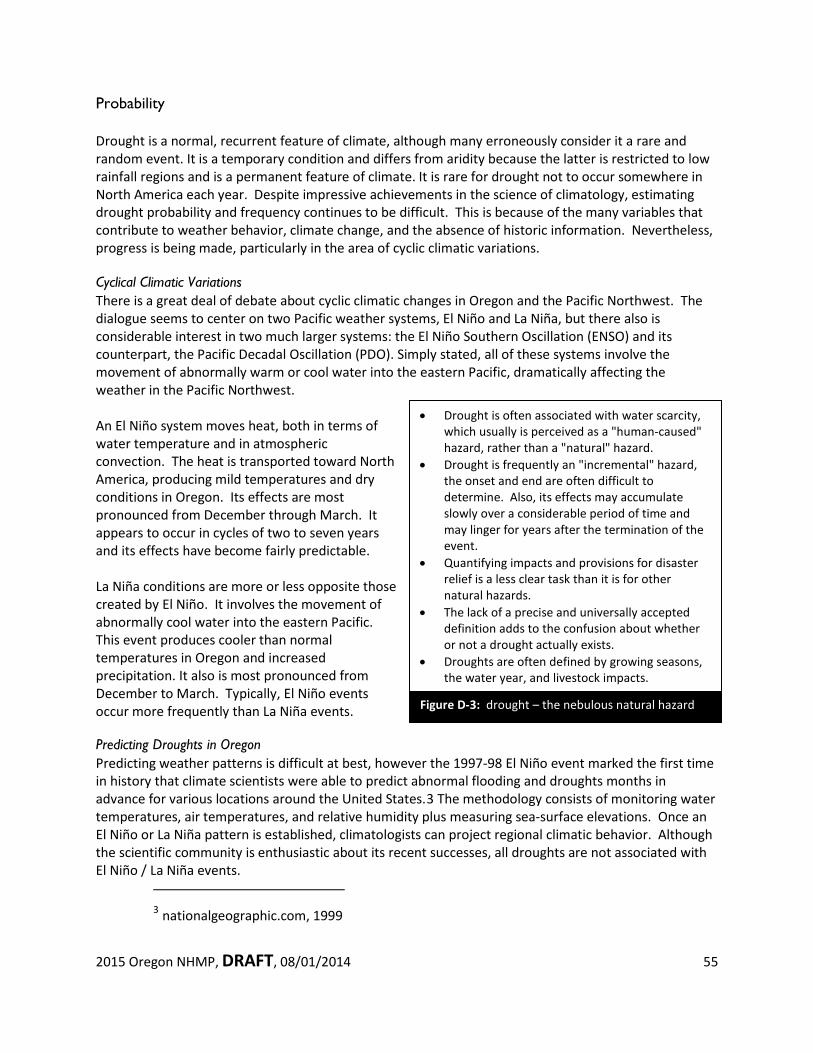
2015 Oregon NHMP, DRAFT, 08/01/2014 55
Probability Drought is a normal, recurrent feature of climate, although many erroneously consider it a rare and random event. It is a temporary condition and differs from aridity because the latter is restricted to low rainfall regions and is a permanent feature of climate. It is rare for drought not to occur somewhere in North America each year. Despite impressive achievements in the science of climatology, estimating drought probability and frequency continues to be difficult. This is because of the many variables that contribute to weather behavior, climate change, and the absence of historic information. Nevertheless, progress is being made, particularly in the area of cyclic climatic variations. Cyclical Climatic Variations There is a great deal of debate about cyclic climatic changes in Oregon and the Pacific Northwest. The dialogue seems to center on two Pacific weather systems, El Niño and La Niña, but there also is considerable interest in two much larger systems: the El Niño Southern Oscillation (ENSO) and its counterpart, the Pacific Decadal Oscillation (PDO). Simply stated, all of these systems involve the movement of abnormally warm or cool water into the eastern Pacific, dramatically affecting the weather in the Pacific Northwest. An El Niño system moves heat, both in terms of water temperature and in atmospheric convection. The heat is transported toward North America, producing mild temperatures and dry conditions in Oregon. Its effects are most pronounced from December through March. It appears to occur in cycles of two to seven years and its effects have become fairly predictable. La Niña conditions are more or less opposite those created by El Niño. It involves the movement of abnormally cool water into the eastern Pacific. This event produces cooler than normal temperatures in Oregon and increased precipitation. It also is most pronounced from December to March. Typically, El Niño events occur more frequently than La Niña events. Predicting Droughts in Oregon Predicting weather patterns is difficult at best, however the 1997-98 El Niño event marked the first time in history that climate scientists were able to predict abnormal flooding and droughts months in advance for various locations around the United States.3 The methodology consists of monitoring water temperatures, air temperatures, and relative humidity plus measuring sea-surface elevations. Once an El Niño or La Niña pattern is established, climatologists can project regional climatic behavior. Although the scientific community is enthusiastic about its recent successes, all droughts are not associated with El Niño / La Niña events.
3 nationalgeographic.com, 1999
• Drought is often associated with water scarcity, which usually is perceived as a "human-caused" hazard, rather than a "natural" hazard.
• Drought is frequently an "incremental" hazard, the onset and end are often difficult to determine. Also, its effects may accumulate slowly over a considerable period of time and may linger for years after the termination of the event.
• Quantifying impacts and provisions for disaster relief is a less clear task than it is for other natural hazards.
• The lack of a precise and universally accepted definition adds to the confusion about whether or not a drought actually exists.
• Droughts are often defined by growing seasons, the water year, and livestock impacts.
Figure D-3: drought – the nebulous natural hazard
2015 Oregon NHMP, DRAFT, 08/01/2014 56
Dust Storms
A dust storm is a strong, violent wind that carries fine particles such as silt, sand, clay, and other materials, often for long distances. The fine particles swirl around in the air during the storm. A dust storm can spread over hundreds of miles and rise over 10,000 feet. They have wind speeds of at least 25 miles per hour. Dust storms usually arrive with little warning and advance in the form of a big wall of dust and debris. The dust is blinding, making driving safely a challenge. A dust storm may last only a few minutes at any given location, but often leave serious car accidents in their wake, occasionally massive pileups.
Dust storms occur most frequently over deserts and regions of dry soil, where particles are loosely bound to the surface. Dust storms don't just happen in the middle of the desert, however. They happen in any dry area where loose dirt can easily be picked up by wind. Grains of sand, lofted into the air by the wind, fall back to the ground within a few hours, but smaller particles remain suspended in the air for a week or more and can be swept thousands of kilometers downwind. Dust from the Sahara desert regularly crosses the Atlantic, causing bright red sunrises and sunsets in Florida, traveling as far as the Caribbean and the Amazon Basin.8 Airborne dust particles, or dust aerosols, alter the climate by intercepting sunlight intended for the surface. By shading the earth from the sun's radiation, dust aerosols have the same effect as a rain cloud. While solar radiation is reduced beneath the dust cloud, the absorption of sunlight by dust particles heats the cloud itself. Approximately half of the dust in today's atmosphere may result from changes to the environment caused by human activity, including agriculture, overgrazing, and the cutting of forests. Data from dust traps near urban areas like Las Vegas show that the spread of housing and other human construction across the desert directly causes increases in dust storms by destabilizing the surface and vegetation.
Analysis and Characterization
Intensive tillage of soils in agricultural uses is also a significant condition releasing soil to make it easily transportable by high winds. Depending on the crop and region involved, tillage may be occurring in the spring and/or in the autumn. Research in north-central Oregon and south-central Washington indicates that region's dust problem isn't simply a matter of soil being redistributed from one field to another by the wind. Fine particulate becomes suspended in the air and may travel thousands of miles. Scientists indicate that the region is truly losing soil.
8 Some of the preceding material is from http://www.kidzworld.com/site/p707.htm#
Think dusts storms aren’t a serious natural hazard? Over the past 40 years in Oregon, more than ten people have been killed and more than 60 injured – some very seriously – due to automobile accidents caused by dust storms, often exacerbated by excessive speed.
2015 Oregon NHMP, DRAFT, 08/01/2014 57
“In September of 1999, after a long dry summer, a farmer was plowing his wheat fields in Eastern Oregon on a blue-sky day. A freak wind whipped up and dust covered the roadway. Instantly, everything went black. Later, they found dead people in cars with the cruise controls still set as high as 75 miles an hour. One person involved in the accident tried to go back to warn others. He waved at them, but the passing drivers just waved back... The last sight the young man had of one trucker was the trucker driving full bore into the dust storm, both hands off the wheel as he waved at the young man.” (April Henry from Learning to Fly) During this September 25, 1999 dust storm, high winds blowing dust set off a chain-reaction of crashes that killed eight people and injured more than twenty. In all, more than forty vehicles crashed in separate pileups in both freeway directions between Hermiston and Pendleton. Parts of Interstate 84 were blocked from mid-morning until nearly midnight.
Huge dust clouds set off by 50 mile per hour winds, dry soil, recent planting of nearby wheat fields and harvesting of potato fields created extremely hazardous driving conditions that fateful morning. However, an Oregon State Police (OSP) report on the dust storm didn’t blame the weather. It reported that driving too fast for conditions was the primary cause of the pileups.
The report indicated that neither OSP nor ODOT had enough warning time to close the freeway before the chain reaction crashes started. Five minutes after OSP noticed that visibility on the freeway was rapidly getting worse, the accidents started.
Community Solutions Team meetings held in early 2000 determined that focusing on the Natural Resources Conservation Service, and Soil and Water Conservation District practices shown on pages xx will help reduce the volume of materials available to be whipped-up in dust storms.
These meetings also resulted in initiatives to increase detection and warning time. These allow OSP and ODOT to temporarily close certain highways, as well as better inform and advise the traveling public.
Several other ideas were examined for possible implementation along the I-84 corridor. Most were determined to be either ineffective or impractical for solving the problems of dust storms that occasionally occur in the area.
Derived from the reports developed by a Community Solutions Team and Oregon State Police after the September 25, 1999 Umatilla County dust storm
2015 Oregon NHMP, DRAFT, 08/01/2014 58
Air quality is adversely affected by windblown dust. Oregon’s Department of Environmental Quality (DEQ) has developed a rule concerning air pollution caused by particulates from volcanic ashfall or windblown dust. Excerpts from that rule are shown in Appendix XX.
Although many people are aware of the negative effects of dust storms such as vehicle crashes on highways, erosion of topsoil, dust in electronic equipment and aircraft engines, and poor air quality, a less obvious but important effect of dust storms and volcanic ashfall is not widely known: dust and ash deposited on the ground surface in new locations is eventually carried down into the soil by rain, providing important nutrients for plants in those locations.
“We called the weather service about 9:30 saying that visibility was getting bad… I could see the dust coming in a big cloud from the southwest. There’s too much tillage to the west and southwest of us. You get a wind event like we had and that soil is loose, powdery and lifting, and I don’t think you can stop it… Farming by its very nature, particularly in this country on these soils, at some time is going to involve tillage, and when it does… you’re going to have exposure to winds… have wind and exposed soil, you’re going to have dust.”
Pendleton area farmer and member of the Oregon Wheat Growers League, talking about the September 25, 1999 event
“(Farmers) say this is a problem the Columbia Basin, composed of mostly sandy soils, has experienced every spring before the rapid farm development that has followed circle irrigation… Luther Fitch, county extension agent in Hermiston… facetiously said Wednesday’s winds ‘probably sent a foot of topsoil back to Montana… undoubtedly there will be considerable need to replant spring wheat and potatoes. Fertilizer will have moved on and needs to be reapplied.’ ” East Oregonian, Steve Clark, Friday, March 26, 1976, p.1
“…dust from freshly plowed fields hung heavy over much of Oregon last night as a windstorm of gale proportions continued unabated. One death and several injuries were attributed to the storm… Political storms abated for the moment, Salem lay yesterday under a pall of Eastern Oregon dust, which the oldest old-timers said was unique in the city’s history. A swirling northeast wind drove tons of Eastern Oregon dust before it, down the Columbia Gorge and into Western Oregon. Diverting down the Willamette River at Portland, the dust clouds reached the valley early Wednesday morning and shrouded the entire country… Lights went on in schools, homes, and business houses as though the day was mid-winter… Old-timers in Salem scratched their heads yesterday and tried to recall a parallel in storm history for the dust invasion… but no precedent for the gale of dirt could be recalled. ‘I recall a terrific storm in January 1880,’ said A.N. Moores. ‘However, it was a wind storm alone and there was no dirt accompanying it’… (Mill City) was surprised Tuesday evening when a heavy bank of clouds filled with dust began to work its way over the mountains and shut off the view of the surrounding hills by its denseness.”
Oregon Statesman, Thursday, April 23, 1931, pp.1-2
2015 Oregon NHMP, DRAFT, 08/01/2014 59
During June 2004, a group of residents of Summer Lake, known as Friends of Summer Lake, asked the state to divert to the lake a third of the water that currently feeds a wildlife sanctuary and irrigates pastures, contending that these uses make the lake dry-up sooner and more often. Another factor in the lake drying-up, however, is increased development in and around the basin, which has reduced the underground aquifer, decreasing the flow of springs.
Rainfall in the area, mostly during winter, averages 12 inches per year, but evaporation in the high desert - where summer temperatures can climb to 105 degrees - averages 40 to 50 inches per year.
Darrell Seven, who owns Summer Lake Inn with his wife, Jean Sage, said wind whipping over the dry lakebed causes alkali dust storms. "It's hard to breathe, it's irritating and it makes you sick," said Seven, who has been in the valley for 30 years. "I lose customers all the time who say they just can't handle it."
Alan Withers, president of the Summer Lake Irrigation District said, however, "This lake isn't very pretty, and we get a lot of dust down here. It's nature's way.”
Based on an Associated Press article
Competition for scarce water can affect the location and frequency of dust storms.
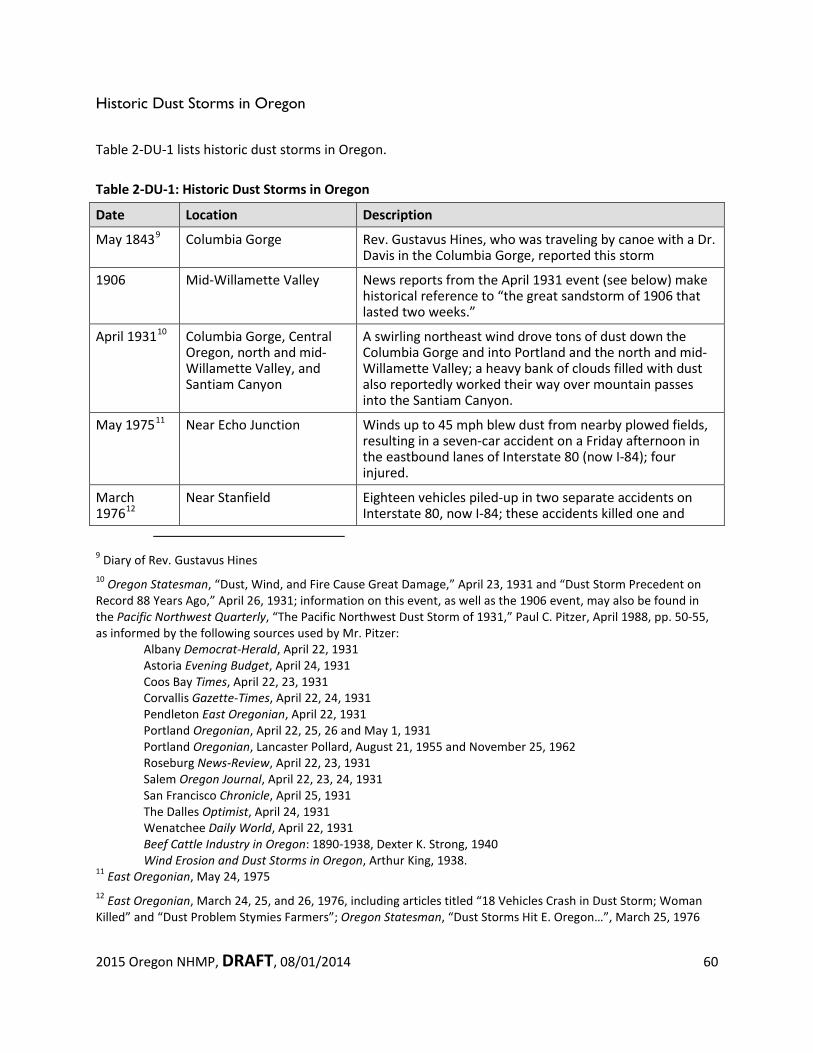
2015 Oregon NHMP, DRAFT, 08/01/2014 60
Historic Dust Storms in Oregon Table 2-DU-1 lists historic dust storms in Oregon. Table 2-DU-1: Historic Dust Storms in Oregon
Date Location Description
May 18439 Columbia Gorge Rev. Gustavus Hines, who was traveling by canoe with a Dr. Davis in the Columbia Gorge, reported this storm
1906 Mid-Willamette Valley News reports from the April 1931 event (see below) make historical reference to “the great sandstorm of 1906 that lasted two weeks.”
April 193110 Columbia Gorge, Central Oregon, north and mid-Willamette Valley, and Santiam Canyon
A swirling northeast wind drove tons of dust down the Columbia Gorge and into Portland and the north and mid-Willamette Valley; a heavy bank of clouds filled with dust also reportedly worked their way over mountain passes into the Santiam Canyon.
May 197511 Near Echo Junction Winds up to 45 mph blew dust from nearby plowed fields, resulting in a seven-car accident on a Friday afternoon in the eastbound lanes of Interstate 80 (now I-84); four injured.
March 197612
Near Stanfield Eighteen vehicles piled-up in two separate accidents on Interstate 80, now I-84; these accidents killed one and
9 Diary of Rev. Gustavus Hines 10 Oregon Statesman, “Dust, Wind, and Fire Cause Great Damage,” April 23, 1931 and “Dust Storm Precedent on Record 88 Years Ago,” April 26, 1931; information on this event, as well as the 1906 event, may also be found in the Pacific Northwest Quarterly, “The Pacific Northwest Dust Storm of 1931,” Paul C. Pitzer, April 1988, pp. 50-55, as informed by the following sources used by Mr. Pitzer: Albany Democrat-Herald, April 22, 1931 Astoria Evening Budget, April 24, 1931 Coos Bay Times, April 22, 23, 1931 Corvallis Gazette-Times, April 22, 24, 1931 Pendleton East Oregonian, April 22, 1931 Portland Oregonian, April 22, 25, 26 and May 1, 1931 Portland Oregonian, Lancaster Pollard, August 21, 1955 and November 25, 1962 Roseburg News-Review, April 22, 23, 1931 Salem Oregon Journal, April 22, 23, 24, 1931 San Francisco Chronicle, April 25, 1931 The Dalles Optimist, April 24, 1931 Wenatchee Daily World, April 22, 1931 Beef Cattle Industry in Oregon: 1890-1938, Dexter K. Strong, 1940 Wind Erosion and Dust Storms in Oregon, Arthur King, 1938. 11 East Oregonian, May 24, 1975 12 East Oregonian, March 24, 25, and 26, 1976, including articles titled “18 Vehicles Crash in Dust Storm; Woman Killed” and “Dust Problem Stymies Farmers”; Oregon Statesman, “Dust Storms Hit E. Oregon…”, March 25, 1976
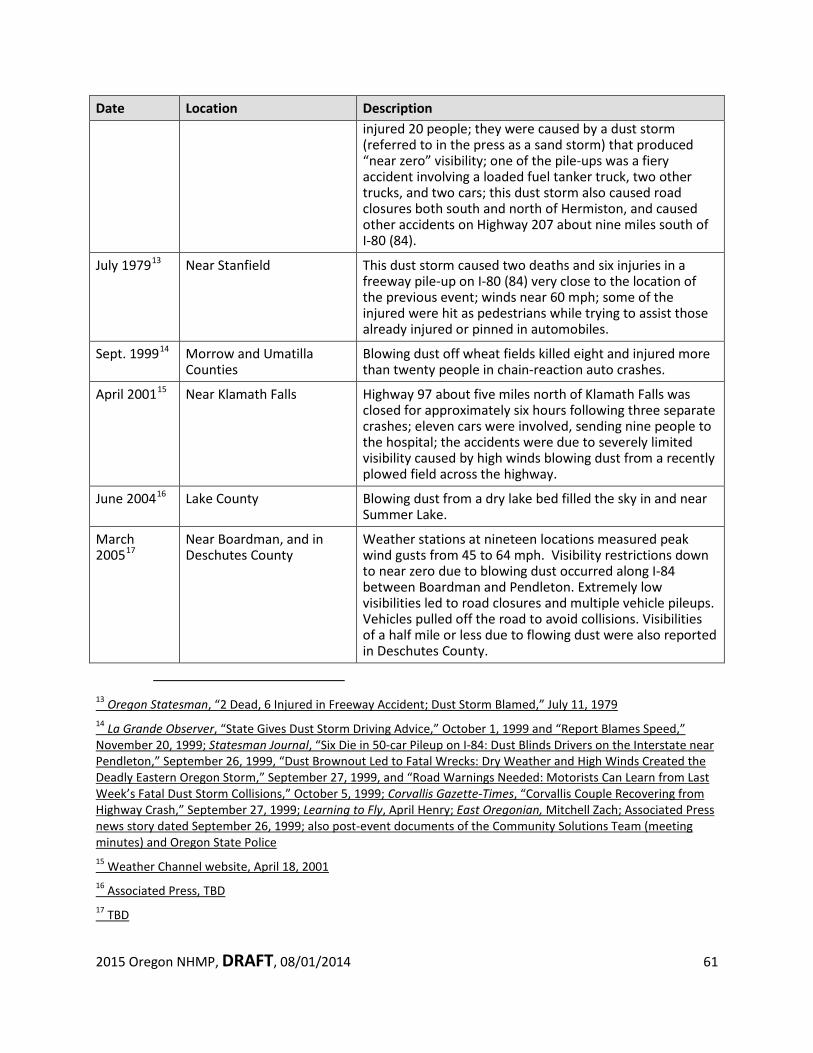
2015 Oregon NHMP, DRAFT, 08/01/2014 61
Date Location Description injured 20 people; they were caused by a dust storm (referred to in the press as a sand storm) that produced “near zero” visibility; one of the pile-ups was a fiery accident involving a loaded fuel tanker truck, two other trucks, and two cars; this dust storm also caused road closures both south and north of Hermiston, and caused other accidents on Highway 207 about nine miles south of I-80 (84).
July 197913 Near Stanfield This dust storm caused two deaths and six injuries in a freeway pile-up on I-80 (84) very close to the location of the previous event; winds near 60 mph; some of the injured were hit as pedestrians while trying to assist those already injured or pinned in automobiles.
Sept. 199914 Morrow and Umatilla Counties
Blowing dust off wheat fields killed eight and injured more than twenty people in chain-reaction auto crashes.
April 200115 Near Klamath Falls Highway 97 about five miles north of Klamath Falls was closed for approximately six hours following three separate crashes; eleven cars were involved, sending nine people to the hospital; the accidents were due to severely limited visibility caused by high winds blowing dust from a recently plowed field across the highway.
June 200416 Lake County Blowing dust from a dry lake bed filled the sky in and near Summer Lake.
March 200517
Near Boardman, and in Deschutes County
Weather stations at nineteen locations measured peak wind gusts from 45 to 64 mph. Visibility restrictions down to near zero due to blowing dust occurred along I-84 between Boardman and Pendleton. Extremely low visibilities led to road closures and multiple vehicle pileups. Vehicles pulled off the road to avoid collisions. Visibilities of a half mile or less due to flowing dust were also reported in Deschutes County.
13 Oregon Statesman, “2 Dead, 6 Injured in Freeway Accident; Dust Storm Blamed,” July 11, 1979 14 La Grande Observer, “State Gives Dust Storm Driving Advice,” October 1, 1999 and “Report Blames Speed,” November 20, 1999; Statesman Journal, “Six Die in 50-car Pileup on I-84: Dust Blinds Drivers on the Interstate near Pendleton,” September 26, 1999, “Dust Brownout Led to Fatal Wrecks: Dry Weather and High Winds Created the Deadly Eastern Oregon Storm,” September 27, 1999, and “Road Warnings Needed: Motorists Can Learn from Last Week’s Fatal Dust Storm Collisions,” October 5, 1999; Corvallis Gazette-Times, “Corvallis Couple Recovering from Highway Crash,” September 27, 1999; Learning to Fly, April Henry; East Oregonian, Mitchell Zach; Associated Press news story dated September 26, 1999; also post-event documents of the Community Solutions Team (meeting minutes) and Oregon State Police 15 Weather Channel website, April 18, 2001 16 Associated Press, TBD 17 TBD
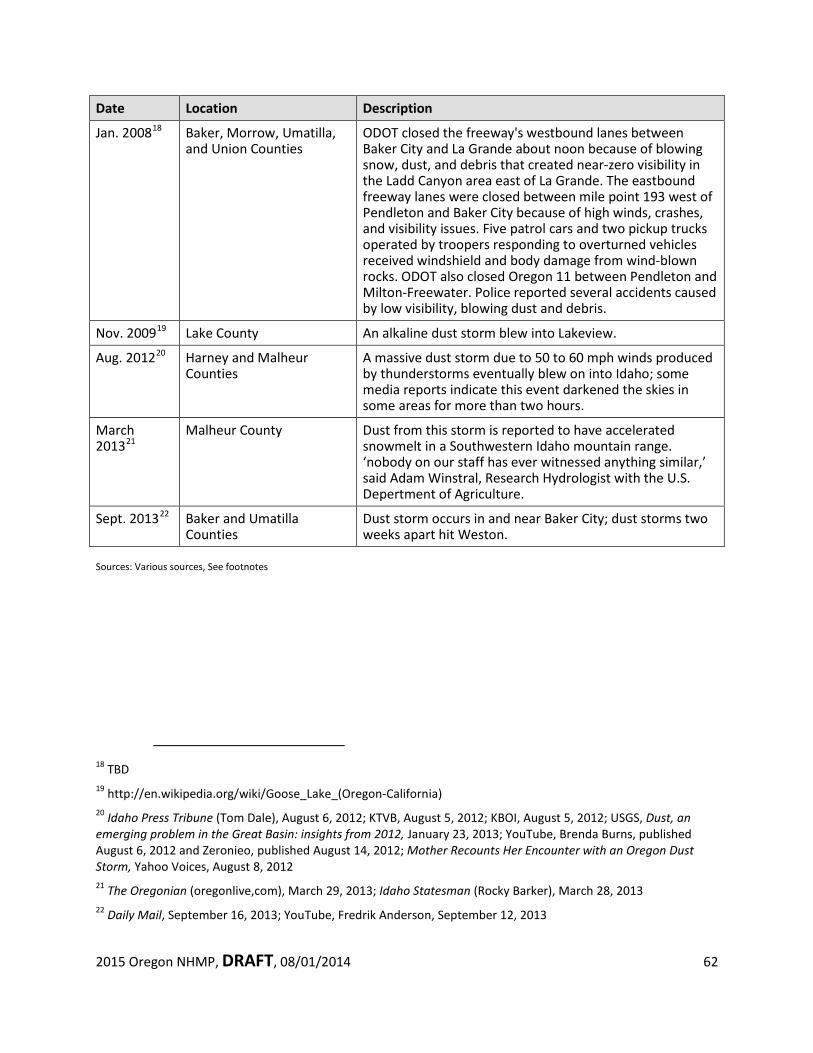
2015 Oregon NHMP, DRAFT, 08/01/2014 62
Date Location Description
Jan. 200818 Baker, Morrow, Umatilla, and Union Counties
ODOT closed the freeway's westbound lanes between Baker City and La Grande about noon because of blowing snow, dust, and debris that created near-zero visibility in the Ladd Canyon area east of La Grande. The eastbound freeway lanes were closed between mile point 193 west of Pendleton and Baker City because of high winds, crashes, and visibility issues. Five patrol cars and two pickup trucks operated by troopers responding to overturned vehicles received windshield and body damage from wind-blown rocks. ODOT also closed Oregon 11 between Pendleton and Milton-Freewater. Police reported several accidents caused by low visibility, blowing dust and debris.
Nov. 200919 Lake County An alkaline dust storm blew into Lakeview.
Aug. 201220 Harney and Malheur Counties
A massive dust storm due to 50 to 60 mph winds produced by thunderstorms eventually blew on into Idaho; some media reports indicate this event darkened the skies in some areas for more than two hours.
March 201321
Malheur County Dust from this storm is reported to have accelerated snowmelt in a Southwestern Idaho mountain range. ‘nobody on our staff has ever witnessed anything similar,’ said Adam Winstral, Research Hydrologist with the U.S. Depertment of Agriculture.
Sept. 201322 Baker and Umatilla Counties
Dust storm occurs in and near Baker City; dust storms two weeks apart hit Weston.
Sources: Various sources, See footnotes
18 TBD 19 http://en.wikipedia.org/wiki/Goose_Lake_(Oregon-California) 20 Idaho Press Tribune (Tom Dale), August 6, 2012; KTVB, August 5, 2012; KBOI, August 5, 2012; USGS, Dust, an emerging problem in the Great Basin: insights from 2012, January 23, 2013; YouTube, Brenda Burns, published August 6, 2012 and Zeronieo, published August 14, 2012; Mother Recounts Her Encounter with an Oregon Dust Storm, Yahoo Voices, August 8, 2012 21 The Oregonian (oregonlive,com), March 29, 2013; Idaho Statesman (Rocky Barker), March 28, 2013 22 Daily Mail, September 16, 2013; YouTube, Fredrik Anderson, September 12, 2013
2015 Oregon NHMP, DRAFT, 08/01/2014 63
Probability Based on a literature search conducted by the Oregon Office of Emergency Management (OEM), thirteen significant dust storms have been recorded in Oregon over the past 40 years. Four of these were during 2012 and 2013, which suggests a bias in the research toward more recent events. Based strictly on the average, the recurrence interval is about once every three years for significant dust storms. However, the mid ‘70s, the millennium roll-over years, and other short time periods seem to have produced more storms. There may be a relationship with ENSO, droughts, or some other weather pattern. This would benefit by more research.
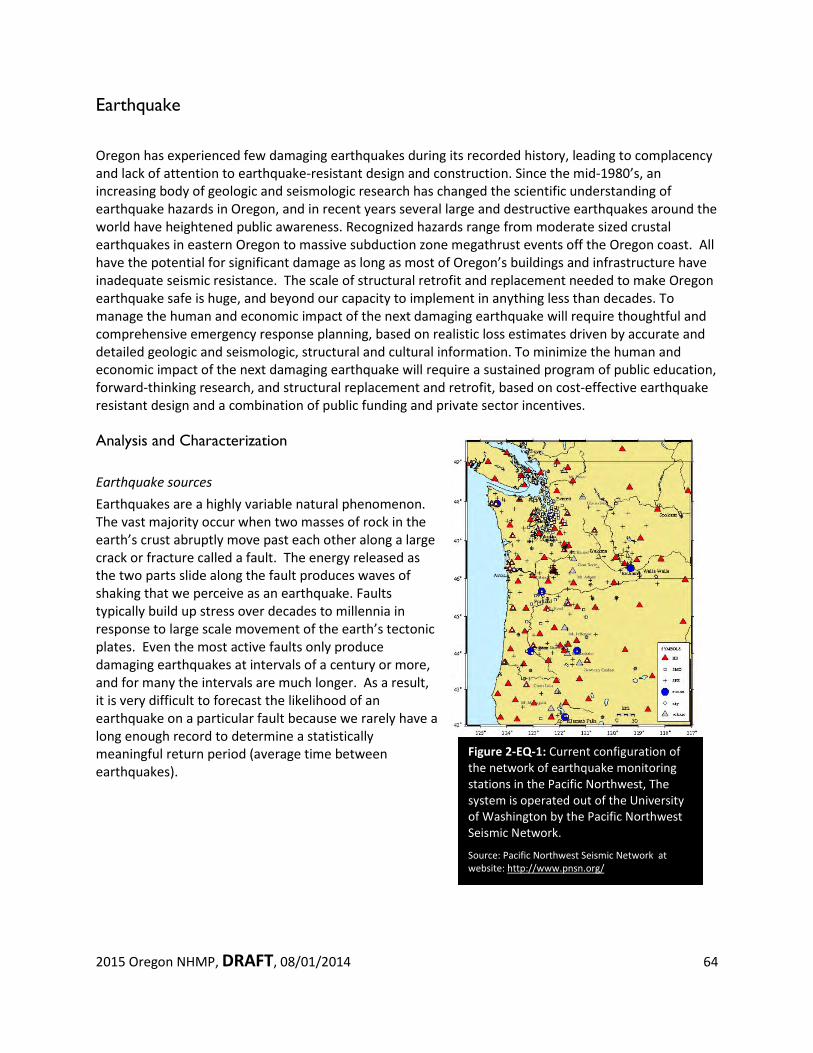
2015 Oregon NHMP, DRAFT, 08/01/2014 64
Figure 2-EQ-1: Current configuration of the network of earthquake monitoring stations in the Pacific Northwest, The system is operated out of the University of Washington by the Pacific Northwest Seismic Network.
Source: Pacific Northwest Seismic Network at website: http://www.pnsn.org/
Earthquake
Oregon has experienced few damaging earthquakes during its recorded history, leading to complacency and lack of attention to earthquake-resistant design and construction. Since the mid-1980’s, an increasing body of geologic and seismologic research has changed the scientific understanding of earthquake hazards in Oregon, and in recent years several large and destructive earthquakes around the world have heightened public awareness. Recognized hazards range from moderate sized crustal earthquakes in eastern Oregon to massive subduction zone megathrust events off the Oregon coast. All have the potential for significant damage as long as most of Oregon’s buildings and infrastructure have inadequate seismic resistance. The scale of structural retrofit and replacement needed to make Oregon earthquake safe is huge, and beyond our capacity to implement in anything less than decades. To manage the human and economic impact of the next damaging earthquake will require thoughtful and comprehensive emergency response planning, based on realistic loss estimates driven by accurate and detailed geologic and seismologic, structural and cultural information. To minimize the human and economic impact of the next damaging earthquake will require a sustained program of public education, forward-thinking research, and structural replacement and retrofit, based on cost-effective earthquake resistant design and a combination of public funding and private sector incentives. Analysis and Characterization Earthquake sources Earthquakes are a highly variable natural phenomenon. The vast majority occur when two masses of rock in the earth’s crust abruptly move past each other along a large crack or fracture called a fault. The energy released as the two parts slide along the fault produces waves of shaking that we perceive as an earthquake. Faults typically build up stress over decades to millennia in response to large scale movement of the earth’s tectonic plates. Even the most active faults only produce damaging earthquakes at intervals of a century or more, and for many the intervals are much longer. As a result, it is very difficult to forecast the likelihood of an earthquake on a particular fault because we rarely have a long enough record to determine a statistically meaningful return period (average time between earthquakes).
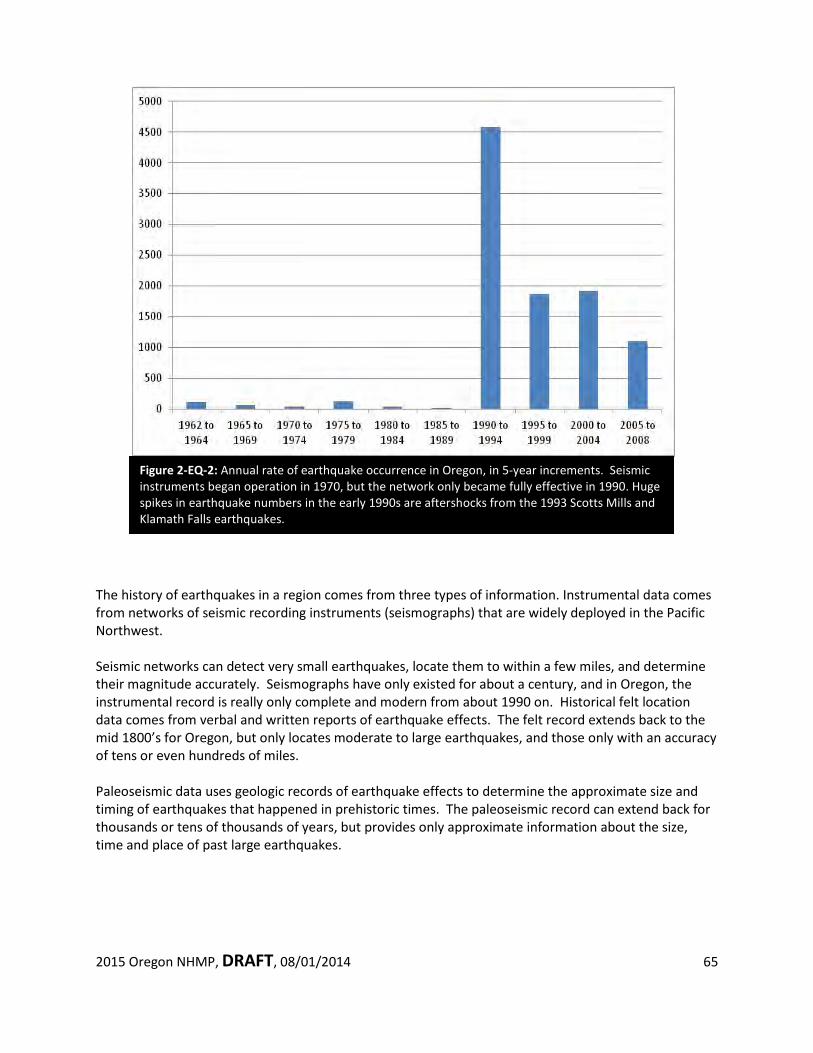
2015 Oregon NHMP, DRAFT, 08/01/2014 65
The history of earthquakes in a region comes from three types of information. Instrumental data comes from networks of seismic recording instruments (seismographs) that are widely deployed in the Pacific Northwest. Seismic networks can detect very small earthquakes, locate them to within a few miles, and determine their magnitude accurately. Seismographs have only existed for about a century, and in Oregon, the instrumental record is really only complete and modern from about 1990 on. Historical felt location data comes from verbal and written reports of earthquake effects. The felt record extends back to the mid 1800’s for Oregon, but only locates moderate to large earthquakes, and those only with an accuracy of tens or even hundreds of miles. Paleoseismic data uses geologic records of earthquake effects to determine the approximate size and timing of earthquakes that happened in prehistoric times. The paleoseismic record can extend back for thousands or tens of thousands of years, but provides only approximate information about the size, time and place of past large earthquakes.
Figure 2-EQ-2: Annual rate of earthquake occurrence in Oregon, in 5-year increments. Seismic instruments began operation in 1970, but the network only became fully effective in 1990. Huge spikes in earthquake numbers in the early 1990s are aftershocks from the 1993 Scotts Mills and Klamath Falls earthquakes.
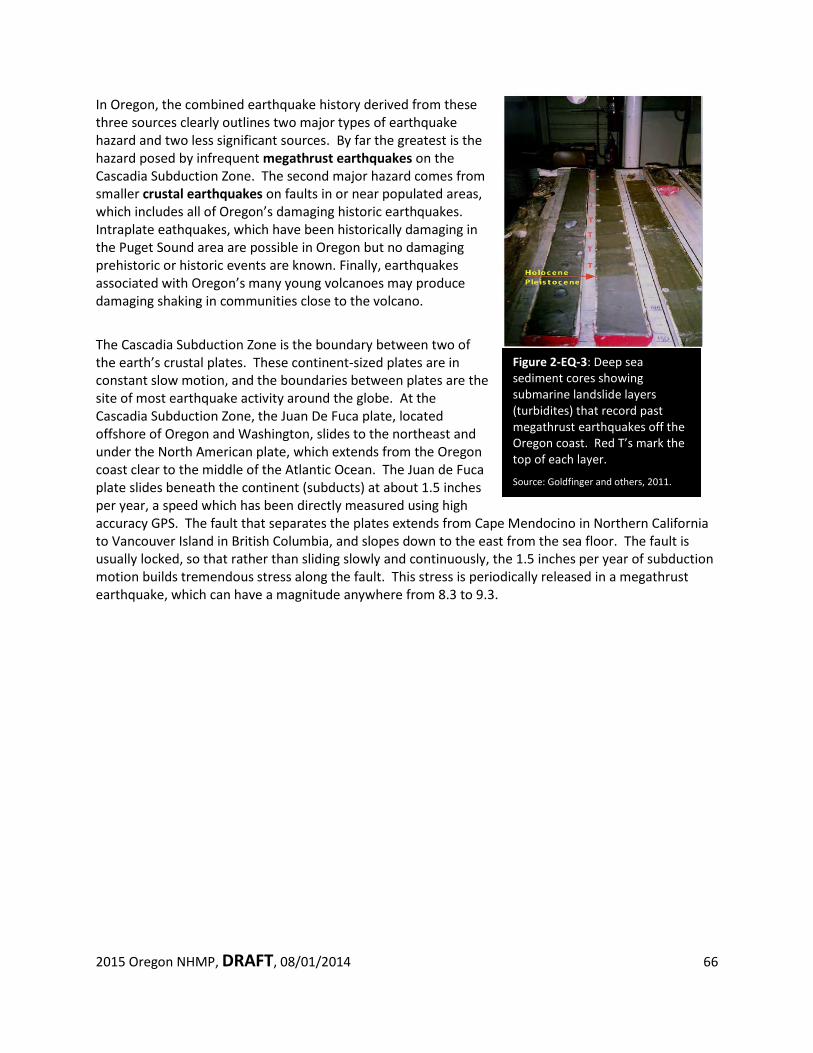
2015 Oregon NHMP, DRAFT, 08/01/2014 66
Figure 2-EQ-3: Deep sea sediment cores showing submarine landslide layers (turbidites) that record past megathrust earthquakes off the Oregon coast. Red T’s mark the top of each layer.
Source: Goldfinger and others, 2011.
In Oregon, the combined earthquake history derived from these three sources clearly outlines two major types of earthquake hazard and two less significant sources. By far the greatest is the hazard posed by infrequent megathrust earthquakes on the Cascadia Subduction Zone. The second major hazard comes from smaller crustal earthquakes on faults in or near populated areas, which includes all of Oregon’s damaging historic earthquakes. Intraplate eathquakes, which have been historically damaging in the Puget Sound area are possible in Oregon but no damaging prehistoric or historic events are known. Finally, earthquakes associated with Oregon’s many young volcanoes may produce damaging shaking in communities close to the volcano.
The Cascadia Subduction Zone is the boundary between two of the earth’s crustal plates. These continent-sized plates are in constant slow motion, and the boundaries between plates are the site of most earthquake activity around the globe. At the Cascadia Subduction Zone, the Juan De Fuca plate, located offshore of Oregon and Washington, slides to the northeast and under the North American plate, which extends from the Oregon coast clear to the middle of the Atlantic Ocean. The Juan de Fuca plate slides beneath the continent (subducts) at about 1.5 inches per year, a speed which has been directly measured using high accuracy GPS. The fault that separates the plates extends from Cape Mendocino in Northern California to Vancouver Island in British Columbia, and slopes down to the east from the sea floor. The fault is usually locked, so that rather than sliding slowly and continuously, the 1.5 inches per year of subduction motion builds tremendous stress along the fault. This stress is periodically released in a megathrust earthquake, which can have a magnitude anywhere from 8.3 to 9.3.
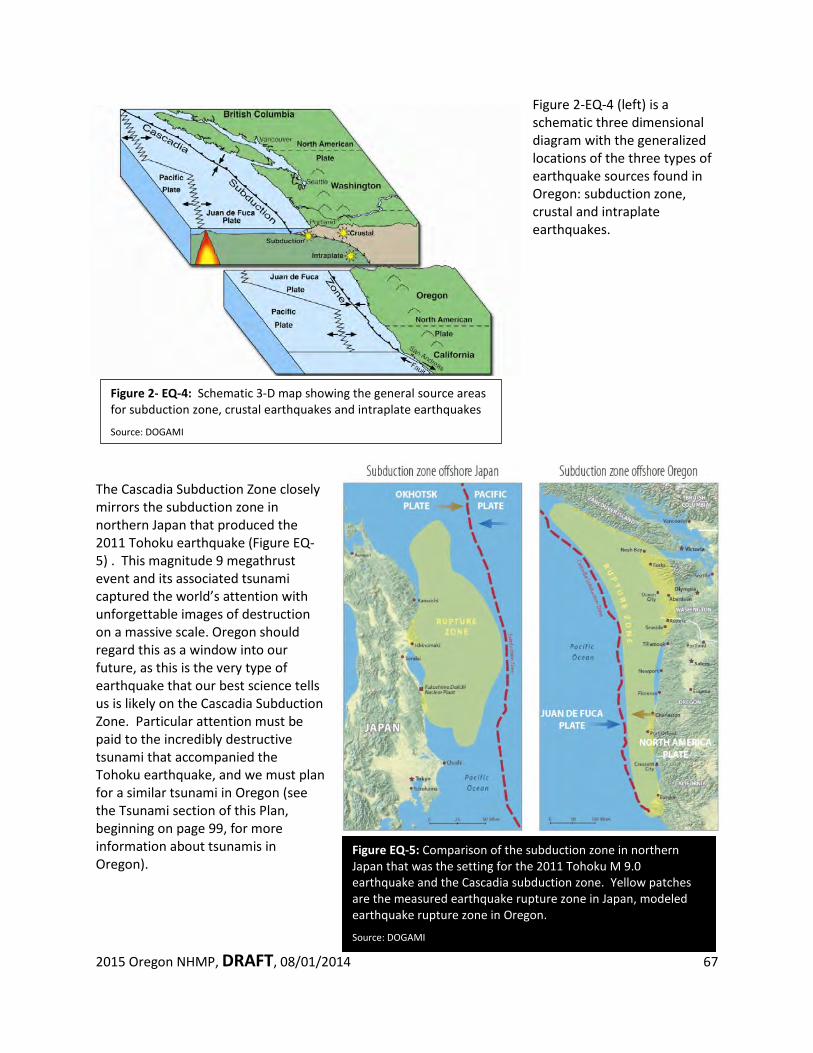
2015 Oregon NHMP, DRAFT, 08/01/2014 67
Figure EQ-5: Comparison of the subduction zone in northern Japan that was the setting for the 2011 Tohoku M 9.0 earthquake and the Cascadia subduction zone. Yellow patches are the measured earthquake rupture zone in Japan, modeled earthquake rupture zone in Oregon.
Source: DOGAMI
Figure 2- EQ-4: Schematic 3-D map showing the general source areas for subduction zone, crustal earthquakes and intraplate earthquakes
Source: DOGAMI
Figure 2-EQ-4 (left) is a schematic three dimensional diagram with the generalized locations of the three types of earthquake sources found in Oregon: subduction zone, crustal and intraplate earthquakes.
The Cascadia Subduction Zone closely mirrors the subduction zone in northern Japan that produced the 2011 Tohoku earthquake (Figure EQ-5) . This magnitude 9 megathrust event and its associated tsunami captured the world’s attention with unforgettable images of destruction on a massive scale. Oregon should regard this as a window into our future, as this is the very type of earthquake that our best science tells us is likely on the Cascadia Subduction Zone. Particular attention must be paid to the incredibly destructive tsunami that accompanied the Tohoku earthquake, and we must plan for a similar tsunami in Oregon (see the Tsunami section of this Plan, beginning on page 99, for more information about tsunamis in Oregon).
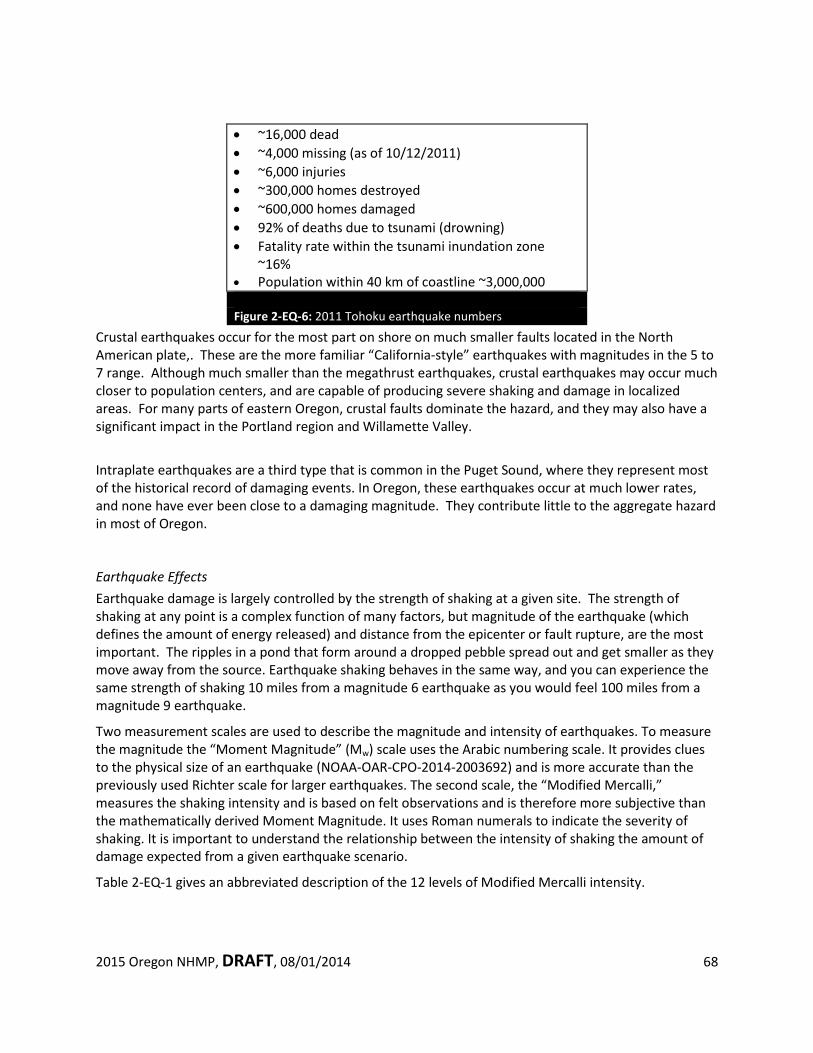
2015 Oregon NHMP, DRAFT, 08/01/2014 68
Crustal earthquakes occur for the most part on shore on much smaller faults located in the North American plate,. These are the more familiar “California-style” earthquakes with magnitudes in the 5 to 7 range. Although much smaller than the megathrust earthquakes, crustal earthquakes may occur much closer to population centers, and are capable of producing severe shaking and damage in localized areas. For many parts of eastern Oregon, crustal faults dominate the hazard, and they may also have a significant impact in the Portland region and Willamette Valley.
Intraplate earthquakes are a third type that is common in the Puget Sound, where they represent most of the historical record of damaging events. In Oregon, these earthquakes occur at much lower rates, and none have ever been close to a damaging magnitude. They contribute little to the aggregate hazard in most of Oregon.
Earthquake Effects Earthquake damage is largely controlled by the strength of shaking at a given site. The strength of shaking at any point is a complex function of many factors, but magnitude of the earthquake (which defines the amount of energy released) and distance from the epicenter or fault rupture, are the most important. The ripples in a pond that form around a dropped pebble spread out and get smaller as they move away from the source. Earthquake shaking behaves in the same way, and you can experience the same strength of shaking 10 miles from a magnitude 6 earthquake as you would feel 100 miles from a magnitude 9 earthquake.
Two measurement scales are used to describe the magnitude and intensity of earthquakes. To measure the magnitude the “Moment Magnitude” (Mw) scale uses the Arabic numbering scale. It provides clues to the physical size of an earthquake (NOAA-OAR-CPO-2014-2003692) and is more accurate than the previously used Richter scale for larger earthquakes. The second scale, the “Modified Mercalli,” measures the shaking intensity and is based on felt observations and is therefore more subjective than the mathematically derived Moment Magnitude. It uses Roman numerals to indicate the severity of shaking. It is important to understand the relationship between the intensity of shaking the amount of damage expected from a given earthquake scenario.
Table 2-EQ-1 gives an abbreviated description of the 12 levels of Modified Mercalli intensity.
• ~16,000 dead • ~4,000 missing (as of 10/12/2011) • ~6,000 injuries • ~300,000 homes destroyed • ~600,000 homes damaged • 92% of deaths due to tsunami (drowning) • Fatality rate within the tsunami inundation zone
~16% • Population within 40 km of coastline ~3,000,000 Figure 2-EQ-6: 2011 Tohoku earthquake numbers
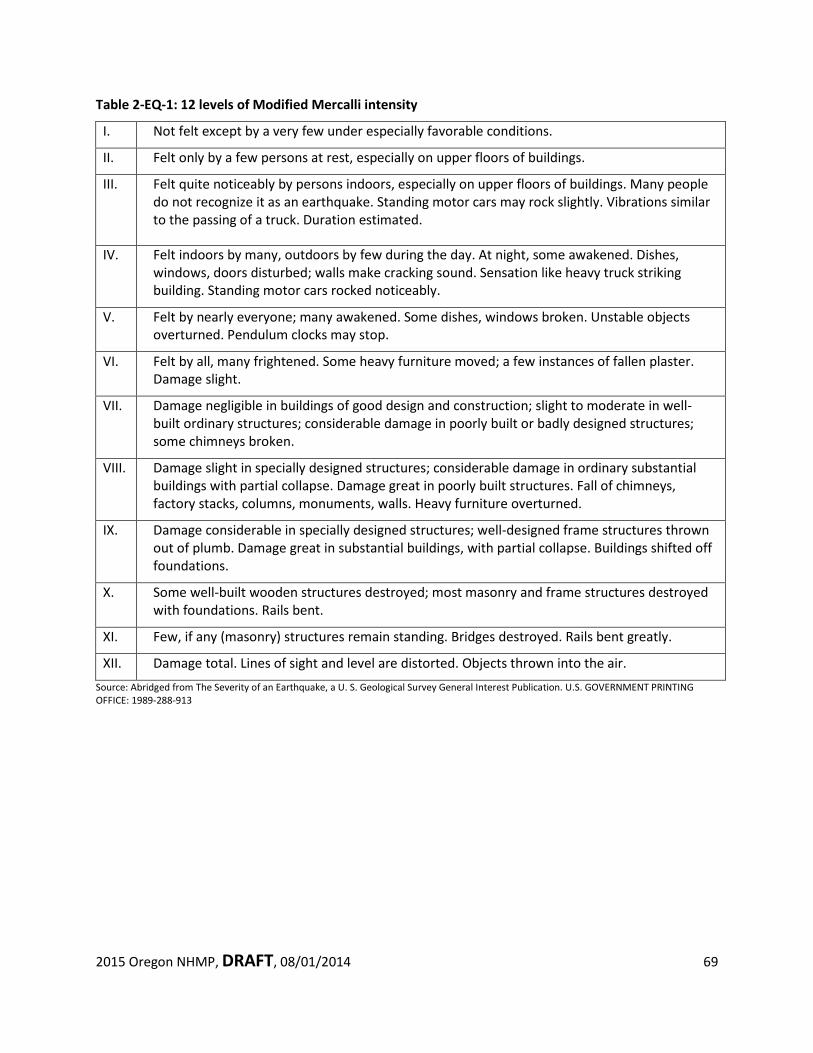
2015 Oregon NHMP, DRAFT, 08/01/2014 69
Table 2-EQ-1: 12 levels of Modified Mercalli intensity
I. Not felt except by a very few under especially favorable conditions.
II. Felt only by a few persons at rest, especially on upper floors of buildings.
III. Felt quite noticeably by persons indoors, especially on upper floors of buildings. Many people do not recognize it as an earthquake. Standing motor cars may rock slightly. Vibrations similar to the passing of a truck. Duration estimated.
IV. Felt indoors by many, outdoors by few during the day. At night, some awakened. Dishes, windows, doors disturbed; walls make cracking sound. Sensation like heavy truck striking building. Standing motor cars rocked noticeably.
V. Felt by nearly everyone; many awakened. Some dishes, windows broken. Unstable objects overturned. Pendulum clocks may stop.
VI. Felt by all, many frightened. Some heavy furniture moved; a few instances of fallen plaster. Damage slight.
VII. Damage negligible in buildings of good design and construction; slight to moderate in well-built ordinary structures; considerable damage in poorly built or badly designed structures; some chimneys broken.
VIII. Damage slight in specially designed structures; considerable damage in ordinary substantial buildings with partial collapse. Damage great in poorly built structures. Fall of chimneys, factory stacks, columns, monuments, walls. Heavy furniture overturned.
IX. Damage considerable in specially designed structures; well-designed frame structures thrown out of plumb. Damage great in substantial buildings, with partial collapse. Buildings shifted off foundations.
X. Some well-built wooden structures destroyed; most masonry and frame structures destroyed with foundations. Rails bent.
XI. Few, if any (masonry) structures remain standing. Bridges destroyed. Rails bent greatly.
XII. Damage total. Lines of sight and level are distorted. Objects thrown into the air. Source: Abridged from The Severity of an Earthquake, a U. S. Geological Survey General Interest Publication. U.S. GOVERNMENT PRINTING OFFICE: 1989-288-913
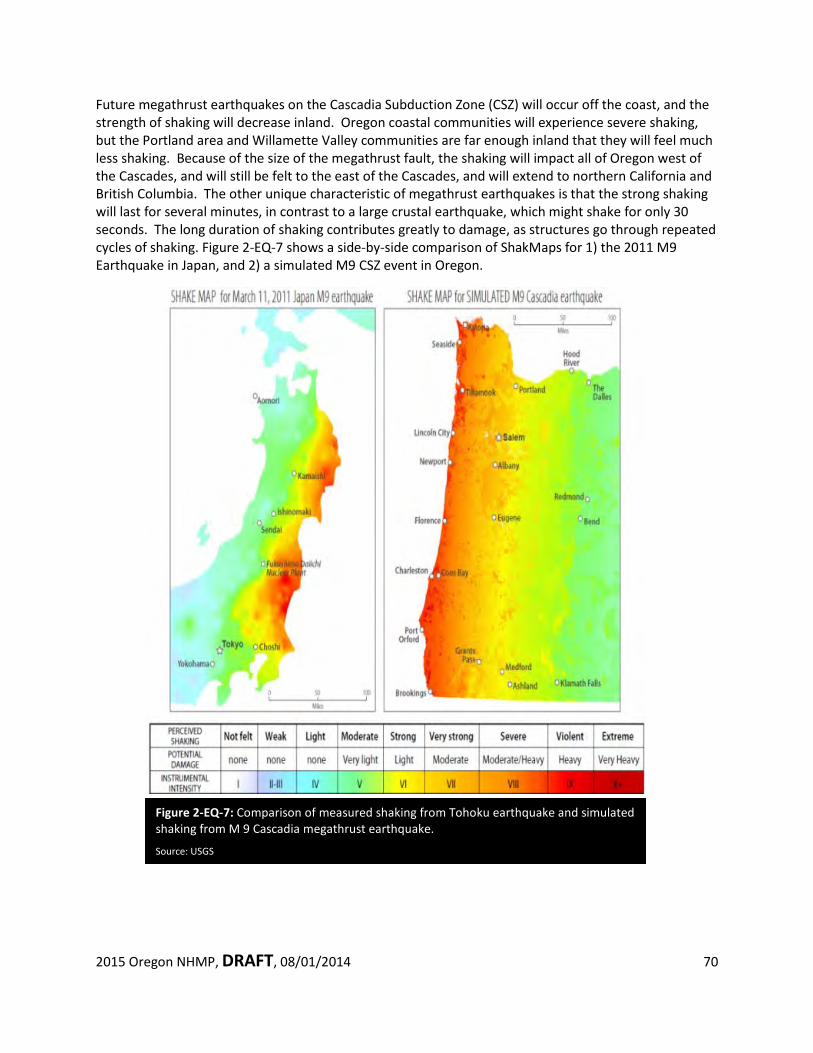
2015 Oregon NHMP, DRAFT, 08/01/2014 70
Figure 2-EQ-7: Comparison of measured shaking from Tohoku earthquake and simulated shaking from M 9 Cascadia megathrust earthquake.
Source: USGS
Future megathrust earthquakes on the Cascadia Subduction Zone (CSZ) will occur off the coast, and the strength of shaking will decrease inland. Oregon coastal communities will experience severe shaking, but the Portland area and Willamette Valley communities are far enough inland that they will feel much less shaking. Because of the size of the megathrust fault, the shaking will impact all of Oregon west of the Cascades, and will still be felt to the east of the Cascades, and will extend to northern California and British Columbia. The other unique characteristic of megathrust earthquakes is that the strong shaking will last for several minutes, in contrast to a large crustal earthquake, which might shake for only 30 seconds. The long duration of shaking contributes greatly to damage, as structures go through repeated cycles of shaking. Figure 2-EQ-7 shows a side-by-side comparison of ShakMaps for 1) the 2011 M9 Earthquake in Japan, and 2) a simulated M9 CSZ event in Oregon.
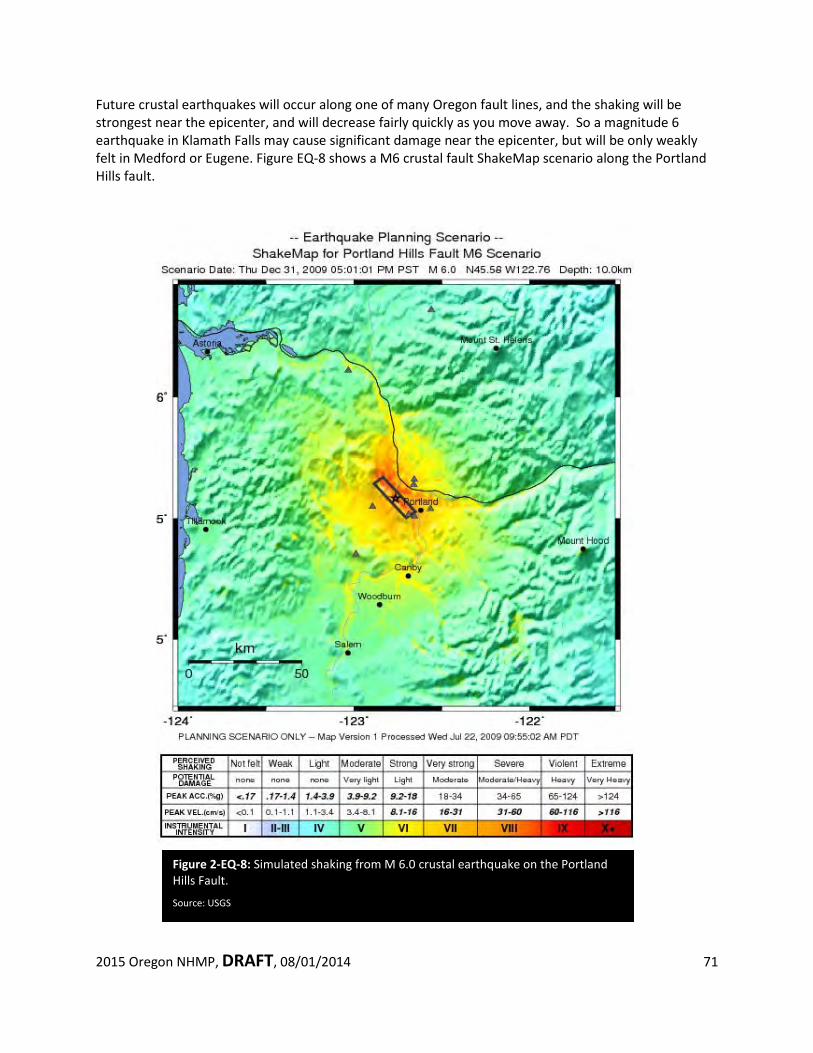
2015 Oregon NHMP, DRAFT, 08/01/2014 71
Figure 2-EQ-8: Simulated shaking from M 6.0 crustal earthquake on the Portland Hills Fault.
Source: USGS
Future crustal earthquakes will occur along one of many Oregon fault lines, and the shaking will be strongest near the epicenter, and will decrease fairly quickly as you move away. So a magnitude 6 earthquake in Klamath Falls may cause significant damage near the epicenter, but will be only weakly felt in Medford or Eugene. Figure EQ-8 shows a M6 crustal fault ShakeMap scenario along the Portland Hills fault.
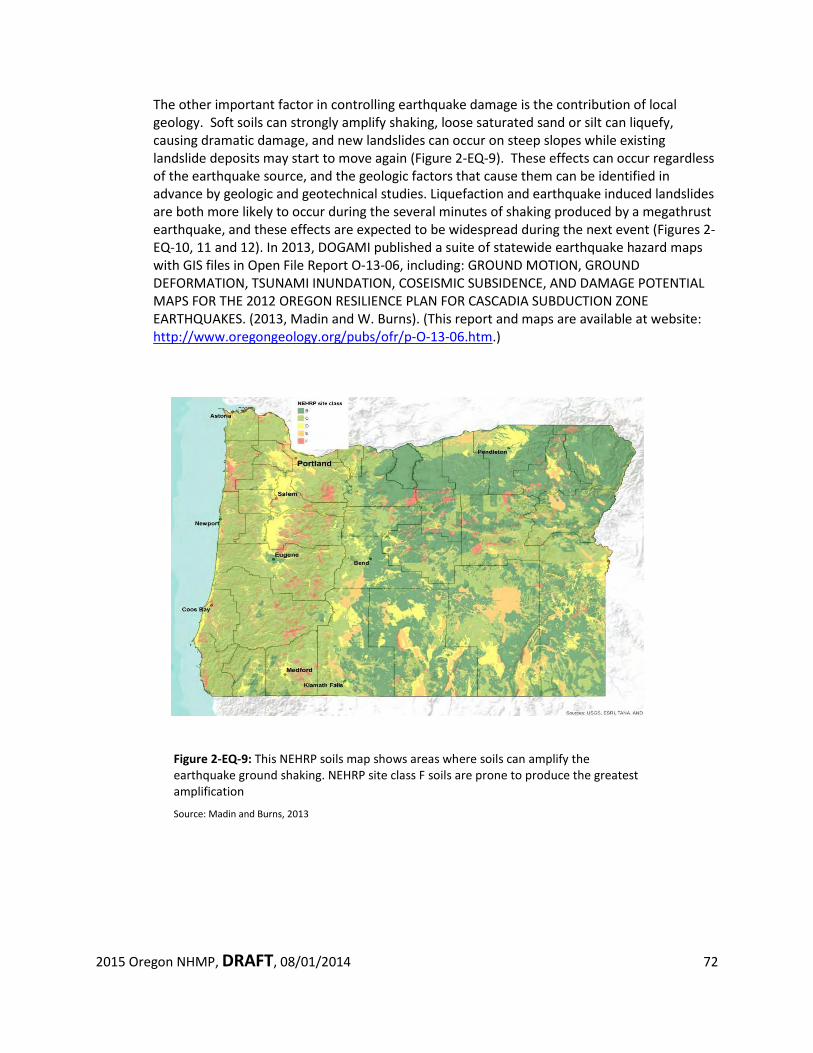
2015 Oregon NHMP, DRAFT, 08/01/2014 72
The other important factor in controlling earthquake damage is the contribution of local geology. Soft soils can strongly amplify shaking, loose saturated sand or silt can liquefy, causing dramatic damage, and new landslides can occur on steep slopes while existing landslide deposits may start to move again (Figure 2-EQ-9). These effects can occur regardless of the earthquake source, and the geologic factors that cause them can be identified in advance by geologic and geotechnical studies. Liquefaction and earthquake induced landslides are both more likely to occur during the several minutes of shaking produced by a megathrust earthquake, and these effects are expected to be widespread during the next event (Figures 2-EQ-10, 11 and 12). In 2013, DOGAMI published a suite of statewide earthquake hazard maps with GIS files in Open File Report O-13-06, including: GROUND MOTION, GROUND DEFORMATION, TSUNAMI INUNDATION, COSEISMIC SUBSIDENCE, AND DAMAGE POTENTIAL MAPS FOR THE 2012 OREGON RESILIENCE PLAN FOR CASCADIA SUBDUCTION ZONE EARTHQUAKES. (2013, Madin and W. Burns). (This report and maps are available at website: http://www.oregongeology.org/pubs/ofr/p-O-13-06.htm.)
Figure 2-EQ-9: This NEHRP soils map shows areas where soils can amplify the earthquake ground shaking. NEHRP site class F soils are prone to produce the greatest amplification
Source: Madin and Burns, 2013
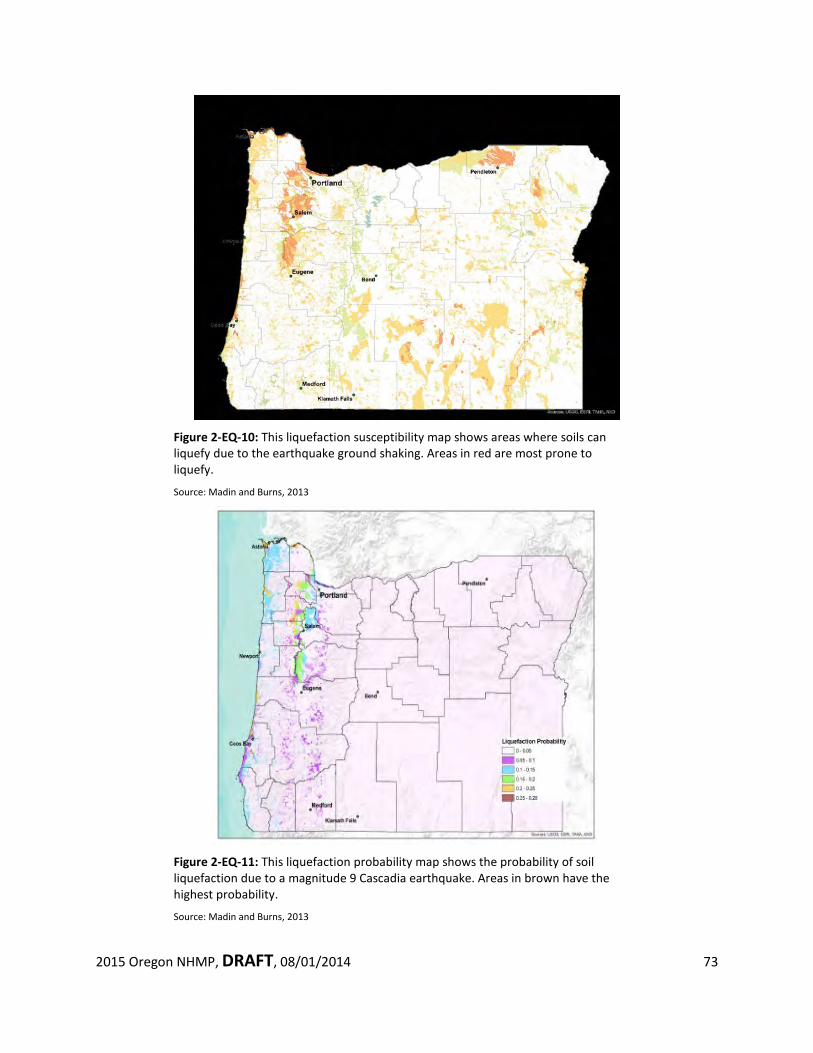
2015 Oregon NHMP, DRAFT, 08/01/2014 73
Figure 2-EQ-10: This liquefaction susceptibility map shows areas where soils can liquefy due to the earthquake ground shaking. Areas in red are most prone to liquefy.
Source: Madin and Burns, 2013
Figure 2-EQ-11: This liquefaction probability map shows the probability of soil liquefaction due to a magnitude 9 Cascadia earthquake. Areas in brown have the highest probability.
Source: Madin and Burns, 2013
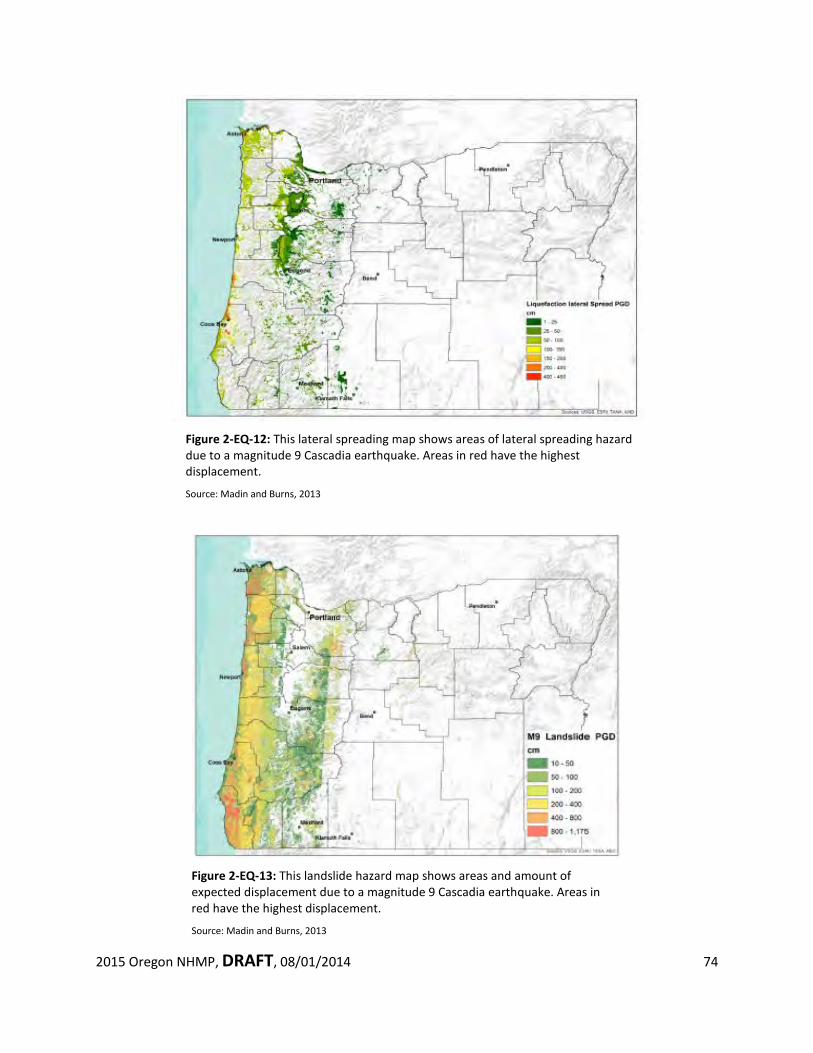
2015 Oregon NHMP, DRAFT, 08/01/2014 74
Figure 2-EQ-12: This lateral spreading map shows areas of lateral spreading hazard due to a magnitude 9 Cascadia earthquake. Areas in red have the highest displacement.
Source: Madin and Burns, 2013
Figure 2-EQ-13: This landslide hazard map shows areas and amount of expected displacement due to a magnitude 9 Cascadia earthquake. Areas in red have the highest displacement.
Source: Madin and Burns, 2013
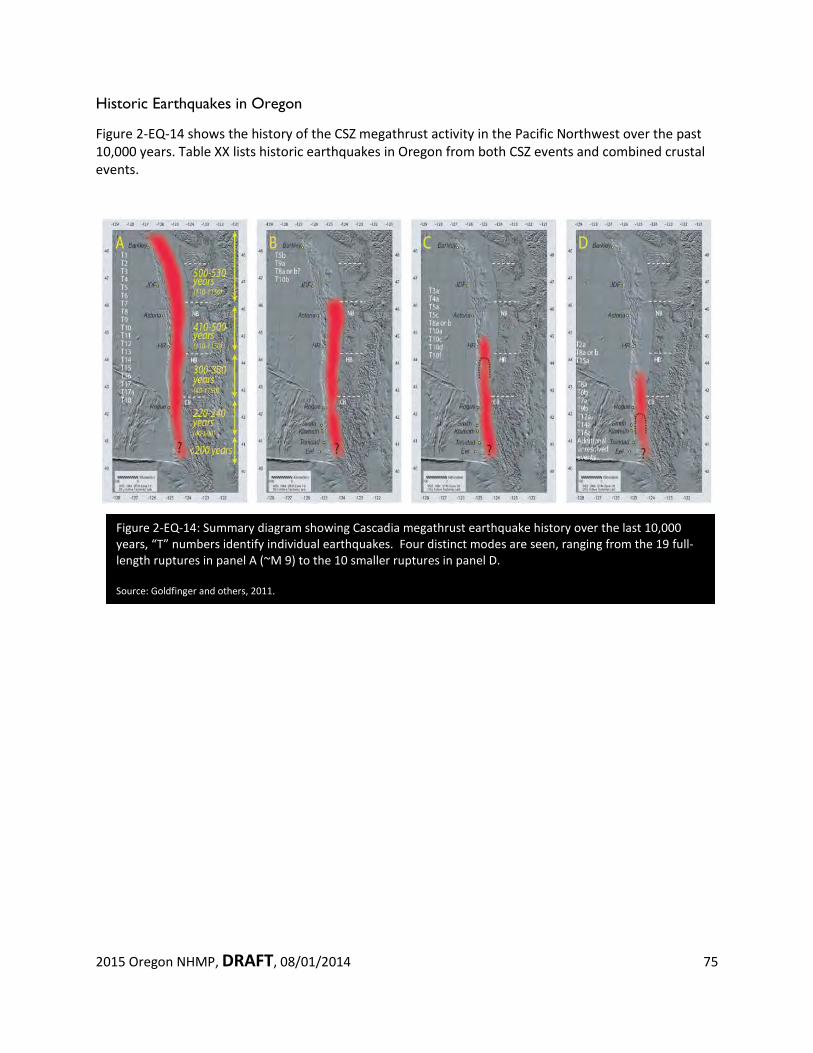
2015 Oregon NHMP, DRAFT, 08/01/2014 75
Historic Earthquakes in Oregon
Figure 2-EQ-14 shows the history of the CSZ megathrust activity in the Pacific Northwest over the past 10,000 years. Table XX lists historic earthquakes in Oregon from both CSZ events and combined crustal events.
Figure 2-EQ-14: Summary diagram showing Cascadia megathrust earthquake history over the last 10,000 years, “T” numbers identify individual earthquakes. Four distinct modes are seen, ranging from the 19 full-length ruptures in panel A (~M 9) to the 10 smaller ruptures in panel D. Source: Goldfinger and others, 2011.
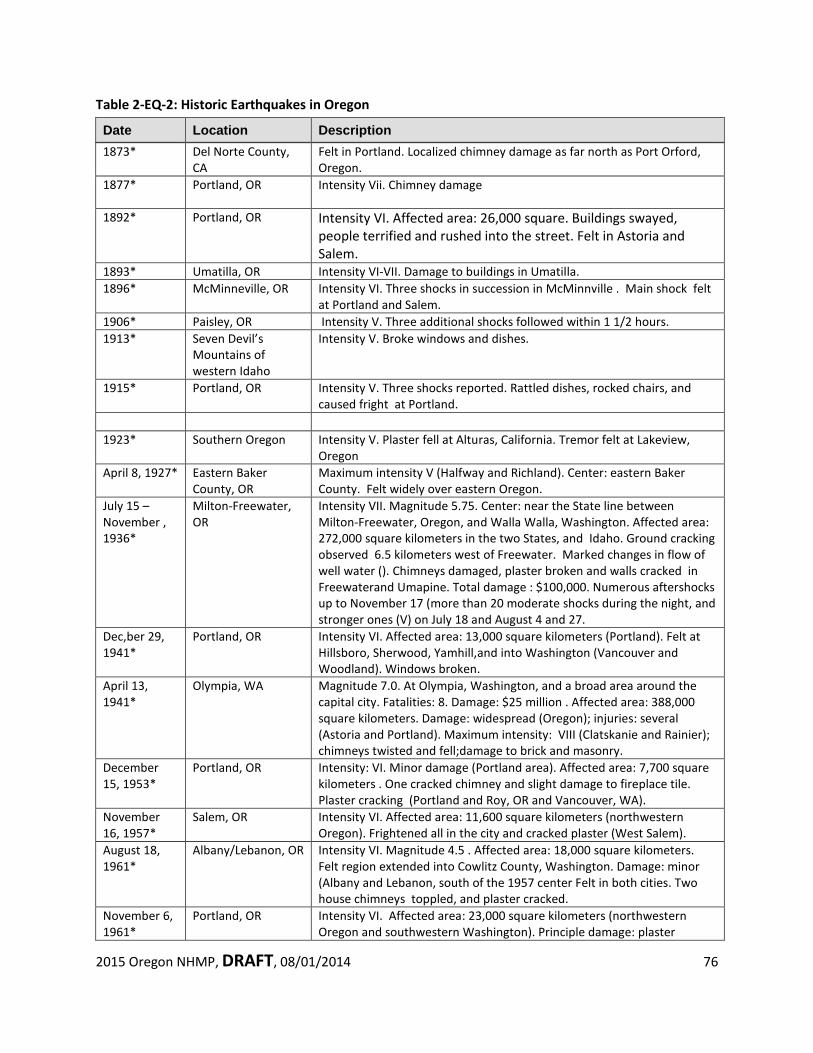
2015 Oregon NHMP, DRAFT, 08/01/2014 76
Table 2-EQ-2: Historic Earthquakes in Oregon
Date Location Description 1873* Del Norte County,
CA Felt in Portland. Localized chimney damage as far north as Port Orford, Oregon.
1877* Portland, OR Intensity Vii. Chimney damage
1892* Portland, OR Intensity VI. Affected area: 26,000 square. Buildings swayed, people terrified and rushed into the street. Felt in Astoria and Salem.
1893* Umatilla, OR Intensity VI-VII. Damage to buildings in Umatilla. 1896* McMinneville, OR Intensity VI. Three shocks in succession in McMinnville . Main shock felt
at Portland and Salem. 1906* Paisley, OR Intensity V. Three additional shocks followed within 1 1/2 hours. 1913* Seven Devil’s
Mountains of western Idaho
Intensity V. Broke windows and dishes.
1915* Portland, OR Intensity V. Three shocks reported. Rattled dishes, rocked chairs, and caused fright at Portland.
1923* Southern Oregon Intensity V. Plaster fell at Alturas, California. Tremor felt at Lakeview,
Oregon April 8, 1927* Eastern Baker
County, OR Maximum intensity V (Halfway and Richland). Center: eastern Baker County. Felt widely over eastern Oregon.
July 15 – November , 1936*
Milton-Freewater, OR
Intensity VII. Magnitude 5.75. Center: near the State line between Milton-Freewater, Oregon, and Walla Walla, Washington. Affected area: 272,000 square kilometers in the two States, and Idaho. Ground cracking observed 6.5 kilometers west of Freewater. Marked changes in flow of well water (). Chimneys damaged, plaster broken and walls cracked in Freewaterand Umapine. Total damage : $100,000. Numerous aftershocks up to November 17 (more than 20 moderate shocks during the night, and stronger ones (V) on July 18 and August 4 and 27.
Dec,ber 29, 1941*
Portland, OR Intensity VI. Affected area: 13,000 square kilometers (Portland). Felt at Hillsboro, Sherwood, Yamhill,and into Washington (Vancouver and Woodland). Windows broken.
April 13, 1941*
Olympia, WA Magnitude 7.0. At Olympia, Washington, and a broad area around the capital city. Fatalities: 8. Damage: $25 million . Affected area: 388,000 square kilometers. Damage: widespread (Oregon); injuries: several (Astoria and Portland). Maximum intensity: VIII (Clatskanie and Rainier); chimneys twisted and fell;damage to brick and masonry.
December 15, 1953*
Portland, OR Intensity: VI. Minor damage (Portland area). Affected area: 7,700 square kilometers . One cracked chimney and slight damage to fireplace tile. Plaster cracking (Portland and Roy, OR and Vancouver, WA).
November 16, 1957*
Salem, OR Intensity VI. Affected area: 11,600 square kilometers (northwestern Oregon). Frightened all in the city and cracked plaster (West Salem).
August 18, 1961*
Albany/Lebanon, OR Intensity VI. Magnitude 4.5 . Affected area: 18,000 square kilometers. Felt region extended into Cowlitz County, Washington. Damage: minor (Albany and Lebanon, south of the 1957 center Felt in both cities. Two house chimneys toppled, and plaster cracked.
November 6, 1961*
Portland, OR Intensity VI. Affected area: 23,000 square kilometers (northwestern Oregon and southwestern Washington). Principle damage: plaster
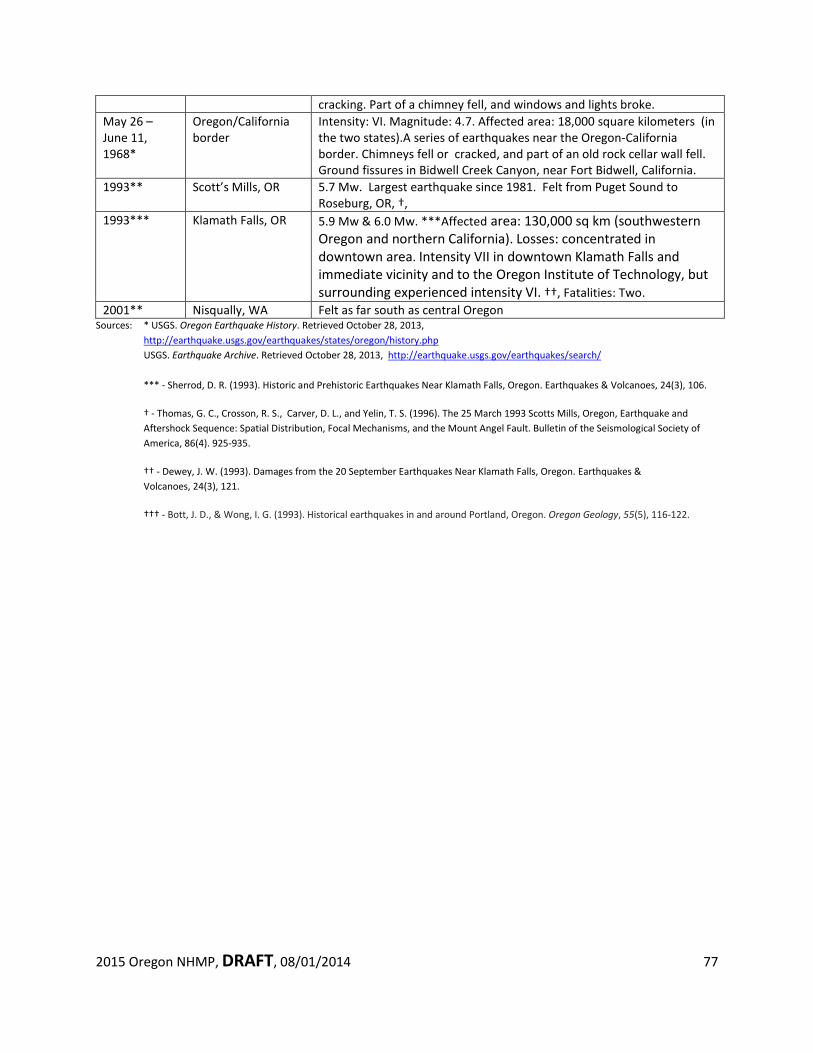
2015 Oregon NHMP, DRAFT, 08/01/2014 77
cracking. Part of a chimney fell, and windows and lights broke. May 26 – June 11, 1968*
Oregon/California border
Intensity: VI. Magnitude: 4.7. Affected area: 18,000 square kilometers (in the two states).A series of earthquakes near the Oregon-California border. Chimneys fell or cracked, and part of an old rock cellar wall fell. Ground fissures in Bidwell Creek Canyon, near Fort Bidwell, California.
1993** Scott’s Mills, OR 5.7 Mw. Largest earthquake since 1981. Felt from Puget Sound to Roseburg, OR, †,
1993*** Klamath Falls, OR 5.9 Mw & 6.0 Mw. ***Affected area: 130,000 sq km (southwestern Oregon and northern California). Losses: concentrated in downtown area. Intensity VII in downtown Klamath Falls and immediate vicinity and to the Oregon Institute of Technology, but surrounding experienced intensity VI. ††, Fatalities: Two.
2001** Nisqually, WA Felt as far south as central Oregon Sources: * USGS. Oregon Earthquake History. Retrieved October 28, 2013,
http://earthquake.usgs.gov/earthquakes/states/oregon/history.php USGS. Earthquake Archive. Retrieved October 28, 2013, http://earthquake.usgs.gov/earthquakes/search/ *** - Sherrod, D. R. (1993). Historic and Prehistoric Earthquakes Near Klamath Falls, Oregon. Earthquakes & Volcanoes, 24(3), 106.
† - Thomas, G. C., Crosson, R. S., Carver, D. L., and Yelin, T. S. (1996). The 25 March 1993 Scotts Mills, Oregon, Earthquake and Aftershock Sequence: Spatial Distribution, Focal Mechanisms, and the Mount Angel Fault. Bulletin of the Seismological Society of America, 86(4). 925-935.
†† - Dewey, J. W. (1993). Damages from the 20 September Earthquakes Near Klamath Falls, Oregon. Earthquakes & Volcanoes, 24(3), 121.
††† - Bott, J. D., & Wong, I. G. (1993). Historical earthquakes in and around Portland, Oregon. Oregon Geology, 55(5), 116-122.
2015 Oregon NHMP, DRAFT, 08/01/2014 78
Probability
The probability of damaging earthquakes varies widely across the state. In Coastal and Western Oregon, the hazard is dominated by Cascadia subduction earthquakes originating from a single fault with a well understood recurrence history. For eastern Oregon the hazard is dominated by numerous crustal faults and background seismicity, with poorly understood probability that varies from region to region. The probability of earthquake hazards occurring in Oregon is defined in two ways. Figure 2-EQ-15 shows the probabilistic hazard for the entire state. This map shows the expected level of earthquake damage that has a 2 percent chance of occurring in the next 50 years. The map is based on the 2008 USGS National Seismic Hazard Map, and has been adjusted to account for the effects of soils following the methods of Madin and Burns, 2013. In this case, the strength of shaking, calculated as peak ground acceleration and peak ground velocity, have been expressed as Mercalli intensity, which describes the effects of shaking on people and structures, and is more readily understandable for a general audience. These maps incorporate all that is known about the probabilities of earthquake on all Oregon faults, including the Cascadia Subduction Zone. For Oregon west of the crest of the Cascades, the Cascadia subduction zone is responsible for most of the hazard, as shown in Figure 2-EQ-15. The paleoseismic record includes 18 MW 8.8-M 9.1 megathrust earthquakes in the last 10,000 years that affected the entire subduction zone. The return period for the largest earthquakes is 530 years, and the probability of the next such event occurring in the next 50 years ranges from 7-12%. An additional 10-20 smaller MW 8.3-8.5 earthquakes only affected the southern half of Oregon and northern California. The average return period for these is about 240 years, and the probability of a small or large subduction earthquake occurring in the next 50 years is 37-43%.
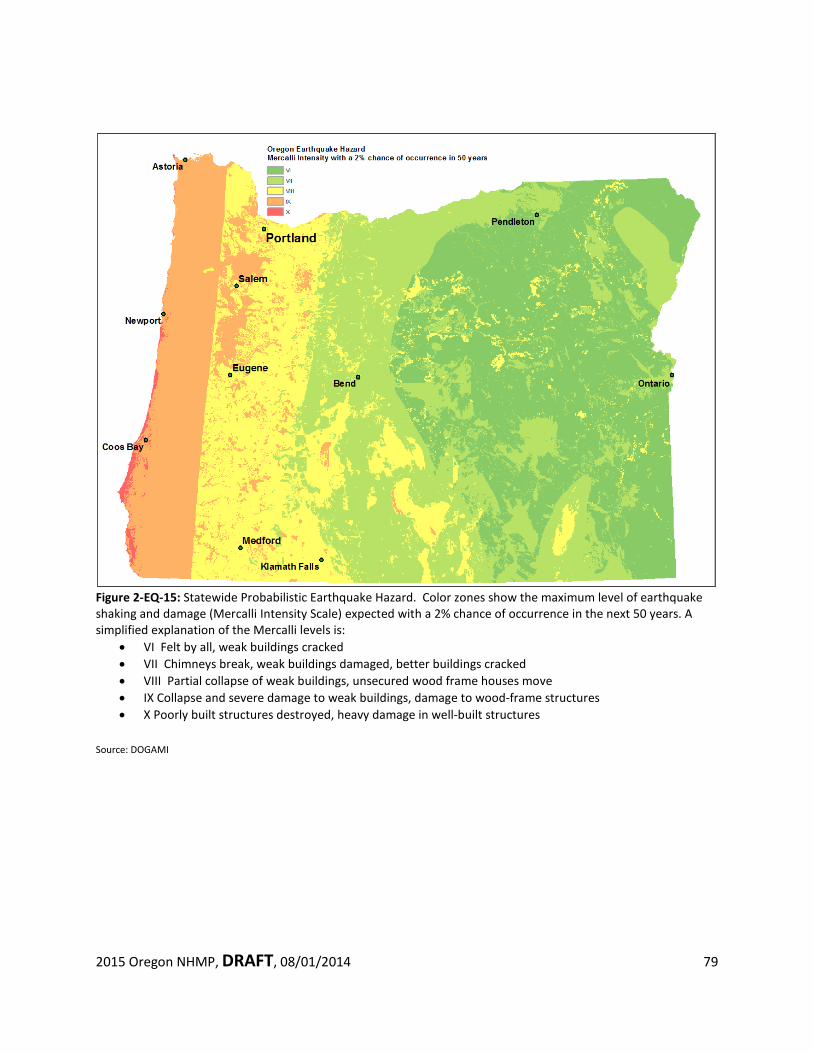
2015 Oregon NHMP, DRAFT, 08/01/2014 79
Figure 2-EQ-15: Statewide Probabilistic Earthquake Hazard. Color zones show the maximum level of earthquake shaking and damage (Mercalli Intensity Scale) expected with a 2% chance of occurrence in the next 50 years. A simplified explanation of the Mercalli levels is:
• VI Felt by all, weak buildings cracked • VII Chimneys break, weak buildings damaged, better buildings cracked • VIII Partial collapse of weak buildings, unsecured wood frame houses move • IX Collapse and severe damage to weak buildings, damage to wood-frame structures • X Poorly built structures destroyed, heavy damage in well-built structures
Source: DOGAMI
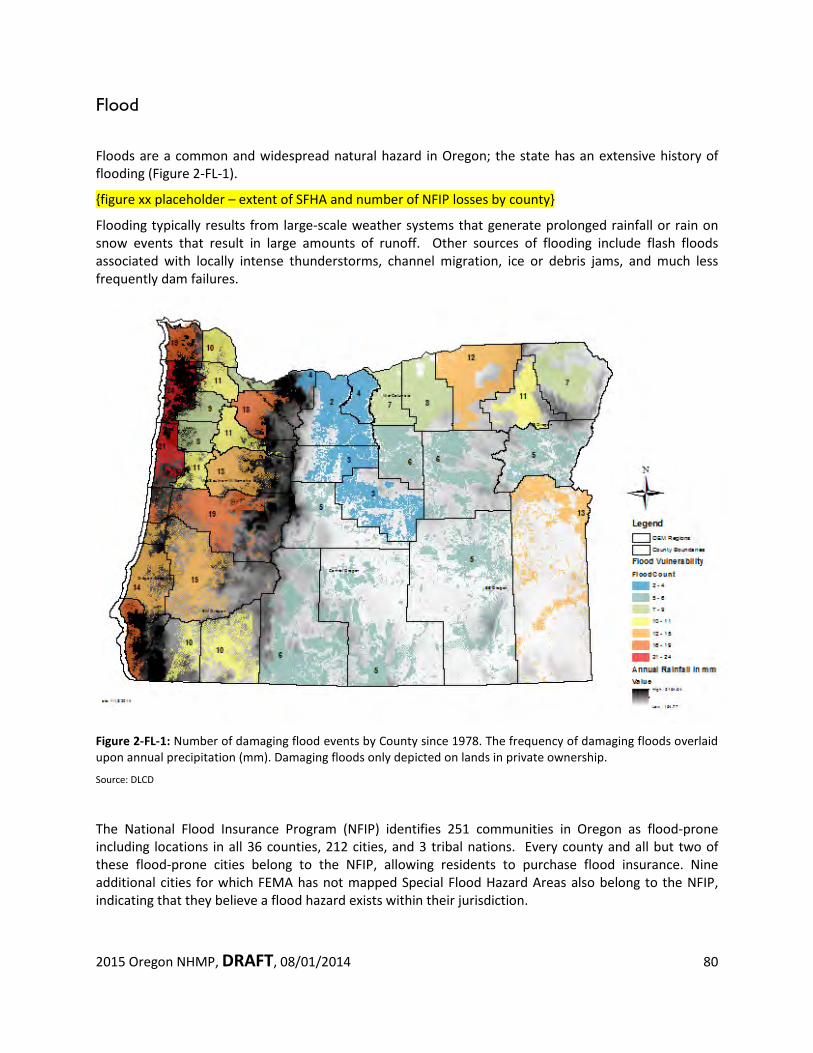
2015 Oregon NHMP, DRAFT, 08/01/2014 80
Flood
Floods are a common and widespread natural hazard in Oregon; the state has an extensive history of flooding (Figure 2-FL-1).
{figure xx placeholder – extent of SFHA and number of NFIP losses by county}
Flooding typically results from large-scale weather systems that generate prolonged rainfall or rain on snow events that result in large amounts of runoff. Other sources of flooding include flash floods associated with locally intense thunderstorms, channel migration, ice or debris jams, and much less frequently dam failures.
Figure 2-FL-1: Number of damaging flood events by County since 1978. The frequency of damaging floods overlaid upon annual precipitation (mm). Damaging floods only depicted on lands in private ownership.
Source: DLCD
The National Flood Insurance Program (NFIP) identifies 251 communities in Oregon as flood-prone including locations in all 36 counties, 212 cities, and 3 tribal nations. Every county and all but two of these flood-prone cities belong to the NFIP, allowing residents to purchase flood insurance. Nine additional cities for which FEMA has not mapped Special Flood Hazard Areas also belong to the NFIP, indicating that they believe a flood hazard exists within their jurisdiction.
2015 Oregon NHMP, DRAFT, 08/01/2014 81
Hazard Analysis and Characterization History of Flooding in Oregon
Oregon has an extensive history of flooding. Tables FL-1 and FL-2 summarize major floods within the state. Oregon’s deadliest recorded flood occurred in Heppner in 1903 when a June 14th storm dropped 1.5 inches of rain within a twenty-minute period. The storm was centered in the headwaters area of Willow Creek above Heppner in Northeastern Oregon. Within minutes, a five-foot wall of water and debris poured through Heppner with enough velocity to rip homes off foundations. These floodwaters claimed 247 lives.
Another late spring flood in 1948 is best remembered for destroying the entire city of Vanport (now Delta Park). Record flow levels on the Columbia River caused the structural failure of a dike. Much of Vanport was destroyed in minutes and was never rebuilt. Nineteen thousand people lost their homes and eighteen people lost their lives.
Many of Oregon’s floods of records occurred in December 1964 and January 1965 during the “Christmas Flood.” Damage from these floods totaled over $157 million dollars and twenty Oregonians lost their lives. From December 20 through 24, 1964, the most severe rainstorm to occur in Central Oregon and one of the most severe west of the Cascades left many areas with two-thirds their normal annual rainfall in five days. The ensuing floods destroyed hundreds of homes and businesses, forced the evacuation of thousands of people, destroyed at least thirty bridges and washed out hundreds of miles of roads and highways.
A similar flood event occurred in February 1996. Following an extended period of unseasonably cold weather and heavy snowfall in the Pacific Northwest, warming temperatures and rain began thawing the snowpack and frozen rivers throughout Oregon. On February 6, a strong subtropical jet stream or “pineapple express” reached Oregon. This warm, humid air mass brought record rainfall amounts, quickly melting the snowpack. At least twenty-five rivers reached flood stage. Many reached flood levels comparable to those reached in the 1964 flood. Twenty-seven of Oregon’s thirty-six counties were eventually covered by a Presidential major disaster declaration due to this event. Statewide, damages totaled over $280 million.
A series of powerful wind and rain storms caused extensive flooding in northwestern in December of 2007. Three people were killed as a result of these storms. The City of Vernonia was hard hit with over 200 buildings substantially damaged and subsequently elevated or bought-out by FEMA.
2015 Oregon NHMP, DRAFT, 08/01/2014 82
Types of Flooding
Riverine – Riverine flooding is the most common flood hazard in Oregon. It is caused by the passage of a larger quantity of water than can be contained within the normal stream channel. The increased stream flow is usually caused by extensive rainfall over a period of several days. The most severe flooding conditions generally occur when rainfall is augmented by snowmelt. If the ground is saturated or frozen, stream flow can be increased even more by the inability of the soil to absorb additional precipitation. Examples of riverine events are the flooding in December 2007, February 1996, and December 1964 to January 1965.
Flash Floods – Flash flooding is caused by extremely intense rainfall over a short period of time, commonly within a single drainage. Flash floods usually occur in the summer during the thunderstorm season. The two key contributors to flash flooding are rainfall intensity and duration. Topography, soil conditions and ground cover also impact flooding. Flash floods, because of their intensity, often pick up large loads of sediment and other solid materials. In these situations, a flash flood may arrive as a fast moving wall of debris, mud, and water.
Occasionally, floating debris or ice accumulates at a natural or man-made obstruction and restrict the flow of water. Water held back by the ice jam or debris dam can cause flooding upstream. Subsequent flash flooding can occur downstream if the obstruction suddenly releases. Areas subject to flash floods are not as obvious as a typical riverine floodplain. However, flash floods may be associated with recognizable locations such as canyons or arroyos. There is also always some potential for flash floods associated with dam failure.
The most notorious flash flood in Oregon was the June 14, 1903 event in Heppner summarized previously. More recent flash floods have occurred in Wallowa Co. (July 2002) and the City of Rufus (August 2003).
Coastal Floods – Coastal areas have additional flood hazards. Winds generated by tropical storms or intense off shore low-pressure systems can drive ocean water inland and cause significant flooding. The height of storm surge is dependent on the wind velocity, water depth and the length of open water (the fetch) over which the wind is flowing. Storm surges are also affected by the shape of the coastline and by the height of tides.
Coastal flooding also may result from tsunamis. A tsunami is a series of traveling ocean waves generated by an earthquake or landslide that occurs below or on the ocean floor. Oregon’s seven coastal counties and many coastal cities are susceptible to flood damage associated with tsunamis. Both “distant” tsunamis generated from seismic events in the Pacific basin and “near shore” tsunamis generated from activity associated with the Cascadia Subduction Zone can impact Oregon’s coast. For more information, see the Tsunami Chapter of this plan.
Shallow Area Flooding – Some areas are characterized by FEMA as being subject to shallow flooding. These are areas that are predicted to be inundated by the 100-year flood with flood depths of one to
2015 Oregon NHMP, DRAFT, 08/01/2014 83
three feet. Flooding events are expected to be low velocity events characterized by “sheet flows” of water.
Urban Flooding – As land is converted from fields or woodlands to roads, roofs, and parking lots, it loses its ability to absorb rainfall. This transition from pervious surfaces to impervious surfaces results in more and faster runoff of water. During periods of urban flooding, streets can become swift moving rivers, and basements can fill with water. Storm drains may back-up with yard waste causing additional nuisance flooding.
Playa Flooding – Playa flooding results from greater than normal runoff into a closed basin. Closed basin systems are those areas that have one or more rivers emptying into one or more lakes that have no outlet. In these situations, water can only leave the system through evaporation. Thus, if annual precipitation in the basin increases significantly, evaporation is not enough to reduce water levels. Lake levels rise and inundate the surrounding properties.
The best-known example of playa basin flooding in Oregon occurs at Malheur and Harney lakes in Harney County. In higher than average precipitation years, the lakes flood adjacent ranches and public roads. Malheur and Harney lakes flooded during the years 1979 to 1986, and then gradually receded. During the wetter years of 1997 to 1999, these lakes again flooded. By 2005, following a number of dry years, they had receded significantly. In spring 2011, as a result of a heavy snowpack and persistent rainfall, Harney Lake’s water level increased significantly with flooding observed in low-lying areas.
Ice Jams – Ice jams happen in colder regions of the State during winter and early spring while rivers are frozen. Sudden warming at higher altitudes melts snow resulting in increased runoff which breaks the ice from reaches of frozen river below. On the way downstream, the floating ice can “jam” in a narrow reach of the drainage or against a road crossing which then dams melting water. As the ice weakens, water breaches the dam releasing a torrent of water. Dam Failure – Dam failures and accidents, though rare, can result in extreme flooding downstream of the dam. Catastrophic dam failures have occurred in other parts of the country and around the world. The South Fork Dam failure (1889 Johnstown flood) resulted in over 2000 fatalities in western Pennsylvania. The Saint Francis Dam in southern California failed in 1928 with a loss of an estimated 600 people. Oregon’s dam safety statutes (ORS 540.350 through 400) came into effect shortly after the Saint Francis disaster. Many historical dam failures were triggered by flood events, others by poor dam construction, and some have been triggered by earthquakes. Dam Safety is one of the Oregon Water Resources Department’s roles. The dam safety program reviews designs for dam construction or modification and approves designs when they are shown to be safe; conducts routine inspections; determines hazard rating and condition; encourages emergency action plans for high hazard dams; and takes enforcement on unsafe dams. The dam safety program also coordinates with federal agencies that are responsible for their dams, and is the Oregon Emergency Response System contact in the event of a major emergency for any dam in the State. Without safety standards for design, construction, maintenance, operations and inspections there is an increased risk of dam safety problems. Oregon has a very good dam safety record, with no fatalities from dam failures. The vast majority of Oregon’s approximately 55 recorded dam failures occurred
2015 Oregon NHMP, DRAFT, 08/01/2014 84
before 1987. About 1/3 of these 55 dam failures resulted in significant property damage. Much of Oregon’s dam infrastructure is aging, and many dams were designed prior to the current understanding of earthquake hazard and especially the risk associated with the Cascadia subduction zone. Primary dam safety program goals are: conducting timely inspections; reducing the number of dams in poor or unsatisfactory condition; having emergency action plans for most high hazard dams; and responding to events that might trigger dam failures. Additional information on dams and dam safety in Oregon is found at: http://www.oregon.gov/owrd/pages/SW/dams_in_oregon.aspx The dam safety program has been ensuring the over 900 dams under its jurisdiction are inspected on schedule, with recommendations sent to dam owners. At times this requires urgent dam safety notices and/or enforcement action. Other high priority functions include determining dam hazard to people and changing hazard ratings based on hydraulic analyses, and development of emergency action plans for high hazard dams. The dam safety program also coordinates with the National Weather Service and OEM on severe flood potential that could affect dams and other infrastructure. The program exceeds FEMA guidance for dam safety inspections on schedule and for condition classification, and should be at the FEMA standard for Emergency Action Plans shortly. Channel Migration in Association with Flooding
Channel migration is the process by which streams move laterally over time. It is typically a gradual phenomenon that takes place over many years due to natural processes of erosion and deposition. In some cases, usually associated with flood events, significant channel migration can happen rapidly. In high flood flow events stream channels can “avulse” and shift to occupy a completely new channel.
Areas most susceptible to channel migration are transitional zones where steep channels flow from foothills into broad, flat floodplains. The most common physiographic characteristics of a landscape prone to channel migration include moderate channel steepness, moderate to low channel confinement (i.e. valley broadness), and erodible geology.
Channel migration can and has created hazardous conditions within Oregon’s developed riparian areas. Rapid migration can undercut structure foundations and damage infrastructure. The upper Sandy River in eastern Clackamas County is an example of where channel migration and development intersect. A recent January 2011 flood resulted in temporary avulsion that washed out section of Lolo Pass Road and also bank erosion that damaged and destroyed several homes.
2015 Oregon NHMP, DRAFT, 08/01/2014 85
Channel migration is not a standard consideration of the NFIP and has not been mapped systematically in Oregon. The Oregon Department of Geology and Mineral Industries (DOGAMI) recently started mapping channel migration zones for areas with known susceptibility on an ad hoc basis. DOGAMI is mapping channel migration zones using procedures developed by the Washington Department of Ecology for administration of its regulatory Shoreline Master Program23. In Oregon more work is required to identify susceptible areas where detailed channel migration zone mapping is needed. El Niño24 and La Niña Events in Oregon and Relationship to Flooding25
One of the most prominent aspects of Oregon’s weather and climate is its variability. This variability ranges over many time and space scales, from small-scale phenomena such as wind gusts and localized thunderstorms, to larger-scale features like fronts and storms, to even more prolonged features such as droughts and periods of flooding. Fluctuations occur on multi-seasonal, multi-year, multi-decade and even multi-century time scales. Examples of these longer time-scale fluctuations include an abnormally hot and dry summer, an abnormally cold and snowy winter, a consecutive series of abnormally mild or exceptionally severe winters, and even a mild winter followed by a severe winter. Human inputs into our geophysical environment are also imposing cumulative impacts with measurable changes to global climate, sea-level and even localized weather. These human inputs along with the normal climate cycles may be working together in unpredictable ways and lead to future climate scenarios that do not resemble past, historic cycles. For example, recent research suggests that a warming climate reinforces the possibility that El Niño events could be stronger and more frequent while La Niña episodes may be weaker and less frequent. The terms El Niño and La Niña represent opposite extremes of the ENSO cycle in an otherwise continuum of global climate events, with “average” conditions generally prevailing between those extremes. In the past three decades there have been several El Niños, with the 1982 to 1983 and 1997 to 1998 events having been the strongest on record, while the period between 1990 and 1995 was characterized by persistent El Niño conditions, the longest on record. (Trenberth, 1999) In general, the longer time-scale phenomena are associated with changes in oceanic and atmospheric circulation that encompass areas far larger than a particular affected region. At times, these persistent features occur simultaneously over vast, and seemingly unrelated, parts of the hemisphere, or even the globe, resulting in abnormal weather, temperature and rainfall patterns throughout the world. During the past several decades, scientists have discovered that important aspects of this interannual variability in global weather patterns are linked to a global-scale, naturally occurring phenomenon known as the El Niño Southern Oscillation (ENSO) cycle. A measure of this cycle is the Southern Oscillation Index (SOI), which is “calculated from the monthly or seasonal fluctuations in the air pressure difference between Tahiti and Darwin, Australia.”
23 The State of Washington has included channel migration as a consideration in its regulatory Shoreline Master Programs (http://www.ecy.wa.gov/programs/sea/sma/st_guide/jurisdiction/cmz.html). 24 The cyclical warming of east Pacific Ocean seawater temperatures off the western coast of South America that can result in significant changes in weather patterns in the United States and elsewhere. 25 In large part from Impacts of the El Niño/Southern Oscillation on the Pacific Northwest, George Taylor, OCS, March 1998, http://www.ocs.orst.edu/reports/enso_pnw.html
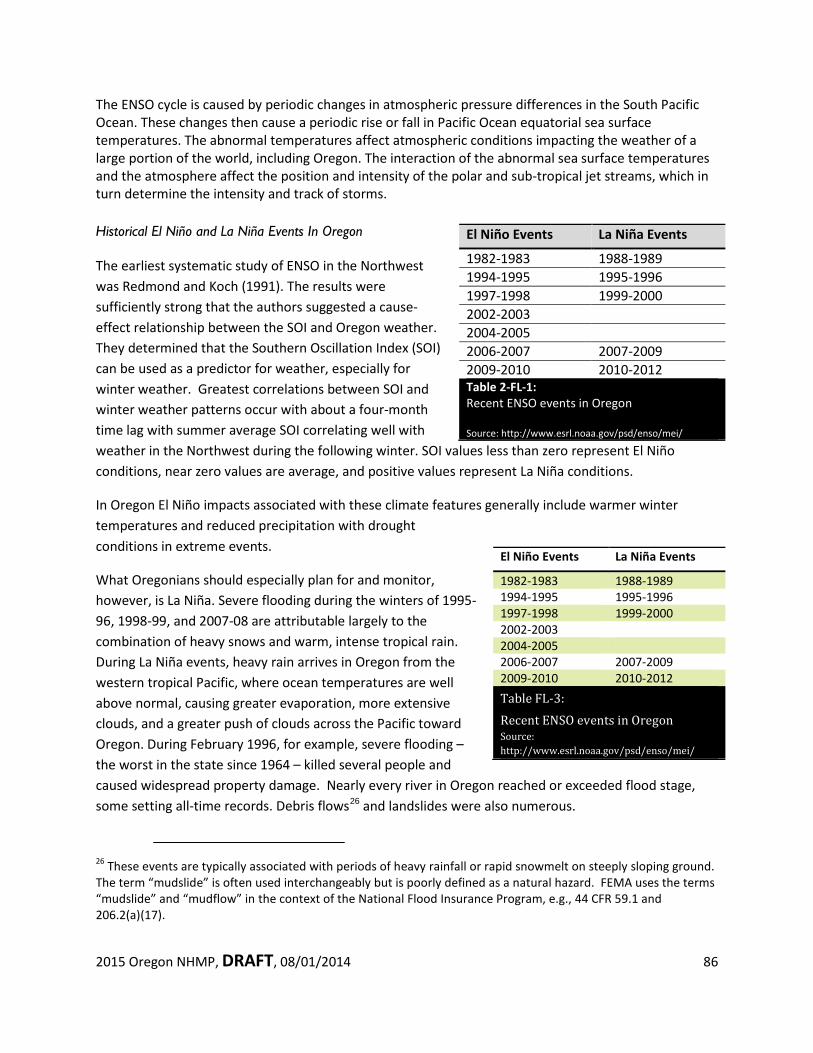
2015 Oregon NHMP, DRAFT, 08/01/2014 86
The ENSO cycle is caused by periodic changes in atmospheric pressure differences in the South Pacific Ocean. These changes then cause a periodic rise or fall in Pacific Ocean equatorial sea surface temperatures. The abnormal temperatures affect atmospheric conditions impacting the weather of a large portion of the world, including Oregon. The interaction of the abnormal sea surface temperatures and the atmosphere affect the position and intensity of the polar and sub-tropical jet streams, which in turn determine the intensity and track of storms.
Historical El Niño and La Niña Events In Oregon
The earliest systematic study of ENSO in the Northwest was Redmond and Koch (1991). The results were sufficiently strong that the authors suggested a cause-effect relationship between the SOI and Oregon weather. They determined that the Southern Oscillation Index (SOI) can be used as a predictor for weather, especially for winter weather. Greatest correlations between SOI and winter weather patterns occur with about a four-month time lag with summer average SOI correlating well with weather in the Northwest during the following winter. SOI values less than zero represent El Niño conditions, near zero values are average, and positive values represent La Niña conditions.
In Oregon El Niño impacts associated with these climate features generally include warmer winter temperatures and reduced precipitation with drought conditions in extreme events.
What Oregonians should especially plan for and monitor, however, is La Niña. Severe flooding during the winters of 1995-96, 1998-99, and 2007-08 are attributable largely to the combination of heavy snows and warm, intense tropical rain. During La Niña events, heavy rain arrives in Oregon from the western tropical Pacific, where ocean temperatures are well above normal, causing greater evaporation, more extensive clouds, and a greater push of clouds across the Pacific toward Oregon. During February 1996, for example, severe flooding – the worst in the state since 1964 – killed several people and caused widespread property damage. Nearly every river in Oregon reached or exceeded flood stage, some setting all-time records. Debris flows26 and landslides were also numerous.
26 These events are typically associated with periods of heavy rainfall or rapid snowmelt on steeply sloping ground. The term “mudslide” is often used interchangeably but is poorly defined as a natural hazard. FEMA uses the terms “mudslide” and “mudflow” in the context of the National Flood Insurance Program, e.g., 44 CFR 59.1 and 206.2(a)(17).
El Niño Events La Niña Events
1982-1983 1988-1989 1994-1995 1995-1996 1997-1998 1999-2000 2002-2003 2004-2005 2006-2007 2007-2009 2009-2010 2010-2012 Table 2-FL-1: Recent ENSO events in Oregon Source: http://www.esrl.noaa.gov/psd/enso/mei/
El Niño Events La Niña Events
1982-1983 1988-1989 1994-1995 1995-1996 1997-1998 1999-2000 2002-2003 2004-2005 2006-2007 2007-2009 2009-2010 2010-2012 Table FL-3: Recent ENSO events in Oregon Source: http://www.esrl.noaa.gov/psd/enso/mei/
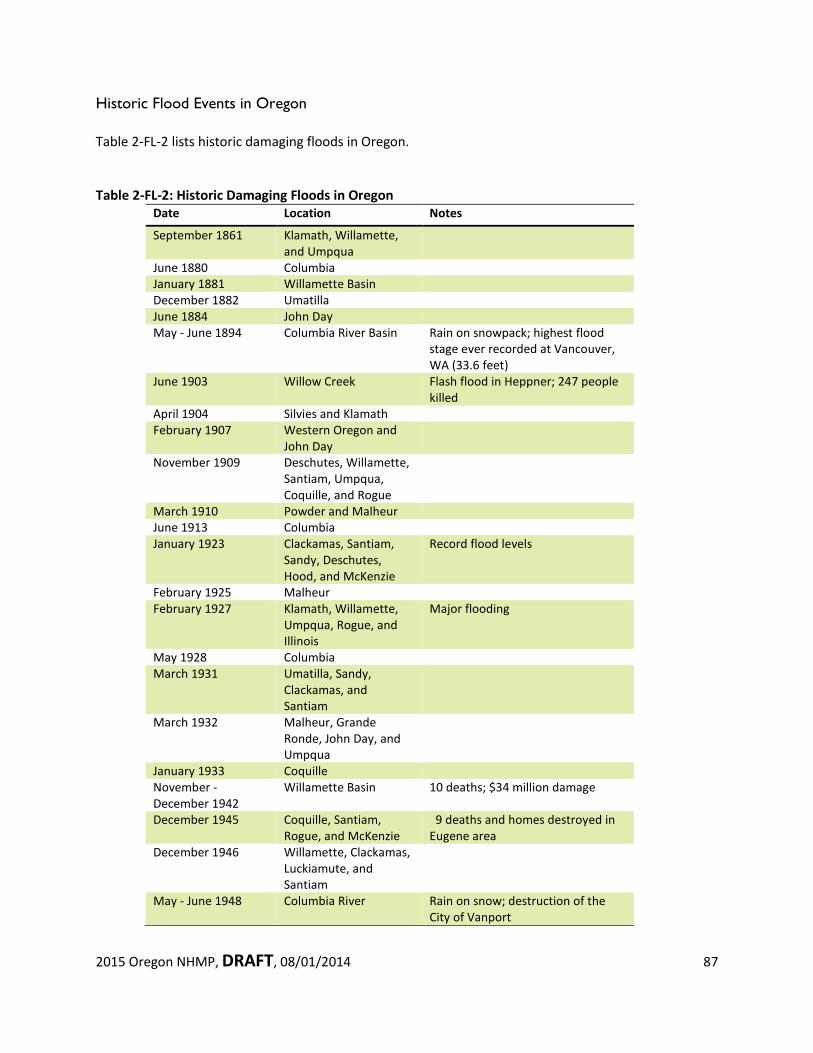
2015 Oregon NHMP, DRAFT, 08/01/2014 87
Historic Flood Events in Oregon Table 2-FL-2 lists historic damaging floods in Oregon. Table 2-FL-2: Historic Damaging Floods in Oregon
Date
Location Notes
September 1861 Klamath, Willamette, and Umpqua
June 1880 Columbia January 1881 Willamette Basin December 1882 Umatilla June 1884 John Day May - June 1894 Columbia River Basin Rain on snowpack; highest flood
stage ever recorded at Vancouver, WA (33.6 feet)
June 1903 Willow Creek Flash flood in Heppner; 247 people killed
April 1904 Silvies and Klamath February 1907 Western Oregon and
John Day
November 1909 Deschutes, Willamette, Santiam, Umpqua, Coquille, and Rogue
March 1910 Powder and Malheur June 1913 Columbia January 1923 Clackamas, Santiam,
Sandy, Deschutes, Hood, and McKenzie
Record flood levels
February 1925 Malheur February 1927 Klamath, Willamette,
Umpqua, Rogue, and Illinois
Major flooding
May 1928 Columbia March 1931 Umatilla, Sandy,
Clackamas, and Santiam
March 1932 Malheur, Grande Ronde, John Day, and Umpqua
January 1933 Coquille November - December 1942
Willamette Basin 10 deaths; $34 million damage
December 1945 Coquille, Santiam, Rogue, and McKenzie
9 deaths and homes destroyed in Eugene area
December 1946 Willamette, Clackamas, Luckiamute, and Santiam
May - June 1948 Columbia River Rain on snow; destruction of the City of Vanport
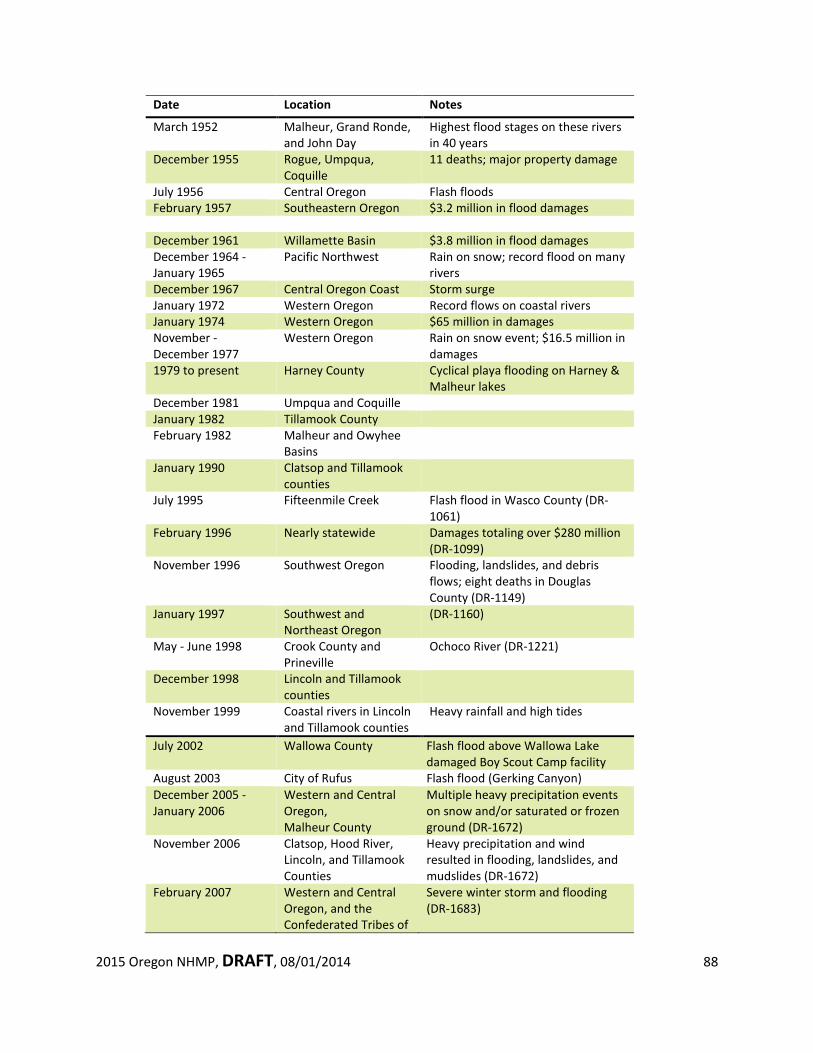
2015 Oregon NHMP, DRAFT, 08/01/2014 88
Date
Location Notes
March 1952 Malheur, Grand Ronde, and John Day
Highest flood stages on these rivers in 40 years
December 1955 Rogue, Umpqua, Coquille
11 deaths; major property damage
July 1956 Central Oregon Flash floods February 1957 Southeastern Oregon $3.2 million in flood damages December 1961 Willamette Basin $3.8 million in flood damages December 1964 - January 1965
Pacific Northwest Rain on snow; record flood on many rivers
December 1967 Central Oregon Coast Storm surge January 1972 Western Oregon Record flows on coastal rivers January 1974 Western Oregon $65 million in damages November - December 1977
Western Oregon Rain on snow event; $16.5 million in damages
1979 to present Harney County Cyclical playa flooding on Harney & Malheur lakes
December 1981 Umpqua and Coquille January 1982 Tillamook County February 1982 Malheur and Owyhee
Basins
January 1990 Clatsop and Tillamook counties
July 1995 Fifteenmile Creek Flash flood in Wasco County (DR-1061)
February 1996 Nearly statewide Damages totaling over $280 million (DR-1099)
November 1996 Southwest Oregon Flooding, landslides, and debris flows; eight deaths in Douglas County (DR-1149)
January 1997 Southwest and Northeast Oregon
(DR-1160)
May - June 1998 Crook County and Prineville
Ochoco River (DR-1221)
December 1998 Lincoln and Tillamook counties
November 1999 Coastal rivers in Lincoln and Tillamook counties
Heavy rainfall and high tides
July 2002 Wallowa County Flash flood above Wallowa Lake damaged Boy Scout Camp facility
August 2003 City of Rufus Flash flood (Gerking Canyon) December 2005 - January 2006
Western and Central Oregon, Malheur County
Multiple heavy precipitation events on snow and/or saturated or frozen ground (DR-1672)
November 2006 Clatsop, Hood River, Lincoln, and Tillamook Counties
Heavy precipitation and wind resulted in flooding, landslides, and mudslides (DR-1672)
February 2007 Western and Central Oregon, and the Confederated Tribes of
Severe winter storm and flooding (DR-1683)
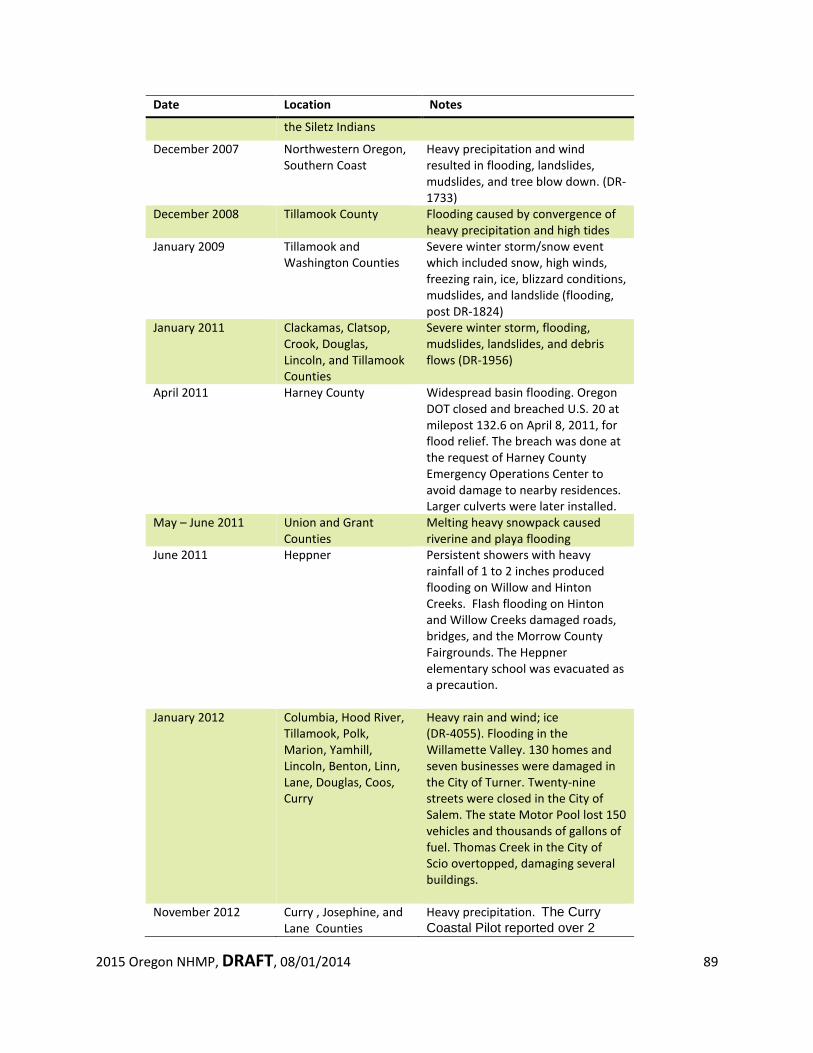
2015 Oregon NHMP, DRAFT, 08/01/2014 89
Date
Location Notes
the Siletz Indians
December 2007 Northwestern Oregon, Southern Coast
Heavy precipitation and wind resulted in flooding, landslides, mudslides, and tree blow down. (DR-1733)
December 2008 Tillamook County Flooding caused by convergence of heavy precipitation and high tides
January 2009 Tillamook and Washington Counties
Severe winter storm/snow event which included snow, high winds, freezing rain, ice, blizzard conditions, mudslides, and landslide (flooding, post DR-1824)
January 2011 Clackamas, Clatsop, Crook, Douglas, Lincoln, and Tillamook Counties
Severe winter storm, flooding, mudslides, landslides, and debris flows (DR-1956)
April 2011 Harney County Widespread basin flooding. Oregon DOT closed and breached U.S. 20 at milepost 132.6 on April 8, 2011, for flood relief. The breach was done at the request of Harney County Emergency Operations Center to avoid damage to nearby residences. Larger culverts were later installed.
May – June 2011 Union and Grant Counties
Melting heavy snowpack caused riverine and playa flooding
June 2011 Heppner Persistent showers with heavy rainfall of 1 to 2 inches produced flooding on Willow and Hinton Creeks. Flash flooding on Hinton and Willow Creeks damaged roads, bridges, and the Morrow County Fairgrounds. The Heppner elementary school was evacuated as a precaution.
January 2012 Columbia, Hood River, Tillamook, Polk, Marion, Yamhill, Lincoln, Benton, Linn, Lane, Douglas, Coos, Curry
Heavy rain and wind; ice (DR-4055). Flooding in the Willamette Valley. 130 homes and seven businesses were damaged in the City of Turner. Twenty-nine streets were closed in the City of Salem. The state Motor Pool lost 150 vehicles and thousands of gallons of fuel. Thomas Creek in the City of Scio overtopped, damaging several buildings.
November 2012 Curry , Josephine, and Lane Counties
Heavy precipitation. The Curry Coastal Pilot reported over 2
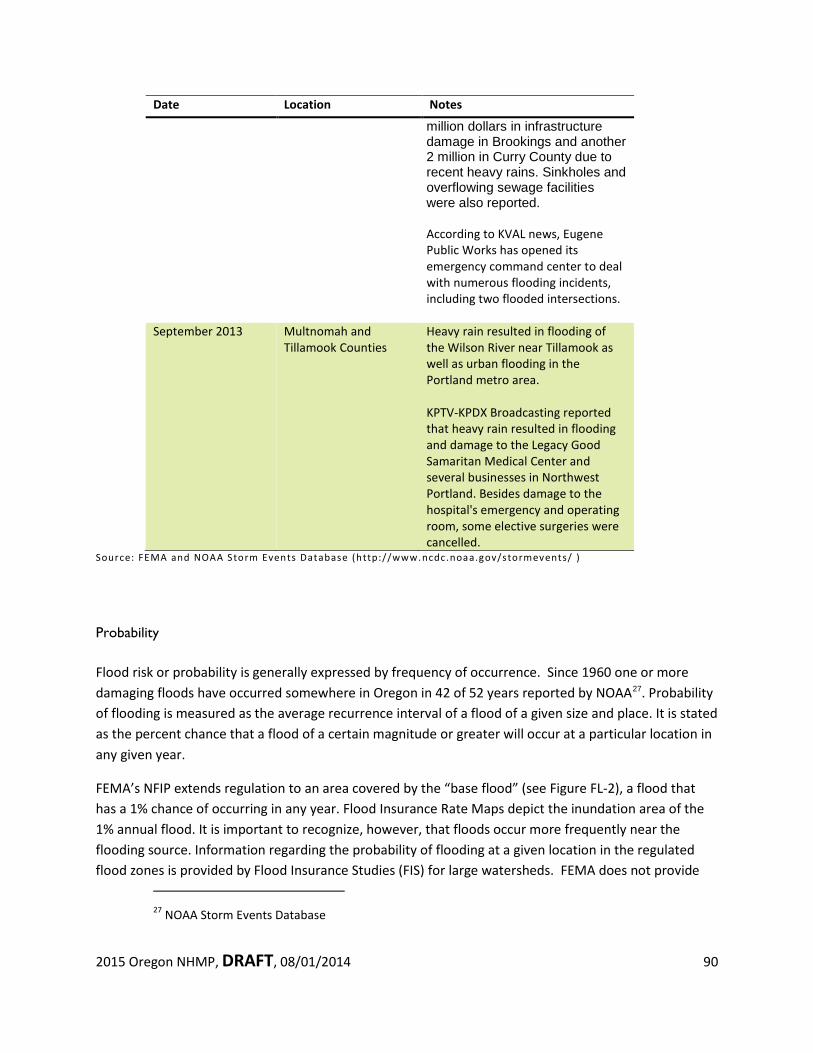
2015 Oregon NHMP, DRAFT, 08/01/2014 90
Date
Location Notes
million dollars in infrastructure damage in Brookings and another 2 million in Curry County due to recent heavy rains. Sinkholes and overflowing sewage facilities were also reported. According to KVAL news, Eugene Public Works has opened its emergency command center to deal with numerous flooding incidents, including two flooded intersections.
September 2013 Multnomah and Tillamook Counties
Heavy rain resulted in flooding of the Wilson River near Tillamook as well as urban flooding in the Portland metro area. KPTV-KPDX Broadcasting reported that heavy rain resulted in flooding and damage to the Legacy Good Samaritan Medical Center and several businesses in Northwest Portland. Besides damage to the hospital's emergency and operating room, some elective surgeries were cancelled.
Source: FEMA and NOAA Storm Events Database (http://www.ncdc.noaa.gov/stormevents/ )
Probability
Flood risk or probability is generally expressed by frequency of occurrence. Since 1960 one or more damaging floods have occurred somewhere in Oregon in 42 of 52 years reported by NOAA27. Probability of flooding is measured as the average recurrence interval of a flood of a given size and place. It is stated as the percent chance that a flood of a certain magnitude or greater will occur at a particular location in any given year.
FEMA’s NFIP extends regulation to an area covered by the “base flood” (see Figure FL-2), a flood that has a 1% chance of occurring in any year. Flood Insurance Rate Maps depict the inundation area of the 1% annual flood. It is important to recognize, however, that floods occur more frequently near the flooding source. Information regarding the probability of flooding at a given location in the regulated flood zones is provided by Flood Insurance Studies (FIS) for large watersheds. FEMA does not provide
27 NOAA Storm Events Database
2015 Oregon NHMP, DRAFT, 08/01/2014 91
information about floods emanating from small watersheds (less than one square mile), or for floods caused by local drainage issues. Probabilities for these types of flood are, as a result, difficult to obtain.
The majority of flood studies in Oregon were conducted in the late 1970s and early 1980s. These studies represent flood risk at a point in time and don’t reflect changing conditions in the watershed. Many of Oregon’s metropolitan areas have significantly developed during the past twenty years resulting in increased impervious surface which causes higher velocities and increased volume of water. While FEMA’s Map Modernization Program did result in updated FIRMs for 14 Counties, many of these maps were produced using models from old flood insurance studies. Whether or by how much these old models underestimate current flood potential is unknown.
Despite the shortcomings of NFIP Flood Insurance Rate Maps, most Oregon communities exclusively rely on them to characterize the risk of flooding. Some jurisdictions use their own flood hazard maps derived from aerial photos of past flood events in conjunction with FEMA FIRMs to better reflect their communities’ flood risks. Others have implemented a higher regulatory standard to address changing conditions; for example Metro's balanced cut and fill requirements, and Tillamook County's and the City of Vernonia’s requirement that new homes and substantial improvements to existing homes be elevated at least three feet above base flood elevation (BFE).28 (See inset for a definition of substantial improvement.)
Channel migration associated with flooding also can be identified with respect to a probability of migration over a period of 100 years. Historic aerial photos are catalogued to calculate past rates of migration which are then projected out to define a channel migration zone. Avulsion (i.e. channel shifting) zones, which are a component of the larger channel migration zone, are an exception to the migration rate approach. Areas of likely avulsion are identified by professional judgment of a fluvial geomorphologist, using high-resolution topographic data, aerial photos, and field observation.
Identification of channel migration susceptibility at the regional level is described in terms of low, moderate, and high relative probabilities. Probability is determined by assessing physiographic parameters of channel gradient, confinement, and pattern.
28 BFE is the projected depth of floodwater at the peak of a base flood, generally measured as feet above sea level.
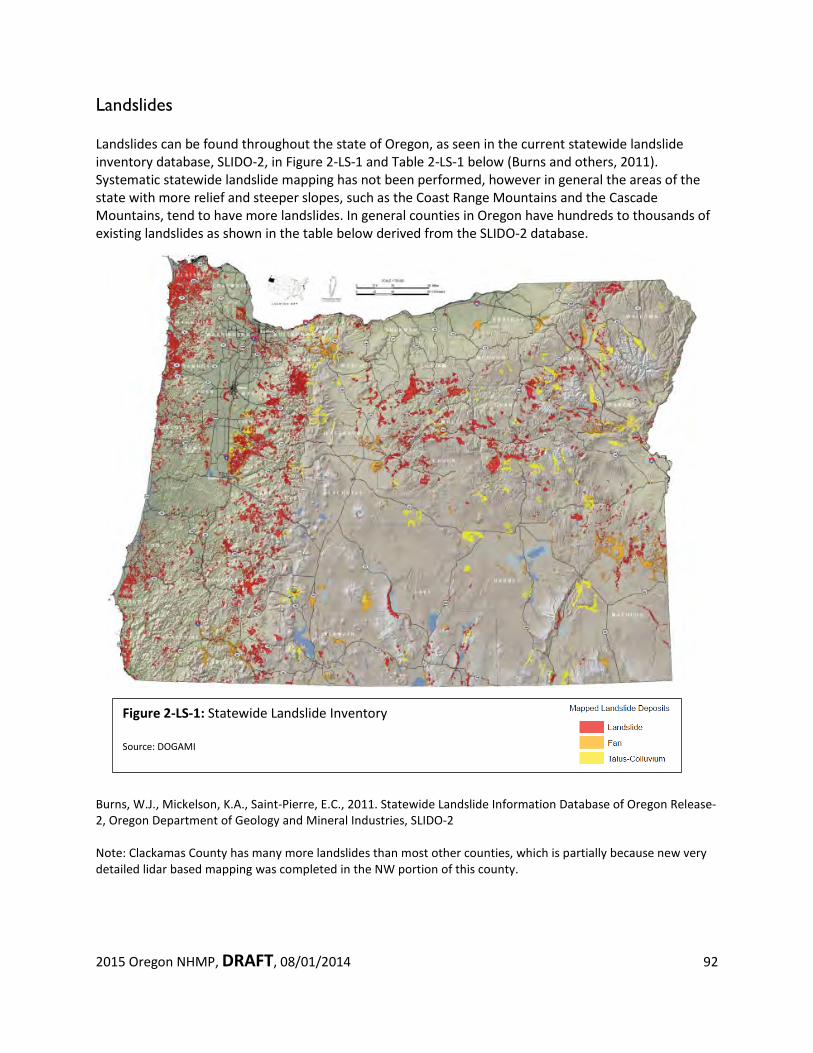
2015 Oregon NHMP, DRAFT, 08/01/2014 92
Landslides Landslides can be found throughout the state of Oregon, as seen in the current statewide landslide inventory database, SLIDO-2, in Figure 2-LS-1 and Table 2-LS-1 below (Burns and others, 2011). Systematic statewide landslide mapping has not been performed, however in general the areas of the state with more relief and steeper slopes, such as the Coast Range Mountains and the Cascade Mountains, tend to have more landslides. In general counties in Oregon have hundreds to thousands of existing landslides as shown in the table below derived from the SLIDO-2 database.
Burns, W.J., Mickelson, K.A., Saint-Pierre, E.C., 2011. Statewide Landslide Information Database of Oregon Release-2, Oregon Department of Geology and Mineral Industries, SLIDO-2 Note: Clackamas County has many more landslides than most other counties, which is partially because new very detailed lidar based mapping was completed in the NW portion of this county.
Figure 2-LS-1: Statewide Landslide Inventory Source: DOGAMI
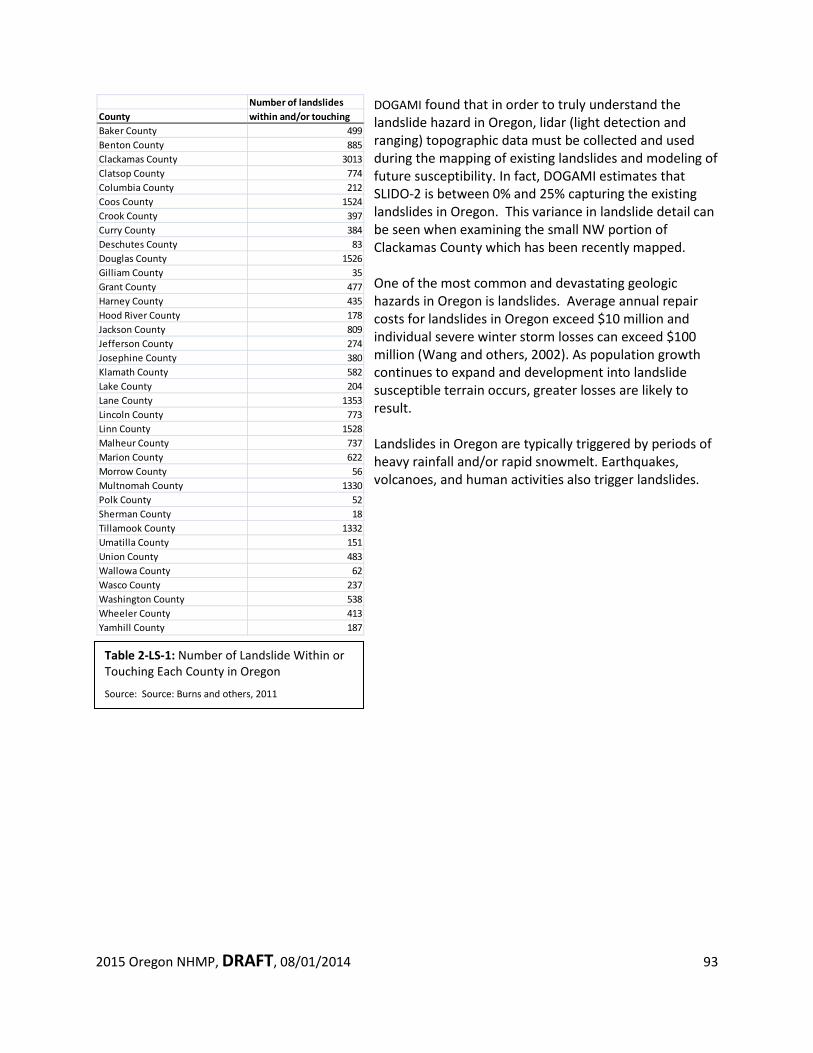
2015 Oregon NHMP, DRAFT, 08/01/2014 93
Number of landslidesCounty within and/or touchingBaker County 499Benton County 885Clackamas County 3013Clatsop County 774Columbia County 212Coos County 1524Crook County 397Curry County 384Deschutes County 83Douglas County 1526Gilliam County 35Grant County 477Harney County 435Hood River County 178Jackson County 809Jefferson County 274Josephine County 380Klamath County 582Lake County 204Lane County 1353Lincoln County 773Linn County 1528Malheur County 737Marion County 622Morrow County 56Multnomah County 1330Polk County 52Sherman County 18Tillamook County 1332Umatilla County 151Union County 483Wallowa County 62Wasco County 237Washington County 538Wheeler County 413Yamhill County 187
Table 2-LS-1: Number of Landslide Within or Touching Each County in Oregon
Source: Source: Burns and others, 2011
DOGAMI found that in order to truly understand the landslide hazard in Oregon, lidar (light detection and ranging) topographic data must be collected and used during the mapping of existing landslides and modeling of future susceptibility. In fact, DOGAMI estimates that SLIDO-2 is between 0% and 25% capturing the existing landslides in Oregon. This variance in landslide detail can be seen when examining the small NW portion of Clackamas County which has been recently mapped. One of the most common and devastating geologic hazards in Oregon is landslides. Average annual repair costs for landslides in Oregon exceed $10 million and individual severe winter storm losses can exceed $100 million (Wang and others, 2002). As population growth continues to expand and development into landslide susceptible terrain occurs, greater losses are likely to result. Landslides in Oregon are typically triggered by periods of heavy rainfall and/or rapid snowmelt. Earthquakes, volcanoes, and human activities also trigger landslides.
2015 Oregon NHMP, DRAFT, 08/01/2014 94
There are 3 main factors that influence an area’s susceptibility to landslides: geometry of the slope, geologic material, and water. Certain geologic formations are more susceptible to landslides than others. In general, locations with steep slopes are most susceptible to landslides, and the landslides occurring on steep slopes tend to move more rapidly and therefore may pose life safety risks.
Wang, Y., Summers, R.D., and Hofmeister, R.J., 2002, Landslide loss estimation pilot project in Oregon: Oregon Department of Geology and Mineral Industries Open-File Report O-02-05, 23 p.
Analysis and Characterization
The term landslide encompasses a wide range of geologic processes and a variety of nomenclatures that can lend itself to confusion. The general term landslide refers to a range of mass movement including rock falls, debris flows, earth slides, and other mass movements. One very important thing to understand is the fact that all landslides have different frequencies of movements, triggering conditions, and very different resulting hazards. All landslides can be classified into one the following six types of movements: 1) slides, 2) flows, 3) spreads, 4) topples, 5) falls, 6) complex. Most slope failures are complex combinations of these distinct types, but the generalized groupings provide a useful means for framing discussion of the type of hazard associated with the landslide, the landslide characteristics, identification methods, and potential mitigation alternatives.
El Nino Southern Oscillation and Effects on Landslides The strongest impacts of intra-seasonal variability on the U.S. occur during the winter months over the western U.S. During the winter this region receives the bulk of its annual precipitation. Storms in this region can last for several days or more and are often accompanied by persistent atmospheric circulation features. Of particular concern are the extreme precipitation events which are linked to flooding and landslide. There is strong evidence for a linkage between weather and climate in this region from studies that have related the El Niño-Southern Oscillation (ENSO) to regional precipitation variability. From these studies it is known that extreme precipitation events can occur at all phases of the El Niño-Southern Oscillation (ENSO) cycle, but the largest fraction of these events occur during La Niña episodes and during ENSO-neutral winters. During La Niña episodes much of the Pacific Northwest experiences increased storminess, increased precipitation and more overall days with measurable precipitation. The risk of flooding and rain-induced landslides (and debris flows) in this region can be related to La Niña episodes. Source: NOAA/Climate Prediction Center http://www.cpc.noaa.gov/products/intraseasonal/intraseasonal_faq.html#usimpacts
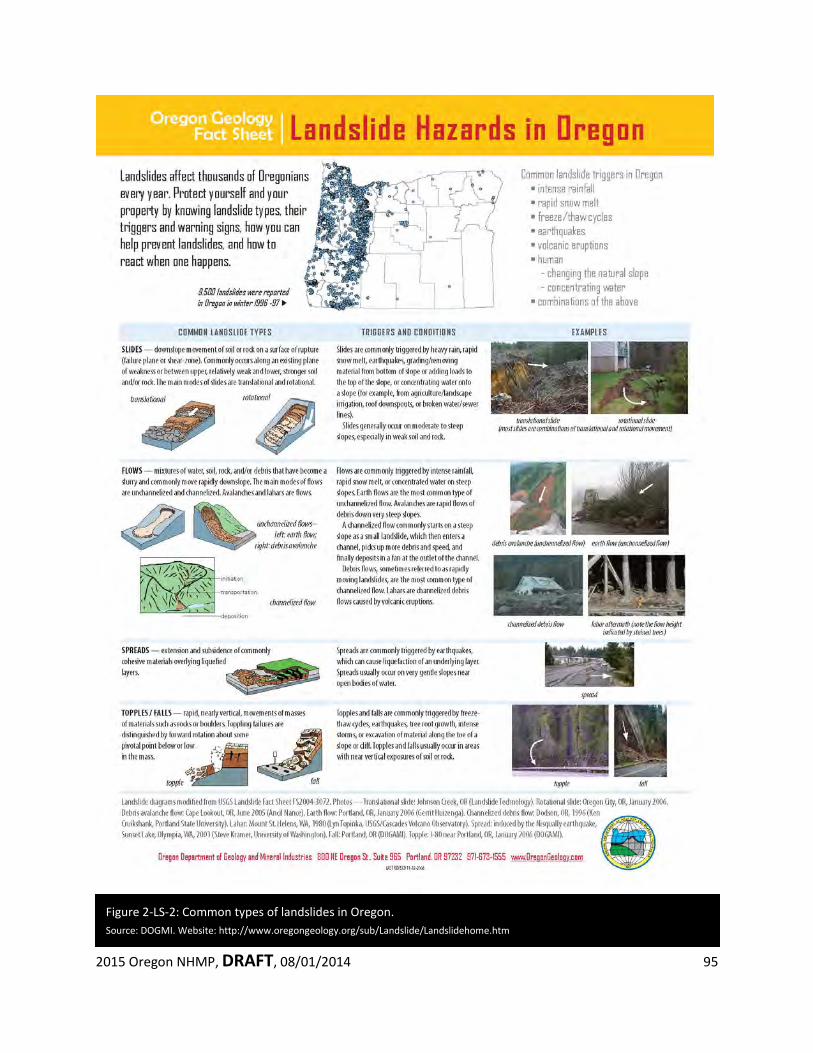
2015 Oregon NHMP, DRAFT, 08/01/2014 95
Figure 2-LS-2: Common types of landslides in Oregon. Source: DOGMI. Website: http://www.oregongeology.org/sub/Landslide/Landslidehome.htm
2015 Oregon NHMP, DRAFT, 08/01/2014 96
These types of movements can be combined with other aspects of the landslide such as type of material, rate of movement, depth of failure, and water content for a better understanding of the type of landslide.
One potentially life threatening type of landslide is the channelized debris flow or “rapidly moving landslide” which are flows that initiate upslope, move into or transport down a steep channel (or drainage) and deposit material, usually at the mouth of the channel. Debris flows are also commonly initiated by other types of landslides that occur on slopes near a channel. They can also initiate within the channel in areas of accelerated erosion during heavy rainfall or snowmelt. Rapidly moving landslides have caused most of the recent landslide related injuries and deaths in Oregon. Debris flows or rapidly moving landslides caused eight deaths in Oregon in 1996 following La Niña storms.
Areas that have failed in the past often remain in a weakened state, and many of these areas tend to fail repeatedly over time. This commonly leads to distinctive geomorphology that can be used to identify landslide areas, although over time the geomorphic expression may become subtle, making the landslide difficult to identify. Other types of landslides tend to occur in the same locations and produce distinctive geomorphology, such as channelized debris flows, which form a fan at the mouth of the channel after repeated events. This is also true for the talus slopes, which form after repeated rock fall has taken place in an area.
Previously impacted areas are particularly important to identify, as they may pose a substantial hazard for future instability and help identify areas that are susceptible to future events. Large, slow moving landslides frequently cause significant property damage, but are far less likely to result in serious injuries. Several examples are the subdivision landslide in Kelso, Washington, the slide at The Capes development in Tillamook County, and the apartment complex in Oregon City.
The velocity of landslides varies from imperceptible to over 35 miles per hour. Some volcanic induced landslides have been known to travel between 50 to 150 miles per hour. On less steep slopes, landslides tend to move slowly and cause damage gradually. Debris flows typically start on steep hillsides as shallow landslides, enter a channel, then liquefy and accelerate. Canyon bottoms, stream channels, and outlets of canyons can be particularly hazardous. Landslides can move long distances, sometimes as much as several miles. The Dodson debris flows in 1996 started high on Columbia River Gorge cliffs, and traveled down steep canyons to form debris fans in the Dodson-Warrendale area. Landslide recurrence interval is highly variable. Some large landslides move continuously at very slow rates. Others move periodically during wet periods. Very steeply sloped areas can have relatively high landslide recurrence intervals (10 to 500 years on an initiation site basis). Since debris flows can be initiated at many sites over a watershed, in some cases recurrence intervals can be less than ten years. Slope alterations can greatly affect recurrence intervals for all types of landslides, and also cause landslides in areas otherwise not susceptible. Most slopes in Western Oregon steeper than 30 degrees (~60%) have a risk of rapidly moving landslide activity regardless of geologic unit. Areas directly below these slopes in the paths of potential landslides are at risk as well.
2015 Oregon NHMP, DRAFT, 08/01/2014 97
Based on the Oregon Department of Forestry Storm Impacts Study, the highest debris flow hazard occurs in Western Lane County, Western Douglas County, and Coos County. The combination of steep slopes and geologic formation (sedimentary rock units) contributes to the increased hazard. The debris flow hazard is also high in much of the Coast Range and Cascade Mountains and in the Columbia River Gorge. Deep landslides are generally defined as having a failure plane within the regional bedrock unit (generally greater than 15 feet deep), whereas the failure plane of shallow landslides is commonly between the thin soil mantle and the top of the bedrock. Deep landslide hazard is high in parts of the Coast Range. Deep landslides are fairly common in pyroclastic rock units of the Western Cascade Mountains, and in fine-grained sedimentary rock units of the Coast Range. Deep landslides also occur in semi-consolidated sedimentary rocks at or near the Oregon coast particularly around Newport, Lincoln County and Tillamook County, and in the Troutdale Formation around the Portland area. Infrequent very large landslides and debris flows may occur in any of the larger mountain ranges or in deep gorges throughout Oregon. During 1996 and 1997, heavier than normal rains caused over 700 landslides within the Portland Metropolitan region, which totaled over $40 million for mitigation (Burns et al., 1998). In the City of Portland, 17 homes were completely destroyed and 64 were badly damaged. There were no serious injuries associated with the landslides in Portland or in other urban areas within Oregon during the 1996 storms. The Oregon Department of Forestry Storm Impacts Study estimated that tens of thousands of landslides occurred on steep slopes in the forests of Western Oregon during 1996. The Oregon Department of Geology and Mineral Industries Slope Failures in Oregon inventoried thousands of reports of landslides across the state resulting from the 1996-1997 storms. There are a significant number of locations in Oregon that are impacted frequently (every 10 to 100 years) by dangerous landslides. The number of injuries and deaths in the future will be directly related to vulnerability: the more people in these areas, the greater the risk of injury or death.
Burns, S.F., Burns, W.J., James, D.H., and Hinkle, J.C., 1998. Landslides in Portland, Oregon: Metropolitan Area Resulting from the Storm of February 1996: Inventory Map, Database, and Evaluation. METRO Natural Hazards Publication 905828, p.1-65.
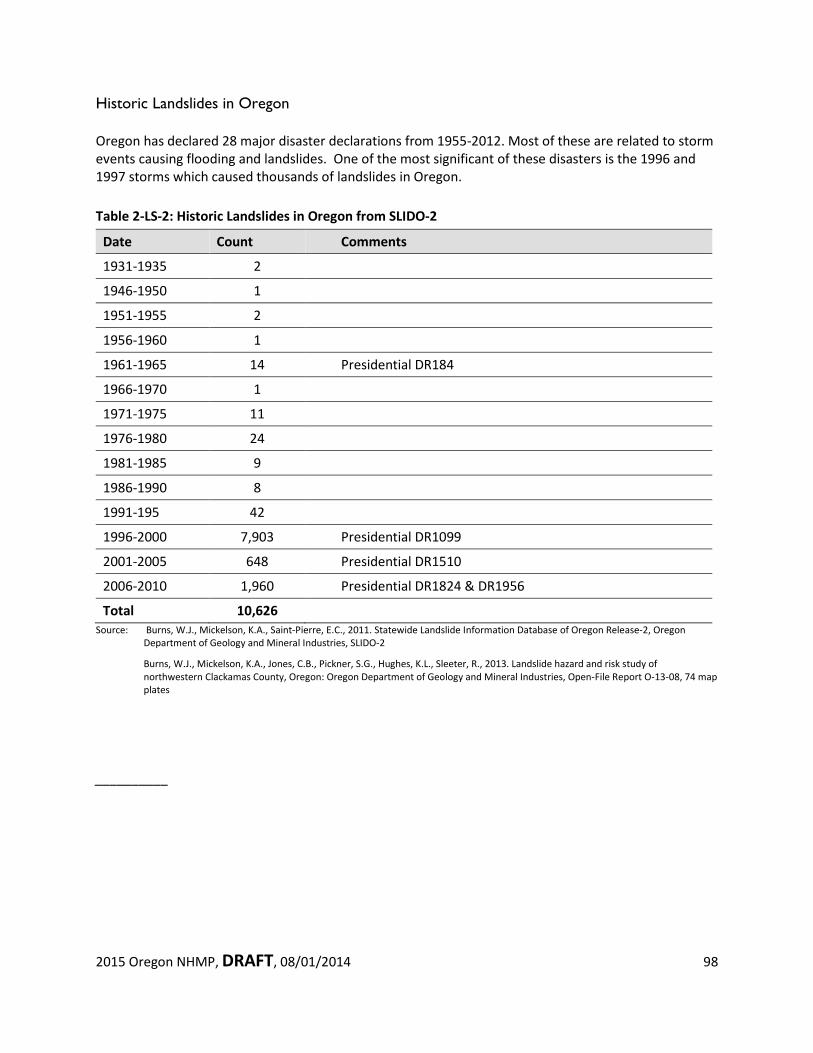
2015 Oregon NHMP, DRAFT, 08/01/2014 98
Historic Landslides in Oregon Oregon has declared 28 major disaster declarations from 1955-2012. Most of these are related to storm events causing flooding and landslides. One of the most significant of these disasters is the 1996 and 1997 storms which caused thousands of landslides in Oregon. Table 2-LS-2: Historic Landslides in Oregon from SLIDO-2
Date Count Comments
1931-1935 2
1946-1950 1
1951-1955 2
1956-1960 1
1961-1965 14 Presidential DR184
1966-1970 1
1971-1975 11
1976-1980 24
1981-1985 9
1986-1990 8
1991-195 42
1996-2000 7,903 Presidential DR1099
2001-2005 648 Presidential DR1510
2006-2010 1,960 Presidential DR1824 & DR1956
Total 10,626 Source: Burns, W.J., Mickelson, K.A., Saint-Pierre, E.C., 2011. Statewide Landslide Information Database of Oregon Release-2, Oregon
Department of Geology and Mineral Industries, SLIDO-2
Burns, W.J., Mickelson, K.A., Jones, C.B., Pickner, S.G., Hughes, K.L., Sleeter, R., 2013. Landslide hazard and risk study of northwestern Clackamas County, Oregon: Oregon Department of Geology and Mineral Industries, Open-File Report O-13-08, 74 map plates
__________
2015 Oregon NHMP, DRAFT, 08/01/2014 99
Probability Landslides are found in every county in Oregon as shown in the Table 2-LS-1. There is a 100% probability of landslides occurring in Oregon in the future. Although we do not know exactly where and when they will occur, they are more likly to happen in the general areas where landslides have occurred in the past. Also, they will likely occur during heavy rainfall events or during a future earthquake. In order to reduce losses from landslides, areas of landslide hazard must first be identified. The first step in landslide hazard identification is to create an inventory of past (historic and prehistoric) landslides. Once this inventory is created, it can be used to create susceptibility maps which display areas that are likely to have landslides in the future. Once the landslide hazards are identified on inventory and susceptibility maps, the risk can be quantified, mitigation projects prioritized and implemented. In 2005, DOGAMI began a collaborative landslide research program with the U.S. Geological Survey (USGS) Landslide Hazards Program to identify and understand landslides in Oregon. In order to begin the extensive undertaking of mapping existing landslides throughout Oregon, a pilot project area was selected to compare remote sensing data/images for effectiveness. The remote sensing data sets compared included (Burns, 2007): (Figure 2-LS-3) 1. 30 m (98 ft) Digital elevation model (DEM) from the Shuttle Radar Topography Mission 2. 10 m (33 ft) DEM derived from the USGS topographic quadrangles 3. Photogrammatic and ground based 1.5 m (5 ft) interval contour data 4. Stereo aerial photographs from 1936 to 2000 5. Lidar imagery with an average of 1 data point per m2 (3.2 ft) and with a vertical accuracy of about 5
cm (6 in)
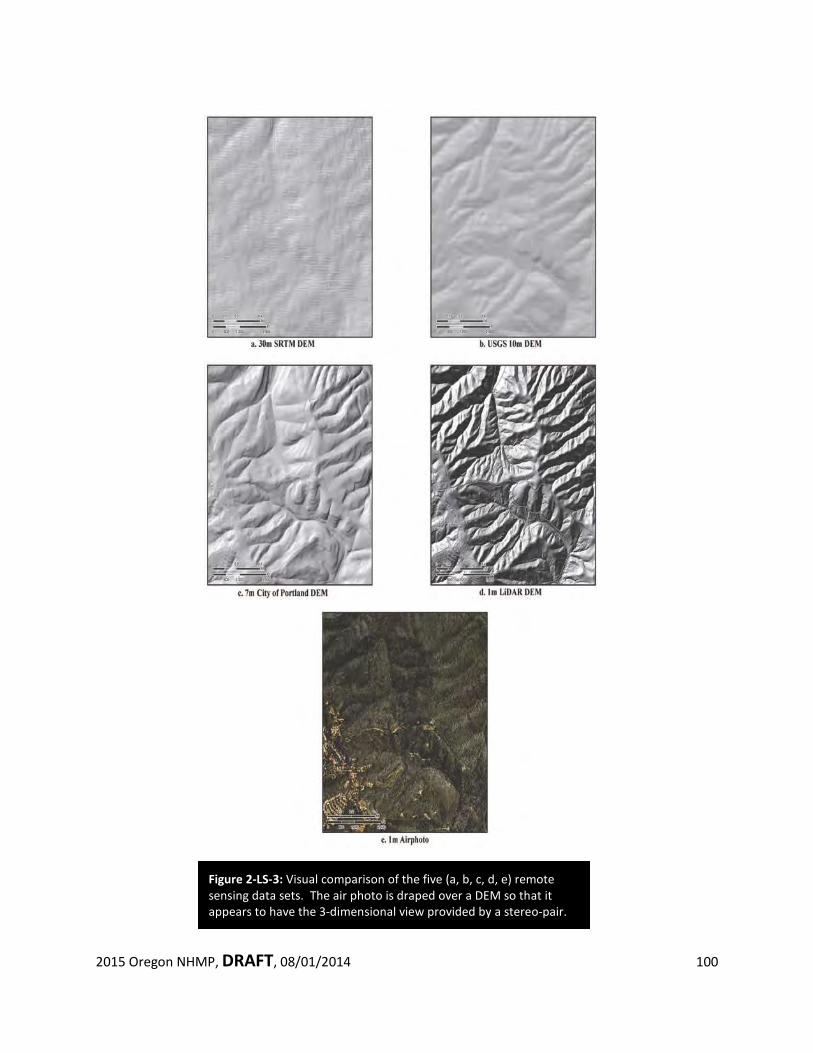
2015 Oregon NHMP, DRAFT, 08/01/2014 100
Figure 2-LS-3: Visual comparison of the five (a, b, c, d, e) remote sensing data sets. The air photo is draped over a DEM so that it appears to have the 3-dimensional view provided by a stereo-pair.
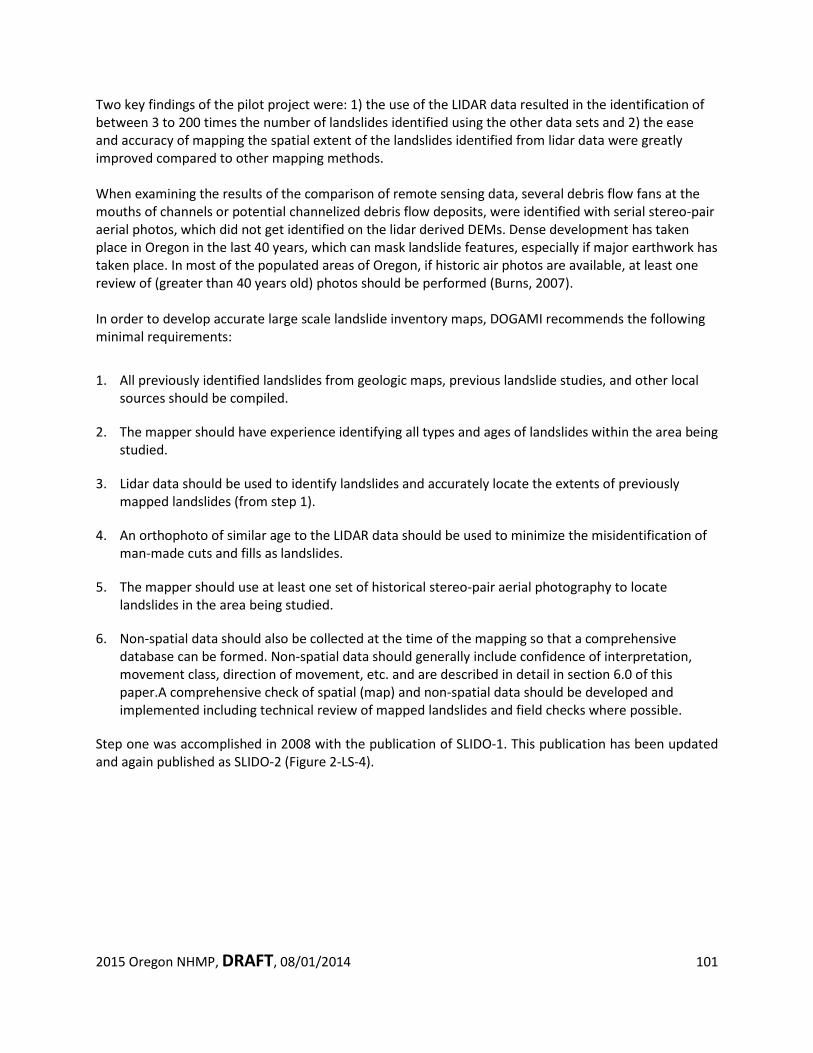
2015 Oregon NHMP, DRAFT, 08/01/2014 101
Two key findings of the pilot project were: 1) the use of the LIDAR data resulted in the identification of between 3 to 200 times the number of landslides identified using the other data sets and 2) the ease and accuracy of mapping the spatial extent of the landslides identified from lidar data were greatly improved compared to other mapping methods. When examining the results of the comparison of remote sensing data, several debris flow fans at the mouths of channels or potential channelized debris flow deposits, were identified with serial stereo-pair aerial photos, which did not get identified on the lidar derived DEMs. Dense development has taken place in Oregon in the last 40 years, which can mask landslide features, especially if major earthwork has taken place. In most of the populated areas of Oregon, if historic air photos are available, at least one review of (greater than 40 years old) photos should be performed (Burns, 2007). In order to develop accurate large scale landslide inventory maps, DOGAMI recommends the following minimal requirements:
1. All previously identified landslides from geologic maps, previous landslide studies, and other local sources should be compiled.
2. The mapper should have experience identifying all types and ages of landslides within the area being studied.
3. Lidar data should be used to identify landslides and accurately locate the extents of previously mapped landslides (from step 1).
4. An orthophoto of similar age to the LIDAR data should be used to minimize the misidentification of man-made cuts and fills as landslides.
5. The mapper should use at least one set of historical stereo-pair aerial photography to locate landslides in the area being studied.
6. Non-spatial data should also be collected at the time of the mapping so that a comprehensive database can be formed. Non-spatial data should generally include confidence of interpretation, movement class, direction of movement, etc. and are described in detail in section 6.0 of this paper.A comprehensive check of spatial (map) and non-spatial data should be developed and implemented including technical review of mapped landslides and field checks where possible.
Step one was accomplished in 2008 with the publication of SLIDO-1. This publication has been updated and again published as SLIDO-2 (Figure 2-LS-4).
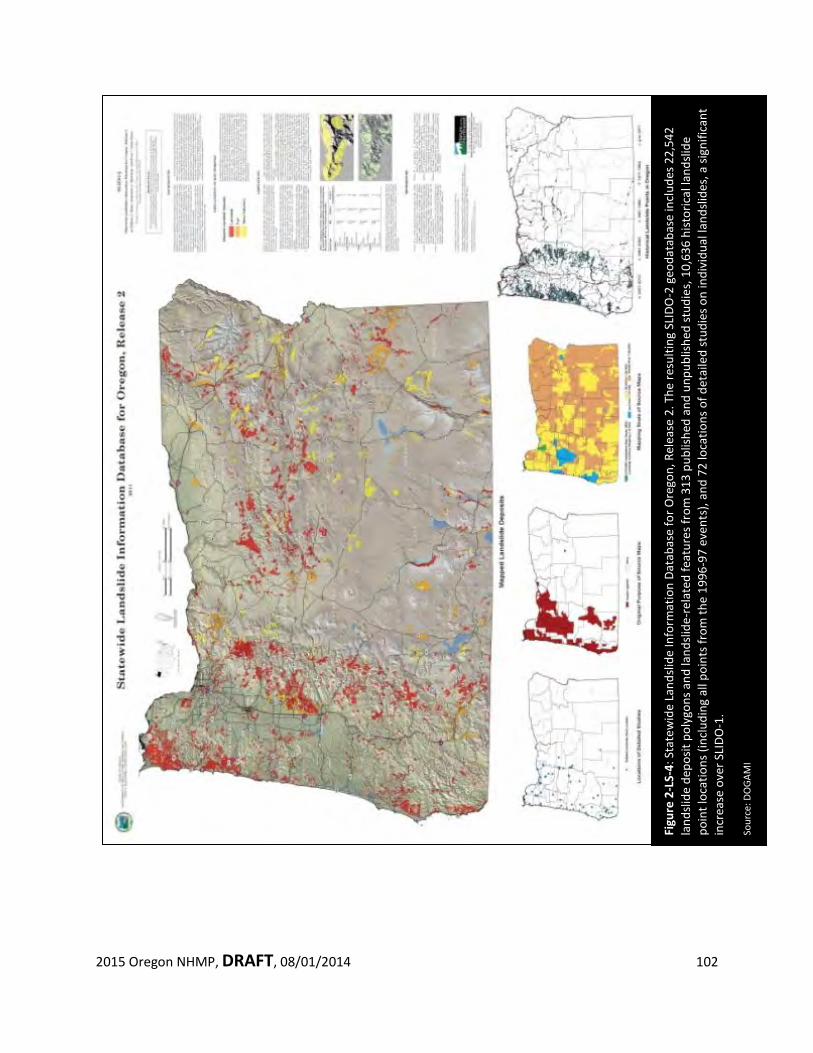
2015 Oregon NHMP, DRAFT, 08/01/2014 102
Figu
re 2
-LS-
4: S
tate
wid
e La
ndsli
de In
form
atio
n Da
taba
se fo
r Ore
gon,
Rel
ease
2. T
he re
sulti
ng S
LIDO
-2 g
eoda
taba
se in
clud
es 2
2,54
2 la
ndsli
de d
epos
it po
lygo
ns a
nd la
ndsli
de-r
elat
ed fe
atur
es fr
om 3
13 p
ublis
hed
and
unpu
blish
ed st
udie
s, 1
0,63
6 hi
stor
ical
land
slide
po
int l
ocat
ions
(inc
ludi
ng a
ll po
ints
from
the
1996
-97
even
ts),
and
72 lo
catio
ns o
f det
aile
d st
udie
s on
indi
vidu
al la
ndsli
des,
a si
gnifi
cant
in
crea
se o
ver S
LIDO
-1.
So
urce
: DO
GAM
I
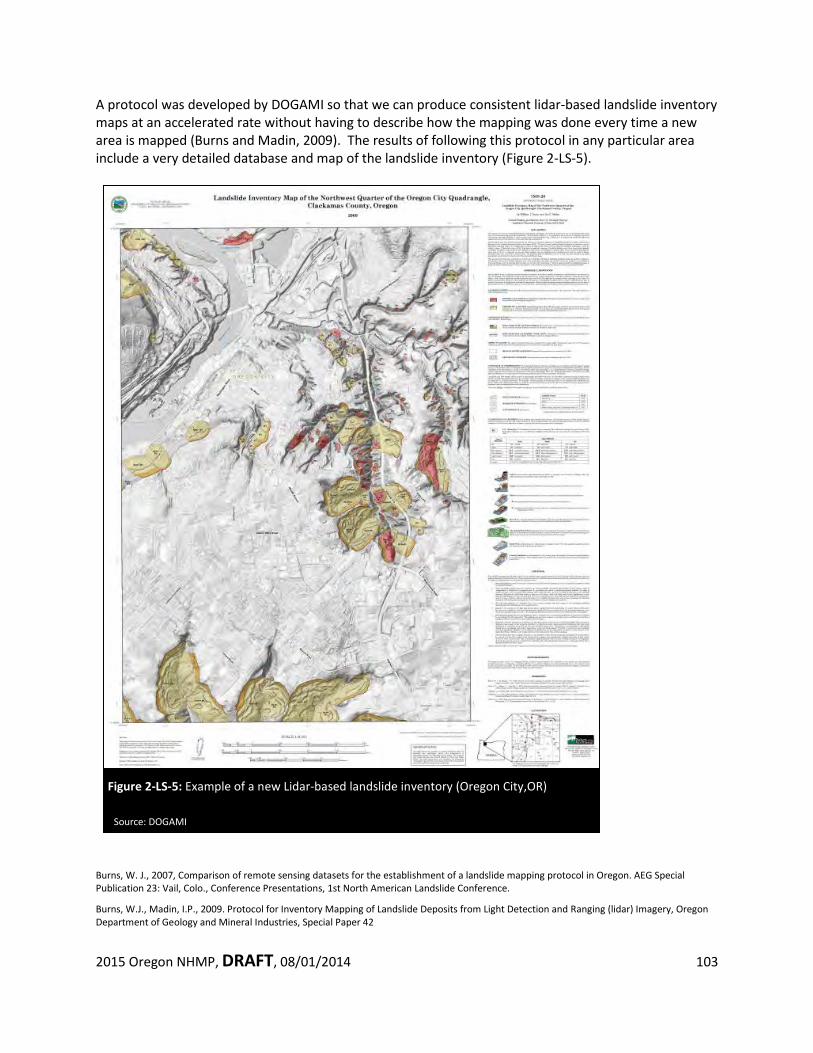
2015 Oregon NHMP, DRAFT, 08/01/2014 103
Figure 2-LS-5: Example of a new Lidar-based landslide inventory (Oregon City,OR)
Source: DOGAMI
A protocol was developed by DOGAMI so that we can produce consistent lidar-based landslide inventory maps at an accelerated rate without having to describe how the mapping was done every time a new area is mapped (Burns and Madin, 2009). The results of following this protocol in any particular area include a very detailed database and map of the landslide inventory (Figure 2-LS-5).
Burns, W. J., 2007, Comparison of remote sensing datasets for the establishment of a landslide mapping protocol in Oregon. AEG Special Publication 23: Vail, Colo., Conference Presentations, 1st North American Landslide Conference.
Burns, W.J., Madin, I.P., 2009. Protocol for Inventory Mapping of Landslide Deposits from Light Detection and Ranging (lidar) Imagery, Oregon Department of Geology and Mineral Industries, Special Paper 42
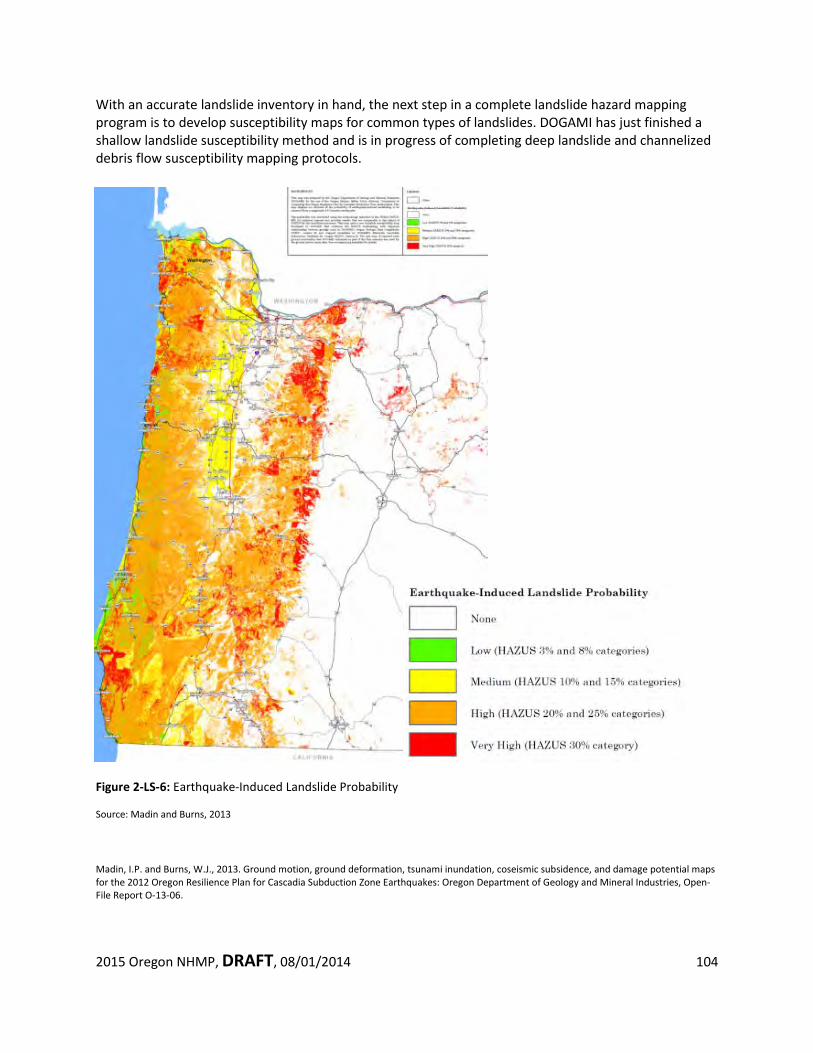
2015 Oregon NHMP, DRAFT, 08/01/2014 104
With an accurate landslide inventory in hand, the next step in a complete landslide hazard mapping program is to develop susceptibility maps for common types of landslides. DOGAMI has just finished a shallow landslide susceptibility method and is in progress of completing deep landslide and channelized debris flow susceptibility mapping protocols.
Figure 2-LS-6: Earthquake-Induced Landslide Probability Source: Madin and Burns, 2013
Madin, I.P. and Burns, W.J., 2013. Ground motion, ground deformation, tsunami inundation, coseismic subsidence, and damage potential maps for the 2012 Oregon Resilience Plan for Cascadia Subduction Zone Earthquakes: Oregon Department of Geology and Mineral Industries, Open-File Report O-13-06.
2015 Oregon NHMP, DRAFT, 08/01/2014 105
Tsunami What is a tsunami?
Tsunamis are a low frequency natural hazard in Oregon and are restricted almost exclusively to coastal areas. Tsunamis are most often caused by the abrupt change in the seafloor accompanying an earthquake (Figure 2-TS-1).The most common sources of the largest tsunamis are earthquakes that occur at subduction zones like the Cascadia Subduction Zone (CSZ), where an oceanic plate descends beneath a continental plate (Figure 2- TS-2). Other important processes that may trigger a tsunami include underwater volcanic eruptions and landslides (includes landslides that start below the water surface and landslides that enter a deep body of water from above the water surface). Tsunamis can travel thousands of miles across ocean basins, so that a particular coastal area may be susceptible to two different types of tsunami hazard caused by:
1) Distant sources across the ocean basin, and
2) Local sources that occur immediately adjacent to a coast.
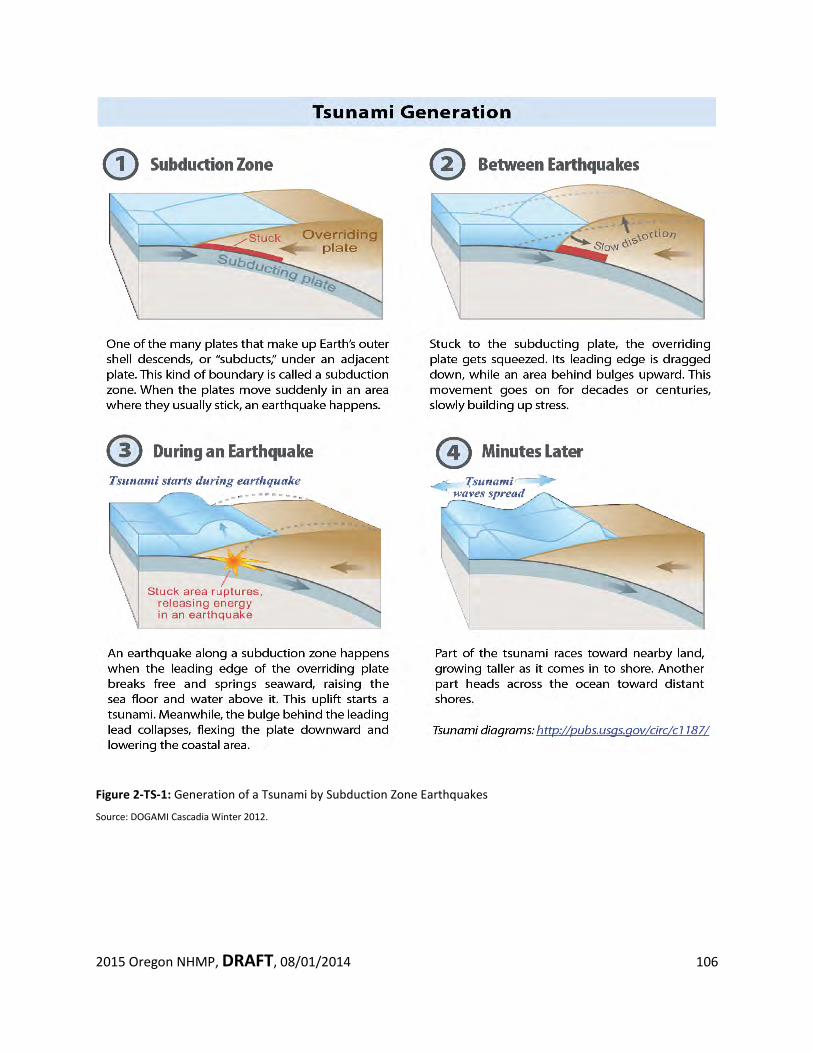
2015 Oregon NHMP, DRAFT, 08/01/2014 106
Figure 2-TS-1: Generation of a Tsunami by Subduction Zone Earthquakes
Source: DOGAMI Cascadia Winter 2012.
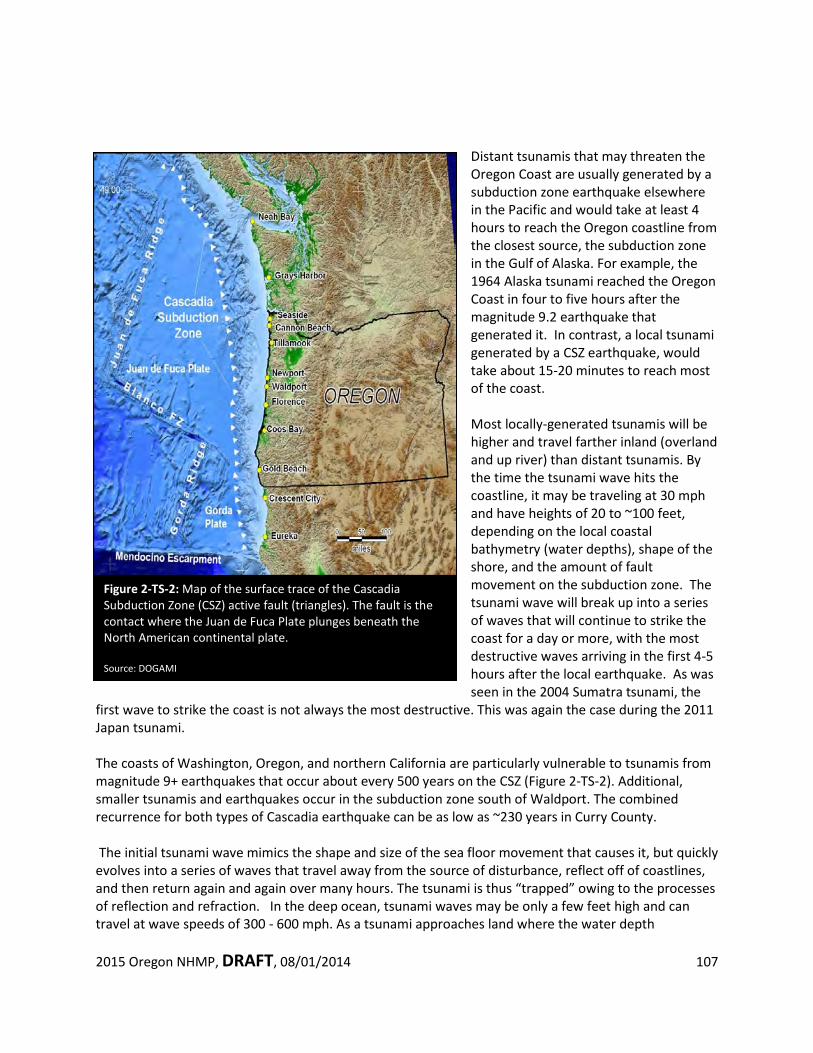
2015 Oregon NHMP, DRAFT, 08/01/2014 107
Distant tsunamis that may threaten the Oregon Coast are usually generated by a subduction zone earthquake elsewhere in the Pacific and would take at least 4 hours to reach the Oregon coastline from the closest source, the subduction zone in the Gulf of Alaska. For example, the 1964 Alaska tsunami reached the Oregon Coast in four to five hours after the magnitude 9.2 earthquake that generated it. In contrast, a local tsunami generated by a CSZ earthquake, would take about 15-20 minutes to reach most of the coast. Most locally-generated tsunamis will be higher and travel farther inland (overland and up river) than distant tsunamis. By the time the tsunami wave hits the coastline, it may be traveling at 30 mph and have heights of 20 to ~100 feet, depending on the local coastal bathymetry (water depths), shape of the shore, and the amount of fault movement on the subduction zone. The tsunami wave will break up into a series of waves that will continue to strike the coast for a day or more, with the most destructive waves arriving in the first 4-5 hours after the local earthquake. As was seen in the 2004 Sumatra tsunami, the
first wave to strike the coast is not always the most destructive. This was again the case during the 2011 Japan tsunami. The coasts of Washington, Oregon, and northern California are particularly vulnerable to tsunamis from magnitude 9+ earthquakes that occur about every 500 years on the CSZ (Figure 2-TS-2). Additional, smaller tsunamis and earthquakes occur in the subduction zone south of Waldport. The combined recurrence for both types of Cascadia earthquake can be as low as ~230 years in Curry County. The initial tsunami wave mimics the shape and size of the sea floor movement that causes it, but quickly evolves into a series of waves that travel away from the source of disturbance, reflect off of coastlines, and then return again and again over many hours. The tsunami is thus “trapped” owing to the processes of reflection and refraction. In the deep ocean, tsunami waves may be only a few feet high and can travel at wave speeds of 300 - 600 mph. As a tsunami approaches land where the water depth
Figure 2-TS-2: Map of the surface trace of the Cascadia Subduction Zone (CSZ) active fault (triangles). The fault is the contact where the Juan de Fuca Plate plunges beneath the North American continental plate. Source: DOGAMI
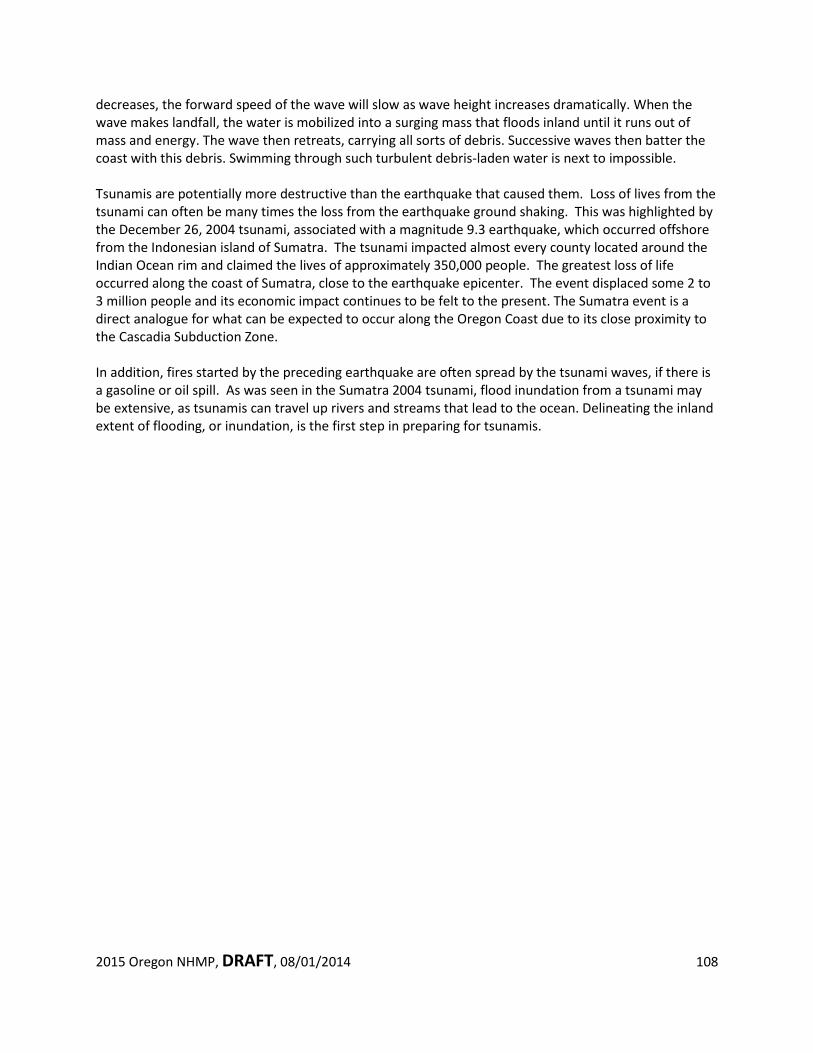
2015 Oregon NHMP, DRAFT, 08/01/2014 108
decreases, the forward speed of the wave will slow as wave height increases dramatically. When the wave makes landfall, the water is mobilized into a surging mass that floods inland until it runs out of mass and energy. The wave then retreats, carrying all sorts of debris. Successive waves then batter the coast with this debris. Swimming through such turbulent debris-laden water is next to impossible. Tsunamis are potentially more destructive than the earthquake that caused them. Loss of lives from the tsunami can often be many times the loss from the earthquake ground shaking. This was highlighted by the December 26, 2004 tsunami, associated with a magnitude 9.3 earthquake, which occurred offshore from the Indonesian island of Sumatra. The tsunami impacted almost every county located around the Indian Ocean rim and claimed the lives of approximately 350,000 people. The greatest loss of life occurred along the coast of Sumatra, close to the earthquake epicenter. The event displaced some 2 to 3 million people and its economic impact continues to be felt to the present. The Sumatra event is a direct analogue for what can be expected to occur along the Oregon Coast due to its close proximity to the Cascadia Subduction Zone. In addition, fires started by the preceding earthquake are often spread by the tsunami waves, if there is a gasoline or oil spill. As was seen in the Sumatra 2004 tsunami, flood inundation from a tsunami may be extensive, as tsunamis can travel up rivers and streams that lead to the ocean. Delineating the inland extent of flooding, or inundation, is the first step in preparing for tsunamis.
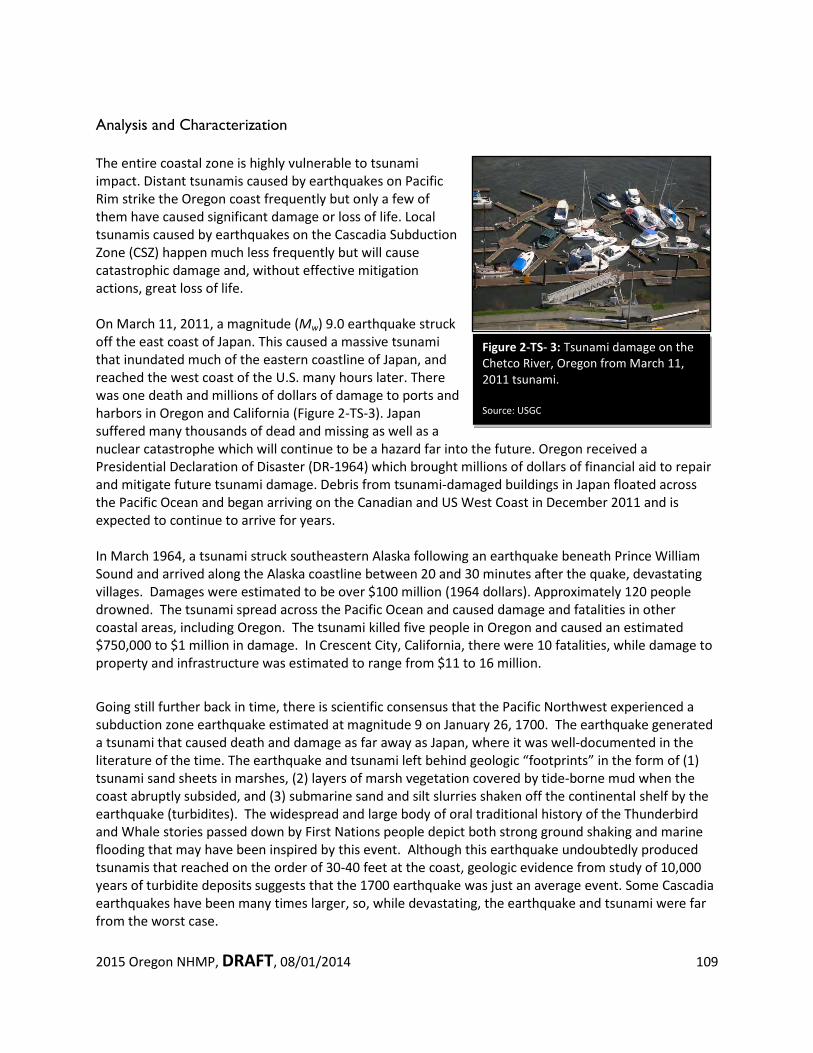
2015 Oregon NHMP, DRAFT, 08/01/2014 109
Figure 2-TS- 3: Tsunami damage on the Chetco River, Oregon from March 11, 2011 tsunami. Source: USGC
Analysis and Characterization The entire coastal zone is highly vulnerable to tsunami impact. Distant tsunamis caused by earthquakes on Pacific Rim strike the Oregon coast frequently but only a few of them have caused significant damage or loss of life. Local tsunamis caused by earthquakes on the Cascadia Subduction Zone (CSZ) happen much less frequently but will cause catastrophic damage and, without effective mitigation actions, great loss of life. On March 11, 2011, a magnitude (Mw) 9.0 earthquake struck off the east coast of Japan. This caused a massive tsunami that inundated much of the eastern coastline of Japan, and reached the west coast of the U.S. many hours later. There was one death and millions of dollars of damage to ports and harbors in Oregon and California (Figure 2-TS-3). Japan suffered many thousands of dead and missing as well as a nuclear catastrophe which will continue to be a hazard far into the future. Oregon received a Presidential Declaration of Disaster (DR-1964) which brought millions of dollars of financial aid to repair and mitigate future tsunami damage. Debris from tsunami-damaged buildings in Japan floated across the Pacific Ocean and began arriving on the Canadian and US West Coast in December 2011 and is expected to continue to arrive for years. In March 1964, a tsunami struck southeastern Alaska following an earthquake beneath Prince William Sound and arrived along the Alaska coastline between 20 and 30 minutes after the quake, devastating villages. Damages were estimated to be over $100 million (1964 dollars). Approximately 120 people drowned. The tsunami spread across the Pacific Ocean and caused damage and fatalities in other coastal areas, including Oregon. The tsunami killed five people in Oregon and caused an estimated $750,000 to $1 million in damage. In Crescent City, California, there were 10 fatalities, while damage to property and infrastructure was estimated to range from $11 to 16 million.
Going still further back in time, there is scientific consensus that the Pacific Northwest experienced a subduction zone earthquake estimated at magnitude 9 on January 26, 1700. The earthquake generated a tsunami that caused death and damage as far away as Japan, where it was well-documented in the literature of the time. The earthquake and tsunami left behind geologic “footprints” in the form of (1) tsunami sand sheets in marshes, (2) layers of marsh vegetation covered by tide-borne mud when the coast abruptly subsided, and (3) submarine sand and silt slurries shaken off the continental shelf by the earthquake (turbidites). The widespread and large body of oral traditional history of the Thunderbird and Whale stories passed down by First Nations people depict both strong ground shaking and marine flooding that may have been inspired by this event. Although this earthquake undoubtedly produced tsunamis that reached on the order of 30-40 feet at the coast, geologic evidence from study of 10,000 years of turbidite deposits suggests that the 1700 earthquake was just an average event. Some Cascadia earthquakes have been many times larger, so, while devastating, the earthquake and tsunami were far from the worst case.
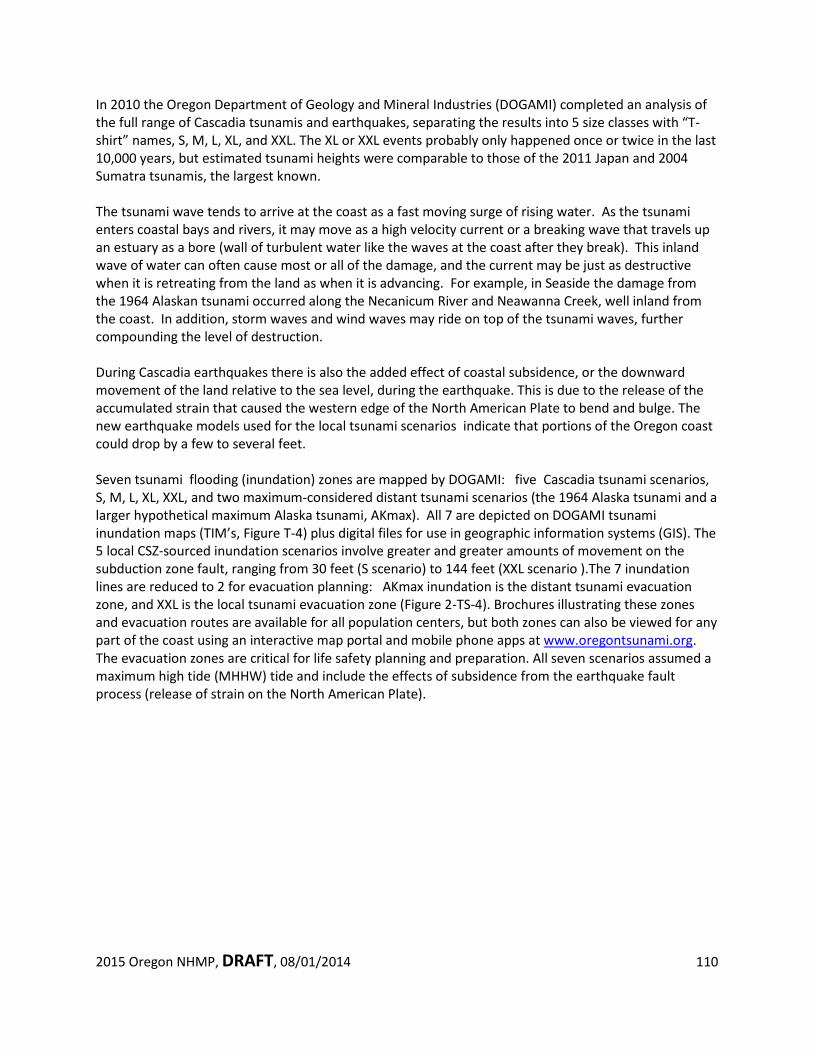
2015 Oregon NHMP, DRAFT, 08/01/2014 110
In 2010 the Oregon Department of Geology and Mineral Industries (DOGAMI) completed an analysis of the full range of Cascadia tsunamis and earthquakes, separating the results into 5 size classes with “T-shirt” names, S, M, L, XL, and XXL. The XL or XXL events probably only happened once or twice in the last 10,000 years, but estimated tsunami heights were comparable to those of the 2011 Japan and 2004 Sumatra tsunamis, the largest known. The tsunami wave tends to arrive at the coast as a fast moving surge of rising water. As the tsunami enters coastal bays and rivers, it may move as a high velocity current or a breaking wave that travels up an estuary as a bore (wall of turbulent water like the waves at the coast after they break). This inland wave of water can often cause most or all of the damage, and the current may be just as destructive when it is retreating from the land as when it is advancing. For example, in Seaside the damage from the 1964 Alaskan tsunami occurred along the Necanicum River and Neawanna Creek, well inland from the coast. In addition, storm waves and wind waves may ride on top of the tsunami waves, further compounding the level of destruction. During Cascadia earthquakes there is also the added effect of coastal subsidence, or the downward movement of the land relative to the sea level, during the earthquake. This is due to the release of the accumulated strain that caused the western edge of the North American Plate to bend and bulge. The new earthquake models used for the local tsunami scenarios indicate that portions of the Oregon coast could drop by a few to several feet. Seven tsunami flooding (inundation) zones are mapped by DOGAMI: five Cascadia tsunami scenarios, S, M, L, XL, XXL, and two maximum-considered distant tsunami scenarios (the 1964 Alaska tsunami and a larger hypothetical maximum Alaska tsunami, AKmax). All 7 are depicted on DOGAMI tsunami inundation maps (TIM’s, Figure T-4) plus digital files for use in geographic information systems (GIS). The 5 local CSZ-sourced inundation scenarios involve greater and greater amounts of movement on the subduction zone fault, ranging from 30 feet (S scenario) to 144 feet (XXL scenario ).The 7 inundation lines are reduced to 2 for evacuation planning: AKmax inundation is the distant tsunami evacuation zone, and XXL is the local tsunami evacuation zone (Figure 2-TS-4). Brochures illustrating these zones and evacuation routes are available for all population centers, but both zones can also be viewed for any part of the coast using an interactive map portal and mobile phone apps at www.oregontsunami.org. The evacuation zones are critical for life safety planning and preparation. All seven scenarios assumed a maximum high tide (MHHW) tide and include the effects of subsidence from the earthquake fault process (release of strain on the North American Plate).
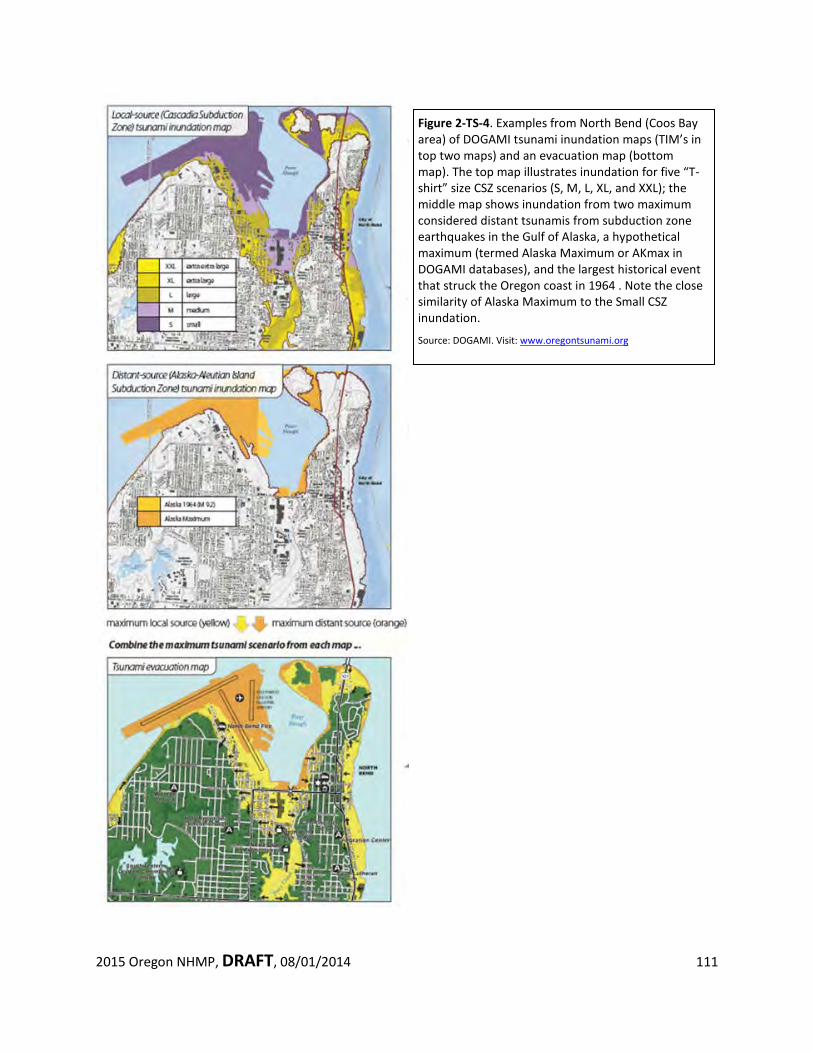
2015 Oregon NHMP, DRAFT, 08/01/2014 111
Figure 2-TS-4. Examples from North Bend (Coos Bay area) of DOGAMI tsunami inundation maps (TIM’s in top two maps) and an evacuation map (bottom map). The top map illustrates inundation for five “T-shirt” size CSZ scenarios (S, M, L, XL, and XXL); the middle map shows inundation from two maximum considered distant tsunamis from subduction zone earthquakes in the Gulf of Alaska, a hypothetical maximum (termed Alaska Maximum or AKmax in DOGAMI databases), and the largest historical event that struck the Oregon coast in 1964 . Note the close similarity of Alaska Maximum to the Small CSZ inundation.
Source: DOGAMI. Visit: www.oregontsunami.org
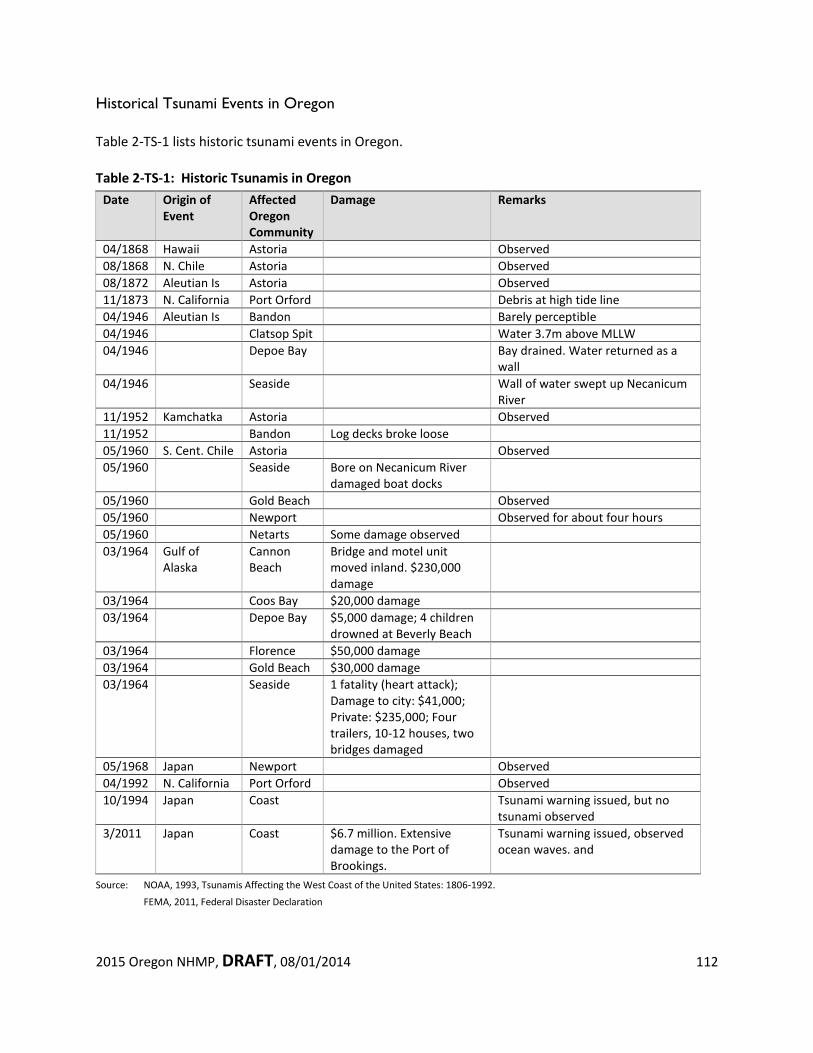
2015 Oregon NHMP, DRAFT, 08/01/2014 112
Historical Tsunami Events in Oregon Table 2-TS-1 lists historic tsunami events in Oregon. Table 2-TS-1: Historic Tsunamis in Oregon
Date Origin of Event
Affected Oregon Community
Damage Remarks
04/1868 Hawaii Astoria Observed 08/1868 N. Chile Astoria Observed 08/1872 Aleutian Is Astoria Observed 11/1873 N. California Port Orford Debris at high tide line 04/1946 Aleutian Is Bandon Barely perceptible 04/1946 Clatsop Spit Water 3.7m above MLLW 04/1946 Depoe Bay Bay drained. Water returned as a
wall 04/1946 Seaside Wall of water swept up Necanicum
River 11/1952 Kamchatka Astoria Observed 11/1952 Bandon Log decks broke loose 05/1960 S. Cent. Chile Astoria Observed 05/1960 Seaside Bore on Necanicum River
damaged boat docks
05/1960 Gold Beach Observed 05/1960 Newport Observed for about four hours 05/1960 Netarts Some damage observed 03/1964 Gulf of
Alaska Cannon Beach
Bridge and motel unit moved inland. $230,000 damage
03/1964 Coos Bay $20,000 damage 03/1964 Depoe Bay $5,000 damage; 4 children
drowned at Beverly Beach
03/1964 Florence $50,000 damage 03/1964 Gold Beach $30,000 damage 03/1964 Seaside 1 fatality (heart attack);
Damage to city: $41,000; Private: $235,000; Four trailers, 10-12 houses, two bridges damaged
05/1968 Japan Newport Observed 04/1992 N. California Port Orford Observed 10/1994 Japan Coast Tsunami warning issued, but no
tsunami observed 3/2011 Japan Coast $6.7 million. Extensive
damage to the Port of Brookings.
Tsunami warning issued, observed ocean waves. and
Source: NOAA, 1993, Tsunamis Affecting the West Coast of the United States: 1806-1992.
FEMA, 2011, Federal Disaster Declaration
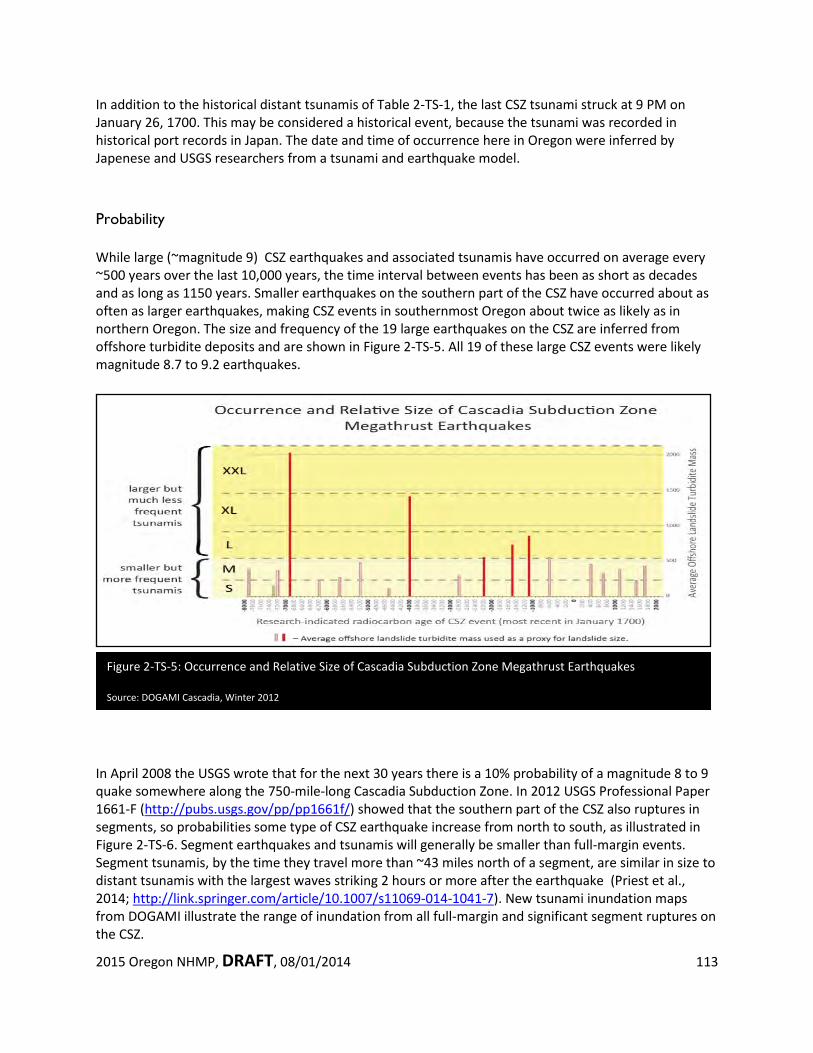
2015 Oregon NHMP, DRAFT, 08/01/2014 113
Figure 2-TS-5: Occurrence and Relative Size of Cascadia Subduction Zone Megathrust Earthquakes Source: DOGAMI Cascadia, Winter 2012
In addition to the historical distant tsunamis of Table 2-TS-1, the last CSZ tsunami struck at 9 PM on January 26, 1700. This may be considered a historical event, because the tsunami was recorded in historical port records in Japan. The date and time of occurrence here in Oregon were inferred by Japenese and USGS researchers from a tsunami and earthquake model.
Probability While large (~magnitude 9) CSZ earthquakes and associated tsunamis have occurred on average every ~500 years over the last 10,000 years, the time interval between events has been as short as decades and as long as 1150 years. Smaller earthquakes on the southern part of the CSZ have occurred about as often as larger earthquakes, making CSZ events in southernmost Oregon about twice as likely as in northern Oregon. The size and frequency of the 19 large earthquakes on the CSZ are inferred from offshore turbidite deposits and are shown in Figure 2-TS-5. All 19 of these large CSZ events were likely magnitude 8.7 to 9.2 earthquakes.
In April 2008 the USGS wrote that for the next 30 years there is a 10% probability of a magnitude 8 to 9 quake somewhere along the 750-mile-long Cascadia Subduction Zone. In 2012 USGS Professional Paper 1661-F (http://pubs.usgs.gov/pp/pp1661f/) showed that the southern part of the CSZ also ruptures in segments, so probabilities some type of CSZ earthquake increase from north to south, as illustrated in Figure 2-TS-6. Segment earthquakes and tsunamis will generally be smaller than full-margin events. Segment tsunamis, by the time they travel more than ~43 miles north of a segment, are similar in size to distant tsunamis with the largest waves striking 2 hours or more after the earthquake (Priest et al., 2014; http://link.springer.com/article/10.1007/s11069-014-1041-7). New tsunami inundation maps from DOGAMI illustrate the range of inundation from all full-margin and significant segment ruptures on the CSZ.
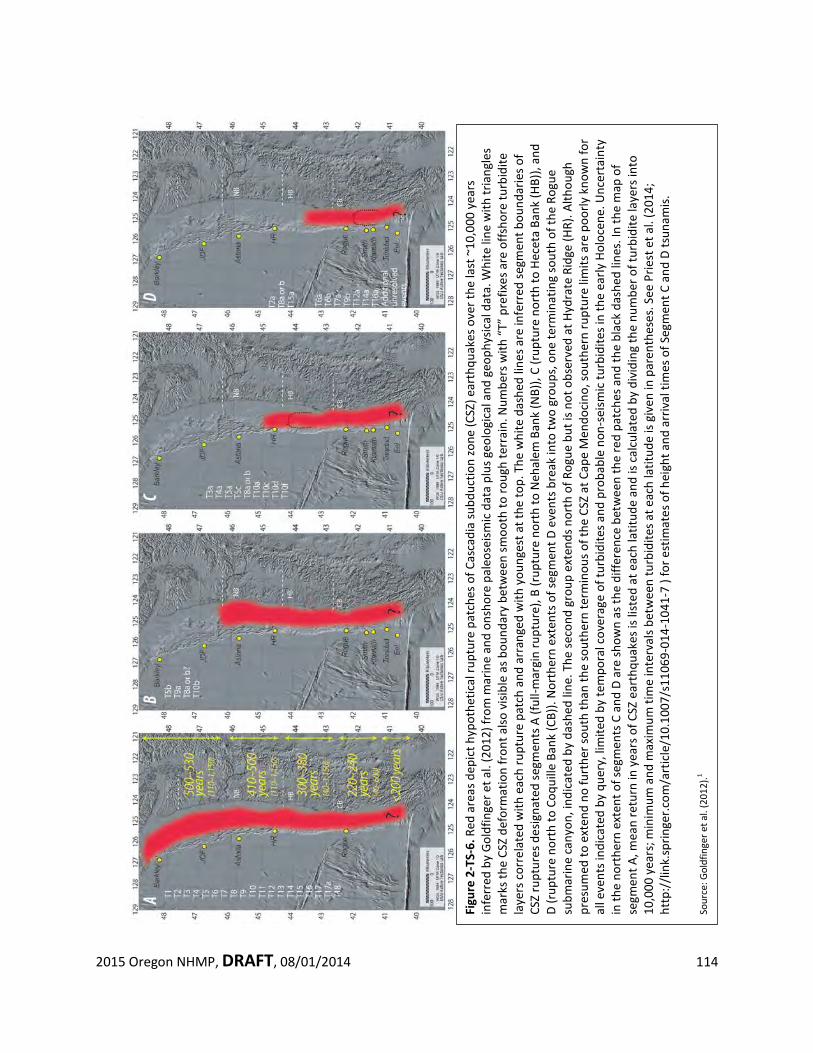
2015 Oregon NHMP, DRAFT, 08/01/2014 114
Figu
re 2
-TS-
6. R
ed a
reas
dep
ict h
ypot
hetic
al ru
ptur
e pa
tche
s of C
asca
dia
subd
uctio
n zo
ne (C
SZ) e
arth
quak
es o
ver t
he la
st ~
10,0
00 y
ears
in
ferr
ed b
y Go
ldfin
ger e
t al.
(201
2) fr
om m
arin
e an
d on
shor
e pa
leos
eism
ic d
ata
plus
geo
logi
cal a
nd g
eoph
ysic
al d
ata.
Whi
te li
ne w
ith tr
iang
les
mar
ks th
e CS
Z de
form
atio
n fr
ont a
lso v
isibl
e as
bou
ndar
y be
twee
n sm
ooth
to ro
ugh
terr
ain.
Num
bers
with
“T”
pre
fixes
are
offs
hore
turb
idite
la
yers
cor
rela
ted
with
eac
h ru
ptur
e pa
tch
and
arra
nged
with
you
nges
t at t
he to
p. T
he w
hite
das
hed
lines
are
infe
rred
segm
ent b
ound
arie
s of
CSZ
rupt
ures
des
igna
ted
segm
ents
A (f
ull-m
argi
n ru
ptur
e), B
(rup
ture
nor
th to
Neh
alem
Ban
k (N
B)),
C (r
uptu
re n
orth
to H
ecet
a Ba
nk (H
B)),
and
D (r
uptu
re n
orth
to C
oqui
lle B
ank
(CB)
). N
orth
ern
exte
nts o
f seg
men
t D e
vent
s bre
ak in
to tw
o gr
oups
, one
term
inat
ing
sout
h of
the
Rogu
e su
bmar
ine
cany
on, i
ndic
ated
by
dash
ed li
ne. T
he se
cond
gro
up e
xten
ds n
orth
of R
ogue
but
is n
ot o
bser
ved
at H
ydra
te R
idge
(HR)
. Alth
ough
pr
esum
ed to
ext
end
no fu
rthe
r sou
th th
an th
e so
uthe
rn te
rmin
ous o
f the
CSZ
at C
ape
Men
doci
no, s
outh
ern
rupt
ure
limits
are
poo
rly k
now
n fo
r al
l eve
nts i
ndic
ated
by
quer
y, li
mite
d by
tem
pora
l cov
erag
e of
turb
idite
s and
pro
babl
e no
n-se
ism
ic tu
rbid
ites i
n th
e ea
rly H
oloc
ene.
Unc
erta
inty
in
the
nort
hern
ext
ent o
f seg
men
ts C
and
D a
re sh
own
as th
e di
ffere
nce
betw
een
the
red
patc
hes a
nd th
e bl
ack
dash
ed li
nes.
In th
e m
ap o
f se
gmen
t A, m
ean
retu
rn in
yea
rs o
f CSZ
ear
thqu
akes
is li
sted
at e
ach
latit
ude
and
is ca
lcul
ated
by
divi
ding
the
num
ber o
f tur
bidi
te la
yers
into
10
,000
yea
rs; m
inim
um a
nd m
axim
um ti
me
inte
rval
s bet
wee
n tu
rbid
ites a
t eac
h la
titud
e is
give
n in
par
enth
eses
. See
Prie
st e
t al.
(201
4;
http
://li
nk.s
prin
ger.c
om/a
rtic
le/1
0.10
07/s
1106
9-01
4-10
41-7
) fo
r est
imat
es o
f hei
ght a
nd a
rriv
al ti
mes
of S
egm
ent C
and
D ts
unam
is.
Sour
ce: G
oldf
inge
r et a
l. (2
012)
.1
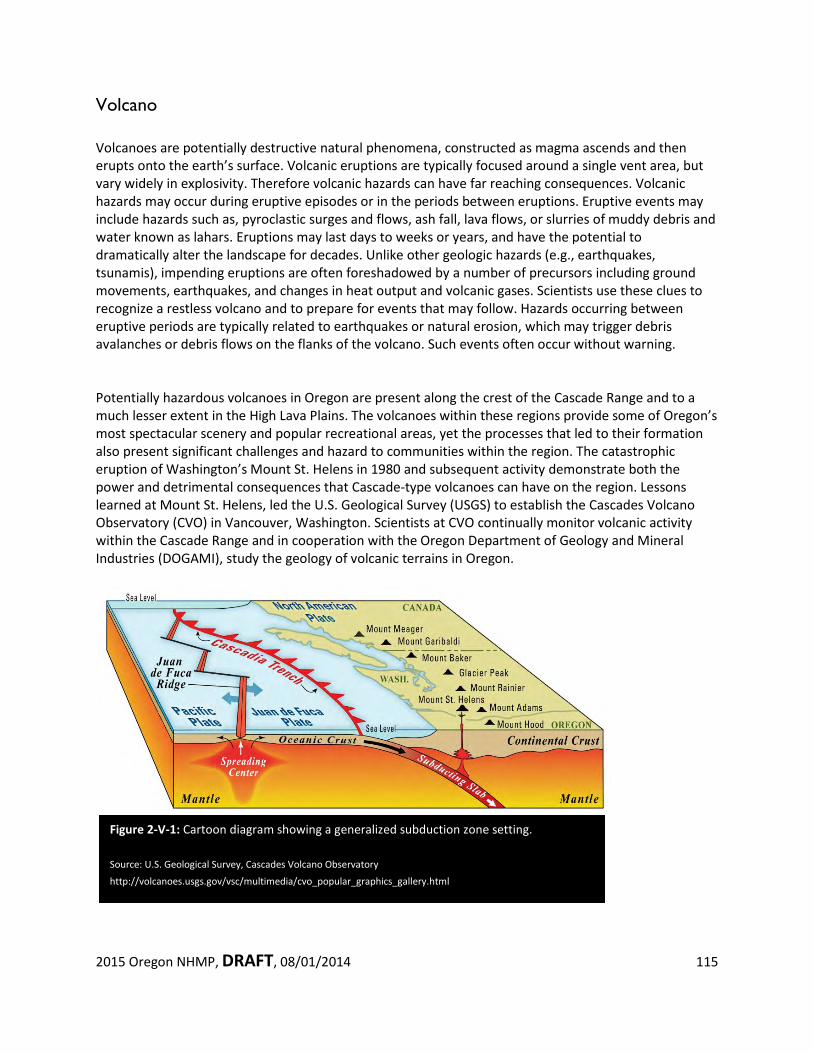
2015 Oregon NHMP, DRAFT, 08/01/2014 115
Figure 2-V-1: Cartoon diagram showing a generalized subduction zone setting. Source: U.S. Geological Survey, Cascades Volcano Observatory
http://volcanoes.usgs.gov/vsc/multimedia/cvo_popular_graphics_gallery.html
Volcano Volcanoes are potentially destructive natural phenomena, constructed as magma ascends and then erupts onto the earth’s surface. Volcanic eruptions are typically focused around a single vent area, but vary widely in explosivity. Therefore volcanic hazards can have far reaching consequences. Volcanic hazards may occur during eruptive episodes or in the periods between eruptions. Eruptive events may include hazards such as, pyroclastic surges and flows, ash fall, lava flows, or slurries of muddy debris and water known as lahars. Eruptions may last days to weeks or years, and have the potential to dramatically alter the landscape for decades. Unlike other geologic hazards (e.g., earthquakes, tsunamis), impending eruptions are often foreshadowed by a number of precursors including ground movements, earthquakes, and changes in heat output and volcanic gases. Scientists use these clues to recognize a restless volcano and to prepare for events that may follow. Hazards occurring between eruptive periods are typically related to earthquakes or natural erosion, which may trigger debris avalanches or debris flows on the flanks of the volcano. Such events often occur without warning. Potentially hazardous volcanoes in Oregon are present along the crest of the Cascade Range and to a much lesser extent in the High Lava Plains. The volcanoes within these regions provide some of Oregon’s most spectacular scenery and popular recreational areas, yet the processes that led to their formation also present significant challenges and hazard to communities within the region. The catastrophic eruption of Washington’s Mount St. Helens in 1980 and subsequent activity demonstrate both the power and detrimental consequences that Cascade-type volcanoes can have on the region. Lessons learned at Mount St. Helens, led the U.S. Geological Survey (USGS) to establish the Cascades Volcano Observatory (CVO) in Vancouver, Washington. Scientists at CVO continually monitor volcanic activity within the Cascade Range and in cooperation with the Oregon Department of Geology and Mineral Industries (DOGAMI), study the geology of volcanic terrains in Oregon.
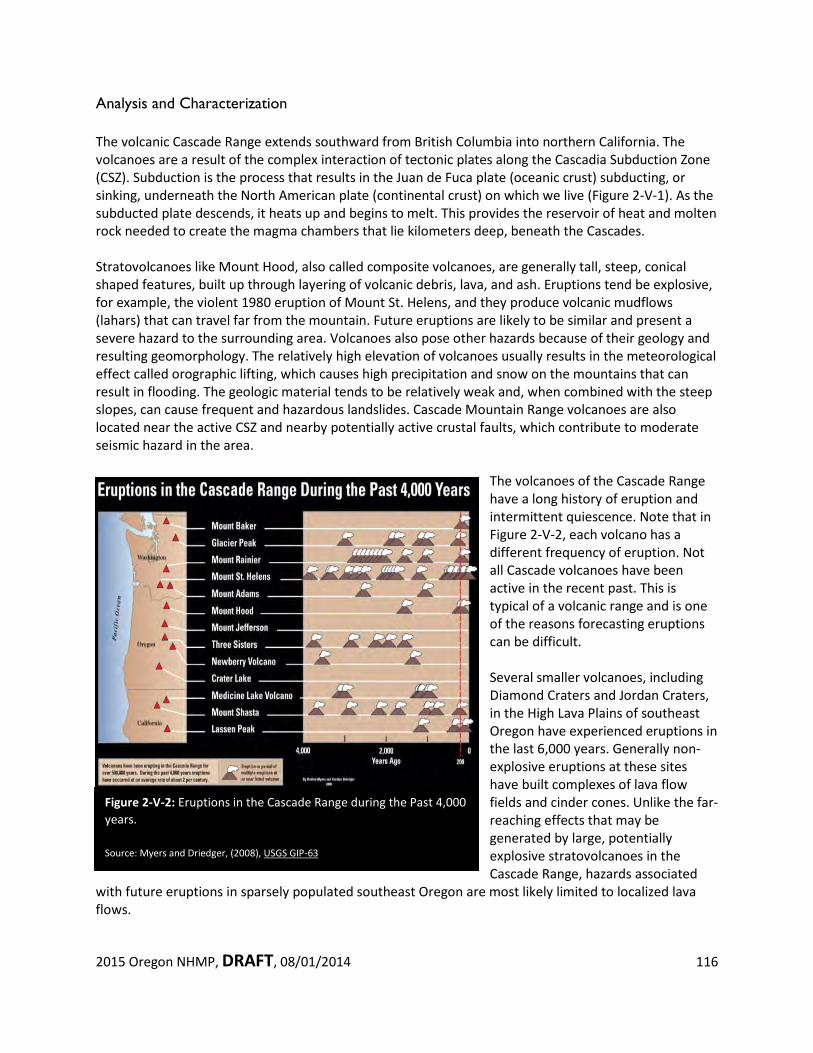
2015 Oregon NHMP, DRAFT, 08/01/2014 116
Figure 2-V-2: Eruptions in the Cascade Range during the Past 4,000 years.
Source: Myers and Driedger, (2008), USGS GIP-63
Analysis and Characterization
The volcanic Cascade Range extends southward from British Columbia into northern California. The volcanoes are a result of the complex interaction of tectonic plates along the Cascadia Subduction Zone (CSZ). Subduction is the process that results in the Juan de Fuca plate (oceanic crust) subducting, or sinking, underneath the North American plate (continental crust) on which we live (Figure 2-V-1). As the subducted plate descends, it heats up and begins to melt. This provides the reservoir of heat and molten rock needed to create the magma chambers that lie kilometers deep, beneath the Cascades. Stratovolcanoes like Mount Hood, also called composite volcanoes, are generally tall, steep, conical shaped features, built up through layering of volcanic debris, lava, and ash. Eruptions tend be explosive, for example, the violent 1980 eruption of Mount St. Helens, and they produce volcanic mudflows (lahars) that can travel far from the mountain. Future eruptions are likely to be similar and present a severe hazard to the surrounding area. Volcanoes also pose other hazards because of their geology and resulting geomorphology. The relatively high elevation of volcanoes usually results in the meteorological effect called orographic lifting, which causes high precipitation and snow on the mountains that can result in flooding. The geologic material tends to be relatively weak and, when combined with the steep slopes, can cause frequent and hazardous landslides. Cascade Mountain Range volcanoes are also located near the active CSZ and nearby potentially active crustal faults, which contribute to moderate seismic hazard in the area.
The volcanoes of the Cascade Range have a long history of eruption and intermittent quiescence. Note that in Figure 2-V-2, each volcano has a different frequency of eruption. Not all Cascade volcanoes have been active in the recent past. This is typical of a volcanic range and is one of the reasons forecasting eruptions can be difficult. Several smaller volcanoes, including Diamond Craters and Jordan Craters, in the High Lava Plains of southeast Oregon have experienced eruptions in the last 6,000 years. Generally non-explosive eruptions at these sites have built complexes of lava flow fields and cinder cones. Unlike the far-reaching effects that may be generated by large, potentially explosive stratovolcanoes in the Cascade Range, hazards associated
with future eruptions in sparsely populated southeast Oregon are most likely limited to localized lava flows.
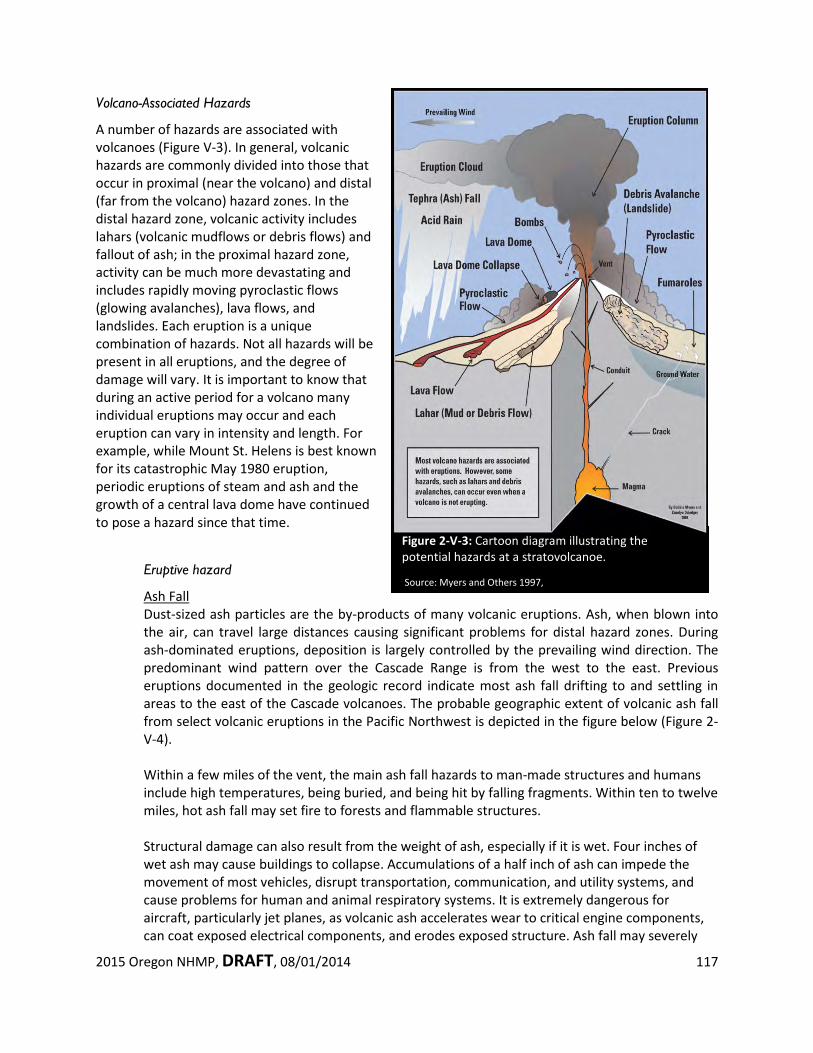
2015 Oregon NHMP, DRAFT, 08/01/2014 117
Volcano-Associated Hazards
A number of hazards are associated with volcanoes (Figure V-3). In general, volcanic hazards are commonly divided into those that occur in proximal (near the volcano) and distal (far from the volcano) hazard zones. In the distal hazard zone, volcanic activity includes lahars (volcanic mudflows or debris flows) and fallout of ash; in the proximal hazard zone, activity can be much more devastating and includes rapidly moving pyroclastic flows (glowing avalanches), lava flows, and landslides. Each eruption is a unique combination of hazards. Not all hazards will be present in all eruptions, and the degree of damage will vary. It is important to know that during an active period for a volcano many individual eruptions may occur and each eruption can vary in intensity and length. For example, while Mount St. Helens is best known for its catastrophic May 1980 eruption, periodic eruptions of steam and ash and the growth of a central lava dome have continued to pose a hazard since that time.
Eruptive hazard
Ash Fall Dust-sized ash particles are the by-products of many volcanic eruptions. Ash, when blown into the air, can travel large distances causing significant problems for distal hazard zones. During ash-dominated eruptions, deposition is largely controlled by the prevailing wind direction. The predominant wind pattern over the Cascade Range is from the west to the east. Previous eruptions documented in the geologic record indicate most ash fall drifting to and settling in areas to the east of the Cascade volcanoes. The probable geographic extent of volcanic ash fall from select volcanic eruptions in the Pacific Northwest is depicted in the figure below (Figure 2-V-4). Within a few miles of the vent, the main ash fall hazards to man-made structures and humans include high temperatures, being buried, and being hit by falling fragments. Within ten to twelve miles, hot ash fall may set fire to forests and flammable structures. Structural damage can also result from the weight of ash, especially if it is wet. Four inches of wet ash may cause buildings to collapse. Accumulations of a half inch of ash can impede the movement of most vehicles, disrupt transportation, communication, and utility systems, and cause problems for human and animal respiratory systems. It is extremely dangerous for aircraft, particularly jet planes, as volcanic ash accelerates wear to critical engine components, can coat exposed electrical components, and erodes exposed structure. Ash fall may severely
Figure 2-V-3: Cartoon diagram illustrating the potential hazards at a stratovolcanoe.
Source: Myers and Others 1997,
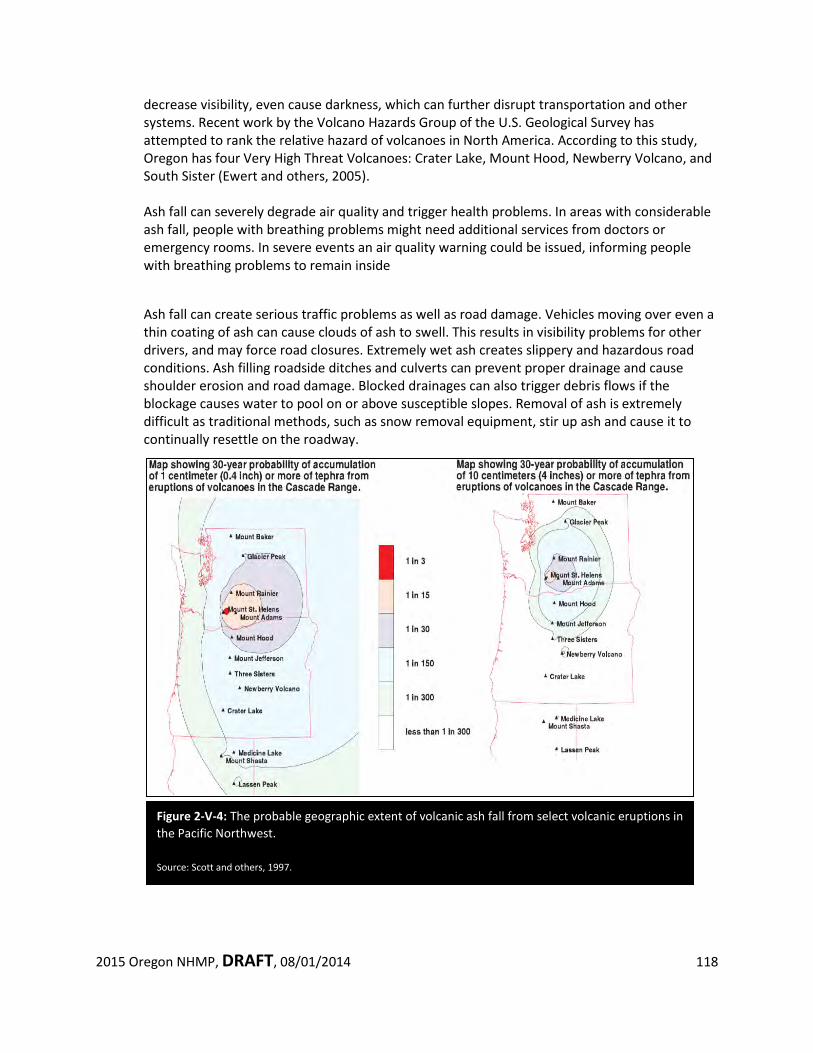
2015 Oregon NHMP, DRAFT, 08/01/2014 118
decrease visibility, even cause darkness, which can further disrupt transportation and other systems. Recent work by the Volcano Hazards Group of the U.S. Geological Survey has attempted to rank the relative hazard of volcanoes in North America. According to this study, Oregon has four Very High Threat Volcanoes: Crater Lake, Mount Hood, Newberry Volcano, and South Sister (Ewert and others, 2005). Ash fall can severely degrade air quality and trigger health problems. In areas with considerable ash fall, people with breathing problems might need additional services from doctors or emergency rooms. In severe events an air quality warning could be issued, informing people with breathing problems to remain inside
Ash fall can create serious traffic problems as well as road damage. Vehicles moving over even a thin coating of ash can cause clouds of ash to swell. This results in visibility problems for other drivers, and may force road closures. Extremely wet ash creates slippery and hazardous road conditions. Ash filling roadside ditches and culverts can prevent proper drainage and cause shoulder erosion and road damage. Blocked drainages can also trigger debris flows if the blockage causes water to pool on or above susceptible slopes. Removal of ash is extremely difficult as traditional methods, such as snow removal equipment, stir up ash and cause it to continually resettle on the roadway.
Figure 2-V-4: The probable geographic extent of volcanic ash fall from select volcanic eruptions in the Pacific Northwest.
Source: Scott and others, 1997.
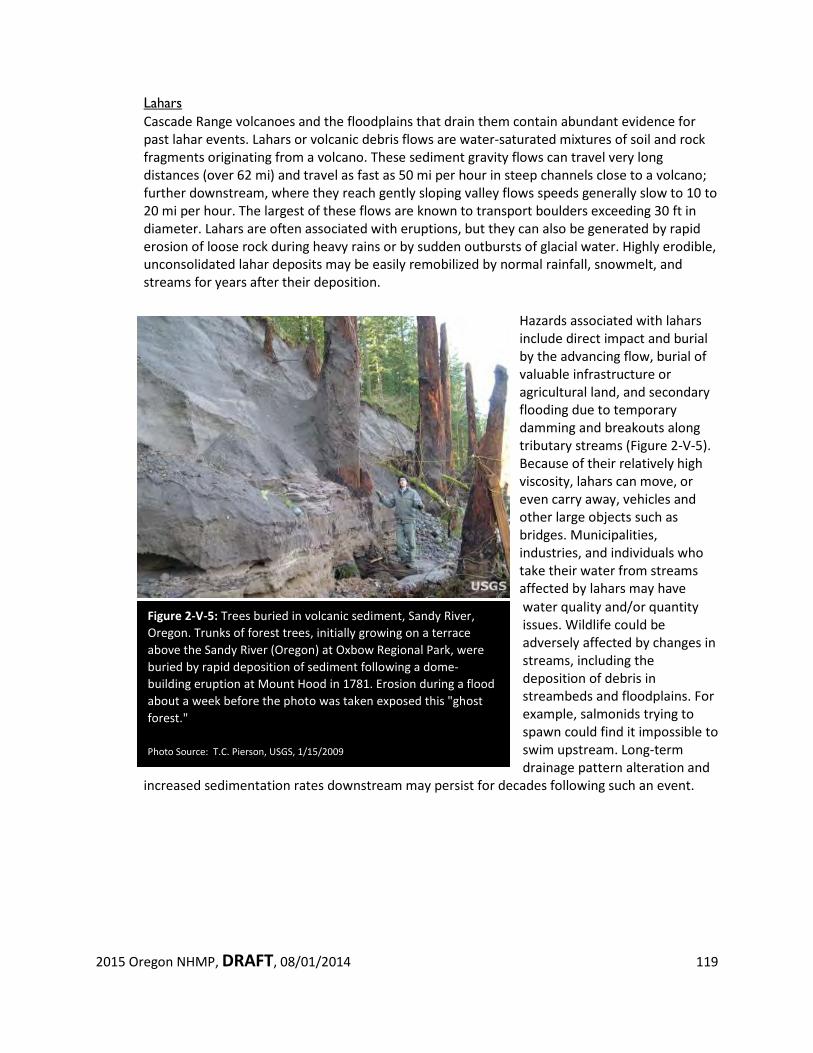
2015 Oregon NHMP, DRAFT, 08/01/2014 119
Figure 2-V-5: Trees buried in volcanic sediment, Sandy River, Oregon. Trunks of forest trees, initially growing on a terrace above the Sandy River (Oregon) at Oxbow Regional Park, were buried by rapid deposition of sediment following a dome-building eruption at Mount Hood in 1781. Erosion during a flood about a week before the photo was taken exposed this "ghost forest."
Photo Source: T.C. Pierson, USGS, 1/15/2009
Lahars Cascade Range volcanoes and the floodplains that drain them contain abundant evidence for past lahar events. Lahars or volcanic debris flows are water-saturated mixtures of soil and rock fragments originating from a volcano. These sediment gravity flows can travel very long distances (over 62 mi) and travel as fast as 50 mi per hour in steep channels close to a volcano; further downstream, where they reach gently sloping valley flows speeds generally slow to 10 to 20 mi per hour. The largest of these flows are known to transport boulders exceeding 30 ft in diameter. Lahars are often associated with eruptions, but they can also be generated by rapid erosion of loose rock during heavy rains or by sudden outbursts of glacial water. Highly erodible, unconsolidated lahar deposits may be easily remobilized by normal rainfall, snowmelt, and streams for years after their deposition.
Hazards associated with lahars include direct impact and burial by the advancing flow, burial of valuable infrastructure or agricultural land, and secondary flooding due to temporary damming and breakouts along tributary streams (Figure 2-V-5). Because of their relatively high viscosity, lahars can move, or even carry away, vehicles and other large objects such as bridges. Municipalities, industries, and individuals who take their water from streams affected by lahars may have water quality and/or quantity issues. Wildlife could be adversely affected by changes in streams, including the deposition of debris in streambeds and floodplains. For example, salmonids trying to spawn could find it impossible to swim upstream. Long-term drainage pattern alteration and
increased sedimentation rates downstream may persist for decades following such an event.
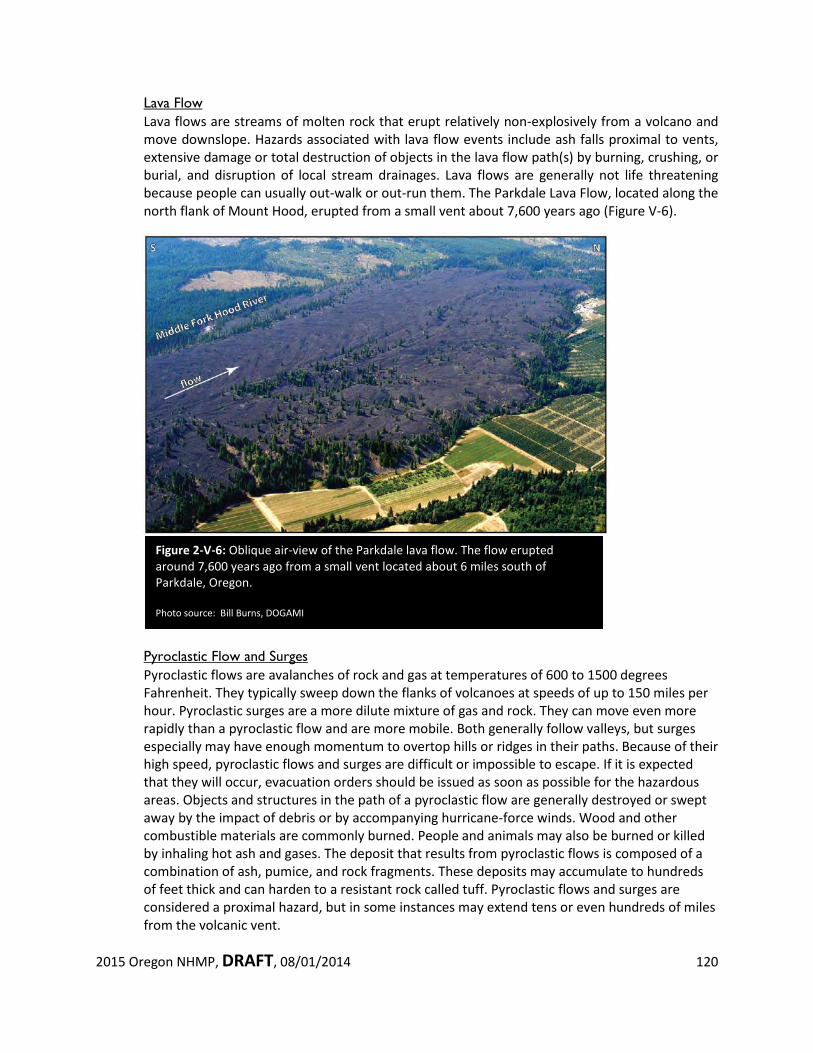
2015 Oregon NHMP, DRAFT, 08/01/2014 120
Figure 2-V-6: Oblique air-view of the Parkdale lava flow. The flow erupted around 7,600 years ago from a small vent located about 6 miles south of Parkdale, Oregon.
Photo source: Bill Burns, DOGAMI
Lava Flow Lava flows are streams of molten rock that erupt relatively non-explosively from a volcano and move downslope. Hazards associated with lava flow events include ash falls proximal to vents, extensive damage or total destruction of objects in the lava flow path(s) by burning, crushing, or burial, and disruption of local stream drainages. Lava flows are generally not life threatening because people can usually out-walk or out-run them. The Parkdale Lava Flow, located along the north flank of Mount Hood, erupted from a small vent about 7,600 years ago (Figure V-6).
Pyroclastic Flow and Surges Pyroclastic flows are avalanches of rock and gas at temperatures of 600 to 1500 degrees Fahrenheit. They typically sweep down the flanks of volcanoes at speeds of up to 150 miles per hour. Pyroclastic surges are a more dilute mixture of gas and rock. They can move even more rapidly than a pyroclastic flow and are more mobile. Both generally follow valleys, but surges especially may have enough momentum to overtop hills or ridges in their paths. Because of their high speed, pyroclastic flows and surges are difficult or impossible to escape. If it is expected that they will occur, evacuation orders should be issued as soon as possible for the hazardous areas. Objects and structures in the path of a pyroclastic flow are generally destroyed or swept away by the impact of debris or by accompanying hurricane-force winds. Wood and other combustible materials are commonly burned. People and animals may also be burned or killed by inhaling hot ash and gases. The deposit that results from pyroclastic flows is composed of a combination of ash, pumice, and rock fragments. These deposits may accumulate to hundreds of feet thick and can harden to a resistant rock called tuff. Pyroclastic flows and surges are considered a proximal hazard, but in some instances may extend tens or even hundreds of miles from the volcanic vent.
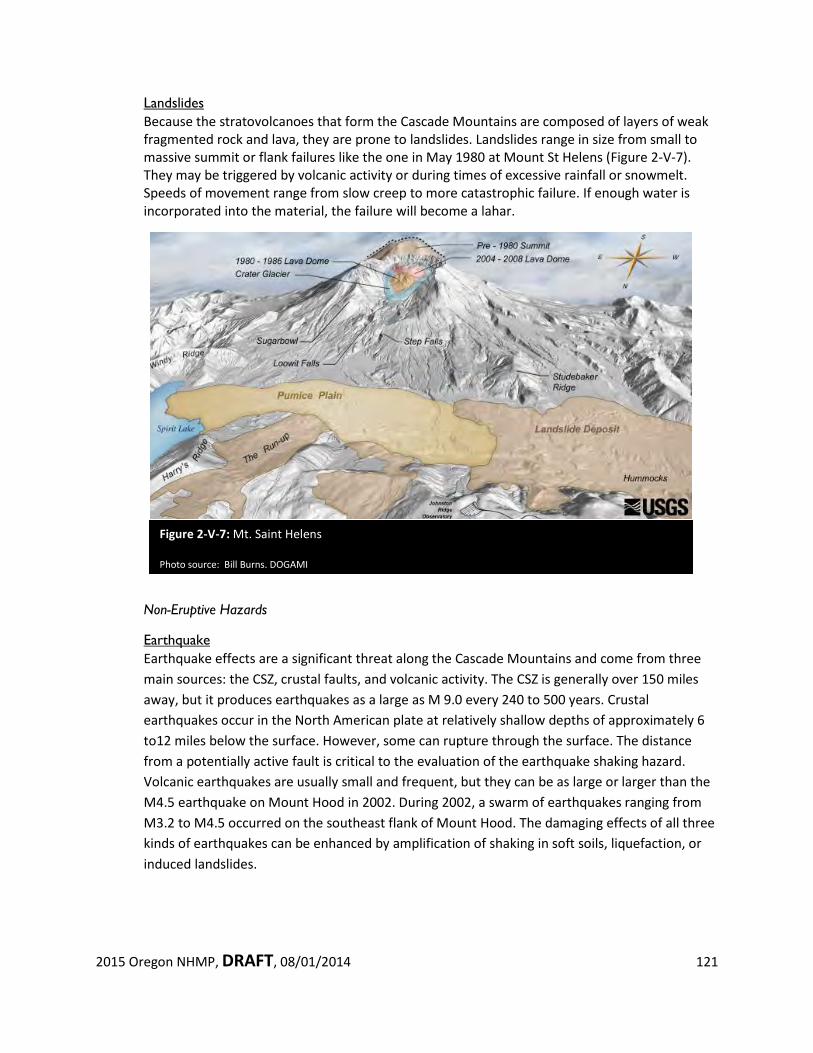
2015 Oregon NHMP, DRAFT, 08/01/2014 121
Figure 2-V-7: Mt. Saint Helens
Photo source: Bill Burns, DOGAMI
Landslides Because the stratovolcanoes that form the Cascade Mountains are composed of layers of weak fragmented rock and lava, they are prone to landslides. Landslides range in size from small to massive summit or flank failures like the one in May 1980 at Mount St Helens (Figure 2-V-7). They may be triggered by volcanic activity or during times of excessive rainfall or snowmelt. Speeds of movement range from slow creep to more catastrophic failure. If enough water is incorporated into the material, the failure will become a lahar.
Non-Eruptive Hazards
Earthquake Earthquake effects are a significant threat along the Cascade Mountains and come from three main sources: the CSZ, crustal faults, and volcanic activity. The CSZ is generally over 150 miles away, but it produces earthquakes as a large as M 9.0 every 240 to 500 years. Crustal earthquakes occur in the North American plate at relatively shallow depths of approximately 6 to12 miles below the surface. However, some can rupture through the surface. The distance from a potentially active fault is critical to the evaluation of the earthquake shaking hazard. Volcanic earthquakes are usually small and frequent, but they can be as large or larger than the M4.5 earthquake on Mount Hood in 2002. During 2002, a swarm of earthquakes ranging from M3.2 to M4.5 occurred on the southeast flank of Mount Hood. The damaging effects of all three kinds of earthquakes can be enhanced by amplification of shaking in soft soils, liquefaction, or induced landslides.
2015 Oregon NHMP, DRAFT, 08/01/2014 122
Flood and Channel Migration The relatively high elevation of volcanoes usually results in the meteorological affect called orographic lifting, which causes high precipitation and snow on the mountains. The result can be very high levels of rainfall and/or rapid snowmelt that can result in flooding.
Floods cause damage to assets through inundation of water and by erosion and deposition of soil and/or large objects. Defining the hazard associated with inundation by flooding is done by calculating the area that is likely to be flooded during different levels of flooding. Larger floods are less frequent than smaller floods, so flood levels may be defined by their return period. The longer the return period, the deeper the flood waters, and hence the larger the area that is inundated. Some common return periods used in flood hazard mapping include 10-year, 25-year, 100-year, and 500-year floods. Most flooding on Cascade Range volcanoes occurs when heavy, warm rain during large winter or spring storms falls on accumulations of low-elevation snow. Channel migration hazards can occur slowly, for example, by continuous erosion along a cutbank meander and deposition onto a point bar during high flows, or very rapidly during storm events through avulsion or rapid abandonment of the current river channel for a new one. Such rapid migration can not only destroy structures but even remove the land beneath structures.
For more information on flooding and channel migration zones see the Flood section of this Plan, beginning on page 75.
Landslide The general term landslide refers to a range of geologic events including rock falls, debris flows, earth slides, and other mass movements. Most landslides that occur on volcanoes are large deep-seated landslide complexes or debris flows. Deep-seated landslides have failure surfaces usually tens of feet below the surface and can cover large areas from acres to square miles. These types of landslides tend to move relatively slowly, but they can lurch forward if shaken by an earthquake or if disturbed by removal of material from the toe, by addition of material to the head, or by addition of water into the slide mass. Debris flows tend to initiate in the upper portions of a drainage, picking up water, sediment, and speed as they come down the drainage. As they reach the mouth of the confined/steep portion of the drainage, they tend to spread out and deposit the majority of the material, generally creating a fan. Debris flows are also commonly initiated by other types of landslides that occur on slopes near a channel. They can also initiate within the channel in areas of accelerated erosion during heavy rainfall or snowmelt.
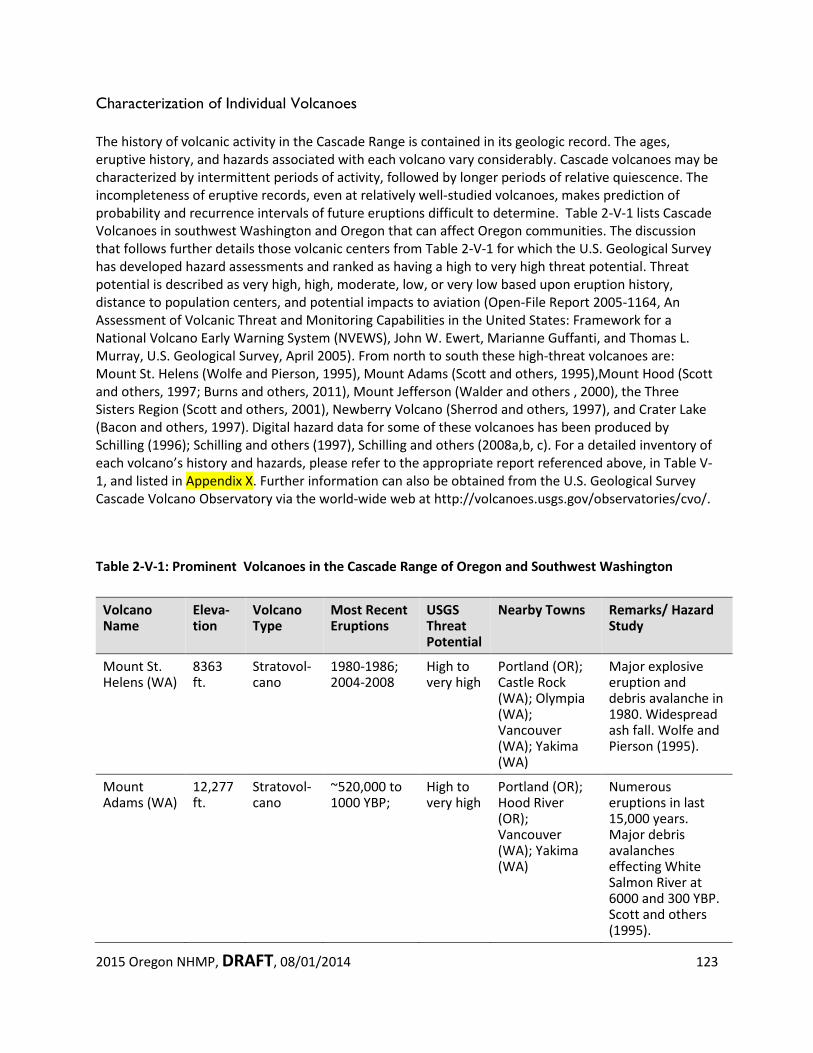
2015 Oregon NHMP, DRAFT, 08/01/2014 123
Characterization of Individual Volcanoes The history of volcanic activity in the Cascade Range is contained in its geologic record. The ages, eruptive history, and hazards associated with each volcano vary considerably. Cascade volcanoes may be characterized by intermittent periods of activity, followed by longer periods of relative quiescence. The incompleteness of eruptive records, even at relatively well-studied volcanoes, makes prediction of probability and recurrence intervals of future eruptions difficult to determine. Table 2-V-1 lists Cascade Volcanoes in southwest Washington and Oregon that can affect Oregon communities. The discussion that follows further details those volcanic centers from Table 2-V-1 for which the U.S. Geological Survey has developed hazard assessments and ranked as having a high to very high threat potential. Threat potential is described as very high, high, moderate, low, or very low based upon eruption history, distance to population centers, and potential impacts to aviation (Open-File Report 2005-1164, An Assessment of Volcanic Threat and Monitoring Capabilities in the United States: Framework for a National Volcano Early Warning System (NVEWS), John W. Ewert, Marianne Guffanti, and Thomas L. Murray, U.S. Geological Survey, April 2005). From north to south these high-threat volcanoes are: Mount St. Helens (Wolfe and Pierson, 1995), Mount Adams (Scott and others, 1995),Mount Hood (Scott and others, 1997; Burns and others, 2011), Mount Jefferson (Walder and others , 2000), the Three Sisters Region (Scott and others, 2001), Newberry Volcano (Sherrod and others, 1997), and Crater Lake (Bacon and others, 1997). Digital hazard data for some of these volcanoes has been produced by Schilling (1996); Schilling and others (1997), Schilling and others (2008a,b, c). For a detailed inventory of each volcano’s history and hazards, please refer to the appropriate report referenced above, in Table V-1, and listed in Appendix X. Further information can also be obtained from the U.S. Geological Survey Cascade Volcano Observatory via the world-wide web at http://volcanoes.usgs.gov/observatories/cvo/.
Table 2-V-1: Prominent Volcanoes in the Cascade Range of Oregon and Southwest Washington
Volcano Name
Eleva-tion
Volcano Type
Most Recent Eruptions
USGS Threat Potential
Nearby Towns Remarks/ Hazard Study
Mount St. Helens (WA)
8363 ft.
Stratovol-cano
1980-1986; 2004-2008
High to very high
Portland (OR); Castle Rock (WA); Olympia (WA); Vancouver (WA); Yakima (WA)
Major explosive eruption and debris avalanche in 1980. Widespread ash fall. Wolfe and Pierson (1995).
Mount Adams (WA)
12,277 ft.
Stratovol-cano
~520,000 to 1000 YBP;
High to very high
Portland (OR); Hood River (OR); Vancouver (WA); Yakima (WA)
Numerous eruptions in last 15,000 years. Major debris avalanches effecting White Salmon River at 6000 and 300 YBP. Scott and others (1995).
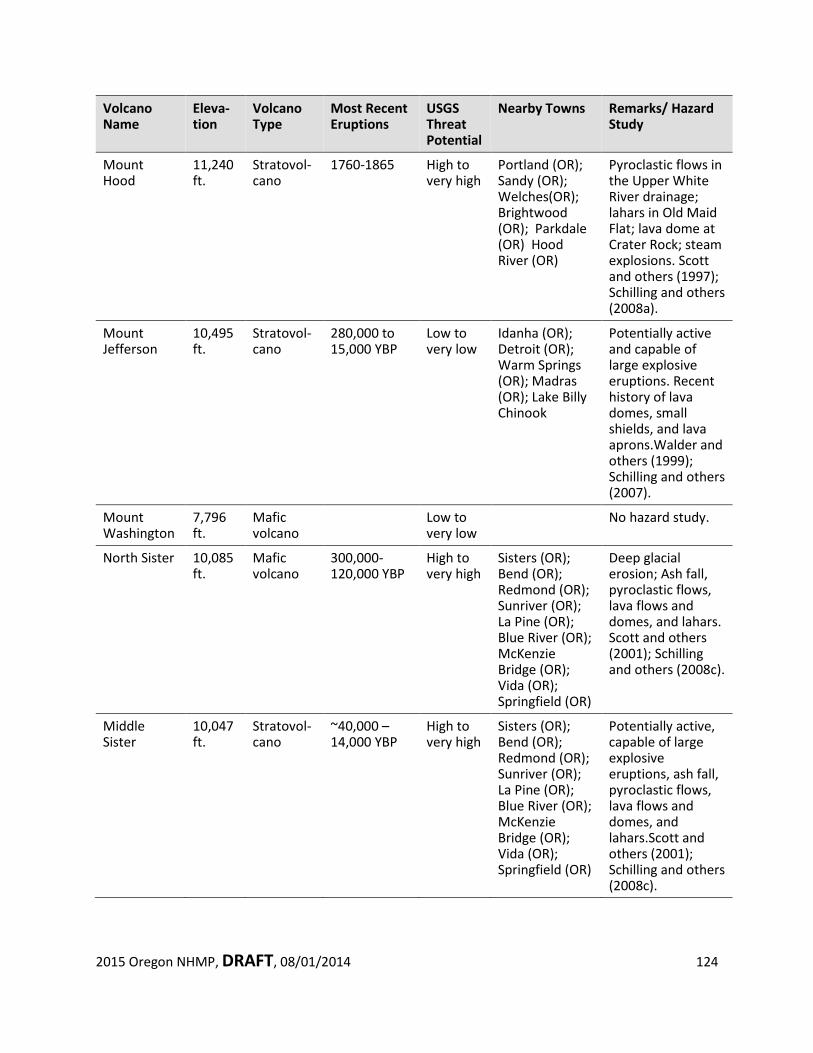
2015 Oregon NHMP, DRAFT, 08/01/2014 124
Volcano Name
Eleva-tion
Volcano Type
Most Recent Eruptions
USGS Threat Potential
Nearby Towns Remarks/ Hazard Study
Mount Hood
11,240 ft.
Stratovol-cano
1760-1865 High to very high
Portland (OR); Sandy (OR); Welches(OR); Brightwood (OR); Parkdale (OR) Hood River (OR)
Pyroclastic flows in the Upper White River drainage; lahars in Old Maid Flat; lava dome at Crater Rock; steam explosions. Scott and others (1997); Schilling and others (2008a).
Mount Jefferson
10,495 ft.
Stratovol-cano
280,000 to 15,000 YBP
Low to very low
Idanha (OR); Detroit (OR); Warm Springs (OR); Madras (OR); Lake Billy Chinook
Potentially active and capable of large explosive eruptions. Recent history of lava domes, small shields, and lava aprons.Walder and others (1999); Schilling and others (2007).
Mount Washington
7,796 ft.
Mafic volcano
Low to very low
No hazard study.
North Sister 10,085 ft.
Mafic volcano
300,000- 120,000 YBP
High to very high
Sisters (OR); Bend (OR); Redmond (OR); Sunriver (OR); La Pine (OR); Blue River (OR); McKenzie Bridge (OR); Vida (OR); Springfield (OR)
Deep glacial erosion; Ash fall, pyroclastic flows, lava flows and domes, and lahars. Scott and others (2001); Schilling and others (2008c).
Middle Sister
10,047 ft.
Stratovol-cano
~40,000 – 14,000 YBP
High to very high
Sisters (OR); Bend (OR); Redmond (OR); Sunriver (OR); La Pine (OR); Blue River (OR); McKenzie Bridge (OR); Vida (OR); Springfield (OR)
Potentially active, capable of large explosive eruptions, ash fall, pyroclastic flows, lava flows and domes, and lahars.Scott and others (2001); Schilling and others (2008c).
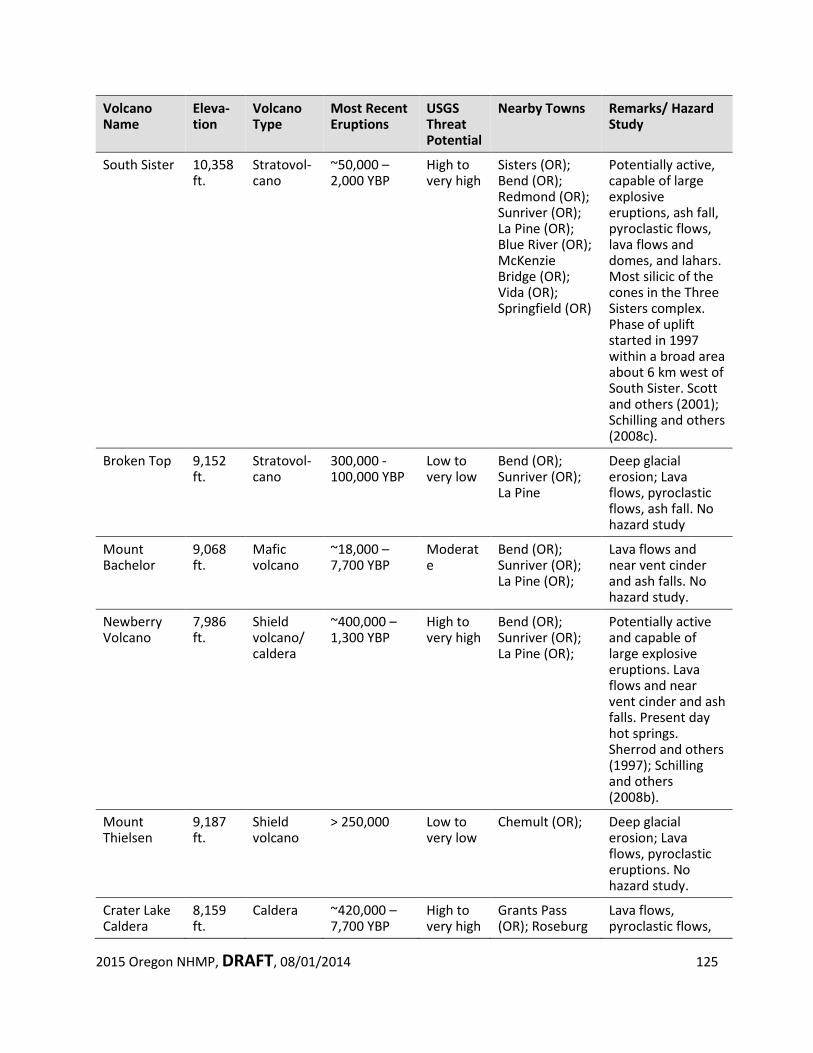
2015 Oregon NHMP, DRAFT, 08/01/2014 125
Volcano Name
Eleva-tion
Volcano Type
Most Recent Eruptions
USGS Threat Potential
Nearby Towns Remarks/ Hazard Study
South Sister 10,358 ft.
Stratovol-cano
~50,000 – 2,000 YBP
High to very high
Sisters (OR); Bend (OR); Redmond (OR); Sunriver (OR); La Pine (OR); Blue River (OR); McKenzie Bridge (OR); Vida (OR); Springfield (OR)
Potentially active, capable of large explosive eruptions, ash fall, pyroclastic flows, lava flows and domes, and lahars. Most silicic of the cones in the Three Sisters complex. Phase of uplift started in 1997 within a broad area about 6 km west of South Sister. Scott and others (2001); Schilling and others (2008c).
Broken Top 9,152 ft.
Stratovol-cano
300,000 - 100,000 YBP
Low to very low
Bend (OR); Sunriver (OR); La Pine
Deep glacial erosion; Lava flows, pyroclastic flows, ash fall. No hazard study
Mount Bachelor
9,068 ft.
Mafic volcano
~18,000 – 7,700 YBP
Moderate
Bend (OR); Sunriver (OR); La Pine (OR);
Lava flows and near vent cinder and ash falls. No hazard study.
Newberry Volcano
7,986 ft.
Shield volcano/ caldera
~400,000 – 1,300 YBP
High to very high
Bend (OR); Sunriver (OR); La Pine (OR);
Potentially active and capable of large explosive eruptions. Lava flows and near vent cinder and ash falls. Present day hot springs. Sherrod and others (1997); Schilling and others (2008b).
Mount Thielsen
9,187 ft.
Shield volcano
> 250,000 Low to very low
Chemult (OR); Deep glacial erosion; Lava flows, pyroclastic eruptions. No hazard study.
Crater Lake Caldera
8,159 ft.
Caldera ~420,000 – 7,700 YBP
High to very high
Grants Pass (OR); Roseburg
Lava flows, pyroclastic flows,
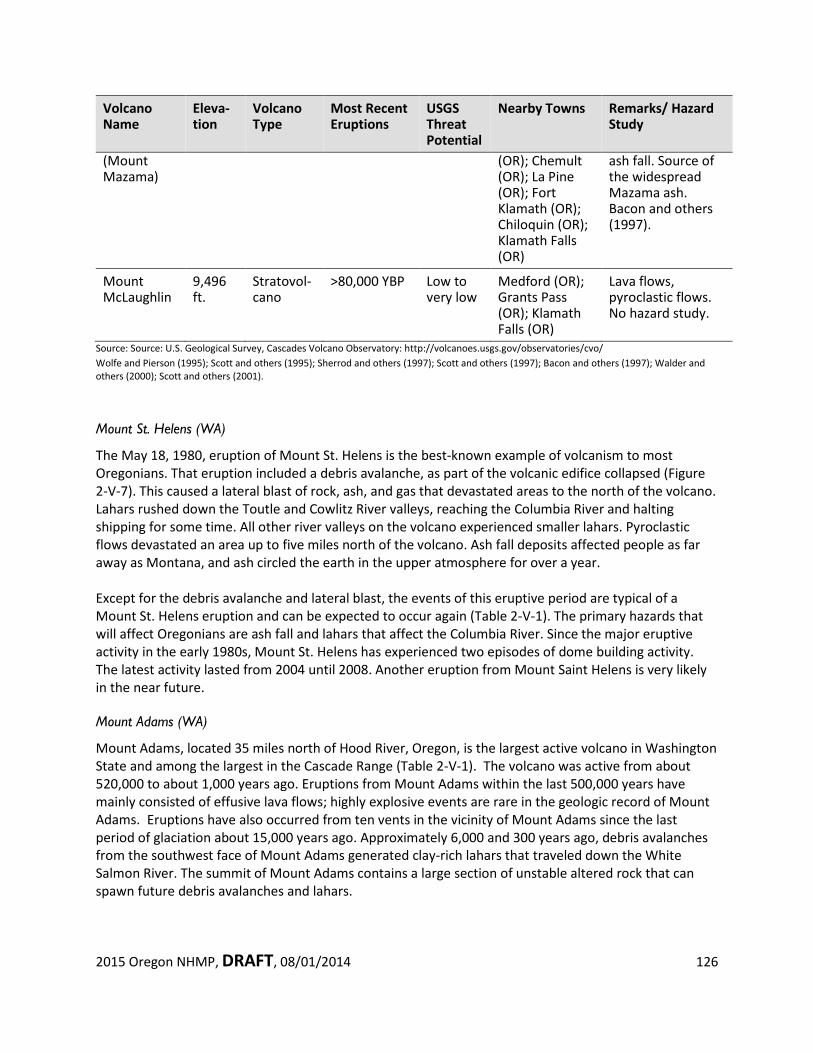
2015 Oregon NHMP, DRAFT, 08/01/2014 126
Volcano Name
Eleva-tion
Volcano Type
Most Recent Eruptions
USGS Threat Potential
Nearby Towns Remarks/ Hazard Study
(Mount Mazama)
(OR); Chemult (OR); La Pine (OR); Fort Klamath (OR); Chiloquin (OR); Klamath Falls (OR)
ash fall. Source of the widespread Mazama ash. Bacon and others (1997).
Mount McLaughlin
9,496 ft.
Stratovol-cano
>80,000 YBP Low to very low
Medford (OR); Grants Pass (OR); Klamath Falls (OR)
Lava flows, pyroclastic flows. No hazard study.
Source: Source: U.S. Geological Survey, Cascades Volcano Observatory: http://volcanoes.usgs.gov/observatories/cvo/ Wolfe and Pierson (1995); Scott and others (1995); Sherrod and others (1997); Scott and others (1997); Bacon and others (1997); Walder and others (2000); Scott and others (2001).
Mount St. Helens (WA)
The May 18, 1980, eruption of Mount St. Helens is the best-known example of volcanism to most Oregonians. That eruption included a debris avalanche, as part of the volcanic edifice collapsed (Figure 2-V-7). This caused a lateral blast of rock, ash, and gas that devastated areas to the north of the volcano. Lahars rushed down the Toutle and Cowlitz River valleys, reaching the Columbia River and halting shipping for some time. All other river valleys on the volcano experienced smaller lahars. Pyroclastic flows devastated an area up to five miles north of the volcano. Ash fall deposits affected people as far away as Montana, and ash circled the earth in the upper atmosphere for over a year. Except for the debris avalanche and lateral blast, the events of this eruptive period are typical of a Mount St. Helens eruption and can be expected to occur again (Table 2-V-1). The primary hazards that will affect Oregonians are ash fall and lahars that affect the Columbia River. Since the major eruptive activity in the early 1980s, Mount St. Helens has experienced two episodes of dome building activity. The latest activity lasted from 2004 until 2008. Another eruption from Mount Saint Helens is very likely in the near future. Mount Adams (WA)
Mount Adams, located 35 miles north of Hood River, Oregon, is the largest active volcano in Washington State and among the largest in the Cascade Range (Table 2-V-1). The volcano was active from about 520,000 to about 1,000 years ago. Eruptions from Mount Adams within the last 500,000 years have mainly consisted of effusive lava flows; highly explosive events are rare in the geologic record of Mount Adams. Eruptions have also occurred from ten vents in the vicinity of Mount Adams since the last period of glaciation about 15,000 years ago. Approximately 6,000 and 300 years ago, debris avalanches from the southwest face of Mount Adams generated clay-rich lahars that traveled down the White Salmon River. The summit of Mount Adams contains a large section of unstable altered rock that can spawn future debris avalanches and lahars.
2015 Oregon NHMP, DRAFT, 08/01/2014 127
Potential hazards from Mount Adams include lava flows near the central vent area and lahars that could reach and disrupt the Columbia River channel. Such lahars may have little or no advanced warning. Mount Hood
The last major eruption of Mount Hood occurred in approximately 1781 (232 years ago)(Tables 2- V-1 and 2). The Sandy River that drains the volcano’s northwest side was originally named the Quicksand River by Lewis and Clark, who traversed the area only a couple of years after an eruption. Lahars had filled the river channel with debris, much of which has now been scoured away. There were two other minor periods of eruptions during the last 500 years, the last in the mid-1800s. Typically, these involved lava flows near the summit, pyroclastic flows, and lahars but little ash fall. From its recent eruptive history, the volcano is most likely to erupt from the south side, but planning should be done assuming eruptions could be centered anywhere on the mountain. A large eruption could generate pyroclastic flows and lahars that could inundate the entire length of the Sandy and White River Valleys. An eruption from the north flank could affect the Hood River Valley. Due to its proximity to the Portland metropolitan area, major east-west highways, the Bull Run Reservoir (which supplies water to a majority of Portland area residents), and ski and summer recreation areas, Mount Hood poses the greatest potential volcanic hazard to Oregonians. In addition, a large volume of debris and sediment in lahars could affect shipping lanes in the Columbia River and operation of Bonneville and The Dalles dams. In recent years, numerous debris flows caused by winter storms have flowed down river drainages. Highway 35 is periodically closed for repair work after these events damaged the bridge over the White River. If a volcanic event occurred, the same drainages would be affected.
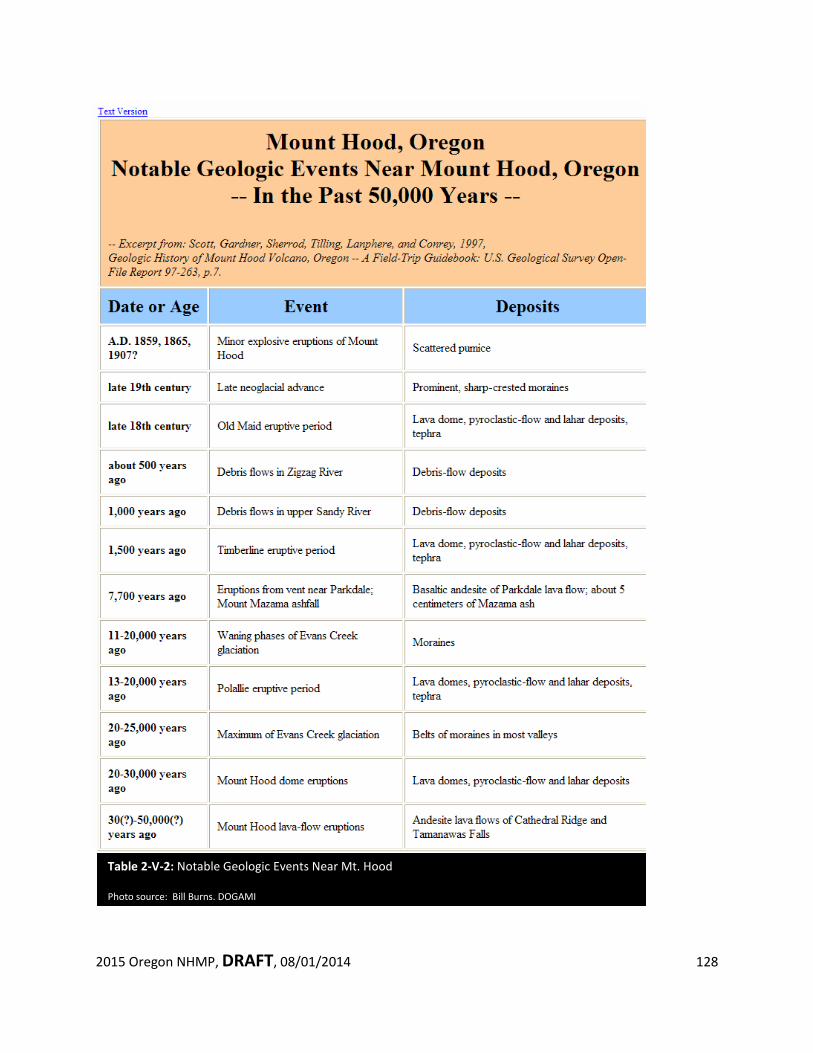
2015 Oregon NHMP, DRAFT, 08/01/2014 128
Table 2-V-2: Notable Geologic Events Near Mt. Hood
Photo source: Bill Burns, DOGAMI
2015 Oregon NHMP, DRAFT, 08/01/2014 129
Mount Jefferson
Mount Jefferson is located in a relatively unpopulated part of the Cascade Range. The last eruptive episode at Mount Jefferson was about 15,000 years ago. Research at stratovolcanoes around the world indicates that Mount Jefferson should be regarded as dormant, not extinct. The steep slopes of the volcano provide the setting for possible debris flows and lahars, even without an eruption. These would be confined to valleys, generally within 10 miles of the volcano. A major eruption, however unlikely in the short term, could generate pyroclastic flows and lahars that would travel up to a few dozen miles down river valleys. Two reservoirs could be affected by pyroclastic flows from a major eruption: Detroit Lake and Lake Billy Chinook. An explosive eruption could spew ash for hundreds of miles in the downwind direction. Many smaller volcanoes are located between Mount Jefferson and Mount Hood to the north and Three Sisters to the south. Eruptions from any of these would be primarily erupt cinders and ash to form cinder cones. Three Sisters Region North Sister has probably been inactive for at least 100,000 years (Table 2-V-1). Middle Sister last erupted between 25,000 and 15,000 years ago. South Sister had a very small ongoing uplift, which began in 1996 and became undetectable by 2003. The uplift was about one inch a year and likely indicated movement of a small amount of magma. At this writing, there is no indication that the uplift will ever develop into a volcanic eruption. However, that possibility cannot be ruled out. Hence, the Cascade Volcano Observatory has increased their monitoring of the area over the past several years.
Future eruptions at South Sister (and possibly Middle Sister) are likely to include lava flows, pyroclastic flows, and lahars. The possibility exists for lahars to travel many miles down valley floors, if an eruption melts a large amount of snow and ice. Ash fall would likely be contained within 20 miles of the vent. Newberry Volcano
Newberry Volcano, unlike the stratovolcanoes of the Cascade Range, is a shield volcano with broad, relatively gently sloping flanks composed of stacked basaltic lavas flows (Table 2-V-1). The volcano is about 400,000 years old and has had thousands of eruptions both from the central vent area and along its flanks. The present 4 by 5 mi wide caldera at Newberry Volcano's summit formed about 75,000 years ago by a major explosive eruption and collapse event. This was the most recent of at least three caldera- forming eruptions that lofted pumice and ash high into the air and spread pyroclastic flows across the volcano's surface. The most recent eruption was 1,300 years ago when the “Big Obsidian Flow”, a glassy rhyolitic lava flow, erupted within the caldera. Future eruptions are likely to include lava flows, pyroclastic flows, lahars, and ash fall. Newberry Volcano has attracted interest for its geothermal potential. The heat under the volcano, with temperatures in some areas in excess of 509 degrees Fahrenheit, is evidence that it is only dormant.
Crater Lake Caldera About 7,700 years ago, Mount Mazama erupted with great violence, leaving the caldera that Crater Lake now occupies (Table V-1). Layers of ash produced from that eruption have been found in eight western states and three Canadian provinces. The countryside surrounding Crater Lake was covered by
2015 Oregon NHMP, DRAFT, 08/01/2014 130
pyroclastic flows. Wizard Island is the result of much smaller eruptions since that cataclysm. The most recent eruption was about 5,000 years ago and occurred within the caldera. No eruptions have occurred outside the caldera since 10,000 years ago.
This potentially active volcanic center is contained within Crater Lake National Park. The western half of the caldera is considered the most likely site of future activity. Effects from volcanic activity (e.g., ash fall, lava flows) are likely to remain within the caldera. If an eruption occurs outside the caldera, pyroclastic flows and lahars could affect valleys up to a few dozen miles from the erupting vent. The probability of another caldera-forming eruption is very low, as is the probability of eruptions occurring outside the caldera.
Other Volcanic Areas of Oregon
On the scale of geologic time, volcanic eruptions may occur in other parts of Oregon. However, on a human time scale, the probability of an eruption outside the Cascades is so low as to be negligible.
Although the high, snow-topped mountains of the Cascades are Oregon’s most visible volcanoes, other potential eruptive centers exist. These include smaller peaks, such as the Belknap shield volcano in central Oregon, which had a lava flow about 1,400 years ago. Several smaller volcanoes, including Diamond Craters and Jordan Craters, in the High Lava Plains of southeast Oregon have experienced recent eruptions in the last 7,000 years. Generally non-explosive eruptions at these sites have built complexes of lava flow fields and cinder cones. Hazards associated with future eruptions in sparsely populated southeast Oregon would most likely include lava flows covering many square miles; ash and volcanic gases derived from these eruptions may be regionally significant.
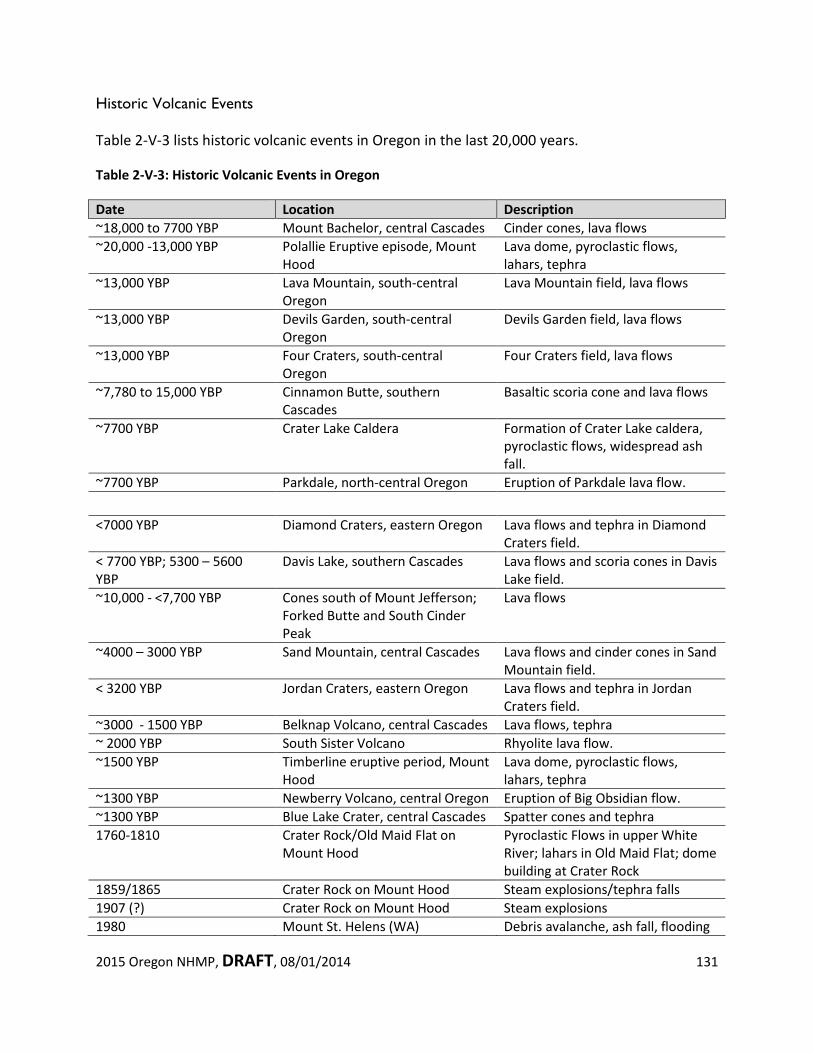
2015 Oregon NHMP, DRAFT, 08/01/2014 131
Historic Volcanic Events
Table 2-V-3 lists historic volcanic events in Oregon in the last 20,000 years.
Table 2-V-3: Historic Volcanic Events in Oregon
Date Location Description ~18,000 to 7700 YBP Mount Bachelor, central Cascades Cinder cones, lava flows ~20,000 -13,000 YBP Polallie Eruptive episode, Mount
Hood Lava dome, pyroclastic flows, lahars, tephra
~13,000 YBP Lava Mountain, south-central Oregon
Lava Mountain field, lava flows
~13,000 YBP Devils Garden, south-central Oregon
Devils Garden field, lava flows
~13,000 YBP Four Craters, south-central Oregon
Four Craters field, lava flows
~7,780 to 15,000 YBP Cinnamon Butte, southern Cascades
Basaltic scoria cone and lava flows
~7700 YBP Crater Lake Caldera Formation of Crater Lake caldera, pyroclastic flows, widespread ash fall.
~7700 YBP Parkdale, north-central Oregon Eruption of Parkdale lava flow.
<7000 YBP Diamond Craters, eastern Oregon Lava flows and tephra in Diamond Craters field.
< 7700 YBP; 5300 – 5600 YBP
Davis Lake, southern Cascades Lava flows and scoria cones in Davis Lake field.
~10,000 - <7,700 YBP Cones south of Mount Jefferson; Forked Butte and South Cinder Peak
Lava flows
~4000 – 3000 YBP Sand Mountain, central Cascades Lava flows and cinder cones in Sand Mountain field.
< 3200 YBP Jordan Craters, eastern Oregon Lava flows and tephra in Jordan Craters field.
~3000 - 1500 YBP Belknap Volcano, central Cascades Lava flows, tephra ~ 2000 YBP South Sister Volcano Rhyolite lava flow. ~1500 YBP Timberline eruptive period, Mount
Hood Lava dome, pyroclastic flows, lahars, tephra
~1300 YBP Newberry Volcano, central Oregon Eruption of Big Obsidian flow. ~1300 YBP Blue Lake Crater, central Cascades Spatter cones and tephra 1760-1810 Crater Rock/Old Maid Flat on
Mount Hood Pyroclastic Flows in upper White River; lahars in Old Maid Flat; dome building at Crater Rock
1859/1865 Crater Rock on Mount Hood Steam explosions/tephra falls 1907 (?) Crater Rock on Mount Hood Steam explosions 1980 Mount St. Helens (WA) Debris avalanche, ash fall, flooding
2015 Oregon NHMP, DRAFT, 08/01/2014 132
on Columbia River 1981-1986 Mount St. Helens (WA) Lava dome growth, steam, lahars 1989-2001 Mount St. Helens (WA) Hydrothermal explosions 2004-2008 Mount St. Helens (WA) Lava dome growth, steam, ash Sources: Source: Source: U.S. Geological Survey, Cascades Volcano Observatory: http://volcanoes.usgs.gov/observatories/cvo/ Wolfe and Pierson (1995); Sherrod and others (1997); Scott and others (1997); Bacon and others (1997); Walder and others (2000); Scott and others (2001). Probability Geologists can make general forecasts of long-term volcanic activity from careful characterization of past activity, but they cannot supply a timeline. Several U.S. Geological Survey open-file reports provide the odds of certain events taking place at particular volcanoes. However, the U.S. Geological Survey stresses that government officials and the public must realize the limitations in forecasting eruptions and be prepared for such uncertainty. Short-range forecasts, on the order of months or weeks, are often possible. There are usually several signs of impending volcanic activity that may lead up to eruptions. The upward movement of magma into a volcano prior to an eruption generally causes a significant increase in small, localized earthquakes and an increase in emission of carbon dioxide and compounds of sulfur and chlorine that can be measured in volcanic springs and the atmosphere above the volcano. Changes in the depth or location of magma beneath a volcano often cause changes in elevation. These changes can be detected through ground instrumentation or remote sensing (for example, this was how the South Sister Bulge uplift was discovered). The Cascades Volcanic Observatory (CVO) employs scientists from a range of disciplines to continually assess and monitor volcanic activity in the Cascade Ranges. If anomalous patterns are detected (for example, an increase in earthquakes), CVO staff coordinate the resources necessary to study the volcano
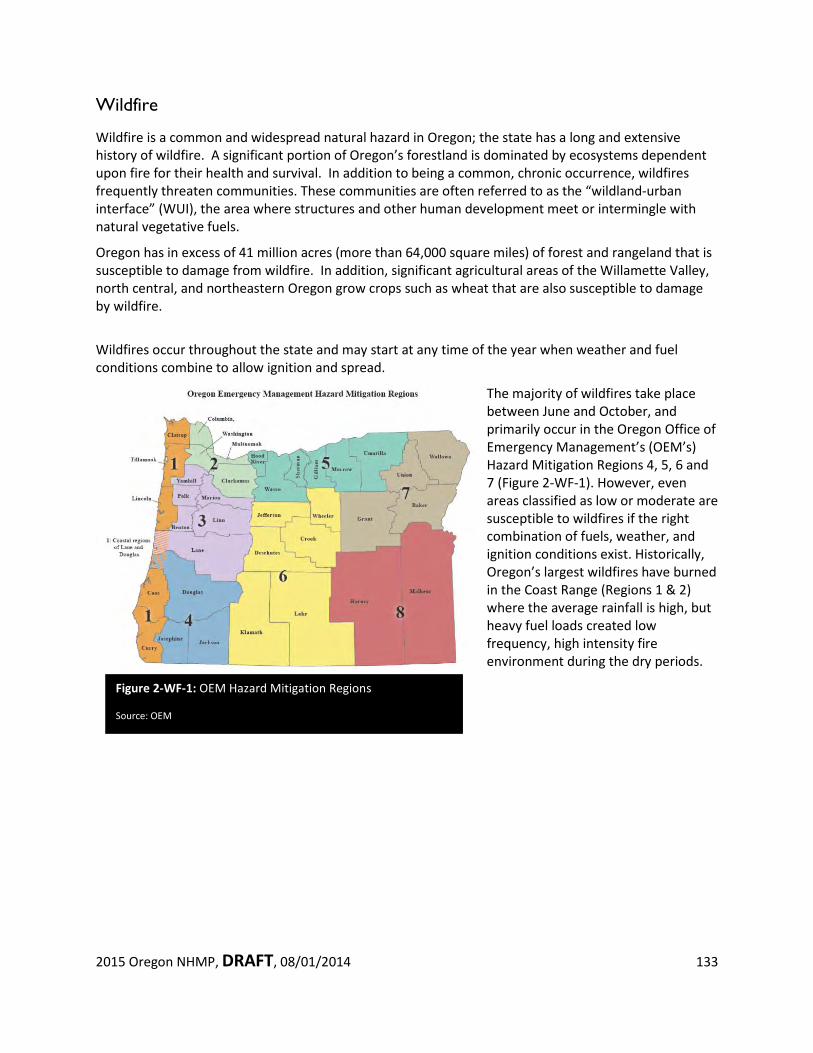
2015 Oregon NHMP, DRAFT, 08/01/2014 133
Wildfire
Wildfire is a common and widespread natural hazard in Oregon; the state has a long and extensive history of wildfire. A significant portion of Oregon’s forestland is dominated by ecosystems dependent upon fire for their health and survival. In addition to being a common, chronic occurrence, wildfires frequently threaten communities. These communities are often referred to as the “wildland-urban interface” (WUI), the area where structures and other human development meet or intermingle with natural vegetative fuels.
Oregon has in excess of 41 million acres (more than 64,000 square miles) of forest and rangeland that is susceptible to damage from wildfire. In addition, significant agricultural areas of the Willamette Valley, north central, and northeastern Oregon grow crops such as wheat that are also susceptible to damage by wildfire.
Wildfires occur throughout the state and may start at any time of the year when weather and fuel conditions combine to allow ignition and spread.
The majority of wildfires take place between June and October, and primarily occur in the Oregon Office of Emergency Management’s (OEM’s) Hazard Mitigation Regions 4, 5, 6 and 7 (Figure 2-WF-1). However, even areas classified as low or moderate are susceptible to wildfires if the right combination of fuels, weather, and ignition conditions exist. Historically, Oregon’s largest wildfires have burned in the Coast Range (Regions 1 & 2) where the average rainfall is high, but heavy fuel loads created low frequency, high intensity fire environment during the dry periods.
Figure 2-WF-1: OEM Hazard Mitigation Regions Source: OEM
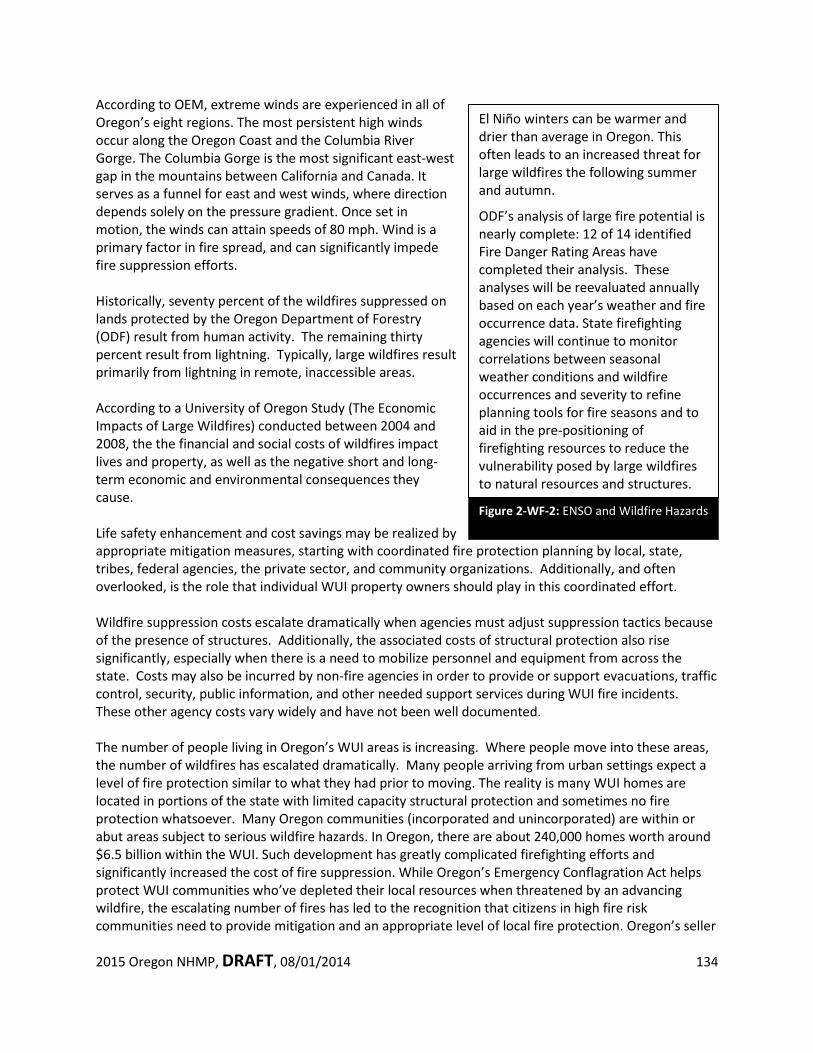
2015 Oregon NHMP, DRAFT, 08/01/2014 134
Figure 2-WF-2: ENSO and Wildfire Hazards
According to OEM, extreme winds are experienced in all of Oregon’s eight regions. The most persistent high winds occur along the Oregon Coast and the Columbia River Gorge. The Columbia Gorge is the most significant east-west gap in the mountains between California and Canada. It serves as a funnel for east and west winds, where direction depends solely on the pressure gradient. Once set in motion, the winds can attain speeds of 80 mph. Wind is a primary factor in fire spread, and can significantly impede fire suppression efforts. Historically, seventy percent of the wildfires suppressed on lands protected by the Oregon Department of Forestry (ODF) result from human activity. The remaining thirty percent result from lightning. Typically, large wildfires result primarily from lightning in remote, inaccessible areas. According to a University of Oregon Study (The Economic Impacts of Large Wildfires) conducted between 2004 and 2008, the the financial and social costs of wildfires impact lives and property, as well as the negative short and long-term economic and environmental consequences they cause. Life safety enhancement and cost savings may be realized by appropriate mitigation measures, starting with coordinated fire protection planning by local, state, tribes, federal agencies, the private sector, and community organizations. Additionally, and often overlooked, is the role that individual WUI property owners should play in this coordinated effort. Wildfire suppression costs escalate dramatically when agencies must adjust suppression tactics because of the presence of structures. Additionally, the associated costs of structural protection also rise significantly, especially when there is a need to mobilize personnel and equipment from across the state. Costs may also be incurred by non-fire agencies in order to provide or support evacuations, traffic control, security, public information, and other needed support services during WUI fire incidents. These other agency costs vary widely and have not been well documented. The number of people living in Oregon’s WUI areas is increasing. Where people move into these areas, the number of wildfires has escalated dramatically. Many people arriving from urban settings expect a level of fire protection similar to what they had prior to moving. The reality is many WUI homes are located in portions of the state with limited capacity structural protection and sometimes no fire protection whatsoever. Many Oregon communities (incorporated and unincorporated) are within or abut areas subject to serious wildfire hazards. In Oregon, there are about 240,000 homes worth around $6.5 billion within the WUI. Such development has greatly complicated firefighting efforts and significantly increased the cost of fire suppression. While Oregon’s Emergency Conflagration Act helps protect WUI communities who’ve depleted their local resources when threatened by an advancing wildfire, the escalating number of fires has led to the recognition that citizens in high fire risk communities need to provide mitigation and an appropriate level of local fire protection. Oregon’s seller
El Niño winters can be warmer and drier than average in Oregon. This often leads to an increased threat for large wildfires the following summer and autumn.
ODF’s analysis of large fire potential is nearly complete: 12 of 14 identified Fire Danger Rating Areas have completed their analysis. These analyses will be reevaluated annually based on each year’s weather and fire occurrence data. State firefighting agencies will continue to monitor correlations between seasonal weather conditions and wildfire occurrences and severity to refine planning tools for fire seasons and to aid in the pre-positioning of firefighting resources to reduce the vulnerability posed by large wildfires to natural resources and structures.
2015 Oregon NHMP, DRAFT, 08/01/2014 135
disclosure requires a statement of whether or not property is classified as forestland-urban interface. Collaboration and coordination is ongoing among several agencies to promote educational efforts through programs like Firewise, the Oregon Forestland Urban Interface Fire Protection Act, and Fire Adapted Communities from the National Cohesive Wildfire Strategy. While many homes already exist in WUI areas, increasing construction in vulnerable areas also increases risk for vulnerable populations. The initial role of land use, such as Oregon’s Goal 4 and Goal 7 play critical roles and guidance to development in these areas29. Life safety enhancement and cost saving mitigation measures include Community Wildfire Protection Plans (CWPP), coordinated fire protection planning and coordination by local, state, tribal, federal agencies, the private sector, and community organizations. Many local communities use their CWPP as their wildland fire chapter in their Local Natural Hazards Mitigation Plan (LNHMP). Overabundant, dense forest fuels, particularly on public lands, are a focus of mitigation discussion. The Healthy Forest Restoration Act is focused on reducing overly dense vegetation and trees to create fuel breaks, provide funding and guidance to reduce or eliminate hazardous fuels in National Forests, improve forest fire fighting, and research new methods to reduce the impact of invasive insects. Oregon’s efforts in and near WUI areas are a massive task, but are resulting in improvements. Not only does it take many years, sustaining the work requires a substantial, ongoing financial commitment. Progress is often challenging because fuel mitigation methods are not universally accepted and are often controversial. However, recurring WUI fires continue to bring the issue into public focus as well as unite communities and stakeholders in a common set of values.
Analysis and Characterization
History of Wildfire
Wildfires have been a feature of the Oregon landscape for thousands of years. Prehistoric fires resulted from lightning and from the practices of Native Americans. The Blue Mountains in northeastern Oregon were named by early immigrants, because of the existence of a perpetual, blue colored wildfire smoke haze that lingered over the region. Between 1840 and 1900, wildland fires burned at least two million acres of forestland in western Oregon. It is believed settlers caused many of these fires. Following the establishment of the U.S. Forest Service and Oregon Department of Forestry, in 1905 and 1911, respectively, an aggressive and coordinated system of fire prevention and suppression emerged. However, it took several decades before significant gains were made. Major wildfires in 1933, 1939, 1945 and 1951 burned across more than 355,000 acres in the northern Coast Range and became known collectively as the “Tillamook Burn.”
29 Oregon’s Statewide Planning Goals http://oregon.gov/LCD/goals.shtml#Statewide_Planning_Goals
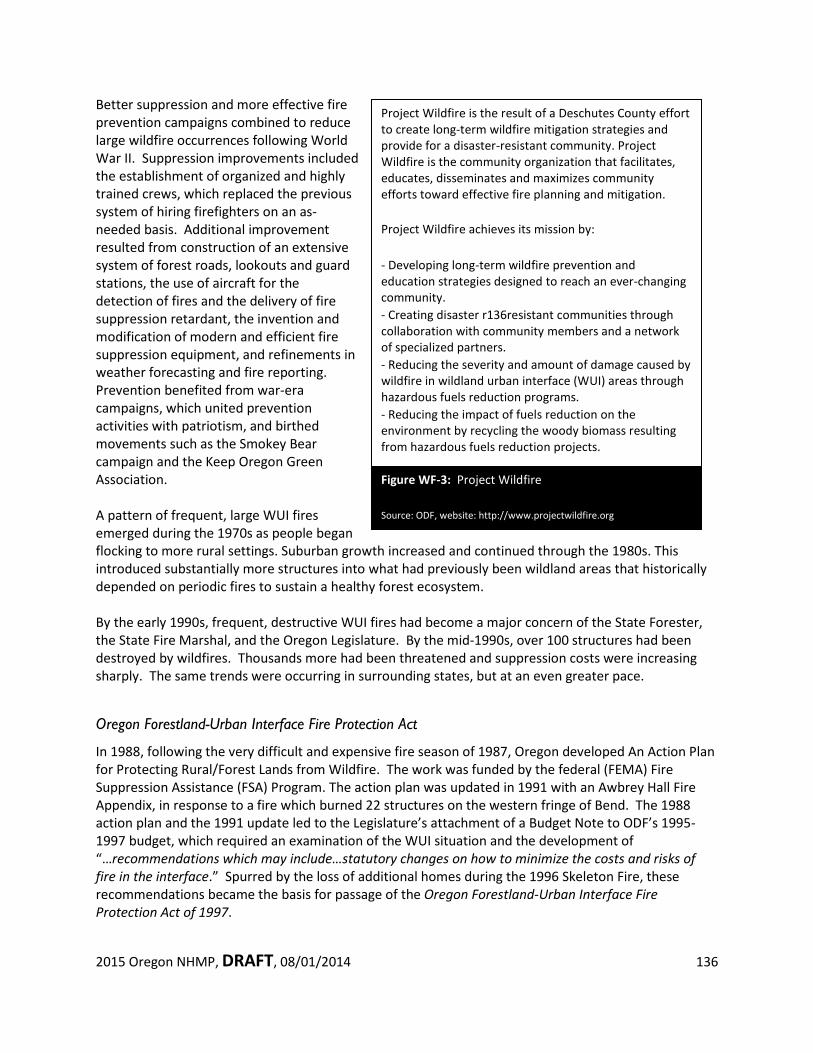
2015 Oregon NHMP, DRAFT, 08/01/2014 136
Project Wildfire is the result of a Deschutes County effort to create long-term wildfire mitigation strategies and provide for a disaster-resistant community. Project Wildfire is the community organization that facilitates, educates, disseminates and maximizes community efforts toward effective fire planning and mitigation.
Project Wildfire achieves its mission by:
- Developing long-term wildfire prevention and education strategies designed to reach an ever-changing community.
- Creating disaster r136resistant communities through collaboration with community members and a network of specialized partners.
- Reducing the severity and amount of damage caused by wildfire in wildland urban interface (WUI) areas through hazardous fuels reduction programs.
- Reducing the impact of fuels reduction on the environment by recycling the woody biomass resulting from hazardous fuels reduction projects.
Better suppression and more effective fire prevention campaigns combined to reduce large wildfire occurrences following World War II. Suppression improvements included the establishment of organized and highly trained crews, which replaced the previous system of hiring firefighters on an as-needed basis. Additional improvement resulted from construction of an extensive system of forest roads, lookouts and guard stations, the use of aircraft for the detection of fires and the delivery of fire suppression retardant, the invention and modification of modern and efficient fire suppression equipment, and refinements in weather forecasting and fire reporting. Prevention benefited from war-era campaigns, which united prevention activities with patriotism, and birthed movements such as the Smokey Bear campaign and the Keep Oregon Green Association. A pattern of frequent, large WUI fires emerged during the 1970s as people began flocking to more rural settings. Suburban growth increased and continued through the 1980s. This introduced substantially more structures into what had previously been wildland areas that historically depended on periodic fires to sustain a healthy forest ecosystem. By the early 1990s, frequent, destructive WUI fires had become a major concern of the State Forester, the State Fire Marshal, and the Oregon Legislature. By the mid-1990s, over 100 structures had been destroyed by wildfires. Thousands more had been threatened and suppression costs were increasing sharply. The same trends were occurring in surrounding states, but at an even greater pace.
Oregon Forestland-Urban Interface Fire Protection Act
In 1988, following the very difficult and expensive fire season of 1987, Oregon developed An Action Plan for Protecting Rural/Forest Lands from Wildfire. The work was funded by the federal (FEMA) Fire Suppression Assistance (FSA) Program. The action plan was updated in 1991 with an Awbrey Hall Fire Appendix, in response to a fire which burned 22 structures on the western fringe of Bend. The 1988 action plan and the 1991 update led to the Legislature’s attachment of a Budget Note to ODF’s 1995-1997 budget, which required an examination of the WUI situation and the development of “…recommendations which may include…statutory changes on how to minimize the costs and risks of fire in the interface.” Spurred by the loss of additional homes during the 1996 Skeleton Fire, these recommendations became the basis for passage of the Oregon Forestland-Urban Interface Fire Protection Act of 1997.
Figure WF-3: Project Wildfire
Source: ODF, website: http://www.projectwildfire.org
2015 Oregon NHMP, DRAFT, 08/01/2014 137
The Act recognized that “…forestland-urban interface property owners have a basic responsibility to share in a complete and coordinated protection system...” In addition, during the 1990s, prevention and mitigation of WUI fires included enactment of the Wildfire Hazard Zone process and the inclusion of defensible space requirements in the land use planning process. Significant efforts were made to increase voluntary landowner participation, through aggressive awareness campaigns, such as FireFree, Project Wildfire, Project Impact, Firewise, and other locally driven programs. Through the years, Oregon’s wildfire suppression system continued to improve. Firefighters benefited from improved training, coordination, and equipment. Better interagency initial attack cooperation, the growth of private crew and fire engine wildfire suppression resources, formation of structural incident management teams, and regional coordination of fire suppression are additional examples of these continued improvements. Technology has improved as well with the addition of lightning tracking software and fire detection cameras to support or replace deteriorating lookout towers. Nevertheless, the frequency of wildfires threatening WUI communities continues to underscore the need for urgent action. The summer of 2002 included eleven Emergency Conflagration Act incidents, with as many as five running concurrently. More than 50 structures burned and, at one point, the entire Illinois Valley in Josephine County seemed under siege from the Biscuit Fire, Oregon’s largest wildfire on record. This wildfire threatened the homes of approximately 17,000 people, with over 4,000 homes under imminent evacuation alert. At almost 500,000 acres, it was the nation’s largest wildfire of the year. The summer of 2013 once again brought to bear one of the worst fire season’s in Oregon. For the first time since 1951, more than 100,000 acres burned on lands protected by the Oregon Department of Forestry. Five incident management teams were deployed in a period of three days following a dry lightning thunderstorm event in late July that sparked nearly 100 fires in southern Oregon from more than 300 lightning strikes. Another storm that passed over central and eastern Oregon in mid-August produced significant fires that threatened the communities of John Day and The Dalles. Since 1996, Oregon has had 52 declared Conflagrations under the Act. Oregon’s mitigation efforts since 2002 have influenced a dramatic decrease in these types of fires, resulting in none to three per year through 2011. (see Appendix X for more information on Conflagration Fires from 1996 to 2011)
Types of Wildfire
Wildfires burn primarily in vegetative fuels located outside highly urbanized areas. Wildfires may be broadly categorized as agricultural, forest, range, or WUI fires. Agricultural - Fires burning in areas where the primary fuels are flammable cultivated crops, such as wheat. This type of fire tends to spread very rapidly, but is relatively easy to suppress if adequate resources are available. Structures threatened are usually few in number and generally belong to the property owner. There may be significant losses in terms of agricultural products from such fires. Forest - The classic wildfire; these fires burn in fuels composed primarily of timber and associated fuels, such as brush, grass, and logging residue. Due to variations of fuel, weather, and topography, this type of fire may be extremely difficult and costly to suppress. In wilderness areas these types of fires are often monitored and allowed to burn for the benefits brought by the ecology of fire, but also pose a risk to private lands when these fires escape these wilderness areas.
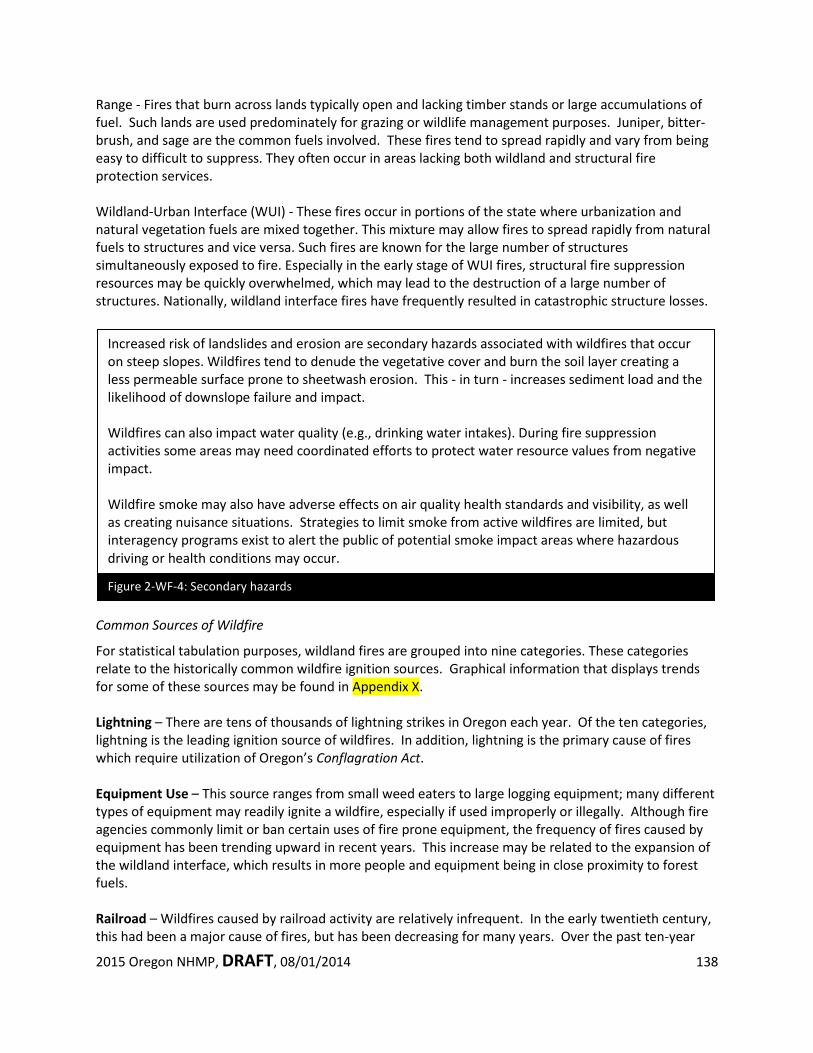
2015 Oregon NHMP, DRAFT, 08/01/2014 138
Figure 2-WF-4: Secondary hazards
Increased risk of landslides and erosion are secondary hazards associated with wildfires that occur on steep slopes. Wildfires tend to denude the vegetative cover and burn the soil layer creating a less permeable surface prone to sheetwash erosion. This - in turn - increases sediment load and the likelihood of downslope failure and impact. Wildfires can also impact water quality (e.g., drinking water intakes). During fire suppression activities some areas may need coordinated efforts to protect water resource values from negative impact. Wildfire smoke may also have adverse effects on air quality health standards and visibility, as well as creating nuisance situations. Strategies to limit smoke from active wildfires are limited, but interagency programs exist to alert the public of potential smoke impact areas where hazardous driving or health conditions may occur.
Range - Fires that burn across lands typically open and lacking timber stands or large accumulations of fuel. Such lands are used predominately for grazing or wildlife management purposes. Juniper, bitter-brush, and sage are the common fuels involved. These fires tend to spread rapidly and vary from being easy to difficult to suppress. They often occur in areas lacking both wildland and structural fire protection services. Wildland-Urban Interface (WUI) - These fires occur in portions of the state where urbanization and natural vegetation fuels are mixed together. This mixture may allow fires to spread rapidly from natural fuels to structures and vice versa. Such fires are known for the large number of structures simultaneously exposed to fire. Especially in the early stage of WUI fires, structural fire suppression resources may be quickly overwhelmed, which may lead to the destruction of a large number of structures. Nationally, wildland interface fires have frequently resulted in catastrophic structure losses.
Common Sources of Wildfire
For statistical tabulation purposes, wildland fires are grouped into nine categories. These categories relate to the historically common wildfire ignition sources. Graphical information that displays trends for some of these sources may be found in Appendix X. Lightning – There are tens of thousands of lightning strikes in Oregon each year. Of the ten categories, lightning is the leading ignition source of wildfires. In addition, lightning is the primary cause of fires which require utilization of Oregon’s Conflagration Act. Equipment Use – This source ranges from small weed eaters to large logging equipment; many different types of equipment may readily ignite a wildfire, especially if used improperly or illegally. Although fire agencies commonly limit or ban certain uses of fire prone equipment, the frequency of fires caused by equipment has been trending upward in recent years. This increase may be related to the expansion of the wildland interface, which results in more people and equipment being in close proximity to forest fuels. Railroad – Wildfires caused by railroad activity are relatively infrequent. In the early twentieth century, this had been a major cause of fires, but has been decreasing for many years. Over the past ten-year
2015 Oregon NHMP, DRAFT, 08/01/2014 139
period, the number of fires has leveled out. In the past few decades, Oregon has responded to railroad caused fires with aggressive fire investigation and cost recovery efforts. Oregon Department of Forestry works with the railroad on hazard abatement along tracks and requires water cars and chase vehicles during high fire danger. The resulting quick return to normal fire incidence showed that railroad fires are preventable. Recreation – The trend in fires caused by people recreating in and near Oregon's forests has been rising over the past ten years. This trend may reflect the state's growing population and as well as a greater interest in outdoor recreation opportunities. Debris Burning – Historically, fires resulting from debris burning activities has been a leading cause of human caused wildfires. Aggressive prevention activities, coupled with an increasing use of local burning bans during the wildfire season, has begun to show positive results. Many debris burning fires occur outside the confines of fire season, which has led to increased awareness during the spring and fall months leading into and out of fire season. Juvenile – The trend in the incidence of juveniles starting wildland fires is downward in recent years. This is attributed to concerted effort by local fire prevention cooperatives to deliver fire prevention messages directly to school classrooms and the Office of the State Fire Marshall’s (OSFM’s) aggressive youth intervention program. In 1999, according to the ODF, juveniles were reported to have started 60 wildland fires. Conversely, juveniles accounted for just 17 fires in 2013 and, on average, have only accounted for 25 fires per year over the last 10 years. Additionally, parents or guardians, under Oregon Law, are responsible for damages done by fires started by their children. ORS 30.765 covers the liability of parents; ORS 163.577 holds parents or guardians accountable for child supervision; ORS 477.745 makes parents liable for wildfire suppression costs of a fire by a minor child; and ORS 480.158 holds a parent liable for fireworks caused fires. Additionally, parents may be assessed civil penalties. Arson – Oregon experienced a rapid rise in the frequency of arson caused fires in the early ‘90s. 1992 was the worst fire season for arson with 96 fires attributed to the category. In response, the state instituted aggressive arson prevention activities with solid working relationships with local law enforcement and the arson division of the Oregon State Police. The result has seen the 10-year average slightly decline with just 41 fires occurring annually since 2004. Smoking – Fires caused by smoking and improperly discarded cigarettes is down. It is not known if this is due to fewer people smoking, recent modifications producing self extinguishing cigarettes, or better investigation of fire causes. Miscellaneous – Wildfires resulting from a wide array of causes: automobile accidents, burning homes, pest control measures, shooting tracer ammunition and exploding targets, and electric fence use are a few of the causes in this category. The frequency of such fires has been rising in recent years.
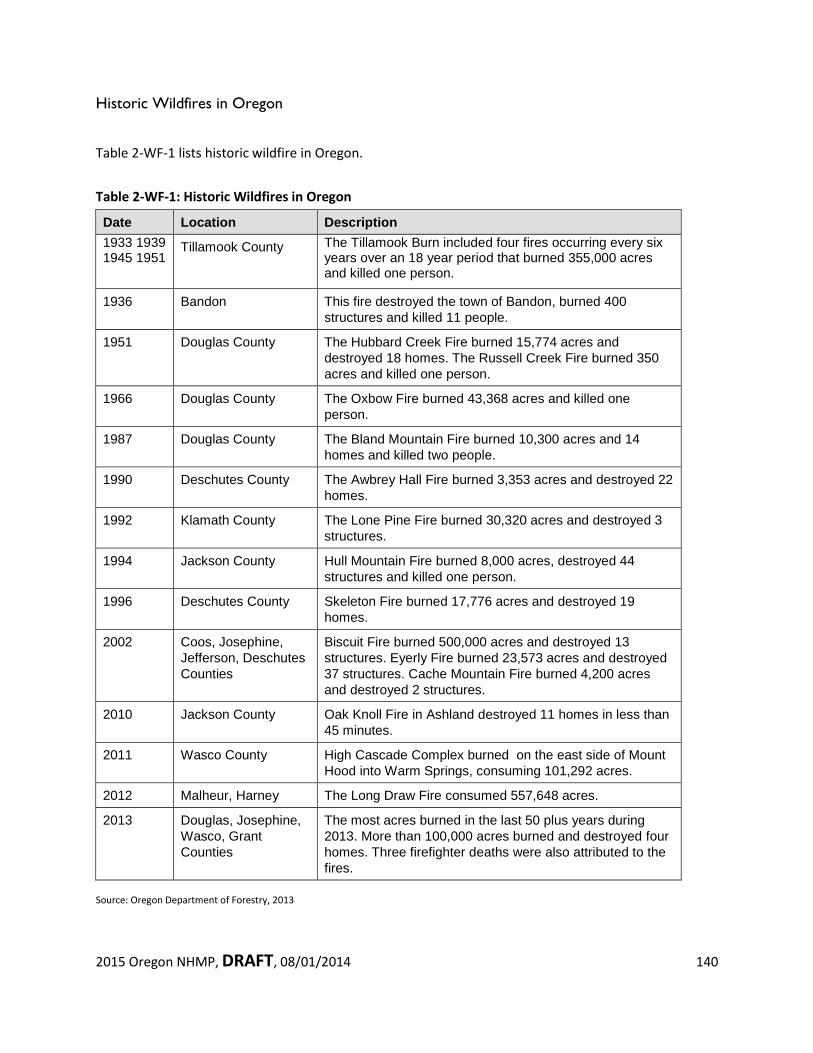
2015 Oregon NHMP, DRAFT, 08/01/2014 140
Historic Wildfires in Oregon
Table 2-WF-1 lists historic wildfire in Oregon. Table 2-WF-1: Historic Wildfires in Oregon
Date Location Description 1933 1939 1945 1951
Tillamook County The Tillamook Burn included four fires occurring every six years over an 18 year period that burned 355,000 acres and killed one person.
1936 Bandon This fire destroyed the town of Bandon, burned 400 structures and killed 11 people.
1951 Douglas County The Hubbard Creek Fire burned 15,774 acres and destroyed 18 homes. The Russell Creek Fire burned 350 acres and killed one person.
1966 Douglas County The Oxbow Fire burned 43,368 acres and killed one person.
1987 Douglas County The Bland Mountain Fire burned 10,300 acres and 14 homes and killed two people.
1990 Deschutes County The Awbrey Hall Fire burned 3,353 acres and destroyed 22 homes.
1992 Klamath County The Lone Pine Fire burned 30,320 acres and destroyed 3 structures.
1994 Jackson County Hull Mountain Fire burned 8,000 acres, destroyed 44 structures and killed one person.
1996 Deschutes County Skeleton Fire burned 17,776 acres and destroyed 19 homes.
2002 Coos, Josephine, Jefferson, Deschutes Counties
Biscuit Fire burned 500,000 acres and destroyed 13 structures. Eyerly Fire burned 23,573 acres and destroyed 37 structures. Cache Mountain Fire burned 4,200 acres and destroyed 2 structures.
2010 Jackson County Oak Knoll Fire in Ashland destroyed 11 homes in less than 45 minutes.
2011 Wasco County High Cascade Complex burned on the east side of Mount Hood into Warm Springs, consuming 101,292 acres.
2012 Malheur, Harney The Long Draw Fire consumed 557,648 acres.
2013 Douglas, Josephine, Wasco, Grant Counties
The most acres burned in the last 50 plus years during 2013. More than 100,000 acres burned and destroyed four homes. Three firefighter deaths were also attributed to the fires.
Source: Oregon Department of Forestry, 2013
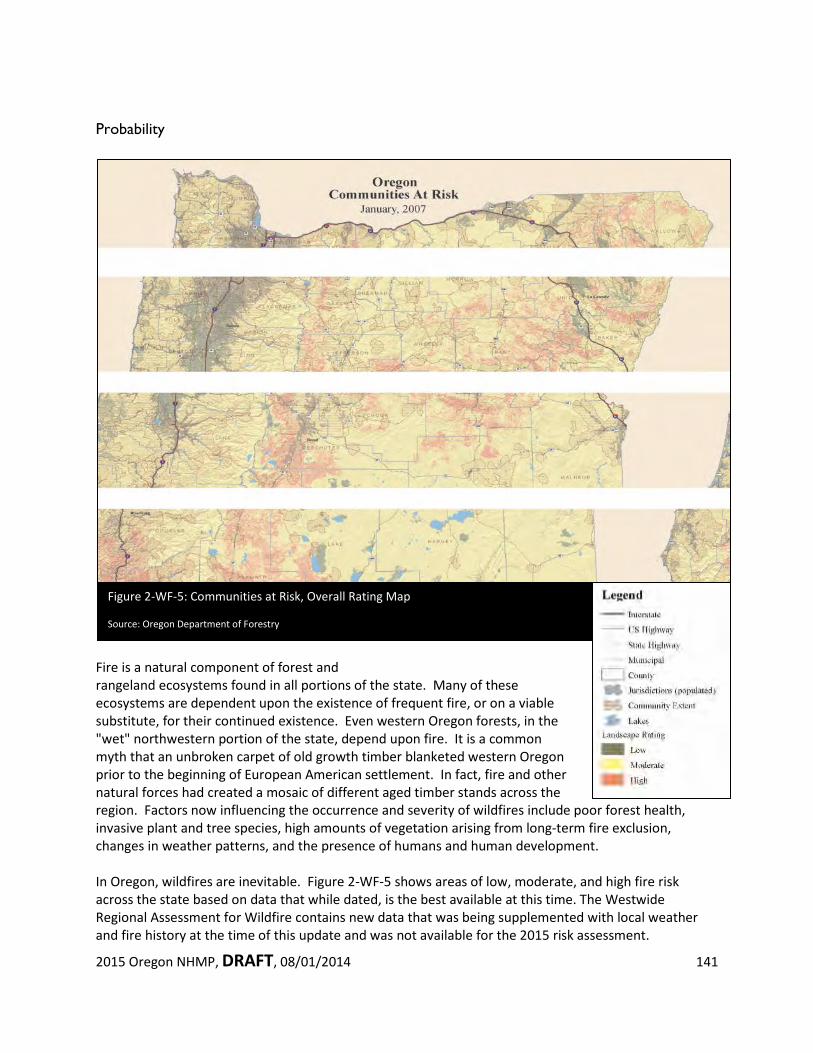
2015 Oregon NHMP, DRAFT, 08/01/2014 141
Figure 2-WF-5: Communities at Risk, Overall Rating Map Source: Oregon Department of Forestry
Probability
Fire is a natural component of forest and rangeland ecosystems found in all portions of the state. Many of these ecosystems are dependent upon the existence of frequent fire, or on a viable substitute, for their continued existence. Even western Oregon forests, in the "wet" northwestern portion of the state, depend upon fire. It is a common myth that an unbroken carpet of old growth timber blanketed western Oregon prior to the beginning of European American settlement. In fact, fire and other natural forces had created a mosaic of different aged timber stands across the region. Factors now influencing the occurrence and severity of wildfires include poor forest health, invasive plant and tree species, high amounts of vegetation arising from long-term fire exclusion, changes in weather patterns, and the presence of humans and human development. In Oregon, wildfires are inevitable. Figure 2-WF-5 shows areas of low, moderate, and high fire risk across the state based on data that while dated, is the best available at this time. The Westwide Regional Assessment for Wildfire contains new data that was being supplemented with local weather and fire history at the time of this update and was not available for the 2015 risk assessment.
2015 Oregon NHMP, DRAFT, 08/01/2014 142
Although usually thought of as being a summer occurrence, wildland fires can occur during any month of the year. The vast majority of wildfires burn during the June to October time period. Dry spells during the winter months, especially when combined with winds and dead fuels, may result in fires that burn with an intensity and a rate of spread that surprises many people. During a typical year, in excess of 2,500 wildland fires are ignited on protected forestlands in Oregon. On lands protected by ODF, the ten-year trend in both the incidence of human caused fires and the acres they burn across is rising. When compared to Oregon's rapidly increasing population, the trend in the number of human caused wildland fires has also been trending upward.
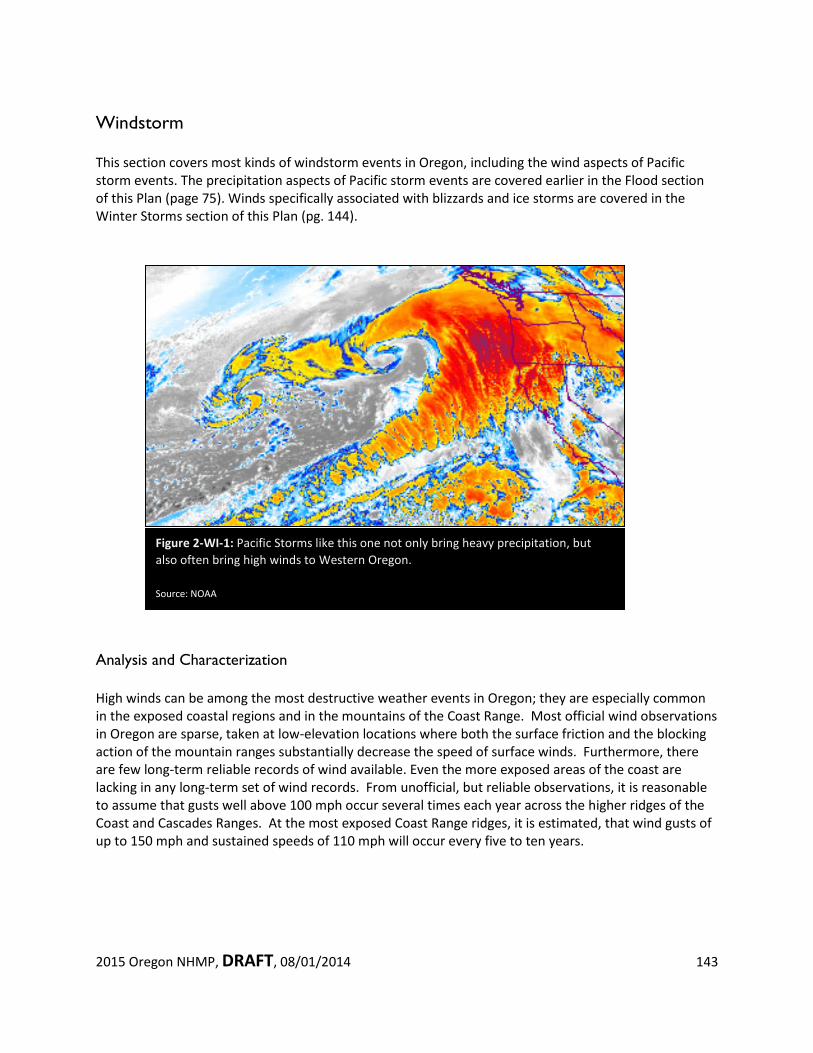
2015 Oregon NHMP, DRAFT, 08/01/2014 143
Windstorm This section covers most kinds of windstorm events in Oregon, including the wind aspects of Pacific storm events. The precipitation aspects of Pacific storm events are covered earlier in the Flood section of this Plan (page 75). Winds specifically associated with blizzards and ice storms are covered in the Winter Storms section of this Plan (pg. 144).
Analysis and Characterization High winds can be among the most destructive weather events in Oregon; they are especially common in the exposed coastal regions and in the mountains of the Coast Range. Most official wind observations in Oregon are sparse, taken at low-elevation locations where both the surface friction and the blocking action of the mountain ranges substantially decrease the speed of surface winds. Furthermore, there are few long-term reliable records of wind available. Even the more exposed areas of the coast are lacking in any long-term set of wind records. From unofficial, but reliable observations, it is reasonable to assume that gusts well above 100 mph occur several times each year across the higher ridges of the Coast and Cascades Ranges. At the most exposed Coast Range ridges, it is estimated, that wind gusts of up to 150 mph and sustained speeds of 110 mph will occur every five to ten years.
Figure 2-WI-1: Pacific Storms like this one not only bring heavy precipitation, but also often bring high winds to Western Oregon.
Source: NOAA
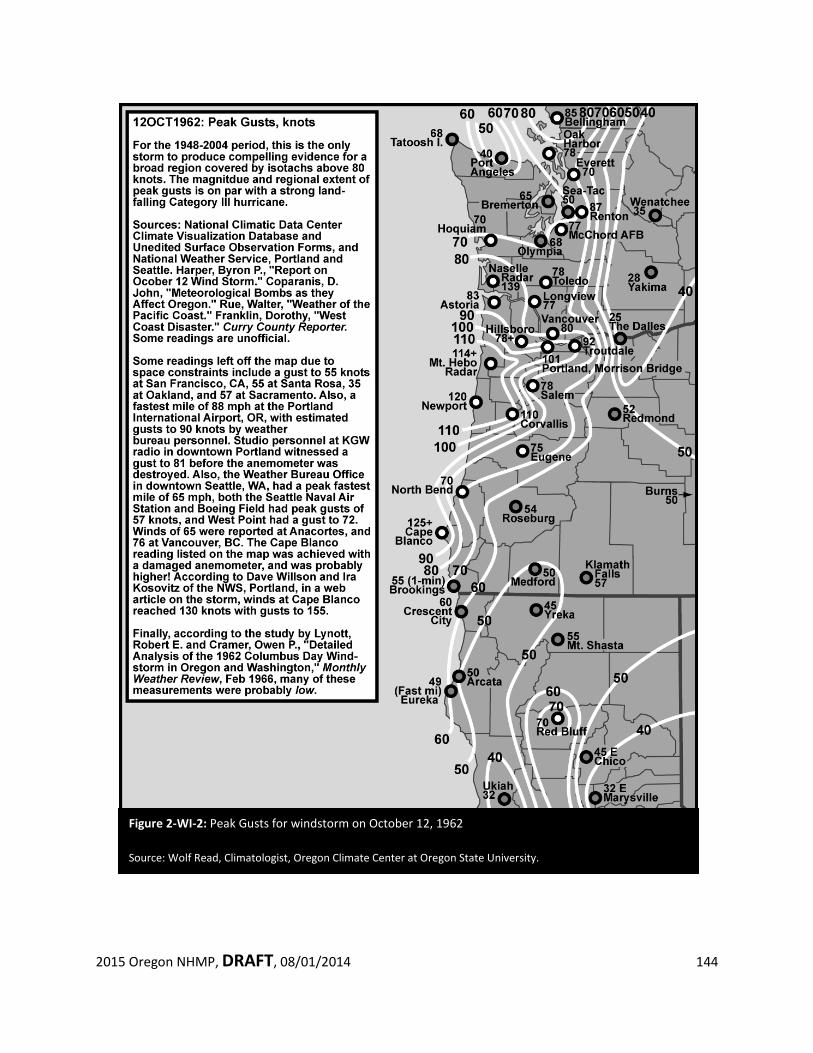
2015 Oregon NHMP, DRAFT, 08/01/2014 144
Figure 2-WI-2: Peak Gusts for windstorm on October 12, 1962 Source: Wolf Read, Climatologist, Oregon Climate Center at Oregon State University.
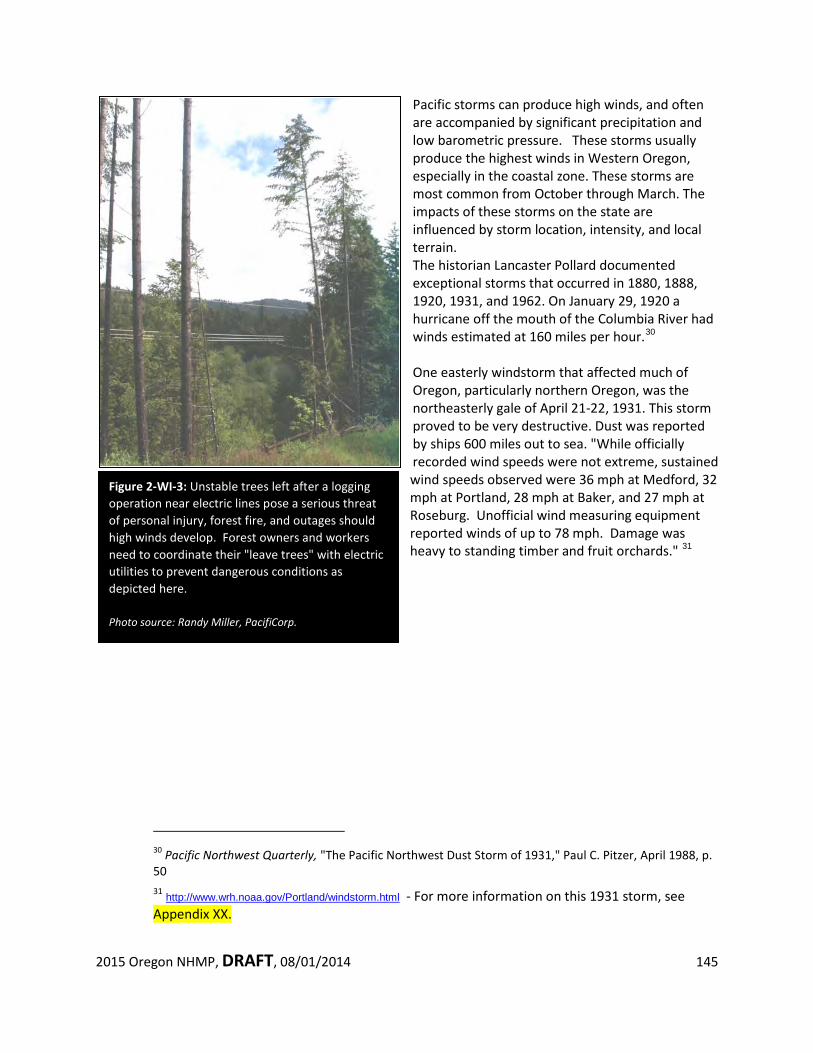
2015 Oregon NHMP, DRAFT, 08/01/2014 145
Figure 2-WI-3: Unstable trees left after a logging operation near electric lines pose a serious threat of personal injury, forest fire, and outages should high winds develop. Forest owners and workers need to coordinate their "leave trees" with electric utilities to prevent dangerous conditions as depicted here.
Photo source: Randy Miller, PacifiCorp.
Pacific storms can produce high winds, and often are accompanied by significant precipitation and low barometric pressure. These storms usually produce the highest winds in Western Oregon, especially in the coastal zone. These storms are most common from October through March. The impacts of these storms on the state are influenced by storm location, intensity, and local terrain. The historian Lancaster Pollard documented exceptional storms that occurred in 1880, 1888, 1920, 1931, and 1962. On January 29, 1920 a hurricane off the mouth of the Columbia River had winds estimated at 160 miles per hour.30 One easterly windstorm that affected much of Oregon, particularly northern Oregon, was the northeasterly gale of April 21-22, 1931. This storm proved to be very destructive. Dust was reported by ships 600 miles out to sea. "While officially recorded wind speeds were not extreme, sustained wind speeds observed were 36 mph at Medford, 32 mph at Portland, 28 mph at Baker, and 27 mph at Roseburg. Unofficial wind measuring equipment reported winds of up to 78 mph. Damage was heavy to standing timber and fruit orchards." 31
30 Pacific Northwest Quarterly, "The Pacific Northwest Dust Storm of 1931," Paul C. Pitzer, April 1988, p. 50 31 http://www.wrh.noaa.gov/Portland/windstorm.html - For more information on this 1931 storm, see Appendix XX.
2015 Oregon NHMP, DRAFT, 08/01/2014 146
Effects
The damaging effects of windstorms may extend for distances of 100 to 300 miles from the center of storm activity. Isolated wind phenomena in the mountainous regions have more localized effects. Near-surface winds and associated pressure effects exert loads on walls, doors, windows, and roofs, sometimes causing structural components to fail.
Positive wind pressure is a direct and frontal assault on a structure, pushing walls, doors, and windows inward. Negative pressure also affects the sides and roof: passing currents create lift and suction forces that act to pull building components and surfaces outward. The effects of high velocity winds are magnified in the upper levels of multi-story structures. As positive and negative forces impact and remove the building protective envelope (doors, windows, and walls), internal pressures rise and result in roof or leeward building component failures and considerable structural damage.
Debris carried along by extreme winds can directly contribute to loss of life and indirectly to the failure of protective building envelope components. Upon impact, wind-driven debris can rupture a building, allowing more significant positive and internal pressures. When severe windstorms strike a community, downed trees, powerlines, and damaged property are major hindrances to response and recovery.
The most destructive winds are those which blow from the south, parallel to the major mountain ranges. The Columbus Day Storm of 1962 was a classic example of a south windstorm. The storm developed from Tyhoon Freda remnants in the Gulf of Alaska, deepened off the coast of California and moved from the southwest, then turned, coming into Oregon directly from the south. This was the most damaging windstorm in Oregon of the last century. Winds in the Willamette Valley topped 100 mph, while in the Coast Range they exceeded 140 mph. The Columbus Day Storm was the equivalent of a Category IV hurricane in terms of central pressure and wind speeds.
In terms of damage, "throughout the Willamette Valley, undamaged homes were the exception, not the rule. In 1962 dollars, the Columbus Day Storm caused an estimated $230-280 million in damage to property in California, Oregon, Washington and British Columbia combined, with $170-200 million happening in Oregon alone. This damage figure is comparable to eastern hurricanes that made landfall in the 1957-1961 time period...The (Columbus Day Storm) was declared the worst natural disaster of 1962 by the Metropolitan Life Insurance Company. In terms of timber loss, about 11.2 billion board feet was felled... in Oregon and Washington combined."32 "The storm claimed 46 lives, injured hundreds more, and knocked power out for several million people.33
32 http://www.climate.washington.edu/stormking/ 33 http://www.wrh.noaa.gov/pqr/info/pdf/pacwindstorms.pdf
2015 Oregon NHMP, DRAFT, 08/01/2014 147
Other Issues
In the Hazard Mitigation Survey Team (HMST) Report developed in response to the February 7, 2002 windstorm the recommended observation issued that "differences in definitions of easements and allowable practices within them ('easement language') for private versus public, and urban forests vs. rural forests should be resolved." The State IHMT agencies agree that this issue continues to exist, but neither the resources nor the political will exist at this time to attempt to fix this complicated issue with many vested stakeholders. Two other issues identified in that report also continue to exist, but cannot be solved at this time:
1. "Land use actions being proposed by agencies with non-utility interests, which would affect land for which utilities have an interest, should be coordinated and should address vegetation management as it affects utility system operations", and
2. "Agencies and organizations should be identified to work with federal and state landowners to streamline processes by which electric utilities conduct hazard mitigation work on those lands..." Currently, ODOT issues permits for right-of-way work and ODF issues permits for the use of power equipment in forested areas.
Other areas of ongoing concern from this HMST Report are: • Under Coordination - Utility providers should receive notification, from property owners, of planned
tree-harvesting operations near utility lines.
• Under Vegetation Management - Diseased, damaged, and hazard trees near powerlines that could fall or hit utility lines should be removed. Some "leave trees" remaining after new building developments and tree harvesting operations pose a threat to utility line safety and reliability. See Appendix W-3 to this chapter, How to Recognize and Prevent Tree Hazards, for progress that has been made towards vegetation management issues.
• Under Engineering, Construction, and Compliance - "During initial planning and design of utility lines, identify types of geographic areas already known to pose hazards during windstorms. Inventory and analyze areas of repetitive failures to determine alternate designs and construction methods that will mitigate future damages... Consider selective undergrounding of lines where repetitive tree damage occurs, keeping in mind excavations can undermine tree root zones and create new hazards."
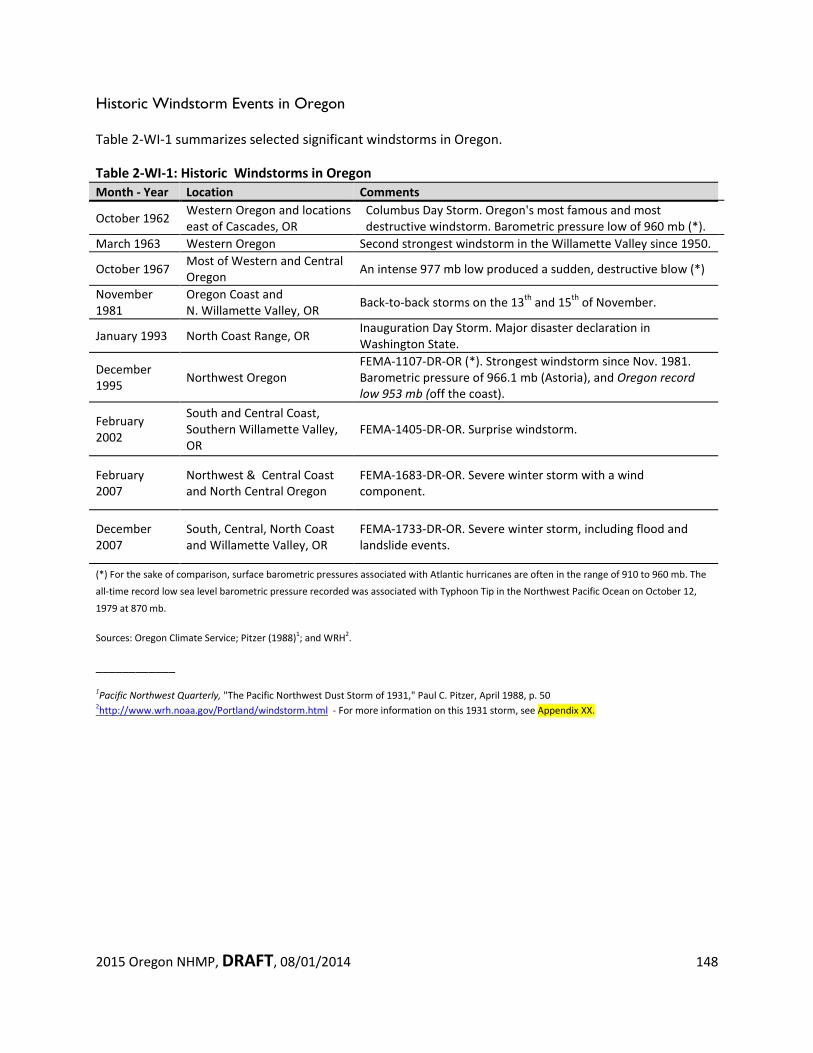
2015 Oregon NHMP, DRAFT, 08/01/2014 148
Historic Windstorm Events in Oregon
Table 2-WI-1 summarizes selected significant windstorms in Oregon.
Table 2-WI-1: Historic Windstorms in Oregon Month - Year Location Comments
October 1962 Western Oregon and locations east of Cascades, OR
Columbus Day Storm. Oregon's most famous and most destructive windstorm. Barometric pressure low of 960 mb (*).
March 1963 Western Oregon Second strongest windstorm in the Willamette Valley since 1950.
October 1967 Most of Western and Central Oregon An intense 977 mb low produced a sudden, destructive blow (*)
November 1981
Oregon Coast and N. Willamette Valley, OR Back-to-back storms on the 13th and 15th of November.
January 1993 North Coast Range, OR Inauguration Day Storm. Major disaster declaration in Washington State.
December 1995 Northwest Oregon
FEMA-1107-DR-OR (*). Strongest windstorm since Nov. 1981. Barometric pressure of 966.1 mb (Astoria), and Oregon record low 953 mb (off the coast).
February 2002
South and Central Coast, Southern Willamette Valley, OR
FEMA-1405-DR-OR. Surprise windstorm.
February 2007
Northwest & Central Coast and North Central Oregon
FEMA-1683-DR-OR. Severe winter storm with a wind component.
December 2007
South, Central, North Coast and Willamette Valley, OR
FEMA-1733-DR-OR. Severe winter storm, including flood and landslide events.
(*) For the sake of comparison, surface barometric pressures associated with Atlantic hurricanes are often in the range of 910 to 960 mb. The
all-time record low sea level barometric pressure recorded was associated with Typhoon Tip in the Northwest Pacific Ocean on October 12,
1979 at 870 mb.
Sources: Oregon Climate Service; Pitzer (1988)1; and WRH2.
____________
1Pacific Northwest Quarterly, "The Pacific Northwest Dust Storm of 1931," Paul C. Pitzer, April 1988, p. 50 2http://www.wrh.noaa.gov/Portland/windstorm.html - For more information on this 1931 storm, see Appendix XX.
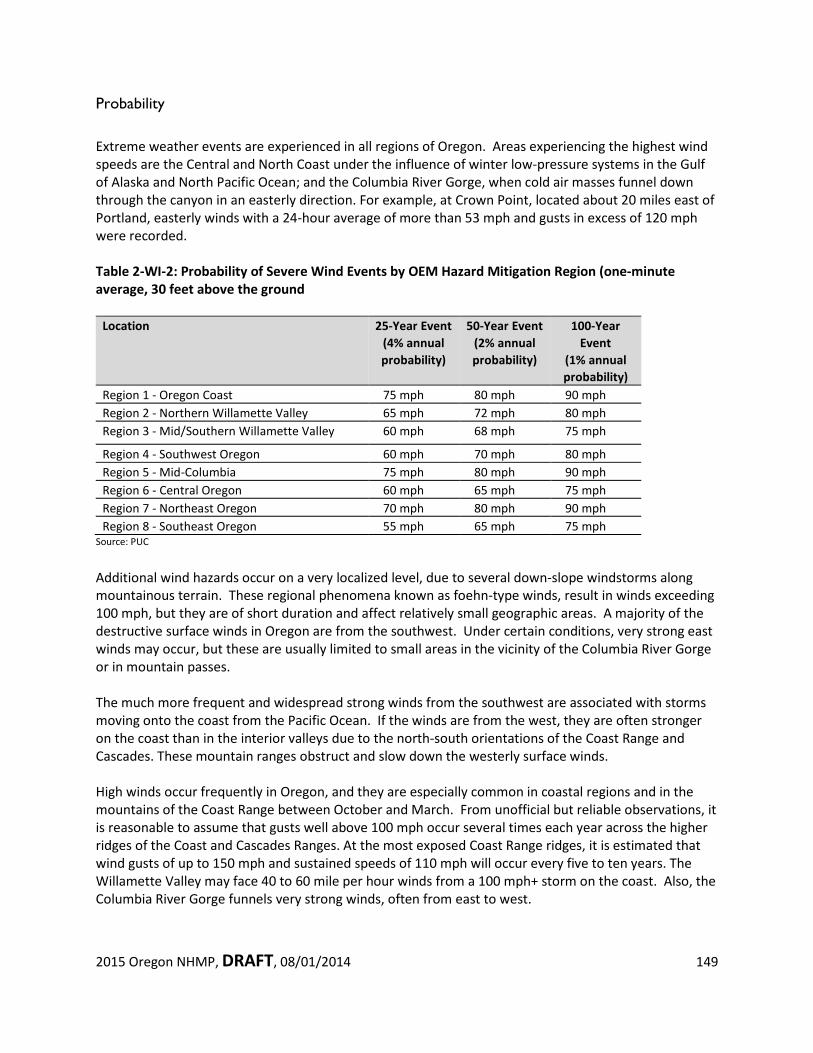
2015 Oregon NHMP, DRAFT, 08/01/2014 149
Probability Extreme weather events are experienced in all regions of Oregon. Areas experiencing the highest wind speeds are the Central and North Coast under the influence of winter low-pressure systems in the Gulf of Alaska and North Pacific Ocean; and the Columbia River Gorge, when cold air masses funnel down through the canyon in an easterly direction. For example, at Crown Point, located about 20 miles east of Portland, easterly winds with a 24-hour average of more than 53 mph and gusts in excess of 120 mph were recorded. Table 2-WI-2: Probability of Severe Wind Events by OEM Hazard Mitigation Region (one-minute average, 30 feet above the ground
Location
25-Year Event (4% annual probability)
50-Year Event (2% annual probability)
100-Year Event
(1% annual probability)
Region 1 - Oregon Coast 75 mph 80 mph 90 mph Region 2 - Northern Willamette Valley 65 mph 72 mph 80 mph Region 3 - Mid/Southern Willamette Valley 60 mph 68 mph 75 mph
Region 4 - Southwest Oregon 60 mph 70 mph 80 mph Region 5 - Mid-Columbia 75 mph 80 mph 90 mph Region 6 - Central Oregon 60 mph 65 mph 75 mph Region 7 - Northeast Oregon 70 mph 80 mph 90 mph Region 8 - Southeast Oregon 55 mph 65 mph 75 mph
Source: PUC Additional wind hazards occur on a very localized level, due to several down-slope windstorms along mountainous terrain. These regional phenomena known as foehn-type winds, result in winds exceeding 100 mph, but they are of short duration and affect relatively small geographic areas. A majority of the destructive surface winds in Oregon are from the southwest. Under certain conditions, very strong east winds may occur, but these are usually limited to small areas in the vicinity of the Columbia River Gorge or in mountain passes. The much more frequent and widespread strong winds from the southwest are associated with storms moving onto the coast from the Pacific Ocean. If the winds are from the west, they are often stronger on the coast than in the interior valleys due to the north-south orientations of the Coast Range and Cascades. These mountain ranges obstruct and slow down the westerly surface winds. High winds occur frequently in Oregon, and they are especially common in coastal regions and in the mountains of the Coast Range between October and March. From unofficial but reliable observations, it is reasonable to assume that gusts well above 100 mph occur several times each year across the higher ridges of the Coast and Cascades Ranges. At the most exposed Coast Range ridges, it is estimated that wind gusts of up to 150 mph and sustained speeds of 110 mph will occur every five to ten years. The Willamette Valley may face 40 to 60 mile per hour winds from a 100 mph+ storm on the coast. Also, the Columbia River Gorge funnels very strong winds, often from east to west.
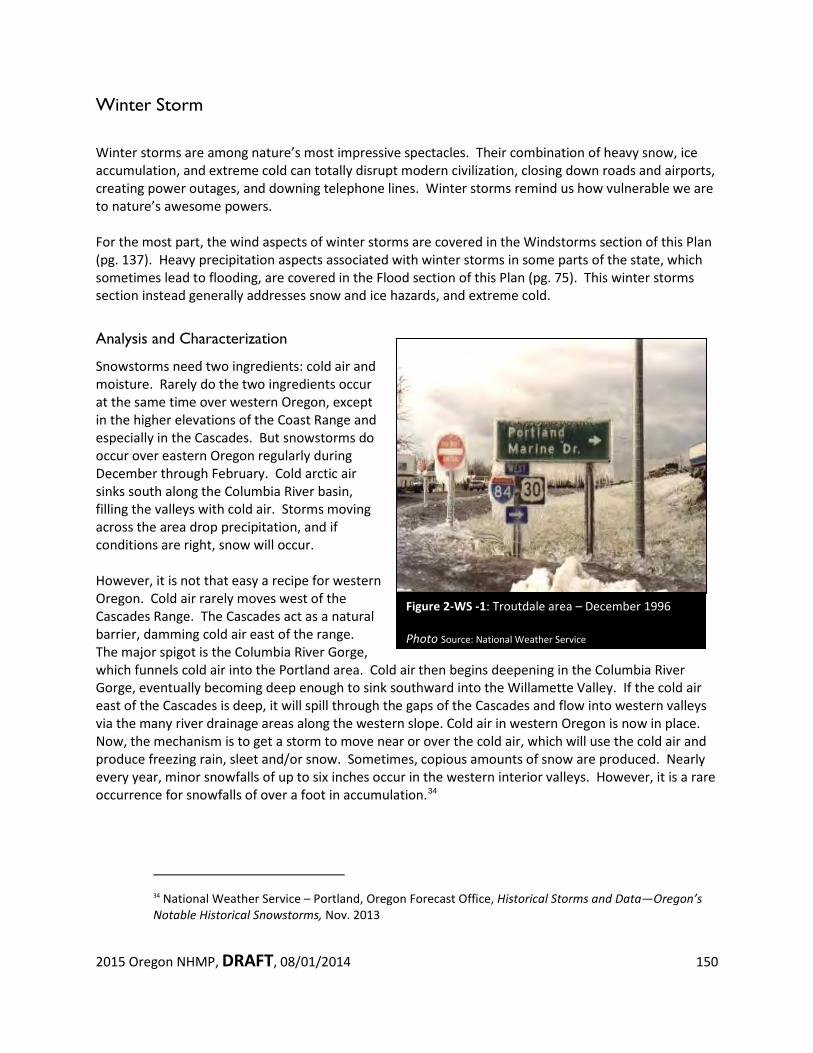
2015 Oregon NHMP, DRAFT, 08/01/2014 150
Winter Storm
Winter storms are among nature’s most impressive spectacles. Their combination of heavy snow, ice accumulation, and extreme cold can totally disrupt modern civilization, closing down roads and airports, creating power outages, and downing telephone lines. Winter storms remind us how vulnerable we are to nature’s awesome powers. For the most part, the wind aspects of winter storms are covered in the Windstorms section of this Plan (pg. 137). Heavy precipitation aspects associated with winter storms in some parts of the state, which sometimes lead to flooding, are covered in the Flood section of this Plan (pg. 75). This winter storms section instead generally addresses snow and ice hazards, and extreme cold.
Analysis and Characterization
Snowstorms need two ingredients: cold air and moisture. Rarely do the two ingredients occur at the same time over western Oregon, except in the higher elevations of the Coast Range and especially in the Cascades. But snowstorms do occur over eastern Oregon regularly during December through February. Cold arctic air sinks south along the Columbia River basin, filling the valleys with cold air. Storms moving across the area drop precipitation, and if conditions are right, snow will occur. However, it is not that easy a recipe for western Oregon. Cold air rarely moves west of the Cascades Range. The Cascades act as a natural barrier, damming cold air east of the range. The major spigot is the Columbia River Gorge, which funnels cold air into the Portland area. Cold air then begins deepening in the Columbia River Gorge, eventually becoming deep enough to sink southward into the Willamette Valley. If the cold air east of the Cascades is deep, it will spill through the gaps of the Cascades and flow into western valleys via the many river drainage areas along the western slope. Cold air in western Oregon is now in place. Now, the mechanism is to get a storm to move near or over the cold air, which will use the cold air and produce freezing rain, sleet and/or snow. Sometimes, copious amounts of snow are produced. Nearly every year, minor snowfalls of up to six inches occur in the western interior valleys. However, it is a rare occurrence for snowfalls of over a foot in accumulation.34
34 National Weather Service – Portland, Oregon Forecast Office, Historical Storms and Data—Oregon’s Notable Historical Snowstorms, Nov. 2013
Figure 2-WS -1: Troutdale area – December 1996
Photo Source: National Weather Service
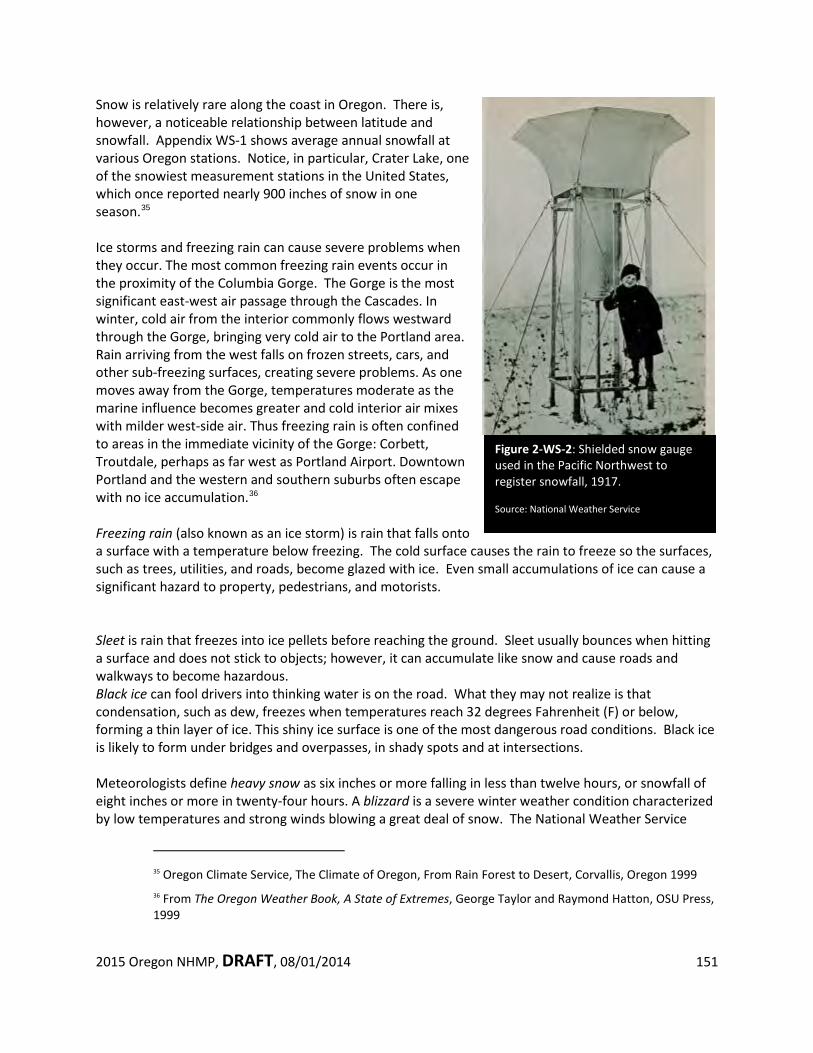
2015 Oregon NHMP, DRAFT, 08/01/2014 151
Snow is relatively rare along the coast in Oregon. There is, however, a noticeable relationship between latitude and snowfall. Appendix WS-1 shows average annual snowfall at various Oregon stations. Notice, in particular, Crater Lake, one of the snowiest measurement stations in the United States, which once reported nearly 900 inches of snow in one season.35 Ice storms and freezing rain can cause severe problems when they occur. The most common freezing rain events occur in the proximity of the Columbia Gorge. The Gorge is the most significant east-west air passage through the Cascades. In winter, cold air from the interior commonly flows westward through the Gorge, bringing very cold air to the Portland area. Rain arriving from the west falls on frozen streets, cars, and other sub-freezing surfaces, creating severe problems. As one moves away from the Gorge, temperatures moderate as the marine influence becomes greater and cold interior air mixes with milder west-side air. Thus freezing rain is often confined to areas in the immediate vicinity of the Gorge: Corbett, Troutdale, perhaps as far west as Portland Airport. Downtown Portland and the western and southern suburbs often escape with no ice accumulation.36 Freezing rain (also known as an ice storm) is rain that falls onto a surface with a temperature below freezing. The cold surface causes the rain to freeze so the surfaces, such as trees, utilities, and roads, become glazed with ice. Even small accumulations of ice can cause a significant hazard to property, pedestrians, and motorists. Sleet is rain that freezes into ice pellets before reaching the ground. Sleet usually bounces when hitting a surface and does not stick to objects; however, it can accumulate like snow and cause roads and walkways to become hazardous. Black ice can fool drivers into thinking water is on the road. What they may not realize is that condensation, such as dew, freezes when temperatures reach 32 degrees Fahrenheit (F) or below, forming a thin layer of ice. This shiny ice surface is one of the most dangerous road conditions. Black ice is likely to form under bridges and overpasses, in shady spots and at intersections. Meteorologists define heavy snow as six inches or more falling in less than twelve hours, or snowfall of eight inches or more in twenty-four hours. A blizzard is a severe winter weather condition characterized by low temperatures and strong winds blowing a great deal of snow. The National Weather Service
35 Oregon Climate Service, The Climate of Oregon, From Rain Forest to Desert, Corvallis, Oregon 1999 36 From The Oregon Weather Book, A State of Extremes, George Taylor and Raymond Hatton, OSU Press, 1999
Figure 2-WS-2: Shielded snow gauge used in the Pacific Northwest to register snowfall, 1917. Source: National Weather Service
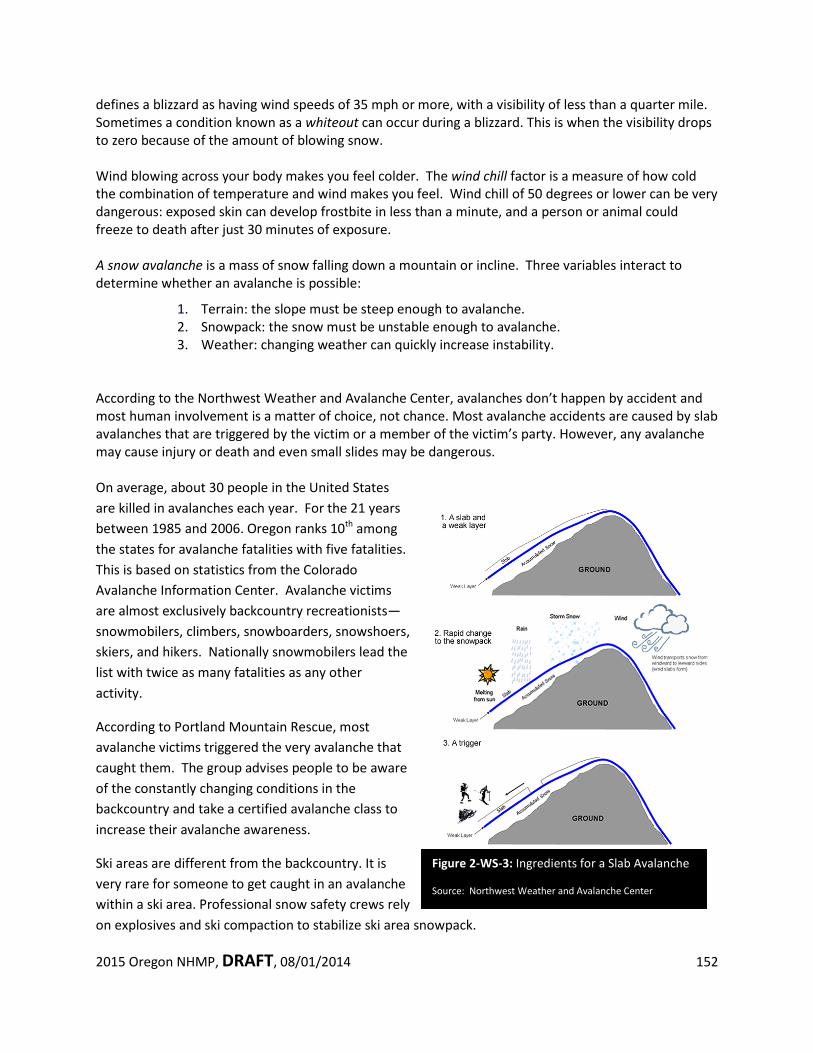
2015 Oregon NHMP, DRAFT, 08/01/2014 152
defines a blizzard as having wind speeds of 35 mph or more, with a visibility of less than a quarter mile. Sometimes a condition known as a whiteout can occur during a blizzard. This is when the visibility drops to zero because of the amount of blowing snow. Wind blowing across your body makes you feel colder. The wind chill factor is a measure of how cold the combination of temperature and wind makes you feel. Wind chill of 50 degrees or lower can be very dangerous: exposed skin can develop frostbite in less than a minute, and a person or animal could freeze to death after just 30 minutes of exposure. A snow avalanche is a mass of snow falling down a mountain or incline. Three variables interact to determine whether an avalanche is possible:
1. Terrain: the slope must be steep enough to avalanche. 2. Snowpack: the snow must be unstable enough to avalanche. 3. Weather: changing weather can quickly increase instability.
According to the Northwest Weather and Avalanche Center, avalanches don’t happen by accident and most human involvement is a matter of choice, not chance. Most avalanche accidents are caused by slab avalanches that are triggered by the victim or a member of the victim’s party. However, any avalanche may cause injury or death and even small slides may be dangerous. On average, about 30 people in the United States are killed in avalanches each year. For the 21 years between 1985 and 2006. Oregon ranks 10th among the states for avalanche fatalities with five fatalities. This is based on statistics from the Colorado Avalanche Information Center. Avalanche victims are almost exclusively backcountry recreationists—snowmobilers, climbers, snowboarders, snowshoers, skiers, and hikers. Nationally snowmobilers lead the list with twice as many fatalities as any other activity.
According to Portland Mountain Rescue, most avalanche victims triggered the very avalanche that caught them. The group advises people to be aware of the constantly changing conditions in the backcountry and take a certified avalanche class to increase their avalanche awareness.
Ski areas are different from the backcountry. It is very rare for someone to get caught in an avalanche within a ski area. Professional snow safety crews rely on explosives and ski compaction to stabilize ski area snowpack.
Figure 2-WS-3: Ingredients for a Slab Avalanche Source: Northwest Weather and Avalanche Center
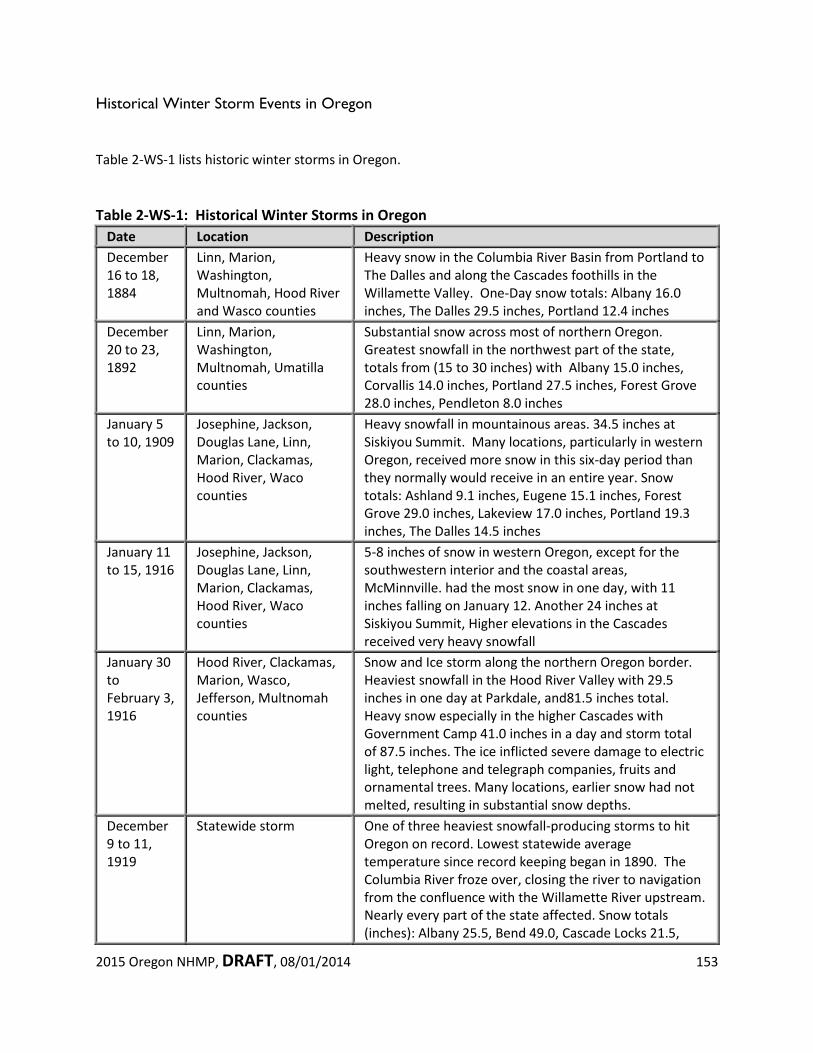
2015 Oregon NHMP, DRAFT, 08/01/2014 153
Historical Winter Storm Events in Oregon
Table 2-WS-1 lists historic winter storms in Oregon.
Table 2-WS-1: Historical Winter Storms in Oregon Date Location Description December 16 to 18, 1884
Linn, Marion, Washington, Multnomah, Hood River and Wasco counties
Heavy snow in the Columbia River Basin from Portland to The Dalles and along the Cascades foothills in the Willamette Valley. One-Day snow totals: Albany 16.0 inches, The Dalles 29.5 inches, Portland 12.4 inches
December 20 to 23, 1892
Linn, Marion, Washington, Multnomah, Umatilla counties
Substantial snow across most of northern Oregon. Greatest snowfall in the northwest part of the state, totals from (15 to 30 inches) with Albany 15.0 inches, Corvallis 14.0 inches, Portland 27.5 inches, Forest Grove 28.0 inches, Pendleton 8.0 inches
January 5 to 10, 1909
Josephine, Jackson, Douglas Lane, Linn, Marion, Clackamas, Hood River, Waco counties
Heavy snowfall in mountainous areas. 34.5 inches at Siskiyou Summit. Many locations, particularly in western Oregon, received more snow in this six-day period than they normally would receive in an entire year. Snow totals: Ashland 9.1 inches, Eugene 15.1 inches, Forest Grove 29.0 inches, Lakeview 17.0 inches, Portland 19.3 inches, The Dalles 14.5 inches
January 11 to 15, 1916
Josephine, Jackson, Douglas Lane, Linn, Marion, Clackamas, Hood River, Waco counties
5-8 inches of snow in western Oregon, except for the southwestern interior and the coastal areas, McMinnville. had the most snow in one day, with 11 inches falling on January 12. Another 24 inches at Siskiyou Summit, Higher elevations in the Cascades received very heavy snowfall
January 30 to February 3, 1916
Hood River, Clackamas, Marion, Wasco, Jefferson, Multnomah counties
Snow and Ice storm along the northern Oregon border. Heaviest snowfall in the Hood River Valley with 29.5 inches in one day at Parkdale, and81.5 inches total. Heavy snow especially in the higher Cascades with Government Camp 41.0 inches in a day and storm total of 87.5 inches. The ice inflicted severe damage to electric light, telephone and telegraph companies, fruits and ornamental trees. Many locations, earlier snow had not melted, resulting in substantial snow depths.
December 9 to 11, 1919
Statewide storm One of three heaviest snowfall-producing storms to hit Oregon on record. Lowest statewide average temperature since record keeping began in 1890. The Columbia River froze over, closing the river to navigation from the confluence with the Willamette River upstream. Nearly every part of the state affected. Snow totals (inches): Albany 25.5, Bend 49.0, Cascade Locks 21.5,
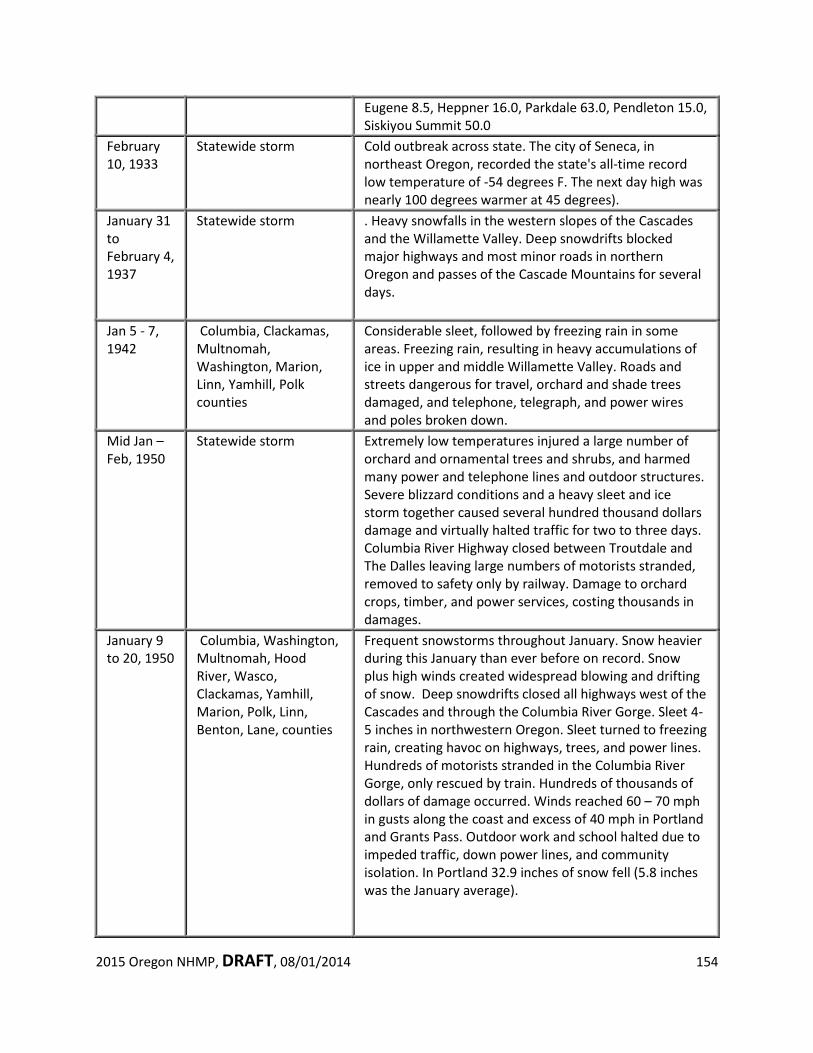
2015 Oregon NHMP, DRAFT, 08/01/2014 154
Eugene 8.5, Heppner 16.0, Parkdale 63.0, Pendleton 15.0, Siskiyou Summit 50.0
February 10, 1933
Statewide storm Cold outbreak across state. The city of Seneca, in northeast Oregon, recorded the state's all-time record low temperature of -54 degrees F. The next day high was nearly 100 degrees warmer at 45 degrees).
January 31 to February 4, 1937
Statewide storm . Heavy snowfalls in the western slopes of the Cascades and the Willamette Valley. Deep snowdrifts blocked major highways and most minor roads in northern Oregon and passes of the Cascade Mountains for several days.
Jan 5 - 7, 1942
Columbia, Clackamas, Multnomah, Washington, Marion, Linn, Yamhill, Polk counties
Considerable sleet, followed by freezing rain in some areas. Freezing rain, resulting in heavy accumulations of ice in upper and middle Willamette Valley. Roads and streets dangerous for travel, orchard and shade trees damaged, and telephone, telegraph, and power wires and poles broken down.
Mid Jan – Feb, 1950
Statewide storm Extremely low temperatures injured a large number of orchard and ornamental trees and shrubs, and harmed many power and telephone lines and outdoor structures. Severe blizzard conditions and a heavy sleet and ice storm together caused several hundred thousand dollars damage and virtually halted traffic for two to three days. Columbia River Highway closed between Troutdale and The Dalles leaving large numbers of motorists stranded, removed to safety only by railway. Damage to orchard crops, timber, and power services, costing thousands in damages.
January 9 to 20, 1950
Columbia, Washington, Multnomah, Hood River, Wasco, Clackamas, Yamhill, Marion, Polk, Linn, Benton, Lane, counties
Frequent snowstorms throughout January. Snow heavier during this January than ever before on record. Snow plus high winds created widespread blowing and drifting of snow. Deep snowdrifts closed all highways west of the Cascades and through the Columbia River Gorge. Sleet 4-5 inches in northwestern Oregon. Sleet turned to freezing rain, creating havoc on highways, trees, and power lines. Hundreds of motorists stranded in the Columbia River Gorge, only rescued by train. Hundreds of thousands of dollars of damage occurred. Winds reached 60 – 70 mph in gusts along the coast and excess of 40 mph in Portland and Grants Pass. Outdoor work and school halted due to impeded traffic, down power lines, and community isolation. In Portland 32.9 inches of snow fell (5.8 inches was the January average).
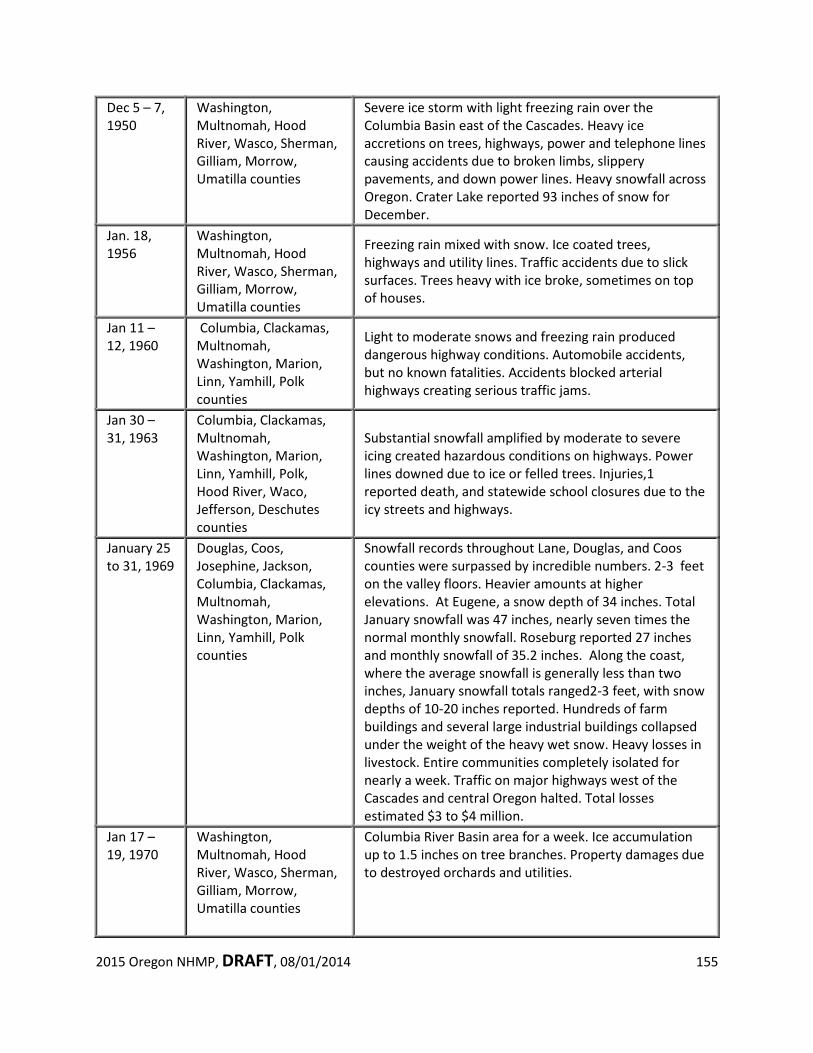
2015 Oregon NHMP, DRAFT, 08/01/2014 155
Dec 5 – 7, 1950
Washington, Multnomah, Hood River, Wasco, Sherman, Gilliam, Morrow, Umatilla counties
Severe ice storm with light freezing rain over the Columbia Basin east of the Cascades. Heavy ice accretions on trees, highways, power and telephone lines causing accidents due to broken limbs, slippery pavements, and down power lines. Heavy snowfall across Oregon. Crater Lake reported 93 inches of snow for December.
Jan. 18, 1956
Washington, Multnomah, Hood River, Wasco, Sherman, Gilliam, Morrow, Umatilla counties
Freezing rain mixed with snow. Ice coated trees, highways and utility lines. Traffic accidents due to slick surfaces. Trees heavy with ice broke, sometimes on top of houses.
Jan 11 – 12, 1960
Columbia, Clackamas, Multnomah, Washington, Marion, Linn, Yamhill, Polk counties
Light to moderate snows and freezing rain produced dangerous highway conditions. Automobile accidents, but no known fatalities. Accidents blocked arterial highways creating serious traffic jams.
Jan 30 – 31, 1963
Columbia, Clackamas, Multnomah, Washington, Marion, Linn, Yamhill, Polk, Hood River, Waco, Jefferson, Deschutes counties
Substantial snowfall amplified by moderate to severe icing created hazardous conditions on highways. Power lines downed due to ice or felled trees. Injuries,1 reported death, and statewide school closures due to the icy streets and highways.
January 25 to 31, 1969
Douglas, Coos, Josephine, Jackson, Columbia, Clackamas, Multnomah, Washington, Marion, Linn, Yamhill, Polk counties
Snowfall records throughout Lane, Douglas, and Coos counties were surpassed by incredible numbers. 2-3 feet on the valley floors. Heavier amounts at higher elevations. At Eugene, a snow depth of 34 inches. Total January snowfall was 47 inches, nearly seven times the normal monthly snowfall. Roseburg reported 27 inches and monthly snowfall of 35.2 inches. Along the coast, where the average snowfall is generally less than two inches, January snowfall totals ranged2-3 feet, with snow depths of 10-20 inches reported. Hundreds of farm buildings and several large industrial buildings collapsed under the weight of the heavy wet snow. Heavy losses in livestock. Entire communities completely isolated for nearly a week. Traffic on major highways west of the Cascades and central Oregon halted. Total losses estimated $3 to $4 million.
Jan 17 – 19, 1970
Washington, Multnomah, Hood River, Wasco, Sherman, Gilliam, Morrow, Umatilla counties
Columbia River Basin area for a week. Ice accumulation up to 1.5 inches on tree branches. Property damages due to destroyed orchards and utilities.
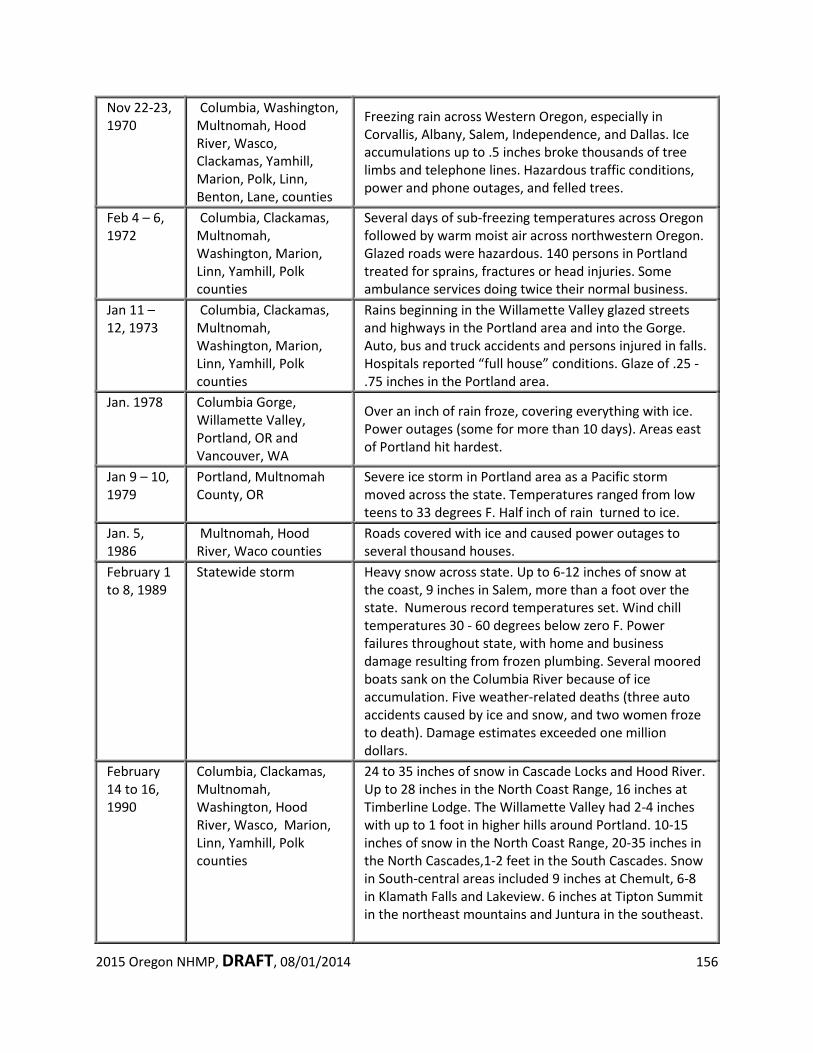
2015 Oregon NHMP, DRAFT, 08/01/2014 156
Nov 22-23, 1970
Columbia, Washington, Multnomah, Hood River, Wasco, Clackamas, Yamhill, Marion, Polk, Linn, Benton, Lane, counties
Freezing rain across Western Oregon, especially in Corvallis, Albany, Salem, Independence, and Dallas. Ice accumulations up to .5 inches broke thousands of tree limbs and telephone lines. Hazardous traffic conditions, power and phone outages, and felled trees.
Feb 4 – 6, 1972
Columbia, Clackamas, Multnomah, Washington, Marion, Linn, Yamhill, Polk counties
Several days of sub-freezing temperatures across Oregon followed by warm moist air across northwestern Oregon. Glazed roads were hazardous. 140 persons in Portland treated for sprains, fractures or head injuries. Some ambulance services doing twice their normal business.
Jan 11 – 12, 1973
Columbia, Clackamas, Multnomah, Washington, Marion, Linn, Yamhill, Polk counties
Rains beginning in the Willamette Valley glazed streets and highways in the Portland area and into the Gorge. Auto, bus and truck accidents and persons injured in falls. Hospitals reported “full house” conditions. Glaze of .25 - .75 inches in the Portland area.
Jan. 1978
Columbia Gorge, Willamette Valley, Portland, OR and Vancouver, WA
Over an inch of rain froze, covering everything with ice. Power outages (some for more than 10 days). Areas east of Portland hit hardest.
Jan 9 – 10, 1979
Portland, Multnomah County, OR
Severe ice storm in Portland area as a Pacific storm moved across the state. Temperatures ranged from low teens to 33 degrees F. Half inch of rain turned to ice.
Jan. 5, 1986
Multnomah, Hood River, Waco counties
Roads covered with ice and caused power outages to several thousand houses.
February 1 to 8, 1989
Statewide storm Heavy snow across state. Up to 6-12 inches of snow at the coast, 9 inches in Salem, more than a foot over the state. Numerous record temperatures set. Wind chill temperatures 30 - 60 degrees below zero F. Power failures throughout state, with home and business damage resulting from frozen plumbing. Several moored boats sank on the Columbia River because of ice accumulation. Five weather-related deaths (three auto accidents caused by ice and snow, and two women froze to death). Damage estimates exceeded one million dollars.
February 14 to 16, 1990
Columbia, Clackamas, Multnomah, Washington, Hood River, Wasco, Marion, Linn, Yamhill, Polk counties
24 to 35 inches of snow in Cascade Locks and Hood River. Up to 28 inches in the North Coast Range, 16 inches at Timberline Lodge. The Willamette Valley had 2-4 inches with up to 1 foot in higher hills around Portland. 10-15 inches of snow in the North Coast Range, 20-35 inches in the North Cascades,1-2 feet in the South Cascades. Snow in South-central areas included 9 inches at Chemult, 6-8 in Klamath Falls and Lakeview. 6 inches at Tipton Summit in the northeast mountains and Juntura in the southeast.
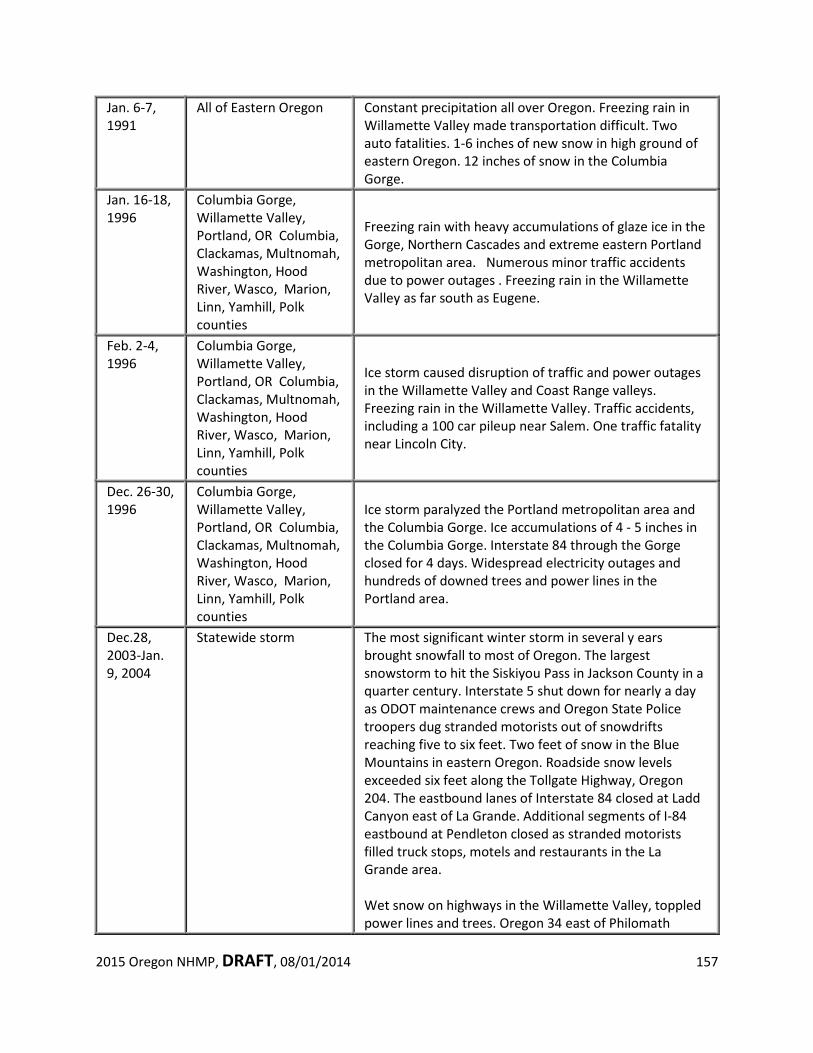
2015 Oregon NHMP, DRAFT, 08/01/2014 157
Jan. 6-7, 1991
All of Eastern Oregon Constant precipitation all over Oregon. Freezing rain in Willamette Valley made transportation difficult. Two auto fatalities. 1-6 inches of new snow in high ground of eastern Oregon. 12 inches of snow in the Columbia Gorge.
Jan. 16-18, 1996
Columbia Gorge, Willamette Valley, Portland, OR Columbia, Clackamas, Multnomah, Washington, Hood River, Wasco, Marion, Linn, Yamhill, Polk counties
Freezing rain with heavy accumulations of glaze ice in the Gorge, Northern Cascades and extreme eastern Portland metropolitan area. Numerous minor traffic accidents due to power outages . Freezing rain in the Willamette Valley as far south as Eugene.
Feb. 2-4, 1996
Columbia Gorge, Willamette Valley, Portland, OR Columbia, Clackamas, Multnomah, Washington, Hood River, Wasco, Marion, Linn, Yamhill, Polk counties
Ice storm caused disruption of traffic and power outages in the Willamette Valley and Coast Range valleys. Freezing rain in the Willamette Valley. Traffic accidents, including a 100 car pileup near Salem. One traffic fatality near Lincoln City.
Dec. 26-30, 1996
Columbia Gorge, Willamette Valley, Portland, OR Columbia, Clackamas, Multnomah, Washington, Hood River, Wasco, Marion, Linn, Yamhill, Polk counties
Ice storm paralyzed the Portland metropolitan area and the Columbia Gorge. Ice accumulations of 4 - 5 inches in the Columbia Gorge. Interstate 84 through the Gorge closed for 4 days. Widespread electricity outages and hundreds of downed trees and power lines in the Portland area.
Dec.28, 2003-Jan. 9, 2004
Statewide storm The most significant winter storm in several y ears brought snowfall to most of Oregon. The largest snowstorm to hit the Siskiyou Pass in Jackson County in a quarter century. Interstate 5 shut down for nearly a day as ODOT maintenance crews and Oregon State Police troopers dug stranded motorists out of snowdrifts reaching five to six feet. Two feet of snow in the Blue Mountains in eastern Oregon. Roadside snow levels exceeded six feet along the Tollgate Highway, Oregon 204. The eastbound lanes of Interstate 84 closed at Ladd Canyon east of La Grande. Additional segments of I-84 eastbound at Pendleton closed as stranded motorists filled truck stops, motels and restaurants in the La Grande area. Wet snow on highways in the Willamette Valley, toppled power lines and trees. Oregon 34 east of Philomath
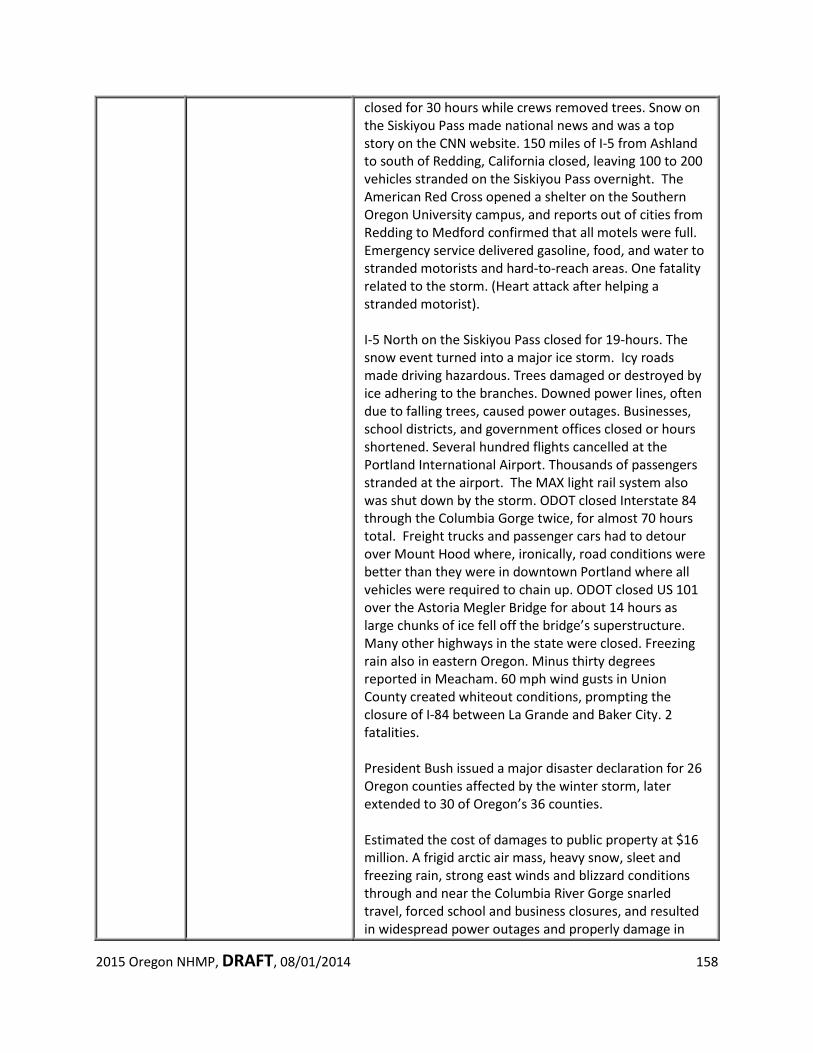
2015 Oregon NHMP, DRAFT, 08/01/2014 158
closed for 30 hours while crews removed trees. Snow on the Siskiyou Pass made national news and was a top story on the CNN website. 150 miles of I-5 from Ashland to south of Redding, California closed, leaving 100 to 200 vehicles stranded on the Siskiyou Pass overnight. The American Red Cross opened a shelter on the Southern Oregon University campus, and reports out of cities from Redding to Medford confirmed that all motels were full. Emergency service delivered gasoline, food, and water to stranded motorists and hard-to-reach areas. One fatality related to the storm. (Heart attack after helping a stranded motorist). I-5 North on the Siskiyou Pass closed for 19-hours. The snow event turned into a major ice storm. Icy roads made driving hazardous. Trees damaged or destroyed by ice adhering to the branches. Downed power lines, often due to falling trees, caused power outages. Businesses, school districts, and government offices closed or hours shortened. Several hundred flights cancelled at the Portland International Airport. Thousands of passengers stranded at the airport. The MAX light rail system also was shut down by the storm. ODOT closed Interstate 84 through the Columbia Gorge twice, for almost 70 hours total. Freight trucks and passenger cars had to detour over Mount Hood where, ironically, road conditions were better than they were in downtown Portland where all vehicles were required to chain up. ODOT closed US 101 over the Astoria Megler Bridge for about 14 hours as large chunks of ice fell off the bridge’s superstructure. Many other highways in the state were closed. Freezing rain also in eastern Oregon. Minus thirty degrees reported in Meacham. 60 mph wind gusts in Union County created whiteout conditions, prompting the closure of I-84 between La Grande and Baker City. 2 fatalities. President Bush issued a major disaster declaration for 26 Oregon counties affected by the winter storm, later extended to 30 of Oregon’s 36 counties. Estimated the cost of damages to public property at $16 million. A frigid arctic air mass, heavy snow, sleet and freezing rain, strong east winds and blizzard conditions through and near the Columbia River Gorge snarled travel, forced school and business closures, and resulted in widespread power outages and properly damage in
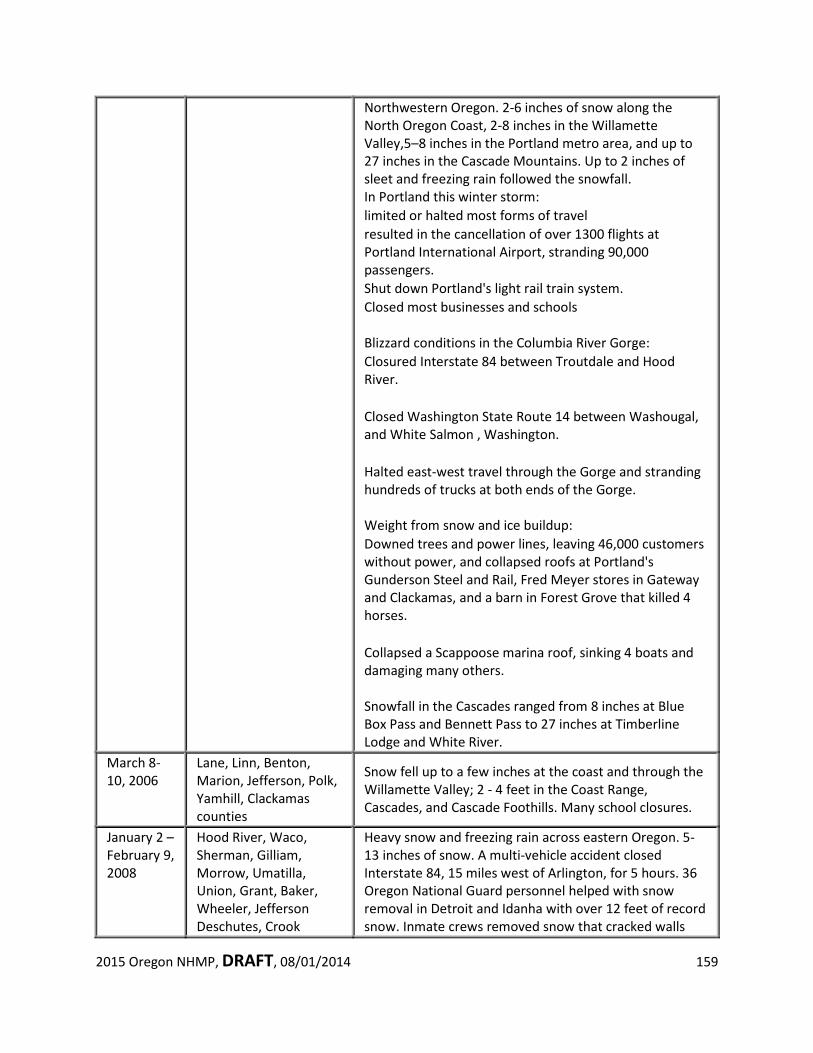
2015 Oregon NHMP, DRAFT, 08/01/2014 159
Northwestern Oregon. 2-6 inches of snow along the North Oregon Coast, 2-8 inches in the Willamette Valley,5–8 inches in the Portland metro area, and up to 27 inches in the Cascade Mountains. Up to 2 inches of sleet and freezing rain followed the snowfall. In Portland this winter storm:
limited or halted most forms of travel resulted in the cancellation of over 1300 flights at
Portland International Airport, stranding 90,000 passengers.
Shut down Portland's light rail train system. Closed most businesses and schools
Blizzard conditions in the Columbia River Gorge:
Closured Interstate 84 between Troutdale and Hood River.
Closed Washington State Route 14 between Washougal,
and White Salmon , Washington. Halted east-west travel through the Gorge and stranding
hundreds of trucks at both ends of the Gorge. Weight from snow and ice buildup:
Downed trees and power lines, leaving 46,000 customers without power, and collapsed roofs at Portland's Gunderson Steel and Rail, Fred Meyer stores in Gateway and Clackamas, and a barn in Forest Grove that killed 4 horses.
Collapsed a Scappoose marina roof, sinking 4 boats and
damaging many others. Snowfall in the Cascades ranged from 8 inches at Blue Box Pass and Bennett Pass to 27 inches at Timberline Lodge and White River.
March 8-10, 2006
Lane, Linn, Benton, Marion, Jefferson, Polk, Yamhill, Clackamas counties
Snow fell up to a few inches at the coast and through the Willamette Valley; 2 - 4 feet in the Coast Range, Cascades, and Cascade Foothills. Many school closures.
January 2 – February 9, 2008
Hood River, Waco, Sherman, Gilliam, Morrow, Umatilla, Union, Grant, Baker, Wheeler, Jefferson Deschutes, Crook
Heavy snow and freezing rain across eastern Oregon. 5-13 inches of snow. A multi-vehicle accident closed Interstate 84, 15 miles west of Arlington, for 5 hours. 36 Oregon National Guard personnel helped with snow removal in Detroit and Idanha with over 12 feet of record snow. Inmate crews removed snow that cracked walls
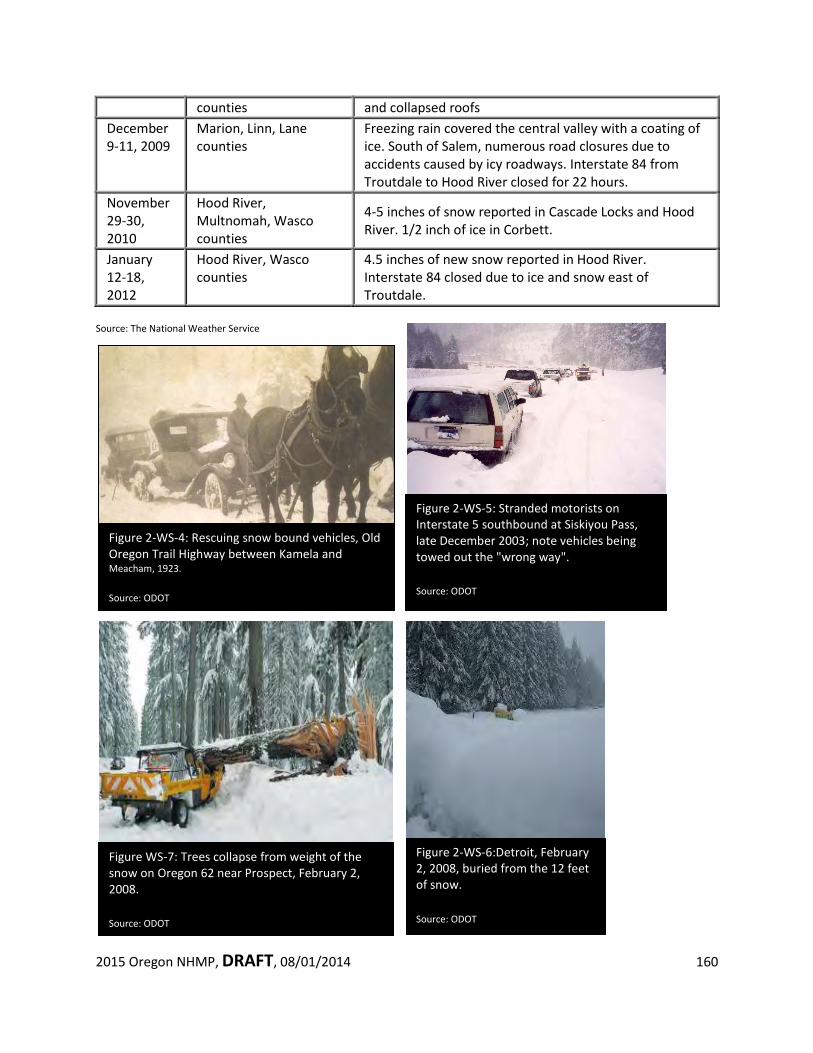
2015 Oregon NHMP, DRAFT, 08/01/2014 160
Figure 2-WS-4: Rescuing snow bound vehicles, Old Oregon Trail Highway between Kamela and Meacham, 1923. Source: ODOT
counties and collapsed roofs December 9-11, 2009
Marion, Linn, Lane counties
Freezing rain covered the central valley with a coating of ice. South of Salem, numerous road closures due to accidents caused by icy roadways. Interstate 84 from Troutdale to Hood River closed for 22 hours.
November 29-30, 2010
Hood River, Multnomah, Wasco counties
4-5 inches of snow reported in Cascade Locks and Hood River. 1/2 inch of ice in Corbett.
January 12-18, 2012
Hood River, Wasco counties
4.5 inches of new snow reported in Hood River. Interstate 84 closed due to ice and snow east of Troutdale.
Source: The National Weather Service
Figure 2-WS-5: Stranded motorists on Interstate 5 southbound at Siskiyou Pass, late December 2003; note vehicles being towed out the "wrong way". Source: ODOT
Figure WS-7: Trees collapse from weight of the snow on Oregon 62 near Prospect, February 2, 2008. Source: ODOT
Figure 2-WS-6:Detroit, February 2, 2008, buried from the 12 feet of snow. Source: ODOT
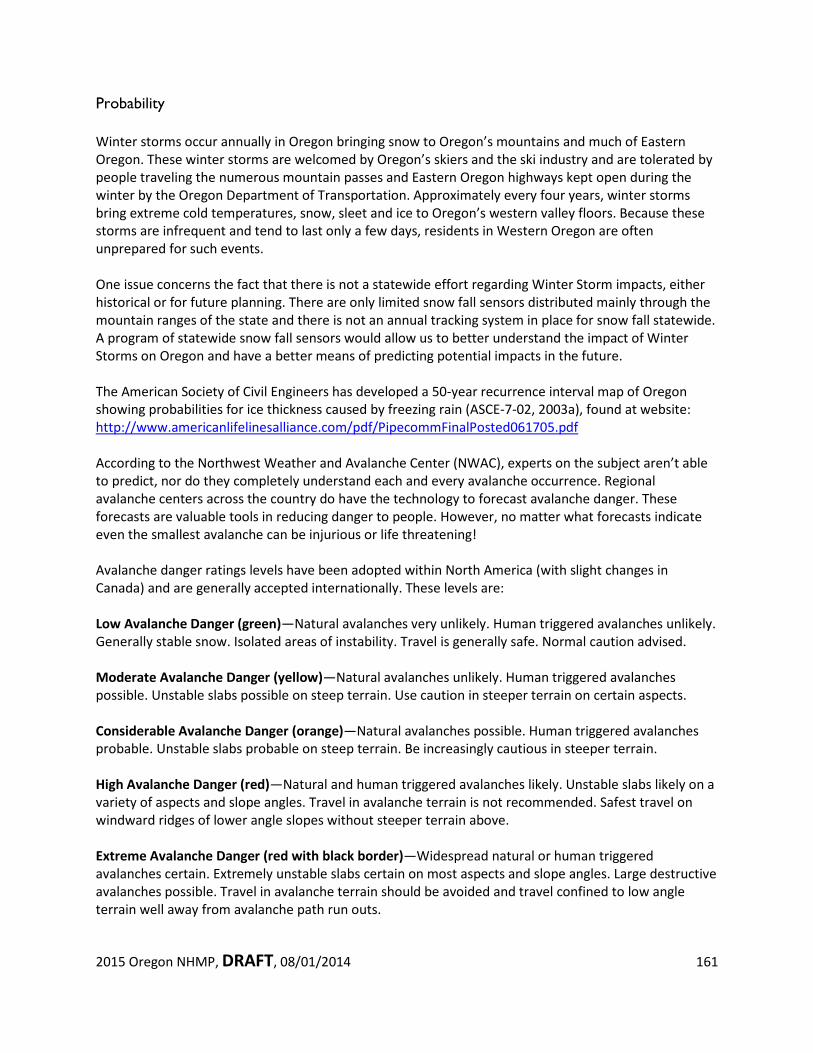
2015 Oregon NHMP, DRAFT, 08/01/2014 161
Probability Winter storms occur annually in Oregon bringing snow to Oregon’s mountains and much of Eastern Oregon. These winter storms are welcomed by Oregon’s skiers and the ski industry and are tolerated by people traveling the numerous mountain passes and Eastern Oregon highways kept open during the winter by the Oregon Department of Transportation. Approximately every four years, winter storms bring extreme cold temperatures, snow, sleet and ice to Oregon’s western valley floors. Because these storms are infrequent and tend to last only a few days, residents in Western Oregon are often unprepared for such events. One issue concerns the fact that there is not a statewide effort regarding Winter Storm impacts, either historical or for future planning. There are only limited snow fall sensors distributed mainly through the mountain ranges of the state and there is not an annual tracking system in place for snow fall statewide. A program of statewide snow fall sensors would allow us to better understand the impact of Winter Storms on Oregon and have a better means of predicting potential impacts in the future. The American Society of Civil Engineers has developed a 50-year recurrence interval map of Oregon showing probabilities for ice thickness caused by freezing rain (ASCE-7-02, 2003a), found at website: http://www.americanlifelinesalliance.com/pdf/PipecommFinalPosted061705.pdf According to the Northwest Weather and Avalanche Center (NWAC), experts on the subject aren’t able to predict, nor do they completely understand each and every avalanche occurrence. Regional avalanche centers across the country do have the technology to forecast avalanche danger. These forecasts are valuable tools in reducing danger to people. However, no matter what forecasts indicate even the smallest avalanche can be injurious or life threatening! Avalanche danger ratings levels have been adopted within North America (with slight changes in Canada) and are generally accepted internationally. These levels are: Low Avalanche Danger (green)—Natural avalanches very unlikely. Human triggered avalanches unlikely. Generally stable snow. Isolated areas of instability. Travel is generally safe. Normal caution advised. Moderate Avalanche Danger (yellow)—Natural avalanches unlikely. Human triggered avalanches possible. Unstable slabs possible on steep terrain. Use caution in steeper terrain on certain aspects. Considerable Avalanche Danger (orange)—Natural avalanches possible. Human triggered avalanches probable. Unstable slabs probable on steep terrain. Be increasingly cautious in steeper terrain. High Avalanche Danger (red)—Natural and human triggered avalanches likely. Unstable slabs likely on a variety of aspects and slope angles. Travel in avalanche terrain is not recommended. Safest travel on windward ridges of lower angle slopes without steeper terrain above. Extreme Avalanche Danger (red with black border)—Widespread natural or human triggered avalanches certain. Extremely unstable slabs certain on most aspects and slope angles. Large destructive avalanches possible. Travel in avalanche terrain should be avoided and travel confined to low angle terrain well away from avalanche path run outs.
2015 DRAFT NHMP, Risk Assessment, State Vulnerabilty, v03, 08/01/2014 162
Oregon Vulnerabilities Overview
The vulnerability assessment provides an overview and analysis of the state’s vulnerabilities to each of Oregon’s 11 hazards addressed in this Plan. Both local and state risk assessments are referenced to identify vulnerabilities, most vulnerable jurisdictions and potential impacts from each hazard. In addition, a side-by-side comparison of local and state vulnerability “rankings” for each county show similarities and differences that the state will be addressing over the course of the next Plan update cycle.
The exposure analysis and estimate of potential losses to state owned and leased facilities and critical and essential facilities (both state owned/leased and non-state owned/leased) located within hazard zones performed by the Department of Geology and Mineral Industries (DOGAMI) for the 2012 Oregon NHMP was updated by DOGAMI in 2014. Loss data is not available in local plans. Therefore, this Plan only includes the most recent estimates provided by DOGAMI.
In addition, an overview of seismic lifeline vulnerabilities is a new addition to the 2015 Oregon NHMP. This includes a summary of the Oregon Department of Transportation’s (ODOT’s) 2012 Oregon Seismic Lifeline Report (OSLR) findings, including identification of system vulnerabilities, loss estimates and recommended next steps. Both the facilities and lifeline report findings are further discussed in the Regional Risk Assessment later in this Plan (pg.xx-xx).
Requirement: 44 CFR §201.4(c)(2)(ii): Th[e] risk assessment shall include… (ii) (a)n overview and analysis of the State’s vulnerability to the hazards described . . . based on estimates provided in local risk assessments as well as the State risk assessment. The State shall describe vulnerability in terms of the jurisdictions most threatened by the identified hazards, and most vulnerable to damage and loss associated with hazard events…
Requirement: 44 CFR §201.4(c)(2)(ii): Th[e] risk assessment shall include… (ii) (s)tate owned or operated critical facilities located in the identified hazard areas shall also be addressed.
Requirement: 44 CFR §201.4(c)(2)(iii): Th[e] risk assessment shall include… (iii) (a)n overview and analysis of potential losses to the identified vulnerable structures, based on estimates provided in local risk assessments as well as the State risk assessment. The State shall estimate the potential dollar losses to State owned or operated buildings, infrastructure, and critical facilities located in the identified hazard areas.
2015 DRAFT NHMP, Risk Assessment, State Vulnerabilty, v03, 08/01/2014 163
Local Vulnerability Assessments
The Oregon Military Department, Office of Emergency Management (OEM) periodically collects hazard vulnerability information from each of the 36 counties in the state. The information is generated at the local government level to meet OEM required activities under the State’s Emergency Management Grant Program (EMPG) and in many cases to inform Local NHMPs. The OEM Hazard Analysis Methodology was first developed by FEMA in 1983, and has been gradually refined by OEM over the years. There are two key components to this methodology: vulnerability and probability. Vulnerability examines both typical and maximum credible events, and probability reflects how physical changes in the jurisdiction and scientific research modify the historical record for each hazard. This analysis is conducted by county or city emergency program managers, usually with the assistance of a team of local public safety officials. The assessment team initially identifies which hazards are relevant in that community. Then, the team scores each hazard in four categories: history, probability, vulnerability, and maximum treat. Following is the definition and ranking method for each category: • History= the record of previous occurrences
o Low 0 - 1 event past 100 years o Moderate 2 - 3 events past100 years o High 4 + events past100 years
• Probability= the likelihood of future occurrence within a specified period of time o Low one incident likely within 75 to 100 years o Moderate one incident likely within 35 to 75 years o High one incident likely within 10 to 35 years
• Vulnerability= the percentage of population and property likely to be affected under an “average” occurrence of the hazard
o Low < 1% affected o Moderate 1 - 10% affected o High > 10% affected
• Maximum Threat= the highest percentage of population and property that could be impacted under a worst-case scenario
o Low < 5% affected o Moderate 5 - 25% affected o High > 25% affected
Each county in Oregon is required to periodically update their Hazard Analysis. As part of this analysis, each county develops risk scores for the natural hazards that affect their communities. These scores
Requirement: 44 CFR §201.4(c)(2)(ii): Th[e] risk assessment shall include… (ii) (a)n overview and analysis of the State’s vulnerability to the hazards described . . . based on estimates provided in local risk assessments …. The State shall describe vulnerability in terms of the jurisdictions most threatened by the identified hazards, and most vulnerable to damage and loss associated with hazard events…
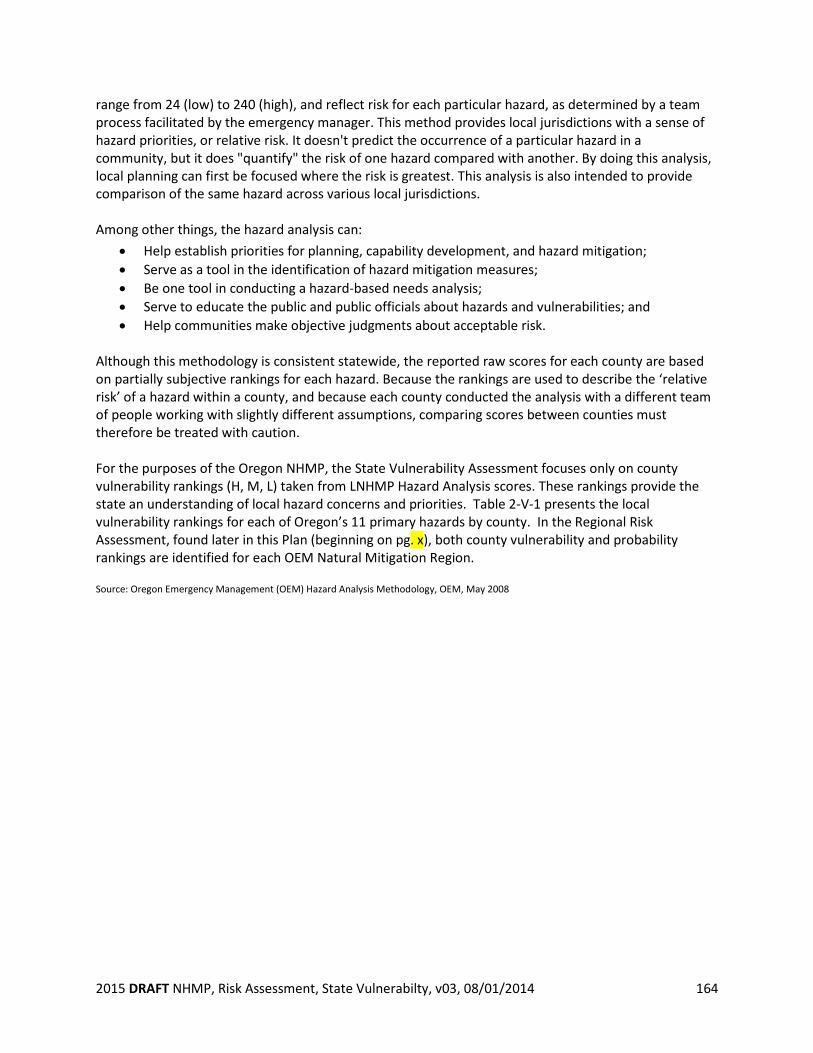
2015 DRAFT NHMP, Risk Assessment, State Vulnerabilty, v03, 08/01/2014 164
range from 24 (low) to 240 (high), and reflect risk for each particular hazard, as determined by a team process facilitated by the emergency manager. This method provides local jurisdictions with a sense of hazard priorities, or relative risk. It doesn't predict the occurrence of a particular hazard in a community, but it does "quantify" the risk of one hazard compared with another. By doing this analysis, local planning can first be focused where the risk is greatest. This analysis is also intended to provide comparison of the same hazard across various local jurisdictions. Among other things, the hazard analysis can:
• Help establish priorities for planning, capability development, and hazard mitigation; • Serve as a tool in the identification of hazard mitigation measures; • Be one tool in conducting a hazard-based needs analysis; • Serve to educate the public and public officials about hazards and vulnerabilities; and • Help communities make objective judgments about acceptable risk.
Although this methodology is consistent statewide, the reported raw scores for each county are based on partially subjective rankings for each hazard. Because the rankings are used to describe the ‘relative risk’ of a hazard within a county, and because each county conducted the analysis with a different team of people working with slightly different assumptions, comparing scores between counties must therefore be treated with caution. For the purposes of the Oregon NHMP, the State Vulnerability Assessment focuses only on county vulnerability rankings (H, M, L) taken from LNHMP Hazard Analysis scores. These rankings provide the state an understanding of local hazard concerns and priorities. Table 2-V-1 presents the local vulnerability rankings for each of Oregon’s 11 primary hazards by county. In the Regional Risk Assessment, found later in this Plan (beginning on pg. x), both county vulnerability and probability rankings are identified for each OEM Natural Mitigation Region.
Source: Oregon Emergency Management (OEM) Hazard Analysis Methodology, OEM, May 2008
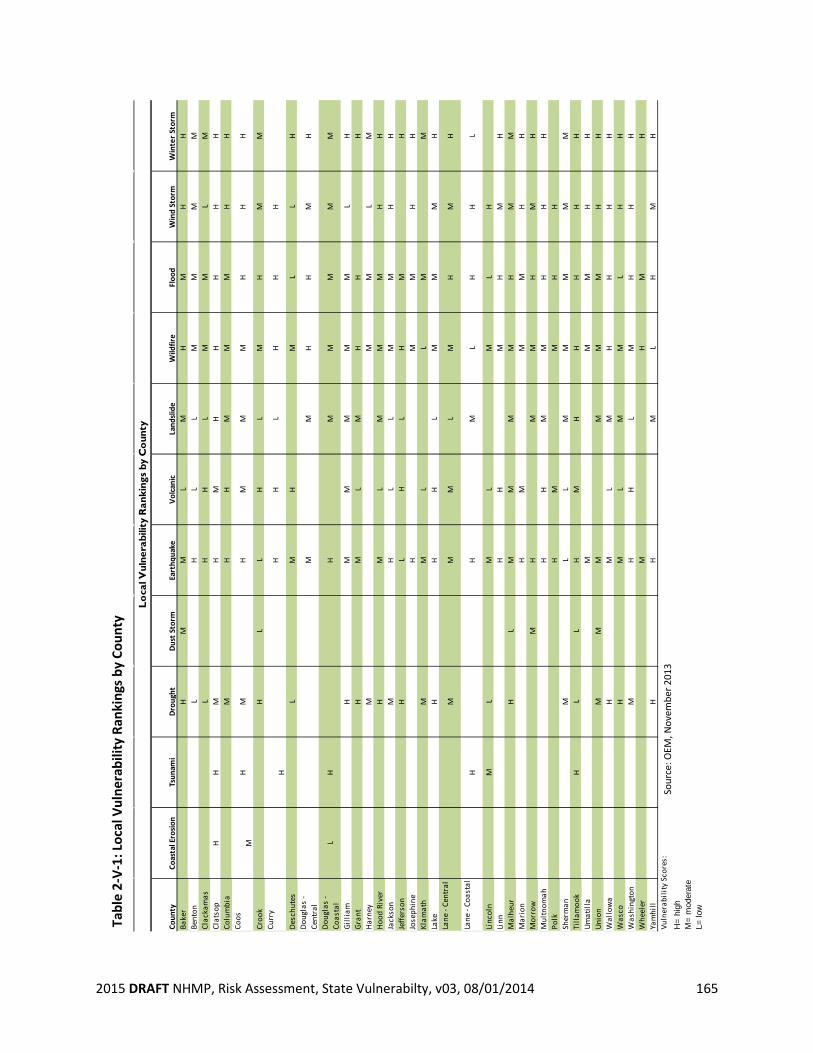
2015 DRAFT NHMP, Risk Assessment, State Vulnerabilty, v03, 08/01/2014 165
Tabl
e 2-
V-1:
Loc
al V
ulne
rabi
lity
Rank
ings
by
Coun
ty
Coun
tyCo
asta
l Ero
sion
Tsun
ami
Drou
ght
Dust
Sto
rmEa
rthq
uake
Volca
nic
Land
slide
Wild
fire
Floo
dW
ind
Stor
mW
inte
r Sto
rmBa
ker
HM
ML
MH
MH
HBe
nton
LH
LL
MM
MM
Clac
kam
asL
HH
LM
ML
MCl
atso
pH
H M
HM
HH
HH
HCo
lum
bia
MH
HM
MM
HH
Coos
M
H M
HM
MM
HH
H
Croo
kH
LL
HL
MH
MM
Curr
yH
HH
LH
HH
Desc
hute
sL
MH
ML
LH
Doug
las
- Ce
ntra
lM
MH
HM
H
Doug
las
- Co
asta
lL
H H
MM
MM
M
Gilli
amH
MM
MM
ML
HGr
ant
HM
LM
HH
HHa
rney
MM
ML
MHo
od R
iver
HM
LM
MM
HH
Jack
son
MH
LL
MM
HH
Jeffe
rson
HL
HL
HM
HJo
seph
ine
HM
MH
HKl
amat
hM
ML
LM
MLa
keH
HH
LM
MM
HLa
ne -
Cent
ral
MM
ML
MH
MH
Lane
- Co
asta
lH
HM
LH
HL
Linc
oln
M
LM
LM
LH
Linn
HH
MH
MH
Mal
heur
HL
MM
MM
HM
MM
ario
nH
MM
MH
HM
orro
wM
HM
MH
MH
Mul
tnom
ah
HH
MM
HH
HPo
lkH
MM
HH
Sher
man
ML
LM
MM
MM
Tilla
moo
kH
LL
HM
HH
HH
HUm
atill
aM
MM
HH
Unio
nM
MM
MM
MH
HW
allo
wa
HM
LM
HH
HH
Was
coH
ML
MM
LH
HW
ashi
ngto
nM
HH
LM
HH
HW
heel
erM
HM
HYa
mhi
llH
HM
LH
MH
M=
mod
erat
eL=
low
Loc
al V
ulne
rabi
lity
Ran
king
s by
Cou
nty
H=
high
Vuln
erab
ility
Sco
res:
Sour
ce: O
EM, N
ovem
ber 2
013
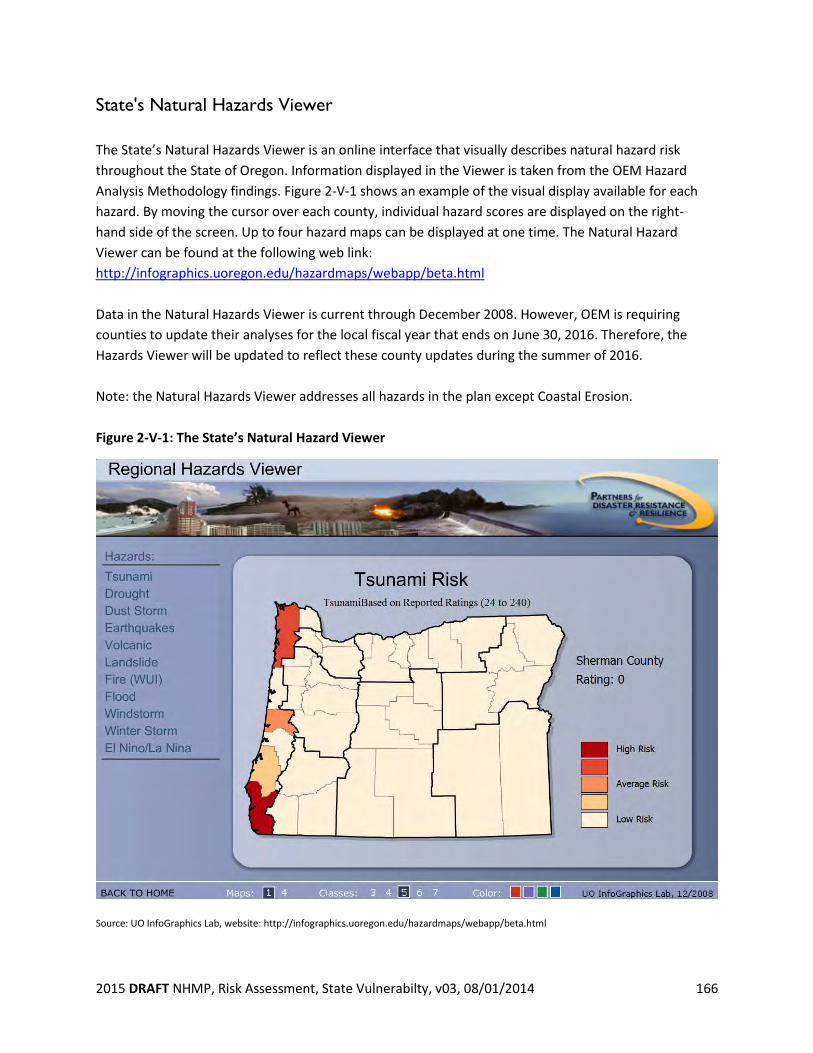
2015 DRAFT NHMP, Risk Assessment, State Vulnerabilty, v03, 08/01/2014 166
State's Natural Hazards Viewer The State’s Natural Hazards Viewer is an online interface that visually describes natural hazard risk throughout the State of Oregon. Information displayed in the Viewer is taken from the OEM Hazard Analysis Methodology findings. Figure 2-V-1 shows an example of the visual display available for each hazard. By moving the cursor over each county, individual hazard scores are displayed on the right-hand side of the screen. Up to four hazard maps can be displayed at one time. The Natural Hazard Viewer can be found at the following web link: http://infographics.uoregon.edu/hazardmaps/webapp/beta.html Data in the Natural Hazards Viewer is current through December 2008. However, OEM is requiring counties to update their analyses for the local fiscal year that ends on June 30, 2016. Therefore, the Hazards Viewer will be updated to reflect these county updates during the summer of 2016. Note: the Natural Hazards Viewer addresses all hazards in the plan except Coastal Erosion. Figure 2-V-1: The State’s Natural Hazard Viewer
Source: UO InfoGraphics Lab, website: http://infographics.uoregon.edu/hazardmaps/webapp/beta.html
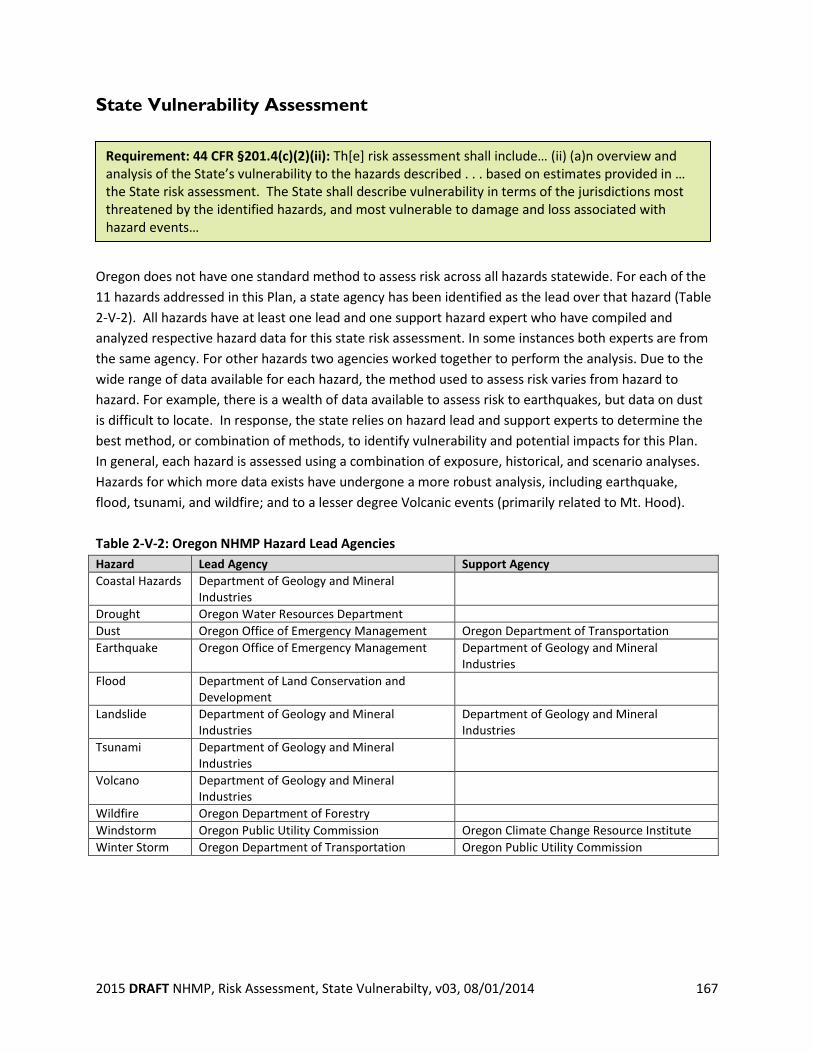
2015 DRAFT NHMP, Risk Assessment, State Vulnerabilty, v03, 08/01/2014 167
State Vulnerability Assessment
Oregon does not have one standard method to assess risk across all hazards statewide. For each of the 11 hazards addressed in this Plan, a state agency has been identified as the lead over that hazard (Table 2-V-2). All hazards have at least one lead and one support hazard expert who have compiled and analyzed respective hazard data for this state risk assessment. In some instances both experts are from the same agency. For other hazards two agencies worked together to perform the analysis. Due to the wide range of data available for each hazard, the method used to assess risk varies from hazard to hazard. For example, there is a wealth of data available to assess risk to earthquakes, but data on dust is difficult to locate. In response, the state relies on hazard lead and support experts to determine the best method, or combination of methods, to identify vulnerability and potential impacts for this Plan. In general, each hazard is assessed using a combination of exposure, historical, and scenario analyses. Hazards for which more data exists have undergone a more robust analysis, including earthquake, flood, tsunami, and wildfire; and to a lesser degree Volcanic events (primarily related to Mt. Hood). Table 2-V-2: Oregon NHMP Hazard Lead Agencies Hazard Lead Agency Support Agency Coastal Hazards Department of Geology and Mineral
Industries
Drought Oregon Water Resources Department Dust Oregon Office of Emergency Management Oregon Department of Transportation Earthquake Oregon Office of Emergency Management Department of Geology and Mineral
Industries Flood Department of Land Conservation and
Development
Landslide Department of Geology and Mineral Industries
Department of Geology and Mineral Industries
Tsunami Department of Geology and Mineral Industries
Volcano Department of Geology and Mineral Industries
Wildfire Oregon Department of Forestry Windstorm Oregon Public Utility Commission Oregon Climate Change Resource Institute Winter Storm Oregon Department of Transportation Oregon Public Utility Commission
Requirement: 44 CFR §201.4(c)(2)(ii): Th[e] risk assessment shall include… (ii) (a)n overview and analysis of the State’s vulnerability to the hazards described . . . based on estimates provided in … the State risk assessment. The State shall describe vulnerability in terms of the jurisdictions most threatened by the identified hazards, and most vulnerable to damage and loss associated with hazard events…
2015 DRAFT NHMP, Risk Assessment, State Vulnerabilty, v03, 08/01/2014 168
Coastal Hazards Chronic hazards are clearly evident along Oregon’s shores, including beach, dune, and bluff erosion, landslides, slumps, gradual weathering of sea cliffs, and flooding of low-lying coastal lands during major storms. The damage caused by chronic hazards is usually gradual and cumulative. The regional, oceanic, and climatic environments that result in intense winter storms determine the severity of chronic hazards along the coast. These hazards threaten property in its path and, in extreme events, can threaten human life as well.
Most Vulnerable Communities
The Department of Geology and Mineral Industries is the agency with primary oversight of the coastal erosion hazard. Based on agency staff review of the available hazard data, DOGAMI ranks Tillamook, Lincoln, Clatsop and Curry Counties one through four respectively as the counties most vulnerable to coastal erosion in the state. Coastal hazards in Coos, Lane and Douglas counties are considered to be generally negligible. This is because the bulk of these coastlines have little population base and hence are largely unmodified. In Coos County, coastal hazards can be found in a few discrete communities such as adjacent to the Coquille jetty in Bandon and along Lighthouse Beach near Cape Arago. Similarly, coastal hazards in Lane County are confined almost entirely to the Heceta Beach community and adjacent to the Siuslaw River mouth, particularly within the lower estuary mouth where development lines coastal bluffs that is gradually being eroded by riverine processes. The most vulnerable counties and communities on the Oregon coast include:
Tillamook County (ranked #1) • Neskowin (erosion and flooding) • Pacific City (erosion) • Tierra del Mar (erosion and flooding) • Cape Meares (flooding) • Twin Rocks (erosion and flooding) • Rockaway Beach(erosion and flooding)
Lincoln County (ranked #2) • Yachats to Alsea Spit (erosion) • Waldport (erosion and flooding) • Alsea Spit (erosion) • Seal Rock (erosion and landsliding) • Ona Beach to Southbeach (erosion and landsliding) • Newport (landsliding) • Beverly Beach (erosion and landsliding) • Gleneden Beach to Siletz Spit (erosion, landsliding, and flooding) • Lincoln City (erosion and landsliding)
2015 DRAFT NHMP, Risk Assessment, State Vulnerabilty, v03, 08/01/2014 169
Clatsop County (ranked #3) • Falcon Cove (erosion and landsliding) • Arch Cape (erosion and flooding) • Tolovana to Cannon Beach (erosion and flooding) • Seaside (Flooding) Curry County (ranked #4) • Nesika Beach (erosion and landsliding) • Port Orford (flooding at Garrison Lake) Coos County (ranked #5) • North Coos Spit (erosion) • Lighthouse Beach (bluff erosion) • Bandon (erosion and flooding, particularly adjacent to the south Coquille jetty) Lane County (ranked #6) • Heceta Beach (erosion and flooding)
Intellectual knowledge derived from field experience, discussions with scientists, scientific publications, agency reports, and thesis dissertations were used to determine which communities are the most vulnerable to coastal hazards within Oregon.
2015 DRAFT NHMP, Risk Assessment, State Vulnerabilty, v03, 08/01/2014 170
Drought There is a tendency to associate drought conditions with the arid sections of the state, principally east of the Cascade Mountains. However, this perception is not entirely accurate. During the winter of 2002-03, Coos and Curry counties on the south coast experienced drought conditions for some time. When a drought occurs, it may affect all regions of the state. However, most of Oregon’s urban areas usually fare much better during a drought than rural, less populated regions of the state. By encouraging or invoking water conservation measures during a drought, municipalities can reduce residential and industrial demand for water. Rural areas are much more dependent on water for irrigation for agricultural production. Several regions of the state, dependent on an agricultural economy, are more vulnerable to drought conditions. Generally, counties west of the Cascades and in the southern portions of the state are more prone to drought-related impacts. Most Vulnerable Communities
The Water Resources Department (WRD) is the state agency with primary oversight of drought conditions and mitigation activities. Based on the frequency of drought declarations issued by the Governor issued since 1995, Klamath and Baker Counties are the most vulnerable to drought, followed by Sherman, Gilliam, Morrow, and Malheur Counties. Both Klamath and Baker Counties have experienced 7 drought declarations out of the last 13 years. The above communities were identified as most vulnerable based on the frequency of drought declarations issued by the Governor issued since 1995.
2015 DRAFT NHMP, Risk Assessment, State Vulnerabilty, v03, 08/01/2014 171
Dust Storms Dust storms primarily occur in the arid regions of Central and Eastern Oregon They are generally produced by the interaction of strong winds, fine-grained surface material, and landscapes with little vegetation. The winds involved can be as small as "dust devils" or as large as fast moving regional air masses.
Most Vulnerable Communities
Based on research conducted by OEM, the counties in Oregon most vulnerable to dust storms are Morrow and Umatilla. These two counties are most vulnerable because historically in locations close to their county lines, a combination of soil types, past agricultural practices, and high winds have led to motor vehicle accidents that have resulted in many deaths and injuries. The following counties are also vulnerable: Baker, Deschutes, Harney, Jefferson, Klamath, Lake, Malheur, Union, and Wasco. Poor visibility leading to motor vehicle crashes is the worst potential impact of these storms; often these crashes result in fatalities and major injuries. Other impacts include poor air quality, including dust infiltration of equipment and engines, loss of productive soil, and an increase in fine sediment loading of creeks and rivers. Communities most vulnerable to dust storms have been identified on the basis of historic occurrence, including the impacts of those occurrences.
2015 DRAFT NHMP, Risk Assessment, State Vulnerabilty, v03, 08/01/2014 172
Earthquake Oregon has a long history of earthquakes (and tsunamis, which often accompany major off-shore seismic events) because of the state’s proximity to the Cascadia Subduction Zone (CSZ) just off the Pacific Coast, and also from crustal faults that run under or near populated areas. Oregon is vulnerable to damage because of its topography and geology; many of its local soil profiles are prone to liquefaction during the shaking that would occur during a Cascadia event. Depending on the size of the fault rupture, areas receiving major damage from an magnitude 8.0 – 9.0 earthquake would include most of the counties in Western Oregon; the heavily populated metropolitan areas of Portland, Salem, and Eugene would certainly experience major damage. A major Cascadia earthquake (>MW8.5) or a local crustal earthquake (>MW5.0) would be devastating to the Portland metropolitan area. The Northern Willamette Valley/Portland Metro Region is the most densely populated region with a total population of almost 1.5 million people. A major earthquake would likely do extensive damage to many of the region’s 1382 bridges and overpasses as few bridges have been retrofitted to withstand this type of event. In addition, many structures are located on soils likely to experience liquefaction from the shaking that would occur. Most of the state’s major critical infrastructure such as energy sector lifelines, transportation hubs, and medical facilities are particularly vulnerable to damage from liquefaction and long periods of shaking. The Northern Willamette Valley/Portland Metro Region also has 49 dams that could be affected by a major earthquake. Depending on the size of the fault rupture, this magnitude of earthquake would likely cause extensive damage to structures and infrastructure in the Mid/Southern Willamette Valley Region as well. The city of Salem, Oregon’s state capital, is only 46 miles south of Portland. To gain a perspective of the potential damage from a major earthquake, 169 of the state’s facilities are located in or near Salem. To replace these state facilities would cost over $850 million dollars. Marion County, where Salem is located, has over 20 dams and 400 bridges that could also be affected. For more information on state facilities located in earthquake hazard zones, see pg. X of this Plan. The long-term effects from a major earthquake would be felt for years. Major damage would likely occur to most of western Oregon’s public and private buildings, its vast road network, to its rail lines and power transmission lines, and to the state’s most important employment centers. A major earthquake that occurs in the southern, central, or eastern areas of Oregon would be catastrophic to that region. It may also be catastrophic to the state economically if key facilities and infrastructure (i.e., highways, bridges, rail lines, power transmission lines, and dams) are damaged to the degree that links with the Portland metropolitan region and the rest of the state could not quickly be repaired. However, the length of time for the state to recover from such a disaster occurring in an area away from the Portland metropolitan area should be much shorter than if the same event occurred near Portland. For more information about the seismic vulnerability lifelines, see pages X-X summarizing the Oregon Department of Transportation’s Seismic Lifeline Report. In the late 1990s, DOGAMI developed two earthquake loss models for Oregon: (1) a magnitude 8.5 Cascadia Subduction Zone (CSZ), and (2) a 500-yr probabilistic ground motion model, which combines CSZ, intraplate and crustal events. Both models are based on HAZUS, a computer program developed by the Federal Emergency Management Agency (FEMA) as a means of determining potential losses from earthquakes. The CSZ event is based on a potential 8.5 earthquake generated off the Oregon
2015 DRAFT NHMP, Risk Assessment, State Vulnerabilty, v03, 08/01/2014 173
coast. The 500-yr model incorporates earthquake ground motions with 10% chance of exceedence in the next 50 years, which was used by the building code. It does not look at a single earthquake (as in the CSZ model) but encompasses many faults. Neither model takes into account damage and losses from unreinforced masonry buildings or tsunamis. Due to the limitations of HAZUS with respect to modeling damage from unreinforced masonry buildings and tsunamis at that time, DOGAMI estimated fatalities outside of the HAZUS model. DOGAMI developed lower bound estimates on the order of 5,000 fatalities. DOGAMI investigators caution that the models contain a high degree of uncertainty and should be used only for general planning and policy purposes. Despite the model limitations, valuable estimates of damage, functionality and relationships between county estimates are made available for each region within Oregon. Results for each OEM Hazard Mitigation Region are found in the Regional Risk Assessment section of this plan (beginning on page xx). In 2000, DOGAMI co-organized an important conference convening scientists to discuss the Cascadia fault. At this Geological Society of America Penrose conference, which was held in Seaside, Oregon, there was scientific consensus that the most recent Cascadia earthquake occurred in 1700, that it was a magnitude 9 earthquake, and the Cascadia fault would produce future magnitude 9 earthquakes and damaging tsunamis (DOGAMI Special Paper 33, found at website: http://www.naturenw.org/qs3/products.php?sku=001227 ). Also in 2000, the Oregon Seismic Safety Policy Advisory Commission (OSSPAC) developed a report called "Oregon At Risk" which address the many cross-cutting effects that earthquakes have on our communities, including the basic services provided by infrastructure. Five objectives were outlined: 1) earthquake awareness and education, 2) earthquake risk information, 3) earthquake safety of buildings and lifelines, 4) geoscience and technical information, and 5) emergency pre-disaster planning, response and recovery. The report is available on the following Oregon Emergency Management webpage: http://www.oregon.gov/omd/oem/pages/osspac/osspac.aspx. In 2007, DOGAMI completed a rapid visual screening (RVS) of educational and emergency facilities in communities across Oregon, as directed by the Oregon Legislature in Senate Bill 2 (2005). RVS is a technique developed by the Federal Emergency Management Agency (FEMA), known as FEMA 154, to identify, inventory, and rank buildings that are potentially vulnerable to seismic events. DOGAMI surveyed a total of 3,349 buildings, giving each a ‘low,’ ‘moderate,’ ‘high,’ or ‘very high’ potential of collapse in the event of an earthquake. It is important to note that these rankings represent a probability of collapse based on limited observed and analytical data and are therefore approximate rankings.1 The RVS study can help to prioritize which buildings require additional studies and which do not. To fully assess a building’s potential of collapse, a more detailed engineering study completed by a qualified professional is required. In the Regional Assessments section of this Plan, details of this study for each OEM Hazard Mitigation Region can be found (pages xx-yy).
1 State of Oregon Department of Geologic and Mineral Industries, Implementation of 2005 Senate Bill 2 Relating to Public Safety, Seismic Safety and Seismic Rehabilitation of Public Building, May 22, 2007, iv.
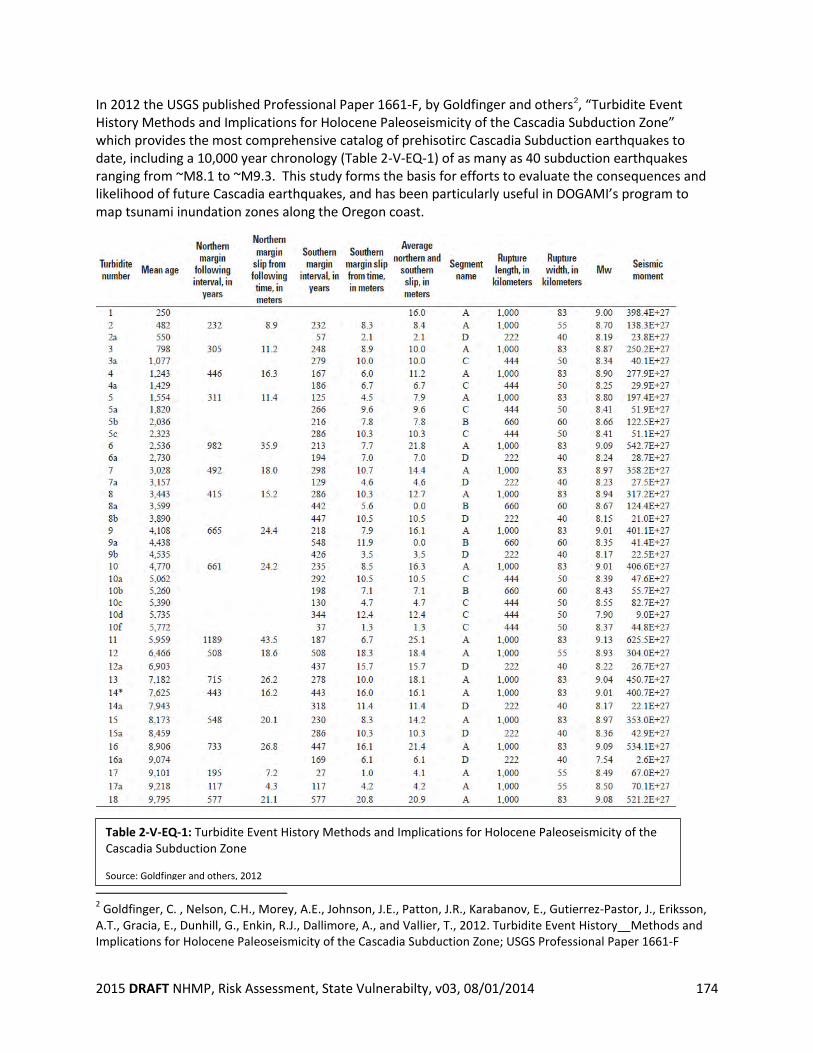
2015 DRAFT NHMP, Risk Assessment, State Vulnerabilty, v03, 08/01/2014 174
In 2012 the USGS published Professional Paper 1661-F, by Goldfinger and others2, “Turbidite Event History Methods and Implications for Holocene Paleoseismicity of the Cascadia Subduction Zone” which provides the most comprehensive catalog of prehisotirc Cascadia Subduction earthquakes to date, including a 10,000 year chronology (Table 2-V-EQ-1) of as many as 40 subduction earthquakes ranging from ~M8.1 to ~M9.3. This study forms the basis for efforts to evaluate the consequences and likelihood of future Cascadia earthquakes, and has been particularly useful in DOGAMI’s program to map tsunami inundation zones along the Oregon coast.
.
2 Goldfinger, C. , Nelson, C.H., Morey, A.E., Johnson, J.E., Patton, J.R., Karabanov, E., Gutierrez-Pastor, J., Eriksson, A.T., Gracia, E., Dunhill, G., Enkin, R.J., Dallimore, A., and Vallier, T., 2012. Turbidite Event History__Methods and Implications for Holocene Paleoseismicity of the Cascadia Subduction Zone; USGS Professional Paper 1661-F
Table 2-V-EQ-1: Turbidite Event History Methods and Implications for Holocene Paleoseismicity of the Cascadia Subduction Zone Source: Goldfinger and others, 2012
2015 DRAFT NHMP, Risk Assessment, State Vulnerabilty, v03, 08/01/2014 175
In 2013, DOGAMI published Open-File Report O-13-09, by Wang and others3, “Earthquake Risk Study for Oregon’s Critical Energy Infrastructure Hub”. This report highlights the concentration of critical energy facilities in the Portland Harbor area of the lower Willamette River, and the seismic risk posed by a combination of liquefiable soils and the age and poor condition of many facilities in the area. The report also points out how dependent Oregon is on this concentration of facilities for virtually all petroleum products used in the State, and the potential impacts on post earthquake recovery if these facilities are damaged. Also in 2013, the Cascadia Region Earthquake Workgroup (CREW) issued a Cascadia magnitude 9 scenario, which provides a narrative on the expected effects throughout the region including northern California, Oregon, Washington and British Columbia (www.crew.org). Some of the CREW scenario was obtained from the 2011 Federal Emergency Management Agency (FEMA) regional planning scenario for the Pacific Northwest (Draft Analytical Baseline Study for the Cascadia Earthquake and Tsunami, September 12, 2011) based on a magnitude 9 megathrust earthquake. Using the most current version of HAZUS, FEMA’s disaster loss modeling software, they have prepared the most comprehensive and realistic Cascadia scenario to date). In addition to HAZUS analysis, FEMA evaluated likely tsunami effects for several Oregon coastal communities. Data like this provides a critical tool for planning emergency response and for designing a resiliency plan, as it highlights areas of infrastructure damage that affect the entire system. State and local government agencies have been working with FEMA to provide local knowledge to inform the scenario, and the final document and associated databases should be adopted as the basis for planning. In general the scenario results predict severe damage in coastal areas, particularly in tsunami inundation zones with widespread but moderate damage along the I-5 corridor (Figure 2-V-EQ-1 ). For more information about tsunamis in Oregon, see pages 102 and X. For more information about seismic lifeline vulnerability see page xx.
3 Wang, Y., Bartlett, S.F., and Miles, S.B., 2013, Earthquake Risk Study for Oregon’s Critical Energy Infrastructure Hub; Oregon Department of Geology and Mineral Industries Open-File Report, O-13-09
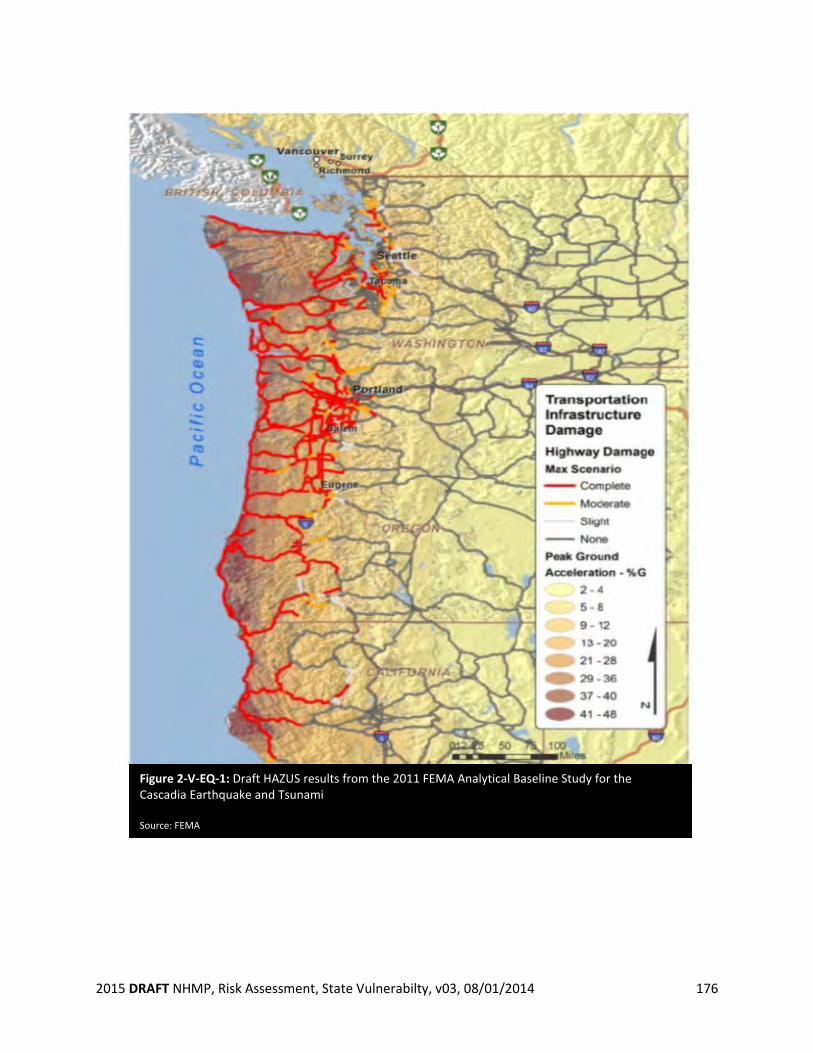
2015 DRAFT NHMP, Risk Assessment, State Vulnerabilty, v03, 08/01/2014 176
Figure 2-V-EQ-1: Draft HAZUS results from the 2011 FEMA Analytical Baseline Study for the Cascadia Earthquake and Tsunami Source: FEMA
2015 DRAFT NHMP, Risk Assessment, State Vulnerabilty, v03, 08/01/2014 177
The Oregon Seismic Safety Policy Advisory Commission (OSSPAC) developed a report in 2013 entitled "The Oregon Resilience Plan: Reducing Risk and Improving Recovery for the Next Cascadia Earthquake and Tsunami”. The report, which was commissioned by a legislative resolution, estimated the impacts of an M 9.0 Cascadia subduction earthquake on the State’s population, buildings and infrastructure with a focus on 7 sectors:
• Businesses • Coastal Communities • Energy • Transportation • Communication • Critical Buildings • Water and wastewater
For each of these sectors the Plan sets a desired level of performance (time to recover a given level of service) and estimates preformance under current conditions in each of four earthquake impact zones:
• Tsunami, where damage will be complete and saving lives through evacuation is the main focus
• Coastal, where damage will be severe and the focus will be on managing a displaced population with little functioning infrastructure,
• Valley, where moderate damage will be widespread, and the focus will be on restoring services quickly to re-start the economy,
• Eastern, where damage will be light, and the focus will be on staging recovery efforts for the rest of the state.
For the first three zones, times for restoration of services(Table 2-V-EQ-2) are typically several months, and in some cases several years, a clearly unacceptable level of performance, and far short of the general performance goal of two weeks to restore most services to functional, if not original conditions. These results are particularly sobering in the face of the report’s finding that where services are not restored within 2 to 4 weeks, businesses will either fail or leave. The report includes extensive recommendations for actions that if implemented over the next 50 years, should greatly improve the performance of Oregon’s buildigns and infrastructure in the next great earthquake. These include:
• Undertaking comprehensive assessments of key structures and systems • Launching a sustained program of investment in retrofit of Oregon’s public buildings • Creating a package of incentives to help Oregon’s private sector improve its resieinece • Updating public policies to streamline recovery and to increase public preparedness.
Upon consideration of the Plan, the 2013 Oregon Legislature passed Senate Bill 33 establishing an Oregon Resilience Task Force to facilitate a comprehensive and robust plan to implement the Oregon Resilience Plan. The Task Force will report to the Oregon Legislature during the 2015 session. The report and an executive summary are available at:
• http://www.oregon.gov/OMD/OEM/osspac/docs/Oregon_Resilience_Plan_Final.pdf • http://www.oregon.gov/OMD/OEM/osspac/docs/Oregon_Resilience_Plan_Executive_Summar
y_Final.pdf
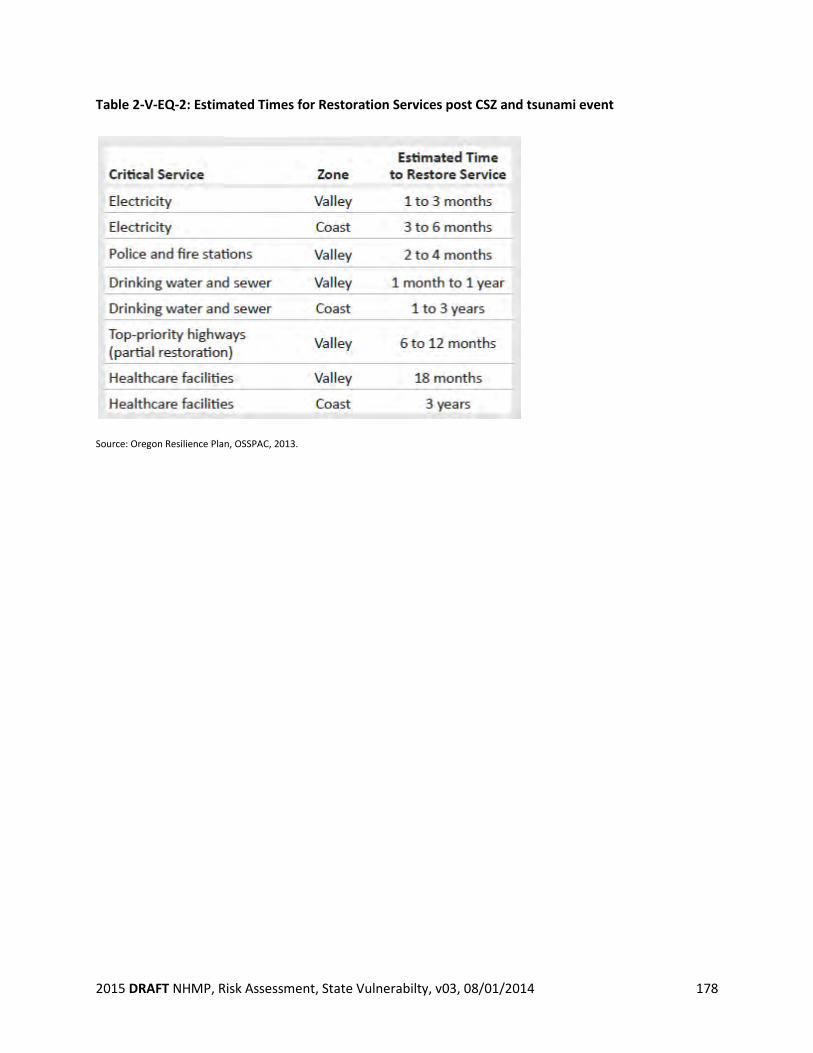
2015 DRAFT NHMP, Risk Assessment, State Vulnerabilty, v03, 08/01/2014 178
Table 2-V-EQ-2: Estimated Times for Restoration Services post CSZ and tsunami event
Source: Oregon Resilience Plan, OSSPAC, 2013.
2015 DRAFT NHMP, Risk Assessment, State Vulnerabilty, v03, 08/01/2014 179
Most Vulnerable Communities
The Department of Geology and Mineral Industries (DOGAMI) is the agency with primary oversight of the earthquake hazard identification and risk evaluation, and also has responsibilities on earthquake risk mitigation. DOGAMI has developed two earthquake loss models for Oregon based on the two most likely sources of seismic events: (1) the Cascadia Subduction Zone (CSZ), and (2) combined crustal events (500-year Model). Both models are based on HAZUS, a computerized program, currently used by the FEMA as a means of determining potential losses from earthquakes. The CSZ event is based on a potential 8.5 earthquake generated off the Oregon coast. The model does not take into account a tsunami, which probably would develop from the event. The 500-Year crustal model does not look at a single earthquake (as in the CSZ model); it encompasses many faults, each with a 10% chance of producing an earthquake in the next 50 years. The model assumes that each fault will produce a single “average” earthquake during this time. Neither model takes unreinforced masonry buildings into consideration DOGAMI investigators caution that the models contain a high degree of uncertainty and should be used only for general planning purposes. Despite their limitations, the models do provide some approximate estimates of damage. Below DOGAMI lists all counties in the state in the order of projected losses and damages (highest to lowest) based on the two models mentioned above. See Special Paper 29 for more information on these earthquake loss models, found at website: http://www.naturenw.org/qs3/products.php?sku=001223. Counties listed from highest to lowest based on projected losses and damages from a Cascadia Subduction Zone (CSZ) earthquake: 1. Multnomah 2. Lane 3. Coos 4. Washington 5. Marion 6. Benton 7. Lincoln 8. Josephine 9. Clatsop 10. Jackson 11. Linn 12. Curry 13. Clackamas 14. Douglas 15. Yamhill 16. Polk 17. Tillamook 18. Columbia
2015 DRAFT NHMP, Risk Assessment, State Vulnerabilty, v03, 08/01/2014 180
19. Klamath 20. Deschutes 21. Hood River 22. Jefferson 23. Grant 24. Gilliam 25. Harney 26. Lake 27. Umatilla 28. Baker 29. Crook 30. Malheur 31. Morrow 32. Sherman 33. Union 34. Wallowa 35. Wasco 36. Wheeler Counties listed from highest to lowest based on projected losses and damages due to combined crustal events using a 500-year model: 1. Multnomah 2. Washington 3. Lane 4. Marion 5. Clackamas 6. Coos 7. Jackson 8. Benton 9. Linn 10. Klamath 11. Josephine 12. Lincoln 13. Clatsop 14. Yamhill 15. Douglas 16. Polk 17. Curry 18. Tillamook 19. Columbia 20. Deschutes 21. Umatilla
2015 DRAFT NHMP, Risk Assessment, State Vulnerabilty, v03, 08/01/2014 181
22. Hood River 23. Malheur 24. Lake 25. Wasco 26. Jefferson 27. Baker 28. Morrow 29. Union 30. Wallowa 31. Crook 32. Grant 33. Harney 34. Sherman 35. Wheeler 36. Gilliam
It should be emphasized that in the original 1999 DOGAMI study, the estimated statewide losses did not include tsunami-related losses. In the future, an updated HAZUS study should include the current population and infrastructure as well as losses from a tsunami. If the tsunami losses were included, the above 15 counties may be shifted to include coastal counties, such as Lincoln County.
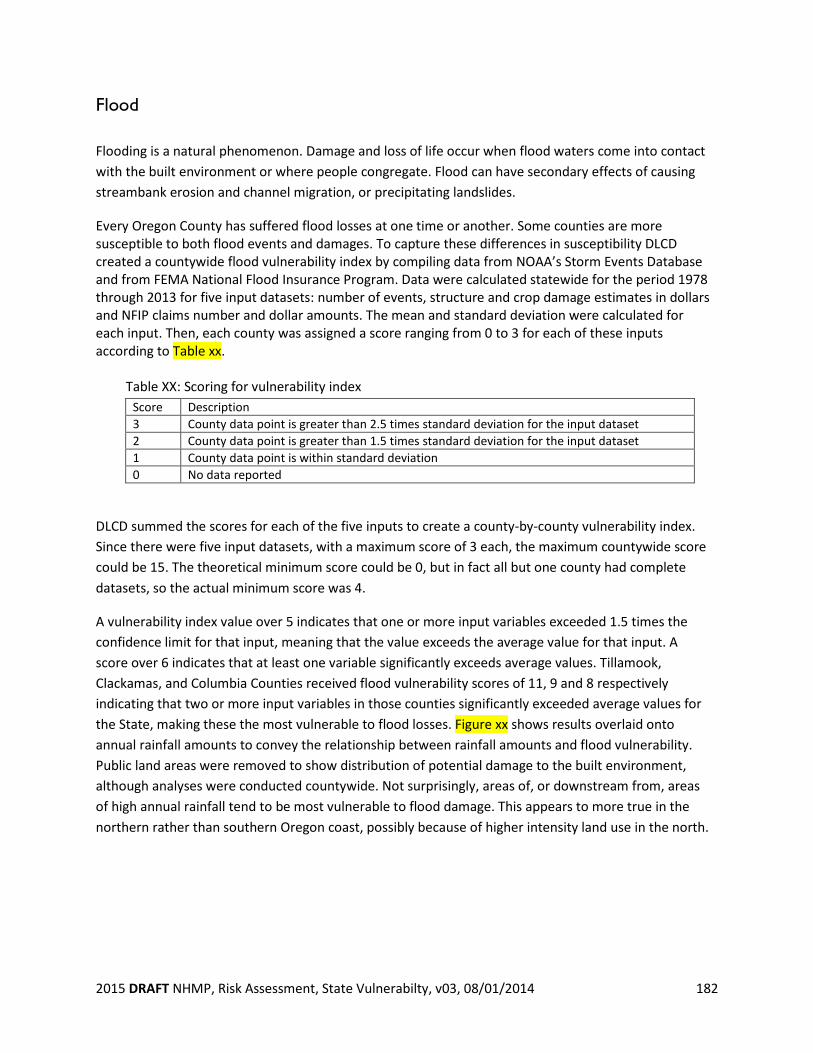
2015 DRAFT NHMP, Risk Assessment, State Vulnerabilty, v03, 08/01/2014 182
Flood Flooding is a natural phenomenon. Damage and loss of life occur when flood waters come into contact with the built environment or where people congregate. Flood can have secondary effects of causing streambank erosion and channel migration, or precipitating landslides.
Every Oregon County has suffered flood losses at one time or another. Some counties are more susceptible to both flood events and damages. To capture these differences in susceptibility DLCD created a countywide flood vulnerability index by compiling data from NOAA’s Storm Events Database and from FEMA National Flood Insurance Program. Data were calculated statewide for the period 1978 through 2013 for five input datasets: number of events, structure and crop damage estimates in dollars and NFIP claims number and dollar amounts. The mean and standard deviation were calculated for each input. Then, each county was assigned a score ranging from 0 to 3 for each of these inputs according to Table xx.
Table XX: Scoring for vulnerability index Score Description 3 County data point is greater than 2.5 times standard deviation for the input dataset 2 County data point is greater than 1.5 times standard deviation for the input dataset 1 County data point is within standard deviation 0 No data reported
DLCD summed the scores for each of the five inputs to create a county-by-county vulnerability index. Since there were five input datasets, with a maximum score of 3 each, the maximum countywide score could be 15. The theoretical minimum score could be 0, but in fact all but one county had complete datasets, so the actual minimum score was 4.
A vulnerability index value over 5 indicates that one or more input variables exceeded 1.5 times the confidence limit for that input, meaning that the value exceeds the average value for that input. A score over 6 indicates that at least one variable significantly exceeds average values. Tillamook, Clackamas, and Columbia Counties received flood vulnerability scores of 11, 9 and 8 respectively indicating that two or more input variables in those counties significantly exceeded average values for the State, making these the most vulnerable to flood losses. Figure xx shows results overlaid onto annual rainfall amounts to convey the relationship between rainfall amounts and flood vulnerability. Public land areas were removed to show distribution of potential damage to the built environment, although analyses were conducted countywide. Not surprisingly, areas of, or downstream from, areas of high annual rainfall tend to be most vulnerable to flood damage. This appears to more true in the northern rather than southern Oregon coast, possibly because of higher intensity land use in the north.
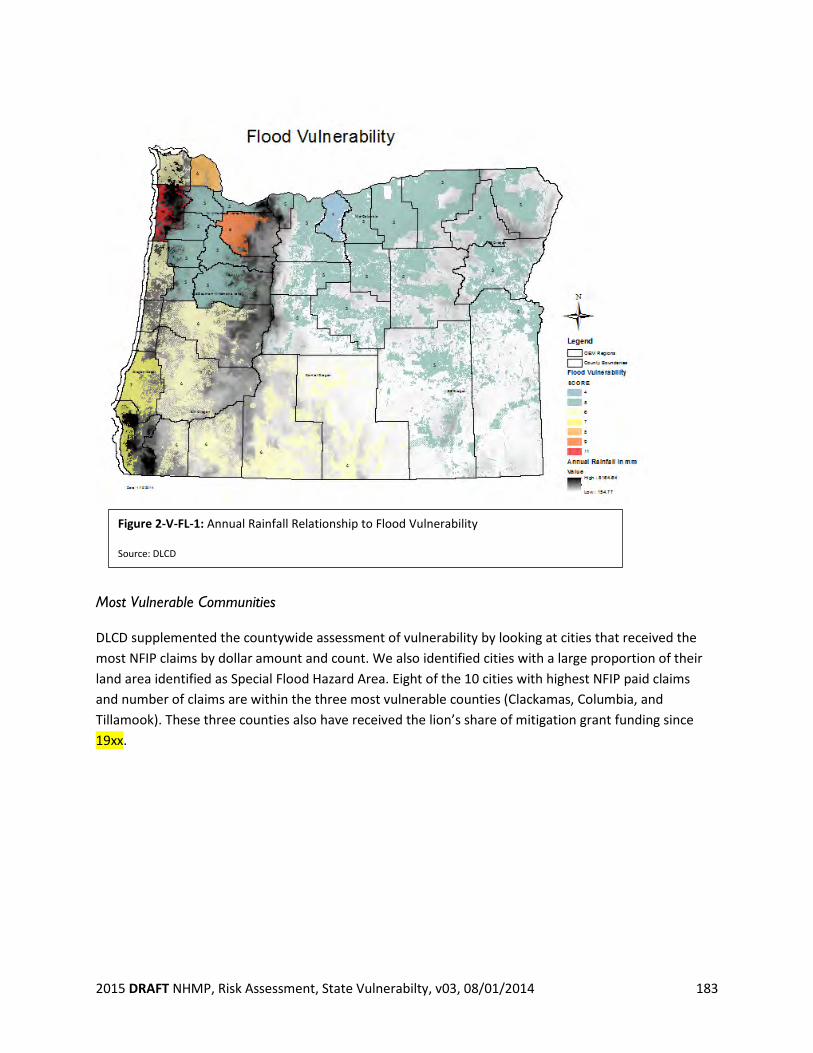
2015 DRAFT NHMP, Risk Assessment, State Vulnerabilty, v03, 08/01/2014 183
Most Vulnerable Communities
DLCD supplemented the countywide assessment of vulnerability by looking at cities that received the most NFIP claims by dollar amount and count. We also identified cities with a large proportion of their land area identified as Special Flood Hazard Area. Eight of the 10 cities with highest NFIP paid claims and number of claims are within the three most vulnerable counties (Clackamas, Columbia, and Tillamook). These three counties also have received the lion’s share of mitigation grant funding since 19xx.
Figure 2-V-FL-1: Annual Rainfall Relationship to Flood Vulnerability
Source: DLCD
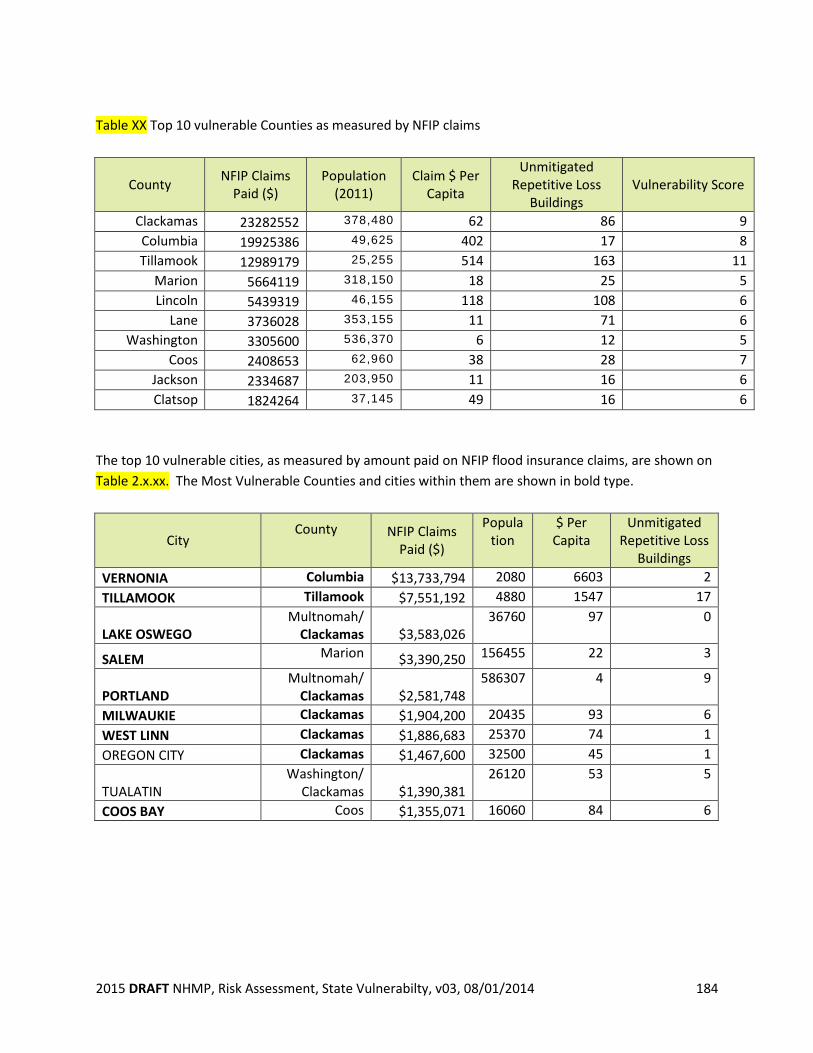
2015 DRAFT NHMP, Risk Assessment, State Vulnerabilty, v03, 08/01/2014 184
Table XX Top 10 vulnerable Counties as measured by NFIP claims
County NFIP Claims Paid ($)
Population (2011)
Claim $ Per Capita
Unmitigated Repetitive Loss
Buildings Vulnerability Score
Clackamas 23282552 378,480 62 86 9 Columbia 19925386 49,625 402 17 8 Tillamook 12989179 25,255 514 163 11
Marion 5664119 318,150 18 25 5 Lincoln 5439319 46,155 118 108 6
Lane 3736028 353,155 11 71 6 Washington 3305600 536,370 6 12 5
Coos 2408653 62,960 38 28 7 Jackson 2334687 203,950 11 16 6 Clatsop 1824264 37,145 49 16 6
The top 10 vulnerable cities, as measured by amount paid on NFIP flood insurance claims, are shown on Table 2.x.xx. The Most Vulnerable Counties and cities within them are shown in bold type.
City County
NFIP Claims Paid ($)
Population
$ Per Capita
Unmitigated Repetitive Loss
Buildings VERNONIA Columbia $13,733,794 2080 6603 2 TILLAMOOK Tillamook $7,551,192 4880 1547 17
LAKE OSWEGO Multnomah/
Clackamas $3,583,026 36760 97 0
SALEM Marion $3,390,250 156455 22 3
PORTLAND Multnomah/
Clackamas $2,581,748 586307 4 9
MILWAUKIE Clackamas $1,904,200 20435 93 6 WEST LINN Clackamas $1,886,683 25370 74 1 OREGON CITY Clackamas $1,467,600 32500 45 1
TUALATIN Washington/
Clackamas $1,390,381 26120 53 5
COOS BAY Coos $1,355,071 16060 84 6
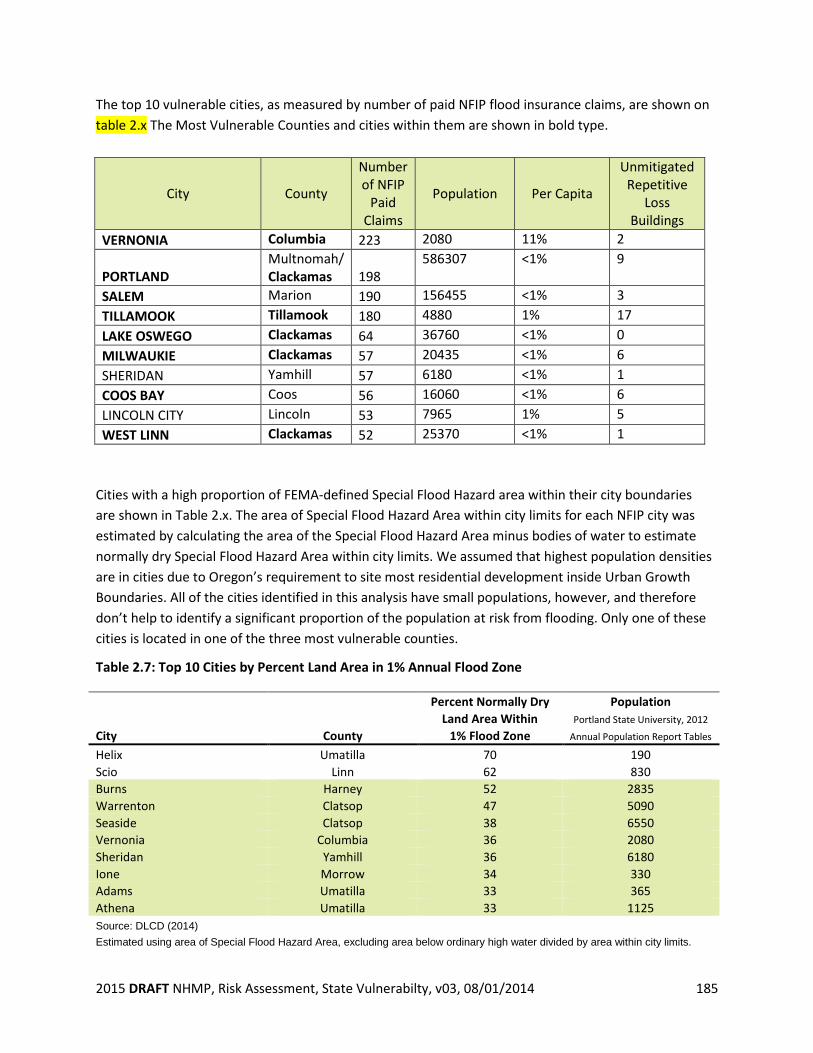
2015 DRAFT NHMP, Risk Assessment, State Vulnerabilty, v03, 08/01/2014 185
The top 10 vulnerable cities, as measured by number of paid NFIP flood insurance claims, are shown on table 2.x The Most Vulnerable Counties and cities within them are shown in bold type.
City County
Number of NFIP
Paid Claims
Population Per Capita
Unmitigated Repetitive
Loss Buildings
VERNONIA Columbia 223 2080 11% 2
PORTLAND Multnomah/ Clackamas 198
586307 <1% 9
SALEM Marion 190 156455 <1% 3 TILLAMOOK Tillamook 180 4880 1% 17 LAKE OSWEGO Clackamas 64 36760 <1% 0 MILWAUKIE Clackamas 57 20435 <1% 6 SHERIDAN Yamhill 57 6180 <1% 1 COOS BAY Coos 56 16060 <1% 6 LINCOLN CITY Lincoln 53 7965 1% 5 WEST LINN Clackamas 52 25370 <1% 1
Cities with a high proportion of FEMA-defined Special Flood Hazard area within their city boundaries are shown in Table 2.x. The area of Special Flood Hazard Area within city limits for each NFIP city was estimated by calculating the area of the Special Flood Hazard Area minus bodies of water to estimate normally dry Special Flood Hazard Area within city limits. We assumed that highest population densities are in cities due to Oregon’s requirement to site most residential development inside Urban Growth Boundaries. All of the cities identified in this analysis have small populations, however, and therefore don’t help to identify a significant proportion of the population at risk from flooding. Only one of these cities is located in one of the three most vulnerable counties.
Table 2.7: Top 10 Cities by Percent Land Area in 1% Annual Flood Zone
City County
Percent Normally Dry Land Area Within
1% Flood Zone
Population Portland State University, 2012
Annual Population Report Tables Helix Umatilla 70 190 Scio Linn 62 830 Burns Harney 52 2835 Warrenton Clatsop 47 5090 Seaside Clatsop 38 6550 Vernonia Columbia 36 2080 Sheridan Yamhill 36 6180 Ione Morrow 34 330 Adams Umatilla 33 365 Athena Umatilla 33 1125 Source: DLCD (2014) Estimated using area of Special Flood Hazard Area, excluding area below ordinary high water divided by area within city limits.
2015 DRAFT NHMP, Risk Assessment, State Vulnerabilty, v03, 08/01/2014 186
Severe Repetitive Losses FEMA has identified 296 buildings in Oregon as repetitive loss (RL) properties.
The NFIP defines a repetitive loss property as any insurable building for which two or more claims of more than $1,000 were paid by the NFIP within any rolling 10-year period since 1978. At least two of the claims must be more than 10 days apart but within 10 years of each other. A repetitive loss property may or may not be currently insured by the NFIP.
In Oregon, RL properties represent about 1% of all insured properties, and account for about 14% of all claims paid (19% of the dollar amount paid). Most (80%) of Oregon’s repetitive loss properties pre-date the FIRMs. 4 These properties are referred to as “pre-FIRM”; they were built in floodplains before FEMA FIRMs became available. Because of this, the property owners do not pay the true, actuarial cost of flood insurance. The RL lists provided by FEMA can have value for hazard mitigation planning because their locations may be indicative of persistent flood or drainage problems that may or may not be reflected on a FIRM.
RL properties in Oregon have suffered on average less than 3 losses each. FEMA reports counts for unincorporated Clackamas (26), Lane (22), Lincoln (37), Tillamook (37), and Washington (25) in the double digits5. Each of these counties also shows at least one severe repetitive loss (defined below). Of the cities, only the City of Tillamook shows RL buildings in the double digits. Together these counties and the one city account for over half of Oregon’s repetitive losses. All of these counties and the one city are located all or part in Oregon’s coastal region, suggesting where the State should focus future mitigation planning and project development. Any mitigation of repetitive loss buildings along the coast also should address exposure to tsunami hazards. Where both flood and tsunami are factors, buy-outs would seem to be an appropriate mitigation strategy.
Severe Repetitive Losses
A subset of repetitive loss properties, a severe repetitive loss property is a structure that:
(a) Is covered under a contract for flood insurance made available under the NFIP; and (b) Has incurred flood related damage –
(i) For which 4 or more separate claims payments have been made under flood insurance coverage with the amount of each such claim exceeding $5,000, and with the cumulative amount of such claims payments exceeding $20,000; or (ii) For which at least 2 separate claims payments have been made under such coverage, with the cumulative amount of such claims exceeding the market value of the insured structure.
4 BureauNet, accessed 7/11/2014 5 Ibid.
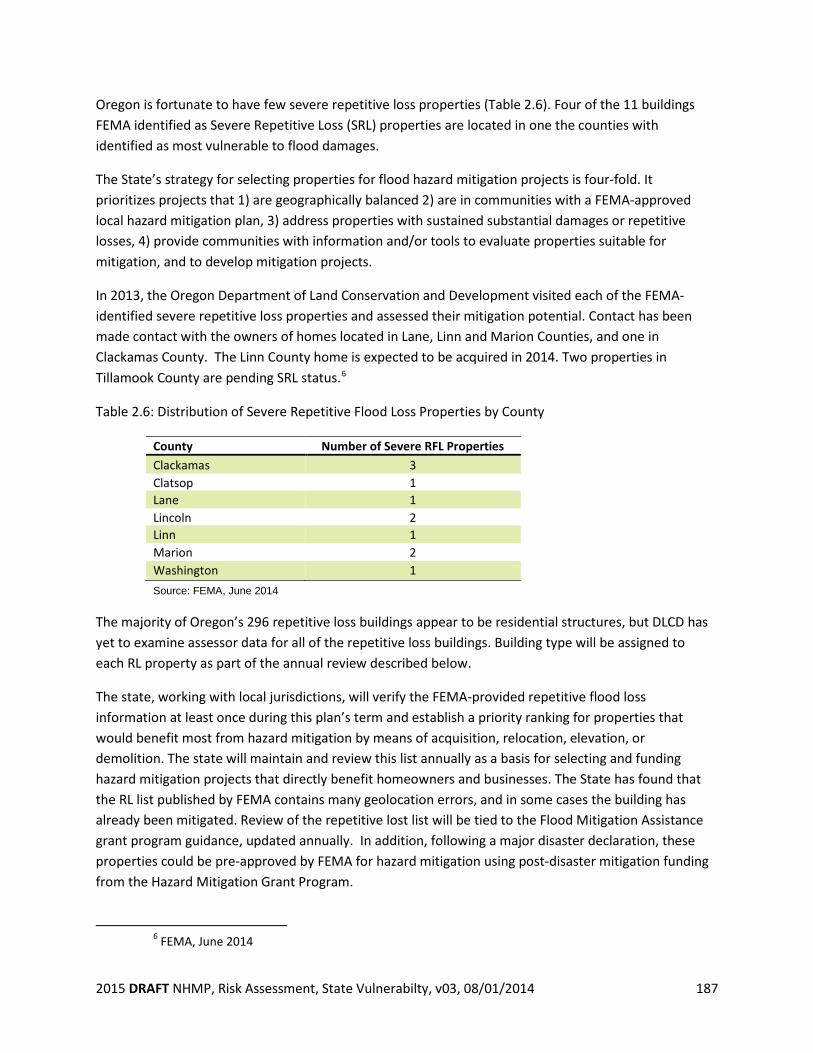
2015 DRAFT NHMP, Risk Assessment, State Vulnerabilty, v03, 08/01/2014 187
Oregon is fortunate to have few severe repetitive loss properties (Table 2.6). Four of the 11 buildings FEMA identified as Severe Repetitive Loss (SRL) properties are located in one the counties with identified as most vulnerable to flood damages.
The State’s strategy for selecting properties for flood hazard mitigation projects is four-fold. It prioritizes projects that 1) are geographically balanced 2) are in communities with a FEMA-approved local hazard mitigation plan, 3) address properties with sustained substantial damages or repetitive losses, 4) provide communities with information and/or tools to evaluate properties suitable for mitigation, and to develop mitigation projects.
In 2013, the Oregon Department of Land Conservation and Development visited each of the FEMA-identified severe repetitive loss properties and assessed their mitigation potential. Contact has been made contact with the owners of homes located in Lane, Linn and Marion Counties, and one in Clackamas County. The Linn County home is expected to be acquired in 2014. Two properties in Tillamook County are pending SRL status.6
Table 2.6: Distribution of Severe Repetitive Flood Loss Properties by County
County Number of Severe RFL Properties Clackamas 3 Clatsop 1 Lane 1 Lincoln 2 Linn 1 Marion 2 Washington 1 Source: FEMA, June 2014
The majority of Oregon’s 296 repetitive loss buildings appear to be residential structures, but DLCD has yet to examine assessor data for all of the repetitive loss buildings. Building type will be assigned to each RL property as part of the annual review described below.
The state, working with local jurisdictions, will verify the FEMA-provided repetitive flood loss information at least once during this plan’s term and establish a priority ranking for properties that would benefit most from hazard mitigation by means of acquisition, relocation, elevation, or demolition. The state will maintain and review this list annually as a basis for selecting and funding hazard mitigation projects that directly benefit homeowners and businesses. The State has found that the RL list published by FEMA contains many geolocation errors, and in some cases the building has already been mitigated. Review of the repetitive lost list will be tied to the Flood Mitigation Assistance grant program guidance, updated annually. In addition, following a major disaster declaration, these properties could be pre-approved by FEMA for hazard mitigation using post-disaster mitigation funding from the Hazard Mitigation Grant Program.
6 FEMA, June 2014
2015 DRAFT NHMP, Risk Assessment, State Vulnerabilty, v03, 08/01/2014 188
Once the repetitive loss list is verified, DLCD and OEM will analyze and summarize the information in a geographical information system to discover spatial patterns associated with repetitive losses. Results will be shared with jurisdictions in which repetitive loss structures are located, with the recommendation that the loss areas be addressed in local hazard mitigation plans as potential mitigation action items (in concept but not by specific property address). DLCD will provide NFIP communities that contain RL properties with the information necessary for them to identify and pre-qualify potential mitigation project opportunities that are cost-effective, environmentally sound and technically feasible. OEM will work with these communities in turning qualified potential projects into sub-grant applications.
In addition, Notice of Funding Availability letters will be sent directly to jurisdictions with validated RL and SRL properties when funding opportunities become available. Local jurisdictions are required to have a current FEMA-approved local hazard mitigation plan in order to be eligible to receive any FEMA funding. Channel Migration Channel migration vulnerability is not well understood at the state or regional level because no systematic identification of the hazard has been performed in Oregon.
2015 DRAFT NHMP, Risk Assessment, State Vulnerabilty, v03, 08/01/2014 189
Landslide Landslides occur statewide in Oregon, although areas with steeper slopes, weaker geology, and higher annual precipitation tend to have more landslides. In general, the coast and Coast Range Mountains and the Cascade Mountains have the most landslides. On occasion, major landslides occur on US or State Highways that sever these major transportation routes (including rail lines) causing temporary but significant economic damage to the state. Although less frequent, landslides and debris flows do occur that result in the death of people located in their paths.
Most Vulnerable Communities
The Department of Geology and Mineral Industries is the agency with primary oversight of the landslide hazard. Based on agency staff review of available hazard data, DOGAMI lists Clackamas, Linn, Douglas, Coos, Lane, Tillamook, Multnomah, Benton, Jackson, Clatsop, Lincoln, Marion, Washington, Curry, Columbia, Hood River, and Yamhill Counties as having the highest hazard and risk to landslide in the state. Because of their importance to the state’s economy, landslides occurring in Multnomah, Clackamas, and Washington Counties present the greatest danger from this type of disaster. Landslides that close US Highway 101 or any of the many highways connecting the I-5 corridor to the coast have a significant effect on commerce in the Oregon Coast Region. Currently, there is no method to evaluate statewide vulnerability to landslides. The communities listed above are primarily based on existing landslide inventory data in SLIDO-2. DOGAMI has performed landslide risk analysis of some individual communities in Oregon including Astoria, part of the HWY 30 transportation corridor, the Mt. Hood region, and parts of the Portland metro. The Mt Hood multi-hazard risk study provides details on the methods used to evaluate landslide and other hazard risk.
Burns, W.J., Hughes, K. B., Olson, K. V., McClaughry, J. D., Mickelson, K. A., Coe, D. E., English, J.T., Roberts, J. T., Lyles Smith, R. R., Madin, I.P., 2012. Multi-Hazard and Risk Study for the Mount Hood Region, Multnomah, Clackamas, and Hood River Counties, Oregon, Oregon Department of Geology and Mineral Industries, Open-File Report O-11-16
2015 DRAFT NHMP, Risk Assessment, State Vulnerabilty, v03, 08/01/2014 190
Tsunami The entire coastal zone is highly vulnerable to tsunami impact. Distant tsunamis caused by earthquakes on the Pacific Rim strike the Oregon coast frequently but only a few of them have caused significant damage or loss of life. Local tsunamis caused by earthquakes on the Cascadia Subduction Zone (CSZ) happen much less frequently but will cause catastrophic damage and, without effective mitigation actions, great loss of life. Because tsunamis in Oregon typically occur as a result of earthquakes, the unknown time and magnitude of such events adds to the difficulty in adequately preparing for such disasters. If a major earthquake occurs along the CSZ, a local tsunami could follow within 5 to 30 minutes. Although tsunami evacuation routes have been posted all along the Oregon Coast, damage to bridges and roadways from an earthquake could make evacuation quite difficult even if a tsunami warning were given. In addition, if a major earthquake and tsunami occur during the “tourist season,” causalities and fatalities from these disasters would be far greater than if the same events occurred during the winter months. It is also important to consider where the impact of a tsunami would be the greatest. Owing to relatively large resident and visitor populations located at very low elevations, cities facing the Pacific Ocean on the northern Oregon Coast are more vulnerable to inundation and have the greater potential for loss of life than coastal cities in central and southern Oregon. USGS estimated vulnerable populations using a tsunami inundation zone similar to the Medium CSZ event, which is the most likely event to occur. That study found that:
(1) 22,201 residents and 10,201 households are in the zone, with the largest numbers in the northern coast;
(2) the City of Seaside had the highest number of residents in the zone (4,790), (3) 7,912 residents (36% of all residents in the zone) are in unincorporated communities, the balance in 26 incorporated communities.7
Similar inventories are not yet available for the currently mapped DOGAMI tsunami inundaton zones, but the lower probability L, XL, and XXL CSZ inundation zones will impact more residents. Distant tsunamis, except for the most extreme events, will not affect significant numbers of residents, since they flood principally beaches and immediate waterfront areas. Loss of life from distant tsunamis will also be far less than for local tsunamis, because there will be at least four hours to evacuate prior to wave arrival rather than 15-20 minutes. That said, visitors are more vulnerable than residents to both distant and locally generated tsunamis, because they are more likely to be at beaches and shoreline parks and are generally less aware of hazard response and preparedness. During the summer and holidays, visitors can greatly outnumber residents in the small coastal towns. While intensive education and outreach programs led by DOGAMI and OEM have greatly increased awareness and preparedness, residents are much more likely to have received this education than visitors.
7 US Geological Survey Scientific Investigations Report 2007-5283.
2015 DRAFT NHMP, Risk Assessment, State Vulnerabilty, v03, 08/01/2014 191
The Oregon Resilience Plan (ORP) uses the impact of a “Medium” or “M” CSZ earthquake and tsunami for planning purposes, because this was judged the most likely CSZ event (see DOGAMI Special Paper 43 for explanation). The current regulatory tsunami inundation utilized by the Oregon Building Code to limit new construction of critical, essential, large occupancy, and hazardous facilities also uses a scenario similar to the “Medium” case. The ORP describes the “M” impact as follows:
Following the Cascadia event, the coastal communities will be cut off from the rest of the state and from each other. The coastal area’s transportation system, electrical power transmission and distribution grid, and natural gas service will be fragmented and offline, with long‐term setbacks to water and wastewater services. Reliable communications will be similarly affected. Because so many of these connecting systems are single lines with little or no redundancy, any break or damage requiring repair or replacement will compromise the service capacity of the entire line. The loss of roads and bridges that run north and south will make travel up and down the coast and into the valley difficult, if not impossible, due to the lack of alternate routes in many areas. Reestablishing the roads and utility infrastructure will be a challenge, and the difficulties will be exacerbated in the tsunami inundation area by its more complete destruction. Even businesses outside of the tsunami inundation may not recover from the likely collapse of a tourist‐based economy during the phased and complicated recovery and reconstruction period. Based on the resilience targets provided by the Transportation, Energy, Communications, and Water/Wastewater task groups, current timelines for the restoration of services up to 90‐percen toperational levels will take a minimum of one to three years, and often over three years in the earthquake‐only zone. Restoration in the tsunami zone will take even longer than that... The most critical infrastructure is the road and highway system. Without functioning road systems, none of the infrastructure can be accessed to begin repairs. The tsunami will also create an enormous amount of debris that needs to be gathered, sorted, and managed. The recent experience of Japan, with a similar mountainous coastline, has shown that debris management competes with shelter and reconstruction needs for the same flat land that is often in the inundation zone.
The ORP estimates that times for recovery of the coastal infrastructure for a Medium CSZ event will be as follows: Electricity and natural gas – 3-6 months, drinking water and sewer systems –1-3 years, and Healthcare facilities – 3 years. The ORP gives no estimate for times to recover police and fire stations or the coastal transportation system, but times for the latter would no doubt be measured in years. Economic recovery would also be many years, since much of the coast is dependent on tourism that is directly dependent on the transportation system. According to the ORP:
Even if a business had sufficient capital to relocate, it is unlikely that the tourist industry will recover rapidly enough to support business start‐up. Local authorities may need to keep tourists out of the inundation zones, for safety reasons, for months or years after a tsunami.
2015 DRAFT NHMP, Risk Assessment, State Vulnerabilty, v03, 08/01/2014 192
Most Vulnerable Communities
The entire coastal region is highly vulnerable to tsunamis, but some areas are more vulnerable owing to geographic and demographic factors. Oregon Emergency Management (OEM) is the agency with primary oversight of emergency response to the tsunami hazard. A 1990 revision of DOGAMI’s enabling statutes added geologic hazard mitigation to its responsibilities, but other state agencies such as OEM and local governments share this responsibility. Based on agency staff review of the available hazard data, particularly estimates of Wood (2007) 5, OEM lists, Clatsop and Tillamook counties as having the highest hazard to tsunami in the state. As previously mentioned, Seaside is the most vulnerable town to tsunamis on the coast, but Gearhart, Cannon Beach, Rockaway Beach, Pacific City, Neskowin, Salishan Spit, Cutler City in Lincoln City, South Beach in Newport, and downtown Waldport are all extremely difficult to evacuate owing to local geographic factors (marshes or lakes limiting evacuation, long distances to evacuation routes, and limited high ground for evacuees) and significant percentages of retirees with limited mobility. Vulnerability of communities is based primarily on difficulty of evacuation in the 15-20 minutes between a CSZ earthquake and arrival of the tsunami. A community is considered highly vulnerable if the population is large with high ground located a long distance away accessible by only a few routes that could be compromised by earthquake damage.
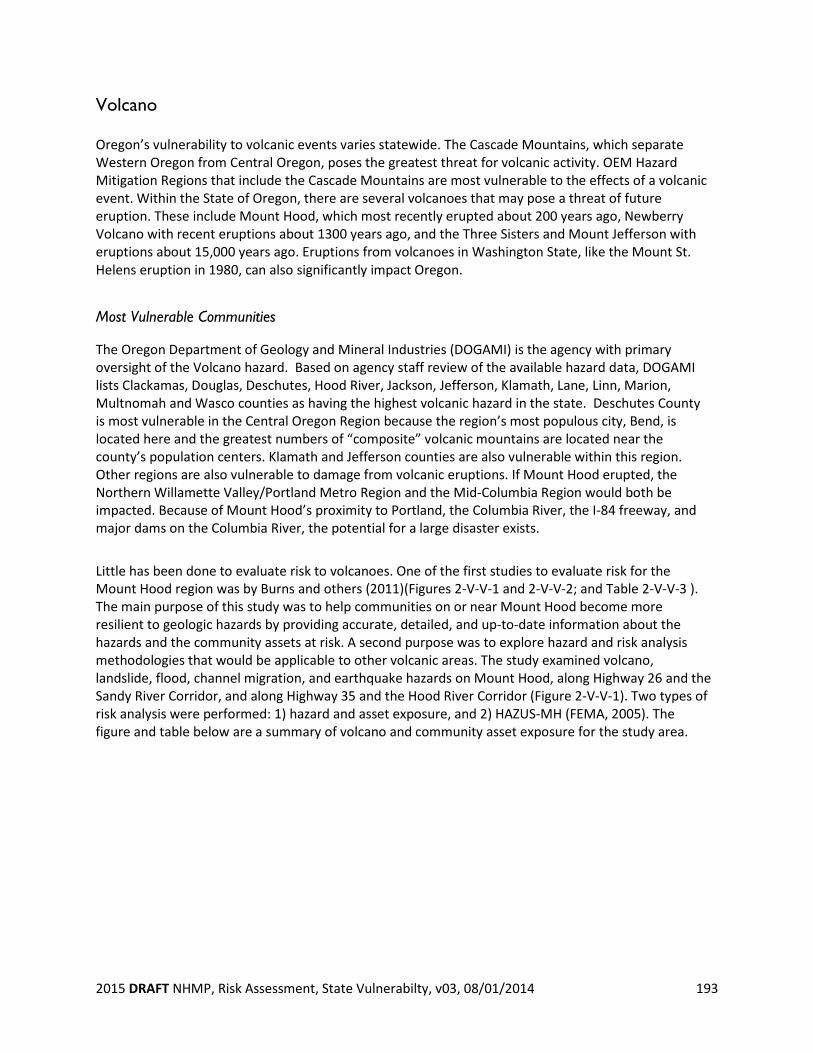
2015 DRAFT NHMP, Risk Assessment, State Vulnerabilty, v03, 08/01/2014 193
Volcano Oregon’s vulnerability to volcanic events varies statewide. The Cascade Mountains, which separate Western Oregon from Central Oregon, poses the greatest threat for volcanic activity. OEM Hazard Mitigation Regions that include the Cascade Mountains are most vulnerable to the effects of a volcanic event. Within the State of Oregon, there are several volcanoes that may pose a threat of future eruption. These include Mount Hood, which most recently erupted about 200 years ago, Newberry Volcano with recent eruptions about 1300 years ago, and the Three Sisters and Mount Jefferson with eruptions about 15,000 years ago. Eruptions from volcanoes in Washington State, like the Mount St. Helens eruption in 1980, can also significantly impact Oregon.
Most Vulnerable Communities
The Oregon Department of Geology and Mineral Industries (DOGAMI) is the agency with primary oversight of the Volcano hazard. Based on agency staff review of the available hazard data, DOGAMI lists Clackamas, Douglas, Deschutes, Hood River, Jackson, Jefferson, Klamath, Lane, Linn, Marion, Multnomah and Wasco counties as having the highest volcanic hazard in the state. Deschutes County is most vulnerable in the Central Oregon Region because the region’s most populous city, Bend, is located here and the greatest numbers of “composite” volcanic mountains are located near the county’s population centers. Klamath and Jefferson counties are also vulnerable within this region. Other regions are also vulnerable to damage from volcanic eruptions. If Mount Hood erupted, the Northern Willamette Valley/Portland Metro Region and the Mid-Columbia Region would both be impacted. Because of Mount Hood’s proximity to Portland, the Columbia River, the I-84 freeway, and major dams on the Columbia River, the potential for a large disaster exists.
Little has been done to evaluate risk to volcanoes. One of the first studies to evaluate risk for the Mount Hood region was by Burns and others (2011)(Figures 2-V-V-1 and 2-V-V-2; and Table 2-V-V-3 ). The main purpose of this study was to help communities on or near Mount Hood become more resilient to geologic hazards by providing accurate, detailed, and up-to-date information about the hazards and the community assets at risk. A second purpose was to explore hazard and risk analysis methodologies that would be applicable to other volcanic areas. The study examined volcano, landslide, flood, channel migration, and earthquake hazards on Mount Hood, along Highway 26 and the Sandy River Corridor, and along Highway 35 and the Hood River Corridor (Figure 2-V-V-1). Two types of risk analysis were performed: 1) hazard and asset exposure, and 2) HAZUS-MH (FEMA, 2005). The figure and table below are a summary of volcano and community asset exposure for the study area.
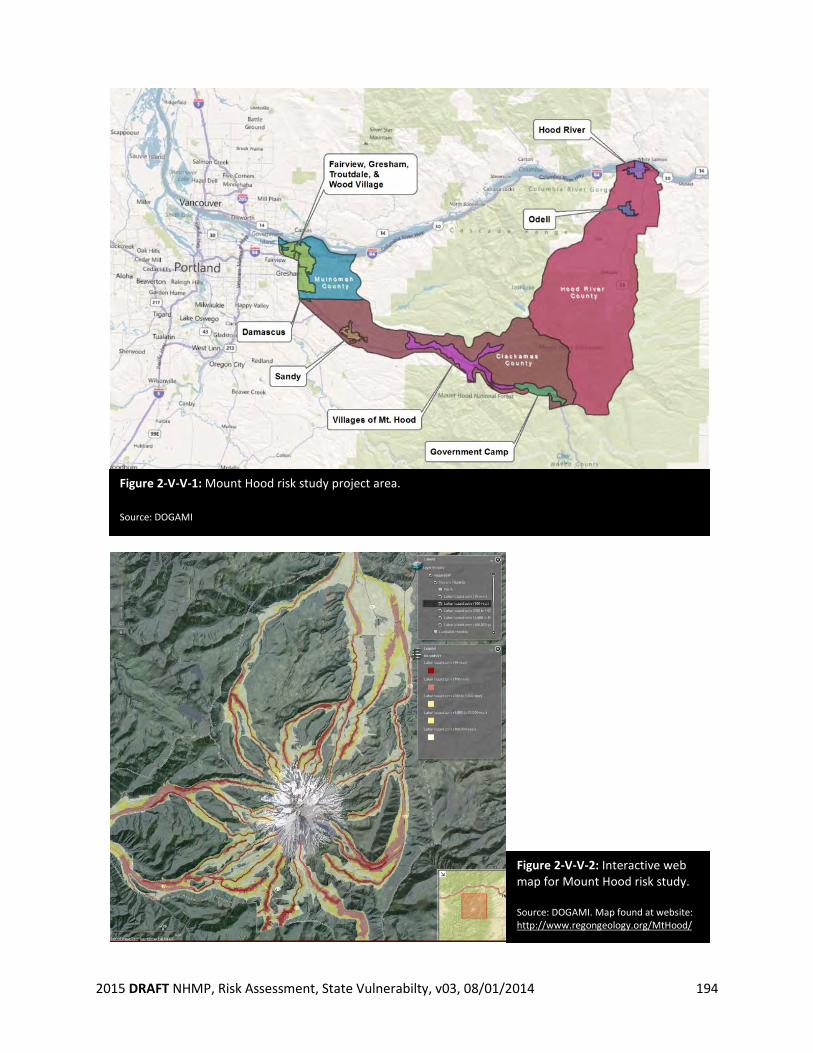
2015 DRAFT NHMP, Risk Assessment, State Vulnerabilty, v03, 08/01/2014 194
Figure 2-V-V-1: Mount Hood risk study project area.
Source: DOGAMI
Figure 2-V-V-2: Interactive web map for Mount Hood risk study. Source: DOGAMI. Map found at website: http://www.regongeology.org/MtHood/
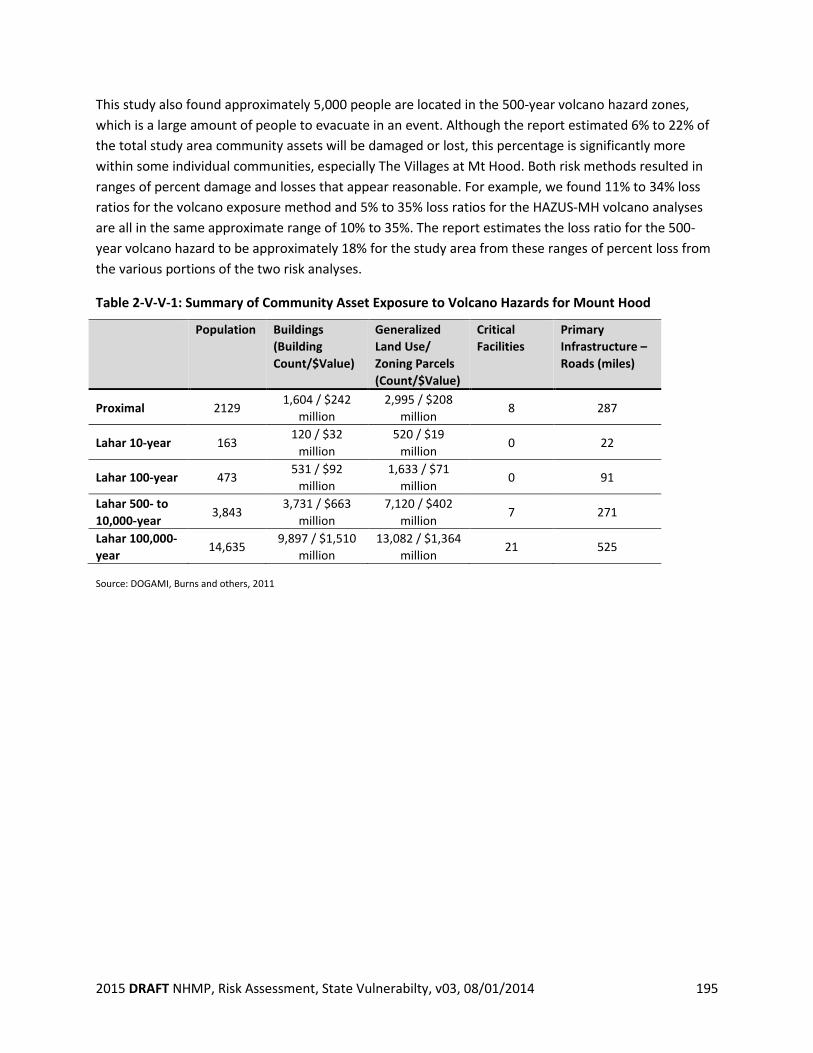
2015 DRAFT NHMP, Risk Assessment, State Vulnerabilty, v03, 08/01/2014 195
This study also found approximately 5,000 people are located in the 500-year volcano hazard zones, which is a large amount of people to evacuate in an event. Although the report estimated 6% to 22% of the total study area community assets will be damaged or lost, this percentage is significantly more within some individual communities, especially The Villages at Mt Hood. Both risk methods resulted in ranges of percent damage and losses that appear reasonable. For example, we found 11% to 34% loss ratios for the volcano exposure method and 5% to 35% loss ratios for the HAZUS-MH volcano analyses are all in the same approximate range of 10% to 35%. The report estimates the loss ratio for the 500-year volcano hazard to be approximately 18% for the study area from these ranges of percent loss from the various portions of the two risk analyses.
Table 2-V-V-1: Summary of Community Asset Exposure to Volcano Hazards for Mount Hood
Population Buildings (Building Count/$Value)
Generalized Land Use/ Zoning Parcels (Count/$Value)
Critical Facilities
Primary Infrastructure – Roads (miles)
Proximal 2129 1,604 / $242
million 2,995 / $208
million 8 287
Lahar 10-year 163 120 / $32
million 520 / $19
million 0 22
Lahar 100-year 473 531 / $92
million 1,633 / $71
million 0 91
Lahar 500- to 10,000-year
3,843 3,731 / $663
million 7,120 / $402
million 7 271
Lahar 100,000-year
14,635 9,897 / $1,510
million 13,082 / $1,364
million 21 525
Source: DOGAMI, Burns and others, 2011
2015 DRAFT NHMP, Risk Assessment, State Vulnerabilty, v03, 08/01/2014 196
Wildfire Wildfires are a common and widespread natural hazard in Oregon. Fire is a critical component of the forest and rangeland ecosystems found in all portions of the state. Over 41 million acres of forest and rangeland in Oregon are susceptible to wildfire, which may occur during any month of the year, but usually occur between July and October. In addition to wildland-urban interface(WUI) fires, Oregon experiences wildland fires that do not threaten structures, and also occasionally has prescribed fires. The principal type of wildfire affecting Oregon communities is the interface fire, which occurs where wildland and developed areas intermingle with both vegetation and structures combining to provide fuel. As more people have moved into WUI areas, the number of large wildfires impacting homes has escalated dramatically.
Most Vulnerable Communities
In 2006, the Oregon Department of Forestry conducted a Statewide Forest Assessment of the communities at risk to wildfire to determine priorities for delivering landowner assistance. The parameters of this assessment included high priority fish and wildlife habitat, potential for forest conversion, and communities at risk to wildfire. The communities at risk to wildfire component will be used to characterize the wildfire hazard in this Plan. A community was defined as a geographic area within and surrounding permanent dwellings with basic infrastructure and services, under a common fire protection jurisdiction, government, or tribal trust or allotment, for which there is a significant threat due to wildfire. The 2006 communities at risk assessment first evaluated landscape wildfire risk based on ignition risk, fuel loading and hazard, suppression capability, and values at risk (population, municipal watersheds, commercial timber); and then evaluated community risk as a function of the surrounding landscape risk ratings. Of the 595 identified community areas in Oregon, 159 (27%) face a HIGH risk from wildfire and 331 (56%) faced a moderate threat. Although the majority of OEM Hazard Mitigation Regions in Oregon have at least one high risk community, the majority are concentrated in Regions 4 and 6. In Region 4, Douglas County had the highest absolute number of high risk communities with 33, and Jackson County had the highest percent of communities facing high risk (all 22 identified communities). In Region 6, Deschutes County recorded the second highest percentage with 10 out of 12 identified communities facing high risk of wildfire. An update to the 2006 statewide wildfire assessment is currently underway. The update is a part of a regional wildfire assessment referred to as the West Wide Risk Assessment (WWRA) to assess wildfire risk in 17 western states. The WWRA uses indices (Fire Risk, Fire Threat, Fire Effects) as well as Ratings (Values Impacted, Suppression Difficulty) to generate a composite assessment of wildfire vulnerability and risk. Although the WWRA is complete, Oregon is in the process of scaling the assessment to the state level, so the complete data set for Oregon is not available at this time. A complete wildfire hazard and vulnerability analysis using the WWRA will be available for the next Oregon NHMP update.
2015 DRAFT NHMP, Risk Assessment, State Vulnerabilty, v03, 08/01/2014 197
Preliminary maps from the WWRA were used in the critical and essential infrastructure analysis. In addition, preliminary hazard and exposure summary statistics from the WWRA for the state of Oregon are as follows:
22% of burnable acres in the state have a Moderate-to-High wildfire risk 56 million burnable acres across the state (90% of all lands) 751,672 people are living at risk to wildfire within Wildland Development Areas 27.6 million acres of forest assets are at risk to wildfire
With respect to structures and population density, communities that were evaluated for wildfire risk were either rural (consisting of 1 to 3.9 dwellings per 40 acres and a population density of 28 to 111 people per square mile), suburban (consisting of 4 to 19.9 dwellings per 40 acres and a population density of 112 to 559 people per square mile) or urban (consisting of 20 to 99 dwellings per 40 acres and 560 to 1,371 people per square mile). Highly urbanized areas (100 or more dwellings per square mile and 1,372 or more people per square mile) were excluded. Factors that contributed to a community being rated as at high risk from wildfire were as follows:
Ignition Risk – A high risk rating was given when fire occurrence exceeded 1 fire per 1,000 acres over 10 years. Fuel Loading and Hazard – A high risk rating was based on a composite rating based on the following (percents indicate weight each factor is given to the composite rating):
Weather (25%) – The weather risk rating is based on the number of days per season that forest fuels were capable of producing a significant wildfire event as determined by an analysis of daily fire danger rating indices for regulated use areas across Oregon. All of eastern Oregon and interior southwest Oregon are high weather risk. Slope, Aspect and Elevation (12%) – Slopes greater than 40 percent with south facing aspects at elevations at or below 3,500 feet all contribute to high risk. Fuels (30%) – Forest fuels that result in fire behaviors of flame lengths exceeding 8 feet; frequent spotting, torching, or crowning such that fire severity is stand replacing. Example fuel conditions include flammable grasses, heavy/flammable brush, and mature timber with slash. Insect and Disease Damage (20%) – A high risk rating was given for forested areas exhibiting at least 3 dead trees per acre from insect and disease; or at least 3 consecutive years of defoliation from the spruce budworm, as determined by the statewide aerial insect and disease survey. Fire Regime Condition Class (13%) – Fire regime condition class is a measure of forest conditions that are outside the range of natural variability in fuel conditions as result from increased tree stocking and fuel build-up resulting from fire suppression. Lodgepole pine forests are the exception as they can exhibit a high Fire Regime Condition Class rating even though the conditions are within their range of natural variability. Forests with the high risk Fire Regime Condition Class rating exhibit
2015 DRAFT NHMP, Risk Assessment, State Vulnerabilty, v03, 08/01/2014 198
excessive surface fuels, brush, live and dead mid-canopy or ladder fuels as well as canopy fuels in standing dead and overstocked mature trees. Wildfire under these forest conditions are likely to develop in severe crown fires.
Suppression Capability – Areas at high risk have no organized fire suppression response capability. Areas at moderate risk have wildland forest suppression response, but structural response within 10 minutes is limited. Values at Risk – High values at risk were defined by population and dwelling densities (urban and highly urbanized), forests containing municipal watersheds and forests managed for wood production.
In summary, the perfect storm for a community at the highest risk of wildfire would be an urban community within interior southwestern or eastern Oregon surrounded by forests of low elevation on south facing slopes exceeding 40 percent in slope; containing high amounts of surface and ladder fuels arising from insect and disease mortality as well as the exclusion of fire due to fire suppression efforts; with little or no organized wildfire suppression capability. On average, 96% of the fires are suppressed at 10 acres or less. Unfortunately, the remaining 4% of the fires tend to be damaging and very difficult to suppress.
2015 DRAFT NHMP, Risk Assessment, State Vulnerabilty, v03, 08/01/2014 199
Windstorm The damaging effects of windstorms may extend for distances of 100 to 300 miles from the center of storm activity. Isolated wind phenomena in the mountainous regions have more localized effects. Near-surface winds and associated pressure effects exert loads on walls, doors, windows, and roofs, sometimes causing considerable damage. When severe windstorms strike a community, downed trees, power lines, and damaged property are major hindrances to response and recovery. Most Vulnerable Communities The Oregon Coast has several relatively harsh storms during the winter months. Although major damage from these storms is infrequent, the Oregon Coast Region of the state is the most vulnerable to windstorms. The seven coastal counties in the Oregon Coast Region often face 60 to 100 mile an hour winds sometime during the year. While the coast is experiencing severe winds, the Willamette Valley may also face 40 to 60 mile per hour winds from the same storm. Also, the Columbia River Gorge funnels very strong winds, often from east to west. The Northern Willamette Valley/Portland Metro and Mid-Columbia Regions are most vulnerable to this type of wind event. Major windstorms that can impact large areas of the state, like the Columbus Day windstorm of 1962, are relatively rare. These storms can cause major damage to many areas of the state with the Oregon coastal counties typically suffering the most damage from this type of hazardous event. The PUC is the entity with primary oversight over the windstorm hazard. PUC lists Benton, Clatsop, Coos, Columbia, Curry, Douglas, Gilliam, Hood River, Lane, Lincoln, Linn, Marion, Morrow, Multnomah, Polk, Sherman, Tillamook, and Washington as the most vulnerable to damage and loss associated with windstorms. The Oregon Climate Service (OCS) and Oregon Climate Change Research Institute (OCCRI) provides weather and climate support. The identification of communities most vulnerable to windstorms is based on PUC agency staff and OCCRI/OCS staff review.
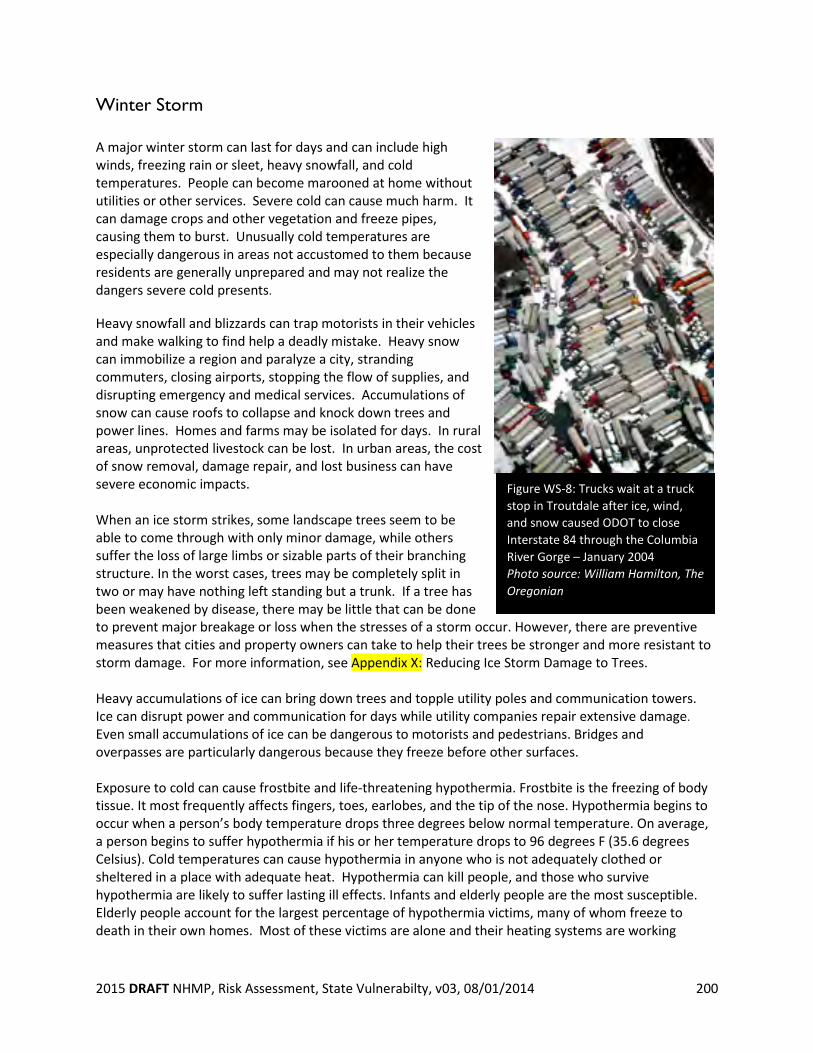
2015 DRAFT NHMP, Risk Assessment, State Vulnerabilty, v03, 08/01/2014 200
Winter Storm A major winter storm can last for days and can include high winds, freezing rain or sleet, heavy snowfall, and cold temperatures. People can become marooned at home without utilities or other services. Severe cold can cause much harm. It can damage crops and other vegetation and freeze pipes, causing them to burst. Unusually cold temperatures are especially dangerous in areas not accustomed to them because residents are generally unprepared and may not realize the dangers severe cold presents. Heavy snowfall and blizzards can trap motorists in their vehicles and make walking to find help a deadly mistake. Heavy snow can immobilize a region and paralyze a city, stranding commuters, closing airports, stopping the flow of supplies, and disrupting emergency and medical services. Accumulations of snow can cause roofs to collapse and knock down trees and power lines. Homes and farms may be isolated for days. In rural areas, unprotected livestock can be lost. In urban areas, the cost of snow removal, damage repair, and lost business can have severe economic impacts. When an ice storm strikes, some landscape trees seem to be able to come through with only minor damage, while others suffer the loss of large limbs or sizable parts of their branching structure. In the worst cases, trees may be completely split in two or may have nothing left standing but a trunk. If a tree has been weakened by disease, there may be little that can be done to prevent major breakage or loss when the stresses of a storm occur. However, there are preventive measures that cities and property owners can take to help their trees be stronger and more resistant to storm damage. For more information, see Appendix X: Reducing Ice Storm Damage to Trees. Heavy accumulations of ice can bring down trees and topple utility poles and communication towers. Ice can disrupt power and communication for days while utility companies repair extensive damage. Even small accumulations of ice can be dangerous to motorists and pedestrians. Bridges and overpasses are particularly dangerous because they freeze before other surfaces. Exposure to cold can cause frostbite and life-threatening hypothermia. Frostbite is the freezing of body tissue. It most frequently affects fingers, toes, earlobes, and the tip of the nose. Hypothermia begins to occur when a person’s body temperature drops three degrees below normal temperature. On average, a person begins to suffer hypothermia if his or her temperature drops to 96 degrees F (35.6 degrees Celsius). Cold temperatures can cause hypothermia in anyone who is not adequately clothed or sheltered in a place with adequate heat. Hypothermia can kill people, and those who survive hypothermia are likely to suffer lasting ill effects. Infants and elderly people are the most susceptible. Elderly people account for the largest percentage of hypothermia victims, many of whom freeze to death in their own homes. Most of these victims are alone and their heating systems are working
Figure WS-8: Trucks wait at a truck stop in Troutdale after ice, wind, and snow caused ODOT to close Interstate 84 through the Columbia River Gorge – January 2004 Photo source: William Hamilton, The Oregonian
2015 DRAFT NHMP, Risk Assessment, State Vulnerabilty, v03, 08/01/2014 201
improperly or not at all. People who take certain medications, who have certain medical conditions, or who have been drinking alcohol also are at increased risk for hypothermia. Driving can be tricky in the snow, but once a storm has passed, there is another danger: flying snow from trucks and cars. When snow is warmed by the vehicle, it will begin to melt. Wind and motion cause sections to break off and hit other vehicles. The snow can also fall on the road, melt, and later turn into ice. Winter storms are considered deceptive killers because most winter storm deaths are related only indirectly to the storms. Overall, most winter storm deaths result from vehicle or other transportation accidents caused by ice and snow. Exhaustion and heart attacks brought on by overexertion are two other common causes of deaths related to winter storms. Tasks such as shoveling snow, pushing a vehicle, or even walking in heavy snow can cause a heart attack, particularly in people who are older or who are not used to high levels of physical activity. Home fires occur more frequently in the winter because people do not take the proper safety precautions when using alternative heat sources. Fires during winter storms present a great danger because water supplies may freeze and it may be difficult for firefighting equipment to get to the fire. In addition, people can be killed by carbon monoxide emitted by fuels such as charcoal briquettes improperly used to heat homes.8 One issue concerns the fact that there is not a statewide effort regarding Winter Storm impacts, either historical or for future planning. There are only limited snow fall sensors distributed mainly through the mountain ranges of the state and there is not an annual tracking system in place for snow fall statewide. A program of statewide snow fall sensors would allow us to better understand the impact of Winter Storms on Oregon and have a better means of predicting potential impacts in the future.
Most Vulnerable Communities
The Oregon Department of Transportation (ODOT) is the agency with primary oversight of the Winter Storm hazard. Based on agency staff review of the available hazard data, ODOT lists the Northern Willamette Valley (Linn, Benton, Marion, Polk and Yamhill Counties); the Portland Metro Region (Columbia, Washington, Multnomah and Clackamas Counties); and the Mid/Southern Willamette Region (Lane, Douglas, Josephine and Jackson Counties) as the most vulnerable to damage and loss associated with winter storms because Oregon’s most densely populated cities are located within these regions. The Portland metropolitan area is the most vulnerable not only because it is the most densely populated but also because of its proximity to the Columbia River Gorge. It is not uncommon to have severe ice and sleet storms occurring as cold artic winds blow down the Gorge over east Multnomah County and Portland. These storms have delayed air traffic and even closed the Portland International Airport in the past, thus negatively affecting Oregon’s economy. Winter storms often bring ice and sleet that makes driving extremely dangerous. Ice and sleet storms can cripple the movement of goods and services, thus negatively impacting Oregon’s economy.
8 From Talking About Disaster: Guide for Standard Messages, produced by the National Disaster Education Coalition, Washington, D.C., 2004
2015 DRAFT NHMP, Risk Assessment, State Vulnerabilty, v03, 08/01/2014 202
National Weather Service Winter Storm reports were used as the basis for determining community vulnerabilities. Unfortunately there is only the NWS storm information available for analysis. There is no statewide Winter Storm program to study the impacts of these storms statewide. There is no program to identify annual average snow falls across the state either historical or for planning purposes. Hydrological precipitation information is available but not winter storm and snow fall information.
2015 DRAFT NHMP, Risk Assessment, State Vulnerabilty, v03, 08/01/2014 203
Local and State Vulnerability Assessment Comparison
Past iterations of the Oregon NHMP stated local and state vulnerability “rankings” separately. No comparison or analysis of similarities and differences among the methods was conducted. For this update, the state placed local and state vulnerability “rankings” side-by-side to identify if and where similarities and differences occur. Following is a summary of basic similarities and differences in these methods as well as in the vulnerability “rankings”. While local risk assessments are standardized and state risk assessments vary from hazard to hazard, there are similarities among these methods. First, in all of these assessments historical events are identified and are the basis upon which probability of future hazard events occurring is determined. Second, based on best available data, vulnerability to each hazard is identified at the local or state scale respectively. On the other hand, how local and state assessments identify vulnerability varies greatly from local to state, as well as across all hazards at the state level. As described on pg XX, local assessments use the OEM Hazard Analysis Methodology that ranks vulnerability to each hazard based on the estimated the percentage of population and property likely to be affected. The “ranking” of vulnerability is based on local knowledge, and is therefore somewhat subjective. This methodology identifies which hazards are priorities at the local level. As described in the preceding section of this Plan, for the state assessment, each hazard lead assesses vulnerability based on best available data. For some hazards− such as flood, earthquake and tsunami − a significant amount of data is available and supports detailed damage and loss estimates. Projected damages and losses help the state identify which communities are most vulnerable to each hazard. Hazards for which there is limited data available undergo a less rigorous assessment, and identifying which communities are most vulnerable may be more challenging. Each hazard lead is an expert on that particular hazard. Hazard lead knowledge with some combination of research, literature and agency knowledge form the factual basis for each state hazard risk assessment accompanied by some level of subjectivity. While local and state risk assessment methods are inherently different, there is added value in comparing findings from both. All methods identify hazard priorities. Local assessments identify the hazards to which each community believes they are most vulnerable. State hazard leads identify which communities are most vulnerable to each hazard compared to other communities. These assessment rankings are intended to guide local and state mitigation goals and actions which inform mitigation priorities for local and state NHMPs. Table 2-V-3 shows a side-by-side comparison of local and state vulnerability rankings. Symbols in this table are defined as:
Local State H= High Vulnerability MV= Most Vulnerable Community (as identified by all hazard leads) M= Moderate Vulnerability V= Vulnerable Community (as identified by some hazard leads) L= Low Vulnerability
This side-by-side comparison indicates similarities and differences between local and state vulnerability rankings. For some counties, local and state assessments agree there is a high level of vulnerability to a
2015 DRAFT NHMP, Risk Assessment, State Vulnerabilty, v03, 08/01/2014 204
hazard, as indicated by both an “H” (high vulnerability) and a “MV” (Most Vulnerable) rankings by local and state assessments respectively. In other instances, local and state rankings are not in sync. For example, a county that did not score itself for a hazard (indicating it is not at risk to that hazard), or scored itself “L” (as having low vulnerability) to a hazard; and the state ranked that county as one of the “MV” (most vulnerable) counties to that hazard. Time did not permit for an analysis of this table to be conducted during this Plan update cycle. For the purposes of this update, a side-by-side comparison is the extent to which the state is able to address these inconsistencies. However, the state is in the process of exploring what these findings mean and how Oregon can better align local and state risk assessments to identify its most vulnerable communities. In April 3014, The Department of Land Conservation and Development (DLCD) presented a version of this table at the Oregon Prepared Conference to emergency managers and others involved with LNHMP updates. This presentation initiated a local-state discussion about risk assessments in Oregon; how to enhance the Plan update process at the local level; and how state hazard experts can better inform local jurisdictions on statewide hazard data. This table will also be presented to the State Interagency Hazard Mitigation Team (IHMT) for feedback on how to best initiate a two-way information sharing dialogue between local and state entities that perform risk assessment updates for NHMPs. Between the 2015 and the next Oregon NHMP update the state will facilitate these discussions. The state is also identifying ways to incorporate this discussion into statewide conferences and trainings.
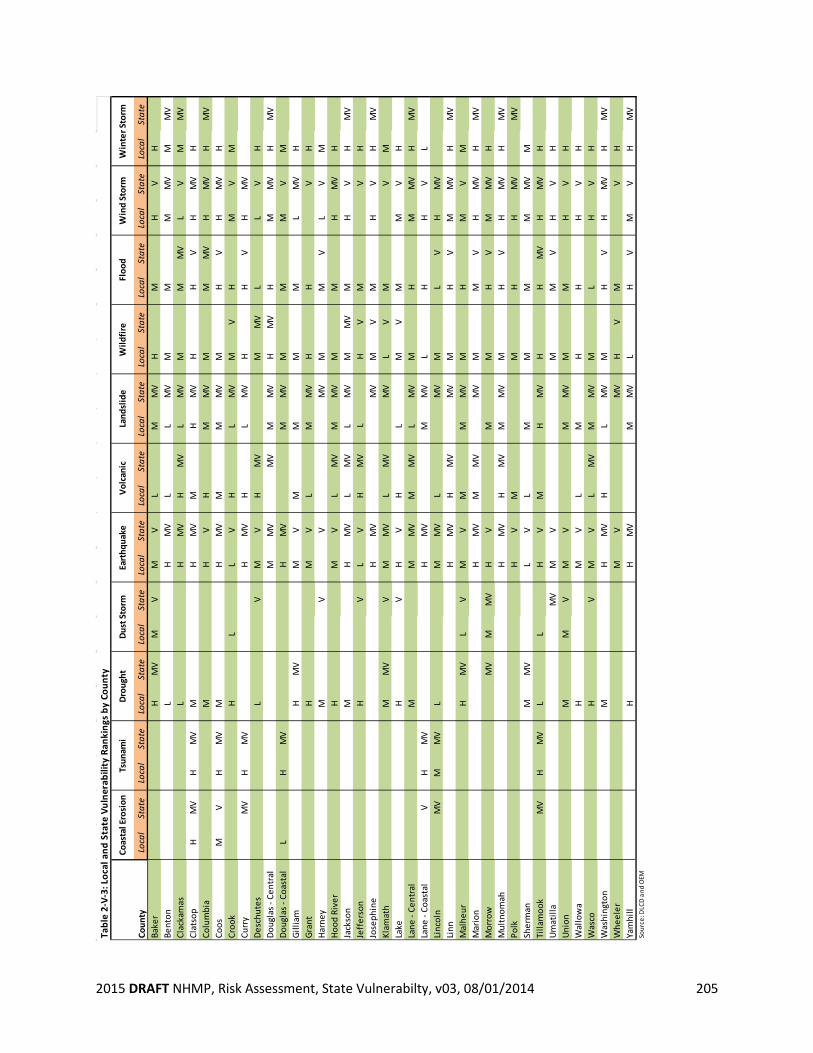
2015 DRAFT NHMP, Risk Assessment, State Vulnerabilty, v03, 08/01/2014 205
Loca
lSt
ate
Loca
lSt
ate
Loca
lSt
ate
Loca
lSt
ate
Loca
lSt
ate
Loca
lSt
ate
Loca
lSt
ate
Loca
lSt
ate
Loca
lSt
ate
Loca
lSt
ate
Loca
lSt
ate
Bake
rH
MV
MV
MV
LM
MV
HM
HV
HBe
nton
LH
MV
LL
MV
MM
MM
VM
MV
Clac
kam
asL
HM
VH
MV
LM
VM
MM
VL
VM
MV
Clat
sop
H M
VH
MV
MH
MV
MH
MV
HH
VH
MV
HCo
lum
bia
MH
VH
MM
VM
MM
VH
MV
HM
VCo
osM
V
H M
VM
HM
VM
MM
VM
HV
HM
VH
Croo
kH
LL
VH
LM
VM
VH
MV
MCu
rry
MV
H M
VH
MV
HL
MV
HH
VH
MV
Desc
hute
sL
VM
VH
MV
MM
VL
LV
HDo
ugla
s - C
entr
alM
MV
MV
MM
VH
MV
HM
MV
HM
VDo
ugla
s - C
oast
alL
H M
VH
MV
MM
VM
MM
VM
Gilli
amH
MV
MV
MM
MM
LM
VH
Gran
tH
MV
LM
MV
HH
VH
Harn
eyM
VV
MV
MM
VL
VM
Hood
Riv
erH
MV
LM
VM
MV
MM
HM
VH
Jack
son
MH
MV
LM
VL
MV
MM
VM
HV
HM
VJe
ffer
son
HV
LV
HM
VL
HV
MV
HJo
seph
ine
HM
VM
VM
VM
HV
HM
VKl
amat
hM
MV
VM
MV
LM
VM
VL
VM
VM
Lake
HV
HV
HL
MV
MM
VH
Lane
- Ce
ntra
lM
MM
VM
MV
LM
VM
HM
MV
HM
VLa
ne -
Coas
tal
VH
MV
HM
VM
MV
LH
HV
LLi
ncol
nM
VM
M
VL
MM
VL
MV
ML
VH
MV
Linn
HM
VH
MV
MV
MH
VM
MV
HM
VM
alhe
urH
MV
LV
MV
MM
MV
MH
MV
MM
ario
nH
MV
MM
VM
VM
MV
HM
VH
MV
Mor
row
MV
MM
VH
VM
MH
VM
MV
HM
ultn
omah
H
MV
HM
VM
MV
MH
VH
MV
HM
VPo
lkH
VM
MH
HM
VM
VSh
erm
anM
MV
LV
LM
MM
MM
VM
Tilla
moo
kM
VH
MV
LL
HV
MH
MV
HH
MV
HM
VH
Umat
illa
MV
MV
MM
VH
VH
Unio
nM
MV
MV
MM
VM
MH
VH
Wal
low
aH
MV
LM
HH
HV
HW
asco
HV
MV
LM
VM
MV
ML
HV
HW
ashi
ngto
nM
HM
VH
LM
VM
HV
HM
VH
MV
Whe
eler
MV
MV
HV
MV
HYa
mhi
llH
HM
VM
MV
LH
VM
VH
MV
Volc
anic
Land
slid
eW
ildfir
eFl
ood
Sour
ce: D
LCD
and
OEM
Tabl
e 2-
V-3:
Loc
al a
nd S
tate
Vul
nera
bilit
y Ra
nkin
gs b
y Co
unty
Drou
ght
Coun
ty
Coas
tal E
rosi
onTs
unam
iW
ind
Stor
mW
inte
r Sto
rmDu
st S
torm
Eart
hqua
ke
2015 DRAFT NHMP, Risk Assessment, State Vulnerabilty, v03, 08/01/2014 206
State-Owned and Leased Facilities and Critical and Essential Facilities Exposure Assessment
According to the Oregon Department of Administrative Services (DAS), the State of Oregon owns or leases buildings having a total value of over $7.3 billion. Because of this investment it is important the State assess the vulnerability of these structures to Oregon’s natural hazards, including landslides, floods, volcanic hazards, tsunamis, earthquakes, wildfires, and coastal erosion. The Oregon Department of Geology and Mineral Industries (DOGAMI) assembled the best-available statewide natural hazard data and assessed which state-owned/leased buildings are exposed to each hazard. Data to support this level of analysis was available for the follow hazards: coastal erosion, earthquake, flood, landslide, tsunami, volcano, and wildfire. Most building data were carried forward from the 2012 Oregon NHMP assessment of state-owned/leased buildings. For the 2015 assessment, this building data (originally digitized by DOGAMI from DAS-supplied spreadsheets) was updated with DAS deletions and additions current as of 2013. Because of imprecise, incomplete, or ambiguous addresses, 205 lower-value entries in the “additions” spreadsheets were not digitized in this study. This amounts to nearly $28 million worth of property, though only about $17 million is within Oregon state boundaries; at least $11 million of that total is located in Utah, Texas, or Washington and therefore outside the bounds of this analysis. Notably, the DAS building data does not identify “critical and essential” facilities. So, DOGAMI identified indicative descriptors found within building names and usage descriptions (e.g. armory, haz-mat storage, hospital, communication tower, etc.) and identified those facilities critical/essential . It is also important to note this assessment is based on limited data. The DAS buildings list is of variable quality and completeness. Facilities for which there were missing or incomplete address/location information, uncertain matches to older building data, missing or vague names, or locations outside of the State of Oregon were not used in this update. The DAS database lists 5,693 state facilities owned or leased by 122 state agencies. DOGAMI used the DAS list to locate facilities using Geographic Information Systems (GIS). Figure FAC-V-1 shows the distribution of these 5,693 state-owned/leased facilities within Oregon Emergency Management (OEM) Natural Hazard Mitigation Regions. Critical and essential facilities not owned or leased by the state are in each map developed for this analysis. These facilities were carried forward from an earlier DOGAMI project to locate critical and essential facilities such as military facilities, schools, communication towers, police and fire stations,
Requirement: 44 CFR §201.4(c)(2)(ii): Th[e] risk assessment shall include… (ii) (s)tate owned or operated critical facilities located in the identified hazard areas shall also be addressed.
Requirement: 44 CFR §201.4(c)(2)(iii): Th[e] risk assessment shall include… (iii) (a)n overview and analysis of potential losses to the identified vulnerable structures, based on estimates provided in local risk assessments as well as the State risk assessment. The State shall estimate the potential dollar losses to State owned or operated buildings, infrastructure, and critical facilities located in the identified hazard areas.
2015 DRAFT NHMP, Risk Assessment, State Vulnerabilty, v03, 08/01/2014 207
hospitals, etc. These facilities were located and digitized by DOGAMI. Critical and/or essential facilities were defined using criteria developed by FEMA and the International Building Council. Facilities were located and digitized from a variety of sources including FEMA, the US Department of Transportation, DAS, the Oregon Office of Emergency Management, the Oregon Department of Transportation, and others. However, since no property values are included in this data, and they are not owned or leased by the state, they are not included in property value.
Hazard Data Limitations
This assessment evaluates each hazard individually; there are no comprehensive or multi-hazard assessments. In order to prioritize facilities most vulnerable facilities to natural hazards, DOGAMI categorized most hazards with simple classification schemes (most commonly “High”, “Moderate”, “Low”, or “Other”). For each hazard “Other” is used to describe very low hazard areas, unmapped and/or unstudied areas, or zero hazard zones (this is further defined in each of the hazard descriptions below). Statewide natural hazard data are generalized in several ways and provide a gross view of their distribution and magnitude across the state. They are often combined or derived from other data sources that themselves can have widely different quality, accuracy, attribution, or currency. Future investigations or actual hazard events may substantially modify our understanding of where and when natural hazards might occur. Last, it is worth noting that building-specific information can make an enormous difference when evaluating the actual damaging effects of natural hazards. For example, a modern seismically-reinforced building may receive far less or no earthquake damage relative to older un-reinforced buildings next door. This study evaluates which facilities are exposed to certain natural hazards and, due to data and time limitations, makes no attempt to account for site-specific characteristics.
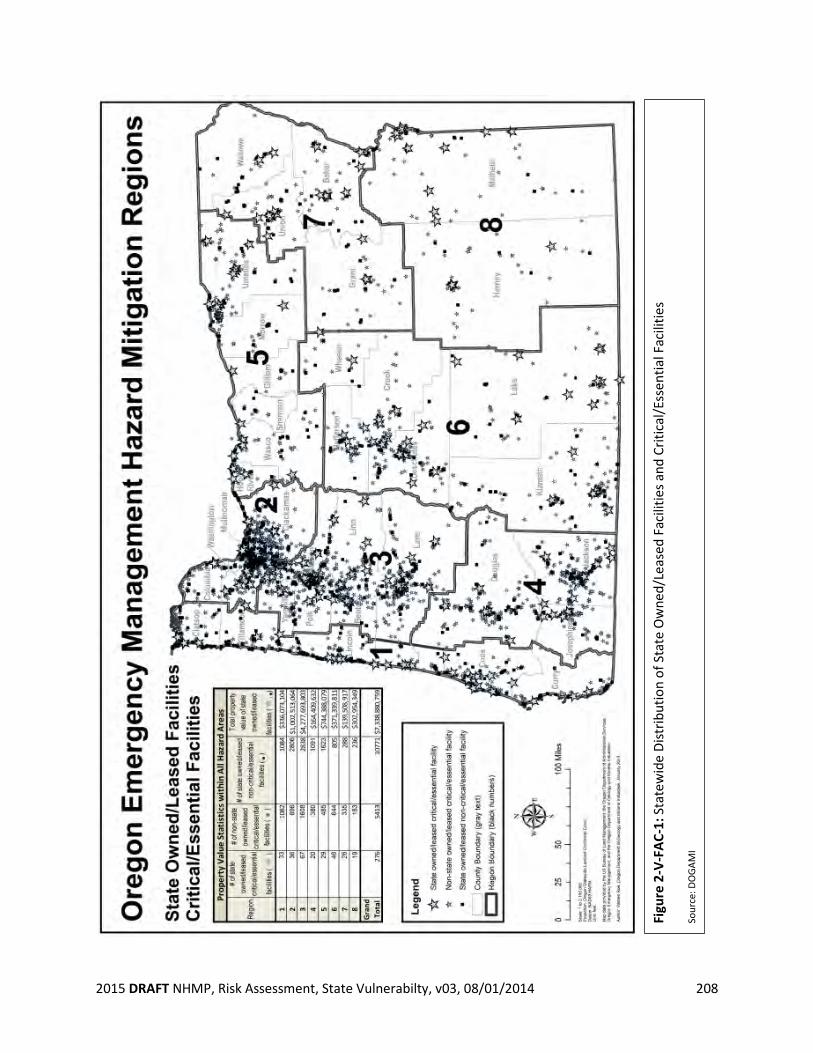
2015 DRAFT NHMP, Risk Assessment, State Vulnerabilty, v03, 08/01/2014 208
Figu
re 2
-V-F
AC-1
: Sta
tew
ide
Dist
ribut
ion
of S
tate
Ow
ned/
Leas
ed F
acili
ties a
nd C
ritic
al/E
ssen
tial F
acili
ties
Sour
ce: D
OGA
MI
2015 DRAFT NHMP, Risk Assessment, State Vulnerabilty, v03, 08/01/2014 209
State Owned/Leased Facilities and Critical/Essential Facilities Within Hazard Areas The spatial distribution of the facilities in this analysis is not easily viewed on a statewide map. Therefore, maps depicting hazard zones and facilities within those zones have only been created at the regional scale. Those maps can be found later in this Plan, in the Regional Risk Assessment, beginning on page XX. Coastal Erosion DOGAMI used the results from several of their coastal erosion studies to develop a coastal erosion hazard zone for this analysis. However, this data does not cover the entire Oregon coastline: coastal erosion hazard zones have not been created for Lane, Douglas, and Coos Counties, and only partial data coverage exists for Curry County. To address these data gaps, DOGAMI excluded those portions of the coast from the analysis, using a 0.5km buffer of the coastline to delineate an “other” value. In areas where mapping exists, the hazard is mapped as Active, High, Moderate, or Low Hazard Zones which, for the purposes of this analysis, were simplified to “High” (encompassing Active and High), “Moderate”, and “Other” (encompassing Low hazards and unmapped areas). The Low hazard zones incorporate hypothetical landslide block failures assumed to fail in the event of a M9 Cascadia earthquake and were placed under “Other” due to their very low probability. All other areas of the state received a None attribute. Coastal Erosion Hazard Facility Summary Of the 5,693 facilities evaluated, 33 are currently located within a coastal erosion zone representing a value of approximately $7 million. Table 2-V-FAC-1 shows all 33 state owned facilities located within a coastal erosion hazard zone. One of the 33 (ODOT Cape Perpetua Radio building) is identified as a critical or essential facility. Coastal Erosion Data Limitations 1. Erosion rates used to estimate widths of hazard zones are based on interpretation of a relatively short historical series of aerial photography (1939 to present) and very limited lidar data acquired before 2008. Photos were georeferenced but not necessarily orthorectified and spatial locations may have considerable error. 2. Coastal erosion hazard zones have not been created for Lane, Douglas, and Coos Counties, and only partial data coverage exists for Curry County. Therefore, state owned facilities along the coastline in these areas are not accounted for in this study. Recommended Data Improvements As previously stated, the coastal erosion hazard dataset used the best available data from detailed studies conducted by DOGAMI. However, this data does not cover the entire coastline and outside of very small, specific areas, the overall coastal erosion hazard in Lane, Douglas, Coos and Curry counties is undetermined. Therefore, DOGAMI recommends conducting detailed coastal erosion studies on a case-by-case basis within these counties. This recommendation should be included as a specific action item in this Plan.
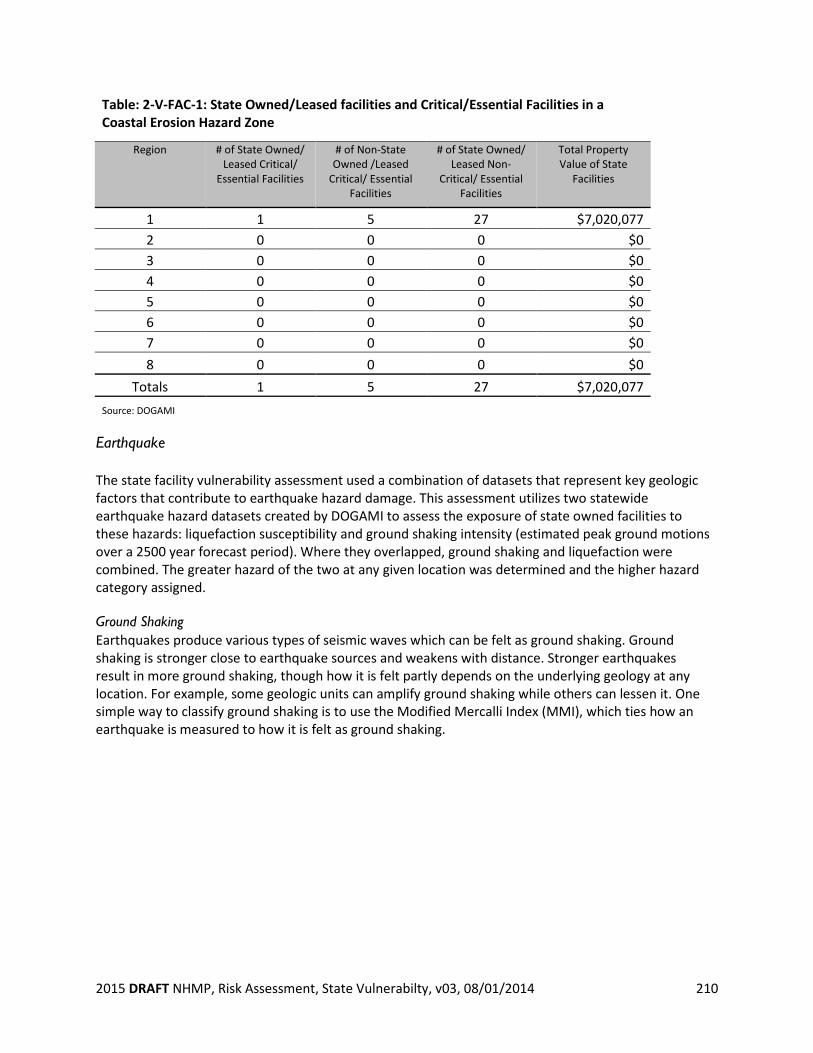
2015 DRAFT NHMP, Risk Assessment, State Vulnerabilty, v03, 08/01/2014 210
Table: 2-V-FAC-1: State Owned/Leased facilities and Critical/Essential Facilities in a Coastal Erosion Hazard Zone
Region # of State Owned/ Leased Critical/
Essential Facilities
# of Non-State Owned /Leased
Critical/ Essential Facilities
# of State Owned/ Leased Non-
Critical/ Essential Facilities
Total Property Value of State
Facilities
1 1 5 27 $7,020,077 2 0 0 0 $0 3 0 0 0 $0 4 0 0 0 $0 5 0 0 0 $0 6 0 0 0 $0 7 0 0 0 $0 8 0 0 0 $0
Totals 1 5 27 $7,020,077 Source: DOGAMI
Earthquake The state facility vulnerability assessment used a combination of datasets that represent key geologic factors that contribute to earthquake hazard damage. This assessment utilizes two statewide earthquake hazard datasets created by DOGAMI to assess the exposure of state owned facilities to these hazards: liquefaction susceptibility and ground shaking intensity (estimated peak ground motions over a 2500 year forecast period). Where they overlapped, ground shaking and liquefaction were combined. The greater hazard of the two at any given location was determined and the higher hazard category assigned. Ground Shaking Earthquakes produce various types of seismic waves which can be felt as ground shaking. Ground shaking is stronger close to earthquake sources and weakens with distance. Stronger earthquakes result in more ground shaking, though how it is felt partly depends on the underlying geology at any location. For example, some geologic units can amplify ground shaking while others can lessen it. One simple way to classify ground shaking is to use the Modified Mercalli Index (MMI), which ties how an earthquake is measured to how it is felt as ground shaking.
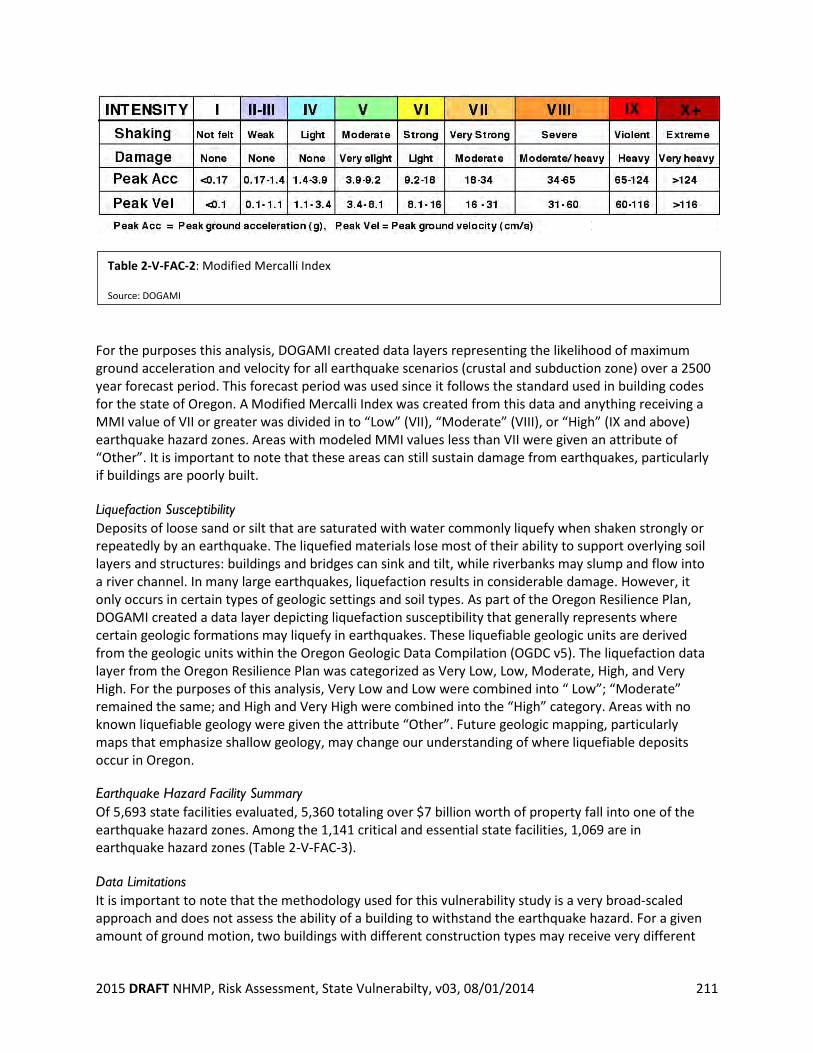
2015 DRAFT NHMP, Risk Assessment, State Vulnerabilty, v03, 08/01/2014 211
Table 2-V-FAC-2: Modified Mercalli Index
Source: DOGAMI
For the purposes this analysis, DOGAMI created data layers representing the likelihood of maximum ground acceleration and velocity for all earthquake scenarios (crustal and subduction zone) over a 2500 year forecast period. This forecast period was used since it follows the standard used in building codes for the state of Oregon. A Modified Mercalli Index was created from this data and anything receiving a MMI value of VII or greater was divided in to “Low” (VII), “Moderate” (VIII), or “High” (IX and above) earthquake hazard zones. Areas with modeled MMI values less than VII were given an attribute of “Other”. It is important to note that these areas can still sustain damage from earthquakes, particularly if buildings are poorly built. Liquefaction Susceptibility Deposits of loose sand or silt that are saturated with water commonly liquefy when shaken strongly or repeatedly by an earthquake. The liquefied materials lose most of their ability to support overlying soil layers and structures: buildings and bridges can sink and tilt, while riverbanks may slump and flow into a river channel. In many large earthquakes, liquefaction results in considerable damage. However, it only occurs in certain types of geologic settings and soil types. As part of the Oregon Resilience Plan, DOGAMI created a data layer depicting liquefaction susceptibility that generally represents where certain geologic formations may liquefy in earthquakes. These liquefiable geologic units are derived from the geologic units within the Oregon Geologic Data Compilation (OGDC v5). The liquefaction data layer from the Oregon Resilience Plan was categorized as Very Low, Low, Moderate, High, and Very High. For the purposes of this analysis, Very Low and Low were combined into “ Low”; “Moderate” remained the same; and High and Very High were combined into the “High” category. Areas with no known liquefiable geology were given the attribute “Other”. Future geologic mapping, particularly maps that emphasize shallow geology, may change our understanding of where liquefiable deposits occur in Oregon. Earthquake Hazard Facility Summary Of 5,693 state facilities evaluated, 5,360 totaling over $7 billion worth of property fall into one of the earthquake hazard zones. Among the 1,141 critical and essential state facilities, 1,069 are in earthquake hazard zones (Table 2-V-FAC-3). Data Limitations It is important to note that the methodology used for this vulnerability study is a very broad-scaled approach and does not assess the ability of a building to withstand the earthquake hazard. For a given amount of ground motion, two buildings with different construction types may receive very different
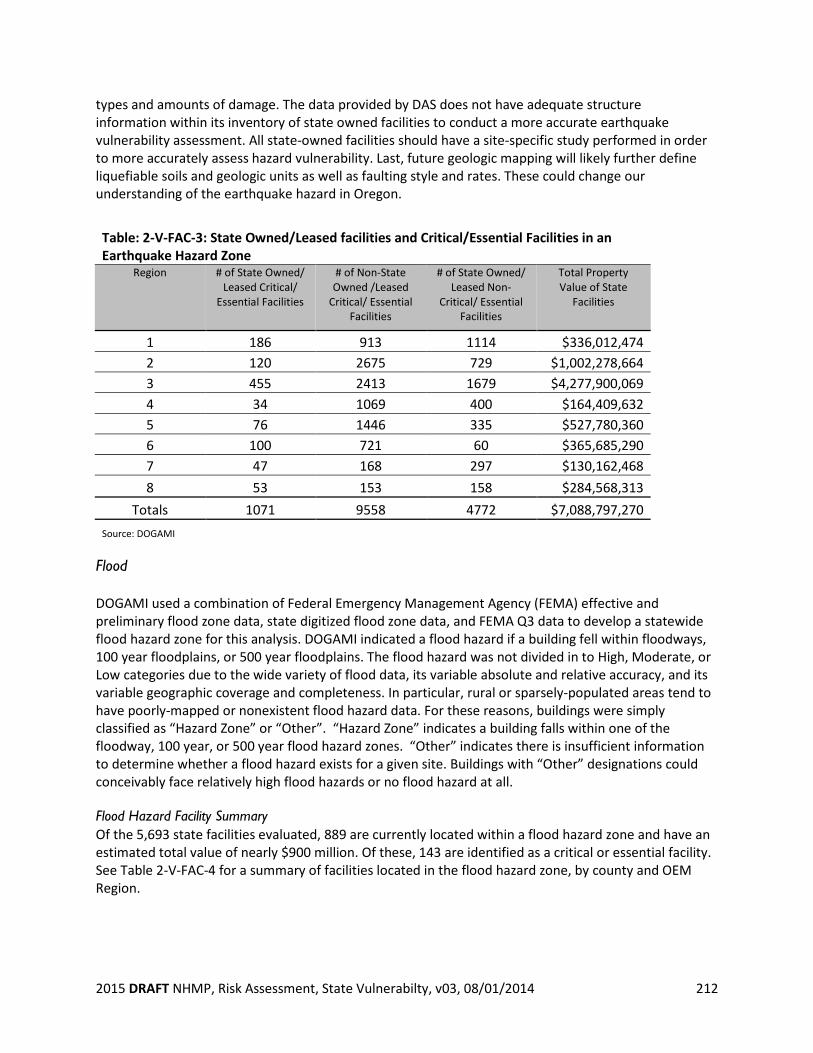
2015 DRAFT NHMP, Risk Assessment, State Vulnerabilty, v03, 08/01/2014 212
types and amounts of damage. The data provided by DAS does not have adequate structure information within its inventory of state owned facilities to conduct a more accurate earthquake vulnerability assessment. All state-owned facilities should have a site-specific study performed in order to more accurately assess hazard vulnerability. Last, future geologic mapping will likely further define liquefiable soils and geologic units as well as faulting style and rates. These could change our understanding of the earthquake hazard in Oregon.
Table: 2-V-FAC-3: State Owned/Leased facilities and Critical/Essential Facilities in an Earthquake Hazard Zone
Region # of State Owned/ Leased Critical/
Essential Facilities
# of Non-State Owned /Leased
Critical/ Essential Facilities
# of State Owned/ Leased Non-
Critical/ Essential Facilities
Total Property Value of State
Facilities
1 186 913 1114 $336,012,474 2 120 2675 729 $1,002,278,664 3 455 2413 1679 $4,277,900,069 4 34 1069 400 $164,409,632 5 76 1446 335 $527,780,360 6 100 721 60 $365,685,290 7 47 168 297 $130,162,468 8 53 153 158 $284,568,313
Totals 1071 9558 4772 $7,088,797,270 Source: DOGAMI
Flood DOGAMI used a combination of Federal Emergency Management Agency (FEMA) effective and preliminary flood zone data, state digitized flood zone data, and FEMA Q3 data to develop a statewide flood hazard zone for this analysis. DOGAMI indicated a flood hazard if a building fell within floodways, 100 year floodplains, or 500 year floodplains. The flood hazard was not divided in to High, Moderate, or Low categories due to the wide variety of flood data, its variable absolute and relative accuracy, and its variable geographic coverage and completeness. In particular, rural or sparsely-populated areas tend to have poorly-mapped or nonexistent flood hazard data. For these reasons, buildings were simply classified as “Hazard Zone” or “Other”. “Hazard Zone” indicates a building falls within one of the floodway, 100 year, or 500 year flood hazard zones. “Other” indicates there is insufficient information to determine whether a flood hazard exists for a given site. Buildings with “Other” designations could conceivably face relatively high flood hazards or no flood hazard at all. Flood Hazard Facility Summary Of the 5,693 state facilities evaluated, 889 are currently located within a flood hazard zone and have an estimated total value of nearly $900 million. Of these, 143 are identified as a critical or essential facility. See Table 2-V-FAC-4 for a summary of facilities located in the flood hazard zone, by county and OEM Region.
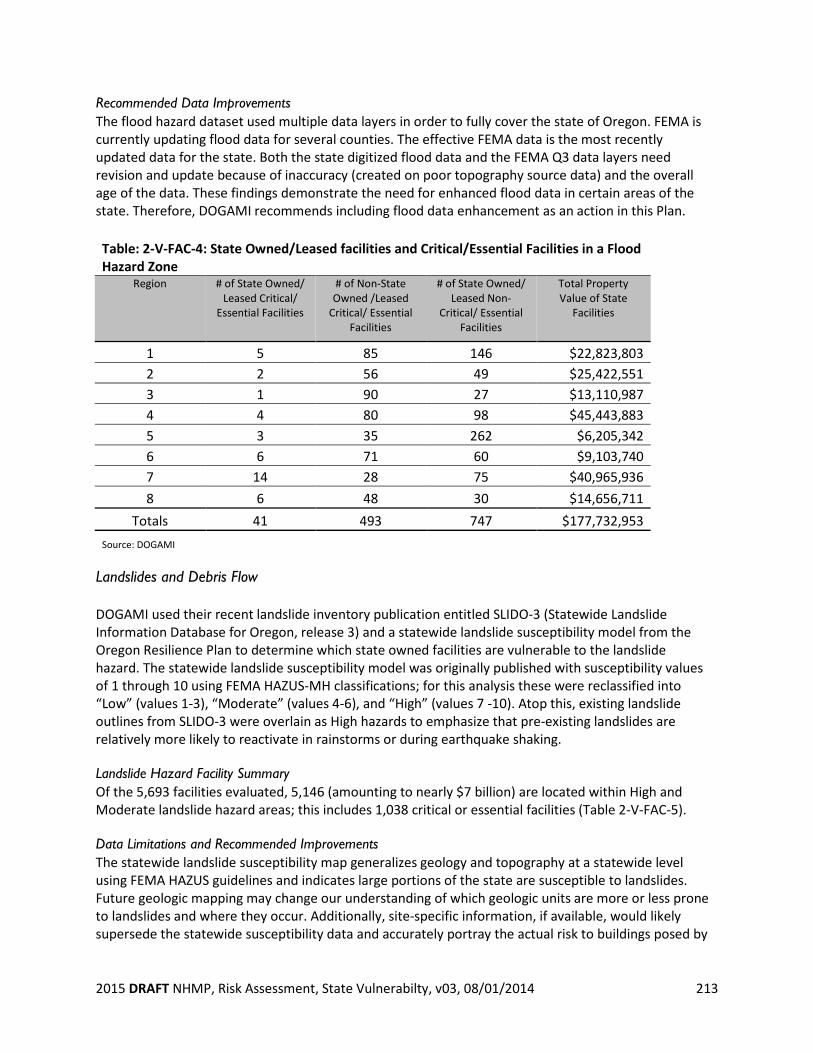
2015 DRAFT NHMP, Risk Assessment, State Vulnerabilty, v03, 08/01/2014 213
Recommended Data Improvements The flood hazard dataset used multiple data layers in order to fully cover the state of Oregon. FEMA is currently updating flood data for several counties. The effective FEMA data is the most recently updated data for the state. Both the state digitized flood data and the FEMA Q3 data layers need revision and update because of inaccuracy (created on poor topography source data) and the overall age of the data. These findings demonstrate the need for enhanced flood data in certain areas of the state. Therefore, DOGAMI recommends including flood data enhancement as an action in this Plan. Table: 2-V-FAC-4: State Owned/Leased facilities and Critical/Essential Facilities in a Flood Hazard Zone
Region # of State Owned/ Leased Critical/
Essential Facilities
# of Non-State Owned /Leased
Critical/ Essential Facilities
# of State Owned/ Leased Non-
Critical/ Essential Facilities
Total Property Value of State
Facilities
1 5 85 146 $22,823,803 2 2 56 49 $25,422,551 3 1 90 27 $13,110,987 4 4 80 98 $45,443,883 5 3 35 262 $6,205,342 6 6 71 60 $9,103,740 7 14 28 75 $40,965,936 8 6 48 30 $14,656,711
Totals 41 493 747 $177,732,953 Source: DOGAMI
Landslides and Debris Flow DOGAMI used their recent landslide inventory publication entitled SLIDO-3 (Statewide Landslide Information Database for Oregon, release 3) and a statewide landslide susceptibility model from the Oregon Resilience Plan to determine which state owned facilities are vulnerable to the landslide hazard. The statewide landslide susceptibility model was originally published with susceptibility values of 1 through 10 using FEMA HAZUS-MH classifications; for this analysis these were reclassified into “Low” (values 1-3), “Moderate” (values 4-6), and “High” (values 7 -10). Atop this, existing landslide outlines from SLIDO-3 were overlain as High hazards to emphasize that pre-existing landslides are relatively more likely to reactivate in rainstorms or during earthquake shaking. Landslide Hazard Facility Summary Of the 5,693 facilities evaluated, 5,146 (amounting to nearly $7 billion) are located within High and Moderate landslide hazard areas; this includes 1,038 critical or essential facilities (Table 2-V-FAC-5). Data Limitations and Recommended Improvements The statewide landslide susceptibility map generalizes geology and topography at a statewide level using FEMA HAZUS guidelines and indicates large portions of the state are susceptible to landslides. Future geologic mapping may change our understanding of which geologic units are more or less prone to landslides and where they occur. Additionally, site-specific information, if available, would likely supersede the statewide susceptibility data and accurately portray the actual risk to buildings posed by
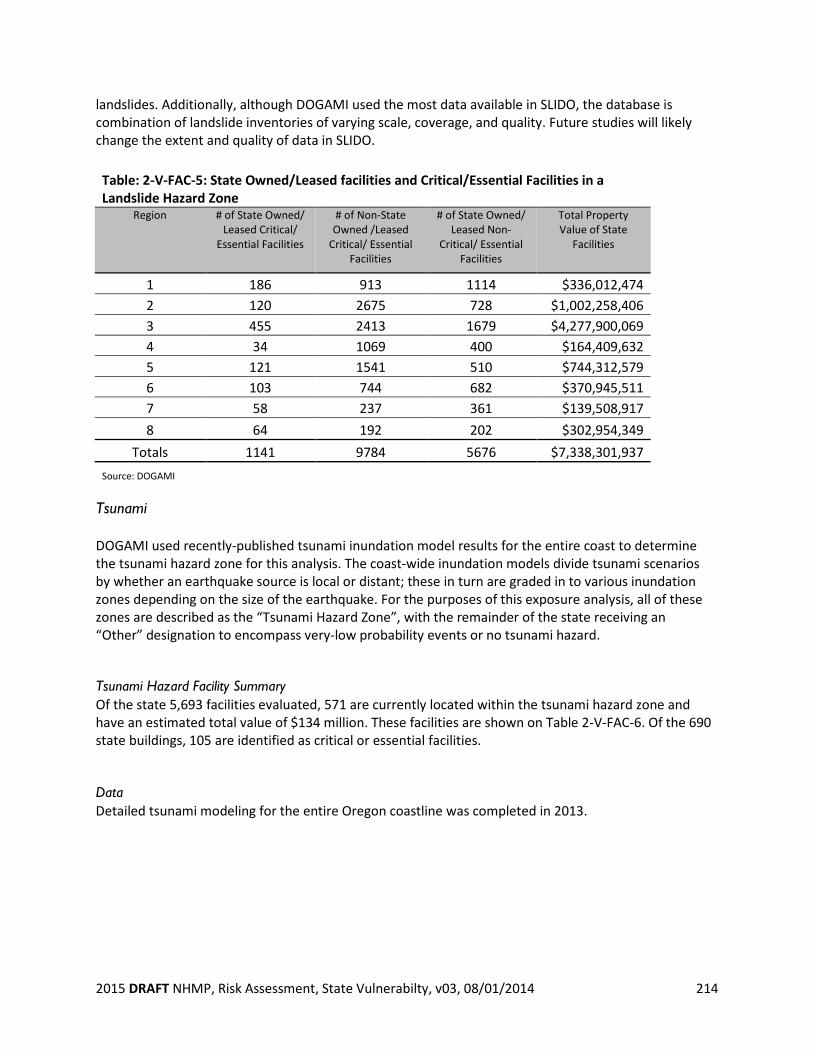
2015 DRAFT NHMP, Risk Assessment, State Vulnerabilty, v03, 08/01/2014 214
landslides. Additionally, although DOGAMI used the most data available in SLIDO, the database is combination of landslide inventories of varying scale, coverage, and quality. Future studies will likely change the extent and quality of data in SLIDO. Table: 2-V-FAC-5: State Owned/Leased facilities and Critical/Essential Facilities in a Landslide Hazard Zone
Region # of State Owned/ Leased Critical/
Essential Facilities
# of Non-State Owned /Leased
Critical/ Essential Facilities
# of State Owned/ Leased Non-
Critical/ Essential Facilities
Total Property Value of State
Facilities
1 186 913 1114 $336,012,474 2 120 2675 728 $1,002,258,406 3 455 2413 1679 $4,277,900,069 4 34 1069 400 $164,409,632 5 121 1541 510 $744,312,579 6 103 744 682 $370,945,511 7 58 237 361 $139,508,917 8 64 192 202 $302,954,349
Totals 1141 9784 5676 $7,338,301,937 Source: DOGAMI
Tsunami DOGAMI used recently-published tsunami inundation model results for the entire coast to determine the tsunami hazard zone for this analysis. The coast-wide inundation models divide tsunami scenarios by whether an earthquake source is local or distant; these in turn are graded in to various inundation zones depending on the size of the earthquake. For the purposes of this exposure analysis, all of these zones are described as the “Tsunami Hazard Zone”, with the remainder of the state receiving an “Other” designation to encompass very-low probability events or no tsunami hazard. Tsunami Hazard Facility Summary Of the state 5,693 facilities evaluated, 571 are currently located within the tsunami hazard zone and have an estimated total value of $134 million. These facilities are shown on Table 2-V-FAC-6. Of the 690 state buildings, 105 are identified as critical or essential facilities. Data Detailed tsunami modeling for the entire Oregon coastline was completed in 2013.
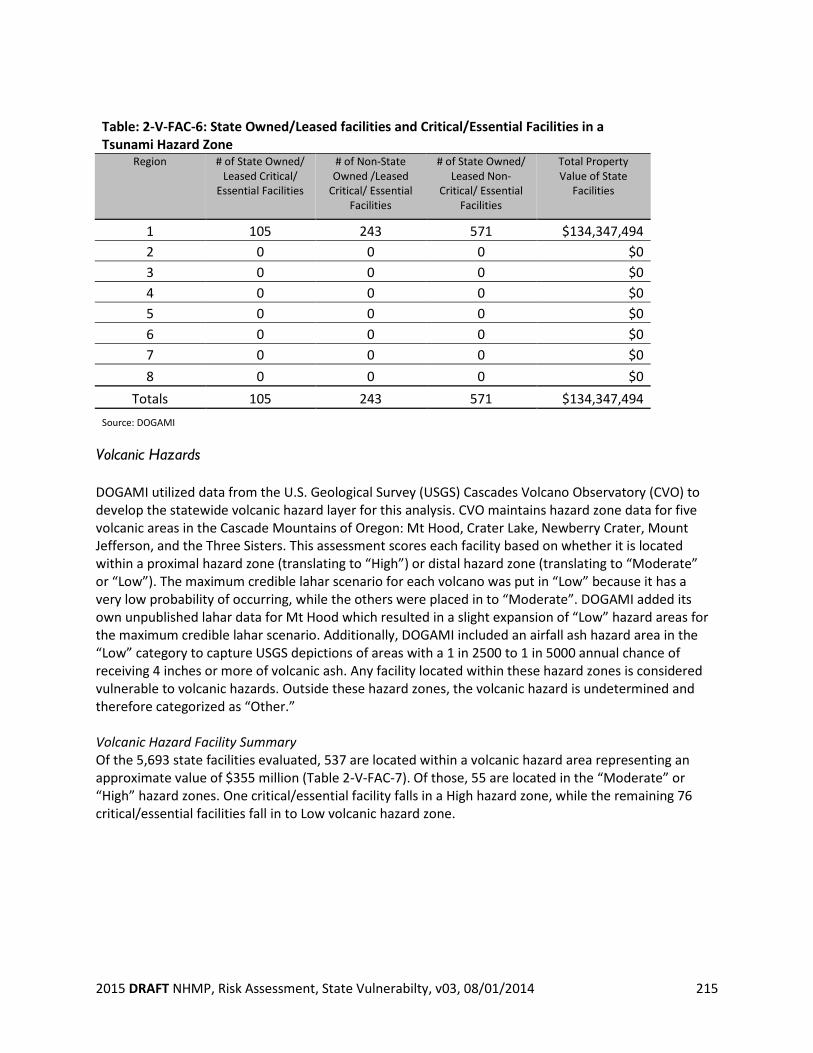
2015 DRAFT NHMP, Risk Assessment, State Vulnerabilty, v03, 08/01/2014 215
Table: 2-V-FAC-6: State Owned/Leased facilities and Critical/Essential Facilities in a Tsunami Hazard Zone
Region # of State Owned/ Leased Critical/
Essential Facilities
# of Non-State Owned /Leased
Critical/ Essential Facilities
# of State Owned/ Leased Non-
Critical/ Essential Facilities
Total Property Value of State
Facilities
1 105 243 571 $134,347,494 2 0 0 0 $0 3 0 0 0 $0 4 0 0 0 $0 5 0 0 0 $0 6 0 0 0 $0 7 0 0 0 $0 8 0 0 0 $0
Totals 105 243 571 $134,347,494 Source: DOGAMI
Volcanic Hazards DOGAMI utilized data from the U.S. Geological Survey (USGS) Cascades Volcano Observatory (CVO) to develop the statewide volcanic hazard layer for this analysis. CVO maintains hazard zone data for five volcanic areas in the Cascade Mountains of Oregon: Mt Hood, Crater Lake, Newberry Crater, Mount Jefferson, and the Three Sisters. This assessment scores each facility based on whether it is located within a proximal hazard zone (translating to “High”) or distal hazard zone (translating to “Moderate” or “Low”). The maximum credible lahar scenario for each volcano was put in “Low” because it has a very low probability of occurring, while the others were placed in to “Moderate”. DOGAMI added its own unpublished lahar data for Mt Hood which resulted in a slight expansion of “Low” hazard areas for the maximum credible lahar scenario. Additionally, DOGAMI included an airfall ash hazard area in the “Low” category to capture USGS depictions of areas with a 1 in 2500 to 1 in 5000 annual chance of receiving 4 inches or more of volcanic ash. Any facility located within these hazard zones is considered vulnerable to volcanic hazards. Outside these hazard zones, the volcanic hazard is undetermined and therefore categorized as “Other.” Volcanic Hazard Facility Summary Of the 5,693 state facilities evaluated, 537 are located within a volcanic hazard area representing an approximate value of $355 million (Table 2-V-FAC-7). Of those, 55 are located in the “Moderate” or “High” hazard zones. One critical/essential facility falls in a High hazard zone, while the remaining 76 critical/essential facilities fall in to Low volcanic hazard zone.
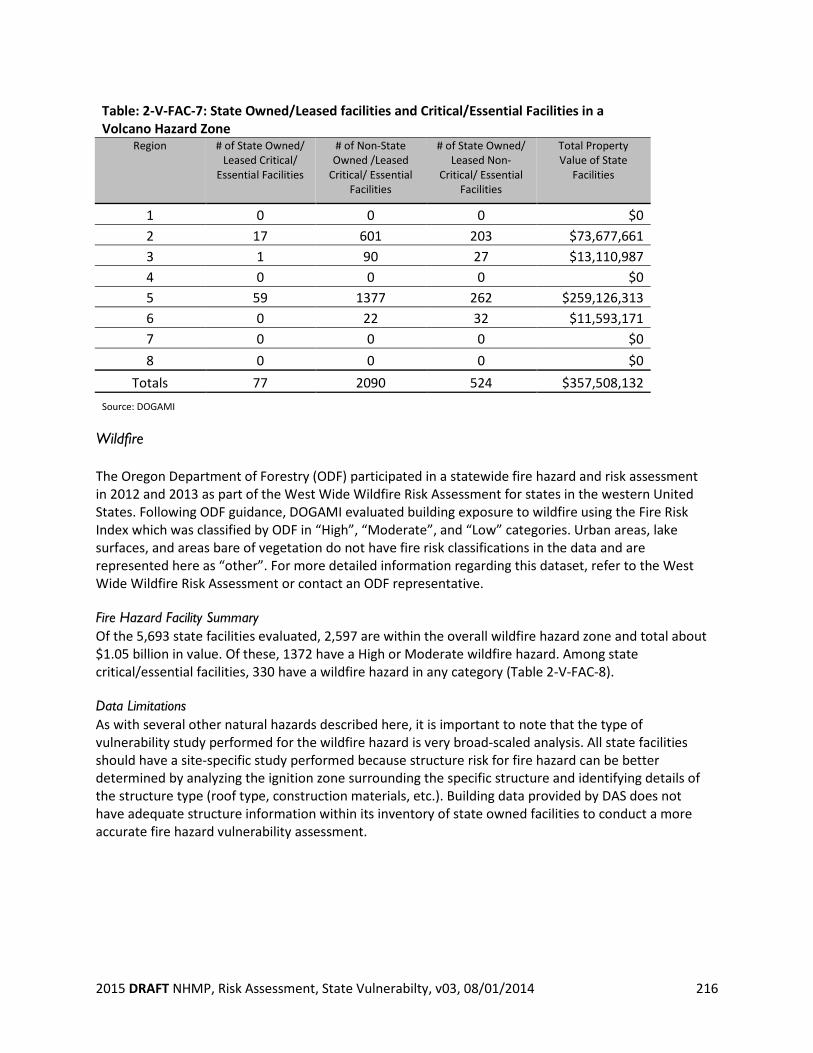
2015 DRAFT NHMP, Risk Assessment, State Vulnerabilty, v03, 08/01/2014 216
Table: 2-V-FAC-7: State Owned/Leased facilities and Critical/Essential Facilities in a Volcano Hazard Zone
Region # of State Owned/ Leased Critical/
Essential Facilities
# of Non-State Owned /Leased
Critical/ Essential Facilities
# of State Owned/ Leased Non-
Critical/ Essential Facilities
Total Property Value of State
Facilities
1 0 0 0 $0 2 17 601 203 $73,677,661 3 1 90 27 $13,110,987 4 0 0 0 $0 5 59 1377 262 $259,126,313 6 0 22 32 $11,593,171 7 0 0 0 $0 8 0 0 0 $0
Totals 77 2090 524 $357,508,132 Source: DOGAMI
Wildfire The Oregon Department of Forestry (ODF) participated in a statewide fire hazard and risk assessment in 2012 and 2013 as part of the West Wide Wildfire Risk Assessment for states in the western United States. Following ODF guidance, DOGAMI evaluated building exposure to wildfire using the Fire Risk Index which was classified by ODF in “High”, “Moderate”, and “Low” categories. Urban areas, lake surfaces, and areas bare of vegetation do not have fire risk classifications in the data and are represented here as “other”. For more detailed information regarding this dataset, refer to the West Wide Wildfire Risk Assessment or contact an ODF representative. Fire Hazard Facility Summary Of the 5,693 state facilities evaluated, 2,597 are within the overall wildfire hazard zone and total about $1.05 billion in value. Of these, 1372 have a High or Moderate wildfire hazard. Among state critical/essential facilities, 330 have a wildfire hazard in any category (Table 2-V-FAC-8). Data Limitations As with several other natural hazards described here, it is important to note that the type of vulnerability study performed for the wildfire hazard is very broad-scaled analysis. All state facilities should have a site-specific study performed because structure risk for fire hazard can be better determined by analyzing the ignition zone surrounding the specific structure and identifying details of the structure type (roof type, construction materials, etc.). Building data provided by DAS does not have adequate structure information within its inventory of state owned facilities to conduct a more accurate fire hazard vulnerability assessment.
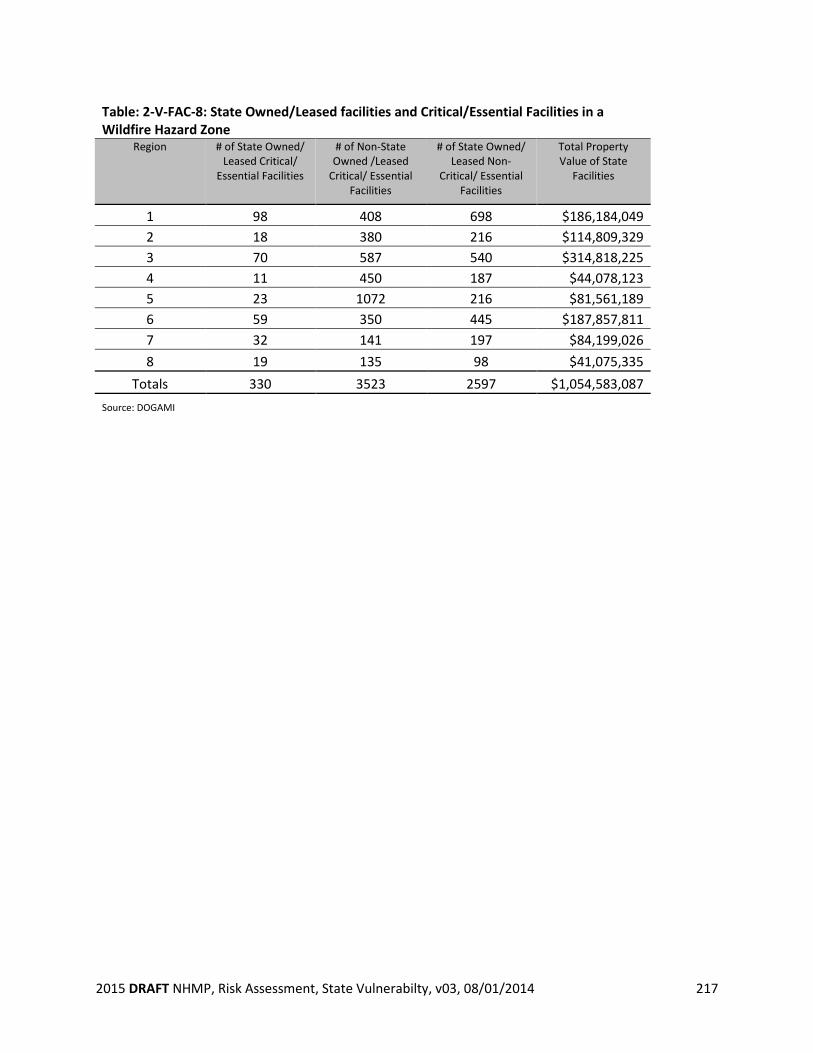
2015 DRAFT NHMP, Risk Assessment, State Vulnerabilty, v03, 08/01/2014 217
Table: 2-V-FAC-8: State Owned/Leased facilities and Critical/Essential Facilities in a Wildfire Hazard Zone
Region # of State Owned/ Leased Critical/
Essential Facilities
# of Non-State Owned /Leased
Critical/ Essential Facilities
# of State Owned/ Leased Non-
Critical/ Essential Facilities
Total Property Value of State
Facilities
1 98 408 698 $186,184,049 2 18 380 216 $114,809,329 3 70 587 540 $314,818,225 4 11 450 187 $44,078,123 5 23 1072 216 $81,561,189 6 59 350 445 $187,857,811 7 32 141 197 $84,199,026 8 19 135 98 $41,075,335
Totals 330 3523 2597 $1,054,583,087 Source: DOGAMI
2015 DRAFT NHMP, Risk Assessment, State Vulnerabilty, v03, 08/01/2014 218
Seismic Transportation Lifeline Vulnerabilities
In 2012 the Oregon Department of Transportation (ODOT) conducted the Oregon Seismic Lifeline Routes (OSLR) identification project. The purpose of the OSLR project was to support emergency response and recovery efforts by providing the best connecting highways practicable between service providers, incident areas and essential supply lines to allow emergency service providers to do their jobs with minimum disruption. It is also intended to support community and regional economic recovery after a disaster event. While the focus of the OSLR project is entirely on state highway right of way, there was an assumption that other transportation modes and facilities are part of an integrated lifelines system. The Oregon Seismic Resilience Plan furthers the discussion of the roles of the different modes and facilities in the aftermath of a CSZ event. Prior to the OSLR project, most seismic resiliency planning and analysis at ODOT focused on bridges. Recognizing that fully resilient bridges alone would not ensure resilient highways, the ODOT Bridge Section and Transportation Development Division Planning Unit worked together to develop a method for evaluating seismic vulnerability of highways at a corridor level. The methodology included factors related to both the physical characteristics of the highway and a range of trip-ends served that are critical to emergency response and recovery. The result is a backbone system of state highways to connect the areas of the state most vulnerable to a major CSZ event with areas best suited for staging relief efforts and keeping the state economy going, to be prioritized for appropriate retrofit and improvement as funds are made available. The OSLR project study concludes with recommendations for designation of a Seismic Lifelines System. The OSLR project implements Oregon Highway Plan Policy 1E: Lifeline Routes, by recommending a specific list of highways and bridges that comprise the seismic lifeline network. Further, it establishes a three-tiered system of seismic lifelines to help prioritize investment in seismic retrofits on state-owned highways and bridges. The OSLR project was conducted by the ODOT Transportation Development Division (TDD) from September 2011 through April 2012, in coordination and consultation with Bridge, Maintenance, Geotechnical, and other impacted divisions within the agency, as well as with other state agencies including the Oregon Department of Geological and Mineral Industries (DOGAMI) and the Public Utility Commission (PUC) through a Project Management Team (PMT) and Steering Committee (SC). The full report can be found at website: https://services.oregon.gov/ODOT/TD/TP/Reports/Seismic%20Lifelines%20Evaluation%20Vulnerability%20Synthese%20and%20Identification.pdf
Requirement: 44 CFR §201.4(c)(2)(iii): Th[e] risk assessment shall include… (iii) …The State shall estimate the potential dollar losses to … infrastructure…located in the identified hazard areas.
2015 DRAFT NHMP, Risk Assessment, State Vulnerabilty, v03, 08/01/2014 219
Methodology The OSLR project management team used the following 5-step process to conduct the OSLR analysis.
Step 1: Identify study corridors
State highways west of US 97 were selected as study corridors that met one or more of the following characteristics (Figure 2-V-LL-1): • Likely ability to promote safety and survival through connections to major population centers with
survival resources • Current use as a strategic freight and commerce route • Connection to one or more of the following key destinations of statewide significance:
o Interstate (I)-84 east of Biggs Junction o US 20 east of Bend o The California border on I-5 o The California border on US 97 o A crossing of the Columbia River into southwest Washington o A port on the Columbia or Willamette River o A port on the coast o Portland International Airport o Redmond Municipal Airport
The study corridors were grouped geographically into the following six distinct zones within the western half of the state (Figure 2-V-LL-2): • Coast (US 101 and connections to US 101 from the I-5 corridor) • Portland Metro (highways within the Portland metro region) • Valley (circulation between the Portland metro area and other major population centers in the
Willamette Valley) • South I-5 (the section of I-5 south of Eugene/Springfield) • Cascades (highways crossing the Cascades mountain range) • Central (the US 97/US 197 corridor from Washington to California)
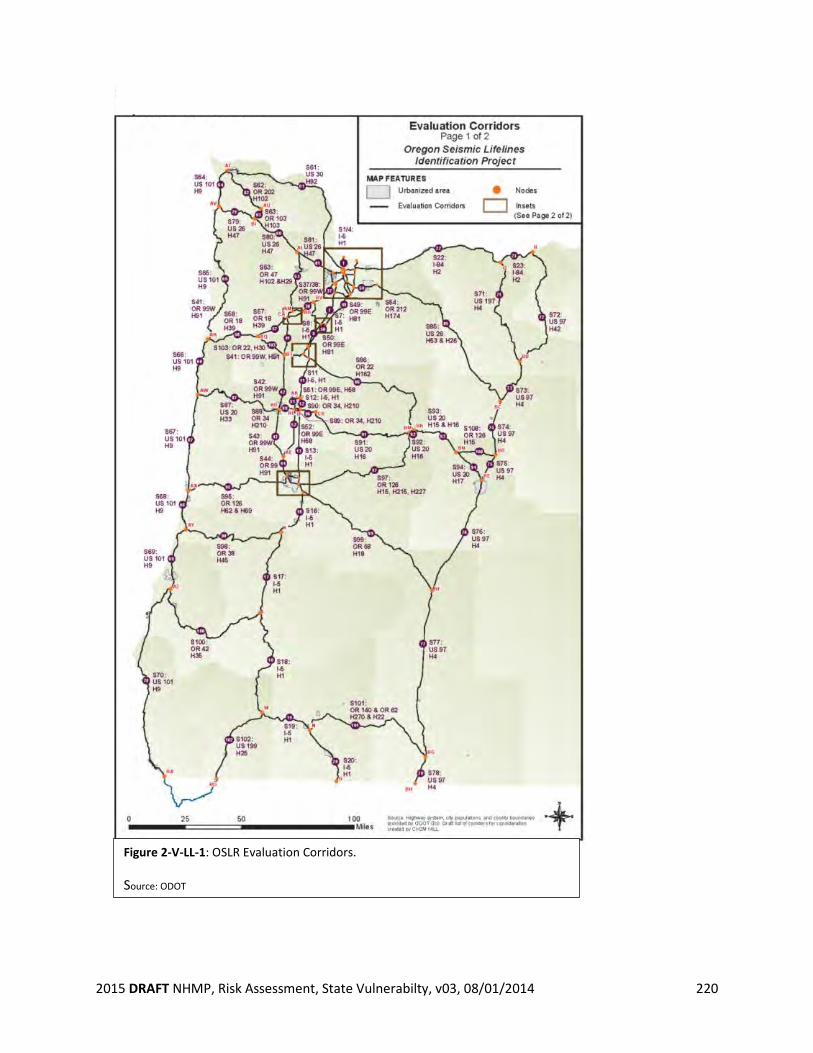
2015 DRAFT NHMP, Risk Assessment, State Vulnerabilty, v03, 08/01/2014 220
Figure 2-V-LL-1: OSLR Evaluation Corridors.
Source: ODOT
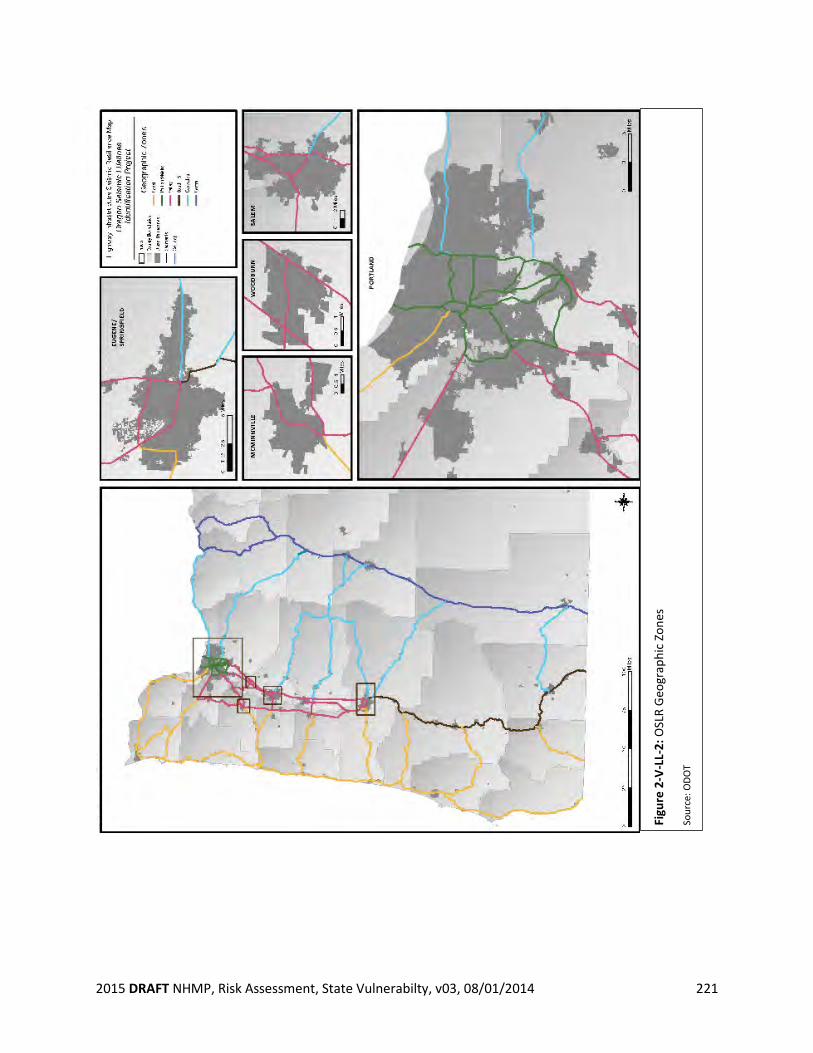
2015 DRAFT NHMP, Risk Assessment, State Vulnerabilty, v03, 08/01/2014 221
Figu
re 2
-V-L
L-2:
OSL
R G
eogr
aphi
c Zo
nes
Sour
ce: O
DOT
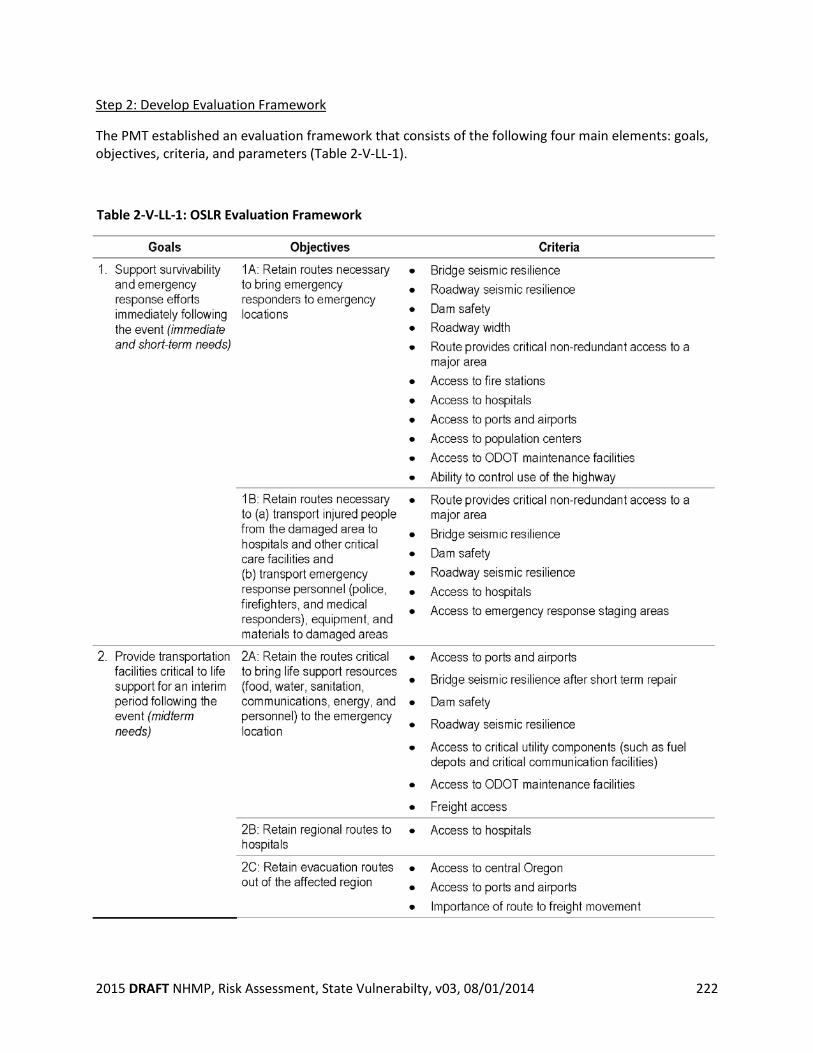
2015 DRAFT NHMP, Risk Assessment, State Vulnerabilty, v03, 08/01/2014 222
Step 2: Develop Evaluation Framework
The PMT established an evaluation framework that consists of the following four main elements: goals, objectives, criteria, and parameters (Table 2-V-LL-1).
Table 2-V-LL-1: OSLR Evaluation Framework
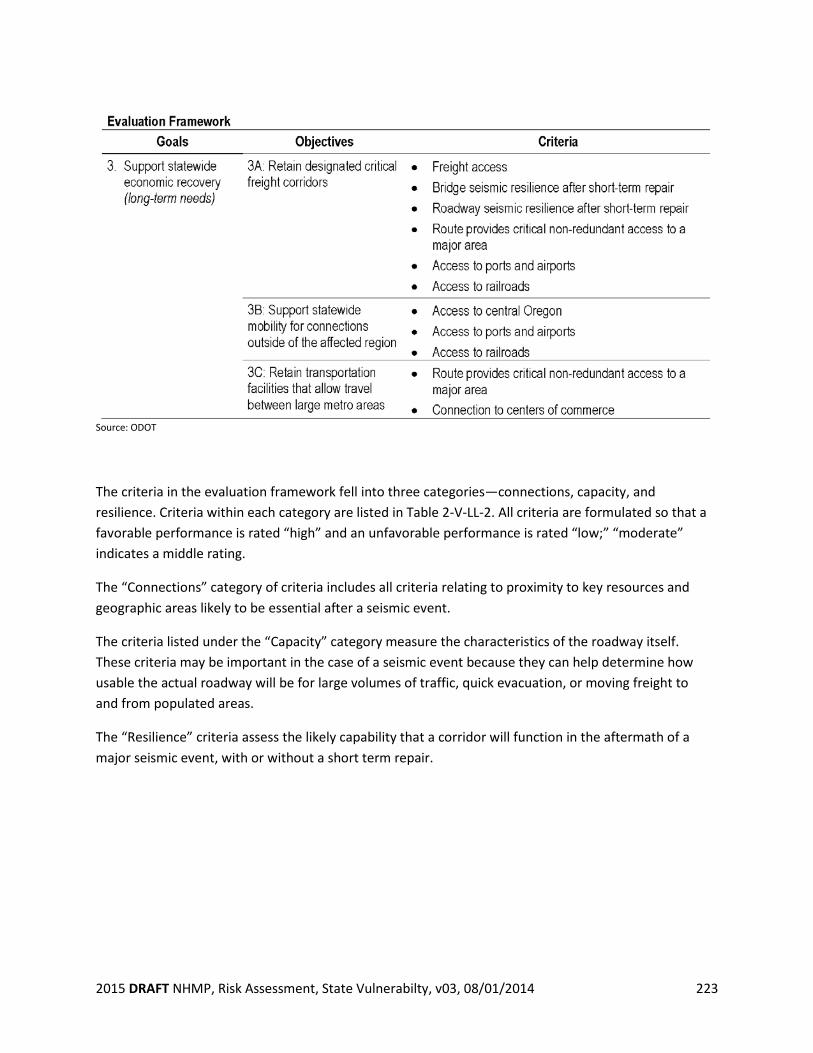
2015 DRAFT NHMP, Risk Assessment, State Vulnerabilty, v03, 08/01/2014 223
Source: ODOT
The criteria in the evaluation framework fell into three categories—connections, capacity, and resilience. Criteria within each category are listed in Table 2-V-LL-2. All criteria are formulated so that a favorable performance is rated “high” and an unfavorable performance is rated “low;” “moderate” indicates a middle rating.
The “Connections” category of criteria includes all criteria relating to proximity to key resources and geographic areas likely to be essential after a seismic event.
The criteria listed under the “Capacity” category measure the characteristics of the roadway itself. These criteria may be important in the case of a seismic event because they can help determine how usable the actual roadway will be for large volumes of traffic, quick evacuation, or moving freight to and from populated areas.
The “Resilience” criteria assess the likely capability that a corridor will function in the aftermath of a major seismic event, with or without a short term repair.
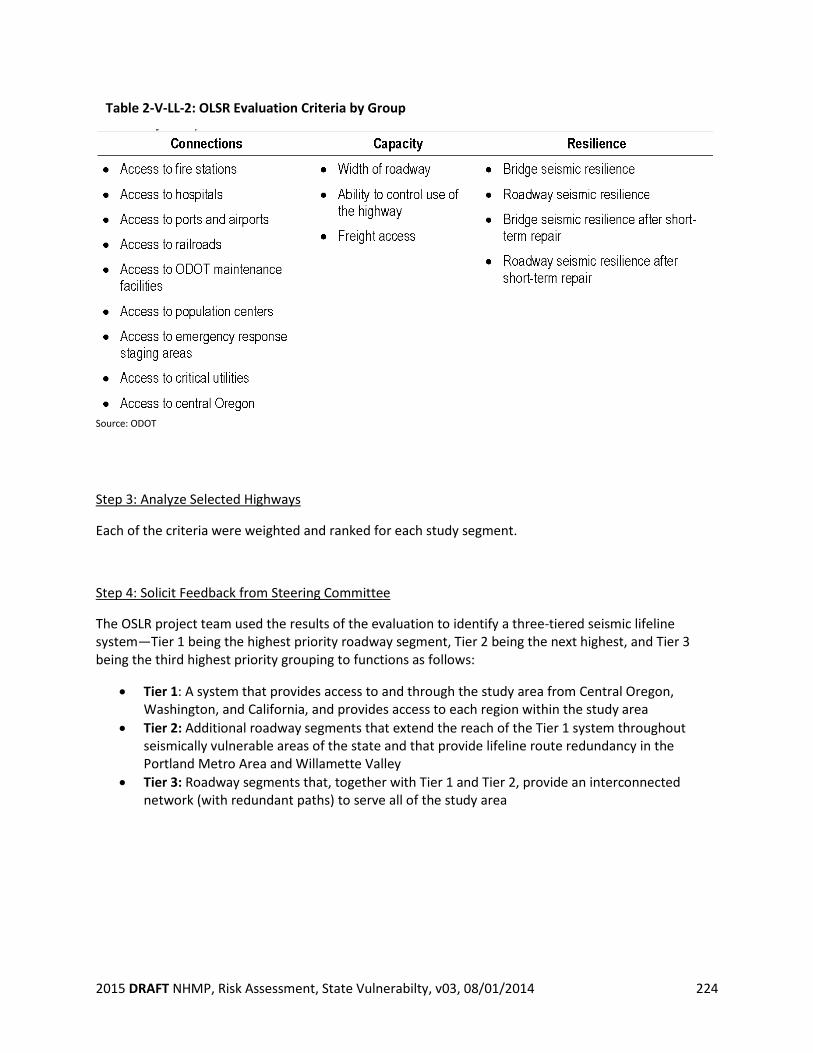
2015 DRAFT NHMP, Risk Assessment, State Vulnerabilty, v03, 08/01/2014 224
Source: ODOT
Step 3: Analyze Selected Highways
Each of the criteria were weighted and ranked for each study segment.
Step 4: Solicit Feedback from Steering Committee
The OSLR project team used the results of the evaluation to identify a three-tiered seismic lifeline system—Tier 1 being the highest priority roadway segment, Tier 2 being the next highest, and Tier 3 being the third highest priority grouping to functions as follows:
• Tier 1: A system that provides access to and through the study area from Central Oregon, Washington, and California, and provides access to each region within the study area
• Tier 2: Additional roadway segments that extend the reach of the Tier 1 system throughout seismically vulnerable areas of the state and that provide lifeline route redundancy in the Portland Metro Area and Willamette Valley
• Tier 3: Roadway segments that, together with Tier 1 and Tier 2, provide an interconnected network (with redundant paths) to serve all of the study area
Table 2-V-LL-2: OLSR Evaluation Criteria by Group
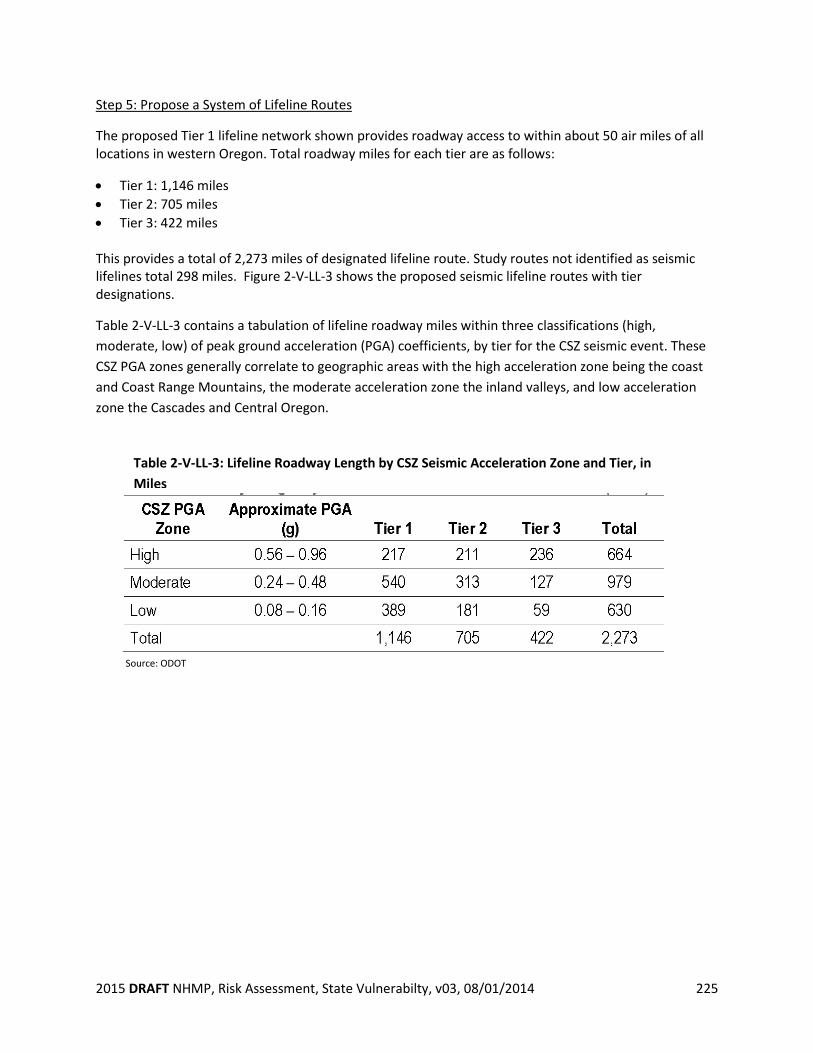
2015 DRAFT NHMP, Risk Assessment, State Vulnerabilty, v03, 08/01/2014 225
Step 5: Propose a System of Lifeline Routes
The proposed Tier 1 lifeline network shown provides roadway access to within about 50 air miles of all locations in western Oregon. Total roadway miles for each tier are as follows:
• Tier 1: 1,146 miles • Tier 2: 705 miles • Tier 3: 422 miles This provides a total of 2,273 miles of designated lifeline route. Study routes not identified as seismic lifelines total 298 miles. Figure 2-V-LL-3 shows the proposed seismic lifeline routes with tier designations.
Table 2-V-LL-3 contains a tabulation of lifeline roadway miles within three classifications (high, moderate, low) of peak ground acceleration (PGA) coefficients, by tier for the CSZ seismic event. These CSZ PGA zones generally correlate to geographic areas with the high acceleration zone being the coast and Coast Range Mountains, the moderate acceleration zone the inland valleys, and low acceleration zone the Cascades and Central Oregon.
Source: ODOT
Table 2-V-LL-3: Lifeline Roadway Length by CSZ Seismic Acceleration Zone and Tier, in Miles
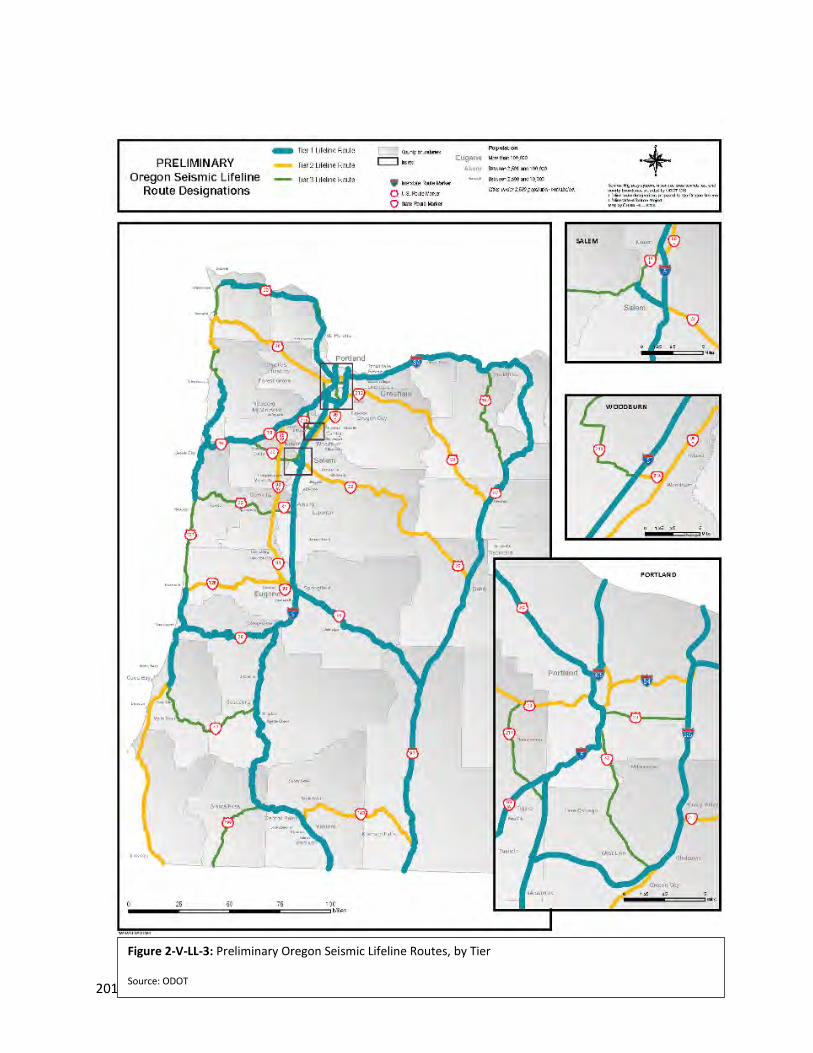
2015 DRAFT NHMP, Risk Assessment, State Vulnerabilty, v03, 08/01/2014 226
Figure 2-V-LL-3: Preliminary Oregon Seismic Lifeline Routes, by Tier
Source: ODOT
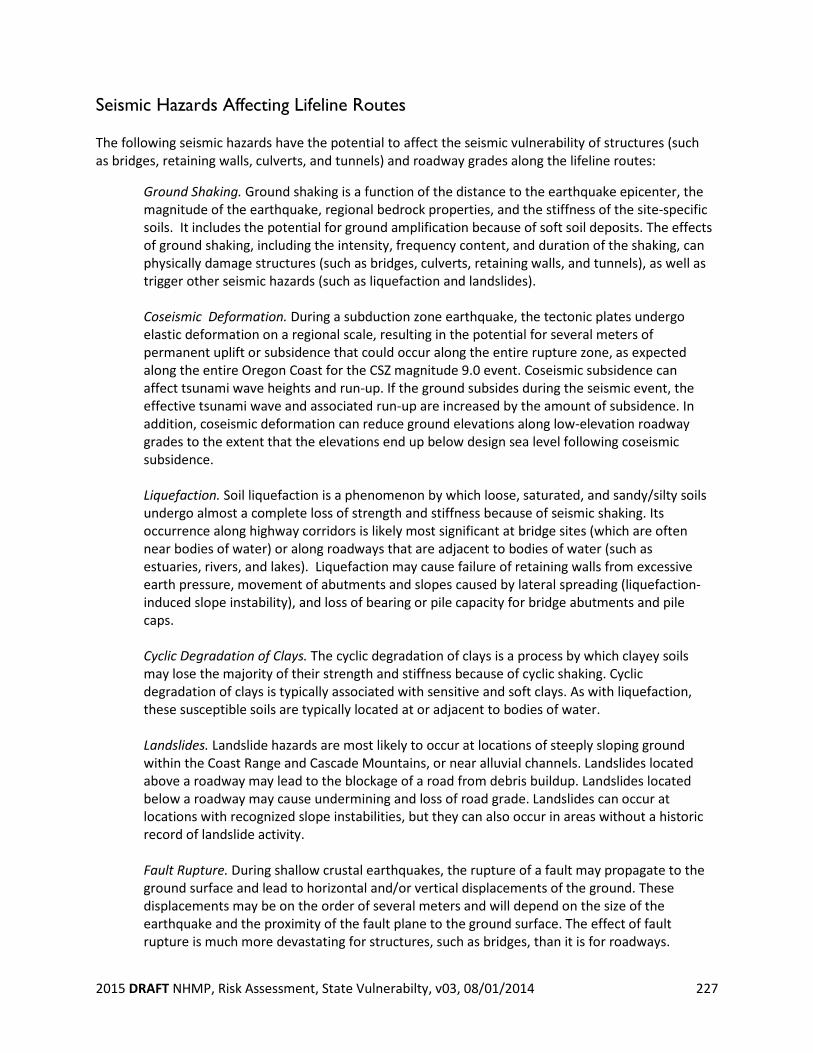
2015 DRAFT NHMP, Risk Assessment, State Vulnerabilty, v03, 08/01/2014 227
Seismic Hazards Affecting Lifeline Routes
The following seismic hazards have the potential to affect the seismic vulnerability of structures (such as bridges, retaining walls, culverts, and tunnels) and roadway grades along the lifeline routes:
Ground Shaking. Ground shaking is a function of the distance to the earthquake epicenter, the magnitude of the earthquake, regional bedrock properties, and the stiffness of the site-specific soils. It includes the potential for ground amplification because of soft soil deposits. The effects of ground shaking, including the intensity, frequency content, and duration of the shaking, can physically damage structures (such as bridges, culverts, retaining walls, and tunnels), as well as trigger other seismic hazards (such as liquefaction and landslides). Coseismic Deformation. During a subduction zone earthquake, the tectonic plates undergo elastic deformation on a regional scale, resulting in the potential for several meters of permanent uplift or subsidence that could occur along the entire rupture zone, as expected along the entire Oregon Coast for the CSZ magnitude 9.0 event. Coseismic subsidence can affect tsunami wave heights and run-up. If the ground subsides during the seismic event, the effective tsunami wave and associated run-up are increased by the amount of subsidence. In addition, coseismic deformation can reduce ground elevations along low-elevation roadway grades to the extent that the elevations end up below design sea level following coseismic subsidence. Liquefaction. Soil liquefaction is a phenomenon by which loose, saturated, and sandy/silty soils undergo almost a complete loss of strength and stiffness because of seismic shaking. Its occurrence along highway corridors is likely most significant at bridge sites (which are often near bodies of water) or along roadways that are adjacent to bodies of water (such as estuaries, rivers, and lakes). Liquefaction may cause failure of retaining walls from excessive earth pressure, movement of abutments and slopes caused by lateral spreading (liquefaction-induced slope instability), and loss of bearing or pile capacity for bridge abutments and pile caps. Cyclic Degradation of Clays. The cyclic degradation of clays is a process by which clayey soils may lose the majority of their strength and stiffness because of cyclic shaking. Cyclic degradation of clays is typically associated with sensitive and soft clays. As with liquefaction, these susceptible soils are typically located at or adjacent to bodies of water. Landslides. Landslide hazards are most likely to occur at locations of steeply sloping ground within the Coast Range and Cascade Mountains, or near alluvial channels. Landslides located above a roadway may lead to the blockage of a road from debris buildup. Landslides located below a roadway may cause undermining and loss of road grade. Landslides can occur at locations with recognized slope instabilities, but they can also occur in areas without a historic record of landslide activity. Fault Rupture. During shallow crustal earthquakes, the rupture of a fault may propagate to the ground surface and lead to horizontal and/or vertical displacements of the ground. These displacements may be on the order of several meters and will depend on the size of the earthquake and the proximity of the fault plane to the ground surface. The effect of fault rupture is much more devastating for structures, such as bridges, than it is for roadways.
2015 DRAFT NHMP, Risk Assessment, State Vulnerabilty, v03, 08/01/2014 228
However, the thoroughness of current mapping of faults for the State of Oregon is uncertain and very few of the observed earthquakes in Oregon are associated with mapped crustal faults. It is anticipated that, given the heavy vegetative cover for a lot of Oregon and the short period of time for which records have been kept, not all active faults have been identified. Tsunamis. Tsunamis may affect lifeline routes near and adjacent to the coastline. The resulting water forces can damage structures within the tsunami run-up zone, and can also cause debris buildup or inundation and the washing away of roadway grades. Seiche Waves. Seiche waves are resonance waves that are caused by seismic shaking of enclosed bodies of water, and often occur at distances far from the earthquake epicenter. The hazards listed previously all have relevance to seismic lifeline routes. However, fault rupture, cyclic degradation of clayey soils, and seiche wave hazards were not further evaluated because a CSZ event is not a fault rupture event, there is limited information on clay deformation and the affected areas are likely to also be subject to liquefaction which is considered and seiche waves are limited in height so not expected to have destructive effects on the studied highways. (See Figures 4-1, 4-4 and 4-5)
2015 DRAFT NHMP, Risk Assessment, State Vulnerabilty, v03, 08/01/2014 229
State Vulnerability
Given the current conditions of the state highway system, the western half of Oregon will be profoundly impacted by a Cascadia Subduction Zone that will fragment major highways by damaging and destroying bridges, triggering landslides that obstruct and/or undermine roadways, other geological hazards such as soil liquefaction and the potential for tsunami that could overwhelm low-lying transportation facilities. Significant loss of life is likely in tsunami prone areas. Additional loss of life from untreated injuries and disease due to a fragmented response network could also be significant. Loss of life due to structural collapse could be widespread, exacerbated by the duration of ground shaking and the size of the event at the coast, in the Coast Range, along the Lower Columbia, in the Metro area and in the central valleys. The long term economic impacts would be profound. Many buildings – residential, commercial, and industrial – would collapse or suffer significant damage. Supply lines for reconstruction materials would be disrupted and the transportation system capacity to move goods is likely to be usurped for a period of weeks for response/survival supplies and materials and personnel needed to re-establish essential services. The ability of employees and customers to get to businesses could be disrupted for weeks if not longer. Smaller and locally based businesses cannot typically survive long periods of closure. A program to immediately (within the next few years) retrofit all seismic lifeline routes in western Oregon to current design standards is not possible with current budget limitations. Even if the State were able to embark on a program of rapid seismic strengthening of the entire highway system, let alone other regional and private transportation assets, it would be prudent to begin where the most benefit is accomplished in the least time for the least cost. That is a key premise of the development of the OSLR project and the Seismic Options Report that was, in part, based upon it.
2015 DRAFT NHMP, Risk Assessment, State Vulnerabilty, v03, 08/01/2014 230
Statewide Loss Estimates
The OSLR project includes consideration of the costs of retrofitting bridges and other highway facilities to support the tiering decisions and a preliminary work for revenue requests for implementation. Cost estimates were made for construction projects to mitigate or correct vulnerabilities on the recommended Seismic Lifelines system. Details can be found in Appendix E of the Seismic Options Report developed by ODOT staff to brief executive staff and OTC. Appendix F of that report considers the Estimated Economic Impact Due to Failure of Transportation Infrastructure. This analysis was done to answer a slightly different question: what is the value of making the recommended improvements to the identified lifeline routes?
“This analysis evaluated four alternative scenarios in order to gain a sense of the potential loss in production activity we could expect due to the damage to the transportation system after a major seismic event. Four scenarios representing seismic preparation and repair demonstrate the value added (impacts avoided) to the Oregon economy. Significant economic losses in production activity can be avoided by preparing for a major earthquake ahead of time. With no preparation ahead of time, Oregon could lose up to $355 billion in gross state product in the 8 to 10 year period after the event. Proactive investment in bridge strengthening and landslide mitigation reduces this loss between 10% and 24% over the course of the eight years simulated for this analysis.”
It is important to note that the losses considered in the economic analysis only considered impacts directly related to transportation system failures. It did not account for impacts outside of the transportation economic impacts such as the collapse of industrial or commercial buildings or basic service failures. Even so, the benefit to cost ratio of making needed improvements to the Seismic Lifelines system is 46:1. Figure 2-V-LL-4 shows seismic vulnerability of proposed lifeline routes relative to projected ground shaking form a CSZ event. Figure 2-V-LL-5 shows bridges in tsunami zones. These are the most significant vulnerabilities of the state highway system.
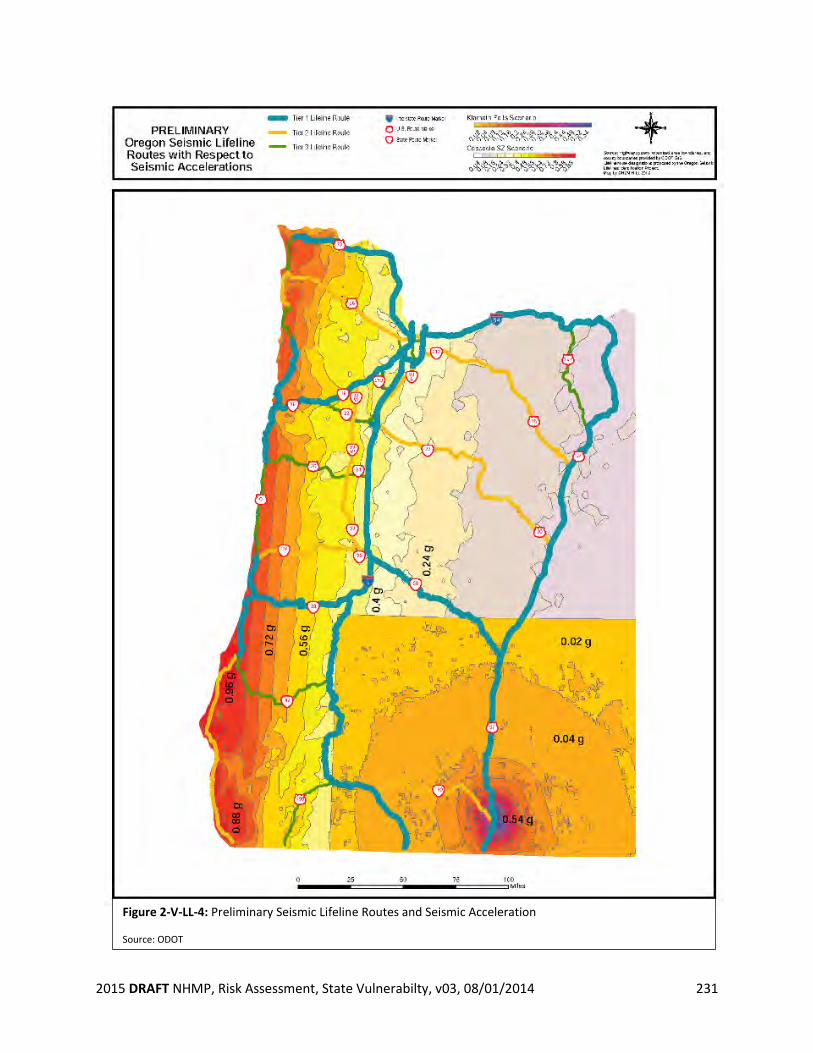
2015 DRAFT NHMP, Risk Assessment, State Vulnerabilty, v03, 08/01/2014 231
Figure 2-V-LL-4: Preliminary Seismic Lifeline Routes and Seismic Acceleration Source: ODOT
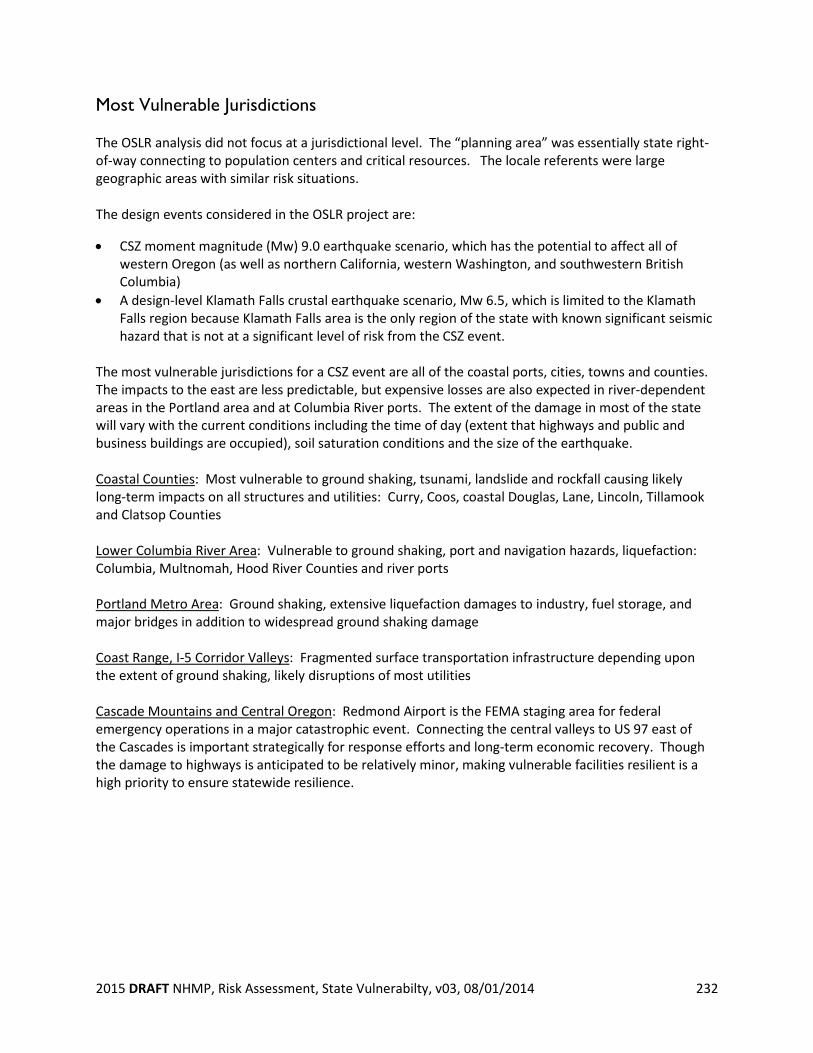
2015 DRAFT NHMP, Risk Assessment, State Vulnerabilty, v03, 08/01/2014 232
Most Vulnerable Jurisdictions
The OSLR analysis did not focus at a jurisdictional level. The “planning area” was essentially state right-of-way connecting to population centers and critical resources. The locale referents were large geographic areas with similar risk situations. The design events considered in the OSLR project are:
• CSZ moment magnitude (Mw) 9.0 earthquake scenario, which has the potential to affect all of western Oregon (as well as northern California, western Washington, and southwestern British Columbia)
• A design-level Klamath Falls crustal earthquake scenario, Mw 6.5, which is limited to the Klamath Falls region because Klamath Falls area is the only region of the state with known significant seismic hazard that is not at a significant level of risk from the CSZ event.
The most vulnerable jurisdictions for a CSZ event are all of the coastal ports, cities, towns and counties. The impacts to the east are less predictable, but expensive losses are also expected in river-dependent areas in the Portland area and at Columbia River ports. The extent of the damage in most of the state will vary with the current conditions including the time of day (extent that highways and public and business buildings are occupied), soil saturation conditions and the size of the earthquake. Coastal Counties: Most vulnerable to ground shaking, tsunami, landslide and rockfall causing likely long-term impacts on all structures and utilities: Curry, Coos, coastal Douglas, Lane, Lincoln, Tillamook and Clatsop Counties Lower Columbia River Area: Vulnerable to ground shaking, port and navigation hazards, liquefaction: Columbia, Multnomah, Hood River Counties and river ports Portland Metro Area: Ground shaking, extensive liquefaction damages to industry, fuel storage, and major bridges in addition to widespread ground shaking damage Coast Range, I-5 Corridor Valleys: Fragmented surface transportation infrastructure depending upon the extent of ground shaking, likely disruptions of most utilities Cascade Mountains and Central Oregon: Redmond Airport is the FEMA staging area for federal emergency operations in a major catastrophic event. Connecting the central valleys to US 97 east of the Cascades is important strategically for response efforts and long-term economic recovery. Though the damage to highways is anticipated to be relatively minor, making vulnerable facilities resilient is a high priority to ensure statewide resilience.
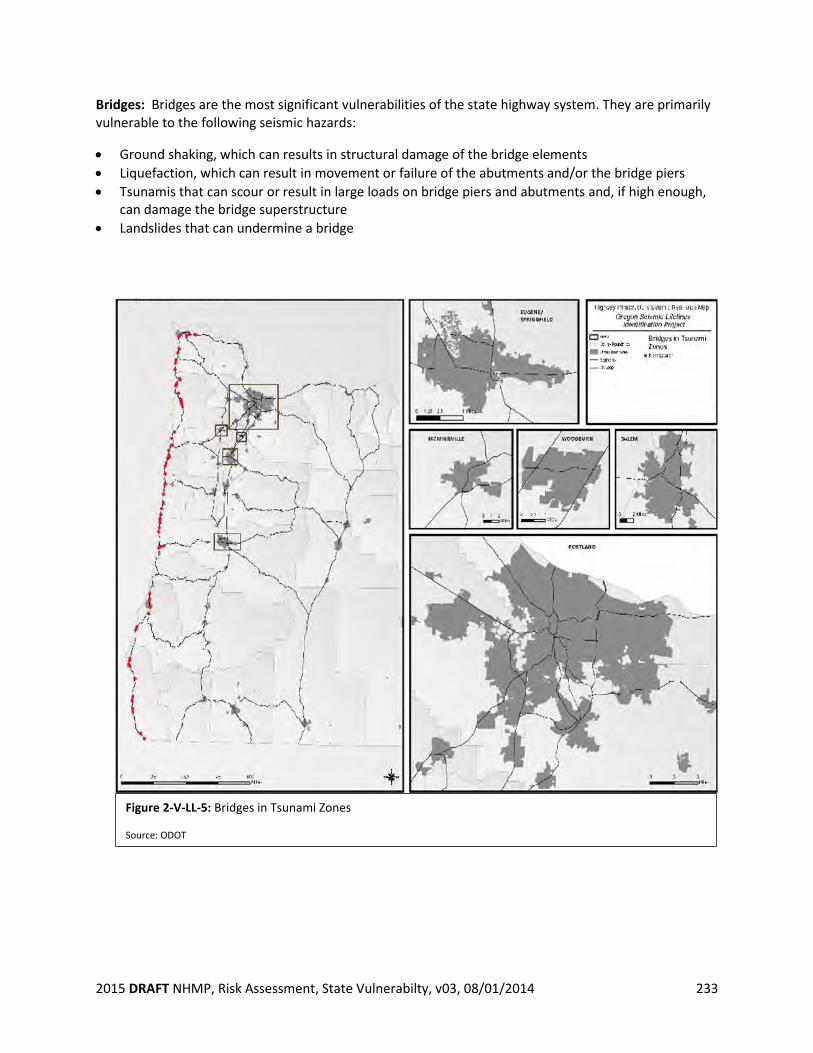
2015 DRAFT NHMP, Risk Assessment, State Vulnerabilty, v03, 08/01/2014 233
Bridges: Bridges are the most significant vulnerabilities of the state highway system. They are primarily vulnerable to the following seismic hazards:
• Ground shaking, which can results in structural damage of the bridge elements • Liquefaction, which can result in movement or failure of the abutments and/or the bridge piers • Tsunamis that can scour or result in large loads on bridge piers and abutments and, if high enough,
can damage the bridge superstructure • Landslides that can undermine a bridge
Figure 2-V-LL-5: Bridges in Tsunami Zones Source: ODOT
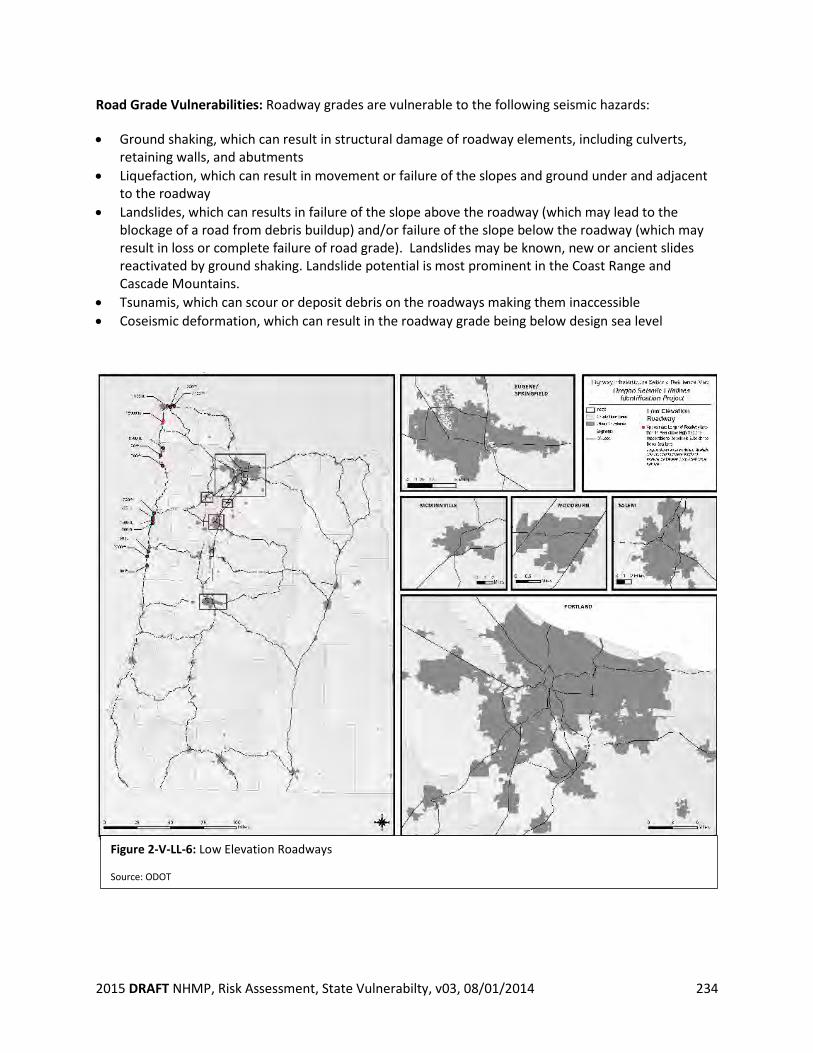
2015 DRAFT NHMP, Risk Assessment, State Vulnerabilty, v03, 08/01/2014 234
Road Grade Vulnerabilities: Roadway grades are vulnerable to the following seismic hazards:
• Ground shaking, which can result in structural damage of roadway elements, including culverts, retaining walls, and abutments
• Liquefaction, which can result in movement or failure of the slopes and ground under and adjacent to the roadway
• Landslides, which can results in failure of the slope above the roadway (which may lead to the blockage of a road from debris buildup) and/or failure of the slope below the roadway (which may result in loss or complete failure of road grade). Landslides may be known, new or ancient slides reactivated by ground shaking. Landslide potential is most prominent in the Coast Range and Cascade Mountains.
• Tsunamis, which can scour or deposit debris on the roadways making them inaccessible • Coseismic deformation, which can result in the roadway grade being below design sea level
Figure 2-V-LL-6: Low Elevation Roadways Source: ODOT
2015 DRAFT NHMP, Risk Assessment, State Vulnerabilty, v03, 08/01/2014 235
Tunnels: Tunnels generally perform well in seismic events; however, some amount of rock fall and structural damage is likely, particularly at portals. The length of tunnels along each segment was tabulated.
Figure 2-V-LL-7: Tunnels Source: ODOT
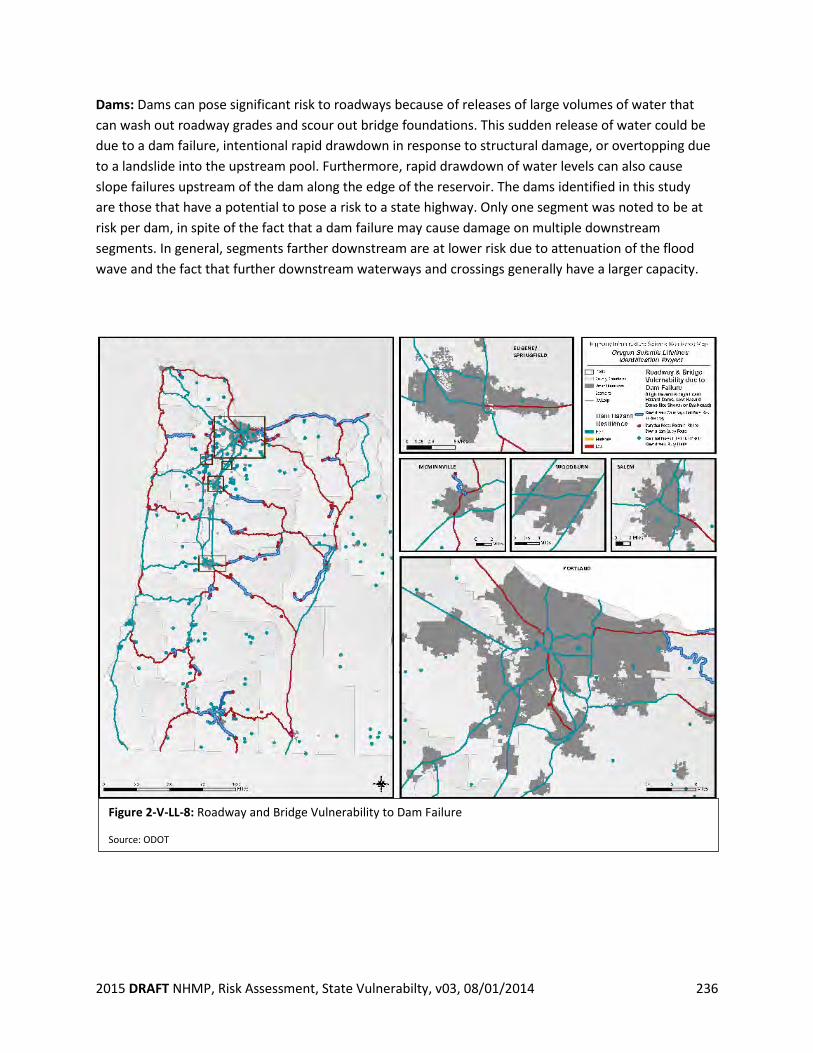
2015 DRAFT NHMP, Risk Assessment, State Vulnerabilty, v03, 08/01/2014 236
Dams: Dams can pose significant risk to roadways because of releases of large volumes of water that can wash out roadway grades and scour out bridge foundations. This sudden release of water could be due to a dam failure, intentional rapid drawdown in response to structural damage, or overtopping due to a landslide into the upstream pool. Furthermore, rapid drawdown of water levels can also cause slope failures upstream of the dam along the edge of the reservoir. The dams identified in this study are those that have a potential to pose a risk to a state highway. Only one segment was noted to be at risk per dam, in spite of the fact that a dam failure may cause damage on multiple downstream segments. In general, segments farther downstream are at lower risk due to attenuation of the flood wave and the fact that further downstream waterways and crossings generally have a larger capacity.
Figure 2-V-LL-8: Roadway and Bridge Vulnerability to Dam Failure Source: ODOT
2015 DRAFT NHMP, Risk Assessment, State Vulnerabilty, v03, 08/01/2014 237
Data
The main sources of data used to analyze the seismic vulnerability of each highway segment include:
• ODOT GIS Database. • DOGAMI References. • U.S. Geological Survey (USGS) Seismic Hazard References. • Risks from Earthquake Damage to Roadway Systems (REDARS2) Data. • DOGAMI and the Federal Emergency Management Agency evaluations of the potential impacts
of a major seismic event in Oregon, • Local knowledge of CH2M HILL staff who have lived and worked in these regions • Interviews with key maintenance and technical staff at ODOT • Interviews of technical and field staff at DOGAMI • Public mapping databases, including aerial photographs, digital terrain models (DTMs), and
transportation GIS databases
Data Limitations
The goal of the seismic vulnerability assessment was to use the best available data to make informed and rational seismic lifelines route decisions at the current time. A complete and thorough engineering evaluation would require a much larger project and longer timeframe than is currently prudent. However, the available data is believed to have been judiciously used to enable the development of reasonable criteria and procedures for selecting a backbone system of seismic lifeline routes that will meet ODOT’s needs. During the last 15 years ODOT Bridge Section has compiled statewide hazard and vulnerability data including data on bridge seismic vulnerabilities and existing landslides, while other state and federal agencies have compiled geographic and other data defining seismic risks including predicted tsunami inundation zones. That work is the foundation of this study. Most of the earlier studies have been either comprehensive (statewide) but imprecise, or precise but not comprehensive. Some statewide information used in the OSLR analysis (for example, the landslide data) was compiled from various sources and is based on varied data-gathering technologies and data-evaluation methods. Therefore, the data are highly variable and are not precise or consistent as a whole. Some older statewide or region-wide data were used in this project in place of more recent site-specific information to provide a platform to make relative comparisons (rather than absolute measures) of seismic risks along various candidate lifeline routes.
2015 DRAFT NHMP, Risk Assessment, State Vulnerabilty, v03, 08/01/2014 238
Recommended Next Steps This report provides ODOT with guidance about which roadways are most important for response and recovery following a major earthquake and which roadways are most easily prepared for, and repaired after, a major seismic event. Tier 1 lifeline routes are the most critical highways identified to provide statewide coverage; Tiers 2 and 3 lifeline routes would increase the usability of the system and add access to other areas. The Tier 1 routes have been divided into two phases for planning purposes. Phase one engineering and site evaluations are under way. The next steps in the process of planning for a seismic event are to do engineering and site evaluations of the recommended routes to inform prioritizing specific mitigation and retrofit projects on these lifelines. Although this study has provided comparative results for seismic vulnerability on roadways, it does not provide sufficient detail to actually prioritize bridge and roadway seismic retrofits on a given highway facility. The engineering and site evaluations will determine the actual needs for and costs of bridge and roadway seismic retrofit projects. Identifying funding and implementing seismic lifelines priorities will be an ongoing part of the Highway Division’s work for many years to come. The OSLR enables an approach that can be expedited or done incrementally over time. The Seismic Options Report addresses general questions about the kinds of work that need to be done and the economic value of doing that work. It is the intent of this combined effort to position the state to develop an increasingly resilient highway system in an efficient and strategic manner.
2015 DRAFT NHMP, Risk Assessment, State Vulnerabilty, v03, 08/01/2014 239
Future Enhancements to the State Risk Assessment
Climate Change
<Place holder for Climate Change Enhancements in next Plan update>
2015 DRAFT NHMP, Risk Assessment, State Vulnerabilty, v03, 08/01/2014 240
New Risk Assessment Methodology
During the 2012 Oregon NHMP update process it was realized by the state that no standardized statewide risk assessment methodology is being used across all hazards— each hazard lead uses a different method to assess risk. This is due in part to the fact that “many state agencies do not have the tools and/or resources to conduct a full risk assessment. Likewise, most agencies do not maintain existing statewide risk assessment data” as identified in Task 5 of the Mid-Planning Alterations to the 2012 work plan. In response, the state allocated remaining federal funds from DR-1733 to support initial stages of the development of a standardized risk assessment model. Beginning in March 2013, Oregon’s Interagency Hazard Mitigation Team (IHMT) established a Risk Assessment Sub-Committee (RAS-C) that worked in partnership with faculty and staff from the University of Oregon’s Department of Geography, InfoGraphics’s Lab and Oregon Partnership for Disaster Resilience (OPDR) to develop a new risk assessment model concept. When fully developed and implemented, the model will provide a standardized way to assess vulnerability to natural hazards in Oregon thereby allowing the state to better identify where to strategically target mitigation resources. This initiative was facilitated by the Department of Land Conservation and Development (DLCD). The RAS-C convened a total of five times from March to August to develop a risk assessment methodology that 1) meets federal requirements, 2) draws from the strengths of existing methods and 3) addresses Oregon’s unique priorities. The committee took a four-pronged approach to developing a new risk assessment model. Phase One involved the review of natural hazard risk assessment methodologies found in academic literature and in other SNHMPs. In Phase Two, the UO team developed a proposed risk assessment model concept drawing from the strongest elements of the literature review and other research. While this phase focused heavily on adapting Susan Cutter’s Social Vulnerability Index (SoVI), a key driver was the development of a framework tailored toward Oregon that could address key shortcomings identified in Cutter and other models. In addition, the model incorporates state priorities identified by the RAS-C. Phase Three involved testing the feasibility of the proposed model. Finally, in Phase Four, the UO team developed a timeline, work plan and budget in an effort to identify the resources needed to fully develop the risk assessment model and interface. The proposed three-year budget is roughly $600,000, which includes UO staff and resources. This budget does not consider state time and resource needs, including, but not limited to, a high level of interagency collaboration to identify and classify hazard and vulnerability data, testing, and implementing the model. Notably, state resource needs will ultimately have to be identified and supported through funding and technical support to fully realize this model. At this time, further development of the new model is pending funding. The RAS-C continues to meet to discuss potential funding opportunities. Due to the considerable amount of funding and other resources needed to fully develop and implement the new risk assessment methodology, it is likely that its development will take place in phases over the course of the next few iterations of the Oregon NHMP. At the time this Plan was written, the following grant proposal that would support the development and testing of the social vulnerability and flood hazard elements of the new model has been submitted and is awaiting funding announcements.
2015 DRAFT NHMP, Risk Assessment, State Vulnerabilty, v03, 08/01/2014 241
Oregon’s Social Vulnerability to Climate-driven Hazards
One step toward developing the new risk assessment model would be the implementation of the Oregon Social Vulnerability to Climate-driven Hazards Project. Three state agencies – the Oregon Health Authority (OHA), the Department of Geology and Mineral Industries (DOGAMI), and the Department of Land Conservation and Development (DLCD) – and the University of Oregon will collaborate to complete this work. This project will combine social vulnerability data, climate data, and natural hazard data to produce a decision support tool identifying risks to vulnerable populations and future flooding hazards. This partnership will 1) develop and refine an index of social vulnerability to climate change at the census-tract level, 2) develop a new climate-induced flood hazard data layer for one pilot watershed, and 3) combine the two data sets to analyze vulnerability to flooding. The information developed in this project will be used to inform the update of a Local Natural Hazard Mitigation Plan (LNHMP) in the pilot watershed. Furthermore, the Oregon refined index of social vulnerability (at the census tract level) developed in this project will be used to further develop and test the social vulnerability element of the state’s new risk assessment model. Testing the new risk assessment model will provide the state with a better understanding of the inter-agency data sharing and collaboration resources needed to fully realize the new model. This project is pending funding from a National Oceanic and Atmospheric Administration (NOAA) - Climate Program Office (CPO) - Climate and Societal Interactions (CSI) - Sectoral Applications Research Program (SARP): Climate Extreme Event Preparedness, Planning, and Adaptation grant. Grantee announcement are scheduled for Spring 2014. Pending NOAA funding, this project is projected to be implemented August 1st, 2014 - July 31, 2016.
2015 DRAFT NHMP, Risk Assessment, State Vulnerabilty, v03, 08/01/2014 242
Cultural Resources
<Place holder for Cultural Resources Enhancements in next Plan update>