Embed Size (px)
Citation preview

31 DALGLEISH STREET, THEBARTON, SA AUSTRALIA, 5031 WWW.BIONOMICS.COM.AU ABN 53 075 582 740
2015 BIONOMICS ANNUAL REPORT
For
per
sona
l use
onl
y

BIONOMICS IS DISCOVERING AND DEVELOPING INNOVATIVE THERAPEUTICS FOR SERIOUS MEDICAL CONDITIONS, WORKING WITH PARTNERS TO ACHIEVE SIGNIFICANT OUTCOMES FOR PATIENTS, SHAREHOLDERS AND EMPLOYEESBionomics is a leader in the discovery and development of innovative biopharmaceuticals with operations in Australia, Europe and US.
The Company undertakes discovery, development and strategic partnering of first in class and best in class drugs to treat patients with serious medical conditions including cancer and central nervous system disorders.
Bionomics utilizes key global, strategic partnerships for the commercialisation of its drugs.
PAGE 1 VISION
PAGE 2 HIGHLIGHTS
PAGE 3 CHAIRMAN’S LETTER
PAGE 4CEO AND MANAGING DIRECTOR’S REPORT
PAGE 9 PIPELINE
PAGE 13INTELLECTUAL PROPERTY PORTFOLIO
PAGE 14 BOARD OF DIRECTORS
PAGE 16 MANAGEMENT
PAGE 18 DIRECTOR’S REPORT
PAGE 34ANNUAL FINANCIAL STATEMENTS
PAGE 81 INDEPENDENT AUDIT REPORT
PAGE 83 SHAREHOLDER INFORMATION
CONTENTS
PAGE 85 COMPANY PARTICULARS
For
per
sona
l use
onl
y

2HIGHLIGHTS
BIONOMICS WAS PROMINENT IN PRESENTING AT A NUMBER OF LEADING INTERNATIONAL CANCER CONFERENCES
n �BNC105 Phase 2 renal cancer biomarker data presented at the European Society for Medical Oncology Congress in Spain
n �Cumulative biomarker data across all BNC105 clinical trials presented at AACR
n �Data presented at AACR demonstrated that BNC420, a novel small molecule inhibitor of VEGFR3, significantly outperforms sunitinib in inhibiting tumour metastasis in a mouse model of melanoma
MERCK PARTNERSHIPS
SECOND BIONOMICS MERCK-SYMPOSIUM NOVEMBER 2014
n �International and Australian developments in pain and migraine research
n �Third Bionomics-Merck Symposium to be held on 16 November 2015 “Addressing Alzheimer’s Disease and Cognition” with keynote speaker Dr Darryle Schoepp, VP & Therapeutic Area Head, Neuroscience, Merck & Co
BNC210: A NEXT GENERATION TREATMENT FOR ANXIETY AND DEPRESSION
PHASE 2 BNC210 TRIAL COMMENCED IN PATIENTS WITH GENERALISED ANXIETY DISORDER
n �Double-blinded, placebo controlled trial evaluating changes in emotional control and defensive and risk-taking behaviours
n �Data anticipated in Q3, 2016
PHASE 1 MULTIPLE ASCENDING DOSE TRIAL REPORTED POSITIVE RESULTS
n �All primary and secondary endpoints met
n �BNC210 reduced the effect of nicotine consistent with its mechanism of action
n �Supports further development of BNC210 in other types of anxiety and in depression
US$10 MILLION SILICON VALLEY BANK FUNDING SECURED FOR BNC210 DEVELOPMENT
n �Enabled rapid transition to Phase 2
BNC101: LRG5 INHIBITOR TARGETING CANCER STEM CELLS IN SOLID TUMOURS
n �Completion of GMP manufacture and IND-enabling studies
n �Successfully passed IND review
n �Two posters were presented at American Association for Cancer Research (AACR) 105th Annual Meeting in Philadelphia further supporting biomarker-driven clinical development of BNC101 in pancreatic cancer and colorectal cancer.
n �BNC101 data presented at the 26th EORTC-NCI-AACR Symposium on Molecular Targets and Cancer Therapeutics in Barcelona showed preclinical activity of BNC101 in primary lung cancer and triple negative breast cancer models.
PRESTWICK ACQUISITION
n �Premium provider of medicinal chemistry services and smart screening libraries with “bluechip” customers
n �Strengthened our MultiCore technology platform to rapidly identify novel drug candidates
For
per
sona
l use
onl
y

CHAIRMAN’S REPORT3
DEAR SHAREHOLDERS
As a mature biotechnology company Bionomics understands its strengths in drug discovery and development.
Our mission is to generate novel, best in class drug candidates which fill the needs of patients with Central Nervous System (CNS) disorders and patients with cancer.
2015 has seen Bionomics take up the continued development of BNC210, moving this drug candidate for the treatment of anxiety and depression into two clinical trials including a Phase 2 clinical trial in patients with Generalized Anxiety Disorder. US$10 million in non-dilutive funding from Silicon Valley Bank has supported this continuing clinical program. Your Company has also prepared BNC101, the first of our drug candidates targeting cancer stem cells, for a clinical trial which is anticipated to commence later this year. This development is particularly pleasing as it represents progress in an important asset from our 2012 acquisition of Biogen spin-out Eclipse Therapeutics, Inc.
Bionomics has continued to focus on its two major partnerships with Merck & Co on programs targeting new treatments for pain and conditions such as ADHD, Alzheimer’s Disease, Schizophrenia and Parkinson’s Disease. The combined value of these deals represents potentially US$678 million in upfront payments, option fees and milestone payments in addition to potential future royalty payments for successfully developed products. These agreements represent clear validation of the Company’s ionX and MultiCore platform technologies. We are delighted that our Annual Symposium with Merck continues to go from strength to strength, attracting cutting edge presentations from world renowned international and Australian researchers and clinicians from both academia and industry, with a rapidly growing global attendance.
In October 2014 Bionomics acquired the assets of Prestwick Chemical, a company which has played a critical role in the development of our cognition and pain programs. The acquisition of Prestwick has enabled us to expand our MultiCore chemistry technology and strengthen our footprint in a key strategic market.
Bionomics is in a strong cash position to develop and build its portfolio of promising drug candidates and to establish agreements that will drive recurrent revenue into the future. We remain focused on leveraging our proprietary platform technologies to develop and commercialise novel, best-in-class drugs for the treatment of CNS disorders and cancer. We continue to evaluate strategic partnerships and collaborations to maximize value, with three programs in our pipeline, including BNC105, targeted for partnership.
We are fortunate to have one of the most experienced and dedicated teams in the sector. In line with our expanded global operations, our strategic partnerships and our clinical stage development programs Bionomics has been delighted to welcome Dr Jens Mikkelsen as our Chief Scientific Officer, Mr Jack Moschakis as our Legal Counsel & Company Secretary and Mr Tony Colasin as our Chief Business Officer to the Bionomics team. Each brings considerable global experience to their respective roles and strengthens the team for the next phase of the Company’s growth. Mr Colasin is based at our US research facility in San Diego, whilst Dr Mikkelsen, who has moved from Denmark to take up his appointment, and Mr Moschakis are both based in Adelaide, South Australia.
I am excited by Bionomics’ future and I acknowledge the support of all shareholders which has been so important for the Company. Thank you. Finally I’d like to thank my fellow Directors, our CEO & Managing Director Deborah Rathjen and the entire Bionomics team for their efforts during 2015.
GRAEME KAUFMAN CHAIRMAN
For
per
sona
l use
onl
y

CEO & MANAGING DIRECTOR’S REPORT 4
DEAR SHAREHOLDERS
Bionomics is dedicated to discovering and developing better treatments for disorders of the Central Nervous System (CNS) and for the treatment of cancer. We are a global, clinical-stage biopharmaceutical company with a deep pipeline of best in class, novel drug candidates discovered using our proprietary technology platforms – ionX, MultiCore and CSCRx.
n PLATFORM TECHNOLOGIES DRIVE THE DISCOVERY AND DEVELOPMENT OF BEST IN CLASS DRUG CANDIDATES FOR DEVELOPMENT AND STRATEGIC PARTNERINGOur ionX and MultiCore platforms are validated through the continuing development of BNC210 as a treatment for anxiety and depression as well as our two partnerships with Merck & Co in cognition and pain. Our partnerships with Merck signed in 2013 and 2014 have a combined potential value of up to US$678 million in upfront and research payments, option fees and milestone payments with additional potential royalties on product sales. In FY 2015 Bionomics received US$20 million in upfront payments from Merck.
nMERCK PARTNERSHIPS AND THE BIONOMICS - MERCK ANNUAL SYMPOSIUMAs an outward sign of the strength of Bionomics partnerships with Merck, in November 2014 Merck and Bionomics hosted a special Symposium at the Crowne Plaza Hotel in Adelaide. This was the second Bionomics-Merck Symposium and attracted approximately 200 attendees. Speakers at the Symposium included renowned Australian and international researchers from the field of pain research and focused on the clinical aspects of pain and migraine, novel targets for pain therapeutics and drug discovery. Planning is already advanced for the third annual Symposium to be held on 16 November 2015 which will focus on cognition. Our keynote speaker will be Dr Darryle Schoepp, VP & Therapeutic Area Head, Neuroscience, Merck & Co.
A diversity orientated chemistry platform for the discovery of small molecule drugs.
Computer aided pharmacophore modelling.
Scaffold hopping synthetic appoaches rapidly create diversity
in small, focussed libraries.
Parallel, differentiated chemical series of potential drug candidates.
Identifies drug candidates targeting bith ligand gated and voltage gated ion channels for CNS indications.
Proprietary cell lines and screening approaches.
Comprehensive in vivo models validate target biology.
Identifies drug candidates that inhibit the growth of cancer stem cells.
Enables dissection and validation of target biology.
Proprietary in vitro assays combined with in vivo assays.
ionX
MultiCore
CSCRx
For
per
sona
l use
onl
y

CEO & MANAGING DIRECTOR’S REPORT5
During the reporting period BNC210 was rapidly progressed into a Phase 2 clinical trial in patients with Generalized Anxiety Disorder or GAD. The double-blinded, placebo–controlled trial is being conducted in 24 patients with untreated GAD. This clinical trial will image changes in the brain’s emotional centre, the amygdala, using functional magnetic resonance imaging or fMRI. The endpoints of the clinical trial are focussed on the capacity of BNC210 to engage brain systems relevant to anxiety including emotional control and defensive and risk taking behaviours. The study is being conducted at The Institute of Psychiatry, Psychology & Neuroscience, King’s College, London. We anticipate that data will be available from the trial in Q3, 2016.
BNC210 has also been evaluated in a Phase 1B multiple ascending dose trial in which 54 healthy subjects were dosed twice daily for eight consecutive days. All primary and secondary endpoints of the trial were met. BNC210 was safe and well tolerated. Importantly there were no adverse effects on cognition or emotional stability and no abuse potential indicated. The demonstration that BNC210 reduces nicotine - dependent changes, as measured by EEG, provides valuable evidence of target engagement and strongly supports further development of BNC210 in other types of anxiety and in depression over an extended period and is supported by 90 day toxicology studies.
In November 2014 Bionomics secured US$10 million project-specific non-dilutive financing from Silicon Valley Bank to fund these two clinical trials of BNC210. We were very pleased to secure this important funding which allowed us to rapidly move BNC210 into a Phase 2 clinical trial. Silicon Valley Bank has over US$33 billion in assets and 34 locations worldwide. Forbes Magazine rates it amongst Americas Best Banks (2013).
We are very excited by the potential of BNC210. BNC210 is an orally-administered, novel, proprietary negative allosteric modulator of the alpha-7 nicotinic acetylcholine receptor, or the α7 receptor. We believe that negative allosteric modulation of the α7 receptor provides an attractive therapeutic target for the treatment of anxiety and depression which has yet to be fully explored and in which Bionomics has developed significant, new insights. As an allosteric modulator BNC210
only works when it is needed. High levels of the neurotransmitter Acetylcholine, or ACh, which causes rapid activation of the α7 receptor have been linked to symptoms of anxiety and depression. We believe that the α7 receptor is a key driver of emotional responses and modulation of the α7 receptor in the amygdala may reduce anxiety and depression. The proposed mechanism of action of BNC210 is depicted in the diagram on the next page.
Clinical trials have shown that BNC210 is safe and well tolerated. BNC210 administration to healthy subjects does not impair cognitive performance, cause sedation or impair motor co-ordination. BNC210 has shown evidence of brain activity via EEG which is consistent with anxiolytic activity in the absence of sedation. BNC210 in a CCK4 challenge model significantly reduced both the number of panic symptoms and intensity of panic symptoms. BNC210 administration was also associated with more rapid return to normal emotional stability compared to placebo. As noted above, we recently reported that BNC210 significantly reduced the effects of nicotine as measured by EEG, providing evidence of target engagement.
n BNC210: A NEXT GENERATION TREATMENT FOR ANXIETY AND DEPRESSION PROGRESSED TO PHASE 2
“Clinical trials have shown that BNC210 is
safe and well tolerated”
To date BNC210 has been evaluated in six completed clinical trials and 190 subjects. Based on these clinical trials and additional preclinical data, we believe BNC210 has the following important advantages over many existing treatments for anxiety and depression:
190 SUBJECTS TESTEDn lack of sedation;n rapid action;n no impairment of attention, memory or
motor coordination; andn no potential for addiction or the
development of tolerance.
For
per
sona
l use
onl
y

6
If successfully developed, BNC210 could represent a significant advance in the treatment of anxiety and depression with the potential to overcome unmet needs for patients which have existed for decades with current treatments. Anxiety is a condition which places a considerable burden on our society. For example, approximately 14.4% of the Australian population is affected by anxiety. Approximately 40 million people suffer from anxiety disorders in the United States and patients with anxiety can have one or more anxiety disorders. There are six broad categories of anxiety disorders: GAD, post-traumatic stress disorder, panic disorder, social anxiety disorder, obsessive compulsive disorder and phobias. The anxiety market is projected to reach US$18.2 billion by 2020. There are a number of drugs used to treat anxiety with the mainstay being benzodiazepines. GAD is commonly treated
with antidepressants that enhance either serotonin or norepinephrine. The key limitations with these antidepressants are a modest efficacy and late onset of action, discontinuation syndrome, changes in weight, sexual dysfunction and suicide ideation in adolescents, while benzodiazepines such as Valium display side-effects such as sedation, addiction, tolerance and cognitive disturbances, and are therefore not recommended for long-term treatment despite short-term efficacy. Anxiety and depression often have overlapping symptoms with over 40% of patients diagnosed with depression also suffering from a diagnosed anxiety disorder. An estimated 18.2 million people in the US suffer from depression and in 2012 alone the top 10 antidepressants recorded sales of US$8.8 billion. Clearly, BNC210 has tremendous market potential if successfully developed.
BNC210 ACTION DEPENDS ON ACh NEUROTRANSMISSION AND THE DISEASE STATE
NORMAL ANXIETY AND DEPRESSION
AMYGDALA AMYGDALA BNC210
BNC210
α7 RECEPTOR α7 RECEPTOR
Ca2+ Ca2+
“BNC210 has tremendous market potential if successfully developed”
For
per
sona
l use
onl
y

CEO & MANAGING DIRECTOR’S REPORT7
With the acquisition of Biogen spin-out Eclipse Therapeutics in 2012, Bionomics made the strategic decision to focus its cancer drug discovery and development efforts on targeting cancer stem cells. Many current cancer drugs do not specifically target cancer stem cells, a deficiency which may lead to tumour recurrence and metastasis. Cancer stem cells are cancer cells that possess cellular characteristics associated with normal stem cells. Such stem cells have the potential to differentiate to all cell types found in a tumour. Cancer stem cells can therefore generate tumours through self-renewal and differentiation into multiple cancer cell types. We believe that specific drugs targeting cancer stem cells will reduce the risk of tumour metastasis and recurrence.
BNC101 is a first-in-class, high affinity anti-LGR5 humanized monoclonal antibody targeting cancer stem cells. During the year Bionomics progressed BNC101 towards a clinical trial. Investigational New Drug (IND) enabling studies and GMP manufacture are now complete and an IND application has successfully passed review by the US FDA. We are working towards initiation of the Phase 1 clinical trial which will enrol patients with colorectal cancer and also patients with pancreatic cancer.
Based on our preclinical studies, reported at international cancer conferences in 2015, BNC101 prevents or delays tumour recurrence and reduces cancer stem cells in metastatic colorectal, pancreatic, triple-negative breast and small cell lung cancers. BNC101 also reduces circulating tumour cells that express LGR5.
n BNC101: THE FIRST OF BIONOMICS CANCER TREATMENTS TO TARGET CANCER STEM CELLS POISED FOR CLINICAL TRIALS
BULK TUMOUR CELLS
CANCER STEM CELLS CSC
CANCER STEM CELL THERAPY
TUMOUR REGRESSION
CONVENTIONAL CANCER THERAPY
TUMOUR RELAPSE
CSC
CSC
BIONOMICS APPROACH TO
TARGETING CANCER STEM
CELLS
Bionomics’ CSCRx platform can identify drugs that target cancer stem cells
�n�CSC have the potential to differentiate into all cell types within a tumor.
�n�Many drugs do not specifically target CSC leading to tumor recurrence and metastasis.
Wnt signaling has been implicated in proliferation and survival of CSC.
LGR5 is a receptor that modulates Wnt signaling in CSCs.
For
per
sona
l use
onl
y

8
There exists unmet need in the treatment of both metastatic colorectal and metastatic pancreatic cancers. The global market for metastatic colorectal cancer treatments has been predicted to grow to $9.4 billion by 2020. In 2014, there were approximately 136,000 new cases of metastatic colorectal cancer in the United States. Currently, five year survival for first-line metastatic colorectal cancer treatments is approximately 11% with median overall survival for metastatic colorectal cancer approximately 12-13 months in second-line treatment. LGR5 expression has been correlated with poor patient response or survival in metastatic colorectal cancer. The global metastatic pancreatic cancer drug market is estimated to be $1.2 billion in 2015. In 2014, there were approximately 46,420 new cases of metastatic pancreatic cancer in the United States. For pancreatic cancer patients overall, the five-year survival rate is approximately 4% for all stages combined and only 1.6% for patients with metastatic pancreatic cancer. The median current overall survival for metastatic pancreatic cancer patients in first-line treatment is approximately 8-11 months.
BNC101 SHOWS ANTI-TUMOR ACTIVITY
“There exists unmet need in the treatment of both metastatic colorectal and metastatic
pancreatic cancers.”
CT3 LDA Tumor Growth
Tum
or V
olum
e (m
m3 )
BNC101 FOLFIRI
Individual Tumors at Day 68
CANCER STEM CELL RECURRENCE ASSAY
DAY FOLFIRI
Mean Tumor Volumes
Tum
or V
olum
e (m
m3 )
Individual Tumors at Day 105
All Gem, nab-pacIsotype Control AntibodyIgG1 Gem, nab-pacBNC101, Gem, nab-pac
Nab-paclitaxel is also known as Abraxane
Last Chemo Complete
Tumor Regression
Gem/nab-pac Gem/nab-pac + Antibody Antibody
DAY Gem/nab-pac Gem/nab-pac/BNC101
COLORECTAL CANCER: PRECLINICAL ACTIVITY
PANCREATIC CANCER: PRECLINICAL ACTIVITY
For
per
sona
l use
onl
y

CEO & MANAGING DIRECTOR’S REPORT9
PLATFORM TECHNOLOGIES DELIVER MULTI-PRODUCT PIPELINEOur strengths, and a differentiating feature for Bionomics amongst Australian biotechnology companies, lie in the depth and breadth of our pipeline where a number of proprietary, drug candidates are being positioned for development and for selective partnering. These drug candidates are being investigated by our passionate, world-class research teams.
OTHER PROGRAMSBNC105 Solid tumors, renal, ovarian, mesothelioma
BNC420 Solid tumors, melanoma, breast
BNC164 Psoriasis, uveitis
CANCER STEM CELLS (CSCRx)
BNC101 Colorectal cancer
Pancreatic cancer
Other solid tumors
CANCER STEM CELLS (CSCRx and MultiCore)
MELK Solid tumors
OTHERS Solid tumors
DRUG CANDIDATE
CENTRAL NERVOUS SYSTEM (ionX and MultiCore)
BNC210 Generalized Anxiety Disorder
Other Indications
UNDISCLOSED ADHD, ALZHEIMER’S, COGNITION, PARKINSON’S, SCHIZOPHRENIA
UNDISCLOSED CHRONIC AND NEUROPATHIC PAIN
OTHERS PAIN, PARKINSON’S DYSKINESIA, EPILEPSY
PRECLINICAL
Results from P2A trial in Q3 2016
Inititate P1 trial in Q4 2015
Inititate P1 trial in H1 2016
PHASE 1 PHASE 2MILESTONES
(CALENDAR YEAR)
For
per
sona
l use
onl
y

10
BNC105 is a tubulin depolymerizing agent, derived from our MultiCore platform, which has been examined in two Phase 2 and two Phase 1 clinical trials and demonstrated promising signals of efficacy with potential for biomarker-driven development in chronic lymphocytic leukemia, ovarian cancer and renal cancer. During FY15 BNC105 Phase 2 renal cancer biomarker data was presented at the European Society for Medical Oncology Congress in Spain and a peer-reviewed scientific publication on this work was accepted for publication by the journal Clinical Cancer Research. Cumulative biomarker data across all BNC105 clinical trials was presented at AACR, correlating biomarker changes with a measure of efficacy Progression Free Survival (PFS). In addition a patent application covering synergistic combinations of BNC105 with immune-oncology therapies such as anti-PD1 and anti-CTLA4 was filed. We have also progressed strategic discussions for the continued clinical development of BNC105.
BNC420 is an orally administered tyrosine kinase inhibitor. This preclinical drug candidate is thought to suppress tumour progression by targeting tumour-induced immune tolerance and lymphangiogenesis. One key differentiator of BNC420 is that it displays significant selectivity to VEGFR3 over related VEGFR receptors, while other competitive inhibitors of the VEGFR receptors (e.g. sunitinib/Sutent) do not exhibit such selectivity for VEGFR3. The data presented at AACR showed that BNC420 significantly outperformed Sutent in inhibiting tumour metastasis. In a murine model of melanoma, BNC420 suppressed the development of tumour lymph vessels, the growth of regional metastatic tumours and the spread of tumours to the draining lymph nodes. In contrast, Sutent failed to suppress lymph node metastasis and appeared to enhance formation of regional metastatic tumours.
BNC164 is a potent small molecule ion channel inhibitor with immunomodulator potential in preclinical development for mild to moderate psoriasis as well as other inflammatory diseases such as uveitis and inflammatory bowel disease.
Our strategy for unlocking the value of selected drug candidates in our pipeline is to secure strategic partnerships with companies having complementary development and commercialisation capabilities to maximise the chances of clinical and commercial success.
For
per
sona
l use
onl
y

CEO & MANAGING DIRECTOR’S REPORT11
THE ACQUISITION OF PRESTWICK CHEMICAL EXPANDED OUR MULTICORE PLATFORM AND OUR PRESENCE IN EUROPE Bionomics strengthened its commercial position and European foothold with the acquisition of the assets of Prestwick Chemical in October 2014.
Prestwick is a premium provider of medicinal chemistry services and smart screening libraries. A service provider to Bionomics since 2009, Prestwick has contributed and is continuing to contribute to Bionomics cognition, pain and anxiety and depression programs. This acquisition reflects our commitment to a strategy of enhancing our platform technologies so that we can rapidly identify and advance highly promising drug candidates for development and selective strategic partnering.
We regard Prestwick as a valuable asset that brings with it a blue chip customer base.
Prestwick is co-located with Bionomics’ wholly-owned business Neurofit and boasts one marketed product from its contract research services as well as numerous drug candidates in Phase 3 clinical trials.
FINANCIAL RESULTS Bionomics remains in a strong position to continue its development and partnering activities. Cash at 30 June 2015 was a healthy $26.558 million, an increase of $16.990 million over the 30 June 2014 balance. Revenue and other income for the period was $16.616 million compared with $27.546 million for the period to 30 June 2014. The operating loss after tax of the Group for the period was $16.949 million and reflects the Company’s continued execution of its business plan.
“Our Company is well positioned in the biotechnology sector”
For
per
sona
l use
onl
y
12
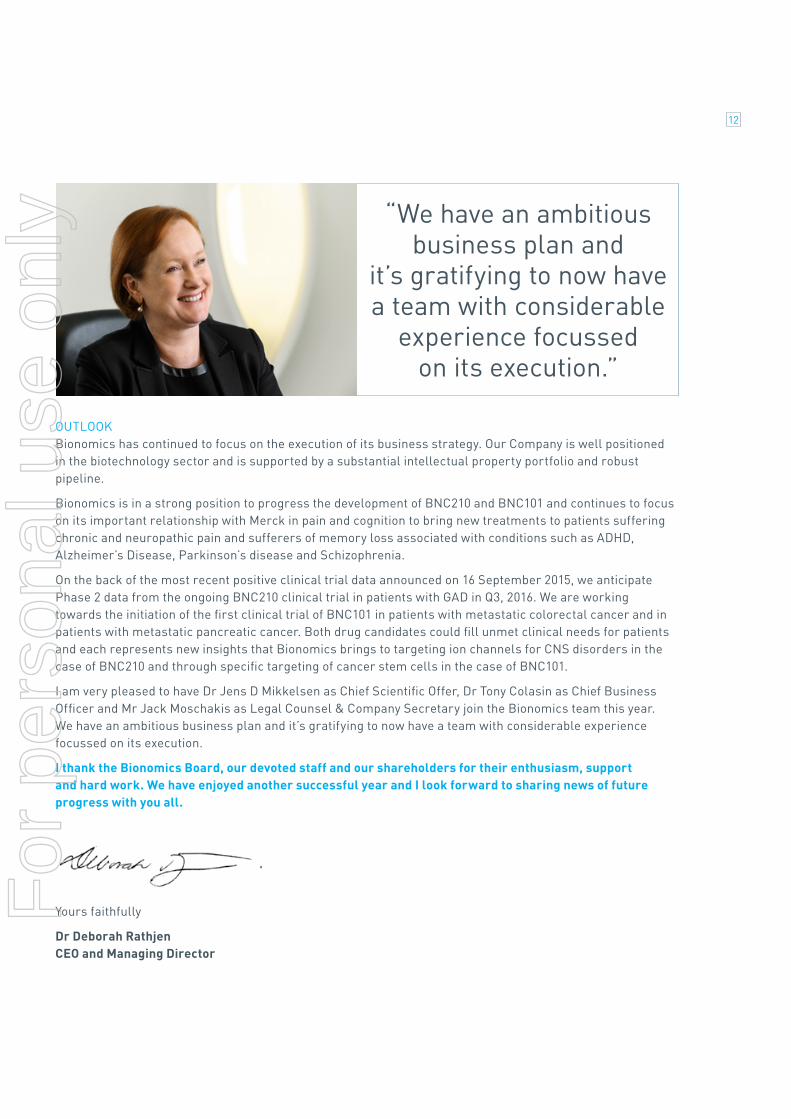
OUTLOOK Bionomics has continued to focus on the execution of its business strategy. Our Company is well positioned in the biotechnology sector and is supported by a substantial intellectual property portfolio and robust pipeline.
Bionomics is in a strong position to progress the development of BNC210 and BNC101 and continues to focus on its important relationship with Merck in pain and cognition to bring new treatments to patients suffering chronic and neuropathic pain and sufferers of memory loss associated with conditions such as ADHD, Alzheimer’s Disease, Parkinson’s disease and Schizophrenia.
On the back of the most recent positive clinical trial data announced on 16 September 2015, we anticipate Phase 2 data from the ongoing BNC210 clinical trial in patients with GAD in Q3, 2016. We are working towards the initiation of the first clinical trial of BNC101 in patients with metastatic colorectal cancer and in patients with metastatic pancreatic cancer. Both drug candidates could fill unmet clinical needs for patients and each represents new insights that Bionomics brings to targeting ion channels for CNS disorders in the case of BNC210 and through specific targeting of cancer stem cells in the case of BNC101.
I am very pleased to have Dr Jens D Mikkelsen as Chief Scientific Offer, Dr Tony Colasin as Chief Business Officer and Mr Jack Moschakis as Legal Counsel & Company Secretary join the Bionomics team this year. We have an ambitious business plan and it’s gratifying to now have a team with considerable experience focussed on its execution.
I thank the Bionomics Board, our devoted staff and our shareholders for their enthusiasm, support and hard work. We have enjoyed another successful year and I look forward to sharing news of future progress with you all.
Yours faithfully
Dr Deborah Rathjen CEO and Managing Director
“We have an ambitious business plan and
it’s gratifying to now have a team with considerable
experience focussed on its execution.”
For
per
sona
l use
onl
y

INTELLECTUAL PROPERTY PORTFOLIO13
WE ARE THE OWNER ON RECORD OF 107 ISSUED PATENTS ACROSS 39 FAMILIES AND 117 PENDING PATENT APPLICATIONS ACROSS 60 FAMILIES FILED IN EUROPE, THE UNITED STATES AND ASIA. THE BIONOMICS PATENT PORTFOLIO INCLUDES:
Through the worldwide Patent Cooperation Treaty (PCT) mechanism, Bionomics and its related companies were granted 12 patents this financial year, 29 PCT patent applications entered the national and regional phases of examination, 2 PCT patent applications and 3 provisional patent applications were filed.
�24
�4
�1
�6 �17
�3
�2
�8
�6
�patent families covering BNC375 and congeners and their use in the treatment of memory enhancement and related disorders
patent application covering chronic pain
patent families covering BNC210 and congeners and their use in the treatment of anxiety and other disorders
�patent families covering BNC105 and congeners and their use in the treatment of cancer
�patent families covering BNC420 and congeners and their use in the treatment of melanoma, breast cancer and other cancers
�patent families covering Parkinson’s Disease and related disorders
patent families covering BNC164 and congeners and their use in the treatment of autoimmune disease
�patent families covering BNC101 and its use in targeting cancer stem cells
patent families covering discoveries made utilizing Bionomics’ technology platforms
For
per
sona
l use
onl
y

14BOARD OF DIRECTORS
DR DEBORAH RATHJEN BSc (HONS), PhD, MAICD, FTSE
CEO and Managing Director Dr Rathjen joined Bionomics in 2000 from Peptech Limited, where she was General Manager of Business Development and Licensing. Dr Rathjen was a co-inventor of Peptech’s TNF technology and leader of the company’s successful defence of its key TNF patents against a legal challenge by BASF. Dr Rathjen has significant experience in company building and financing, mergers and acquisitions, therapeutic product research and development, business development, licensing and commercialisation. Dr Rathjen has been recognised both in Australia and internationally through awards and honours
including the 2004 AusBiotech President’s Medal, 2006 Flinders University Distinguished Alumni Award, 2009 BioSingapore Asia Pacific Biotechnology Woman Entrepreneur of the Year, 2009 Regional Finalist Ernst & Young - Entrepreneur of the Year and 2014 Woman Executive of the Year BioPharm Industry Awards. In 2015 Dr Rathjen was included in the Top 50 most influential Australian business women by The Australian newspaper.
MR GRAEME KAUFMAN BSc, MBA Chairman and Non-Executive Director Mr Kaufman has wide ranging experience across the biotechnology sector, spanning scientific, commercial and financial areas. His experience with CSL Limited, Australia’s largest biopharmaceutical company included responsibility for all of their manufacturing facilities, and the operation of an independent business division operating in the high technology medical device market. As CSL’s General Manager Finance, Mr Kaufman had global responsibility for finance, strategy development, human resources and information technology. Mr Kaufman has also served as an executive director of ASX-listed Circadian
Technologies and a non-executive director of Amrad Corporation. He was previously Executive Vice President Corporate Finance with Mesoblast Limited and is currently non-executive Chairman of IDT Australia Limited and non-executive Chairman of Paradigm Biopharmaceuticals Limited.
MR TREVOR TAPPENDEN CA, FAICD Non-Executive Director Mr Tappenden commenced a career as a Non-Executive Director in 2003 after a career with Ernst & Young spanning 30 years. During his time at Ernst & Young Mr Tappenden held a variety of positions including Managing Partner of the Melbourne Office, member of the Board of Partners, Head of the Victorian Government Services Group and National Director of the Entrepreneurial Services Division. He holds directorships in various private, government and not-for-profit organisations and is the Chairman of the Audit and Risk Management Committees of many of those organisations.For
per
sona
l use
onl
y

BOARD OF DIRECTORS15
DR ERROL DE SOUZA PhD Non-Executive Director Dr De Souza is a leader in the development of therapeutics for treatment of central nervous system (CNS) disorders. He is currently President and CEO of a leading US company Biodel Inc (Nasdaq: BIOD) and is the former President and CEO of US biotech companies Archemix Corporation and Synaptic Pharmaceutical Corporation. Dr De Souza formerly held senior management positions at Aventis and its predecessor Hoechst Marion Roussel Pharmaceuticals, Inc. Most recently, he was Senior Vice President and Site Head of US Drug Innovation and Approval (R&D), at Aventis, where he was
responsible for the discovery and development of drug candidates through Phase IIa clinical trials for CNS and inflammatory disorders. Prior to Aventis, he was a co-founder and Chief Scientific Officer of Neurocrine Biosciences (Nasdaq: NBIX). Dr De Souza has served on multiple editorial boards, National Institutes of Health (NIH) Committees and is currently a Director of several public and private companies.
DR JONATHAN LIM MD Non-Executive Director Jonathan Lim, MD is Chairman, CEO and Co-Founder of Ignyta, Inc., an oncology precision medicine biotechnology company that he helped take public in October 2013. Dr Lim is also Managing Partner of City Hill Ventures, LLC, which he established in 2010, and was formerly President, CEO, and Board Director of Halozyme Therapeutics, Inc. Under Dr Lim’s eight years of leadership, the company went public and raised $300 million from financing and corporate partnerships with Roche and Baxter, achieved two US FDA approvals, and built a late stage pipeline of two Phase III, two Phase II, and two
Phase I product candidates. Dr Lim’s prior experience includes management consulting at McKinsey, NIH Postdoctoral Fellowship at Harvard, and general surgery residency at New York Hospital-Cornell. He has BS and MS degrees from Stanford, MD from McGill, and MPH from Harvard.
For
per
sona
l use
onl
y

MANAGEMENT 16
MR TONY COLASIN MBA Chief Business Officer Mr. Colasin brings over 20 years of experience in senior business development, product commercialisation, and corporate finance roles at major biopharmaceutical companies, contributing to the success of key brands including EPOGEN® and Cialis. He joins Bionomics from Ironwood Pharmaceuticals, where he served as Vice President of Corporate Development and was responsible for strategy and tactical oversight of in-licensing, and mergers and acquisitions. Previously he was Senior Director of Business Development for ICOS Corporation for six years and before that, he held positions at Amgen in various marketing, corporate finance and corporate development roles. Mr. Colasin holds a BS.Ec from the University of Southern California and a MBA from the Anderson School of Management at the University of California, Los Angeles. Mr Colasin also served in the US Marine Corps.
DR JOSÉ IGLESIAS MD Chief Medical Officer Dr Iglesias, responsible for clinical development at Bionomics since November 2012, is a seasoned medical professional with 24 years global experience in the biopharmaceutical industry. Prior to joining Bionomics, he spent six years at Celgene Corporation and its wholly owned subsidiary Abraxis Bioscience as VP of Clinical Development at Celgene with previous roles including CMO and VP of Global Clinical Development and Medical Affairs at Abraxis. Previously, Dr Iglesias worked in several positions at US pharmaceutical giant Eli Lilly over 10 years, including his appointment as Oncology Medical Advisor for the Australia and the Asia Pacific region between 2002 and 2004. A graduate from the Montevideo School of Medicine, Dr Iglesias has been published more than 60 times and is an active member of ASCO, AACR and ESMO.
DR JENS MIKKELSEN MD, PhD Chief Scientific Officer Dr Jens D Mikkelsen joined Bionomics as Chief Scientific Officer in 2015, and prior to that he worked more than 15 years in key positions within the pharmaceutical industry such as Head of Neurobiology, H. Lundbeck; Founder and Director, Zealand Pharma; CSO/CEO, Azign Bioscience; and Head of Translational Neuroscience, NeuroSearch. Dr. Mikkelsen has a long academic career and worked as a professor in translational neuropharmacology at the University Hospital in Copenhagen. He has published more than 275 original papers in the fields of neuroscience and pharmacology. Dr. Mikkelsen earned his medical degree from the University of Copenhagen and a PhD in neuroscience, and postdoctoral training from Cambridge and Stanford universities.
For
per
sona
l use
onl
y

MANAGEMENT17
MR JACK MOSCHAKIS BEc, DipLaw(BAB), GDipBA, FCIS
Legal Counsel and Company Secretary Mr Moschakis brings a depth of legal knowledge with over 25 years’ experience as a legal practitioner. He has worked in senior legal/company secretary roles in the South Australian electricity industry for over 10 years and has expertise in energy law and energy related commercial and contractual matters. His most recent position was at mining company Rex Minerals Ltd where he worked as a legal consultant. Prior to this, Mr Moschakis worked at Thomsons Lawyers, a top tier Adelaide law firm that is now part of the national law firm of Thomson Geer, as an energy and infrastructure consultant. Mr Moschakis holds a Bachelor of Economics (Adel), Diploma in Law (NSW) and Graduate Diploma in Business Administration (Adel). He is a Fellow of the Institute of Chartered Secretaries and Member of the Law Society of South Australia.
MS MELANIE YOUNG BCOM, CA Chief Financial Officer Ms Young has over 15 year’s experience, with six years in the medical device field, including two years as CFO of an ASX-listed company covering all facets of the company’s global finance function. In particular, her considerable commercial experience in listed company reporting requirements, international finances and working capital management complements the Bionomics team. Ms Young has also gained experience in negotiating distributor agreements, due diligence, cost reduction strategies and improving operating efficiencies. Previously Ms Young worked for Deloitte Touche Tohmatsu in the Growth Solutions Division. Ms Young holds a Bachelor of Commerce from Deakin University and is a Chartered Accountant.
For
per
sona
l use
onl
y

18DIRECTOR’S REPORT
Your directors present their report on the financial statements of the Group for the year ended 30 June 2015, comprising the parent entity Bionomics Limited (Bionomics) and its subsidiaries. In order to comply with the Corporations Act 2001, the directors report as follows:
DIRECTORS The following persons were directors of Bionomics during the period and up to the date of this report:
¨�Mr Graeme Kaufman, Non-Executive Chairman
¨��Dr Deborah Rathjen, Chief Executive Officer and Managing Director
¨�Mr Trevor Tappenden, Non-Executive Director
¨�Dr Errol De Souza, Non-Executive Director
¨�Dr Jonathan Lim, Non-Executive Director
The directors held office during the whole of the financial year and since the end of the financial year.
PRINCIPAL ACTIVITIES The principal activities of the Company and its controlled entities (the Group) during the period include the discovery and development of novel drug candidates focused on the treatment of central nervous system disorders and cancer by leveraging our proprietary platform technologies.
OPERATING RESULTS Consolidated revenue for the year to 30 June 2015 decreased by 65% to $6,827,277. Revenues were predominately attributable to the Merck & Co (known as MSD outside the USA and Canada) research collaboration and license agreement announced on 24 June 2014 in our cognition program. Other income for the year to 30 June 2015 increased by 19.5% to $9,789,128 and relates to the Research and Development (R&D) Tax Incentive, foreign government grants and the gain on bargain purchase recognised on the acquisition of Prestwick Chemicals. This compared with revenue of $19,357,932 and other income of $8,188,064 for the year to 30 June 2014. The operating loss after tax of the Group for the year to 30 June 2015 was $16,949,405 compared with the prior year after tax profit of $3,206,616.
The cash position at 30 June 2015 was $26,558,006 and restricted cash of $934,000 classified as current and non-current other financial assets (2014: $9,567,307 and restricted cash of $934,000 classified as current and non-current other financial assets). The 2014 trade and other receivables balance includes the US$20m receivable at 30 June 2014 which was received during the quarter ended 30 September 2014.
The financial performance of key operating segments of Drug discovery and development and Contract services are included in Note 4.
REVIEW OF OPERATIONS We are a global, clinical-stage biopharmaceutical company, leveraging our proprietary platform technologies to discover and develop a deep pipeline of best-in-class, novel drug candidates focused on the treatment of serious Central Nervous System, or CNS, disorders and cancer. Our ionX and MultiCore drug discovery platforms are validated through two partnerships with Merck & Co., or Merck, in cognition and pain with combined development, regulatory and sales based milestone payments of potentially up to US$678 million as well as royalties on net sales. In 2013, Merck entered into an option to exclusively license for development and commercialisation certain small molecule drug candidates for the treatment of chronic and neuropathic pain. Under this agreement, we may receive up to US$172 million in exercise fees and milestone payments as well as royalties on net sales. In 2014, we entered into another collaboration agreement with Merck & Co. to develop compounds targeting cognitive impairment in conditions such as ADHD, Alzheimer’s disease, Parkinson’s disease and schizophrenia. Under this agreement, we received US$20 million in upfront payments and are eligible for an additional US$486 million in research payments, development and commercialisation milestone payments as well as royalties on net sales.
In November 2014 Merck and Bionomics hosted a special Symposium in Adelaide, Australia. The meeting included renowned speakers from the field of pain research and focused on the clinical aspects of pain and migraine, novel targets for pain therapeutics and drug discovery. Planning is already advanced for the third annual Symposium which will focus on cognition with US-based Merck scientists and management anticipated to attend.
Bionomics has continued the development of BNC210 which is now in a Phase 2 clinical trial in patients with Generalised Anxiety Disorder or GAD and we expect results in the third quarter of the 2016 calendar year. BNC210 is a novel, proprietary negative allosteric modulator of the alpha-7 nicotinic acetylcholine receptor, or the α7 receptor. In five completed Phase 1 clinical trials, BNC210 has demonstrated safety and tolerability in 148 healthy subjects and shown initial indications of efficacy in the absence of side effects such as sedation, memory loss, impairment of motor co-ordination and potential for addiction. The α7 receptor is highly expressed in the amygdala which forms part of the emotional centre of the brain and it can be considered a key driver of emotional responses. The Phase 2 trial is evaluating the capacity of BNC210 to engage brain systems relevant to anxiety using functional magnetic resonance imaging (fMRI). The endpoints of the trial include both significant changes in cerebral perfusion and
For
per
sona
l use
onl
y

19 DIRECTOR’S REPORT
in task-related brain activity using the emotional faces task. The clinical trial is being conducted at The Institute of Psychiatry, Psychology & Neuroscience at King’s College in London.
We are also conducting a Phase 1 multiple ascending dose trial in which 54 healthy subjects are dosed twice daily for eight days. The primary endpoint of this clinical trial is safety and tolerability. In this trial we are measuring BNC210’s effects on nicotine-induced EEG changes and we expect results of the trial in the third quarter of the 2015 calendar year.
Anxiety is a condition which places a considerable burden on our society. For example, approximately 14.4% of the Australian population is affected by anxiety. Approximately 40 million people suffer from anxiety disorders in the United States and patients with anxiety can have one or more anxiety disorders. There are six broad categories of anxiety disorders: generalised anxiety disorder, PTSD, panic disorder, social anxiety disorder, obsessive compulsive disorder and phobias. Generalised anxiety disorder is characterised by persistent, excessive, and unrealistic worrying about everyday things. Approximately 6.8 million people suffer from generalised anxiety disorder in the United States. The anxiety market is projected to reach US$18.2 billion by 2020. There are a number of drugs used to treat anxiety with the mainstay being benzodiazepines. Generalised anxiety disorder is commonly treated with SSRIs and SNRIs which are antidepressants that enhance either serotonin or norepinephrine. The key limitations with SSRIs and SNRIs are a modest efficacy and late onset of action, discontinuation or withdrawal syndrome, changes in weight, sexual dysfunction and suicide ideation in adolescents, while benzodiazepines such as Valium display side-effects including sedation, addiction, tolerance and cognitive disturbances, and are therefore not recommended for long-term treatment despite short-term efficacy. Anxiety and depression are mood disorders with overlapping symptoms. Over 40% of patients diagnosed with depression are also diagnosed with an anxiety disorder.
In addition to the successes of its neuroscience programs, Bionomics continues to develop its cancer drug pipeline including compounds focused on cancer stem cells.
During the year Bionomics progressed its lead cancer stem cell drug candidate BNC101 towards clinical trial. IND enabling studies and GMP manufacture are now complete with an IND submission being finalised. BNC101 data was presented at the 26th EORTC-NCI-AACR Symposium on Molecular Targets and Cancer Therapeutics in Barcelona. The data included the preclinical activity of BNC101 in primary lung cancer and triple negative breast models.
The depth of Bionomics’ cancer medicines pipeline was highlighted at the American Association for Cancer Research (AACR) 105th Annual Meeting in Philadelphia with four posters presented across three programs. This meeting was attended by representatives from major pharmaceutical companies and academia, patient advocates and other cancer professionals worldwide. BNC101 was the focus of two posters at the AACR meeting. The posters showed further support for biomarker-driven clinical development for BNC101 in colorectal cancer, pancreatic cancer and other solid tumours. The data also showed that when BNC101 is combined with standard of care chemotherapy it successfully delayed or prevented tumour recurrence in metastatic colorectal cancer and pancreatic patient-derived xenograft models that are designed to mimic a relapse setting following first-line chemotherapy. This is very promising pre-clinical work and we look forward to BNC101 entering its first Phase 1 clinical trial in the fourth quarter of the 2015 calendar year for patients that have metastatic colorectal cancer and metastatic pancreatic cancer.
Our BNC105 drug candidate has been the focus of four clinical trials in ovarian cancer, renal cancer and mesothelioma as well as a clinical trial in patients with differing tumour types. Across these clinical trials it has been shown that key biomarkers are correlated with progression-free survival at six months, paving the way for future biomarker driven clinical development.
Data on BNC420 was also presented at AACR. BNC420, a novel, orally administered, multiple tyrosine kinase inhibitor, has potential to be developed for the treatment of triple negative breast cancer and melanoma. This preclinical drug candidate suppresses tumour progression by targeting tumour-induced immune tolerance and lymphangiogenesis. BNC420 has demonstrated activity in melanoma models as an inhibitor of tumour metastasis. The data presented at AACR demonstrated that BNC420 significantly outperforms first-line treatment sunitinib (Sutent) in inhibiting tumour metastasis by selectively targeting VEGFR3 over related VEGFR receptors.
Bionomics strengthened its MultiCore technology platform and European presence with the acquisition of Prestwick Chemical on 1 October 2014. Prestwick is a premium provider of medicinal chemistry services and smart screening libraries. Its acquisition strengthens our global strategy and allows us to further identify and advance highly promising drug compounds for development and selective, strategic partnering. We regard Prestwick as a valuable asset that brings a blue chip customer base to Bionomics. Prestwick is co-located with Bionomics’ wholly-owned business Neurofit and
For
per
sona
l use
onl
y

20
boasts one marketed product from its contract research services as well as numerous compounds in Phase 3 clinical trials.
OUTLOOK Bionomics is in a strong position to progress its development programs and the Company continues to focus on its important relationship with Merck in pain and cognition to bring new treatments to patients suffering chronic pain and sufferers of memory impairment including those with ADHD, Alzheimer’s Disease, Parkinson’s disease and Schizophrenia.
We intend to advance the development of BNC210 to treat anxiety and depression. We have an ongoing Phase 2 clinical trial with BNC210 in 24 unmedicated generalised anxiety disorder patients and we expect results in the third quarter of the 2016 calendar year. BNC210 is being evaluated in a Phase 1 multiple ascending dose trial in which 54 healthy subjects are treated twice daily for eight days and we anticipate data from this trial in the current quarter.
We also intend to advance the development of BNC101 to treat solid tumors by targeting cancer stem cells. We plan to initiate a Phase 1 clinical trial in patients with metastatic colorectal cancer and metastatic pancreatic cancer. This trial is expected to commence in the fourth quarter of the 2015 calendar year.
DIVIDENDS The directors do not propose to make any recommendation for dividends for the current financial year. There were no dividends declared in respect of the previous financial year.
SIGNIFICANT CHANGES IN THE STATE OF AFFAIRS There were no significant changes in the state of affairs of the Group during the financial year.
SUBSEQUENT EVENTS The Group announced the appointment of Anthony Colasin as Chief Business Officer on 3 August 2015. No other matters or circumstances have arisen since the end of the financial year which significantly affect or may significantly affect the results of the operations of the Group.
LIKELY DEVELOPMENTS AND EXPECTED RESULTS OF OPERATIONS The Group will continue to undertake drug discovery and will seek to commercialise the outcomes of its research and development in the form of drug candidates for the treatment of CNS diseases and cancer.
ENVIRONMENTAL REGULATION The Group is subject to environmental regulations and other licenses in respect of its research facilities in Thebarton (South Australia), Bionomics, Inc. in San Diego and for Neurofit and Prestwick in France. The Group is subject to regular inspections and audits by responsible State and Federal authorities. The Group was in compliance with all the necessary environmental regulations throughout the year ended 30 June 2015 and no related issues have arisen since the end of the financial year to the date of this report.
INFORMATION ON DIRECTORSMR GRAEME KAUFMAN BSc MBA Chairman – Non-Executive Director since 18 September 2012
Experience and Expertise Mr Kaufman has wide ranging experience across the biotechnology sector, spanning scientific, commercial and financial areas. His experience with CSL Limited, Australia’s largest biopharmaceutical company included responsibility for all of their manufacturing facilities, and the operation of an independent business division operating in the high technology medical device market. As CSL’s General Manager Finance, Mr Kaufman had global responsibility for finance, strategy development, human resources and information technology. Mr Kaufman has also served as an executive director of ASX-listed Circadian Technologies and a non-executive director of Amrad Corporation. He was previously Executive Vice President Corporate Finance with Mesoblast Limited and is currently non-executive Chairman of IDT Australia Limited and non-executive Chairman of Paradigm Biopharmaceuticals Limited.
Current Directorships (in addition to Bionomics Limited) Listed: Chairman, IDT Australia Limited (ASX:IDT) (since June 2013); Unlisted: Paradigm BioPharmaceuticals Limited (since August 2014)
Former Listed Directorships in Last Three Years Non-executive Director, Cellmid Limited (ASX:CDY) (from August 2012 until June 2015)
Special Responsibilities Member of Audit and Risk Management Committee
Interests in Shares and Options at Date of Report 178,750 ordinary shares in Bionomics Limited 1,000,000 unlisted options over ordinary shares in Bionomics Limited
For
per
sona
l use
onl
y

21
DR DEBORAH RATHJEN BSc (Hons), MAICD, PhD Chief Executive Officer and Managing Director Director since 18 May 2000
Experience and Expertise Dr Rathjen joined Bionomics in 2000 from Peptech Limited, where she was General Manager of Business Development and Licensing. Dr Rathjen was a co-inventor of Peptech’s TNF technology and leader of the company’s successful defence of its key TNF patents against a legal challenge by BASF. Dr Rathjen has significant experience in company building and financing, mergers and acquisitions, therapeutic product research and development, business development, licensing and commercialisation. Dr Rathjen has been recognised both in Australia and internationally through awards and honours including the 2004 AusBiotech President’s Medal, 2006 Flinders University Distinguished Alumni Award, 2009 BioSingapore Asia Pacific Biotechnology Woman Entrepreneur of the Year, 2009 Regional Finalist Ernst & Young–Entrepreneur of the Year and 2014 Woman Executive of the Year BioPharm Industry Awards. In 2015 Dr Rathjen was included in the Top 50 most influential Australia business women by The Australian newspaper.
Current Directorship (in addition to Bionomics Limited) Listed: Nil Other: Director of CRC for Cancer Therapeutics
Former Listed Directorships in Last Three Years None
Special Responsibilities Chief Executive Officer and Managing Director
Interests in Shares and Options at Date of Report 2,280,401 ordinary shares in Bionomics Limited 2,120,000 unlisted options over ordinary shares in Bionomics Limited
MR TREVOR TAPPENDEN CA, FAICD Non-Executive Director Director since 15 September 2006
Experience and Expertise Mr Tappenden commenced a career as a Non-Executive Director in 2003 after a career with Ernst & Young spanning 30 years. During his time at Ernst & Young Mr Tappenden held a variety of positions including Managing Partner of the Melbourne Office, member of the Board of Partners, Head of the Victorian Government Services Group and National Director of the Entrepreneurial Services Division. He holds directorship in various private, government and not-for-profit organisations and is the Chairman of the Audit and Risk Management Committees of many of those organisations.
Current Directorships (in addition to Bionomics Limited)Listed companies: Nil
Other: Director, Buckfast Pty Ltd; Director & Chairman, Intellicomms Pty Ltd; Director & Chairman, RMIT University Foundation; Director, Museum Victoria
Former Listed Directorships in Last Three Years Director, Metal Storm Limited
Special Responsibilities Chairman of Audit and Risk Management Committee
Interests in Shares and Options at Date of Report 352,500 ordinary shares in Bionomics Limited 200,000 unlisted options over ordinary shares in Bionomics Limited
DR ERROL DE SOUZA PhD Non-Executive Director Director since 28 February 2008
Experience and Expertise Dr De Souza is a leader in the development of therapeutics for treatment of central nervous system (CNS) disorders. He is currently President and CEO of leading US company Biodel Inc. (NASDAQ:BIOD) and is the former President and CEO of US biotech companies Archemix Corporation and Synaptic Pharmaceutical Corporation. Dr De Souza formerly held senior management positions at Aventis and its predecessor Hoechst Marion Roussel Pharmaceuticals, Inc. Most recently, he was Senior Vice President and Site Head of US Drug Innovation and Approval (R&D), at Aventis, where he was responsible for the discovery and development of drug candidates through Phase IIa clinical trials for CNS and inflammatory disorders. Prior to Aventis, he was a co-founder and Chief Scientific Officer of Neurocrine Biosciences (NASDAQ:NBIX). Dr De Souza has served on multiple editorial boards, National Institutes of Health (NIH) Committees and is currently a Director of several public and private companies.
Current Directorships (in addition to Bionomics Limited)Listed companies: Director of Biodel Inc. (NASDAQ:BIOD), Director of Targacept, Inc. (NASDAQ:TRGT)
Former Listed Directorships in Last Three Years None
Special Responsibilities None
Interests in Shares and Options at Date of Report 146,698 ordinary shares in Bionomics Limited 300,000 unlisted options over ordinary shares in Bionomics Limited
DIRECTOR’S REPORT
For
per
sona
l use
onl
y

22
DR JONATHAN LIM MD Non-Executive Director Director since 14 September 2012
Experience and Expertise Jonathan Lim, MD is Chairman, CEO and Co-Founder of Ignyta, Inc. (NASDAQ: RXDX), an oncology precision medicine biotechnology company that he helped take public in October 2013 and raised nearly $120 million during the subsequent six months, and advanced the clinical development of RXDX-101, the company’s lead product candidate. He is also Managing Partner of City Hill Ventures, LLC, which he established in 2010 prior to co-founding Eclipse Therapeutics, Inc. in early 2011. Dr Lim was formerly President, CEO, and Board Director of Halozyme Therapeutics, Inc. where he grew the company from five employees and a market value of $5 million in May 2003 to 140 employees and peak market capitalisation of nearly $1 billion during his tenure. Under Dr Lim’s eight years of leadership, the company went public and raised $300 million from financing and corporate partnerships with Roche and Baxter, achieved two US FDA approvals and built a late stage pipeline of two Phase III, two Phase II, and two Phase I product candidates. Dr Lim’s prior experience includes management consulting at McKinsey, NIH Postdoctoral Fellowship at Harvard and general surgery residency at New York Hospital-Cornell. He has BS and MS degrees from Stanford, MD from McGill and MPH from Harvard.
Current Directorships (in addition to Bionomics Limited)Listed companies: Ignyta, Inc. (NASDAQ: RXDX) Other: Managing Partner, City Hill Ventures, LLC
Former Listed Directorships in Last Three Years President, Halozyme Therapeutics, Inc. (NASDAQ:HALO)
Special Responsibilities None
Interests in Shares and Options at Date of Report 5,091,828 ordinary shares in Bionomics Limited 500,000 unlisted options over ordinary shares in Bionomics Limited
MR JACK MOSCHAKIS BEc, DipLaw(BAB), GDipBA , FCIS Legal Counsel and Company Secretary
Mr Moschakis brings a depth of legal knowledge with over 25 years’ experience as a legal practitioner. He has worked in senior legal/company secretary roles in the South Australian electricity industry for over 10 years and has expertise in energy law and energy related commercial and contractual matters. His most recent position was at mining company Rex Minerals Ltd where he worked as a legal consultant. Prior to this, Mr Moschakis worked at Thomsons Lawyers, a top tier Adelaide law firm that is now part of the national law
firm of Thomson Geer, as an energy and infrastructure consultant. Mr Moschakis holds a Bachelor of Economics (Adel), Diploma in Law (NSW) and Graduate Diploma in Business Administration (Adel). He is a Fellow of the Institute of Chartered Secretaries and Member of the Law Society of South Australia.
MEETINGS OF DIRECTORS The following table sets out the number of directors’ meetings (including meetings of committees of directors) held during the financial year and the number of meetings attended by each director (while they were a director or committee member).
MEETINGS OF DIRECTORS
MEETINGS OF AUDIT AND RISK
MANAGEMENT (ARM)
COMMITTEE
Held Attended Held Attended
Mr Graeme Kaufman 10 10 4 4
Dr Deborah Rathjen 10 10 4* 4*
Mr Trevor Tappenden 10 10 4 4
Dr Errol De Souza 10 10 * *
Dr Jonathan Lim 10 10 * *
* = Not a member of the relevant committee, may attend by invitation.
REMUNERATION REPORT This remuneration report, which forms part of the Directors’ Report, sets out information about the remuneration of the Company’s key management personnel for the financial year ended 30 June 2015. The term ‘key management personnel’ refers to those persons having authority and responsibility for planning, directing and controlling the activities of the consolidated entity (the Group), directly or indirectly, including any director (whether executive or otherwise) of the Group. The prescribed details for each person covered by this report are detailed below under the following headings:
1. Key Management Personnel 2. Remuneration Policy 3. Relationship Between the Remuneration Policy
and Company Performance 4. Remuneration of Key Management Personnel 5. Key Terms of Service Agreements
For
per
sona
l use
onl
y

23 DIRECTOR’S REPORT
Except as noted, the above persons held their current position for the whole of the financial year and since the end of the financial year.
2. Remuneration Policy Non-Executive Director Remuneration Policy Non-executive directors’ fees are reviewed regularly, taking into account comparable remuneration data from the biotechnology sector, with the most recent increase having taken effect in 2012. Non-executive directors’ fees are determined within an aggregate directors’ fee pool limit that is approved by shareholders. The current aggregate non-executive directors’ fee pool limit is $500,000 per annum and was approved by shareholders on 14 November 2012. This amount (or some part of it) is to be divided among the non-executive directors as determined by the Board and reflecting the time and responsibility related to the Board and committees. The Group does not provide retirement allowances for its non-executive directors.
The Chairman and non-executive directors’ fees are $120,000 per annum and $65,000 per annum respectively, inclusive of any statutory Australian superannuation contributions. The Chairman of the Audit and Risk Management Committee, Mr Trevor Tappenden, received an additional $15,000 per annum inclusive of superannuation for services relating to his Audit and Risk Management Committee duties. Dr Errol De Souza received an additional $39,000 per annum for being the Chair of the Scientific Advisory Board during the year, an increase of $24,000 compared to the prior year due to the additional contribution in that role during the year. The total fees paid to non-executive directors for the year ended 30 June 2015 was $369,000 compared to the aggregate directors’ fee pool limit of $500,000, leaving an available limit of $131,000
Non-executive directors may receive share options at the time of their initial appointment to the Board or at other such times as approved by shareholders.
Any value that may be attributed to options issued to non-executive directors is not included in the shareholder approved aggregate limit of directors’ fees applying from time to time.
Executive Remuneration Policy and Framework The objective of the Group’s key management personnel remuneration policy and framework is to ensure that the Group can attract and retain high calibre executives capable of managing the Group’s operations and achieving the Group’s strategic objectives.
The executives total remuneration package framework comprises:
¨��Base pay and benefits, including superannuation and other entitlements;
¨��Performance incentives paid as share options or cash; and
¨��Equity awards through participation in the Bionomics employee equity plans.
The combination of these comprises the executive key management personnel’s total remuneration.
Base pay and benefit levels are reviewed annually and an assessment made against market comparable positions. The executive key management personnel’s base pay and benefit levels may also be reviewed on promotion. The Board reviews and approves the base pay, benefits, incentive payments and equity awards of the Chief
1. Key Management Personnel
NON-EXECUTIVE DIRECTORS POSITION
Mr Graeme Kaufman Chairman, Non-Executive Director
Mr Trevor Tappenden Non-Executive Director
Dr Errol De Souza Non-Executive Director
Dr Jonathan Lim Non-Executive Director
EXECUTIVE DIRECTOR
Dr Deborah Rathjen Chief Executive Officer and Managing Director
OTHER KEY MANAGEMENT PERSONNEL
Dr José Iglesias Chief Medical Officer
Ms Melanie Young Chief Financial Officer, Company Secretary to 18 May 2015
Dr Jens Mikkelsen Chief Scientific Officer (from 11 May 2015)
Mr Jack Moschakis Legal Counsel (from 4 May 2015) and Company Secretary (from 18 May 2015)
For
per
sona
l use
onl
y

24
Executive Officer and Managing Director and other key management personnel directly reporting to the Chief Executive Officer and Managing Director.
3. Relationship Between the Remuneration Policy and Company Performance The Company’s remuneration policy aligns executive reward with the interests of shareholders. The primary focus is on growth in shareholder value through achievement of research, development, regulatory and commercial milestones, and therefore performance goals are not necessarily linked to financial performance measures typical of companies operating in other market segments. Share options and/or cash bonuses are granted to executive key management personnel based on their level of key performance indicator (KPI) achievement. Achievement of KPIs should result in increases in shareholder value. However, instead of a cash award for KPI achievement (unless there are exceptional circumstances) the Company provides share options. Share options only have value if there is an increase in shareholder value. That is further improvement beyond the KPI achievement on which the award is based is usually required to realise value. This is typical of a biotechnology company in Bionomics’ lifecycle. KPIs may include (but are not limited to) successful negotiations of commercial contracts, achieving key research, development and regulatory milestones, and ensuring the availability of adequate capital to achieve stated objectives.
Other factors taken into account in determining remuneration include levels of remuneration in other biotechnology companies, a demonstrated record of performance, internal relativities, and the company’s capacity to pay.
Base pay and benefits Executives receive their base pay and benefits structured as a Total Fixed Remuneration (TFR) package which may be delivered as a combination of cash and prescribed non-financial benefits at the executives’ discretion. Superannuation (or local equivalent) is included in TFR. There are no guaranteed base pay increases in any executive contract. During the year there were increases provided to the Chief Executive Officer and Managing Director, Chief Medical Officer and Chief Financial Officer based on the achievement of personal and corporate KPIs.
Performance incentives Executive service agreements typically do not include pre-determined bonus or equity allocations, however performance incentives in the form of cash or share options may be awarded at the end of the performance review cycle upon achievement of specific Board approved
(i) individual, and (ii) company-related KPIs with a weighting of 50% each.
Following a performance evaluation against these KPIs, the amount of possible incentive payable to each executive is determined by the Board based on the CEO’s recommendation.
The Board determine whether the incentive award should be in share options or cash. The default award is in share options, as this is in accord with the Company’s philosophy that a continuum of KPI achievement pre and post any award is required to progressively improve shareholder value, and that options are an appropriate payment vehicle because a reward is only realised if there is further KPI achievement resulting in improved shareholder value.
In exceptional circumstances, the Board will consider cash payment instead of or in addition to an option award if the executive:
¨��already has significant shareholdings; and/or
¨��resides in a country where an option award is inappropriate due to local regulation or taxes; and/or
¨��is likely to be in a position whereby the executive may be unable to exercise options because of insider knowledge and/or an extended blackout period; and/or
¨��the KPI achievement is, in the judgement of the board, of such significance to materially position the Company for further shareholder value enhancement.
Performance incentives as practised by Bionomics are best characterised as a hybrid short-term and long-term incentive. That is, it has a look back element on what was achieved in the financial year, and a look forward element requiring enhanced shareholder value beyond market expectations at the time of the award. The Board considers this an appropriate approach for a company of Bionomics’ size, nature and lifecycle.
The incentive structure is under active review to ensure it remains effective.
Equity awards Equity awards for executives and employees are provided by a combination of equity plans that may include:
¨��an Employee Share Plan;
¨��an Employee Share Plan ($1,000 Plan); and
¨��an Employee Share Option Plan.
Participation in these plans is at the Board’s discretion and no individual has an ongoing contractual right to participate in a plan or to receive any guaranteed benefits.
For
per
sona
l use
onl
y

25 DIRECTOR’S REPORT
For key appointments, an initial allocation of equity may be offered as a component of their initial employment agreement. The structure of equity awards is under the active review of the Board to ensure it meets good corporate practice for a company of Bionomics’ size, nature and company lifecycle.
Employee Share Plan The Bionomics Employee Share Plan (ESP) was approved by shareholders at the November 2014 Annual General Meeting. It may involve the Company providing an interest-free limited recourse loan to eligible employees to purchase shares under this ESP. The Company takes security over the Shares to secure repayment of the loan. The purpose of this ESP is to provide eligible employees with an incentive to remain with the Company and to improve the longer-term performance of the Company and its returns to shareholders. The issue price will be determined by the Board at its sole discretion, with the intention to base it on market value at the time. No shares have been issued under this plan to date.
Employee Share Plan ($1,000 Plan) All executives and staff, excluding directors, are eligible to participate in the Bionomics Employee Share Plan ($1,000 Plan). The objective of the $1,000 Plan is to assist in the attraction and retention of employees of the company. An annual allocation of up to $1,000 of shares may be granted and taxed on a concessional basis. Shares are granted under the $1,000 Plan for no consideration and are escrowed for 3 years while participants are employed by the company. None were issued during the year ended 30 June 2015 or since that date.
Employee Share Option Plan Options may be granted under the Bionomics Limited Employee Share Option Plan (ESOP) which was re-approved by shareholders at the 2014 Annual General Meeting. All executives and staff are eligible to participate in the Plan. The objective of the Plan is to assist in the recruitment, reward, retention and motivation of employees of the company. Options are granted under the Plan for no consideration. More particularly, the Plan is utilised to award options to executives if they achieve specified KPIs (unless cash is warranted – see above). It may also be used for shareholder approved non-executive director grants at the time of their appointment. The exercise price of options granted under the Plan must be not less than the market price at the time the decision is made to invite a participant to apply for options. The exercise price is calculated as the volume-weighted average price (VWAP) of the shares in the 7 days preceding the approval to grant the options.
Performance of Bionomics Limited The broad corporate key performance indicators listed at the beginning of this section, together with individual KPIs relevant to each executive, are considered to be appropriate drivers of growth in shareholder value and were used by the Board in assessing the appropriate level of incentives payable to each executive during the year.
Other than a sustained improvement in market capitalisation relative to industry peers used as a basis for benchmarking pay, there is no link between the base pay determination and the Company’s financial performance (specifically revenue and net (loss)/profit included in the table below) or share price.
The calculation of the executive key management personnel annual incentive award is set against the achievement of specified milestones and targets approved by the Board. Milestones and targets generally relate to:
¨��Efficiently conducting the Company’s development programs;
¨��Executing Bionomics partnership strategy, both new and existing;
¨��Demonstrating the power of Bionomics’ discovery capabilities; and
¨��Maintaining adequate capital reserves.
These KPIs are established to support the Company achieving its overall objectives. Executive key management personnel have 50% of their performance incentives tied to the achievement of corporate goals and the remaining 50% is tied to the achievement of individual goals.
The Bionomics team achieved important milestones directly related to their key performance indicators, including:
¨��Continued development of BNC210 through initiation of Phase 1b and Phase 2 clinical trials and secured funding for BNC210 development through Silicon Valley Bank;
¨��Progressed BNC101 towards a Phase 1 clinical trial by completing IND enabling studies and GMP manufacture;
¨��Expanded Bionomics’ potential access to U.S. analysts and investors; and
¨��Strengthened the Multicore technology platform, our capacity to identify drug candidates and our European presence with the acquisition of Prestwick Chemical, a premium provider of medicinal chemistry services and smart screening libraries, in October 2014.
Achievement of these and associated KPIs may result in incentive awards to executive key management personnel in the future.
For
per
sona
l use
onl
y

26
The tables below set out summary information about the consolidated entity’s earnings and movements in shareholder wealth for the five years to 30 June 2015.
4. Remuneration of Key Management Personnel The following tables show details of the remuneration received by the directors and the executive key management personnel of the Group for the current and previous financial years.
1 Included in Dr Rathjen’s cash salary and fees is a cash incentive of $60,000 received on 11 September 2014 having met agreed performance criteria including execution of the Merck Option and License Agreement for the pain program and the Merck Research Collaboration and Licensing Agreement for the cognition program, and consideration by the Board (excluding Dr Rathjen) of the factors pertinent as to whether the award should be options or cash (see above).During the year ended 30 June 2015 there has been no grant of a performance-related incentive that will affect future reporting periods.
30 JUNE 2015 $
30 JUNE 2014 $
30 JUNE 2013 $
30 JUNE 2012 $
30 JUNE 2011 $
Revenue 6,827,277 19,921,506 3,724,169 6,834,709 4,071,798
Net Profit/(Loss) before tax (17,277,206) 3,946,945 (9,963,175) (3,328,896) (10,106,903)
Net Profit/(Loss) after tax (16,949,405) 3,206,616 (10,001,350) (3,136,238) (9,356,497)
30 JUNE 2015 CENTS
30 JUNE 2014 CENTS
30 JUNE 2013 CENTS
30 JUNE 2012 CENTS
30 JUNE 2011 CENTS
Share price at start of year 55.0 34.0 30.0 55.5 27.0
Share price at end of year 41.5 55.0 34.0 30.0 55.5
Dividends paid - - - - -
Basic earnings per share (4.0) 1.0 (2.7) (0.9) (2.9)
Diluted earnings per share (4.0) 1.0 (2.7) (0.9) (2.9)
DIRECTORS AND OTHER KEY MANAGEMENT PERSONNEL – 2015
NAME
SHORT-TERM BENEFITSPOST-
EMPLOYMENT
LONG-TERM EMPLOYEE BENEFITS
SHARE-BASED
PAYMENTS
CASH SALARY
AND FEES$
NON-MONETARY
BENEFITS$
SUPER- ANNUATION
$
ANNUAL AND LONG
SERVICE LEAVE
$OPTIONS
$TOTAL
$
Mr Graeme Kaufman 109,589 - 10,411 - 80,774 200,774
Mr Trevor Tappenden 73,059 - 6,941 - - 80,000
Dr Errol De Souza 104,000 - - - - 104,000
Dr Jonathan Lim 65,000 - - - 20,269 85,269
Dr Deborah Rathjen1 483,799 73,221 18,783 17,483 20,288 613,574
Dr José Iglesias4 433,530 - - 5,496 51,302 490,328
Ms Melanie Young 165,721 12,126 16,895 6,780 45,735 247,257
Dr Jens Mikkelsen2 47,247 - - - - 47,247
Mr Jack Moschakis3 45,788 - 3,131 3,960 - 52,879
1,527,733 85,347 56,161 33,719 218,368 1,921,328For
per
sona
l use
onl
y

27 DIRECTOR’S REPORT
2 Dr Mikkelsen has been a Scientific Advisory Board consultant since 4 December 2012 and commenced consulting as the Group’s Chief Scientific Officer on 11 May 2015.
3 Mr Moschakis commenced on 4 May 2015.4 Dr Iglesias’ remuneration package is in Canadian dollars and the table above is translated into Australian dollars. In
local currency, the increase for the financial year ended 30 June 2015 was in line with other executive key management personnel.
Options are granted to directors and other key management personnel under the Bionomics ESOP, details of which are set out in section 5 of this Remuneration Report.
No director or senior management person appointed during the period received a payment as part of their consideration for agreeing to hold the position.
DIRECTORS AND OTHER KEY MANAGEMENT PERSONNEL – 2014
NAME
SHORT-TERM BENEFITSPOST-
EMPLOYMENT
LONG-TERM EMPLOYEE BENEFITS
SHARE-BASED
PAYMENTS
CASH SALARY
AND FEES$
NON-MONETARY
BENEFITS$
SUPER- ANNUATION
$
ANNUAL AND LONG
SERVICE LEAVE
$OPTIONS
$TOTAL
$
Mr Graeme Kaufman 109,876 - 10,164 - 76,509 196,549
Mr Trevor Tappenden 73,227 - 6,773 - - 80,000
Dr Errol De Souza 80,000 - - - - 80,000
Dr Jonathan Lim 65,000 - - - 23,305 88,305
Dr Deborah Rathjen 407,637 75,368 17,775 (366) 17,892 518,306
Dr José Iglesias 378,941 - - 5,979 51,387 436,307
Ms Melanie Young 160,838 12,224 16,008 4,289 42,742 236,101
1,275,519 87,592 50,720 9,902 211,835 1,635,568
5. Key Terms of Service Agreements Remuneration and other terms of employment for the Chief Executive Officer and Managing Director and the other executive key management personnel are formalised in service agreements. Major provisions of the agreements relating to remuneration are set out below:
Dr Deborah Rathjen, Chief Executive Officer and Managing Director ¨��Term of agreement – 5 years commencing 15 October 2010.¨��Total remuneration package, to be reviewed annually by the Board.¨��Payment of termination benefit on early termination by the employer without cause equal to six months’ salary. In
the event of redundancy, purchase or merger of Bionomics by a third party resulting in a material diminution in duties, an additional six months’ salary will be paid.
Dr José Iglesias, Chief Medical Officer ¨��Term of agreement – open, commencing 1 November 2012.¨��Total remuneration package to be reviewed annually by the Chief Executive Officer & Managing Director and
approved by the Board.¨��Payment of termination benefit on early termination by the employer without cause equal to three months’ salary.
In the event of redundancy, purchase or merger of Bionomics by a third party resulting in a material diminution in duties, six months’ salary will be paid.
For
per
sona
l use
onl
y

28
Ms Melanie Young, Chief Financial Officer ¨��Term of agreement – open, commencing 9 May 2011.¨��Total remuneration package to be reviewed annually by the Chief Executive Officer and Managing Director and
approved by the Board.¨��Payment of termination benefit on early termination by the employer without cause equal to three months’ salary.
In the event of redundancy, purchase or merger of Bionomics by a third party resulting in a material diminution in duties, six months’ salary will be paid.
Dr Jens Mikkelsen, Chief Scientific Officer¨��Term of agreement – consultancy agreement, commencing 4 December 2012 and in this role on an open term
agreement commencing 11 May 2015.¨��Total remuneration package to be reviewed annually by the Chief Executive Officer and Managing Director and
approved by the Board.¨��Payment of termination benefit on early termination by the employer without cause equal to six months’ salary.
In the event of redundancy, purchase or merger of Bionomics by a third party resulting in a material diminution in duties, six months’ salary will be paid.
Mr Jack Moschakis, Legal Counsel and Company Secretary¨��Term of agreement – open, commencing 4 May 2015.¨��Total remuneration package to be reviewed annually by the Chief Executive Officer and Managing Director and
approved by the Board.¨��Payment of termination benefit on early termination by the employer without cause equal to six months’ salary.
In the event of redundancy, purchase or merger of Bionomics by a third party resulting in a material diminution in duties, six months’ salary will be paid.
Share-based paymentsShare-based payment benefits are provided to employees via the Bionomics ESOP and the Bionomics Employee Share Plan (ESP).
The market value of shares issued to employees for no cash consideration under the Employee Share Plan is recognised as an employee benefits expense with a corresponding increase in equity when the employees become unconditionally entitled to the shares.
The Bionomics ESOP and ESP was approved by the Board and Shareholders in 2014. Staff eligible to participate in the plan are those who have been a full-time or part-time employee of the Group for a period of not less than six months or a director of the Company.
Options are granted under the plan for no consideration and vest equally over five years, (other than options for incentive awards – see below), provided a person remains employed subject to good leaver provisions (death, retrenchment or retirement).
The amounts disclosed as remuneration relating to options are the assessed fair values at grant date of those options allocated equally over the period from grant date to vesting date. Fair values at grant date are determined using a Black-Scholes option pricing model that takes into account the exercise price, the term of the option, the vesting criteria, the impact of dilution, the share price at grant date, expected price volatility of the underlying share, the expected dividend yield and the risk-free interest rate for the term of the option.
Incentive options are issued at the discretion of the Board and vest immediately. There are no subsequent performance conditions attached to the options. The incentive payable to each executive is determined by the Board based on the CEO’s recommendation. The incentive calculation is based 50% on the Company meeting corporate objectives and 50% on the achievement of individual annual KPIs. The Company’s performance objectives are outlined in 3 above. The executive’s KPIs are established with reference to their contribution to achieving the Company’s overall objectives.
For
per
sona
l use
onl
y

29 DIRECTOR’S REPORT
The terms and conditions of each grant of options affecting remuneration of directors, other key management personnel and any of the top five salaried officers in this or future reporting periods are as follows:
GRANT DATE EXPIRY DATEREVISED
EXERCISE PRICE
FAIR VALUE PER OPTION AT
GRANT DATE VESTING DATE
Granted in prior periods
November 2006 16 November 2015 $0.2976 $0.1867 16 November 2010
16 November 2016 $0.2976 $0.1919 16 November 2011
November 2008 5 November 2015 $0.2976 $0.1488 5 November 2010
5 November 2016 $0.2976 $0.1591 5 November 2011
5 November 2017 $0.2976 $0.1683 5 November 2012
7 August 2016 $0.3692 $0.1419 7 August 2011
November 2011 25 November 2016 $0.6116 $0.2181 25 November 2011
25 November 2016 $0.9186 $0.0475 15 August 2012
December 2011 12 December 2017 $0.5156 $0.3348 12 December 2012
12 December 2018 $0.5156 $0.3553 12 December 2013
12 December 2019 $0.5156 $0.3730 12 December 2014
12 December 2020 $0.5156 $0.3886 12 December 2015
12 December 2021 $0.5156 $0.4025 12 December 2016
August 2012 1 August 2017 $0.2846 $0.1345 1 August 2012
December 2012 11 December 2017 $0.2846 $0.1614 11 December 2012
11 December 2018 $0.3176 $0.1751 11 December 2013
11 December 2019 $0.3176 $0.1871 11 December 2014
11 December 2020 $0.3176 $0.1976 11 December 2015
11 December 2021 $0.3176 $0.2070 11 December 2016
11 December 2022 $0.3176 $0.2155 11 December 2017
June 2013 5 June 2019 $0.3873 $0.2035 5 June 2014
5 June 2020 $0.3873 $0.2179 5 June 2015
5 June 2021 $0.3873 $0.2306 5 June 2016
5 June 2022 $0.3873 $0.2423 5 June 2017
5 June 2023 $0.3873 $0.2526 5 June 2018
August 2013 12 August 2018 $0.3301 $0.3811 12 August 2013
December 2013 17 December 2018 $0.3301 $0.4647 17 December 2013
11 December 2018 $0.7224 $0.3291 11 December 2013
11 December 2019 $0.7224 $0.3598 11 December 2014
11 December 2020 $0.7224 $0.3866 11 December 2015
11 December 2021 $0.7224 $0.4105 11 December 2016
11 December 2022 $0.7224 $0.4318 11 December 2017
Granted in current period
October 2014 15 October 2019 $0.5643 $0.3523 15 October 2014
December 2014 4 December 2019 $0.5643 $0.2705 4 December 2014
For
per
sona
l use
onl
y

30
Options granted under the plan carry no dividend or voting rights. When exercisable, each option is convertible into one ordinary share of Bionomics.
Details of options over ordinary shares in the Company provided as remuneration to each director and each of the other key management personnel are set out below.
During the year, and since the end of the year, incentive options were issued to the following directors and other key management personnel for the achievement in the prior year of Board-approved KPIs and individual KPIs (each contributing 50%):
1 The options vested immediately and were awarded following the achievement of performance objectives.
During the year, the following directors and other key management personnel exercised options that were granted to them as part of their compensation.
The following table summarises options that lapsed during the financial year to directors and other key management personnel. During the financial year, these 440,000 options held by key management personnel in the below table could not be exercised due to the requirement for an extended black-out (non-trading) period and consequently lapsed.
Fully Paid Ordinary Shares of Bionomics Limited
NAMENUMBER
GRANTED DATE
GRANTEDTOTAL FAIR
VALUE $NUMBERVESTED
% OF GRANT VESTED
% OF GRANT FORFEITED
Dr Deborah Rathjen1 75,000 4 Dec 2014 20,288 75,000 100% -
Dr José Iglesias1 63,500 15 Oct 2014 22,371 63,500 100% -
Ms Melanie Young1 63,500 15 Oct 2014 22,371 63,500 100% -
BALANCE AT 1 JULY 2014
NUMBER
GRANTED AS COMPENSATION
NUMBER
RECEIVED ON EXERCISE
OF OPTIONS NUMBER
NET OTHER CHANGES NUMBER
BALANCE AT 30
JUNE 2015 NUMBER
BALANCE HELD
NOMINALLY NUMBER
Mr Graeme Kaufman 178,750 - - - 178,750 -
Mr Trevor Tappenden 307,500 - 100,000 (55,000) 352,500 207,500
Dr Errol De Souza 146,698 - - - 146,698 -
Dr Jonathan Lim 5,091,828 - - - 5,091,828 5,091,828
Dr Deborah Rathjen 1,910,401 - 330,000 40,000 2,280,401 1,134,500
Dr José Iglesias - - - - - -
Ms Melanie Young 39,049 - 37,500 - 76,549 -
NAME
NUMBER OF OPTIONS
EXERCISED
NUMBER OF ORDINARY SHARES
ISSUED
AMOUNT PAID
$
AMOUNT UNPAID
$
Dr Deborah Rathjen 330,000 330,000 121,836 -
Mr Trevor Tappenden 100,000 100,000 29,760 -
Ms Melanie Young 37,500 37,500 10,673 -
NAMEFINANCIAL YEAR IN WHICH
THE OPTIONS WERE GRANTEDNUMBER OF
OPTIONS LAPSED
Dr Deborah Rathjen November 2008 340,000
Dr Errol De Souza November 2008 100,000
For
per
sona
l use
onl
y

31
Share options of Bionomics Limited
BALANCE AT
1 JULY 2014
NUMBER
GRANTED AS
COMPEN-SATION
NUMBEREXERCISED
NUMBEROTHER
NUMBER
BALANCE AT 30 JUNE 2015
NUMBER
BALANCE VESTED AND
EXERCISABLE AT 30
JUNE 2015NUMBER
OPTIONS VESTED DURING
YEARNUMBER
Mr Graeme Kaufman 1,000,000 - - - 1,000,000 400,000 200,000
Mr Trevor Tappenden 300,000 - (100,000) - 200,000 200,000 -
Dr Errol De Souza 400,000 - - (100,000) 300,000 300,000 -
Dr Jonathan Lim 500,000 - - - 500,000 200,000 100,000
Dr Deborah Rathjen 2,715,000 75,000 (330,000) (340,000) 2,120,000 2,120,000 75,000
Dr José Iglesias 565,000 63,500 - - 628,500 328,500 163,500
Ms Melanie Young 635,000 63,500 (37,500) - 661,000 461,000 163,500
DIRECTOR’S REPORT
All share options issued to key management personnel were made in accordance with the provisions of the employee share option plan. The number granted in the above table and in total during the year was 0.05% and 0.5% respectively of common shares outstanding.
During the financial year, 467,500 options were exercised by key management personnel at a weighted average exercise price of $0.35 per option for 467,500 ordinary shares in Bionomics Limited. No amounts remain unpaid on the options exercised during the financial year at year end.
Further details of the employee share option plan and of share options granted during the 2015 and 2014 financial years are contained in Note 22 to the financial statements.
Other Transactions with Directors and Other Key Management Personnel There were no other transactions with Directors or other key management personnel during the financial year.
OTHER INFORMATIONShares Under Option Information relating to shares under option is set out in section 4 of the Remuneration Report. The total number of shares under option at 30 June 2015 was 9,798,480. This is 2.3% of common shares outstanding.
Shares Issued on the Exercise of Options 842,302 ordinary shares of Bionomics were issued during the year ended 30 June 2015 on the exercise of options granted under the Bionomics ESOP.
Warrants During the year the Company issued a warrant in connection with the USD loan (Note 18(v)) which is currently exercisable at the discretion of the holder and is exchangeable for either 643,611 ordinary shares at a fixed price ($0.54) or a lower number of shares for nil consideration, with the number of shares calculated on the basis of a formula which takes into account the movement in the share price of the Company from the date of issue to date of exercise of the warrant.F
or p
erso
nal u
se o
nly

32
Insurance of Officers During the financial year, the Company paid a premium to insure the Directors and Officers (D&O) of the Company. Under the terms of this policy the premium paid by the Company is not permitted to be disclosed.
The liabilities insured are legal costs that may be incurred in defending civil or criminal proceedings that may be brought against the D&O in their capacity as D&O of the Company, and any other payments arising from liabilities incurred by the D&O in connection with such proceedings, other than where such liabilities arise out of conduct involving a wilful breach of duty by the D&O or the improper use by the D&O of their position or of information to gain advantage for themselves or someone else or to cause detriment to the Company.
It is not possible to apportion the premium between amounts relating to the insurance against legal costs and those relating to other liabilities.
The Company has not otherwise, during or since the end of the financial year, except to the extent permitted by law, indemnified or agreed to indemnify an officer or auditor of the Company or of any related body corporate against a liability incurred as such an officer or auditor.
Non-Audit Services The Company may decide to employ the external auditor on assignments additional to their statutory audit duties where the external auditor’s expertise and experience with the Group are important.
Details of the amounts paid to the external auditor for audit and non-audit services provided during the year are set out in Note 28 to the financial statements.
The Board has considered the position and, in accordance with the advice received from the Audit and Risk Management Committee, is satisfied that the provision of the non-audit services is compatible with the general standard of independence for external auditors imposed by the Corporations Act 2001. The directors are satisfied that the provision of non-audit services by the external auditor, as set out in Note 28 to the financial statements, did not compromise the external auditor independence requirements of the Corporations Act 2001 for the following reasons:
¨��all non-audit services have been reviewed by the Audit and Risk Management Committee to ensure they do not impact the integrity, impartiality and objectivity of the external auditor; and
¨��none of the services undermine the general principles relating to auditor independence as set out in Code of Conduct APES 110, Code of Ethics for Professional Accountants, issued by the Accounting Professional & Ethical Standards Board, including reviewing or auditing the external auditor’s own work, acting in a management or a decision-making capacity for the Company, acting as advocate for the Company or jointly sharing economic risk and rewards.
External Auditor Deloitte Touche Tohmatsu continues in office in accordance with section 327 of the Corporations Act 2001.
A copy of the auditors’ independence declaration as required under section 307C of the Corporations Act 2001 is set out on page 33.
This directors’ report is signed in accordance with a resolution of directors made pursuant to Section 298(2) of the Corporations Act 2001.
Graeme Kaufman Deborah RathjenChairman Chief Executive Officer and Managing Director7 August 2015 7 August 2015
For
per
sona
l use
onl
y

AUDITORS’ INDEPENDENCE DECLARATION33
For
per
sona
l use
onl
y

34ANNUAL CONSOLIDATED FINANCIAL STATEMENTS FOR THE FINANCIAL YEAR ENDED 30 JUNE 2015
This financial statement covers both Bionomics Limited (“Bionomics”) as an individual entity (Note 32) and the Group consisting of Bionomics and its subsidiaries. A description of the nature of the Group’s operations and its principal activities is included throughout the Annual Report and the Directors’ Report. The financial statement is presented in Australian dollars.
Bionomics is a company limited by shares, incorporated and domiciled in Australia. It is listed on the Australian Securities Exchange (ASX) (ASX:BNO) and its registered office is 31 Dalgleish Street, Thebarton, SA 5031.
Through the internet, we have ensured that our corporate reporting is timely, complete and available globally at minimum cost to the company. All press releases, financial statements and other information are available on our website www.bionomics.com.au.
PG 35 CONSOLIDATED STATEMENT OF PROFIT OR LOSS AND OTHER COMPREHENSIVE INCOME
PG 36 CONSOLIDATED STATEMENT OF FINANCIAL POSITION
PG 37 CONSOLIDATED STATEMENT OF CHANGES IN EQUITY
PG 38 CONSOLIDATED STATEMENT OF CASH FLOWS
PG 39 NOTES TO THE FINANCIAL STATEMENTS
PG 80 DIRECTORS’ DECLARATION
PG 81 INDEPENDENT AUDIT REPORT
TABLE OF CONTENTS FINANCIAL STATEMENTS
For
per
sona
l use
onl
y

35
THE ABOVE CONSOLIDATED STATEMENT OF PROFIT OR LOSS AND OTHER COMPREHENSIVE INCOME SHOULD BE READ IN CONJUNCTION WITH THE ACCOMPANYING NOTES.
CONSOLIDATED STATEMENT OF PROFIT OR LOSS AND OTHER COMPREHENSIVE INCOME FOR THE FINANCIAL YEAR ENDED 30 JUNE 2015
NOTE30 JUNE 2015
$30 JUNE 2014
$
CONTINUING OPERATIONS
Revenue 5 6,827,277 19,357,932
Other income 5 9,789,128 8,188,064
EXPENSES 6
Research and development expenses (23,181,790) (17,785,002)
Administration expenses (5,730,169) (2,666,597)
Occupancy expenses (2,922,779) (1,927,483)
Compliance expenses (1,186,978) (603,702)
Loss on disposal of assets (8,063) (6,765)
Finance expenses (863,832) (609,502)
(LOSS)/PROFIT BEFORE TAX (17,277,206) 3,946,945
Income tax benefit/(expense) 7 327,801 (740,329)
(LOSS)/PROFIT AFTER TAX (16,949,405) 3,206,616
OTHER COMPREHENSIVE INCOME, NET OF INCOME TAXItems that may be reclassified subsequently to profit or loss:Exchange differences on translating foreign operations 3,312,600 (355,014)
TOTAL COMPREHENSIVE (LOSS)/INCOME FOR THE YEAR (13,636,805) 2,851,602
(Loss)/Profit attributable to:Owners of the Company (13,636,805) 2,851,602
NOTE 2015 2014
EARNINGS PER SHARE FROM CONTINUING OPERATIONS
Basic (Loss)/Earnings per share 30($0.04)
(4 cents)$0.01 1 cent
Diluted (Loss)/Earnings per share 30($0.04)
(4 cents)$0.01 1 cent
For
per
sona
l use
onl
y

THE ABOVE CONSOLIDATED STATEMENT OF FINANCIAL POSITION SHOULD BE READ IN CONJUNCTION WITH THE ACCOMPANYING NOTES.
CONSOLIDATED STATEMENT OF FINANCIAL POSITION AS AT 30 JUNE 2015
36
CURRENT ASSETS NOTE30 JUNE 2015
$30 JUNE 2014
$
Cash and cash equivalents 8 26,558,006 9,567,307
Trade and other receivables 10 1,063,680 20,989,654
Other financial assets 9 550,000 550,000
Inventories 11 409,891 83,423
Research and development incentives receivable 8,005,399 7,501,256
Other assets 12 1,293,932 442,428
TOTAL CURRENT ASSETS 37,880,908 39,134,068
NON-CURRENT ASSETS
Property, plant and equipment 14 3,450,555 828,361
Goodwill 15 10,488,633 9,488,432
Other intangible assets 16 16,927,619 15,225,756
Other financial assets 9 384,000 384,000
TOTAL NON-CURRENT ASSETS 31,250,807 25,926,549
TOTAL ASSETS 69,131,715 65,060,617
CURRENT LIABILITIES
Trade and other payables 17 6,465,626 4,088,054
Borrowings 18 5,460,133 788,600
Provisions 19 1,582,239 1,186,482
Other financial liabilities 21 122,544 -
Other liabilities 20 75,362 3,267,589
TOTAL CURRENT LIABILITIES 13,705,904 9,330,725
NON-CURRENT LIABILITIES
Other payables 17 140,758 260,794
Borrowings 18 9,317,373 505,641
Provisions 19 91,168 108,320
Deferred tax liability 7 5,634,395 4,340,443
Contingent consideration 33 8,276,292 5,696,087
TOTAL NON-CURRENT LIABILITIES 23,459,986 10,911,285
TOTAL LIABILITIES 37,165,890 20,242,010
NET ASSETS 31,965,825 44,818,607
EQUITY
Capital 22 111,990,220 111,721,671
Reserves 23 6,542,653 2,714,579
Accumulated losses (86,567,048) (69,617,643)
EQUITY ATTRIBUTABLE TO OWNERS OF THE COMPANY 31,965,825 44,818,607
For
per
sona
l use
onl
y

THE ABOVE CONSOLIDATED STATEMENT OF CHANGES IN EQUITY SHOULD BE READ IN CONJUNCTION WITH THE ACCOMPANYING NOTES.
CONSOLIDATED STATEMENT OF CHANGES IN EQUITY FOR THE FINANCIAL YEAR ENDED 30 JUNE 2015
37
ISSUED CAPITAL
$
FOREIGN CURRENCY
TRANSLATION RESERVE
$
SHARE-BASED
PAYMENTS RESERVE
$
ACCUMULATED LOSSES
$TOTAL
$
BALANCE AT 1 JULY 2013 111,309,010 1,248,628 1,670,042 (72,824,259) 41,403,421
Profit for the period - - - 3,206,616 3,206,616
Exchange differences on translation of foreign operations - (355,014) - - (355,014)
Total comprehensive income - (355,014) - 3,206,616 2,851,602
Recognition of share-based payments - - 150,923 - 150,923
Issue of ordinary shares under Employee Share Option Plan 412,661 - - - 412,661
BALANCE AT 30 JUNE 2014 111,721,671 893,614 1,820,965 (69,617,643) 44,818,607
Loss for the period - - - (16,949,405) (16,949,405)
Exchange differences on translation of foreign operations - 3,312,600 - - 3,312,600
Total comprehensive income - 3,312,600 - (16,949,405) (13,636,805)
Recognition of share-based payments - - 515,474 - 515,474
Issue of ordinary shares under Employee Share Option Plan 268,549 - - - 268,549
BALANCE AT 30 JUNE 2015 111,990,220 4,206,214 2,336,439 (86,567,048) 31,965,825
For
per
sona
l use
onl
y

THE ABOVE CONSOLIDATED STATEMENT OF CASH FLOWS SHOULD BE READ IN CONJUNCTION WITH THE ACCOMPANYING NOTES.
38CONSOLIDATED STATEMENT OF CASH FLOWS FOR THE FINANCIAL YEAR ENDED 30 JUNE 2015
NOTE2015
$2014
$
CASH FLOWS FROM OPERATING ACTIVITIES
Research and Development Incentives received 7,796,611 7,004,342
Receipts from customers 27,502,747 3,511,431
Payments to suppliers and employees (29,620,018) (23,345,311)
Interest Paid (743,222) (87,236)
NET CASH GENERATED BY/(USED IN) OPERATING ACTIVITIES 29(b) 4,936,118 (12,916,774)
CASH FLOWS FROM INVESTING ACTIVITIES
Interest received 940,607 567,329
Payments for purchases of property, plant and equipment (846,258) (216,598)
Acquisition of Prestwick business 34 (391,136) -
NET CASH (USED IN)/GENERATED BY INVESTING ACTIVITIES (296,787) 350,731
CASH FLOWS FROM FINANCING ACTIVITIES
Repayment of borrowings (667,620) (139,332)
Proceeds from borrowings 12,688,036 339,739
Net proceeds from share issues 268,549 412,661
NET CASH GENERATED BY FINANCING ACTIVITIES 12,288,965 613,068
NET INCREASE/(DECREASE) IN CASH AND CASH EQUIVALENTS 16,928,296 (11,952,975)
Cash and cash equivalents at the beginning of the financial year 9,567,307 21,518,089
Effects of exchange rate changes on the balance of cash held in foreign currencies 16,930 2,193
CASH AND CASH EQUIVALENTS AT THE END OF THE YEAR 29(a) 26,512,533 9,567,307
For
per
sona
l use
onl
y

NOTES TO THE FINANCIAL STATEMENTS
TABLE OF CONTENTS
39
40
40
50
51
53
54
54
56
57
57
58
58
58
58
59
60
61
61
62
62
62
62
67
67
72
73
74
74
75
76
76
77
78
78
79
FOR THE FINANCIAL YEAR ENDED 30 JUNE 2015
NOTE 1: GENERAL INFORMATION
NOTE 2: SUMMARY OF SIGNIFICANT ACCOUNTING POLICIES
NOTE 3: CRITICAL ACCOUNTING ESTIMATES AND JUDGEMENTS
NOTE 4: SEGMENT INFORMATION
NOTE 5: REVENUE AND OTHER INCOME
NOTE 6: EXPENSES
NOTE 7: INCOME TAXES
NOTE 8: CASH AND CASH EQUIVALENTS
NOTE 9: OTHER FINANCIAL ASSETS
NOTE 10: TRADE AND OTHER RECEIVABLES
NOTE 11: INVENTORIES
NOTE 12: OTHER ASSETS
NOTE 13: SUBSIDIARIES
NOTE 14: PROPERTY, PLANT AND EQUIPMENT
NOTE 15: GOODWILL
NOTE 16: OTHER INTANGIBLE ASSETS
NOTE 17: TRADE AND OTHER PAYABLES
NOTE 18: BORROWINGS
NOTE 19: PROVISIONS
NOTE 20: OTHER LIABILITIES
NOTE 21: OTHER FINANCIAL LIABILITIES
NOTE 22: ISSUED CAPITAL
NOTE 23: RESERVES
NOTE 24: FINANCIAL INSTRUMENTS
NOTE 25: KEY MANAGEMENT PERSONNEL COMPENSATION
NOTE 26: COMMITMENTS FOR EXPENDITURE
NOTE 27: EVENTS OCCURRING AFTER REPORTING DATE
NOTE 28: REMUNERATION OF AUDITORS
NOTE 29: CASH FLOW INFORMATION
NOTE 30: EARNINGS PER SHARE
NOTE 31: RELATED PARTY TRANSACTIONS
NOTE 32: PARENT ENTITY INFORMATION
NOTE 33: CONTINGENT CONSIDERATION
NOTE 34: BUSINESS COMBINATIONS - ACQUISITION OF PRESTWICK CHEMICAL
NOTE 35: CONTINGENT LIABILITIES
For
per
sona
l use
onl
y

40
NOTE 1: GENERAL INFORMATION Bionomics Limited (the Company) is a listed public company incorporated in Australia. The address of its registered office and principal place of business is as follows:
31 Dalgleish Street Thebarton, South Australia, 5031 Tel: 08 8354 6100
Principal Activities The principal activities of the Company and its controlled entities (the Group) during the period include the discovery and development of novel drug candidates focused on the treatment of serious central nervous system disorders and cancer by leveraging proprietary platform technologies.
NOTE 2: SUMMARY OF SIGNIFICANT ACCOUNTING POLICIES This financial report includes the consolidated financial statements and notes of the Group.
Statement of Compliance These financial statements are general purpose financial statements which have been prepared in accordance with the Corporations Act 2001, Accounting Standards and Interpretations, and comply with other requirements of the law.
The financial statements comprise the consolidated financial statements of the Group. For the purposes of preparing the consolidated financial statements, the Company is a for-profit entity.
Accounting Standards include Australian Accounting Standards (AASB). Compliance with AASB ensures that the financial statements and notes of the company and the Group comply with International Financial Reporting Standards (IFRS).
The financial statements were authorised for issue by the directors on 7 August 2015.
Basis of Preparation The consolidated financial statements have been prepared on the basis of historical cost, except for certain non-current assets and financial instruments that are measured at revalued amounts or fair values at the end of each reporting period, as explained in the accounting policies below. Historical cost is generally based on the fair values of the consideration given in exchange for assets. All amounts are presented in Australian dollars unless otherwise noted.
Fair value is the price that would be received to sell an asset or paid to transfer a liability in an orderly transaction between market participants at the measurement date, regardless of whether that price is
directly observable or estimated using another valuation technique. In estimating the fair value of an asset or a liability, the Group takes into account the characteristics of the asset or liability if market participants would take those characteristics into account when pricing the asset or liability at measurement date. Fair value for measurement and/or disclosure purposes in these consolidated financial statements is determined on such a basis, except for share-based payment transactions that are within the scope of AASB 2 (IFRS 2), leasing transactions that are within the scope of AASB 117 (IAS 17), and measurements that have some similarities to fair value but are not fair value, such as net realisable value in AASB 2 (IFRS 2) or value in use in AASB 136 (IAS 36).
In addition, for financial reporting purposes, fair value measurements are categorised into Level 1, 2 or 3 based on the degree to which inputs to the fair value measurements are observable and the significance of the inputs to the fair value measurement in its entirety, which are described as follows:
¨��Level 1 inputs are quoted prices (unadjusted) in active markets for identical assets or liabilities that the entity can access at measurement date;
¨��Level 2 inputs are inputs, other than quoted prices included within Level 1, that are observable for that asset or liability, either directly or indirectly; and
¨��Level 3 inputs are unobservable inputs for the asset or liability.
Application of New and Revised Accounting Standards In the current year, the consolidated entity has adopted all of the new and revised Standards and Interpretations issued by the Australian Accounting Standards Board (the AASB) that are relevant to its operations and effective for the current annual reporting period. The adoption of these new and revised Standards and Interpretations has resulted in no significant changes to the consolidated entity’s accounting policies.
Standards and Interpretations in issue not yet adopted At the date of authorisation of the financial report, a number of Standards and Interpretations were in issue but not yet effective.
For
per
sona
l use
onl
y

41
Initial application of the following standards will not affect any of the amounts recognised in the financial report, but will change the disclosures presently made in relation to the financial report of the consolidated entity:
Impact of new and revised requirements Management is currently assessing the potential impact of the following standards:
AASB 9 (IFRS 9) ‘Financial Instruments’ (December 2009), and the relevant amending standards AASB 9 (IFRS 9) introduces new requirements for classifying and measuring financial assets, as follows:
¨��Debt instruments meeting both a ‘business model’ test and a ‘cash flow characteristics’ test are measured at amortised cost (the use of fair value is optional in some limited circumstances).
¨��Investments in equity instruments can be designated as ‘fair value through other comprehensive income’ with only dividends being recognised in profit or loss.
¨��All other instruments (including all derivatives) are measured at fair value with changes recognised in the profit or loss.
¨��The concept of ‘embedded derivatives’ does not apply to financial assets within the scope of the Standard and the entire instrument must be classified and measured in accordance with the above guidelines.
Through AASB 2013-9, (IFRS 9) a new hedge accounting model has been put in place that is designed to be more closely aligned with how entities undertake risk management activities when hedging financial and non-financial risk exposures.
AASB 9 (IFRS 9) ‘Financial Instruments’ (December 2010), and the relevant amending standards A revised version of AASB 9 (IFRS 9) incorporating revised requirements for the classification and measurement of financial liabilities, and carrying over of the existing derecognition requirements from AASB 139 (IAS 39) Financial Instruments: Recognition and Measurement.
The revised financial liability provisions maintain the existing amortised cost measurement basis for most liabilities. New requirements apply where an entity chooses to measure a liability at fair value through profit or loss – in these cases, the portion of the change in fair value related to changes in the entity’s own credit risk is presented in other comprehensive income rather than within profit or loss.
Through AASB 2013-9 (IFRS 9), a new hedge accounting model has been put in place that is designed to be more closely aligned with how entities undertake risk management activities when hedging financial and non-financial risk exposures.
NOTES TO THE FINANCIAL STATEMENTS FOR THE FINANCIAL YEAR ENDED 30 JUNE 2015
STANDARD
EFFECTIVE FOR ANNUAL
REPORTING PERIODS
BEGINNING ON OR AFTER
EXPECTED TO BE INITIALLY APPLIED IN THE FINANCIAL
YEAR ENDING
AASB 9 ‘Financial Instruments’, and the relevant amending standards 1 January 2018 30 June 2019
AASB 2014-4 ‘Amendments to Australian Accounting Standards – Clarification of Acceptable Methods of Depreciation and Amortisation’ 1 January 2016 30 June 2017
AASB 15 ‘Revenue from Contracts with Customers’ and AASB 2014-5 ‘Amendments to Australian Accounting Standards arising from AASB 15’ 1 January 2019 30 June 2020
AASB 2015-1 ‘Amendments to Australian Accounting Standards – Annual Improvements to Australian Accounting Standards 2012-2014 Cycle’ 1 January 2016 30 June 2017
AASB 2015-2 ‘Amendments to Australian Accounting Standards – Disclosure Initiative: Amendments to AASB 101’ 1 January 2016 30 June 2017
AASB 2015-3 ‘Amendments to Australian Accounting Standards arising from Withdrawal of AASB 1031 Materiality’ 1 July 2015 30 June 2016
AASB 2015-5 ‘Amendments to Australian Accounting Standards – Investment Entities: Applying the Consolidation Exception’ 1 January 2016 30 June 2017
For
per
sona
l use
onl
y

42
AASB 9 (IFRS 9) ‘Financial Instruments’ (December 2014), and the relevant amending standards The final version of AASB 9 (IFRS 9) brings together the classification and measurement, impairment and hedge accounting phases of the IASB’s project to replace AASB 139 (IAS 39) Financial Instruments: Recognition and Measurement. This version adds a new expected loss impairment model and limited amendments to classification and measurement for financial assets.
This new version supersedes AASB 9 (IFRS 9) (December 2009) and AASB 9 (IFRS 9) (December 2010). The new version of AASB 9 (IFRS 9) includes:
¨��requirements for impairment of financial assets; and
¨��limited amendments to classification and measurement of financial assets, including introduction of a measurement category of ‘fair value through other comprehensive income’ for debt instruments.
Note: Several versions of AASB 9 (IFRS 9) currently exist due to the issuance of the Standard over several years. In summary:
¨��the mandatory effective date of AASB 9 (IFRS 9) (all versions) and the related consequential amendments is annual periods beginning on or after 1 January 2018; and
¨��either AASB 9 (IFRS 9) (December 2009) or AASB 9 (IFRS 9) (December 2010) can be early adopted if adopted with an initial application date before 1 February 2015, however after this period only AASB 9 (IFRS 9) (December 2014) can be early adopted.
AASB 15 (IFRS 15) ‘Revenue from Contracts with Customers’ and AASB 2014-5 ‘Amendments to Australian Accounting Standards arising from AASB 15’ AASB 15 (IFRS 15) outlines a single comprehensive model for entities to use in accounting for revenue arising from contracts with customers; and replaces AASB 111 (IAS 11) Construction Contracts, AASB 118 (IAS 18) Revenue, Interpretation 13 Customer Loyalty Programmes, Interpretation 15 Agreements for the Construction of Real Estate, Interpretation 18 Transfers of Assets from Customers, and Interpretation 131 Revenue-Barter Transactions Involving Advertising Services.
The core principle is that an entity recognises revenue to depict the transfer of promised goods or services to customers in an amount that reflects the consideration to which the entity expects to be entitled in exchange for those goods or services.
AASB 2014-4 Amendments to Australian Accounting Standards – Clarification of Acceptable Methods of Depreciation and Amortisation Amends AASB 116 (IAS 16) Property, Plant and Equipment and AASB 138 (IAS 38) Intangible Assets to provide additional guidance on how the depreciation or amortisation of property, plant and equipment and intangible assets should be calculated.
AASB 2015-1 ‘Amendments to Australian Accounting Standards – Annual Improvements to Australian Accounting Standards 2012-2014 Cycle’ (‘Annual Improvements to IFRSs 2012-2014 Cycle’) Amends a number of pronouncements as a result of the IASB’s 2012-2014 annual improvements cycle.
Key amendments include:
¨��AASB 5 (IFRS 5) – Change in methods of disposal;
¨��AASB 7 (IFRS 7) – Servicing contracts and applicability of the amendments to AASB 7 to condensed interim financial statements;
¨��AASB 119 (IAS 19) – Discount rate: regional market issue; and
¨��AASB 134 (IAS 34) – Disclosure of information ‘elsewhere in the interim financial report’.
AASB 2015-2 Amendments to Australian Accounting Standards – Disclosure Initiative: Amendments to AASB 101 Amends AASB 101 Presentation of Financial Statements to provide clarification regarding the disclosure requirements in AASB 101.
Includes narrow-focus amendments to address concerns about existing presentation and disclosure requirements and to ensure entities are able to use judgements when applying a Standard in determining what information to disclose in their financial statements.
AASB 2015-3 Amendments to Australian Accounting Standards arising from the Withdrawal of AASB 1031 Materiality Completes the withdrawal of references to AASB 1031 in all Australian Accounting Standards and Interpretations, allowing that Standard to effectively be withdrawn. F
or p
erso
nal u
se o
nly

43 NOTES TO THE FINANCIAL STATEMENTS FOR THE FINANCIAL YEAR ENDED 30 JUNE 2015
AASB 2015-5 (IFRS 10 and IFRS 12) Amendments to Australian Accounting Standards – Investment Entities: Applying the Consolidation Exception Amends AASB 10 (IFRS 10) Consolidated Financial Statements, AASB 12 (IFRS 12) Disclosures of Interests in Other Entities and AASB 128 (IAS 28) Investments in Associates and Joint Ventures, to:
¨��confirm that the exemption from preparing consolidated financial statements set out in paragraph 4(a) of AASB 10 (IFRS 10) is available to a parent entity that is a subsidiary of an investment entity;
¨��clarify the applicability of AASB 12 (IFRS 12) to the financial statements of an investment entity; and
¨��introduce relief in AASB 128 (IAS 28) to permit a non-investment entity investor in an associate or joint venture that is an investment entity to retain the fair value through profit or loss measurement applied by the associate or joint venture to its subsidiaries.
Accounting Policies The following significant accounting policies have been adopted in the preparation and presentation of the financial report.
(a) Basis of Consolidation The consolidated financial statements incorporate the financial statements of the Company and entities controlled by the Company and its subsidiaries. Control is achieved when the Company:
¨�has power over the investee;
¨��is exposed, or has rights, to variable returns from its involvement with the investee; and
¨�has the ability to use its power to affect its returns.
Consolidation of a subsidiary begins when the Company obtains control over the subsidiary and ceases when the Company loses control of the subsidiary. Specifically, income and expenses of a subsidiary acquired or disposed of during the year are included in the consolidated statement of profit or loss and other comprehensive income from the date the Company gains control until the date when the Company ceases to control the subsidiary.
When necessary, adjustments are made to the financial statements of subsidiaries to bring their accounting policies into line with the Group’s accounting policies.
All intragroup assets and liabilities, equity, income, expenses and cash flows relating to transactions between members of the Group are eliminated in full on consolidation.
(b) Foreign Currencies The individual financial statements of each group entity are presented in the currency of the primary economic environment in which the entity operates (its functional currency). For the purpose of the consolidated financial statements, the results and financial position of each group entity are expressed in Australian dollars (‘$’), which is the functional currency of the Company and the presentation currency for the consolidated financial statements.
In preparing the financial statements of each individual group entity, transactions in currencies other than the entity’s functional currency (foreign currencies) are recognised at the rates of exchange prevailing at the dates of the transactions. At the end of each reporting period, monetary items denominated in foreign currencies are retranslated at the rates prevailing at that date. Non-monetary items carried at fair value that are denominated in foreign currencies are retranslated at the rates prevailing at the date when the fair value was determined. Non-monetary items that are measured in terms of historical cost in a foreign currency are not retranslated.
Exchange differences on monetary items are recognised in profit or loss in the period in which they arise except for exchange differences on monetary items receivable from or payable to a foreign operation for which settlement is neither planned nor likely to occur (therefore forming part of the net investment in the foreign operation), which are recognised initially in other comprehensive income and reclassified from equity to profit or loss on repayment of the monetary items.
For the purpose of presenting these consolidated financial statements, the assets and liabilities of the Group’s foreign operations are translated into Australian dollars using exchange rates prevailing at the end of the reporting period. Income and expense items are translated at the average exchange rates for the period. Exchange differences arising, if any, are recognised in other comprehensive income and accumulated in equity.
Goodwill and fair value adjustments to identifiable assets acquired and liabilities assumed through acquisition of a foreign operation are treated as assets and liabilities of the foreign operation and translated at the rate of exchange prevailing at the end of each reporting period. Exchange differences arising are recognised in other comprehensive income and accumulated in equity.
For
per
sona
l use
onl
y

44
(c) Revenue Recognition Revenue is recognised when the amounts of the revenue can be measured reliably, it is probable that economic benefits associated with the transaction will flow to the entity and specific criteria related to the type of revenues has been satisfied. The Group enters into collaboration agreements that comprise of up front payments in connection with out-licensing activities and research funding, milestone payments based on development achieved by our collaborators, sales and royalties based on net sales. For these agreements, the Group applies revenue recognition criteria to the separately identifiable components of a single transaction. The total arrangement consideration is allocated to separately identifiable components by reference to their fair values. Revenue for the periods presented included license revenues, contract services revenues, and rental income.
(i) License revenues in connection with out-licensing of the Group’s patents and other intellectual property to our collaborators are recognised when the following criteria have been met:
� ¨��The Group has transferred to the buyer the significant risks and rewards of ownership of the patents and intellectual property, and
� ¨��The Group does not retain either the continuing managerial involvement to the degree usually associated with ownership or the effective control over the patent and intellectual property.
Where the above criteria are not met, up-front payments received in connection with out-licensing activities would be deferred. All up-front license payments so far received have been recognised upon receipt.
(ii) For milestone receipts the Group’s collaboration partners may be obligated to make certain payments as they achieve certain specified milestones in the further development of the licensed property. To date no such milestone receipts have been received.
(iii) Contract service revenue relates to the provision of scientific services for a fee and is recognised when the services are rendered. The Group’s collaboration agreements contemplate its involvement in the ongoing research and development of its partnered drug candidates, for which the Group is paid fees for the services rendered. Revenue from such contracts to provide services is recognised as services are being rendered. In addition, the Group may enter into separate arrangements to undertake certain contract services work for a fee and such fees are
recognised by reference to the proportion of the total cost of performing the services to the total fee.
(iv) Rental income is recognised on a straight line basis over the term of the lease.
(d) Government Research and Development Incentives Government grants, including Research and Development incentives, are recognised at fair value where there is reasonable assurance that the grant will be received and all grant conditions will be met.
Grants relating to cost reimbursements are recognised as other income in profit or loss in the period when the costs were incurred or when the incentive meets the recognition requirements (if later).
(e) Income Tax Income tax expense represents the sum of the tax currently payable and deferred tax.
Current tax The tax currently payable is based on taxable profit for the year. Taxable profit differs from profit before tax as reported in the consolidated statement of profit or loss and other comprehensive income because of items of income or expense that are taxable or deductible in other years and items that are never taxable or deductible. The Group’s current tax is calculated using tax rates that have been enacted or substantively enacted by the end of the reporting period.
Deferred tax Deferred tax is recognised on temporary differences between the carrying amounts of assets and liabilities in the consolidated financial statements and the corresponding tax bases used in the computation of taxable profit. Deferred tax liabilities are generally recognised for all taxable temporary differences. Deferred tax assets are generally recognised for all deductible temporary differences to the extent that it is probable that taxable profits will be available against which those deductible temporary differences can be utilised. Such deferred tax assets and liabilities are not recognised if the temporary difference arises from the initial recognition (other than in a business combination) of assets and liabilities in a transaction that affects neither the taxable profit nor the accounting profit. In addition, deferred tax liabilities are not recognised if the temporary difference arises from the initial recognition of goodwill.
For
per
sona
l use
onl
y

45
Deferred tax assets and liabilities are measured at the tax rates that are expected to apply in the period in which the liability is settled or the asset realised, based on tax rates (and tax laws) that have been enacted or substantively enacted by the end of the reporting period. The measurement of deferred tax liabilities and assets reflects the tax consequences that would follow from the manner in which the Group expects, at the end of the reporting period, to recover or settle the carrying amount of its assets and liabilities.
Deferred tax liabilities and assets are offset when there is a legally enforceable right to set off current tax assets against current tax liabilities and when they relate to income taxes levied by the same taxation authority and the Group intends to settle its current tax assets and liabilities on a net basis.
Current and deferred tax for the year Current and deferred tax are recognised in profit or loss, except when they relate to items that are recognised in other comprehensive income or directly in equity, in which case the current and deferred tax are also recognised in other comprehensive income or directly in equity, respectively. Where current tax or deferred tax arises from the initial accounting for a business combination, the tax effect is included in the accounting for the business combination.
(i) Tax Consolidation Legislation Bionomics and its wholly-owned Australian controlled entities have implemented the tax consolidation legislation effective 31 December 2005.
The head entity, Bionomics, and the controlled entities in the tax consolidated group account for their own current and deferred tax amounts. These tax amounts are measured as if each entity in the tax consolidated group continues to be a stand-alone taxpayer in its own right.
In addition to its own current and deferred tax amounts, Bionomics also recognises the current tax liabilities (or assets) and the deferred tax assets arising from unused tax losses and unused tax credits assumed from controlled entities in the tax consolidated group.
Assets or liabilities arising under tax funding agreements with the tax consolidated entities are recognised as amounts receivable from or payable to other entities in the group.
Any difference between the amounts assumed and amounts receivable or payable under the tax funding agreement are recognised as a contribution to (or distribution from) wholly-owned tax consolidated entities.
(f) Business Combinations Acquisitions of businesses are accounted for using the acquisition method. The consideration transferred in a business combination is measured at fair value which is calculated as the sum of the acquisition-date fair values of assets transferred by the Group, liabilities incurred by the Group to the former owners of the acquiree and the equity instruments issued by the Group in exchange for control of the acquiree. Acquisition-related costs are recognised in profit or loss as incurred.
At the acquisition date, the identifiable assets acquired and the liabilities assumed are recognised at their fair value, except that:
¨��deferred tax assets or liabilities and assets or liabilities related to employee benefit arrangements are recognised and measured in accordance with AASB 112 (IAS 12) ‘Income Taxes’ and AASB 119 (IAS 19) ‘Employee Benefits’ respectively;
¨��liabilities or equity instruments related to share-based payment arrangements of the acquiree or share-based payment arrangements of the Group entered into to replace share-based payment arrangements of the acquiree are measured in accordance with AASB 2 (IFRS 2) ‘Share-based Payment’ at the acquisition date; and
¨��assets (or disposal groups) that are classified as held for sale in accordance with AASB 5 (IFRS 5) ‘Non-current Assets Held for Sale and Discontinued Operations’ are measured in accordance with that Standard.
Goodwill is measured as the excess of the sum of the consideration transferred, the amount of any non-controlling interests in the acquiree, and the fair value of the acquirer’s previously held equity interest in the acquiree (if any) over the net of the acquisition-date amounts of the identifiable assets acquired and the liabilities assumed. If, after reassessment, the net of the acquisition-date amounts of the identifiable assets acquired and liabilities assumed exceeds the sum of the consideration transferred, the amount of any non-controlling interests in the acquiree and the fair value of the acquirer’s previously held interest in the acquiree (if any), the excess is recognised immediately in profit or loss as a gain on bargain purchase.
Where the consideration transferred by the Group in a business combination includes assets or liabilities resulting from a contingent consideration arrangement, the contingent consideration is measured at its acquisition-date fair value. Changes in the fair value of the contingent consideration that qualify as measurement period adjustments are adjusted retrospectively, with corresponding adjustments against goodwill.
NOTES TO THE FINANCIAL STATEMENTS FOR THE FINANCIAL YEAR ENDED 30 JUNE 2015
For
per
sona
l use
onl
y
46
Measurement period adjustments are adjustments that arise from additional information obtained during the ‘measurement period’ (which cannot exceed one year from the acquisition date) about facts and circumstances that existed at the acquisition date.
The subsequent accounting for changes in the fair value of contingent consideration that do not qualify as measurement period adjustments depends on how the contingent consideration is classified. Contingent consideration that is classified as equity is not remeasured at subsequent reporting dates and its subsequent settlement is accounted for within equity. Contingent consideration that is classified as an asset or liability is remeasured at subsequent reporting dates in accordance with AASB 139 (IFRS 39), or AASB 137 (IFRS 37) ‘Provisions, Contingent Liabilities and Contingent Assets’ respectively, as appropriate, with the corresponding gain or loss being recognised in profit or loss, respectively.
If the initial accounting for a business combination is incomplete by the end of the reporting period in which the combination occurs, the Group reports provisional amounts for the items for which the accounting is incomplete. Those provisional amounts are adjusted during the measurement period (see above), or additional assets or liabilities are recognised, to reflect new information obtained about facts and circumstances that existed as of the acquisition date that, if known, would have affected the amounts recognised as of that date.
(g) Impairment of Tangible and Intangible Assets Other than Goodwill At the end of each reporting period, the Group reviews the carrying amounts of its tangible and intangible assets to determine whether there is any indication that those assets have suffered an impairment loss. If any such indication exists, the recoverable amount of the asset is estimated in order to determine the extent of the impairment loss (if any). When it is not possible to estimate the recoverable amount of an individual asset, the Group estimates the recoverable amount of the cash generating unit to which the asset belongs. When a reasonable and consistent basis of allocation can be identified, corporate assets are also allocated to individual cash generating units, or otherwise they are allocated to the smallest group of cash generating units for which a reasonable and consistent allocation basis can be identified.
A Cash Generating Unit (CGU) is the smallest identifiable group of assets that generates cash flow that are largely independent of cash flows from other assets or group of assets. The cash generating units are defined as a research program that has the potential to be
commercialised at some point in the future. Achievement of certain milestones within the research program will determine when a CGU comes into existence.
Intangible assets with indefinite useful lives are tested for impairment at least annually, and whenever there is an indication that the asset may be impaired.
Recoverable amount is the higher of fair value less costs to sell and value in use. In assessing value in use, the estimated future cash flows are discounted to their present value using a pre-tax discount rate that reflects current market assessments of the time value of money and the risks specific to the asset for which the estimates of future cash flows have not been adjusted.
If the recoverable amount of an asset (or cash generating unit) is estimated to be less than its carrying amount, the carrying amount of the asset (or cash generating unit) is reduced to its recoverable amount. An impairment loss is recognised immediately in profit or loss, unless the relevant asset is carried at a revalued amount, in which case the impairment loss is treated as a revaluation decrease.
Where an impairment loss subsequently reverses, the carrying amount of the asset (or cash generating unit) is increased to the revised estimate of its recoverable amount, but so that the increased carrying amount does not exceed the carrying amount that would have been determined had no impairment loss been recognised for the asset (or cash generating unit) in prior years. A reversal of an impairment loss is recognised immediately in profit or loss, unless the relevant asset is carried at a revalued amount, in which case the reversal of the impairment loss is treated as a revaluation increase.
(h) Cash and Cash Equivalents Cash and cash equivalents includes cash on hand, deposits held at call with financial institutions, other short term, highly liquid investments with original maturities of three months or less that are readily convertible to known amounts of cash and which are subject to an insignificant risk of changes in value and bank overdrafts. Bank overdrafts are shown within borrowings in current liabilities on the consolidated statement of financial position.
(i) Inventories Consumables are stated at the lower of cost and net realisable value.
For
per
sona
l use
onl
y

47 NOTES TO THE FINANCIAL STATEMENTS FOR THE FINANCIAL YEAR ENDED 30 JUNE 2015
(j) Property, Plant and Equipment Land is stated at cost less any impairment losses if applicable and is not depreciated.
Building, plant and equipment are stated at cost less accumulated depreciation or accumulated impairment losses, where applicable.
Depreciation is recognised so as to write off the cost of assets less their residual values over their useful lives, using the diminishing value or straight-line methods, depending on the type of asset. The estimated useful lives, residual values and depreciation method are reviewed at the end of each reporting period.
The depreciation rates for each class of depreciable assets are:
¨�buildings 25 years¨�plant and equipment 20 – 40%¨�equipment under lease 3 – 5 years
An item of property, plant and equipment is derecognised upon disposal or when no future economic benefits are expected to arise from the continued use of the asset. Any gain or loss arising on the disposal or retirement of an item of property, plant and equipment is determined as the difference between the sales proceeds and the carrying amount of the asset and is recognised in profit or loss.
(k) Financial Assets Financial assets are classified into the following specified categories: ‘held-to-maturity’ investments and ‘receivables’. The classification depends on the nature and purpose of the financial assets and is determined at the time of initial recognition. All regular way purchases or sales of financial assets are recognised and derecognised on a trade date basis. Regular way purchases or sales are purchases or sales of financial assets that require delivery of assets within the time frame established by regulation or convention in the marketplace.
(i) Held-to-maturity Investments Bills of exchange and debentures with fixed or determinable payments and fixed maturity dates that the Group has the positive intent and ability to hold to maturity are classified as held-to-maturity investments. Held-to-maturity investments are measured at amortised cost using the effective interest method less any impairment.
(ii) Receivables Trade receivables and other receivables that have fixed or determinable payments that are not quoted in an active market are classified as ‘receivables’.
Interest income is recognised by applying the effective interest rate, except for short term receivables when the effect of discounting is immaterial.
(iii) Impairment of Financial Assets Financial assets, other than those at fair value through profit or loss, are assessed for indicators of impairment at each reporting date. Financial assets are impaired where there is objective evidence that as a result of one or more events that occurred after the initial recognition of the financial asset the estimated future cash flows of the investment have been impacted.
For financial assets carried at amortised cost, the amount of the impairment is the difference between the asset’s carrying amount and the present value of estimated future cash flows, discounted at the original effective interest rate.
The carrying amount of financial assets including uncollectible trade receivables is reduced by the impairment loss through the use of an allowance account. Subsequent recoveries of amounts previously written off are credited against the allowance account. Changes in the carrying amount of the allowance account are recognised in profit or loss.
(l) Intangible Assets
(i) Intellectual Property Acquired intellectual property is recognised as an asset at cost and amortised over its useful life. There is currently no internally generated intellectual property that has been capitalised. Intellectual property with a finite life is amortised on a straight line basis over that life. Intellectual property with an indefinite useful life is subjected to an annual impairment review. There is currently no intellectual property with an indefinite life.
Current useful life of all existing intellectual property is in the range of 5 to 20 years.
The assets’ residual values and useful lives are reviewed, and adjusted if appropriate, at each balance date.
(ii) Goodwill Goodwill arising on an acquisition of a business is carried at cost as established at the date of the acquisition of the business (see Note 2(f) above) less accumulated impairment losses, if any.
For the purposes of impairment testing, goodwill is allocated to each of the Group’s cash generating units (or groups of cash generating units) that is expected to benefit from the synergies of the combination.
For
per
sona
l use
onl
y

48
A cash generating unit to which goodwill has been allocated is tested for impairment annually, or more frequently when there is an indication that the unit may be impaired. If the recoverable amount of the cash generating unit is less than its carrying amount, the impairment loss is allocated first to reduce the carrying amount of any goodwill allocated to the unit and then to the other assets of the unit pro rata based on the carrying amount of each asset in the unit. Any impairment loss for goodwill is recognised directly in profit or loss. An impairment loss recognised for goodwill is not reversed in subsequent periods.
On disposal of the relevant cash generating unit, the attributable amount of goodwill is included in the determination of the profit or loss on disposal.
(iii) Intangible assets acquired in a business combination Intangible assets acquired in a business combination and recognised separately from goodwill are initially recognised at their fair value at the acquisition date (which is regarded as their cost).
Subsequent to initial recognition, intangible assets acquired in a business combination are reported at cost less accumulated amortisation and accumulated impairment losses, on the same basis as intangible assets that are acquired separately.
(m) Research and DevelopmentExpenditure on research activities, undertaken with the prospect of obtaining new scientific or technical knowledge and understanding, is recognised as an expense when it is incurred. Expenditure on development activities are capitalised only when technical feasibility studies identify that the project will deliver future economic benefits and these benefits can be measured reliably. Development costs have a finite life and are amortised on a systematic basis matched to the future economic benefits over the useful life of the project. At year end there are currently no capitalised development costs.
(n) Trade and Other PayablesThese amounts represent liabilities for goods and ser-vices provided to the Group prior to the end of financial year which are unpaid. The amounts are unsecured and are usually paid within 45 days of recognition.
(o) Employee Benefits(i) Short-term and Long-term employee benefits A liability is recognised for benefits accruing to employees in respect of wages and salaries, annual leave, long service leave, and sick leave when it is
probable that settlement will be required and they are capable of being measured reliably. Liabilities recognised in respect of short-term employee benefits, are measured at their nominal values using the remuneration rate expected to apply at the time of settlement. Liabilities recognised in respect of long term employee benefits are measured as the present value of the estimated future cash outflows to be made by the Group in respect of services provided by employees up to reporting date.
(ii) Retirement benefits costs Retirement benefits are contributions made to employee superannuation funds and are charged as expenses when incurred. These contributions are made to external superannuation funds and are not defined benefits programs. Consequently there is no exposure to market movements on employee superannuation liabilities or entitlements.
(iii) Share-based Payments Share-based compensation benefits are provided to employees via the Bionomics Employee Share Option Plan and an Employee Share Plan.
The fair value of shares issued to employees for no cash consideration under the Employee Share Plan is recognised as an employee benefits expense with a corresponding increase in equity. The fair value is measured at grant date and recognised on a straight line basis over the vesting period, based on the Group’s estimate of equity instruments that will eventually vest. The Employee Share Plan is currently not active.
The disclosure in the Remuneration Reports and Note 22 relates to the Employee Share Option Plan.
The Bionomics Employee Share Option Plan was approved by the Board and shareholders in 2014. Staff eligible to participate in the plan are those who have been a full-time or part-time employee of the Group for a period of not less than six months or a director of the Group. Options are granted under the plan for no consideration and vest equally over five years, unless they are bonus options which vest immediately.
The amounts disclosed as remuneration relating to options are the assessed fair values at grant date of those options allocated equally over the period from grant date to vesting date. Fair values at grant date are independently determined using a Black-Scholes option pricing model that takes into account the exercise price, the term of the option and the vesting criteria.
For
per
sona
l use
onl
y

49
(p) Borrowings (other financial liabilities)(i) Warrants Warrants issued by the Group in connection with bank loans are classified as either financial liabilities or as equity in accordance with the substance of the contractual arrangement. Where the warrants do not meet the definition of equity, they are measured at fair value on inception with a corresponding reduction to the associated borrowings. Subsequent to initial recognition, the liability is fair valued with gains or losses recognised in the profit or loss. See Note 21 for further details.
(ii) Other Borrowings Borrowings are initially recognised at fair value, net of transaction costs incurred. Borrowings are subsequently measured at amortised cost. Any difference between the proceeds (net of transaction costs) and the redemption amount is recognised in profit or loss over the period of the borrowings using the effective interest method.
(iii) Classification Borrowings are classified as current liabilities unless the Group has an unconditional right to defer settlement of the liability for at least 12 months after the balance sheet date.
(q) Borrowing Costs All borrowing costs are recognised in profit or loss in the period in which they are incurred.
(r) Leases Leases of property, plant and equipment where the Group has substantially all the risks and rewards of ownership are classified as finance leases. Finance leases are capitalised at the lease’s inception at the lower of the fair value of the leased property and the present value of the minimum lease payments. The corresponding rental obligations, net of finance charges, are included in other long term payables. Each lease payment is allocated between the liability and finance charges so as to achieve a constant rate on the finance balance outstanding. The interest element of the finance cost is charged to the profit or loss over the lease period so as to produce a constant periodic rate of interest on the remaining balance of the liability for each period. The property, plant and equipment acquired under finance leases is depreciated over the shorter of the asset’s useful life and the lease term.
Leases in which a significant portion of the risks and rewards of ownership are retained by the lessor are classified as operating leases. Payments made under operating leases (net of any incentives received from the lessor) are charged to profit or loss on a straight-line basis over the period of the lease.
Lease income from operating leases is recognised in income on a straight-line basis over the lease term.
(s) Issued Capital Ordinary shares are classified as equity.
Incremental costs directly attributable to the issue of new shares or options, or for the acquisition of a business, are deducted directly from equity.
(t) Earnings/(Loss) per Share(i) Basic Earnings/(Loss) per Share Basic earnings/(loss) per share is calculated by dividing the profit/(loss) after income tax attributable to equity holders of the company, excluding any costs of servicing equity other than ordinary shares, by the weighted average number of ordinary shares outstanding during the year, adjusted for bonus elements in ordinary shares issued during the year.
(ii) Diluted Earnings/(Loss) per Share Diluted earnings/(loss) per share adjusts the figures used in the determination of basic earnings per share to take into account the after income tax effect of interest and other financing costs associated with dilutive potential ordinary shares and the weighted average number of shares assumed to have been issued for no consideration in relation to options.
(u) Goods and Services Tax (GST) Revenues, expenses and assets are recognised net of the amount of associated GST, unless the GST incurred is not recoverable from the taxation authority. In this case it is recognised as part of the cost of acquisition of the asset or as part of the expense.
Receivables and payables are stated inclusive of the amount of GST receivable or payable. The net amount of GST recoverable from, or payable to, the taxation authority is included with other receivables or payables in the consolidated statement of financial position.
Cash flows are presented on a gross basis. The GST component of cash flow arising from investing or financing activities which are recoverable from, or payable to the taxation authority, are presented as operating cash flow.
NOTES TO THE FINANCIAL STATEMENTS FOR THE FINANCIAL YEAR ENDED 30 JUNE 2015
For
per
sona
l use
onl
y

50
NOTE 3: CRITICAL ACCOUNTING ESTIMATES AND JUDGEMENTS The preparation of our consolidated financial statements requires the Group to make estimates and judgments that can affect the reported amounts of assets, liabilities, revenues and expenses, as well as the disclosure of contingent assets and liabilities at the date of the financial statements. The Group analyses the estimates and judgments and base estimates and judgments on historical experience and various other assumptions that are believed to be reasonable under the circumstances. Actual results may vary from the estimates. The significant accounting policies are detailed in Note 2 for the year ended 30 June 2015. Summarised below are the accounting policies of particular importance to the portrayal of the financial position and results of operations and that require the application of significant judgment or estimates by management.
Impairment of Goodwill and Other Intangible Assets The Group assesses annually, or whenever there is a change in circumstances, whether goodwill or other intangible assets may be impaired. Determining whether goodwill and other intangible assets are impaired requires an estimation of the value in use of the cash generating units to which goodwill or other intangible assets have been allocated. The value in use calculation is judgmental in nature and requires the Group to make a number of estimates including the future cash flows expected to arise from the cash generating units based on observable market comparables for drug compounds within the cash generating unit and over a period covering drug discovery, development, approval and marketing as well as, a suitable discount rate in order to calculate present value. The cash flow projections are further weighted based on the observable market comparables probability of realising projected milestone and royalty payments. When the carrying value of the cash generating unit exceeds its recoverable amount, the cash generating unit is considered impaired and is written down to its recoverable amount. Impairment losses are further recognised in the consolidated statement of profit or loss and other comprehensive income. A detailed valuation was performed as of 30 June 2015 and each computed fair value of our cash generating unit was in excess of the carrying amount respectively. As a result of this evaluation, it was determined that no impairment of goodwill or other intangible assets existed at 30 June 2015.
Contingent Consideration As a result of the acquisition of Eclipse Therapeutic, Inc. (Eclipse) during the year ended 30 June 2013, the Group determines and recognises at each reporting date the fair value of the additional consideration that may be payable
to Eclipse security holders due to potential royalty payments based on achieving late-stage development success or partnering outcomes based on Eclipse assets. Such potential earn-out payments are recorded at fair value and include a number of significant estimates including adjusted revenue projections and expenses, probability of such projections and a suitable discount rate to calculate present value.
Gain on Bargain Purchase The purchase price of acquisitions is allocated to identifiable assets acquired and liabilities assumed at their acquisition date fair values based on established valuation techniques. Goodwill represents the residual value as of the acquisition date, which in most cases is measured as the excess of the purchase consideration transferred over the net of the acquisition date fair values of the assets acquired and liabilities assumed. In cases of a bargain purchase, a gain is recognised in the consolidated statement of profit or loss and other comprehensive income. During the fiscal year ended 30 June 2015, the Company recorded a gain on bargain purchase resulting from the acquisition of Prestwick. As the predecessor company was in administration, the administrator sought bids for the assets of the company and the Group was the sole bidder.
Revenue Recognition From time to time the Group enters into license and collaboration arrangements for licensing and research activities, for which the Group may receive payments in connection with out-licensing and research funding activities, milestone payments based on developments achieved by our collaborators and royalties based on net sales. For these agreements, the Group applies the revenue recognition criteria to the separately identifiable component and the total arrangement consideration is allocated to separately identifiable components by reference to their fair values. License revenue is further recognised once the Group has transferred to the buyer the significant risks and rewards of ownership of the patent and intellectual property and the Group does not retain involvement to the degree associated with ownership or effective control over the patent and intellectual property. Any provision of scientific services included in those license and collaboration agreements is further recognised as contract services revenue when the services are rendered. In addition, our wholly-owned subsidiaries, Neurofit and Prestwick, provide third party contract services which are recognised by reference to the proportion of the total cost of the contract. The Group has not received any payment and has not recognised any revenues related to milestone payments.
For
per
sona
l use
onl
y
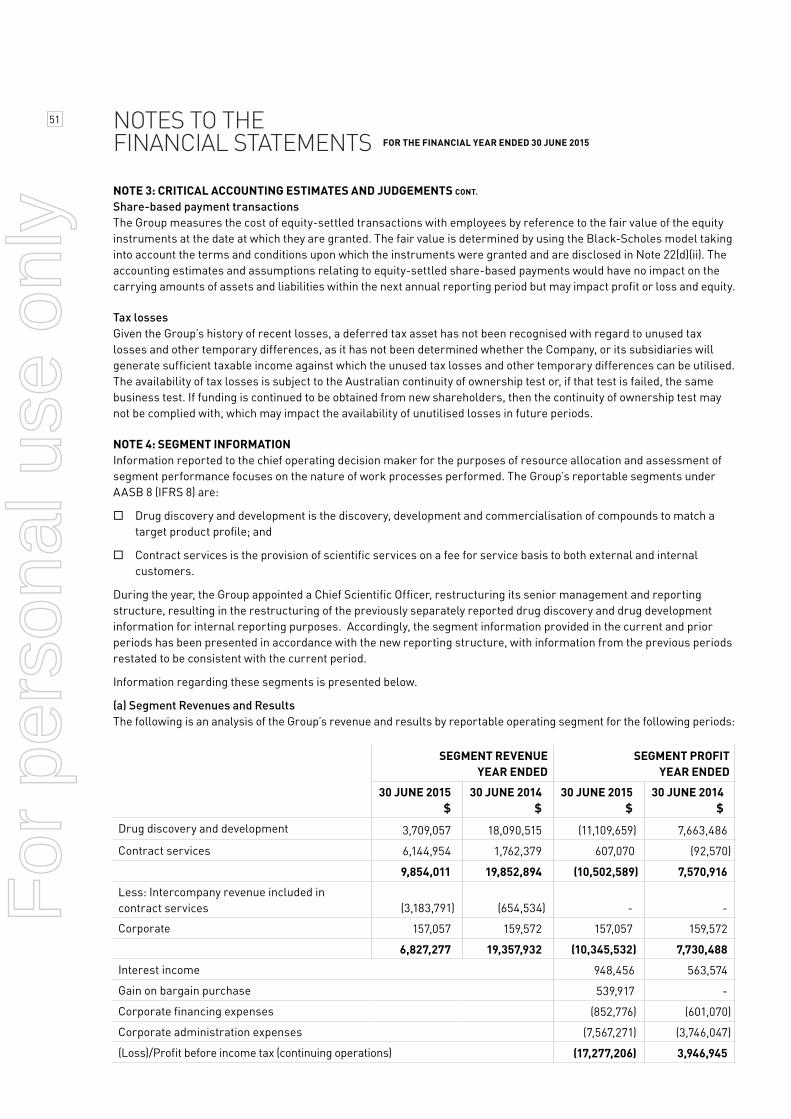
51 NOTES TO THE FINANCIAL STATEMENTS FOR THE FINANCIAL YEAR ENDED 30 JUNE 2015
NOTE 3: CRITICAL ACCOUNTING ESTIMATES AND JUDGEMENTS CONT. Share-based payment transactions The Group measures the cost of equity-settled transactions with employees by reference to the fair value of the equity instruments at the date at which they are granted. The fair value is determined by using the Black-Scholes model taking into account the terms and conditions upon which the instruments were granted and are disclosed in Note 22(d)(ii). The accounting estimates and assumptions relating to equity-settled share-based payments would have no impact on the carrying amounts of assets and liabilities within the next annual reporting period but may impact profit or loss and equity.
Tax losses Given the Group’s history of recent losses, a deferred tax asset has not been recognised with regard to unused tax losses and other temporary differences, as it has not been determined whether the Company, or its subsidiaries will generate sufficient taxable income against which the unused tax losses and other temporary differences can be utilised. The availability of tax losses is subject to the Australian continuity of ownership test or, if that test is failed, the same business test. If funding is continued to be obtained from new shareholders, then the continuity of ownership test may not be complied with, which may impact the availability of unutilised losses in future periods.
NOTE 4: SEGMENT INFORMATION Information reported to the chief operating decision maker for the purposes of resource allocation and assessment of segment performance focuses on the nature of work processes performed. The Group’s reportable segments under AASB 8 (IFRS 8) are:
¨��Drug discovery and development is the discovery, development and commercialisation of compounds to match a target product profile; and
¨��Contract services is the provision of scientific services on a fee for service basis to both external and internal customers.
During the year, the Group appointed a Chief Scientific Officer, restructuring its senior management and reporting structure, resulting in the restructuring of the previously separately reported drug discovery and drug development information for internal reporting purposes. Accordingly, the segment information provided in the current and prior periods has been presented in accordance with the new reporting structure, with information from the previous periods restated to be consistent with the current period.
Information regarding these segments is presented below.
(a) Segment Revenues and Results The following is an analysis of the Group’s revenue and results by reportable operating segment for the following periods:
SEGMENT REVENUE YEAR ENDED
SEGMENT PROFITYEAR ENDED
30 JUNE 2015$
30 JUNE 2014$
30 JUNE 2015$
30 JUNE 2014$
Drug discovery and development 3,709,057 18,090,515 (11,109,659) 7,663,486
Contract services 6,144,954 1,762,379 607,070 (92,570)
9,854,011 19,852,894 (10,502,589) 7,570,916
Less: Intercompany revenue included in contract services (3,183,791) (654,534) - -
Corporate 157,057 159,572 157,057 159,572
6,827,277 19,357,932 (10,345,532) 7,730,488
Interest income 948,456 563,574
Gain on bargain purchase 539,917 -
Corporate financing expenses (852,776) (601,070)
Corporate administration expenses (7,567,271) (3,746,047)
(Loss)/Profit before income tax (continuing operations) (17,277,206) 3,946,945
For
per
sona
l use
onl
y

52
NOTE 4: SEGMENT INFORMATION CONT. Revenue reported above for Contract services includes intersegment sales. There were no intersegment sales for the other reportable segment.
Segment profit represents the result for each segment without allocation of central administration expenses and investment and other revenue.
(b) Segment Assets and Liabilities The following is an analysis of the Group’s assets and liabilities by reportable operating segment:
The Board receive information on liabilities for the Group as a whole as well as liability information for the Contract services segment.
The Board receive information on non-current assets for the Group as a whole as well as non-current asset information for the Contract services segment. Additions to non-current assets:
(c) Other Segment Information The segment result above has been determined after including the following items:
30 JUNE 2015$
30 JUNE 2014$
ASSETS
Drug discovery and development 35,397,049 52,975,741
Contract services 5,487,569 1,371,560
40,884,618 54,347,301
Corporate 28,247,097 10,713,316
TOTAL ASSETS 69,131,715 65,060,617
LIABILITIES
Drug discovery and development 3,164,293 5,682,699
Contract services (excluding intercompany liabilities) 2,160,652 979,488
Corporate 31,840,945 13,579,823
TOTAL LIABILITIES 37,165,890 20,242,010
30 JUNE 2015$
30 JUNE 2014$
Contract services 2,212,081 6,822
Drug discovery and development 846,258 209,776
3,058,339 216,598
DEPRECIATION AND AMORTISATION YEAR ENDED
30 JUNE 2015$
30 JUNE 2014$
Drug discovery and development 1,603,365 1,264,095
Contract services 110,127 236,841
1,713,492 1,500,936
For
per
sona
l use
onl
y

53 NOTES TO THE FINANCIAL STATEMENTS FOR THE FINANCIAL YEAR ENDED 30 JUNE 2015
NOTE 4: SEGMENT INFORMATION CONT.
(d) Revenue from Major Products and Services The following is an analysis of the Group’s external revenue from its major products and services:
(e) Geographical Information The Group operates in three geographical areas, Australia, France and United States of America. The Group’s external revenue and information about its non-current assets by geographical segment are detailed below:
(i) License revenues of $18,046,709 was recognised in the year ended 30 June 2014 related to upfront payment received from our collaboration and license agreement entered in 2014. No such payment were recognised during the year ended 30 June 2015.
(ii) The Government Research and Development Incentives include cash refunds provided by the Australian Government for 45% of eligible research and development expenditures by Australian entities having a tax loss and less than A$20.0 million in revenue. The grants are calculated at the end of the fiscal year to which they relate, based on the expenses incurred in and included in the fiscal year’s Australian income tax return after registration.
(f) Information about Major Customers Included in revenues for the drug discovery and development segment is $3,667,949 (2014: $18,046,709) from one party. No other customer contributed 10% or more to the Group’s revenue for both 2015 and 2014.
30 JUNE 2015$
30 JUNE 2014$
Contract services 6,629,113 1,095,356
License revenue - 18,046,709
Other 198,164 215,867
6,827,277 19,357,932
NOTE 5: REVENUE AND OTHER INCOME30 JUNE 2015
$30 JUNE 2014
$
Revenue
Contract services 6,629,113 1,095,356
Royalties 41,108 56,197
License revenue (i) - 18,046,709
Rent income 157,056 159,670
6,827,277 19,357,932
Other income from continuing operations
Gain on bargain purchase (Note 34) 539,917 -
Interest income 948,456 563,574
Foreign Government grants 1,311,303 118,892
Government Research and Development Incentives (ii) 6,989,452 7,505,598
9,789,128 8,188,064
REVENUE FROM EXTERNAL CUSTOMERS YEAR ENDED
NON-CURRENT ASSETS YEAR ENDED
30 JUNE 2015$
30 JUNE 2014$
30 JUNE 2015$
30 JUNE 2014$
Australia 3,866,113 18,250,087 28,251,420 25,181,146
France 2,961,164 1,107,845 2,606,024 395,887
USA - - 393,363 349,516
6,827,277 19,357,932 31,250,807 25,926,549
For
per
sona
l use
onl
y

54
NOTE 5: REVENUE AND OTHER INCOME CONT.
of the research and development activities with the relevant authorities. There are no unfulfilled conditions or other contingencies attaching to the government Research and Development Incentive. Potentially eligible overseas expenditure awaiting government approval pending review of applications submitted during the year ended 30 June 2015 has been excluded from the calculation of the Research and Development Incentive and if approved, will result in an additional receipt of approximately $1.5 million (2014: $0).
NOTE 6: EXPENSES30 JUNE 2015
$30 JUNE 2014
$
(Loss)/profit before income tax benefit includes the following specific expenses:
Finance expenses
- Interest expense on bank and other loans 689,049 59,758
- Interest expense on contingent consideration 156,362 522,266
- Interest obligations under finance leases 18,421 27,478
863,832 609,502
Depreciation and amortisation
- Building 56,763 -
- Plant and equipment 397,259 142,048
- Equipment under lease 56,898 83,174
510,920 225,222
Amortisation of non-current assets
- Intellectual property 1,202,572 1,275,714
Rental expense on operating leases
- Minimum lease payments 1,019,393 1,027,921
Employment benefit expenses of:
- Wages and salaries 7,058,953 5,610,406
- Superannuation 423,895 235,220
- Share-based payments 515,474 150,923
7,998,322 5,996,549
Foreign currency loss/(gain) 2,213,872 (778)
Loss on disposal of assets
- Plant and equipment 8,063 6,765
NOTE 7: INCOME TAXES30 JUNE 2015
$30 JUNE 2014
$
(a) Income Tax Recognised in Profit or Loss
Current tax
In respect of the current year - 740,329
- 740,329
Deferred tax
Recognised in current year (327,801) -
(327,801) -
Total income tax (benefit)/expense (327,801) 740,329
For
per
sona
l use
onl
y
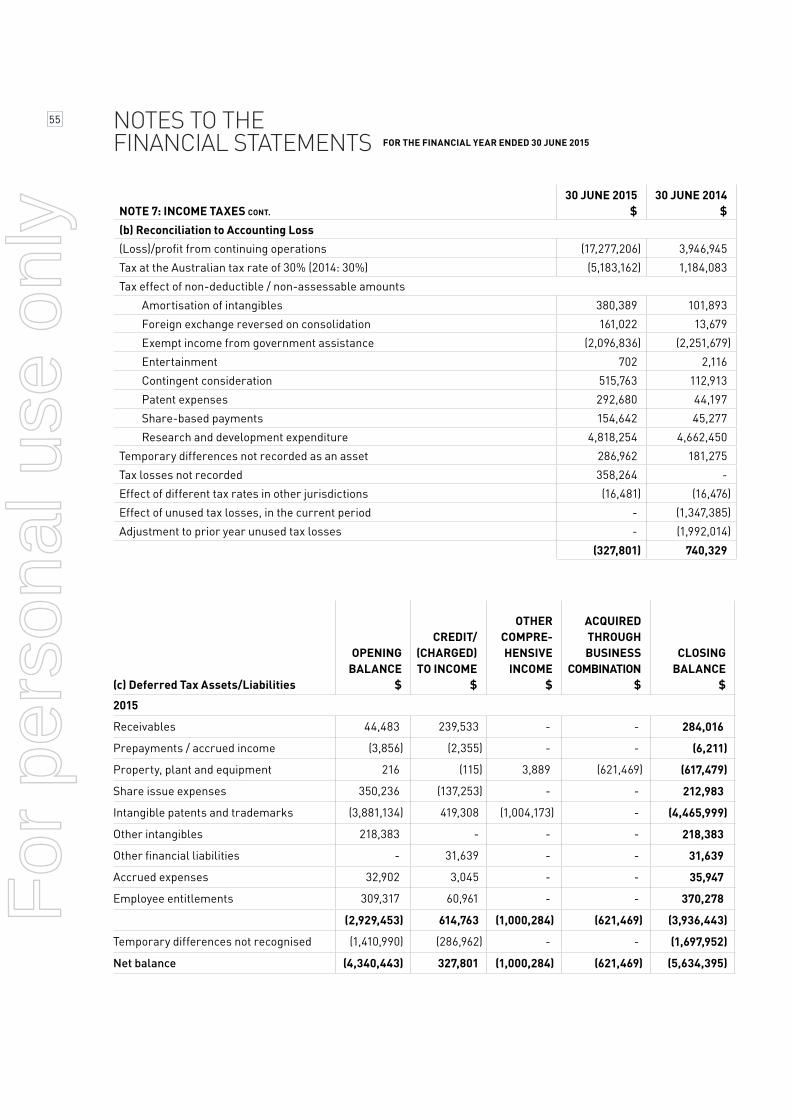
55 NOTES TO THE FINANCIAL STATEMENTS FOR THE FINANCIAL YEAR ENDED 30 JUNE 2015
NOTE 7: INCOME TAXES CONT.
30 JUNE 2015$
30 JUNE 2014$
(b) Reconciliation to Accounting Loss
(Loss)/profit from continuing operations (17,277,206) 3,946,945
Tax at the Australian tax rate of 30% (2014: 30%) (5,183,162) 1,184,083
Tax effect of non-deductible / non-assessable amounts
Amortisation of intangibles 380,389 101,893
Foreign exchange reversed on consolidation 161,022 13,679
Exempt income from government assistance (2,096,836) (2,251,679)
Entertainment 702 2,116
Contingent consideration 515,763 112,913
Patent expenses 292,680 44,197
Share-based payments 154,642 45,277
Research and development expenditure 4,818,254 4,662,450
Temporary differences not recorded as an asset 286,962 181,275
Tax losses not recorded 358,264 -
Effect of different tax rates in other jurisdictions (16,481) (16,476)
Effect of unused tax losses, in the current period - (1,347,385)
Adjustment to prior year unused tax losses - (1,992,014)
(327,801) 740,329
(c) Deferred Tax Assets/Liabilities
OPENING BALANCE
$
CREDIT/(CHARGED) TO INCOME
$
OTHER COMPRE- HENSIVE INCOME
$
ACQUIRED THROUGHBUSINESS
COMBINATION$
CLOSING BALANCE
$
2015
Receivables 44,483 239,533 - - 284,016
Prepayments / accrued income (3,856) (2,355) - - (6,211)
Property, plant and equipment 216 (115) 3,889 (621,469) (617,479)
Share issue expenses 350,236 (137,253) - - 212,983
Intangible patents and trademarks (3,881,134) 419,308 (1,004,173) - (4,465,999)
Other intangibles 218,383 - - - 218,383
Other financial liabilities - 31,639 - - 31,639
Accrued expenses 32,902 3,045 - - 35,947
Employee entitlements 309,317 60,961 - - 370,278
(2,929,453) 614,763 (1,000,284) (621,469) (3,936,443)
Temporary differences not recognised (1,410,990) (286,962) - - (1,697,952)
Net balance (4,340,443) 327,801 (1,000,284) (621,469) (5,634,395)
For
per
sona
l use
onl
y
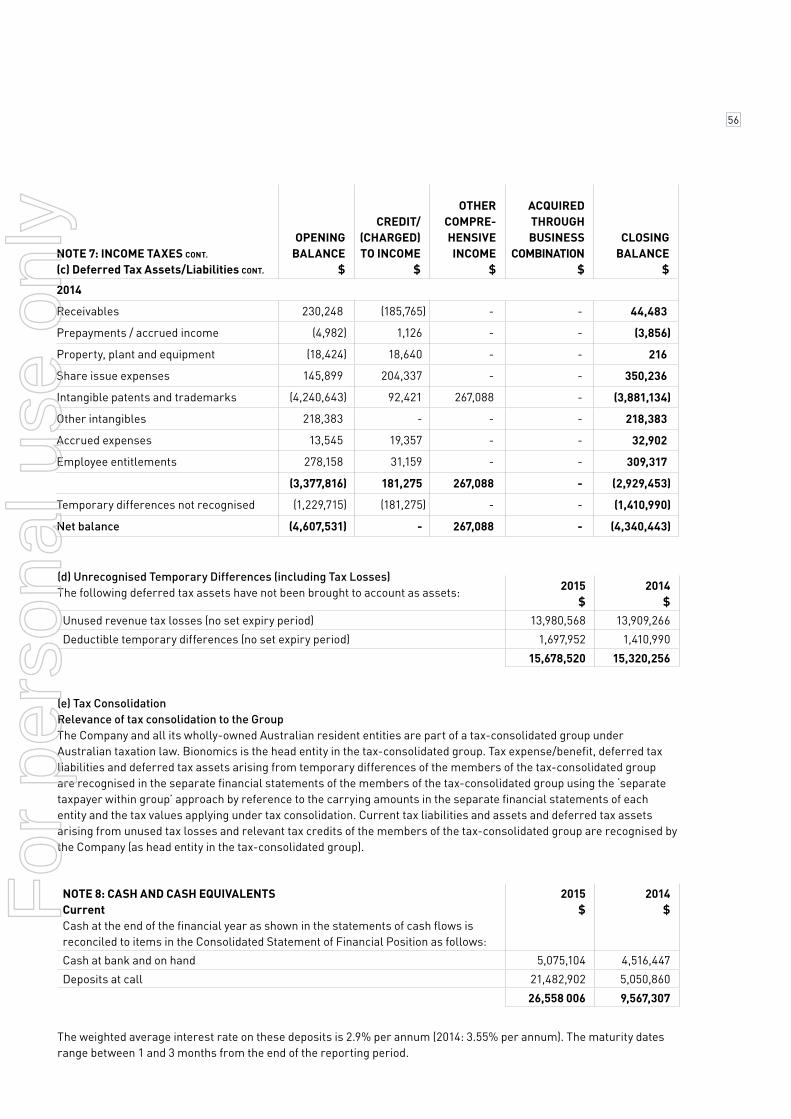
56
NOTE 7: INCOME TAXES CONT.
(c) Deferred Tax Assets/Liabilities CONT.
OPENING BALANCE
$
CREDIT/(CHARGED) TO INCOME
$
OTHER COMPRE- HENSIVE INCOME
$
ACQUIRED THROUGHBUSINESS
COMBINATION$
CLOSING BALANCE
$
2014
Receivables 230,248 (185,765) - - 44,483
Prepayments / accrued income (4,982) 1,126 - - (3,856)
Property, plant and equipment (18,424) 18,640 - - 216
Share issue expenses 145,899 204,337 - - 350,236
Intangible patents and trademarks (4,240,643) 92,421 267,088 - (3,881,134)
Other intangibles 218,383 - - - 218,383
Accrued expenses 13,545 19,357 - - 32,902
Employee entitlements 278,158 31,159 - - 309,317
(3,377,816) 181,275 267,088 - (2,929,453)
Temporary differences not recognised (1,229,715) (181,275) - - (1,410,990)
Net balance (4,607,531) - 267,088 - (4,340,443)
(d) Unrecognised Temporary Differences (including Tax Losses) The following deferred tax assets have not been brought to account as assets:
(e) Tax Consolidation Relevance of tax consolidation to the Group The Company and all its wholly-owned Australian resident entities are part of a tax-consolidated group under Australian taxation law. Bionomics is the head entity in the tax-consolidated group. Tax expense/benefit, deferred tax liabilities and deferred tax assets arising from temporary differences of the members of the tax-consolidated group are recognised in the separate financial statements of the members of the tax-consolidated group using the ‘separate taxpayer within group’ approach by reference to the carrying amounts in the separate financial statements of each entity and the tax values applying under tax consolidation. Current tax liabilities and assets and deferred tax assets arising from unused tax losses and relevant tax credits of the members of the tax-consolidated group are recognised by the Company (as head entity in the tax-consolidated group).
The weighted average interest rate on these deposits is 2.9% per annum (2014: 3.55% per annum). The maturity dates range between 1 and 3 months from the end of the reporting period.
2015$
2014$
Unused revenue tax losses (no set expiry period) 13,980,568 13,909,266
Deductible temporary differences (no set expiry period) 1,697,952 1,410,990
15,678,520 15,320,256
NOTE 8: CASH AND CASH EQUIVALENTS Current Cash at the end of the financial year as shown in the statements of cash flows is reconciled to items in the Consolidated Statement of Financial Position as follows:
2015$
2014$
Cash at bank and on hand 5,075,104 4,516,447
Deposits at call 21,482,902 5,050,860
26,558 006 9,567,307
For
per
sona
l use
onl
y

57
NOTE 9: OTHER FINANCIAL ASSETS2015
$2014
$
Restricted deposits held as security and not available for use 934,000 934,000
Disclosed in the financial statement as:
Current assets 550,000 550,000
Non-current assets 384,000 384,000
934,000 934,000
NOTE 10: TRADE AND OTHER RECEIVABLES2015
$2014
$
Current
Trade receivables 289,604 20,581,109
GST and Value Added Tax (VAT) receivables 756,996 408,545
Other 17,080 -
1,063,680 20,989,654
Age of receivables that are past due but not impaired2015
$2014
$
60-90 days 11,200 13,474
90-120 days - -
Total 11,200 13,474
Average age (days) 61 89
The Group holds two restricted term deposits of $550,000 and $384,000 as security for a loan (Note 18(vi)) and as security for a bank guarantee respectively that are not available for use. The interest rate on these deposits is 2.7% (2014: 3.55%) and maturity dates are 30 and 23 September 2015 respectively (2014: 6 September and 25 July 2014 respectively).
The average credit period on sales of services is 60 days. No interest is charged on trade receivables for the first 60 days from the date of the invoice. Thereafter, interest is charged at 2% per annum on the outstanding balance. Allowances for doubtful debts are recognised against trade receivables based on estimated irrecoverable amounts determined by reference to past default experience of the counterparty and an analysis of the counterparty’s current financial position. The Group has not recognised an allowance for doubtful debts.
Before accepting any new customer, the Group reviews the quality of the customer, and this is reviewed prior to commencing new major work. Of the trade receivables balance at the end of the 2015 year, there were no customers who represent more than 5% of the total balance of trade receivables (2014: $20.3m was due from Merck, the Group’s largest customer).
Trade receivables disclosed above include amounts (see below for aged analysis) that are past due at the end of the reporting period for which the Group has not recognised an allowance for doubtful debts because there has not been a significant change in credit quality and the amounts (which include interest accrued after the receivable is more than 60 days outstanding) are still considered recoverable.
In determining the recoverability of a trade receivable, the Group considers any change in the credit quality of the trade receivable from the date credit was initially granted up to the end of the reporting period. Typically the concentration of credit risk is limited due to the fact that the customer base is large and unrelated, except as noted above where Merck represents 98.6% of the 2014 balance.
NOTES TO THE FINANCIAL STATEMENTS FOR THE FINANCIAL YEAR ENDED 30 JUNE 2015
For
per
sona
l use
onl
y

58
NOTE 11: INVENTORIES2015
$2014
$
Current
Consumables 409,891 83,423
NOTE 12: OTHER ASSETS2015
$2014
$
Current
Prepayments 1,194,038 433,917
Accrued income 99,894 8,511
1,293,932 442,428
NOTE 13: SUBSIDIARIES Details of the Group’s subsidiaries at the end of the reporting period are as follows:
PERCENTAGE OWNED%
ENTITY PRINCIPAL ACTIVITYCOUNTRY OF
INCORPORATION 2015 2014
HEAD ENTITY
Bionomics Limited Research and Development Australia N/A N/A
SUBSIDIARIES OF BIONOMICS LIMITED:
Neurofit SAS Contract Research Organisation France 100 100
Iliad Chemicals Pty Limited Asset owner Australia 100 100
Bionomics, Inc. Research and Development United States 100 100
PC SAS Contract Research Organisation France 100 N/A
NOTE 14: PROPERTY, PLANT AND EQUIPMENT
FREEHOLD LAND AT
COST$
BUILDING AT COST
$
PLANT AND EQUIPMENT
AT COST$
EQUIPMENT UNDER
FINANCE LEASE
AT COST$
TOTAL$
Cost at 30 June 2013 - - 2,465,535 600,507 3,066,042
Additions - - 216,598 - 216,598
Disposals - - (100,664) - (100,664)
Foreign currency exchange differences - - 466 - 466
Cost at 30 June 2014 - - 2,581,935 600,507 3,182,442
Additions - - 846,258 - 846,258
Additions from business acquisitions 256,790 1,882,859 72,432 - 2,212,081
Disposals - - (70,872) - (70,872)
Foreign currency exchange differences (268) (1,963) 106,806 - 104,575
Cost at 30 June 2015 256,522 1,880,896 3,536,559 600,507 6,274,484
For
per
sona
l use
onl
y

59 NOTES TO THE FINANCIAL STATEMENTS FOR THE FINANCIAL YEAR ENDED 30 JUNE 2015
NOTE 14: PROPERTY, PLANT AND EQUIPMENT CONT.
FREEHOLD LAND AT
COST$
BUILDING AT COST
$
PLANT AND EQUIPMENT
AT COST$
EQUIPMENT UNDER
FINANCE LEASE
AT COST$
TOTAL$
Accumulated depreciation at 30 June 2013 - - (2,168,584) (54,608) (2,223,192)
Depreciation (Note 6) - - (142,048) (83,174) (225,222)
Disposals - - 93,900 - 93,900
Foreign currency exchange differences - - 433 - 433
Accumulated depreciation at 30 June 2014 - - (2,216,299) (137,782) (2,354,081)
Depreciation (Note 6) - (56,763) (397,259) (56,898) (510,920)
Disposals - - 62,809 - 62,809
Foreign currency exchange differences - - (21,737) - (21,737)
Accumulated depreciation at 30 June 2015 - (56,763) (2,572,486) (194,680) (2,823,929)
Net Carrying Amounts at 30 June 2014 - - 365,636 462,725 828,361
Net Carrying Amounts at 30 June 2015 256,522 1,824,133 964,073 405,827 3,450,555
Non-current Assets Pledged as Security Refer to Note 18 for information on non-current assets pledged as security by the Group.
(a) Impairment Tests There are two Cash Generating Units (CGUs), Drug discovery and development, and Contract services. These are the same as the operating segments identified in Note 4. Management tests annually whether goodwill or indefinite life intangibles have suffered any impairment, in accordance with the accounting policy stated in Note 2(l)(i) and (l)(ii). For the purpose of impairment testing all goodwill is allocated to the Drug discovery and development CGU.
Determining whether goodwill or intangibles are impaired requires an estimation of the value in use of the cash generating units to which goodwill or indefinite life intangibles have been allocated. The value in use calculation requires the entity to estimate the future cash flows expected to arise from the cash generating unit and a suitable discount rate in order to calculate present value over the expected life cycle of the commercialisation of the assets - in line with the average patent life and development cycle of the drug compound. A pre-tax discount rate of 25% has been used.
NOTE 15: GOODWILL $
Carrying amount at 30 June 2013 9,755,521
Additions -
Foreign currency exchange differences (267,089)
Carrying amount at 30 June 2014 9,488,432
Additions -
Foreign currency exchange differences 1,000,201
Carrying amount at 30 June 2015 10,488,633
Allocation of Goodwill to group CGU’s The carrying amount of goodwill was allocated to the following CGU’s:
2015$
2014$
Drug discovery and development 10,488,633 9,488,432
Contract services - -
For
per
sona
l use
onl
y

60
NOTE 15: GOODWILL CONT. Drug discovery and development The recoverable amount of this CGU is determined based on a value in use calculation which uses cash flow projections based on observable market comparables for drug compounds within the CGU over a period of twenty years covering drug discovery, development, approval and marketing, and a discount rate of 25% per annum (2014: 25% per annum). The cash flow projections are weighted based on the observable market comparables probability of realising projected milestone and royalties payments.
Management believes that the application of discounted cash flows of observable market comparables for one drug compound is reasonable to be applied to other compounds within the CGU at their respective development phases.
Management believes that any reasonably possible change in the key assumptions on which recoverable amount is based would not cause the aggregate carrying amount to exceed the aggregate recoverable amount of the CGU.
No growth rates have been included in the forecast. As the full discovery and development lifecycle has been taken into account with the cashflows, no terminal value has been used.
NOTE 16: OTHER INTANGIBLE ASSETS Intellectual Property The acquired intellectual property includes the Company’s Multicore technology, its BNC101 drug candidate and its BNC105 drug candidate. Each item is carried at its fair value as at its date of acquisition, less accumulated amortisation charges. The remaining amortisation periods for each item are between 5 and 20 years. There is currently no internally generated intellectual property capitalised.
$
Gross carrying amount at 30 June 2013 21,402,923
Additions -
Foreign currency exchange differences (409,977)
Gross carrying amount at 30 June 2014 20,992,946
Additions 12,705
Foreign currency exchange differences 3,243,297
Gross carrying amount at 30 June 2015 24,248,948
Accumulated amortisation amount at 30 June 2013 (4,498,169)
Amortisation (1,275,714)
Foreign currency exchange differences 6,693
Accumulated amortisation amount at 30 June 2014 (5,767,190)
Amortisation (1,202,572)
Foreign currency exchange differences (351,567)
Accumulated amortisation amount at 30 June 2015 (7,321,329)
Net carrying amount 30 June 2014 15,225,756
Net carrying amount 30 June 2015 16,927,619For
per
sona
l use
onl
y
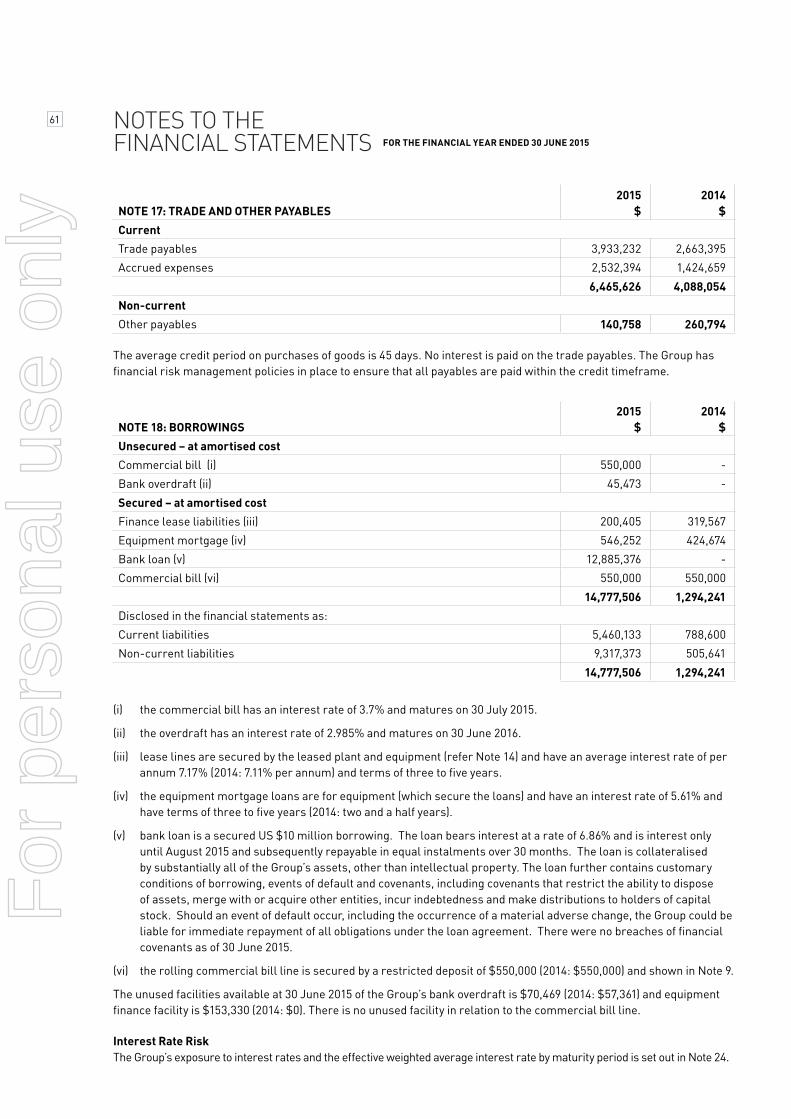
61 NOTES TO THE FINANCIAL STATEMENTS FOR THE FINANCIAL YEAR ENDED 30 JUNE 2015
NOTE 17: TRADE AND OTHER PAYABLES2015
$2014
$
Current
Trade payables 3,933,232 2,663,395
Accrued expenses 2,532,394 1,424,659
6,465,626 4,088,054
Non-current
Other payables 140,758 260,794
NOTE 18: BORROWINGS2015
$2014
$
Unsecured – at amortised cost
Commercial bill (i) 550,000 -
Bank overdraft (ii) 45,473 -
Secured – at amortised cost
Finance lease liabilities (iii) 200,405 319,567
Equipment mortgage (iv) 546,252 424,674
Bank loan (v) 12,885,376 -
Commercial bill (vi) 550,000 550,000
14,777,506 1,294,241
Disclosed in the financial statements as:
Current liabilities 5,460,133 788,600
Non-current liabilities 9,317,373 505,641
14,777,506 1,294,241
The average credit period on purchases of goods is 45 days. No interest is paid on the trade payables. The Group has financial risk management policies in place to ensure that all payables are paid within the credit timeframe.
(i) the commercial bill has an interest rate of 3.7% and matures on 30 July 2015.
(ii) the overdraft has an interest rate of 2.985% and matures on 30 June 2016.
(iii) lease lines are secured by the leased plant and equipment (refer Note 14) and have an average interest rate of per annum 7.17% (2014: 7.11% per annum) and terms of three to five years.
(iv) the equipment mortgage loans are for equipment (which secure the loans) and have an interest rate of 5.61% and have terms of three to five years (2014: two and a half years).
(v) bank loan is a secured US $10 million borrowing. The loan bears interest at a rate of 6.86% and is interest only until August 2015 and subsequently repayable in equal instalments over 30 months. The loan is collateralised by substantially all of the Group’s assets, other than intellectual property. The loan further contains customary conditions of borrowing, events of default and covenants, including covenants that restrict the ability to dispose of assets, merge with or acquire other entities, incur indebtedness and make distributions to holders of capital stock. Should an event of default occur, including the occurrence of a material adverse change, the Group could be liable for immediate repayment of all obligations under the loan agreement. There were no breaches of financial covenants as of 30 June 2015.
(vi) the rolling commercial bill line is secured by a restricted deposit of $550,000 (2014: $550,000) and shown in Note 9.
The unused facilities available at 30 June 2015 of the Group’s bank overdraft is $70,469 (2014: $57,361) and equipment finance facility is $153,330 (2014: $0). There is no unused facility in relation to the commercial bill line.
Interest Rate Risk The Group’s exposure to interest rates and the effective weighted average interest rate by maturity period is set out in Note 24.
For
per
sona
l use
onl
y

62
NOTE 19: PROVISIONS 2015
$2014
$
Current
Employee benefits 1,582,239 1,186,482
Non-current
Employee benefits 91,168 108,320
NOTE 20: OTHER LIABILITIES 2015
$2014
$
Current
Unearned services income 75,362 3,267,589
NOTE 21: OTHER FINANCIAL LIABILITIES 2015
$2014
$
Current
Warrants 122,544 -
NOTE 22: ISSUED CAPITAL (a) Issued and paid-up capital
2015SHARES
2014SHARES
Ordinary shares – fully paid 418,198,869 417,356,567
Warrants 2015
$2014
$
Balance at beginning of period - -
Warrant value at date of issue 223,912 -
Change in value recognised in profit or loss (101,368) -
Balance at end of period 122,544 -
Refer Note 22(e) for details about the fair value of the warrant.
Warrants A derivative was recognised in relation to the warrant that was issued by the Group in connection with the USD loan included in Note 18(v). This warrant is currently exercisable at the discretion of the holder and is exchangeable for either 643,611 ordinary shares at a fixed price ($0.54) or a lower number of shares for nil consideration, with the number of shares calculated on the basis of a formula which takes into account the movement in the share price of the Company from the date of issue to date of exercise of the warrant.
The liability was initially measured at fair value in accordance with AASB 139 (IAS 39). The value of the warrant liability is remeasured at each balance date with any movement in valuations recognised in the profit or loss.
For
per
sona
l use
onl
y

63
DATE DETAILSNUMBER OF
SHARES $
30 June 2013 Closing balance 415,868,325 111,309,010
Share issue – Employee Share Option Plan option exercise 1,488,242 412,661
30 June 2014 Closing balance 417,356,567 111,721,671
Share issue – Employee Share Option Plan option exercise 842,302 268,549
30 June 2015 Closing balance 418,198,869 111,990,220
GRANT DATE EXPIRY DATE EXERCISE PRICE NUMBERFAIR VALUE AT
GRANT DATEJan-06 Jan-16 $0.2376 25,000 $0.15
May-06 Jul-15 $0.2176 5,000 $0.13
Jul-16 $0.2176 30,000 $0.14
Nov-06 Nov-15 $0.2976 100,000 $0.13
Nov-16 $0.2976 100,000 $0.13
Oct-07 Oct-15 $0.2876 5,000 $0.23
Oct-16 $0.2876 5,000 $0.24
Oct-17 $0.2876 5,000 $0.25
Jan-08 Jan-16 $0.3776 3,000 $0.21
Jan-17 $0.3776 4,000 $0.22
Jan-18 $0.3776 4,000 $0.23
Jul-08 Jul-16 $0.3576 14,000 $0.19
Jul-17 $0.3576 14,000 $0.19
Jul-18 $0.3576 14,000 $0.20
Nov-08 Nov-15 $0.2976 100,000 $0.10
Nov-16 $0.2976 100,000 $0.11
Nov-17 $0.2976 100,000 $0.12
NOTE 22: ISSUED CAPITAL CONT.
Movements in ordinary shares of the Company during the past two years were as follows:
Changes to the then Corporations Law abolished the authorised capital and par value concept in relation to share capital from 1 July 1998. Therefore, the Company does not have a limited amount of authorised capital and issued shares do not have a par value.
(b) Ordinary Shares Ordinary shares entitle the holder to participate in dividends and the proceeds on winding up of the Company in proportion to the number of and amounts paid on the shares held. On a show of hands every holder of ordinary shares present at a meeting in person or by proxy, is entitled to one vote and upon a poll each share is entitled to one vote.
(c) Option Modification The terms of the options under the Bionomics Employee Share Option Plan were modified at 30 June 2014 for all options on issue prior to the fully underwritten 1:8 non-renounceable rights issue announced on 4 March 2013. The exercise price for all outstanding options were adjusted under ASX Listing Rule 6.22 and are shown in the table below in this Note 22(d)(i).
(d) Share Options When exercised, each option is convertible into one ordinary share. The exercise price is based on the weighted average price at which the Company’s shares traded on the ASX during the seven trading days immediately before the options are issued.
(i) The Bionomics Employee Share Option Plan The terms and conditions of the Bionomics Employee Share Option Plan are summarised in Note 2(o)(iii). The following options listed are outstanding at reporting date.
NOTES TO THE FINANCIAL STATEMENTS FOR THE FINANCIAL YEAR ENDED 30 JUNE 2015
For
per
sona
l use
onl
y

64
GRANT DATE EXPIRY DATE EXERCISE PRICE NUMBERFAIR VALUE AT
GRANT DATENov-08 cont. Aug-16 $0.3692 330,000 $0.10
Nov-15 $0.2776 10,000 $0.05
Nov-16 $0.2776 10,000 $0.06
Nov-17 $0.2776 10,000 $0.06
Nov-18 $0.2776 10,000 $0.07
Mar-09 Mar-16 $0.2876 2,120 $0.07
Mar-17 $0.2876 2,120 $0.07
Mar-18 $0.2876 2,120 $0.08
Mar-19 $0.2876 12,120 $0.08
Jun-09 Jun-16 $0.2476 4,000 $0.13
Jun-17 $0.2476 54,000 $0.14
Jun-18 $0.2476 54,000 $0.14
Jun-19 $0.2476 54,000 $0.15
Nov-09 Nov-15 $0.2976 100,000 $0.11
Nov-16 $0.2976 100,000 $0.12
Nov-17 $0.2976 100,000 $0.13
Nov-18 $0.2976 100,000 $0.14
Nov-19 $0.2976 100,000 $0.14
Jul-10 July-15 $0.3176 45,000 $0.12
Jul-19 $0.3176 10,000 $0.13
Jul-20 $0.3176 10,000 $0.14
Nov-10 Nov-15 $0.3076 100,000 $0.09
Nov-16 $0.3076 100,000 $0.10
Nov-17 $0.3076 100,000 $0.11
Nov-18 $0.3076 100,000 $0.12
Nov-19 $0.3076 100,000 $0.12
Nov-11 Nov-16 $0.6116 95,000 $0.15
Nov-16 $0.6116 500,000 $0.15
Aug-17 $0.9186 1,000,000 $0.03
Dec-11 Dec-17 $0.5156 100,000 $0.23
Dec-18 $0.5156 100,000 $0.25
Dec-19 $0.5156 100,000 $0.26
Dec-20 $0.5156 100,000 $0.27
Dec-21 $0.5156 100,000 $0.28
Mar-12 Mar-18 $0.5026 5,000 $0.20
Mar-19 $0.5026 5,000 $0.21
Mar-20 $0.5026 5,000 $0.22
Mar-21 $0.5026 5,000 $0.23
Mar-22 $0.5026 5,000 $0.24
Jun-12 Jun-18 $0.3356 13,000 $0.11
Jun-19 $0.3356 13,000 $0.12
Jun-20 $0.3356 13,000 $0.13
Jun-21 $0.3356 13,000 $0.13
Jun-22 $0.3356 13,000 $0.14
Aug-12 Aug-17 $0.2846 67,500 $0.09
Dec-12 Dec-17 $0.2846 65,000 $0.11
Dec-18 $0.3176 200,000 $0.12
Dec-19 $0.3176 200,000 $0.13
NOTE 22: ISSUED CAPITAL CONT.
For
per
sona
l use
onl
y

65
GRANT DATE EXPIRY DATE EXERCISE PRICE NUMBERFAIR VALUE AT
GRANT DATEDec-12 cont. Dec-20 $0.3176 200,000 $0.14
Dec-21 $0.3176 200,000 $0.14
Dec-22 $0.3176 200,000 $0.15
Dec-18 $0.3176 5,000 $0.15
Dec-19 $0.3176 5,000 $0.16
Dec-20 $0.3176 5,000 $0.16
Dec-21 $0.3176 5,000 $0.17
Dec-22 $0.3176 5,000 $0.18
Mar-13 Mar-19 $0.4176 50,000 $0.14
Mar-20 $0.4176 50,000 $0.15
Mar-21 $0.4176 50,000 $0.16
Mar-22 $0.4176 50,000 $0.17
Mar-23 $0.4176 50,000 $0.18
May-13 May-19 $0.3745 114,000 $0.15
May-20 $0.3745 114,000 $0.16
May-21 $0.3745 114,000 $0.17
May-22 $0.3745 114,000 $0.18
May-23 $0.3745 114,000 $0.19
Jun-13 Jun-19 $0.3873 100,000 $0.14
Jun-20 $0.3873 100,000 $0.15
Jun-21 $0.3873 100,000 $0.16
Jun-22 $0.3873 100,000 $0.17
Jun-23 $0.3873 100,000 $0.18
Aug-13 Aug-18 $0.3301 312,500 $0.27
Oct-13 Oct-19 $0.6014 16,600 $0.32
Oct-20 $0.6014 16,600 $0.34
Oct-21 $0.6014 16,600 $0.35
Oct-22 $0.6014 16,600 $0.37
Oct-23 $0.6014 16,600 $0.38
Dec-13 Dec-18 $0.3301 55,000 $0.33
Dec-18 $0.7224 100,000 $0.23
Dec-19 $0.7224 100,000 $0.25
Dec-19 $0.6875 4,000 $0.26
Dec-20 $0.7224 100,000 $0.27
Dec-20 $0.6875 4,000 $0.28
Dec-21 $0.7224 100,000 $0.29
Dec-21 $0.6875 4,000 $0.29
Dec-22 $0.7224 100,000 $0.30
Dec-22 $0.6875 4,000 $0.31
Dec-23 $0.6875 4,000 $0.32
Mar-14 Mar-20 $0.6812 4,000 $0.25
Mar-21 $0.6812 4,000 $0.26
Mar-22 $0.6812 4,000 $0.28
Mar-23 $0.6812 4,000 $0.29
Mar-24 $0.6812 4,000 $0.30
Oct-14 Oct-19 $0.5643 260,000 $0.25
Dec-14 Dec-19 $0.5643 75,000 $0.19
NOTES TO THE FINANCIAL STATEMENTS FOR THE FINANCIAL YEAR ENDED 30 JUNE 2015
NOTE 22: ISSUED CAPITAL CONT.
For
per
sona
l use
onl
y

66
GRANT DATE EXPIRY DATE EXERCISE PRICE NUMBERFAIR VALUE AT
GRANT DATEApr15 Apr-16 $0.5029 19,000 $0.15
Apr-17 $0.5029 19,000 $0.16
Apr-18 $0.5029 19,000 $0.17
Apr-19 $0.5029 19,000 $0.18
Apr-20 $0.5029 19,000 $0.19
May-15 May-16 $0.4246 293,600 $0.17
May-17 $0.4246 293,600 $0.18
May-18 $0.4246 293,600 $0.19
May-19 $0.4246 293,600 $0.19
May-20 $0.4246 293,600 $0.20
9,798,480
SERIES NUMBER EXERCISE EXERCISE PRICE EXERCISE DATESHARE PRICE AT EXERCISE DATE
21-Nov-08 10,000 $0.2776 15-Oct-14 $0.565
16-Nov-06 100,000 $0.2976 17-Nov-14 $0.545
11-Jan-08 3,000 $0.3776 26-Nov-14 $0.490
21-Jan-05 200,000 $0.2976 16-Feb-15 $0.405
22-Jul-10 45,000 $0.3176 5-Mar-15 $0.495
1-Aug-12 35,000 $0.2846 5-Mar-15 $0.495
13-Mar-09 2,120 $0.2876 4-Mar-15 $0.495
12-Aug-13 26,250 $0.3301 30-Mar-15 $0.470
5-Nov-08 190,000 $0.3692 15-Apr-15 $0.420
1-Aug-12 37,500 $0.2846 15-Apr-15 $0.420
5-Nov-08 140,000 $0.3692 5-May-15 $0.410
11-Jan-08 500 $0.3776 25-May-15 $0.425
15-Jun-09 4,000 $0.2476 25-May-15 $0.425
1-Jul-08 10,000 $0.3576 18-Jun-15 $0.440
1-May-06 20,000 $0.2176 18-Jun-15 $0.440
1-May-06 5,000 $0.2176 18-Jun-15 $0.440
11-Jan-08 500 $0.3776 18-Jun-15 $0.440
1-Jul-08 4,000 $0.3576 30-Jun-15 $0.415
1-May-06 4,432 $0.2176 30-Jun-15 $0.415
1-May-06 5,000 $0.2176 30-Jun-15 $0.415
Grand Total 842,302
NOTE 22: ISSUED CAPITAL CONT.
Employee Share Option Plan options exercised during the financial year:
Reconciliation of Employee Share Option Plan:
2015 2014
NUMBER OF OPTIONS
WEIGHTED AVERAGE
EXERCISE PRICE
NUMBEROF OPTIONS
WEIGHTED AVERAGE
EXERCISE PRICE
Opening balance at beginning of financial year 9,458,782 $0.45 10,262,274 $0.41
Granted during the financial year 1,930,500 $0.45 1,016,750 $0.56
Forfeited during the financial year (298,500) $0.40 (20,000) $0.52
Exercised during the financial year (842,302) $0.32 (1,488,242) $0.28
Expired during the financial year (450,000) $0.35 (312,000) $0.29
Closing balance at 30 June 9,798,480 $0.47 9,458,782 $0.45
For
per
sona
l use
onl
y

67
2015NUMBER
2014NUMBER
Unlisted options vested and exercisable at the reporting date 6,184,080 6,269,782
2015$
2014$
Foreign Currency Translation Reserve (a) 4,206,214 893,614
Share-based Payments Reserve (b) 2,336,439 1,820,965
Total reserves 6,542,653 2,714,579
NOTES TO THE FINANCIAL STATEMENTS FOR THE FINANCIAL YEAR ENDED 30 JUNE 2015
(ii) Weighted averages The weighted average remaining contractual life of any unlisted share options outstanding at the end of the year is 4.28 years (2014: 4.11 years). The assessed fair value at grant date of options granted during the year ended 30 June 2015 is outlined in the Remuneration Report. The share price at grant date of these options ranged between $0.415 and $0.565 (2014: $0.29 and $0.39). The expected average price volatility of the company’s shares ranged between 56.5% and 73.6% (2014: 53.2% and 70.4%). Expected dividend yield was 0% (2014: 0%) and the average risk free interest rate used ranged between 2.5% and 3.4% (2014: 3.5% and 4.33%).
(e) Warrants During the year, the Company issued a warrant, see Note 21.
The weighted average remaining contractual life of the unlisted warrant outstanding at the end of the year is 4.6 years (2014: nil).
The assessed fair value at grant date of this warrant granted during the year ended 30 June 2015 was $223,912. The share price at grant date of this warrant was $0.555. The expected average price volatility of the Company’s shares was 72.1%. Expected dividend yield was 0% and the average risk free interest rate used was 3.28%.
The assessed fair value at 30 June 2015 of the warrant that was granted during the year ended 30 June 2015 is $122,544. The share price as at 30 June 2015 was $0.415. The expected average price volatility of the Company’s shares was 58.6%. Expected dividend yield was 0% and the average risk free interest rate as at 30 June 2015 was 3.01%.
(a) Foreign Currency Translation Reserve Exchange differences arising on translation of the foreign controlled entities are taken to the foreign currency translation reserve, as described in Note 2(b). The reserve is recognised in profit or loss when the investment is disposed of.
(b) Share-based Payments Reserve The share-based payments reserve is used to recognise the fair value of options issued over the vesting period, further information about share-based payments is set out in Note 22.
NOTE 22: ISSUED CAPITAL CONT.
NOTE 23: RESERVES
NOTE 24: FINANCIAL INSTRUMENTS (a) Capital Risk Management The Group manages its capital to ensure that entities in the Group will be able to continue as going concerns whilst maximising the return to stakeholders through the optimisation of the debt and equity balance.
The Group’s overall strategy remains unchanged from 2014. The capital structure of the Group consists of debt, which includes borrowings (Note 18), cash and cash equivalents (Note 8) and equity attributable to equity holders of the parent, comprising issued capital (Note 22), reserves (Note 23) and retained earnings.
For
per
sona
l use
onl
y

68
(b) Categories of Financial Instruments2015
$2014
$
Financial assets
Receivables 1,063,680 20,989,654
Other financial assets 934,000 934,000
Cash and cash equivalents 26,558,006 9,567,307
28,555,686 31,490,961
Financial liabilities
Amortised cost 21,383,890 5,643,089
Contingent consideration at fair value 8,276,292 5,696,087
29,660,182 11,339,176
Reconciliation to total assets
Financial assets (as above) 28,555,686 31,490,491
Non-financial assets 40,576,029 33,569,656
69,131,715 65,060,617
Reconciliation to total liabilities
Financial liabilities (as above) 29,660,182 11,339,176
Non-financial liabilities 7,505,708 8,902,834
37,165,890 20,242,010
NOTE 24: FINANCIAL INSTRUMENTS CONT. The Group has global operations, primarily conducted through subsidiary companies established in the markets in which the Group trades. None of the Group’s entities are subject to externally imposed capital requirements.
The Group’s policy is to fund the research and development activities and operations through the issue of equity and the commercialisation of Intellectual Property assets. Project specific borrowings are utilised where appropriate and also minor borrowings for operational assets, as required.
(c) Financial Risk Management Objectives The Board, through the Audit and Risk Management (ARM) Committee, is responsible for ensuring there are adequate policies in relation to risk management, compliance and internal control systems. In summary, Group policies are designed to ensure significant strategic, operational, legal, reputational and financial risks are identified, assessed, and effectively monitored and managed in a manner sufficient for a company of Bionomics’ size and stage of development to enable achievement of the Group’s business strategy and objectives.
The Group’s risk management policies are managed by the key management personnel and are reviewed by the ARM Committee according to a timetable of assessment and review proposed by that committee and approved by the Board.
(d) Market Risk The Group’s activities expose it primarily to the financial risks of changes in foreign currency exchange rates (see (e) page 69) and interest rates (see (f) page 70).
The Group uses derivative financial instruments to manage its exposure to foreign currency risk, if and when appropriate.
Unless approved by the Chief Executive Officer and Managing Director and ARM Committee, interest rate derivatives are not entered into.
The Group measures market risk exposures using sensitivity analysis. There has been no material change to the Group’s exposure to market risks or the manner in which these risks are managed and measured.
There were no derivative financial instruments outstanding as at 30 June 2015 (2014: nil).
For
per
sona
l use
onl
y

69 NOTES TO THE FINANCIAL STATEMENTS FOR THE FINANCIAL YEAR ENDED 30 JUNE 2015
NOTE 24: FINANCIAL INSTRUMENTS CONT.
(e) Foreign Currency Risk Management The Group undertakes certain transactions denominated in foreign currencies; consequently exposures to exchange rate fluctuations arise. Exchange rate exposures are managed in accordance with established policies. The carrying amounts of the Group’s foreign currency denominated monetary assets and liabilities at the end of the reporting date are as follows:
Foreign Currency Sensitivity Analysis The Group is mainly exposed to Euros, US dollars and Pound Sterling (GBP).
The following table details the Group’s sensitivity to a 10% increase and decrease in the Australian dollar against the relevant foreign currencies. 10% is the sensitivity rate used when reporting foreign currency risk internally to key management personnel and represents management’s assessment of the reasonably possible change in foreign currency rates. The sensitivity analysis includes only outstanding foreign currency denominated monetary items and adjusts their translation at the year-end for a 10% change in foreign currency rates. A positive number below indicates an increase in profit or equity where the Australian dollar strengthens 10% against the relevant currency. For a 10% weakening of the Australian dollar against the relevant currency, there would be a comparable impact on the profit or equity with the balances being the opposite.
(i) this is mainly attributable to the exposure outstanding on Euro payables in the Group at the end of the reporting period.
(ii) this is mainly attributable to the exposure to outstanding USD net assets at the end of the reporting period.
(iii) this is as a result of the changes in fair value of the net investment in subsidiaries denominated in Euros, reflected in the foreign currency translation reserve.
(iv) this is mainly attributable to the exposure outstanding on GBP payables in the Group at the end of the reporting period.
(v) this is as a result of the changes in fair value of the net investment in subsidiaries denominated in USD, reflected in the foreign currency translation reserve.
The Group’s sensitivity to foreign currency has decreased during the current year mainly due to the mix of net assets held in non-Australian dollar denominated currencies, in particular, the USD receivable valued through the profit or loss.
The sensitivity analysis may not represent the quantum of foreign exchange risk because the exposure at the end of the reporting period does not reflect the exposure during the year. Requirements change during the financial year depending on research and development activities being undertaken and contract research service financial performance.
LIABILITIES ASSETS
2015$
2014$
2015$
2014$
EUR 2,655,101 989,261 3,832,179 1,371,560
USD 699,374 1,565,744 523,597 20,885,161
GBP 298,297 465,031 - -
EUR IMPACT USD IMPACT GBP IMPACT
2015$
2014$
2015$
2014$
2015$
2014$
Profit or loss 44,950 888 (i) 29,659 (1,782,894) (ii) 27,118 42,276 (iv)
Equity (151,957) (35,643) (iii) (13,679) 26,584 (v) - -
For
per
sona
l use
onl
y

70
NOTE 24: FINANCIAL INSTRUMENTS CONT.
Forward Foreign Exchange Contracts It is the policy of the Group to enter into forward foreign currency contracts to cover specific foreign currency payments and receipts when appropriate (such as when there is a legal commitment to pay or receive foreign currency or the Chief Executive Officer and Managing Director has a high degree of confidence (>90%) that a foreign currency exposure will arise).
Under the Group’s Treasury Policy, the Chief Financial Officer (CFO) will manage the foreign exchange transaction risk adopting the following guidelines:
¨��generally hedge foreign exchange exposure identified above by entering into a forward currency contract.
¨��the duration of any forward currency contract(s) will approximate the period in which the net currency exposure arises
¨��recognising the uncertainty that exists in projecting forward foreign currency flows, a maximum net foreign currency exposure position may be held at any point in time.
Due to the long-term nature of the net investment in the Euro and USD denominated wholly owned subsidiaries, the investments will not be hedged into Australian dollars, with the result that the Australia dollar value of the investments will fluctuate with the market rate through the foreign currency translation reserve.
There were no forward foreign currency contracts outstanding as at 30 June 2015 (2014: nil).
(f) Interest Rate Risk Management The Group is exposed to interest rate risk, only in relation to the cash and cash equivalent balance, as entities in the Group invest funds in both fixed and variable interest rates with various maturities. The Group does not use interest rate swap contracts or forward interest rate contracts.
Interest Rate Sensitivity Analysis The sensitivity analysis below has been determined based on the exposure to interest rates at the end of the reporting period and the stipulated change taking place at the beginning of the financial year and held constant throughout the reporting period.
If interest rates had been 50 basis points higher / (lower) and all other variables were held constant, the Group’s:
¨��loss for the year ended 30 June 2015 would increase / (decrease) by $52,469 (2014: increase / (decrease) by $76,447). This is mainly attributable to the Group’s exposure to interest rates on its variable rate deposits.
The Group’s sensitivity to interest rates has decreased during the current year mainly due to the reduction in interest rates.
(g) Credit Risk Management Credit risk refers to the risk that a counterparty will default on its contractual obligations resulting in financial loss to the Group. The Group has adopted a policy of only dealing with creditworthy counterparties and obtaining sufficient collateral, where appropriate, as a means of mitigating the risk of financial loss from defaults.
As at 30 June 2015, the Group does not have any significant credit risk exposure to any single counterparty or any group of counterparties having similar characteristics. As of 30 June 2014, 98.6% of the Group’s trade and other receivables related to one customer. The credit risk on liquid funds is limited because the counterparties are banks with high credit ratings assigned by international credit rating agencies.
The carrying amount of financial assets recorded in the financial statements, net of any allowances for losses, represents the Group’s maximum exposure to credit risk.
(h) Liquidity Risk Management Ultimate responsibility for liquidity risk management rests with the Board, which has approved an appropriate liquidity risk management framework for management of the Group’s short, medium and long term funding. The Group manages liquidity risk by continuously monitoring forecast and actual cash flows and matching maturity profiles of financial assets and liabilities. Included in Note 18 is a listing of additional undrawn facilities that the group has at its disposal to further reduce liquidity risk.
For
per
sona
l use
onl
y

71
NOTE 24: FINANCIAL INSTRUMENTS CONT.
(i) Liquidity and Interest Rate Risk The following tables detail the Group’s remaining contractual maturity for its financial liabilities. The tables have been drawn up based on the undiscounted cash flows of financial liabilities based on the earliest date on which the Group can be required to pay. The tables include both interest and principal cash flows.
(j) Fair Value of Financial Instruments Some of the Group’s financial assets and liabilities are measured at fair value at the end of each reporting period. The value of other financial assets and liabilities approximate their fair value. The following table gives information about how the fair values of these financial assets and liabilities are determined.
The significant inputs used for Level 3 and disclosed above and the inputs used for Level 2 are disclosed in Note 22(e).
NOTES TO THE FINANCIAL STATEMENTS FOR THE FINANCIAL YEAR ENDED 30 JUNE 2015
INTEREST RATE MATURITY
WEIGHTED AVERAGE
EFFECTIVE INTEREST
RATE%
LESS THAN
1 MONTH$
1–3MONTHS
$
3–12MONTHS
$
1–5YEARS
$
5+YEARS
$TOTAL
$
2015
Non-interest bearing 6,465,626 - - 140,758 - 6,606,384
Finance lease liability 7.17 12,571 25,142 110,311 61,927 - 209,951
Fixed interest rate instruments 5.61 - 1,760,558 4,325,018 10,313,815 - 16,399,391
TOTAL 6,478,197 1,785,700 4,435,329 10,516,500 - 23,215,726
2014
Non-interest bearing 4,088,054 - - 260,794 - 4,348,848
Finance lease liability 7.11 12,571 25,142 113,139 621,356 - 772,208
Fixed interest rate instruments 3.19 - 552,837 106,168 318,505 - 977,510
TOTAL 4,100,625 577,979 219,307 1,200,655 - 6,098,566
FINANCIAL ASSETS/
FINANCIAL LIABILITIES
FAIR VALUE AS AT
FAIR VALUE HIERARCHY
VALUATION TECHNIQUE
SIGNIFICANT UNOBSERVABLE
INPUTS
RELATIONSHIP OF
UNOBSERVABLE INPUTS TO
FAIR VALUE
30 JUNE 2015
$
30 JUNE 2014
$
Contingent consideration in a business combination (Note 34)
Liabilities -$8,276,292
Liabilities -$5,696,087 Level 3
Discounted cash flow
Discount rate of 25% and probability
revenue projections
The higher the discount
rate, the lower the value.
The higher the possible revenue the higher value
Warrant (Note 21)Liabilities -
$122,544 Nil Level 2
Black Scholes
model N/A N/A
For
per
sona
l use
onl
y

72
NOTE 24: FINANCIAL INSTRUMENTS CONT.
Reconciliation of Level 3 fair value measurements
NOTE 25: KEY MANAGEMENT PERSONNEL COMPENSATION The aggregate compensation made to directors and other members of key management personnel of the Group is set out below:
The carrying value of all other financial assets and liabilities approximate their fair value.
2015CONTINGENT
CONSIDERATION IN A BUSINESS COMBINATION
2014CONTINGENT
CONSIDERATION IN A BUSINESS COMBINATION
Opening balance 5,696,087 5,348,695
Total gains or losses:
- in profit or loss 2,580,205 347,392
Closing balance 8,276,292 5,696,087
2015$
2014$
Short-term employee benefits 1,613,080 1,363,111
Post-employment benefits 56,161 50,720
Other long-term benefits 33,719 9,902
Share-based payments 218,368 211,835
Total key management personnel compensation 1,921,328 1,635,568
For
per
sona
l use
onl
y

73 NOTES TO THE FINANCIAL STATEMENTS FOR THE FINANCIAL YEAR ENDED 30 JUNE 2015
2015$
2014$
Represented in the financial statements (Note 18) by:
Current borrowings 147,177 238,600
Non-current borrowings 53,228 505,641
200,405 744,241
2015$
2014$
Non-cancellable operating lease commitments
Within one year 1,111,500 1,017,196
Later than one year but not greater than five 4,003,550 3,877,702
Later than five years 889,714 1,727,286
Minimum lease payments 6,004,764 6,622,184
(b) Operating Leases Operating leases relate to business premises with lease terms of between two and ten years. The building premise leases have options of +2 and +5+5 year terms respectively.
NOTE 26: COMMITMENTS FOR EXPENDITURE (a) Finance Leases The Group leases scientific equipment under finance leases. The average lease term is three years (2014: three years). Under the terms of the lease, the Group retains ownership at the completion of the agreed term. Interest rates underlying all obligations under finance leases are fixed at the respective contract dates ranging from 5.22% to 7.37% (2014: 3.12% to 7.37%) per annum.
MINIMUM LEASE PAYMENTSPRESENT VALUE OF LEASE
PAYMENTS
2015$
2014$
2015$
2014$
Finance Lease Liabilities
Within one year 148,024 150,852 147,177 141,307
Later than one year but not greater than five 61,927 621,356 53,228 602,934
209,951 772,208 200,405 744,241
Future finance charges (9,546) (27,967) - -
Present value of minimum lease payments 200,405 744,241 200,405 744,241
For
per
sona
l use
onl
y

74
NOTE 27: EVENTS OCCURRING AFTER REPORTING DATE The Group announced the appointment of Anthony Colasin as Chief Business Officer on 3 August 2015, no other matters or circumstances have arisen since the end of the financial year which significantly affect or may significantly affect the results of the operations of the Group.
NOTE 28: REMUNERATION OF AUDITORS During the financial year the following services were paid and payable to the external auditor:
The auditor of Bionomics Limited is Deloitte Touche Tohmatsu.
2015$
2014$
Future Rental Income Receivable
Within one year 152,335 152,335
Later than one year but not greater than five 152,335 152,335
304,670 304,670
2015$
2014$
Auditor of the Group
Audit or review of the financial report 160,670 146,103
Other services 120,500 21,534
281,170 167,637
(c) Rental Agreements The Group sub-lets areas of its facility under agreements that are renewed annually. Rent received from these agreements is treated according to the accounting policy outlined in Note 2(c).
NOTE 26: COMMITMENTS FOR EXPENDITURE CONT.
For
per
sona
l use
onl
y

75 NOTES TO THE FINANCIAL STATEMENTS FOR THE FINANCIAL YEAR ENDED 30 JUNE 2015
(b) Reconciliation of operating (loss)/profit to net cash outflow from operating activities
2015$
2014$
(Loss)/Profit for the year (16,949,405) 3,206,616
Items in (loss)/profit
Depreciation and amortisation 1,713,492 1,500,936
Share-based payments 515,474 150,923
Gain on bargain purchase (539,917) -
Loss on asset disposals 8,063 6,765
Contingent consideration – accretion interest 156,362 522,266
Contingent consideration – adjustment to inputs 945,804 -
Amortisation of borrowing costs 45,931 -
Net unrealised foreign exchange differences 3,631,726 (174,874)
Interest received (948,456) (563,574)
Warrant mark-to-market (101,368) -
Changes in operating assets and liabilities
Decrease/(Increase) in receivables 19,992,314 (20,247,285)
Decrease/(Increase) in research and development incentive receivables (504,143) (501,256)
Decrease/(Increase) in other assets (822,082) (23,670)
(Increase)/Decrease in inventory (147,713) 15,103
(Decrease)/Increase in provisions (359,647) 144,389
(Decrease)/Increase in other liabilities (3,380,095) 3,230,142
Increase/(Decrease) in payables 2,007,496 (183,255)
Decrease in deferred tax liability (327,718) -
Net cash inflows/(outflows) from operating activities 4,936,118 (12,916,774)
NOTE 29: CASH FLOW INFORMATION (a) Cash and cash equivalents For the purposes of the consolidated statement of cash flows, cash and cash equivalents include cash on hand and in banks, net of outstanding bank overdrafts. Cash and cash equivalents at the end of the reporting period as shown in the consolidated statement of cash flows can be reconciled to the related items in the consolidated statement of financial position as follows:
2015$
2014$
Cash and cash equivalents (Note 8) 26,558,006 9,567,307
Bank overdraft (Note 18) (45,473) -
26,512,533 9,567,307
For
per
sona
l use
onl
y

76
NOTE 30: EARNINGS PER SHARE
NOTE 31: RELATED PARTY TRANSACTIONS
a) Parent Entity The immediate parent and ultimate controlling party of the Group is Bionomics Limited. Interests in subsidiaries are set out in Note 13.
(b) Key Management Personnel Disclosures relating to compensation of key management personnel are set out in Note 25 and the Directors’ Report.
(c) Loans to Directors and Other Key Management Personnel There were no loans to any directors of the Company or other key management personnel of the Group during the financial year ended 30 June 2015 (2014: $0).
2015 2014
Basic (Loss)/Earnings per share ($0.04)(4 cents)
$0.011 cent
Diluted (Loss)/Earnings per share ($0.04(4 cents)
$0.011 cent
The basic and diluted (Loss)/Earnings per share amounts have been calculated using the ‘(Loss)/Profit after income tax’ figure in the consolidated statement of comprehensive income.
The warrant issued by the Company (see Note 21) has been excluded from the weighted average number of ordinary shares.
2015$
2014$
(Loss)/Profit per share (Basic and Diluted):
(Loss)/Profit after tax for the year (16,949,405) 3,206,616
2015NUMBER
2014NUMBER
Employee options 9,798,480 1,540,000
For
per
sona
l use
onl
y

77 NOTES TO THE FINANCIAL STATEMENTS FOR THE FINANCIAL YEAR ENDED 30 JUNE 2015
(a) Property, Plant and Equipment Commitments There are no contractual commitments for the acquisition of property, plant or equipment as at 30 June 2015 (2014: Nil).
(b) Contingent Liabilities and Guarantees The contingent liabilities and guarantees of the parent are the same as disclosed in Note 35 and Note 9 respectively.
Liabilities
Current liabilities 11,140,329 8,257,939
Non-current liabilities 17,734,833 6,020,532
Total liabilities 28,875,162 14,278,471
Net Assets 31,206,951 44,790,067
Equity
Issued capital 111,990,221 111,721,671
Accumulated losses (83,119,709) (68,752,569)
Share-based payments reserve 2,336,439 1,820,965
Total equity 31,206,951 44,790,067
Financial PerformanceYEAR ENDED 30 JUNE 2015
YEAR ENDED 30 JUNE 2014
(Loss)/Profit for the year (14,367,140) 4,371,102
Other comprehensive income - -
Total comprehensive income (14,367,140) 4,371,102
NOTE 32: PARENT ENTITY INFORMATION The accounting policies of the parent entity, which have been applied in determining the financial information shown below, are the same as those applied in the consolidated financial statements. Refer to Note 2 for a summary of the significant accounting polices relating to the Group.
Financial Position
YEAR ENDED 30 JUNE 2015
$
YEAR ENDED 30 JUNE 2014
$
Assets
Current assets 38,090,327 40,037,551
Non-current assets 21,991,786 19,030,987
Total assets 60,082,113 59,068,538
For
per
sona
l use
onl
y

78
NOTE 34: BUSINESS COMBINATIONS - ACQUISITION OF PRESTWICK CHEMICAL On 23 September 2014, the Company announced the acquisition of Prestwick Chemical (Prestwick) into a new wholly owned subsidiary PC SAS with effect from 1 October 2014. Prestwick is a premium provider of medicinal chemistry services and screening libraries. It specialises in research and development services in early drug discovery based on its expertise and state-of-the-art computational technology. The acquisition of Prestwick vertically integrates key functions within Bionomics in early stage drug discovery and development in neuroscience and oncology.
Acquisition-related costs amounting to $66,596 have been excluded from the consideration transferred and have been recognised as an expense in profit or loss in the year, within the “administration expenses” line item.
Consideration transferred $
Cash 391,136
Assets acquired and liabilities assumed at the date of acquisition $
Current assets
Inventory 159,350
Non-current assets
Property, plant and equipment 2,212,081
Current liabilities
Employee provisions (552,403)
Other payables (266,506)
Non-current liabilities
Deferred tax liability (621,469)
931,053
NOTE 33: CONTINGENT CONSIDERATION During the year ended 30 June 2013, the Company acquired Eclipse Therapeutics, Inc. (Eclipse) into the wholly owned subsidiary Bionomics, Inc.
Part of the consideration are potential cash earn-outs to Eclipse security holders based on achieving late stage development success or partnering outcomes based on Eclipse assets. Due to the movement in the US dollar, change in projected inputs and unwinding of interest, at 30 June 2015 this was $8,276,292 (30 June 2014: $5,696,087).
Dr Jonathan Lim, a Director of Bionomics, was the Chairman and Chief Executive Officer of Eclipse at the time of the acquisition of Eclipse, and joined the Board of Directors of Bionomics in connection with the closing of the acquisition. As a shareholder of Eclipse at the time of the acquisition, Dr Lim is therefore eligible to receive his pro rata share of any potential contingent consideration to Eclipse security holders. As at 30 June, 2015 Dr Lim’s pro-rata share of the contingent consideration would be $1,763,926 (2014: $1,214,007), assuming the contingent consideration was fully earned.
2015$
2014$
Opening Balance 5,696,087 5,348,695
Accretion interest 156,362 522,266
Adjustment for changes in timing of expected revenue projections 945,804 -
FX movement 1,478,039 (174,874)
Closing balance 8,276,292 5,696,087
For
per
sona
l use
onl
y

79
NOTE 35: CONTINGENT LIABILITIES A contingent liability exists in relation to employee contracts of up to $887,038 (2014: $534,395) in the event of redundancy, purchase or merger of the Company by a third party resulting in a material diminution in the employees duties.
In January 2012, the Company entered into a research and license agreement with Ironwood Pharmaceuticals, Inc., or Ironwood, pursuant to which Ironwood was granted worldwide development and commercialisation rights for BNC210. In November 2014, the parties mutually agreed to terminate this license agreement, reverting all rights to BNC210 back to the Company. Our sole obligation to Ironwood is to pay Ironwood low single digit royalties on the net sales of BNC210, if commercialised. It is not practicable to estimate the future payments of any such royalties that may arise due to the stage of development of BNC210.
NOTES TO THE FINANCIAL STATEMENTS FOR THE FINANCIAL YEAR ENDED 30 JUNE 2015
The gain on bargain purchase has been recognised as other income in the Consolidated Statement of Profit or Loss and Other Comprehensive Income. As the predecessor company was in administration, the administrator sought bids for the assets of the company and the Group was the only bidder.
Impact of acquisition on the results of the Group for the year ended 30 June 2015 Included in the loss for the 2015 full-year is $72,335 attributable to this acquisition. Revenue for the full-year includes $1,652,233 in respect of this acquisition.
Had the acquisition been effected at 1 July 2014, the revenue of the Group from continuing operations for the twelve months ended 30 June 2015 would have been $8,326,477, and the loss from continuing operations for the twelve months ended 30 June 2015 would have been $16,704,964. The directors of the Group consider these ‘pro-forma’ numbers to represent an approximate measure of the performance of the combined group on a yearly basis. This may provide a reference point for comparison in future years, but will depend on the revenue and profit derived from external customers versus internal customers.
In determining the ‘pro-forma’ loss of the Group had Prestwick been acquired at the beginning of the year:
¨��Depreciation has been calculated for plant and equipment acquired on the basis of the fair values arising in the initial accounting for the business combination rather than the carrying amounts recognised in the pre-acquisition financial statements; and
¨��An assumption of a similar level of contract research work and chemical library sales has been made.
Gain on bargain purchase $
Fair value of identifiable net asset acquired 931,053
Less: consideration transferred (391,136)
Gain on bargain purchase arising on acquisition (Note 5) 539,917
NOTE 34: BUSINESS COMBINATIONS - ACQUISITION OF PRESTWICK CHEMICAL CONT.
For
per
sona
l use
onl
y

80DIRECTORS’ DECLARATION
The directors declare that:
a) in the directors’ opinion, there are reasonable grounds to believe that the Company will be able to pay its debts as and when they become due and payable;
b) in the directors’ opinion, the attached financial statements are in compliance with International Financial Reporting Standards issued by the International Financial Reporting Standards, as stated in Note 2 to the financial statements;
c) in the directors’ opinion, the attached financial statements and notes thereto are in accordance with the Corporations Act 2001, including compliance with accounting standards and giving a true and fair view of the financial position and performance of the consolidated entity; and
d) the directors have been given the declarations required by section 295A of the Corporations Act 2001.
Signed in accordance with a resolution of the directors made pursuant to section 295(5) of the Corporations Act 2001.
On behalf of the directors
Graeme Kaufman Deborah Rathjen Chairman Chief Executive Officer and Managing Director
Dated this 7th day of August 2015
For
per
sona
l use
onl
y

81 INDEPENDENT AUDIT REPORT
For
per
sona
l use
onl
y

82
For
per
sona
l use
onl
y

83
SHAREHOLDER INFORMATION
CORPORATE GOVERNANCE STATEMENT
The Corporate Governance Statement for the 2014/2015 financial year is located on the Company’s website under the “About” tab or by copying the following to a web browser http://www.bionomics.com.au/about/corporate-governance
All shareholder information provided is current as at 7th September 2015.
Difference in Results Reported to the ASX There are no material differences between the figures reported in the financial statements and those lodged with the ASX in the Company’s Appendix 4E for the year ended 30 June 2015, other than those previously announced to the market.
Audit and Risk Management Committee The Company established an Audit and Risk Management Committee in July 2002. The main responsibilities of the Audit and Risk Management Committee are set out in our ‘Corporate Governance Statement’ published on the Bionomics website under “Investors” and then “Corporate Governance”.
Corporate Governance Bionomics’ corporate governance practices are set out in the section headed ‘Corporate Governance Statement’ published on the Bionomics website under “Investors” and then “Corporate Governance”.
Substantial Shareholders Substantial holders in the Company are set out below:
Equity Securities There are 5,011 holders of ordinary shares in Bionomics.
The number of shareholdings held in less than marketable parcels is 609.
Voting Rights There is one class of quoted equity securities issued by the Company, ordinary, with voting rights attached to the ordinary shares. One share equates to one vote.
ORDINARY SHARES NUMBER HELD
Link Traders (Aust) Pty Ltd 40,187,873
John Leaver 24,241,071
Ausbil Dexia Limited 24,000,000
The Australian National University 21,642,425
NUMBER OF SECURITY HOLDERS
CATEGORY (SIZE OF HOLDING) ORDINARY SHARES UNLISTED OPTIONS
1 – 1,000 495 0
1,001 – 5,000 1,563 8
5,001 – 10,000 862 2
10,001 – 100,000 1,770 56
100,001 – and over 321 15
5,011 81
For
per
sona
l use
onl
y
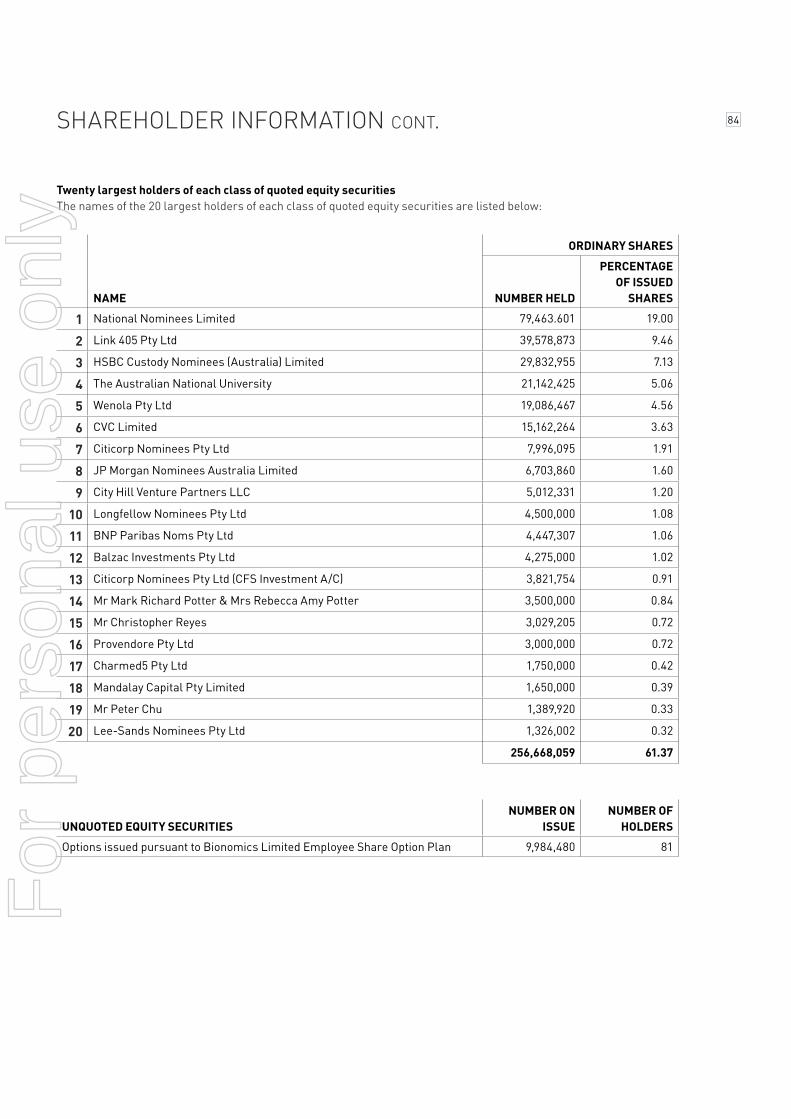
84SHAREHOLDER INFORMATION CONT.
ORDINARY SHARES
NAME NUMBER HELD
PERCENTAGE OF ISSUED
SHARES
1 National Nominees Limited 79,463.601 19.00
2 Link 405 Pty Ltd 39,578,873 9.46
3 HSBC Custody Nominees (Australia) Limited 29,832,955 7.13
4 The Australian National University 21,142,425 5.06
5 Wenola Pty Ltd 19,086,467 4.56
6 CVC Limited 15,162,264 3.63
7 Citicorp Nominees Pty Ltd 7,996,095 1.91
8 JP Morgan Nominees Australia Limited 6,703,860 1.60
9 City Hill Venture Partners LLC 5,012,331 1.20
10 Longfellow Nominees Pty Ltd 4,500,000 1.08
11 BNP Paribas Noms Pty Ltd 4,447,307 1.06
12 Balzac Investments Pty Ltd 4,275,000 1.02
13 Citicorp Nominees Pty Ltd (CFS Investment A/C) 3,821,754 0.91
14 Mr Mark Richard Potter & Mrs Rebecca Amy Potter 3,500,000 0.84
15 Mr Christopher Reyes 3,029,205 0.72
16 Provendore Pty Ltd 3,000,000 0.72
17 Charmed5 Pty Ltd 1,750,000 0.42
18 Mandalay Capital Pty Limited 1,650,000 0.39
19 Mr Peter Chu 1,389,920 0.33
20 Lee-Sands Nominees Pty Ltd 1,326,002 0.32
256,668,059 61.37
UNQUOTED EQUITY SECURITIESNUMBER ON
ISSUENUMBER OF
HOLDERS
Options issued pursuant to Bionomics Limited Employee Share Option Plan 9,984,480 81
Twenty largest holders of each class of quoted equity securities The names of the 20 largest holders of each class of quoted equity securities are listed below:
For
per
sona
l use
onl
y

85 COMPANY PARTICULARS
Bionomics, a listed public Company, is domiciled and incorporated in Australia.
Bionomics shares are listed on the Australian Securities Exchange under the code BNO.
REGISTERED AND ADMINISTRATIVE OFFICE31 Dalgleish StreetThebarton SA Australia 5031Telephone: +61 8 8354 6100 Facsimile: +61 8 8354 6199 E-mail: [email protected] Web Address: www.bionomics.com.au
SHARE REGISTRYComputershare Investor Services Pty LimitedLevel 5, 115 Grenfell StreetAdelaide SA Australia 5000Telephone: 1300 556 161 (within Australia) +61 3 9415 4000 (outside Australia)E-mail: [email protected] Address: www.computershare.com
SOLICITORSJohnson Winter & Slattery211 Victoria SquareAdelaide SA Australia 5000
AUDITORSDeloitte Touche Tohmatsu11 Waymouth StreetAdelaide SA Australia 5000
PATENT ATTORNEYSGriffith HackLevel 10, 161 Collins StreetMelbourne VIC Australia 3000
Davies Collison Cave1 Nicholson StreetMelbourne VIC Australia 3000
Bionomics is not listed on any other stock exchanges other than the ASX.
DIRECTORS
Mr Graeme Kaufman Chairman
Dr Deborah Rathjen Chief Executive Officerand Managing Director
Mr Trevor Tappenden Non-Executive Director
Dr Errol De Souza Non-Executive Director
Dr Jonathan Lim Non-Executive Director
SENIOR MANAGEMENTDr Deborah Rathjen Chief Executive Officer
and Managing DirectorMr Anthony Colasin Chief Business OfficerDr José Iglesias Chief Medical OfficerDr Jens Mikkelsen Chief Scientific OfficerMr Jack Moschakis Legal Counsel
and Company SecretaryMs Melanie Young Chief Financial Officer
SCIENTIFIC ADVISORS
Dr Carrolee Barlow PhD MD BA
Dr Glenn Begley MBBS, PhD, FRACP
Dr Dennis Carson MD BA
Prof Jonathon Cebon MBBS, PhD, FRACP
Dr Philippe Danjou MD PhD
Dr Jayesh Desai FRACP
Dr Errol De Souza PhD
Professor Paul Fitzgerald PhD MSc
Dr Richard Hargreaves PhD
Dr Ann Hayes PhD Bsc
Dr Fiona McLaughlin PhD FSB
Prof Danny Rischin MBBS, FRACP, MD
Prof Paul Rolan MBBS, MD
Dr Fiona Thomson PhD
Dr CD Nigel Toseland FRCPath
Dr Frank Yocca PhD
Bionomics ordinary shares commenced trading on the OTCQX marketplace n the US effective 2 March 2015 under the ticker code “BNOEF”.
Investors can find current financial disclosure and real-time level 2 quotes for Bionomics on www.otcmarkets.com
For more information, please visit www.otcmarkets.com
For
per
sona
l use
onl
y

31 DALGLEISH STREET, THEBARTON, SA AUSTRALIA, 5031 WWW.BIONOMICS.COM.AU ABN 53 075 582 740
2015 BIONOMICS ANNUAL REPORT
For
per
sona
l use
onl
y