Embed Size (px)
Citation preview

2014 results presentation Friday 27 February 2015
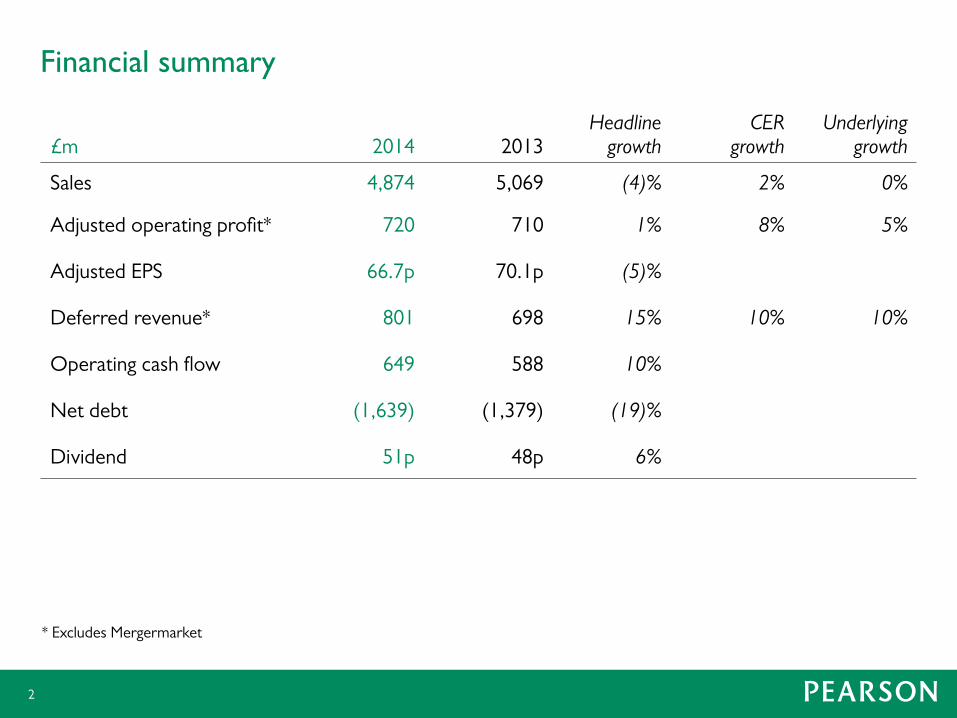
Financial summary
£m
2014
2013
Headline growth
CER growth
Underlying growth
Sales 4,874 5,069 (4)% 2% 0%
Adjusted operating profit* 720 710 1% 8% 5%
Adjusted EPS 66.7p 70.1p (5)%
Deferred revenue* 801 698 15% 10% 10%
Operating cash flow 649 588 10%
Net debt (1,639) (1,379) (19)%
Dividend 51p 48p 6%
2
* Excludes Mergermarket

The headlines
• Cyclical and policy forces as expected
• Major restructuring completed
• Overall, good competitive performance
• Growing strongly in digital & services; emerging markets set up to grow again in 2015
• Reinvestment in new products
• Efficacy making us a stronger, more sustainable company
• Returning to growth in 2015
3

Financial review
4

Sales
£m
2014
2013 CER
growth Underlying
growth
North America 2,974 3,073 2% 2%
Core 1,154 1,258 (5)% (5)%
Growth 746 738 11% (1)%
Total sales 4,874 5,069 2% 0%
5
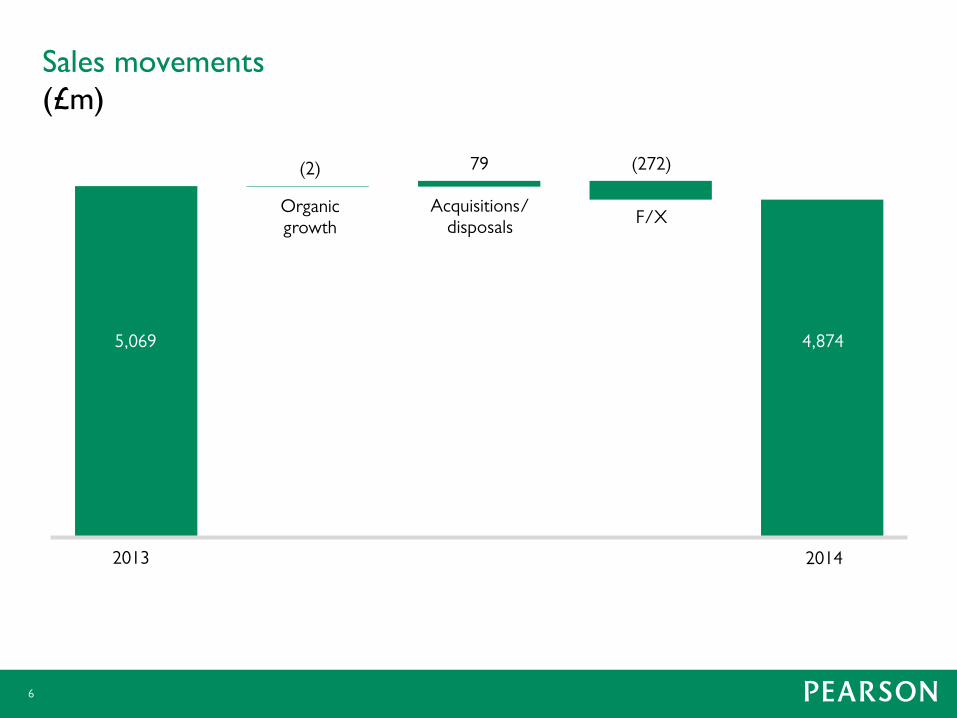
Sales movements (£m)
6
2013 2014
Organic growth
Acquisitions/disposals
F/X
5,069 4,874
(2) 79 (272)
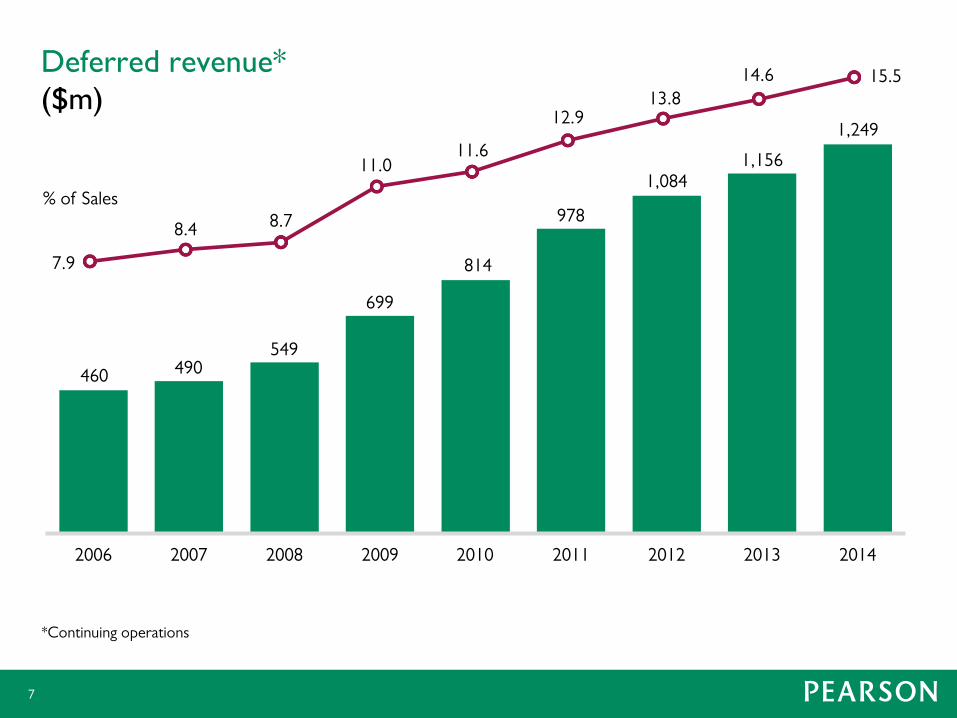
460 490 549
699
814
978
1,084 1,156
1,249
2006 2007 2008 2009 2010 2011 2012 2013 2014
7.9
8.4 8.7
11.0 11.6
12.9 13.8
14.6 15.5
7
Deferred revenue* ($m)
*Continuing operations
% of Sales

Operating profit
£m
2014*
2013**
CER growth
Underlying growth
North America 464 474 5% 5%
Core 152 120 30% 31%
Growth 35 38 16% (68)%
Penguin / PRH 69 78 (6)% 2%
Total excluding Mergermarket 720 710 8% 5%
Mergermarket 2 26 n/a n/a
Total 722 736 5% 5%
8
*Includes £44m net restructuring charges as follows: North America, £16m; Core, £12m; Growth, £4m; Penguin Random House, £12m
** Includes £135m net restructuring charges as follows: North America, £53m; Core, £50m; Growth, £32m

Restructuring charge falls away
(50)
84
45 (30)
Net Restructuring Reinvestment
Normal restructuring
Restructuring charge falls
away
Additional cost savings (FY effect)
(44)
176
60
Additional cost savings (FY effect)
(84)
40
Exceptional restructuring programme complete (£m)
+£99m +£142m
2014 2015
*Excludes impact of any underlying change in performance
Cost savings
Net P&L impact
Restructuring costs
Reinvestment in digital, services, emerging markets
9

Restructuring: physical infrastructure (Warehouse capacity, millions of sq ft)
7.5 7.3
7.0
6.4
4.3
2.9
2009 2010 2011 2012 2013 2014
10

Total business
Profit movements, £m
7
736 722
35 (7) (49)
2013 2014
Underlying Acquisitions/disposals F/X
PRH Tax
11
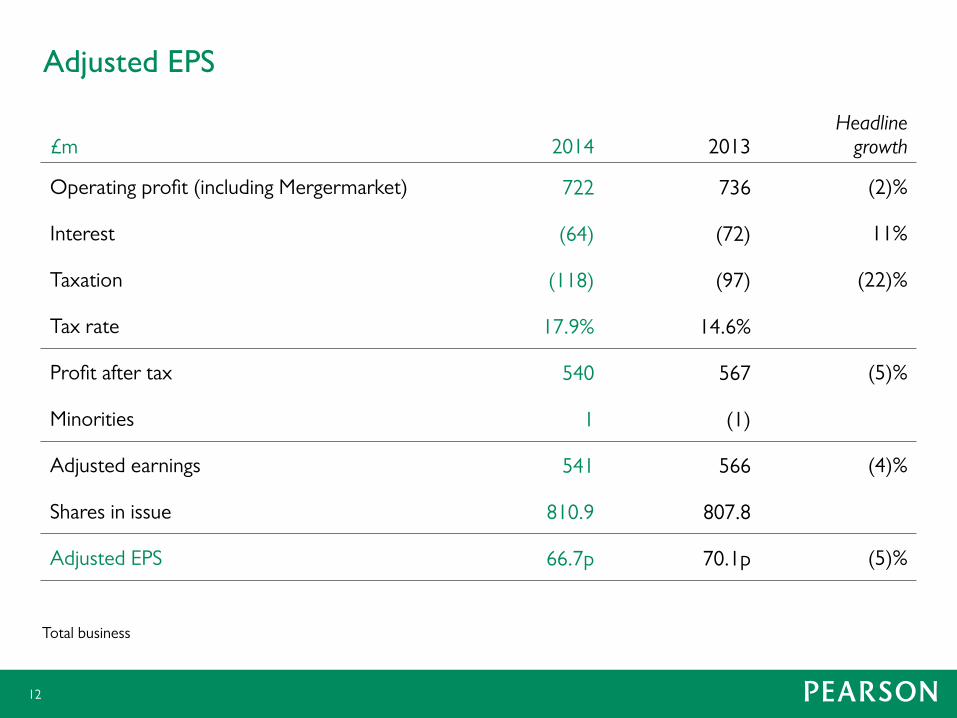
Adjusted EPS
£m
2014
2013
Headline growth
Operating profit (including Mergermarket) 722 736 (2)%
Interest (64) (72) 11%
Taxation (118) (97) (22)%
Tax rate 17.9% 14.6%
Profit after tax 540 567 (5)%
Minorities 1 (1)
Adjusted earnings 541 566 (4)%
Shares in issue 810.9 807.8
Adjusted EPS 66.7p 70.1p (5)%
12
Total business

Statutory P&L
£m
2014
2013
Headline growth
Operating profit 398 458 (13)%
Interest (64) (72) 11%
Finance costs – IAS39 / IAS21 (29) (4)
Profit before tax 305 382 (20)%
Taxation (63) (87) 28%
Profit after tax 242 295 (18)%
Discontinued operations* 228 244 (7)%
Profit for the year 470 539 (13)%
Basic EPS (total) 58.1p 66.6p (13)%
13
*2013 includes profit on sale of Penguin
*2014 includes profit on sale of Mergermarket

Operating cash flow
£m
2014
2013
var
Operating profit 722 736 (14)
Working capital (43) (37) (6)
- of which pre-publication expenditure (52) (77) 25
- of which other working capital 9 40 (31)
Net capital expenditure (172) (169) (3)
Depreciation 137 141 (4)
Share of operating results of associates (105) (84) (21)
Dividends from associates and JVs 120 64 56
Exchange 27 (40) 67
Other movements (37) (23) (14)
Operating cash flow 649 588 61
Cash conversion % 90% 80%
14
Total business

Free cash flow
£m
2014
2013
var
Operating cash flow 649 588 61
Operating tax paid (163) (191) 28
Net interest paid (73) (73) -
Operating free cash flow 413 324 89
Non operating tax paid - (55) 55
Free cash flow 413 269 144
Free cash flow / share 50.9p 33.3p 17.6p
15
Total business

Balance sheet
£m
2014
2013
var
Goodwill / intangible assets 6,310 5,959 351
Tangible fixed assets 334 344 (10)
Associates & JVs 1,118 1,092 26
Pre-publication 820 717 103
Deferred revenue (801) (751) (50)
Traditional working capital 484 397 87
Other net liabilities (114) (61) (53)
Net trading assets 8,151 7,697 454
Shareholders’ funds 5,979 5,700 279
Deferred tax 419 363 56
Pensions (27) 56 (83)
Other provisions 135 193 (58)
Minorities 6 6 -
Net debt 1,639 1,379 260
Capital employed 8,151 7,697 454
Year end $/£ 1.56 1.66
16
Total business
Credit rating
• Net debt/ EBITDA: 1.9x
• Interest cover: 11.3x
• Committed to BBB+/Baa1 over long term
17

Return on invested capital
£m
2014
2013
Operating profit 722 736
Less actual cash tax (operating) (163) (191)
Cash tax rate 23% 26%
Return 559 545
Average: goodwill - gross 6,487 6,828
other intangibles - gross 2,070 2,075
Pre-publication investments 757 736
Tangible fixed and working capital 586 491
Average total invested capital 9,900 10,130
ROIC 5.6% 5.4%
Total business
18

20.4 20.0
16.2
14.2 13.8 13.4 12.3
Working capital / sales (%)
19
Total business
2008 2009 2010 2011 2012 2013 2014
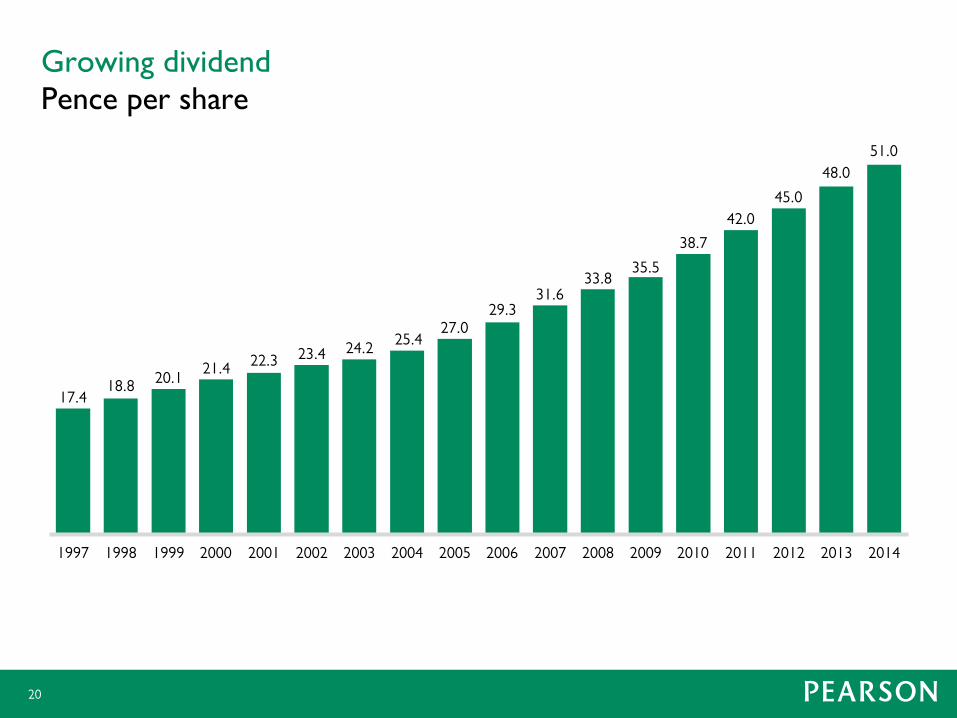
Growing dividend Pence per share
20
17.4 18.8
20.1 21.4 22.3 23.4 24.2
25.4 27.0
29.3 31.6
33.8 35.5
38.7
42.0
45.0
48.0
51.0
1997 1998 1999 2000 2001 2002 2003 2004 2005 2006 2007 2008 2009 2010 2011 2012 2013 2014
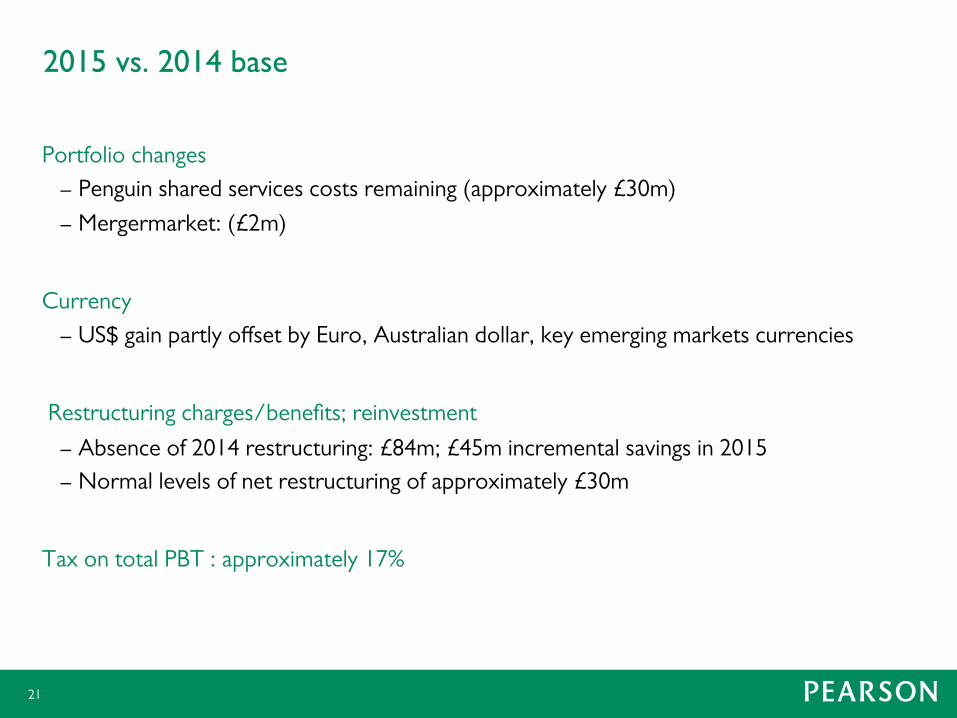
2015 vs. 2014 base
Portfolio changes
– Penguin shared services costs remaining (approximately £30m)
– Mergermarket: (£2m)
Currency
– US$ gain partly offset by Euro, Australian dollar, key emerging markets currencies
Restructuring charges/benefits; reinvestment
– Absence of 2014 restructuring: £84m; £45m incremental savings in 2015
– Normal levels of net restructuring of approximately £30m
Tax on total PBT : approximately 17%
21

2015 outlook (organic)
Guidance
– Adjusted earnings per share range of 75p to 80p
North American Education
– K12
○ greater stability in learning services
○ another good year for Connections
○ increased pre-pub amortisation
○ greater stability in assessments but some policy related risk remains in State assessments
– College
○ growth in digital & services
○ more stable college enrolments; slower new edition year
Growth
– growth in China, Brazil, India
– greater stability in South Africa
Core
– greater stability in UK
– growth in inside services offset by declines in Learning services in Australia
– stability in Italy following a year of significant curriculum change in 2014
22

2014 results presentation Friday 27 February 2015
Agenda
• Efficacy
=> Access, impact, outcomes
=> A higher returning company
• New digital products
• A more focused company
• A higher performing culture
• A strong brand
24

25
Leading to deep gains in learning
Drive change at scale
Good teaching
Technology and big data
Our strategy: combining digital, good teaching and scale The opportunity to improve learning outcomes

2.5 2.3
3.1
3.7
6.3
4.8
5.5
4.1
7.5 7.4
8.8 9.2
Concept and problem solving
Computation Concept and problem solving
Computation
A proven strategy: enVisionMATH Grade equivalent performance over 2 Years
Source: PRES Associates, Inc.
Students in 2nd and 3rd Students in 4th and 5th
Pre-test
Post-test year 1
Post-test year 2
26

A proven strategy: College Park Academy (Connections)
67.8
83.2
76.3
95.0
63.1
78.8 79.5
93.0
Source: 2014 Maryland Report Card
Math Reading Math Reading
6th grade 7th grade
All Maryland Schools
College Park Academy
27

0%
20%
40%
60%
80%
100%
0% 20% 40% 60% 80% 100%
Opportunity for intervention
A proven strategy: Wall Street English
% into the contract period
Student A: predicted as not-at-risk
Student B: predicted as at-risk
Source: Pearson
28
% o
f un
its
com
ple
ted
Pre
dic
tio
n p
oin
t 20
% in
to t
he c
ont
ract
per
iod

29
Source: Pearson
A proven strategy: MyLabs Learning gains at CA State University, Bakersfield with Pearson support
57.0%
68.0%
80.0% 84.0%
Reading / writing Freshman composition
72.7%
88.1%
Pre-test Post-test
5.1
3.7
Pre-MyWritingLab Post-MyWritingLab
Average test scores
Average retention of students starting reading/writing to
completing Freshman composition
Average length of time (in quarters) students spend from starting reading/
writing to completing Freshman composition
Pre-test
Post-test
30
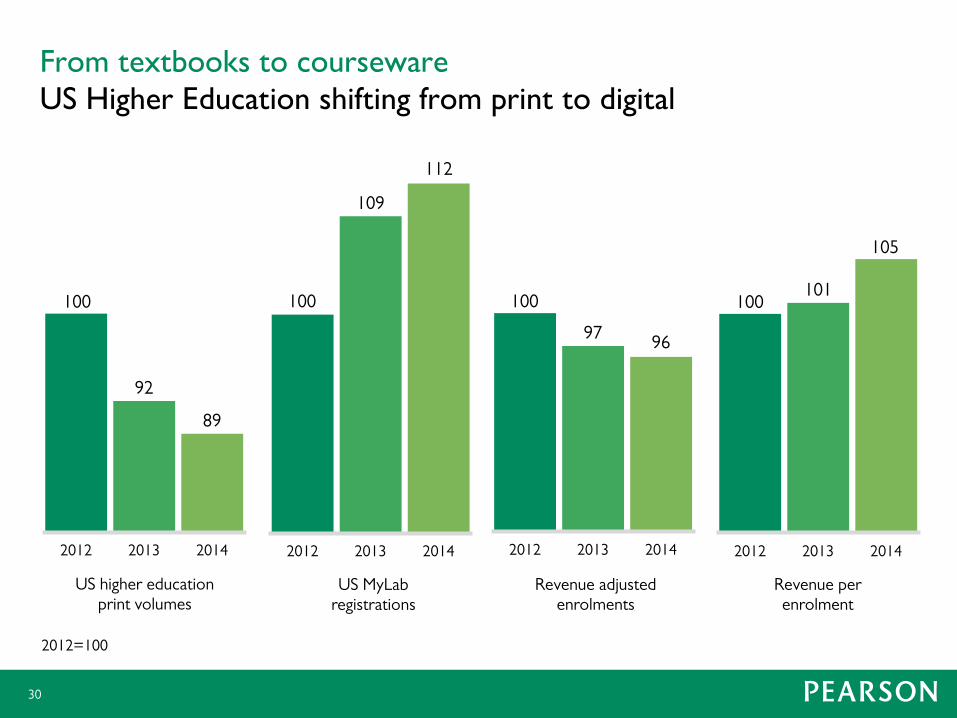
100
92
89
2012 2013 2014
100
109
112
2012 2013 2014
100
97 96
2012 2013 2014
100 101
105
2012 2013 2014
2012=100
From textbooks to courseware US Higher Education shifting from print to digital
US higher education print volumes
US MyLab registrations
Revenue adjusted enrolments
Revenue per enrolment
31
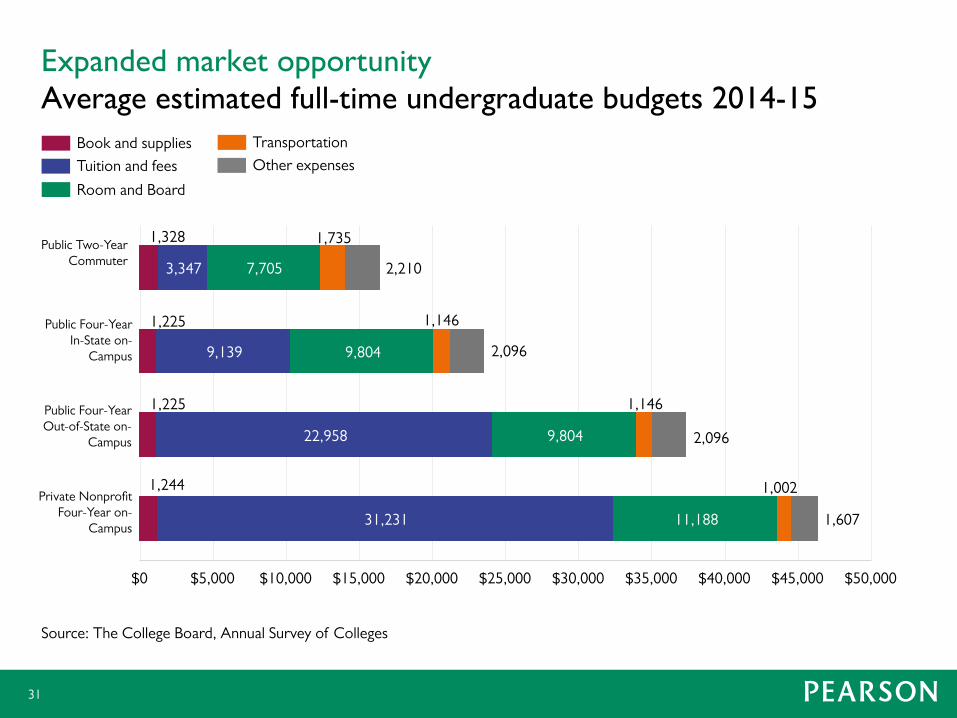
Source: The College Board, Annual Survey of Colleges
1,244
1,225
1,225
1,328
31,231
22,958
9,139
3,347
11,188
9,804
9,804
7,705
1,002
1,146
1,146
1,735
1,607
2,096
2,096
2,210
$0 $5,000 $10,000 $15,000 $20,000 $25,000 $30,000 $35,000 $40,000 $45,000 $50,000
Expanded market opportunity Average estimated full-time undergraduate budgets 2014-15
Public Two-Year Commuter
Public Four-Year In-State on-
Campus
Public Four-Year Out-of-State on-
Campus
Private Nonprofit Four-Year on-
Campus
Book and supplies
Tuition and fees
Room and Board
Transportation
Other expenses

Public Four-Year In-State on-Campus
Incremental launch costs
% o
f va
lue
chai
n ac
cess
ible
Courseware
Schools and colleges
Managed services
32

-5
0
5
10
15
20
25
30
35
0 1 2 3 4 5 6 7 8 9 10
2011 $(000)
Years since graduation from college
Doing more, and better, with less College earnings premium by graduation decade
Source: Mary C. Daly and Leila Bengali, Federal Reserve Bank of San Francisco
1950s – 60s
1970s – 80s
1990s – 2000s
33
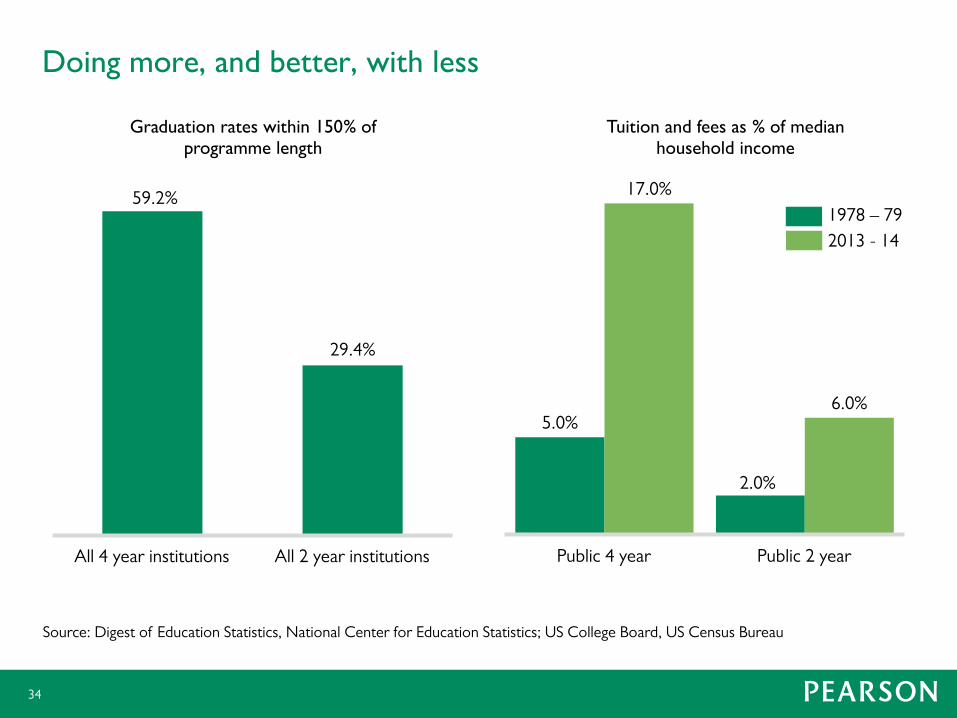
Doing more, and better, with less
5.0%
2.0%
17.0%
6.0%
Public 4 year Public 2 year
59.2%
29.4%
All 4 year institutions All 2 year institutions
Source: Digest of Education Statistics, National Center for Education Statistics; US College Board, US Census Bureau
Graduation rates within 150% of programme length
Tuition and fees as % of median household income
1978 – 79
2013 - 14
34
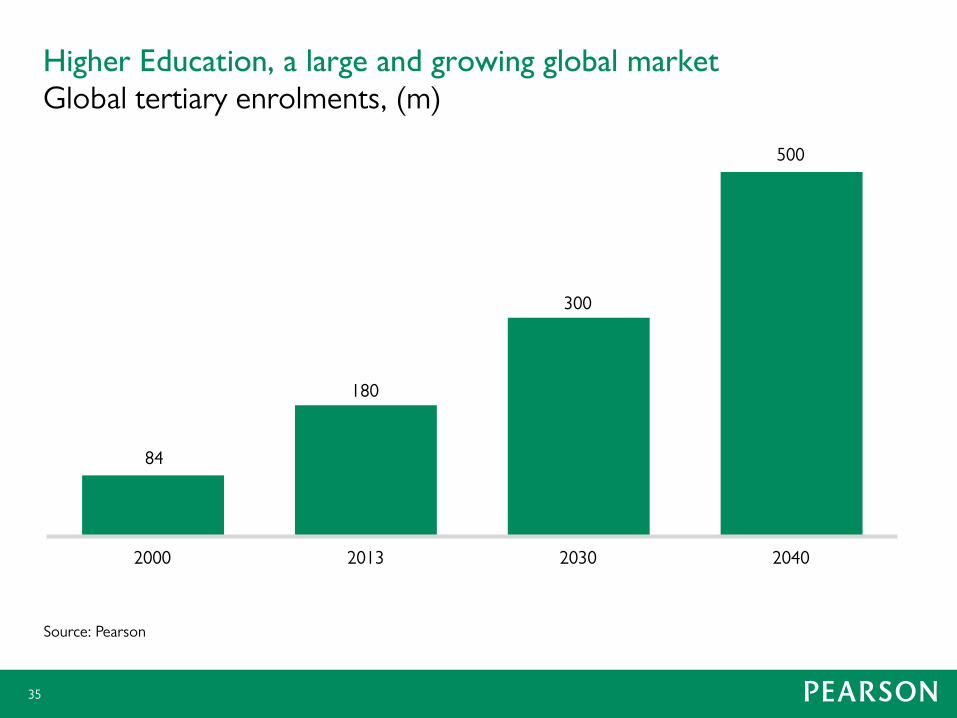
Higher Education, a large and growing global market Global tertiary enrolments, (m)
84
180
300
500
2000 2013 2030 2040
Source: Pearson
35
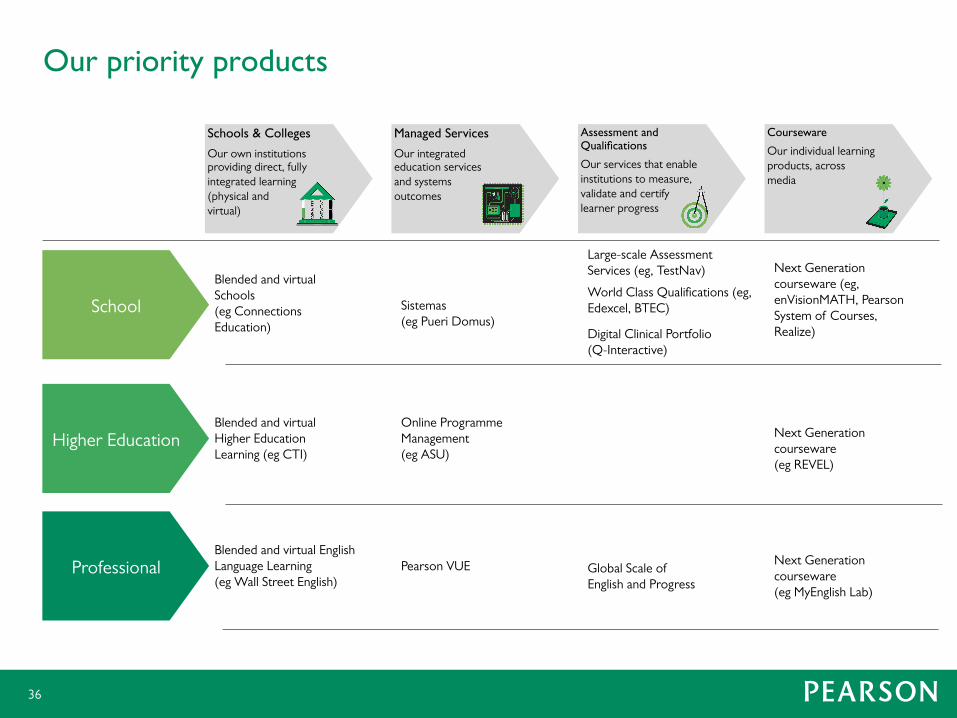
Our priority products
Higher Education
Professional
School
Next Generation courseware (eg REVEL)
Next Generation courseware (eg MyEnglish Lab)
Courseware
Our individual learning products, across media
Next Generation courseware (eg, enVisionMATH, Pearson System of Courses, Realize)
Large-scale Assessment Services (eg, TestNav)
World Class Qualifications (eg, Edexcel, BTEC)
Digital Clinical Portfolio (Q-Interactive)
Global Scale of English and Progress
Assessment and Qualifications
Our services that enable institutions to measure, validate and certify learner progress
Sistemas (eg Pueri Domus)
Online Programme Management (eg ASU)
Pearson VUE
Managed Services
Our integrated education services and systems outcomes
Blended and virtual English Language Learning (eg Wall Street English)
Blended and virtual Schools (eg Connections Education)
Blended and virtual Higher Education Learning (eg CTI)
Schools & Colleges
Our own institutions providing direct, fully integrated learning (physical and virtual)
36
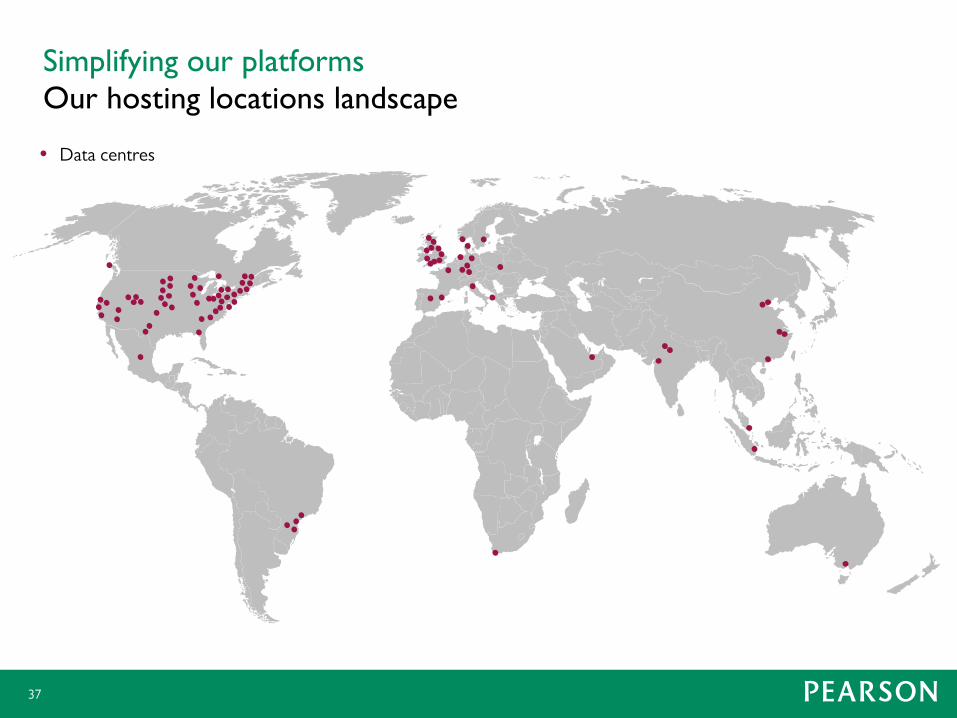
Simplifying our platforms Our hosting locations landscape
Data centres
37

38

39
We are building a more powerful company
• Efficacy
• New digital products
• A more focused company
• A higher performing culture
• A strong brand
=> Access, impact, outcomes
=> A higher returning company

Appendices
-6
-4
-2
0
2
4
6
8
10
12
1999 2000 2001 2002 2003 2004 2005 2006 2007 2008 2009 2010 2011 2012 2013 2014
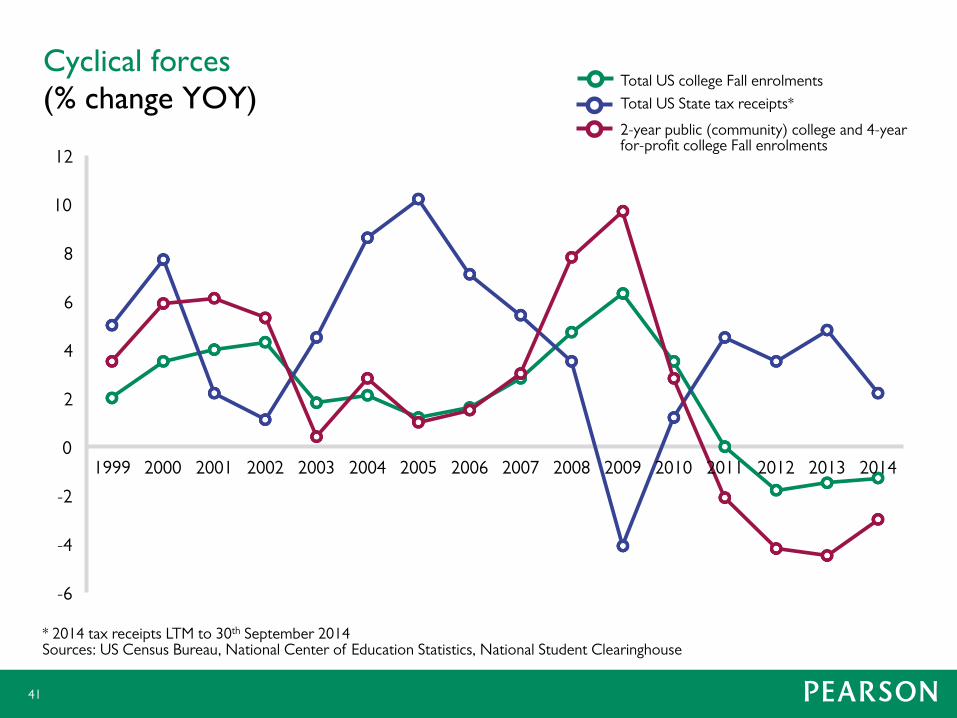
* 2014 tax receipts LTM to 30th September 2014 Sources: US Census Bureau, National Center of Education Statistics, National Student Clearinghouse
Cyclical forces (% change YOY)
Total US college Fall enrolments
Total US State tax receipts*
2-year public (community) college and 4-year for-profit college Fall enrolments
41
60
80
100
120
140
160
180
200
220
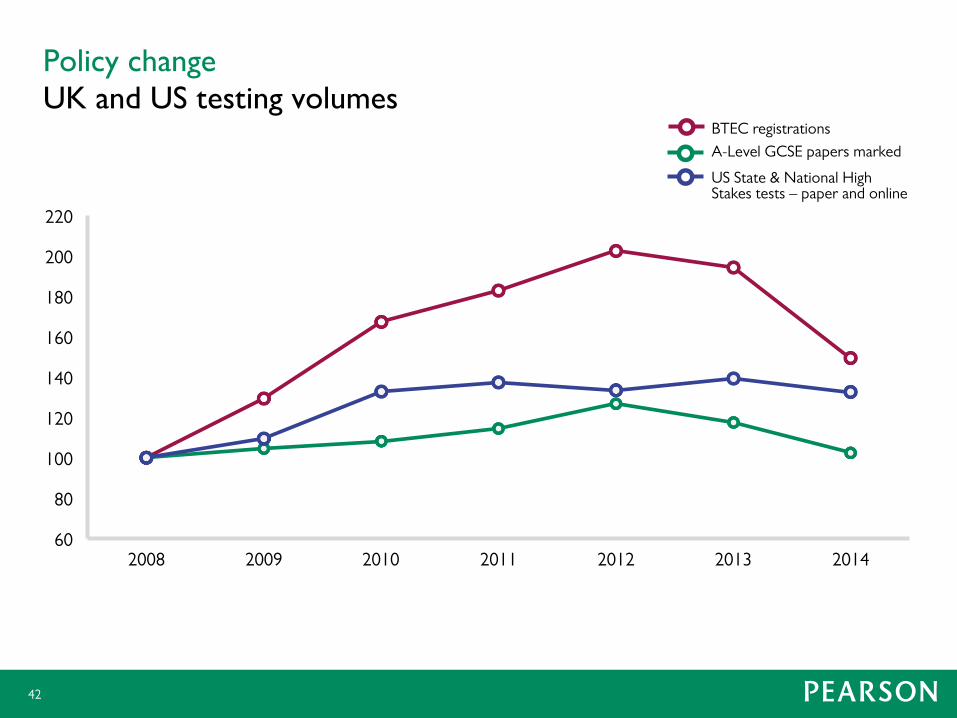
2008 2009 2010 2011 2012 2013 2014
Policy change UK and US testing volumes
BTEC registrations
A-Level GCSE papers marked
US State & National High Stakes tests – paper and online
42

45% 43%
25%
45%
17%
21%
10%
40% 54%
North America Core Growth
Geography revenue split by Line of Business
Professional
Higher Education
School
43
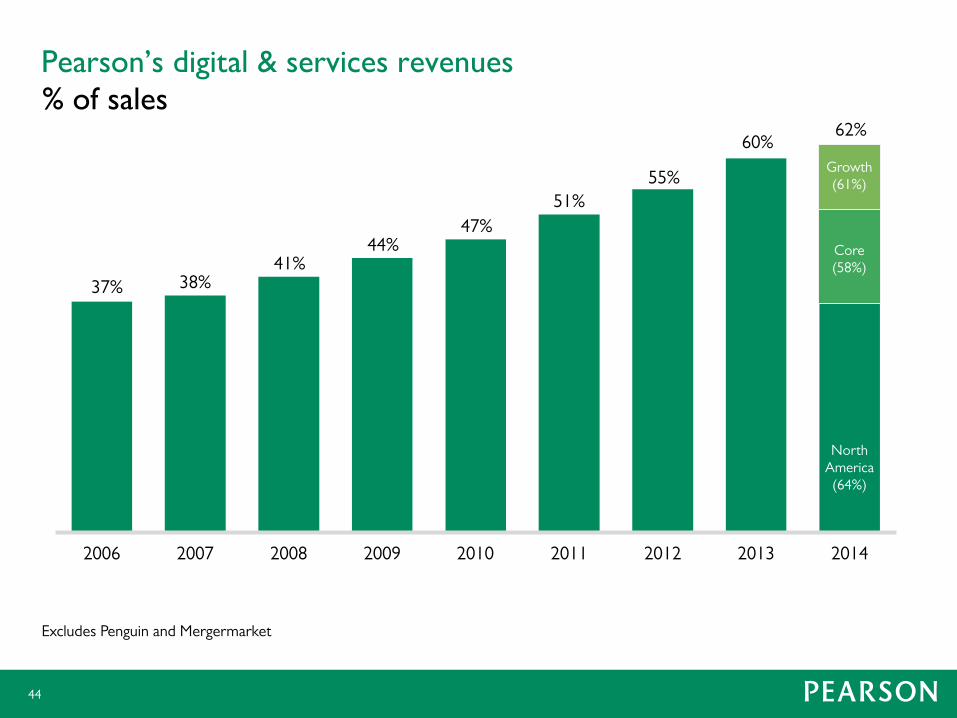
37% 38% 41%
44% 47%
51%
55%
60% 62%
2006 2007 2008 2009 2010 2011 2012 2013 2014
Pearson’s digital & services revenues % of sales
Excludes Penguin and Mergermarket
44
Growth (61%)
Core (58%)
North America (64%)
45
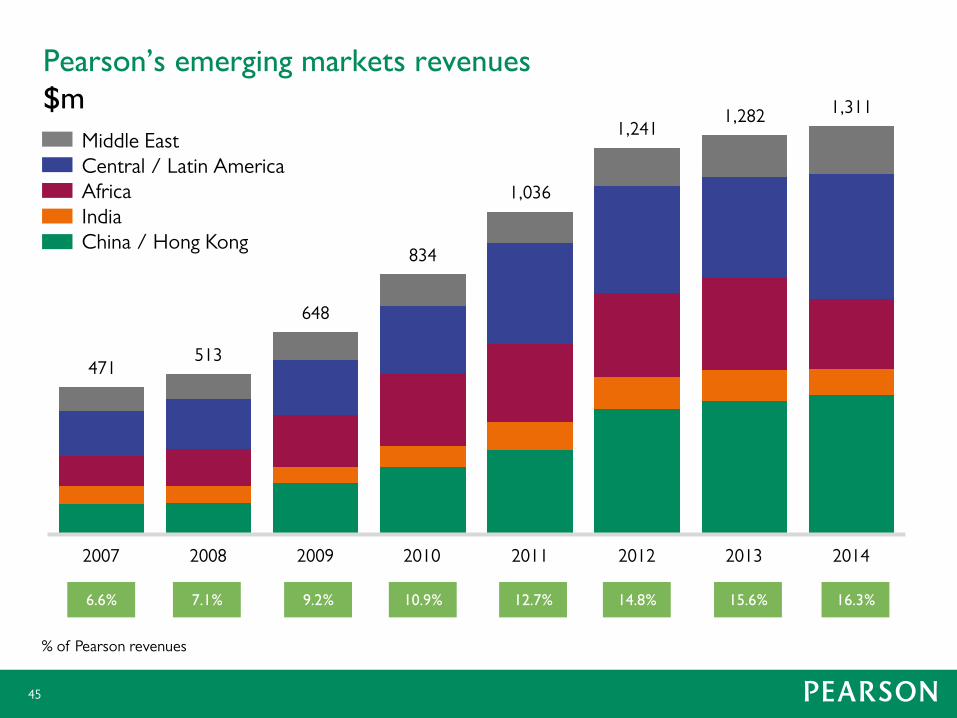
% of Pearson revenues
Pearson’s emerging markets revenues $m
471 513
648
834
1,036
1,241 1,282 1,311
2007 2008 2009 2010 2011 2012 2013 2014
6.6% 7.1% 9.2% 10.9% 12.7% 14.8% 15.6% 16.3%
Middle East Central / Latin America Africa India China / Hong Kong

Focus Products - Key Performance Indicators Assessment, registration and student volume growth
46
SCHOOL 2013 2014
Accuplacer 7,100,000 7,600,000
BTEC (registrations) 1,790,000 1,420,000
Connections Education (Full Time Equivalent students) 53,800 62,000
Edexcel GCSE/A level (papers marked) 5,811,000 5,189,000
Pearson sistemas (students) 497,000 481,000
Q-Interactive (tests administered) 1,000 26,000
Realize (registrations) 0 1,300,000
State and National Paper (papers marked) 38,000,000 31,600,000
State and National TestNav (tests administered) 8,000,000 11,200,000
State and National TestNav Practice (tests administered) 4,300,000 10,600,000
UK National Curriculum Test (papers marked) 3,138,000 3,903,000
HIGHER EDUCATION
CTI/MGI (students) 11,700 13,400
MyLab/Mastering (registrations) 11,700,000 12,500,000
Pearson Online Services (registrations) 173,000 212,000
UTEL Mexico (students) 4,700 9,400
PROFESSIONAL
Global Education (registrations) 109,600 117,300
Global English (registrations) 428,000 423,000
MyEnglishLab (user registrations) 400,000 461,000
Versant + PTE (tests administered) 711,000 827,000
Vue (tests administered) 11,600,000 12,800,000
Wall Street English (students) 191,800 190,100
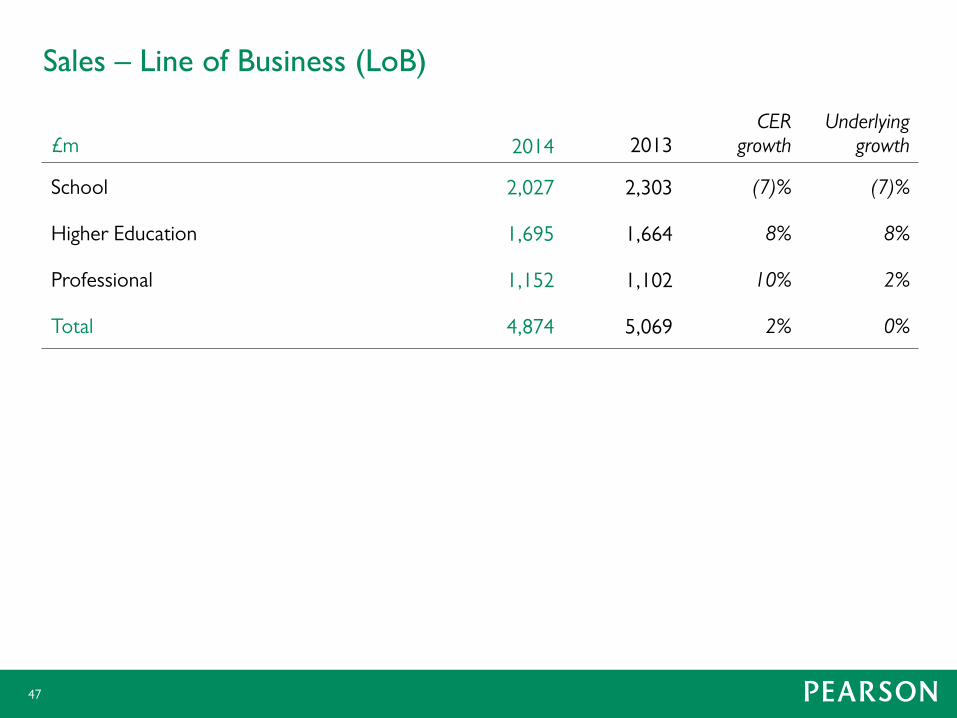
Sales – Line of Business (LoB)
£m
2014
2013
CER growth
Underlying growth
School 2,027 2,303 (7)% (7)%
Higher Education 1,695 1,664 8% 8%
Professional 1,152 1,102 10% 2%
Total 4,874 5,069 2% 0%
47

Operating profit – LoB
£m
2014**
2013*
CER growth
Underlying growth
School 236 268 (6)% (5)%
Higher Education 309 295 12% 12%
Professional 106 69 65% 17%
Penguin / PRH 69 78 (6)% 2%
Total excluding Mergermarket 720 710 8% 5%
Mergermarket 2 26 n/a n/a
Total 722 736 5% 5%
48
*2013 includes £135m net restructuring charges as follows: School, £70m; Higher Education, £24m; Professional, £41m
**2014 includes £44m net restructuring charges as follows: School, £20m; Higher Education, £9m; Professional, £3m and PRH £12m

Reconciliation: statutory to adjusted earnings 2014
£m
Statutory
Discontinued operations
Acquisition costs
Other net gains and
losses
Intangible charges
Other net finance costs
Tax amortisation
benefit
Adjusted earnings
Operating profit 398 2 6 (2) 318 - - 722
Net finance costs (93) - - - - 29 - (64)
Profit before tax 305 2 6 (2) 318 29 - 658
Income tax (63) (1) (1) 1 (73) (5) 24 (118)
Profit after tax 242 1 5 (1) 245 24 24 540
Discontinued operations 228 (1) - (227) - - - -
Profit for the period 470 - 5 (228) 245 24 24 540
Minority interest 1 - - - - - - 1
Earnings 471 - 5 (228) 245 24 24 541
49
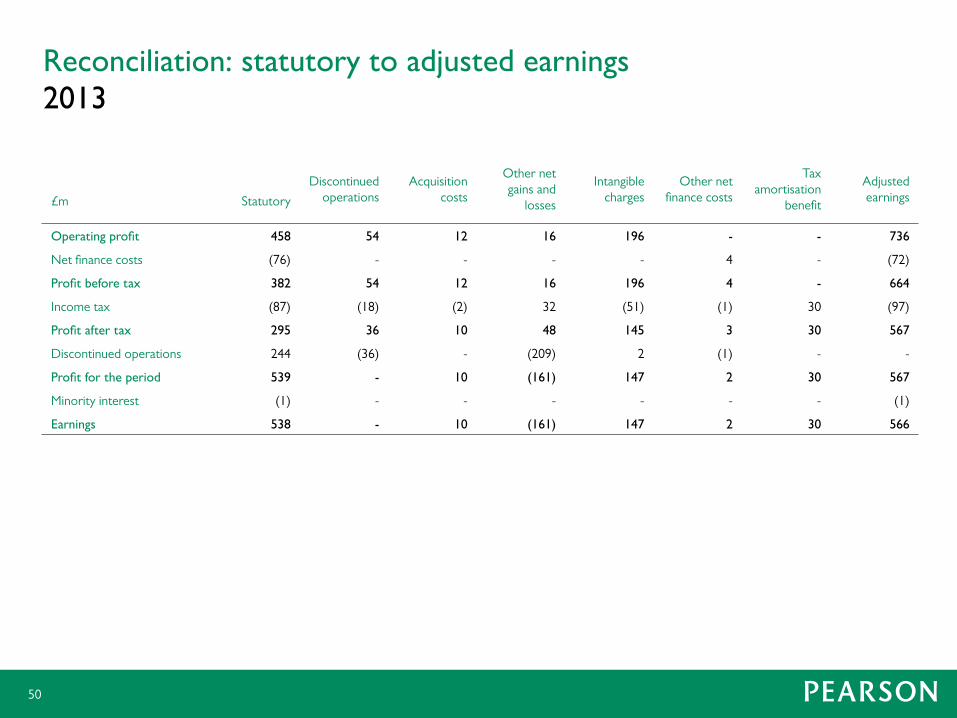
Reconciliation: statutory to adjusted earnings 2013
£m
Statutory
Discontinued operations
Acquisition costs
Other net gains and
losses
Intangible charges
Other net finance costs
Tax amortisation
benefit
Adjusted earnings
Operating profit 458 54 12 16 196 - - 736
Net finance costs (76) - - - - 4 - (72)
Profit before tax 382 54 12 16 196 4 - 664
Income tax (87) (18) (2) 32 (51) (1) 30 (97)
Profit after tax 295 36 10 48 145 3 30 567
Discontinued operations 244 (36) - (209) 2 (1) - -
Profit for the period 539 - 10 (161) 147 2 30 567
Minority interest (1) - - - - - - (1)
Earnings 538 - 10 (161) 147 2 30 566
50
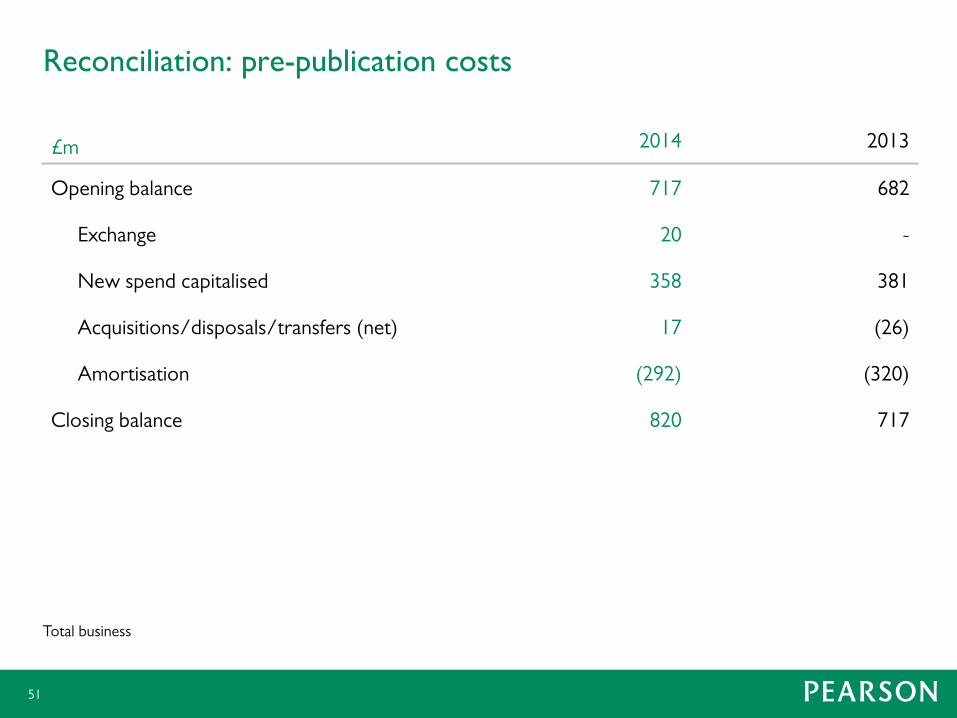
Reconciliation: pre-publication costs
Total business
£m
2014
2013
Opening balance 717 682
Exchange 20 -
New spend capitalised 358 381
Acquisitions/disposals/transfers (net) 17 (26)
Amortisation (292) (320)
Closing balance 820 717
51
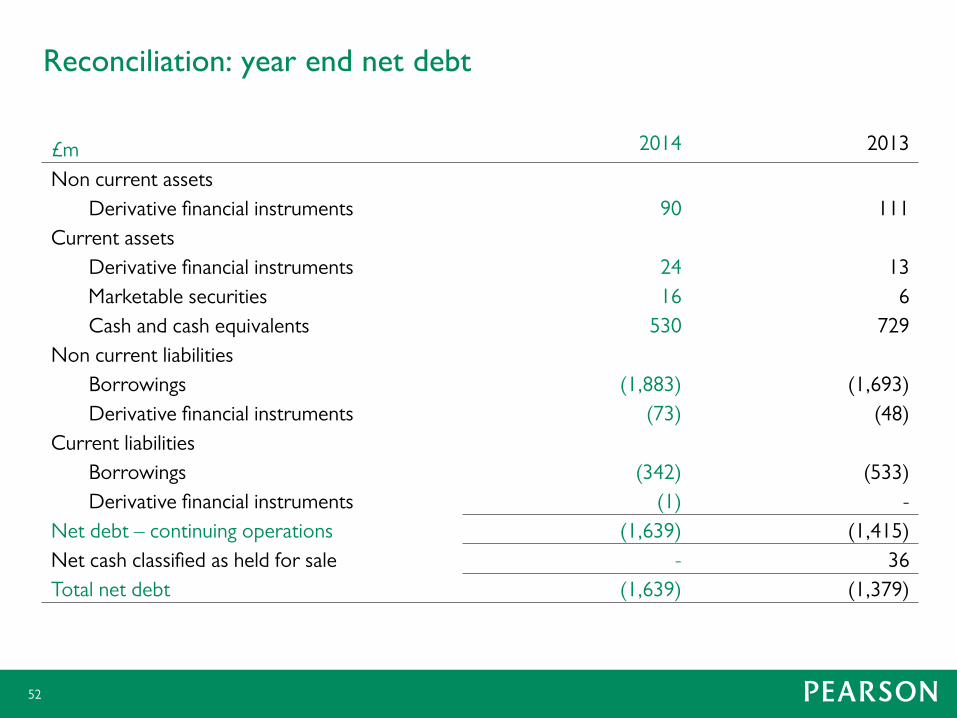
Reconciliation: year end net debt
£m
2014
2013
Non current assets
Derivative financial instruments 90 111
Current assets
Derivative financial instruments 24 13
Marketable securities 16 6
Cash and cash equivalents 530 729
Non current liabilities
Borrowings (1,883) (1,693)
Derivative financial instruments (73) (48)
Current liabilities
Borrowings (342) (533)
Derivative financial instruments (1) -
Net debt – continuing operations (1,639) (1,415)
Net cash classified as held for sale - 36
Total net debt (1,639) (1,379)
52

Retirement benefit obligations
£m
2014
2013
Income statement
Operating charge
Defined benefit schemes 21 29
Defined contribution schemes 69 72
Post retirement medical benefit schemes (11) -
79 101
Interest (1) 3
Total 78 104
Balance sheet
UK pension scheme asset 190 86
Other pension scheme liabilities (55) (35)
Post retirement medical benefit liability (81) (77)
Other pension accruals (27) (30)
Total 27 (56)
Total business
53