Embed Size (px)
Citation preview
2014 Rankings
Missouri

INSIDE FRONT COVER – INTENTIONALLY BLANK

County Health Rankings 2014: Missouri
www.countyhealthrankings.org/missouri 1
INTRODUCTION The County Health Rankings & Roadmaps program helps communities identify and implement solutions that make it easier for people to be healthy in their schools, workplaces, and neighborhoods. Ranking the health of nearly every county in the nation, the County Health Rankings illustrate what we know when it comes to what is making people sick or healthy. The Roadmaps show what we can do to create healthier places to live, learn, work, and play. The Robert Wood Johnson Foundation (RWJF) collaborates with the University of Wisconsin Population Health Institute (UWPHI) to bring this program to cities, counties, and states across the nation.
WHAT ARE THE COUNTY HEALTH RANKINGS? The County Health Rankings measure the health of nearly every county in the nation. Published online at countyhealthrankings.org, the Rankings help counties understand what influences how healthy residents are and how long they will live. The Rankings look at a variety of measures that affect health, such as high school graduation rates, access to healthy foods, rates of smoking, obesity, and teen births. Based on data available for each county, the Rankings are unique in their ability to measure the overall health of each county in all 50 states. They have been used to garner support for local health improvement initiatives among government agencies, healthcare providers, community organizations, business leaders, policy makers, and the public.
HOW ARE PEOPLE USING THE RANKINGS?
Ø Highlighting community success
Ø Identifying root causes of poor health
Ø Supporting policy change
Ø Engaging communities in health improvement
For more information, visit countyhealthrankings.org

County Health Rankings 2014: Missouri
2 www.countyhealthrankings.org/missouri
WHAT ARE THE ROADMAPS TO HEALTH? The Roadmaps to Health help communities bring people together to look at the many factors that influence health, select strategies that work, and make changes that will have a lasting impact. The Roadmaps focus on helping communities determine what they can do and what they can learn from others.
What You Can Do
The Roadmaps to Health Action Center provides step-by-step guides, tools, and webinars to help groups working to improve the health of their communities. Community Coaches also provide customized consultation to local communities that have demonstrated a willingness to address factors that we know influence health, such as education, income, and community safety.
The Action Center also features What Works for Health – a searchable database of evidence-informed policies and programs that can improve health.
Learning From Others
Honoring the efforts of communities working at the forefront of health improvement, the Robert Wood Johnson Foundation annually awards the RWJF Culture of Health Prize to outstanding communities that are working toward better health. The Prize recognizes communities with strong and diverse partnerships that are coming together with a shared vision and commitment to address multiple factors that affect health and make lasting changes that create a culture of health for all. Visit countyhealthrankings.org or rwjf.org/prize to learn about the work of past prize winners.
At countyhealthrankings.org, we also feature stories from communities across the nation who have used data from the County Health Rankings or have engaged in strategies to improve health. For example, you can learn from the successes and challenges of the 30 Roadmaps to Health Community Grantees. These grantees are working to create positive policy or systems changes that address social and economic factors that influence how healthy people are and how long they live, such as education and community safety. You might also want to contact your local affiliate of United Way Worldwide, the National Business Coalition on Health, or the National Association of Counties - their national parent organizations have partnered with us to raise awareness and stimulate action to improve health in their local members’ communities.
How can you get involved?
In communities large and small, people from all walks of life are taking ownership and action to improve health. Visit countyhealthrankings.org to get ideas and guidance on how you can take action in your community. Working with others, you can improve the health of your community.

County Health Rankings 2014: Missouri
www.countyhealthrankings.org/missouri 3
The green map below shows the distribution of Missouri’s health outcomes, based on an equal weighting of length and quality of life.
Lighter colors indicate better performance in the respective summary rankings. Detailed information on the underlying measures is available on our web site.
HEALTH OUTCOMES RANKS
County Rank County Rank County Rank County Rank Adair 42 Dallas 59 Livingston 63 Randolph 71 Andrew 2 Daviess 33 Macon 22 Ray 92 Atchison 13 DeKalb 11 Madison 103 Reynolds 99 Audrain 68 Dent 110 Maries 7 Ripley 112 Barry 85 Douglas 76 Marion 50 Saline 31 Barton 48 Dunklin 115 McDonald 97 Schuyler 73 Bates 25 Franklin 57 Mercer 29 Scotland 41 Benton 79 Gasconade 81 Miller 49 Scott 89 Bollinger 36 Gentry 26 Mississippi 109 Shannon 84 Boone 8 Greene 40 Moniteau 16 Shelby 58 Buchanan 65 Grundy 27 Monroe 23 St. Charles 3 Butler 107 Harrison 28 Montgomery 86 St. Clair 105 Caldwell 95 Henry 88 Morgan 80 St. Francois 96 Callaway 74 Hickory 102 New Madrid 111 St. Louis 20 Camden 43 Holt 67 Newton 64 St. Louis City 108 Cape Girardeau 24 Howard 9 Nodaway 1 Ste. Genevieve 18 Carroll 72 Howell 90 Oregon 78 Stoddard 91 Carter 113 Iron 101 Osage 14 Stone 47 Cass 15 Jackson 75 Ozark 106 Sullivan 94 Cedar 82 Jasper 51 Pemiscot 114 Taney 62 Chariton 19 Jefferson 34 Perry 21 Texas 98 Christian 5 Johnson 6 Pettis 55 Vernon 69 Clark 93 Knox 60 Phelps 66 Warren 37 Clay 12 Laclede 52 Pike 39 Washington 104 Clinton 30 Lafayette 10 Platte 4 Wayne 100 Cole 17 Lawrence 53 Polk 61 Webster 56

County Health Rankings 2014: Missouri
4 www.countyhealthrankings.org/missouri
County Rank County Rank County Rank County Rank Cooper 46 Lewis 32 Pulaski 35 Worth 77 Crawford 83 Lincoln 54 Putnam 44 Wright 87 Dade 70 Linn 38 Ralls 45
County Health Rankings 2014: Missouri
www.countyhealthrankings.org/missouri 5
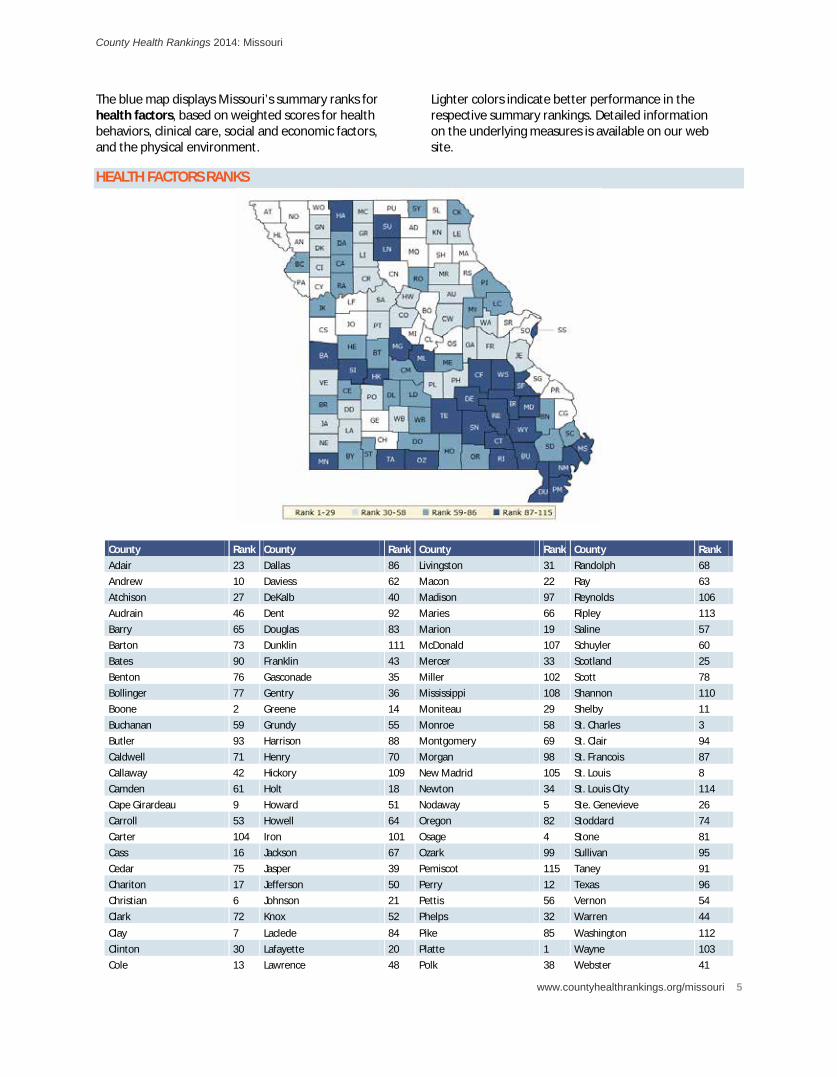
The blue map displays Missouri’s summary ranks for health factors, based on weighted scores for health behaviors, clinical care, social and economic factors, and the physical environment.
Lighter colors indicate better performance in the respective summary rankings. Detailed information on the underlying measures is available on our web site.
HEALTH FACTORS RANKS
County Rank County Rank County Rank County Rank Adair 23 Dallas 86 Livingston 31 Randolph 68 Andrew 10 Daviess 62 Macon 22 Ray 63 Atchison 27 DeKalb 40 Madison 97 Reynolds 106 Audrain 46 Dent 92 Maries 66 Ripley 113 Barry 65 Douglas 83 Marion 19 Saline 57 Barton 73 Dunklin 111 McDonald 107 Schuyler 60 Bates 90 Franklin 43 Mercer 33 Scotland 25 Benton 76 Gasconade 35 Miller 102 Scott 78 Bollinger 77 Gentry 36 Mississippi 108 Shannon 110 Boone 2 Greene 14 Moniteau 29 Shelby 11 Buchanan 59 Grundy 55 Monroe 58 St. Charles 3 Butler 93 Harrison 88 Montgomery 69 St. Clair 94 Caldwell 71 Henry 70 Morgan 98 St. Francois 87 Callaway 42 Hickory 109 New Madrid 105 St. Louis 8 Camden 61 Holt 18 Newton 34 St. Louis City 114 Cape Girardeau 9 Howard 51 Nodaway 5 Ste. Genevieve 26 Carroll 53 Howell 64 Oregon 82 Stoddard 74 Carter 104 Iron 101 Osage 4 Stone 81 Cass 16 Jackson 67 Ozark 99 Sullivan 95 Cedar 75 Jasper 39 Pemiscot 115 Taney 91 Chariton 17 Jefferson 50 Perry 12 Texas 96 Christian 6 Johnson 21 Pettis 56 Vernon 54 Clark 72 Knox 52 Phelps 32 Warren 44 Clay 7 Laclede 84 Pike 85 Washington 112 Clinton 30 Lafayette 20 Platte 1 Wayne 103 Cole 13 Lawrence 48 Polk 38 Webster 41
County Health Rankings 2014: Missouri
6 www.countyhealthrankings.org/missouri
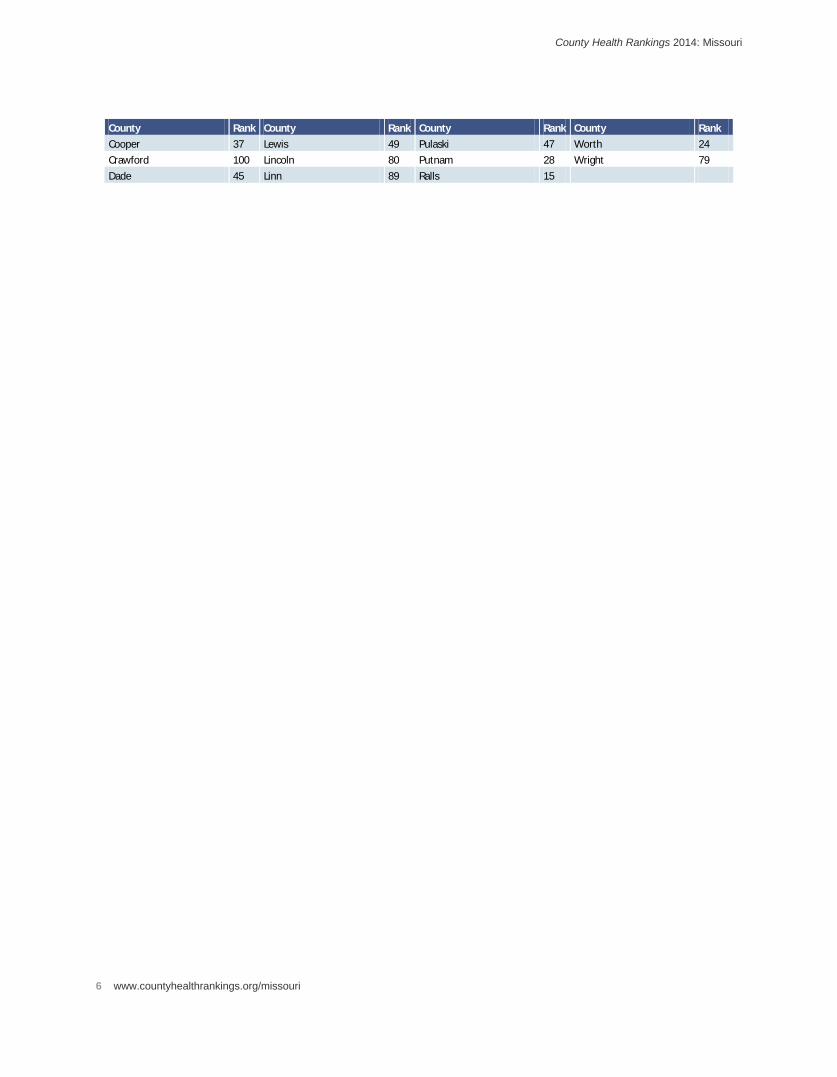
County Rank County Rank County Rank County Rank Cooper 37 Lewis 49 Pulaski 47 Worth 24 Crawford 100 Lincoln 80 Putnam 28 Wright 79 Dade 45 Linn 89 Ralls 15

County Health Rankings 2014: Missouri
www.countyhealthrankings.org/missouri 7
Summary Health Outcomes & Health Factors Rankings Counties receive two ranks:
· Health Outcomes · Health Factors
Each of these ranks represents a weighted summary of a number of measures.
Health outcomes represent how healthy a county is while health factors represent what influences the health of the county.
Rank Health Outcomes Rank Health Factors 1 Nodaway 1 Platte
2 Andrew 2 Boone
3 St. Charles 3 St. Charles
4 Platte 4 Osage
5 Christian 5 Nodaway
6 Johnson 6 Christian
7 Maries 7 Clay
8 Boone 8 St. Louis
9 Howard 9 Cape Girardeau
10 Lafayette 10 Andrew
11 DeKalb 11 Shelby
12 Clay 12 Perry
13 Atchison 13 Cole
14 Osage 14 Greene
15 Cass 15 Ralls
16 Moniteau 16 Cass
17 Cole 17 Chariton
18 Ste. Genevieve 18 Holt
19 Chariton 19 Marion
20 St. Louis 20 Lafayette
21 Perry 21 Johnson
22 Macon 22 Macon
23 Monroe 23 Adair
24 Cape Girardeau 24 Worth
25 Bates 25 Scotland
26 Gentry 26 Ste. Genevieve
27 Grundy 27 Atchison
28 Harrison 28 Putnam
29 Mercer 29 Moniteau
30 Clinton 30 Clinton
31 Saline 31 Livingston
32 Lewis 32 Phelps
33 Daviess 33 Mercer
34 Jefferson 34 Newton
35 Pulaski 35 Gasconade
36 Bollinger 36 Gentry
37 Warren 37 Cooper
38 Linn 38 Polk
39 Pike 39 Jasper
40 Greene 40 DeKalb

County Health Rankings 2014: Missouri
8 www.countyhealthrankings.org/missouri
Rank Health Outcomes Rank Health Factors 41 Scotland 41 Webster
42 Adair 42 Callaway
43 Camden 43 Franklin
44 Putnam 44 Warren
45 Ralls 45 Dade
46 Cooper 46 Audrain
47 Stone 47 Pulaski
48 Barton 48 Lawrence
49 Miller 49 Lewis
50 Marion 50 Jefferson
51 Jasper 51 Howard
52 Laclede 52 Knox
53 Lawrence 53 Carroll
54 Lincoln 54 Vernon
55 Pettis 55 Grundy
56 Webster 56 Pettis
57 Franklin 57 Saline
58 Shelby 58 Monroe
59 Dallas 59 Buchanan
60 Knox 60 Schuyler
61 Polk 61 Camden
62 Taney 62 Daviess
63 Livingston 63 Ray
64 Newton 64 Howell
65 Buchanan 65 Barry
66 Phelps 66 Maries
67 Holt 67 Jackson
68 Audrain 68 Randolph
69 Vernon 69 Montgomery
70 Dade 70 Henry
71 Randolph 71 Caldwell
72 Carroll 72 Clark
73 Schuyler 73 Barton
74 Callaway 74 Stoddard
75 Jackson 75 Cedar
76 Douglas 76 Benton
77 Worth 77 Bollinger
78 Oregon 78 Scott
79 Benton 79 Wright
80 Morgan 80 Lincoln
81 Gasconade 81 Stone
82 Cedar 82 Oregon
83 Crawford 83 Douglas
84 Shannon 84 Laclede
85 Barry 85 Pike
86 Montgomery 86 Dallas
87 Wright 87 St. Francois
88 Henry 88 Harrison

County Health Rankings 2014: Missouri
www.countyhealthrankings.org/missouri 9
Rank Health Outcomes Rank Health Factors 89 Scott 89 Linn
90 Howell 90 Bates
91 Stoddard 91 Taney
92 Ray 92 Dent
93 Clark 93 Butler
94 Sullivan 94 St. Clair
95 Caldwell 95 Sullivan
96 St. Francois 96 Texas
97 McDonald 97 Madison
98 Texas 98 Morgan
99 Reynolds 99 Ozark
100 Wayne 100 Crawford
101 Iron 101 Iron
102 Hickory 102 Miller
103 Madison 103 Wayne
104 Washington 104 Carter
105 St. Clair 105 New Madrid
106 Ozark 106 Reynolds
107 Butler 107 McDonald
108 St. Louis City 108 Mississippi
109 Mississippi 109 Hickory
110 Dent 110 Shannon
111 New Madrid 111 Dunklin
112 Ripley 112 Washington
113 Carter 113 Ripley
114 Pemiscot 114 St. Louis City
115 Dunklin 115 Pemiscot

County Health Rankings 2014: Missouri
10 www.countyhealthrankings.org/missouri
2014 County Health Rankings: Measures, Data Sources, and Years of Data Measure Data Source Years of Data
HEALTH OUTCOMES
Length of Life Premature death National Center for Health Statistics 2008-2010 Quality of Life Poor or fair health Behavioral Risk Factor Surveillance System 2006-2012
Poor physical health days Behavioral Risk Factor Surveillance System 2006-2012 Poor mental health days Behavioral Risk Factor Surveillance System 2006-2012 Low birthweight National Center for Health Statistics 2005-2011
HEALTH FACTORS HEALTH BEHAVIORS Tobacco Use Adult smoking Behavioral Risk Factor Surveillance System 2006-2012 Diet and Exercise
Adult obesity National Center for Chronic Disease Prevention and Health Promotion
2010
Food environment index USDA Food Environment Atlas, Map the Meal Gap 2010-2011 Physical inactivity National Center for Chronic Disease Prevention and
Health Promotion 2010
Access to exercise opportunities OneSource Global Business Browser, Delorme map data, ESRI, & US Census Tigerline Files
2010 & 2012
Alcohol and Drug Use
Excessive drinking Behavioral Risk Factor Surveillance System 2006-2012 Alcohol-impaired driving deaths Fatality Analysis Reporting System 2008-2012
Sexual Activity Sexually transmitted infections National Center for HIV/AIDS, Viral Hepatitis, STD, and TB prevention
2011
Teen births National Center for Health Statistics 2005-2011 CLINICAL CARE Access to Care Uninsured Small Area Health Insurance Estimates 2011
Primary care physicians HRSA Area Resource File 2011 Dentists HRSA Area Resource File 2012 Mental health providers CMS, National Provider Identification 2013
Quality of Care Preventable hospital stays Medicare/Dartmouth Institute 2011 Diabetic screening Medicare/Dartmouth Institute 2011 Mammography screening Medicare/Dartmouth Institute 2011
SOCIAL AND ECONOMIC FACTORS Education High school graduation data.gov, supplemented with National Center for
Education Statistics 2010-2011
Some college American Community Survey 2008-2012 Employment Unemployment Bureau of Labor Statistics 2012 Income Children in poverty Small Area Income and Poverty Estimates 2012 Family and Social Support
Inadequate social support Behavioral Risk Factor Surveillance System 2005-2010 Children in single-parent households American Community Survey 2008-2012
Community Safety
Violent crime Uniform Crime Reporting - FBI 2009-2011 Injury deaths CDC WONDER 2006-2010
PHYSICAL ENVIRONMENT Air and Water Quality
Air pollution - particulate matter 1 CDC WONDER 2011 Drinking water violations Safe Drinking Water Information System FY 2012-2013
Housing and Transit
Severe housing problems HUD, Comprehensive Housing Affordability Strategy 2006-2010 Driving alone to work American Community Survey 2008-2012 Long commute – driving alone American Community Survey 2008-2012
1 Not available for AK and HI.

County Health Rankings 2014: Missouri
www.countyhealthrankings.org/missouri 11
CREDITS
Report Authors University of Wisconsin-Madison School of Medicine and Public Health Department of Population Health Sciences Population Health Institute
Bridget Catlin, PhD, MHSA Amanda Jovaag, MS Julie Willems Van Dijk, PhD, RN Patrick Remington, MD, MPH
This publication would not have been possible without the following contributions:
Data Centers for Disease Control and Prevention: National Center for Health Statistics and Division of Behavioral Surveillance Dartmouth Institute for Health Policy & Clinical Practice
Research Assistance Jennifer Buechner Hyojun Park, MA Elizabeth Pollock Jennifer Robinson Matthew Rodock, MPH Anne Roubal, MS
Communications and Outreach Burness Communications Alison Bergum, MPA Matthew Call Kate Konkle, MPH Kitty Jerome, MA Karen Odegaard, MPH Jan O’Neill, MPA
Design Forum One, Alexandria, VA
Robert Wood Johnson Foundation Abbey Cofsky, MPH – Senior Program Officer Michelle Larkin, JD, MS, RN – Assistant Vice-President, Program Portfolios Marjorie Paloma, MPH – Senior Policy Advisor James S. Marks, MD, MPH – Senior Vice-President and Director, Program Portfolios Joe Marx – Senior Communications Officer
Suggested citation: University of Wisconsin Population Health Institute. County Health Rankings 2014.


INSIDE BACK COVER – INTENTIONALLY BLANK
University of Wisconsin Population Health Institute 610 Walnut St, #524, Madison, WI 53726 (608) 265-8240 / [email protected]