Embed Size (px)
Citation preview

2014 Hankook Tire 4th Quarter Result
Jan. 30, 2015

The information in this presentation is based upon management forecasts and reflects
prevailing conditions and our views as of this date, all of which are accordingly subject
to change. In preparing this presentation, we have relied upon and assumed, without
independent verification, the accuracy and completeness of all information available
from public sources of which was provided by us or which was reviewed by us.
The information in this presentation does not take into account the effects of a possible
transaction or transactions involving an actual or potential change of control, which
may have significant valuation and other effects.
1 Table of Contents
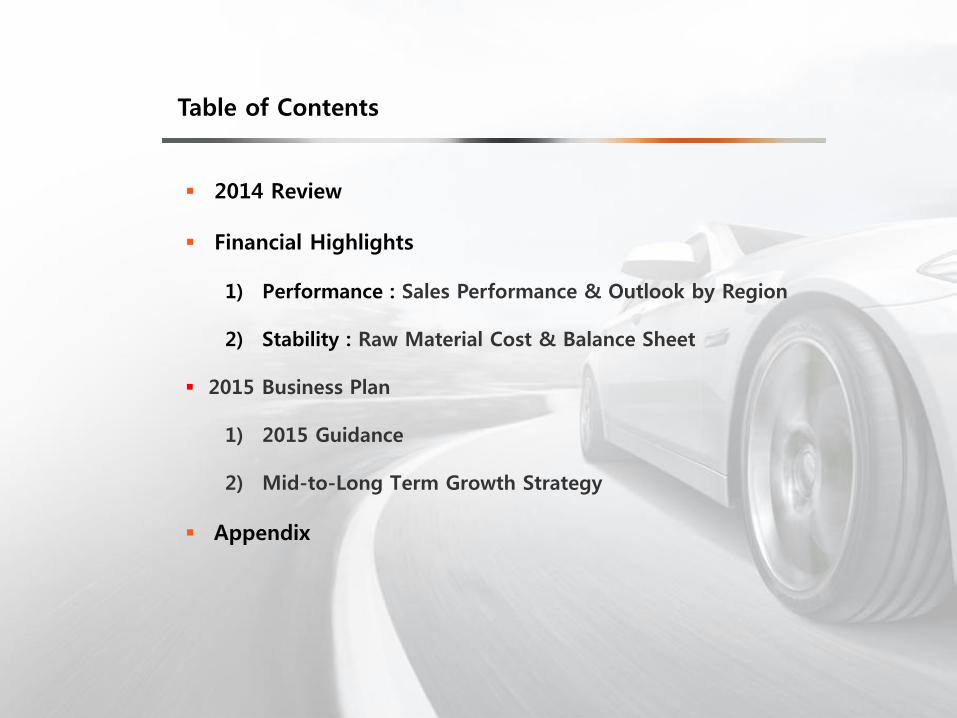
2014 Review
Financial Highlights
1) Performance : Sales Performance & Outlook by Region
2) Stability : Raw Material Cost & Balance Sheet
2015 Business Plan
1) 2015 Guidance
2) Mid-to-Long Term Growth Strategy
Appendix
Finance Team Finance Team
Financial Highlights
5
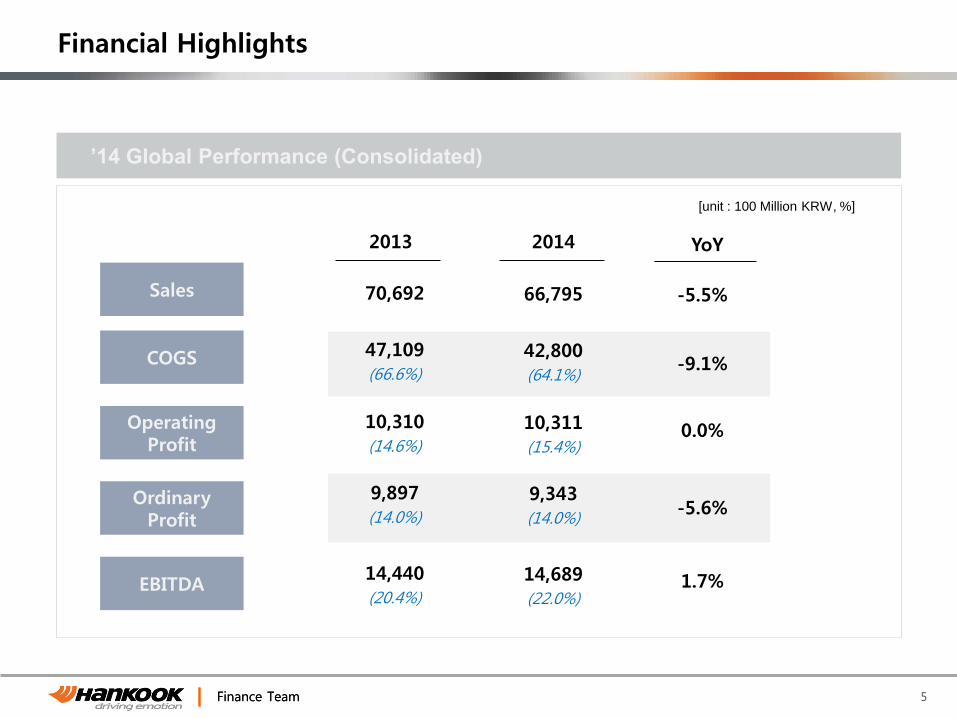
2013
66,795
10,311
(15.4%)
14,689
(22.0%)
2014
42,800
(64.1%)
9,343
(14.0%)
’14 Global Performance (Consolidated)
-5.5%
0.0%
1.7%
-9.1%
-5.6%
YoY
70,692
10,310
(14.6%)
14,440
(20.4%)
47,109
(66.6%)
9,897
(14.0%)
Sales
COGS
Operating Profit
Ordinary Profit
EBITDA
[unit : 100 Million KRW, %]

Finance Team Finance Team
Financial Highlights
6
2013 4Q
16,281
2,438
(15.0%)
3,544
(21.8%)
2014 4Q
10,119
(62.2%)
2,041
(12.5%)
4Q ’14 Global Performance (Consolidated)
-5.1%
-11.6%
-4.6%
-8.1%
-18.8%
QoQ
-5.2%
-4.3%
2.2%
-8.5%
-11.1%
YoY
17,179
2,548
(14.8%)
3,467
(20.2%)
11,065
(64.4%)
2,297
(13.4%)
2014 3Q
17,155
2,759
(16.1%)
3,713
(21.6%)
11,019
(64.2%)
2,515
(14.7%)
Sales
COGS
Operating Profit
Ordinary Profit
EBITDA
[unit : 100 Million KRW, %]

Finance Team Finance Team
4Q Review
1. 4Q ‘14
RE : Sales decreased QoQ and slightly increased YoY
despite of deepened market competition
OE : Sales increased QoQ and YoY due to business
expansion to premium OE
2. ’15 Outlook
MKT : 3% YoY market growth expected
HKT : Plan to achieve business target by fully utilizing
favorable business environment in US, second
brand of Laufenn and diversifying global sales
network
MKT : Price competition intensified due to continuous raw material cost drop & over supply
HKT : Despite of revenue decrease, sales volume increased by 2% YoY & OPM was secured
through improvement of product mix
7
Sales Operating Profit OPM
Global [Unit : 100 million KRW, %]
17,179 16,750 16,609 17,155 16,281
2,548 2,759 2,4382,713 2,429
14.8 15.5 15.1
16.1 15.0
2014 4Q 2014 2Q 2014 3Q 2013 4Q 2014 1Q
1) Performance – Global

Finance Team Finance Team
4Q Review
1. 4Q ‘14
RE : Sales increased QoQ and YoY due to the focus on
premium market and product mix improvement in
LTR and TBR segment
OE : Sales increased QoQ, however, decreased YoY due to
intensified price competition
2. ’15 Outlook
MKT : Expect increase of Japanese brand tires due to
continued weak JPY
HKT : Will strengthen dominant market position by
expansion to premium OE sales
MKT : Slow market growth continued and imported tires increased due to F/X effect
HKT : Focused on premium market further differentiating HKT from competitors
265 236 242 249 277
11597 97 90
106
30.3 29.1 28.6
26.5 27.7
2013 4Q 2014 1Q 2014 2Q 2014 3Q 2014 4Q
Tire sales UHPT sales 매출액대비 UHPT sales
1) Performance – Korea
8
Korea
339 339
380
333
383
※ Sales : based on Sell-in amount
UHPT : Ultra high performance tire
[Unit : Billion KRW, %]

Finance Team
4Q Review
1. 4Q ‘14
RE : Sales stagnated in PCR and decreased in TBR due to
growth slowdown in TBR
OE : Sales increased QoQ and YoY thanks to steady
demand and expansion to premium OE
2 ’15 Outlook
MKT : Expect intensified market competition due to tariff
impose by US gov’t towards tires made in China
HKT : Plan to focus on high inch and strategic product sales
along with strengthening of TBR competitiveness
9
214 205 179 171 152
78 7887 87
91
26.7 27.6
32.7 33.7
37.4
2013 4Q 2014 1Q 2014 2Q 2014 3Q 2014 4Q
Tire sales UHPT sales 매출액대비 UHPT sales
[Unit: Billion KRW, %] China
266 258
292 283
243
MKT : Price competition intensified due to falling ASP and over supply in RE market
HKT : Achieved qualitative growth by expanding UHP sales despite of severe market
competition
1) Performance – China
※ Sales : based on Sell-in amount
UHPT : Ultra high performance tire

Finance Team Finance Team
4Q Review
1. 4Q ’14
RE : Sales dropped QoQ due to slow demand and price
competition, however, volume slightly increased YoY
OE : Sales increased in quantity QoQ and YoY thanks to
business expansion around TBR segment
2 ’15 Outlook
MKT : Price competition will be intensified due to M/S
expansion strategy among manufacturers
HKT : Plan to restructure price positioning through
enhanced retail networks
1) Performance – Europe
10
315 292 288364
271
135 207 197
195
137
30.0
41.5 40.6
34.9 33.6
2013 4Q 2014 1Q 2014 2Q 2014 3Q 2014 4Q
Tire sales UHPT sales 매출액대비 UHPT sales
[Unit: Billion KRW, %] Europe
485
559
450 499
408
MKT : Price competition continued due to the slow demand growth
HKT : Enhanced brand awareness by expanding premium OE business in the region
※ Sales : based on Sell-in amount
UHPT : Ultra high performance tire
Finance Team Finance Team
4Q Review
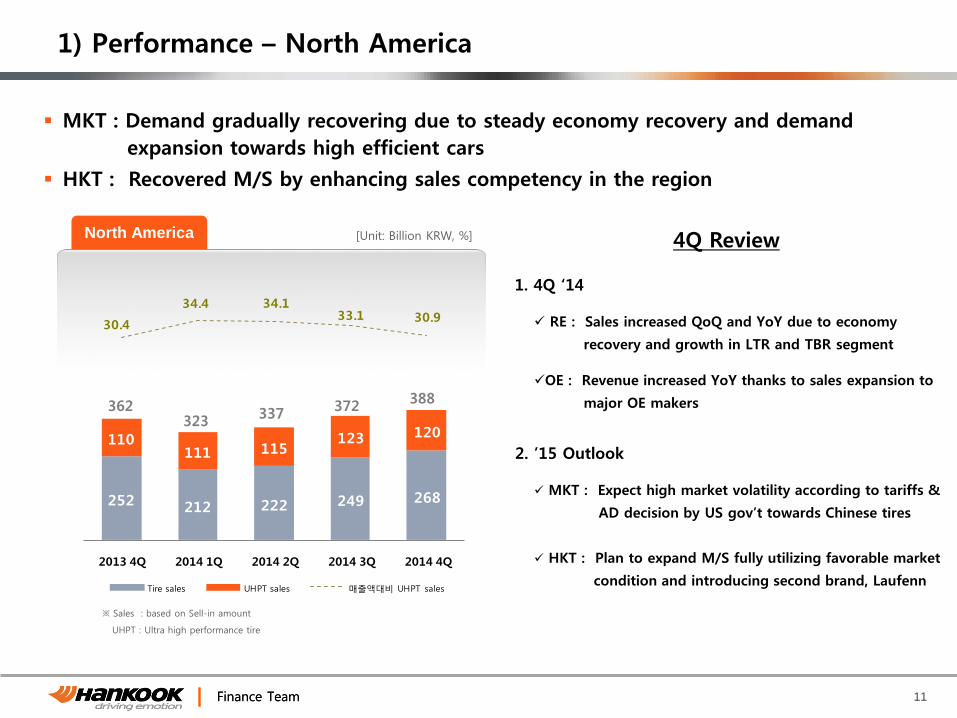
1. 4Q ‘14 RE : Sales increased QoQ and YoY due to economy
recovery and growth in LTR and TBR segment
OE : Revenue increased YoY thanks to sales expansion to
major OE makers
2. ’15 Outlook
MKT : Expect high market volatility according to tariffs &
AD decision by US gov’t towards Chinese tires
HKT : Plan to expand M/S fully utilizing favorable market
condition and introducing second brand, Laufenn
1) Performance – North America
11
252 212 222 249 268
110111 115
123 120
30.4
34.4 34.1 33.1 30.9
2013 4Q 2014 1Q 2014 2Q 2014 3Q 2014 4Q
Tire sales UHPT sales 매출액대비 UHPT sales
[Unit: Billion KRW, %] North America
337 372 362
323
388
MKT : Demand gradually recovering due to steady economy recovery and demand
expansion towards high efficient cars
HKT : Recovered M/S by enhancing sales competency in the region
※ Sales : based on Sell-in amount
UHPT : Ultra high performance tire

Finance Team 12
[Unit : USD/ton] R/M Cost Trend
2,887 2,947
2,464 2,268 2,310
1,967
1,728 1,629 1,506
2,593 2,502
2,223
1,763
2,069 1,923
1,831 1,998
1,753
0
1,000
2,000
3,000
2012 4Q 2013 1Q 2013 2Q 2013 3Q 2013 4Q 2014 1Q 2014 2Q 2014 3Q 2014 4Q
TSR20 BR
N/R
- NR price kept falling due to weak demand in China and over supply from South East Asia
- Expect slight price recovery in ‘15 thanks to economy recovery in US and demand increase in China
S/R
- S/R price in Asia dropped in large scale during 4Q due to lack of demand resulting in over supply
- Price expected to remain same or slight lower level due to delay of global economy recovery
2) Stability : Raw Material Cost
TSR20 : SICOM Price (N/R)
BR (Butadiene Rubber) : average price of ICIS CFR SE Asia

Finance Team Finance Team
50.5% 51.6% 52.7% 53.1% 54.5%
36.0% 37.3%32.5% 30.9%
26.7%
98.2%93.9%
89.7% 88.3%83.4%
2) Stability : Balance Sheet (Consolidated)
13
Asset Liability & Equity
2013 4Q 2014 1Q 2014 2Q 2014 3Q 2014 4Q
Liability Ratio
Net Debt
Ratio
Net Worth to
Asset
Net Debt Amt
[Unit : 100 Mil. KRW] [Unit : 100 Mil. KRW]
[Unit : 100 Mil. KRW]
15,290 13,303 14,136
39,241 43,271 45,491
9,1037,778 7,447
29,42330,416 30,498
77,76781,465 83,436
2013 2014 3Q 2014 4Q
28,062 30,815 29,891
34,98037,260 38,913
14,72513,390 14,632
77,76781,465 83,436
2013 2014 3Q 2014 4Q
12,163 13,360
Inventory Tangible Asset Etc Current Non-Current Equity

Finance Team
2015 Business Plan

Finance Team 15
2015 Business Plan
Secure product leadership
Develop new market & distribution downstream
Introduce second brand & enhance brand competitiveness
▶ Plan to digest ramp up volumes in ‘15 by enhancing sales competency & brand competitiveness

Finance Team Finance Team 16
Global 2014 Result 2015 Plan (%)
Sales 66,795 72,500 8.5%
COGS 42,800 47,450 10.9%
% of COGS 64.1% 65.4%
Gross Profit 23,995 25,050 4.4%
SG&A 13,684 14,700 7.4%
Operating Profit 10,311 10,350 0.4%
OPM 15.4% 14.3%
[100 Million KRW, %]
1) 2015 Guidance
※ Consolidated basis

Finance Team Finance Team
-15,963
14,014 10,800
- - - - -
4,560
25,309
2015(E) 2016(E) 2017(E) 2018(E) 2019(E) 2020(E)
EBITDA CAPEX HVCC Other spending Net Debt
17
2) Mid/Long-Term Growth Strategy
Hold a solid financial structure to grow as a global tire and auto parts company by
2020 through stable EBITDA generation
• Expect continuing net debt amount decrease by secured EBITDA generation
• Expect to hold enough cash for Inorganic growth thanks to CAPEX decrease from ‘16
[100 Million KRW]

Finance Team
2) Mid/Long-Term Growth Strategy
18
Plan to transform organic investment strategy towards qualitative growth
Reach out to global top tier level in area of product, brand and profitability by 2020
Growth strategy to be applied for biz diversification in auto related industry & market
control in tire industry
2001
2002
2003
2004
2005
2006
2007
2008
2009
2010
2011
2012
2013
2014
2015
2016
2017
2018
2019
2020
Capa Ranking
Revenue Ranking
10th
9th
7th
5th
6th
5th
8th
7th
Quantitative Growth through
Inorganic growth
“Qualitative growth to
Top tier level” Capacity Growth
Enhancement of Tire Market Control (Organic)
• Transformation to premium brand
• Productivity enhancement
• Investment expansion in R&D
Revenue Growth & Biz. Diversification (Inorganic)
• Making investment based on ROI & business environment
• Candidate areas for Inorganic growth : Global auto parts biz, Global tire biz, or Region based biz

End of The Document

Finance Team 20
[100 Million KRW]
2013 2014 Diff.
Amt. % Amt. % Amt. %
Assets 77,767 100.0% 83,436 100.0% 5,669 7.3%
Current Assets 39,522 50.8% 38,913 46.6% -609 -1.5%
cashable assets 11,649 15.0% 11,735 14.1% 86 0.7%
Accounts receivable 11,910 15.3% 11,803 14.1% -107 -0.9%
Inventories 14,725 18.9% 14,632 17.5% -93 -0.6%
Non-current Assets 38,245 49.2% 44,523 53.4% 6,278 16.4%
Tangible assets 34,980 45.0% 40,216 48.2% 5,236 15.0%
Liabilities 38,526 49.5% 37,945 45.5% -581 -1.5%
Current Liabilities 29,423 37.8% 30,498 36.6% 1,075 3.7%
Non-Current Liabilities 9,103 11.7% 7,447 8.9% -1,656 -18.2%
Shareholders’ Equity
39,241 50.5% 45,492 54.5% 6,251 15.9%
Debt 25,785 23,898
Net debt 14,136 12,163
Liability Ratio 98.2% 83.4%
Net Worth to Assets 50.5% 54.5%
Net Debt Ratio 36.0% 26.7%
Appendix. F/S – Consolidated B/S
Finance Team 21
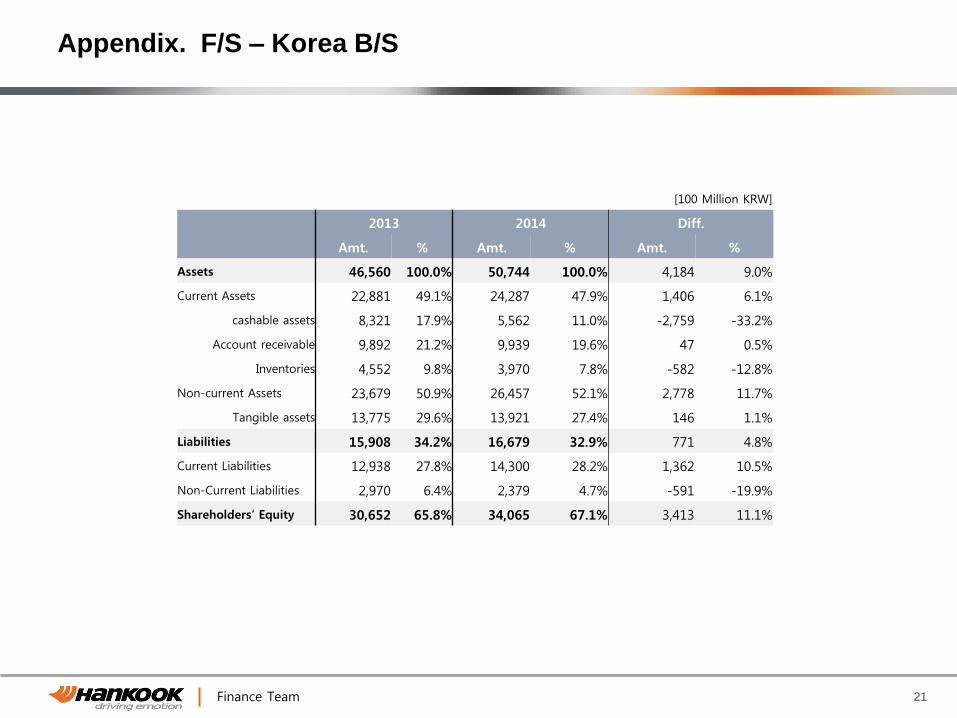
[100 Million KRW]
2013 2014 Diff.
Amt. % Amt. % Amt. %
Assets 46,560 100.0% 50,744 100.0% 4,184 9.0%
Current Assets 22,881 49.1% 24,287 47.9% 1,406 6.1%
cashable assets 8,321 17.9% 5,562 11.0% -2,759 -33.2%
Account receivable 9,892 21.2% 9,939 19.6% 47 0.5%
Inventories 4,552 9.8% 3,970 7.8% -582 -12.8%
Non-current Assets 23,679 50.9% 26,457 52.1% 2,778 11.7%
Tangible assets 13,775 29.6% 13,921 27.4% 146 1.1%
Liabilities 15,908 34.2% 16,679 32.9% 771 4.8%
Current Liabilities 12,938 27.8% 14,300 28.2% 1,362 10.5%
Non-Current Liabilities 2,970 6.4% 2,379 4.7% -591 -19.9%
Shareholders’ Equity 30,652 65.8% 34,065 67.1% 3,413 11.1%
Appendix. F/S – Korea B/S

Finance Team 22
[Mil RMB]
2013 2014 Diff.
Amt. % Amt. % Amt. %
Assets 17,737 100.0% 18,484 100.0% 747 4.2%
Current Assets 7,849 44.3% 7,926 42.9% 76 1.0%
Account receivable 5,229 29.5% 4,299 23.3% -931 -17.8%
Inventories 1,539 8.7% 1,520 8.2% -19 -1.2%
Non-current Assets 9,888 55.7% 10,558 57.1% 671 6.8%
Tangible assets 7,654 43.2% 8,081 43.7% 426 5.6%
Liabilities 10,321 58.2% 9,614 52.0% -708 -6.9%
Current Liabilities 9,288 52.4% 8,304 44.9% -984 -10.6%
Non-Current Liabilities 1,034 5.8% 1,310 7.1% 276 26.7%
Shareholders’ Equity 7,416 41.8% 8,870 48.0% 1,455 19.6%
Appendix. F/S – China B/S

Finance Team 23
[Mil HUF]
2013 2014 Diff.
Amt. % Amt. % Amt. %
Assets 262,384 100.0% 360,153 100.0% 97,769 37.3%
Current Assets 164,526 62.7% 204,874 56.9% 40,347 24.5%
Account receivable 58,792 22.4% 68,825 19.1% 10,033 17.1%
Inventories 25,580 9.7% 30,578 8.5% 4,997 19.5%
Non-current Assets 97,858 37.3% 155,279 43.1% 57,421 58.7%
Tangible assets 97,814 37.3% 155,238 43.1% 57,424 58.7%
Liabilities 163,935 62.5% 227,002 63.0% 63,067 38.5%
Current Liabilities 131,579 50.1% 204,959 56.9% 73,380 55.8%
Non-Current Liabilities 32,356 12.3% 22,042 6.1% -10,313 -31.9%
Shareholders’ Equity 98,449 37.5% 133,151 37.0% 34,702 35.2%
Appendix. F/S – Hungary B/S

Finance Team 24
[K USD]
2013 2014 Diff.
Amt. % Amt. % Amt. %
Assets 398,419 100.0% 623,482 100.0% 225,063 56.5%
Current Assets 83,300 20.9% 199,794 32.0% 116,494 139.8%
Cashable assets 2,540 0.6% 70,418 11.3% 67,878 2672.3%
Account receivable 13,840 3.5% 22,437 3.6% 8,597 62.1%
Inventories 39,813 10.0% 35,013 5.6% -4,800 -12.1%
Non-current Assets 315,119 79.1% 423,688 68.0% 108,569 34.5%
Tangible assets 281,610 70.7% 391,778 62.8% 110,168 39.1%
Liabilities 283,452 71.1% 341,415 54.8% 57,963 20.4%
Current Liabilities 61,310 15.4% 88,641 14.2% 27,331 44.6%
Non-Current Liabilities 222,142 55.8% 252,774 40.5% 30,632 13.8%
Shareholders’ Equity
114,967 28.9% 282,068 45.2% 167,100 145.3%
Appendix. F/S – Indonesia B/S

Finance Team 25
[100 Million KRW]
] 2013 4Q 2014 3Q 2014 4Q YoY QoQ
Amt. % Amt. % Amt. % (%) (%)
Sales 17,179 100.0% 17,155 100.0% 16,281 100.0% -5.2% -5.1%
COGS 11,065 64.4% 11,019 64.2% 10,119 62.2% -8.5% -8.2%
Gross Profit 6,114 35.6% 6,136 35.8% 6,162 37.8% 0.8% 0.4%
SG&A 3,566 20.8% 3,377 19.7% 3,724 22.9% 4.4% 10.3%
Operating Profit 2,548 14.8% 2,759 16.1% 2,438 15.0% -4.3% -11.6%
Other Revenue 365 2.1% 495 2.9% 465 2.9% 27.2% -6.1%
Other Expense 511 3.0% 693 4.0% 799 4.9% 56.3% 15.3%
Financial Revenue 110 0.6% 192 1.1% 233 1.4% 112.1% 21.4%
Financial Expense 215 1.3% 238 1.4% 296 1.8% 37.6% 24.4%
Income Before Income Tax 2,297 13.4% 2,515 14.7% 2,041 12.5% -11.2% -18.8%
E B I T D A 3,467 20.2% 3,713 21.6% 3,544 21.8% 2.2% -4.6%
Depreciation 919 5.3% 954 5.6% 1,106 6.8% 20.3% 15.9%
Appendix. F/S – Consolidated I/S

Finance Team 26
[100 Million KRW]
2013 4Q 2014 3Q 2014 4Q YoY QoQ
Amt. % Amt. % Amt. % (%) (%)
Sales 10,093 100.0% 8,900 100.0% 9,072 100.0% -10.1% 1.9%
COGS 6,850 67.9% 5,971 67.1% 6,042 66.6% -11.8% 1.2%
Gross Profit 3,243 32.1% 2,928 32.9% 3,030 33.4% -6.6% 3.5%
SG&A 2,078 20.6% 1,882 21.1% 2,051 22.6% -1.3% 9.0%
Operating Profit 1,165 11.5% 1,046 11.8% 979 10.8% -16.0% -6.4%
Other Revenue 776 7.7% 755 8.5% 650 7.2% -16.3% -13.9%
Other Expense 276 2.7% 530 6.0% 568 6.3% 105.6% 7.2%
Financial Revenue 33 0.3% 115 1.3% 215 2.4% 555.1% 87.0%
Financial Expense 101 1.0% 85 1.0% 118 1.3% 16.5% 38.8%
Income Before Income Tax 1,596 15.8% 1,301 14.6% 1,158 12.8% -27.5% -11.0%
E B I T D A 1,689 16.7% 1,564 17.6% 1,531 16.9% -9.4% -2.1%
Depreciation 524 5.2% 516 5.8% 554 6.1% 5.7% 7.4%
Appendix. F/S – Korea I/S (IFRS)

Finance Team 27
[100 Million RMB]
2013 4Q 2014 3Q 2014 4Q YoY QoQ
Amt. % Amt. % Amt. % (%) (%)
Sales 27.59 100.0% 25.17 100.0% 23.49 100.0% -14.9% -6.7%
COGS 19.39 70.3% 18.37 73.0% 17.01 72.4% -12.3% -7.4%
Gross Profit 8.20 29.7% 6.80 27.0% 6.48 27.6% -21.0% -4.7%
SG&A 4.88 17.7% 4.72 18.8% 4.38 18.6% -10.2% -7.2%
Operating Profit 3.32 12.0% 2.08 8.3% 2.09 8.9% -37.1% 0.7%
Other Revenue 0.69 2.5% 0.88 3.5% 2.19 9.3% 217.4% 148.1%
Other Expense 0.57 2.1% 1.22 4.8% 0.96 4.1% 68.4% -21.3%
Financial Revenue 0.89 3.2% 0.13 0.5% 0.19 0.8% -78.7% 48.2%
Financial Expense 1.06 3.8% 0.52 2.1% 0.38 1.6% -64.2% -26.7%
Income Before Income Tax 3.27 11.9% 1.35 5.4% 3.13 13.3% -4.4% 131.9%
E B I T D A 5.18 18.8% 3.82 15.2% 3.85 16.4% -25.6% 0.9%
Depreciation 1.85 6.7% 1.74 6.9% 1.76 7.5% -5.0% 1.1%
Appendix. F/S – China B/S

Finance Team 28
[100 Million HUF]
2013 4Q 2014 3Q 2014 4Q YoY QoQ
Amt. % Amt. % Amt. % (%) (%)
Sales 392.05 100.0% 435.53 100.0% 409.12 100.0% 4.4% -6.1%
COGS 281.04 71.7% 291.25 66.9% 264.40 64.6% -5.9% -9.2%
Gross Profit 111.01 28.3% 144.29 33.1% 144.72 35.4% 30.4% 0.3%
SG&A 42.57 10.9% 50.74 11.7% 47.79 11.7% 12.3% -5.8%
Operating Profit 68.44 17.5% 93.54 21.5% 96.93 23.7% 41.6% 3.6%
Other Revenue 4.30 1.1% 4.89 1.1% 15.19 3.7% 253.1% 210.7%
Other Expense 5.70 1.5% 6.15 1.4% 8.12 2.0% 42.4% 32.1%
Financial Revenue 4.33 1.1% 3.53 0.8% 6.51 1.6% 50.3% 84.6%
Financial Expense 5.70 1.5% 7.42 1.7% 28.22 6.9% 395.2% 280.1%
Income Before Income Tax 65.67 16.8% 88.38 20.3% 82.29 20.1% 25.3% -6.9%
E B I T D A 115.19 29.4% 134.99 31.0% 133.69 32.7% 16.1% -1.0%
Depreciation 46.74 11.9% 41.45 9.5% 36.76 9.0% -21.4% -11.3%
Appendix. F/S – Hungary I/S (IFRS)

Finance Team 29
[ Mil USD]
2013 4Q 2014 3Q 2014 4Q YoY QoQ
Amt. % Amt. % Amt. % (%) (%)
Sales 62.10 100.0% 57.21 100.0% 65.19 100.0% 5.0% 13.9%
COGS 41.76 67.2% 40.67 71.1% 45.42 69.7% 8.8% 11.7%
Gross Profit 20.34 32.8% 16.55 28.9% 19.77 30.3% -2.8% 19.5%
SG&A 11.01 17.7% 10.02 17.5% 11.31 17.3% 2.7% 12.9%
Operating Profit 9.33 15.0% 6.53 11.4% 8.46 13.0% -9.3% 29.5%
Other Revenue 0.45 0.7% 3.80 6.6% 0.34 0.5% -23.8% -91.0%
Other Expense 1.30 2.1% 3.88 6.8% 0.50 0.8% -61.5% -87.1%
Financial Revenue 0.11 0.2% 0.42 0.7% 0.27 0.4% 154.7% -35.2%
Financial Expense 1.77 2.9% 1.75 3.1% 1.30 2.0% -26.6% -25.8%
Income Before Income Tax 6.81 11.0% 5.11 8.9% 7.26 11.1% 6.6% 42.0%
E B I T D A 14.49 23.3% 12.09 21.1% 14.48 22.2% -0.1% 19.8%
Depreciation 5.17 8.3% 5.55 9.7% 6.02 9.2% 16.6% 8.5%
Appendix. F/S – Indonesia I/S (IFRS)