Embed Size (px)
Citation preview

Composites: Part B 60 (2014) 716–724
Contents lists available at ScienceDirect
Composites: Part B
journal homepage: www.elsevier .com/locate /composi tesb
Modeling and analysis of the shear capacity of adhesive anchorspost-installed into uncracked concrete
1359-8368/$ - see front matter � 2014 Elsevier Ltd. All rights reserved.http://dx.doi.org/10.1016/j.compositesb.2014.01.015
⇑ Corresponding author. Tel.: +90 342 3172404; fax: +90 342 3601107.E-mail address: [email protected] (M. Gesoglu).
Mehmet Gesoglu a,⇑, Esra Mete Güneyisi a, Erhan Güneyisi a, Muhammet Enes Yılmaz a,Kasım Mermerdas� b
a Gaziantep University, Civil Engineering Department, 27310 Gaziantep, Turkeyb Hasan Kalyoncu University, Civil Engineering Department, 27410 Gaziantep, Turkey
a r t i c l e i n f o
Article history:Received 16 January 2013Received in revised form 18 November 2013Accepted 9 January 2014Available online 17 January 2014
Keywords:A. Metal–matrix composites (MMCs)B. AdhesionB. StrengthC. Analytical modeling
a b s t r a c t
This paper reports the results of an analytical study to predict the edge breakout shear capacity of singleadhesive anchors post-installed into uncracked hardened concrete. For this purpose, an experimentaldatabase for the adhesive anchors compiled by the ACI Committee 355 was obtained and utilized to con-struct training and test sets so as to derive the closed-form solution by means of gene expression pro-gramming (GEP). The independent variables used for development of the prediction model wereanchor diameter, type of anchor, edge distance, embedment depth, clear clearance of the anchor, typeof chemical adhesive, method of injection of the chemical, and compressive strength of the concrete.The generated prediction model yielded correlation coefficients of 0.98 and 0.92 for training and testingdata sets, respectively. Moreover, the performance of the proposed model was compared with the exist-ing models proposed by American Concrete Institute (ACI) and Prestressed/Precast Concrete Institute(PCI). The analyses showed that the proposed GEP model provided much more accurate estimation ofthe observed values as compared to the other models.
� 2014 Elsevier Ltd. All rights reserved.
1. Introduction increased with increasing the concrete strength. They also revealed
Anchorages to concrete include cast-in-place and post-installedanchors. Post-installed anchors are either mechanical or adhesive(bonded) anchors [1]. As a result of advancement in high strengthbonding agent technology, using adhesive anchors have soaredconsiderably [2]. An adhesive anchor can be defined as a reinforc-ing bar or a threaded rod inserted into a drilled hole in hardenedconcrete with a structural adhesive acting as a bonding agent be-tween the concrete and the anchor steel [3]. The hole is filled withthe adhesive that bonds the steel to the concrete. Currentlyavailable structural adhesives can be classified as several types ofthermosetting plastics including epoxies, polyesters, vinylestersas well as a few hybrids of organic and inorganic binders [4]. Adhe-sive anchors have three possible failure mechanisms: yield andfracture of failure anchor steel, formation of an adhesive cone,accompanied by pullout of an adhesive core; and pullout ofadhesive core [5].
In the literature, there have been elaborate studies regardingthe mechanical behavior of post installed anchors [1–9]. Gesogluet al. [6] examined the behavior of such anchors in normal andhigh-strength concretes with and without steel fiber reinforce-ment. They stated that the maximum capacity of the anchors
that the use of steel fibers in concrete did not importantly affectthe pullout capacity of the anchors but the failure type alteredfrom cone to pullout. Fujikake et al. [9] carried out an experimentalstudy to investigate the behavior of the adhesive anchors subject torapid pullout loading. They reported that the dynamic ultimatepullout resistance increased with the loading rate. In the study ofCook and Konz [4], the factors affecting the bond strength of thepolymer based adhesive anchors were investigated. The findingsof this study demonstrated that the reliable prediction of adhesiveanchor performance was only practical by extensive product andcondition specific testing.
The studies regarding the modeling shear capacity of the anchorbolts has not yet found adequate attention in the literature. Leeet al. [10] carried out an experimental study on shear behavior ofheaded anchors with large diameters and deep embedments. Theycompared the experimental shear capacities with those computedfrom existing formulas proposed by ACI 349 and ACI 318 designcodes. They concluded that the existing methods yielded less shearcapacities for the specimens dealt with the study. Bickel and Shaik[11] compared the prediction of performance of the model speci-fied in PCI Design Handbook and CCD model from ACI 318-02,for shear capacity of the headed and adhesive anchors. They re-ported that PCI Design Handbook method and CCD method, withproper adjustments, can be used for predicting the shear capacitiesof adhesive anchors with similar accuracy.
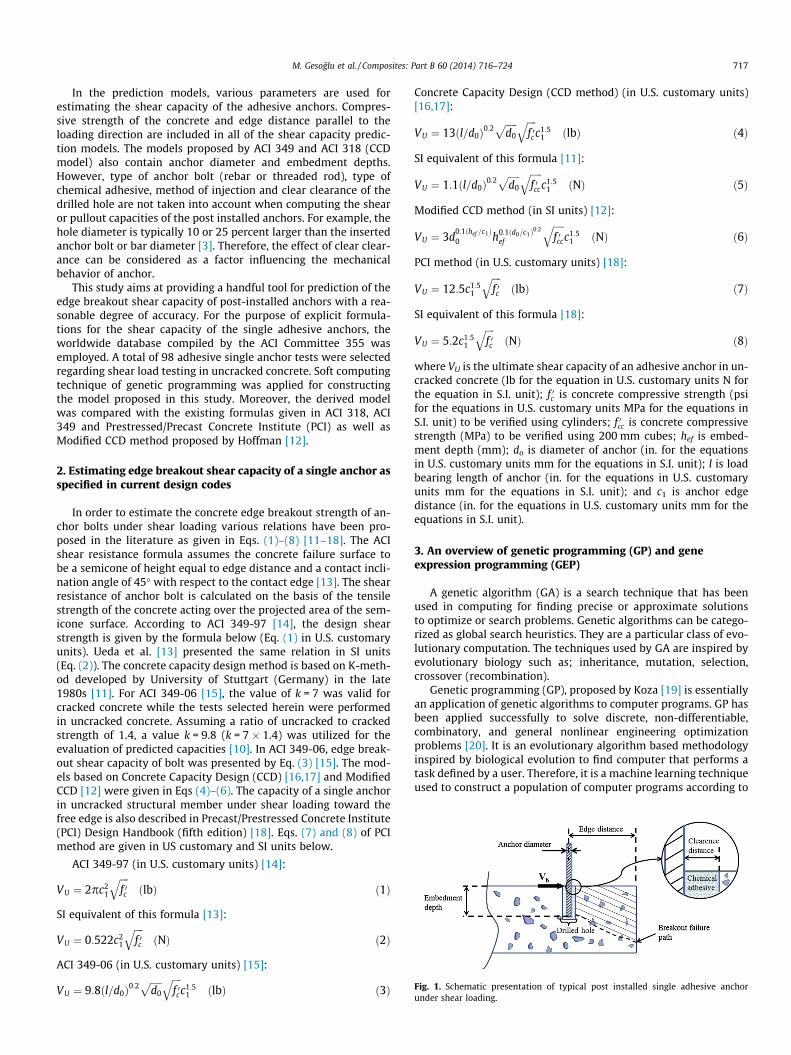
Fig. 1. Schematic presentation of typical post installed single adhesive anchorunder shear loading.
M. Gesoglu et al. / Composites: Part B 60 (2014) 716–724 717
In the prediction models, various parameters are used forestimating the shear capacity of the adhesive anchors. Compres-sive strength of the concrete and edge distance parallel to theloading direction are included in all of the shear capacity predic-tion models. The models proposed by ACI 349 and ACI 318 (CCDmodel) also contain anchor diameter and embedment depths.However, type of anchor bolt (rebar or threaded rod), type ofchemical adhesive, method of injection and clear clearance of thedrilled hole are not taken into account when computing the shearor pullout capacities of the post installed anchors. For example, thehole diameter is typically 10 or 25 percent larger than the insertedanchor bolt or bar diameter [3]. Therefore, the effect of clear clear-ance can be considered as a factor influencing the mechanicalbehavior of anchor.
This study aims at providing a handful tool for prediction of theedge breakout shear capacity of post-installed anchors with a rea-sonable degree of accuracy. For the purpose of explicit formula-tions for the shear capacity of the single adhesive anchors, theworldwide database compiled by the ACI Committee 355 wasemployed. A total of 98 adhesive single anchor tests were selectedregarding shear load testing in uncracked concrete. Soft computingtechnique of genetic programming was applied for constructingthe model proposed in this study. Moreover, the derived modelwas compared with the existing formulas given in ACI 318, ACI349 and Prestressed/Precast Concrete Institute (PCI) as well asModified CCD method proposed by Hoffman [12].
2. Estimating edge breakout shear capacity of a single anchor asspecified in current design codes
In order to estimate the concrete edge breakout strength of an-chor bolts under shear loading various relations have been pro-posed in the literature as given in Eqs. (1)–(8) [11–18]. The ACIshear resistance formula assumes the concrete failure surface tobe a semicone of height equal to edge distance and a contact incli-nation angle of 45� with respect to the contact edge [13]. The shearresistance of anchor bolt is calculated on the basis of the tensilestrength of the concrete acting over the projected area of the sem-icone surface. According to ACI 349-97 [14], the design shearstrength is given by the formula below (Eq. (1) in U.S. customaryunits). Ueda et al. [13] presented the same relation in SI units(Eq. (2)). The concrete capacity design method is based on K-meth-od developed by University of Stuttgart (Germany) in the late1980s [11]. For ACI 349-06 [15], the value of k = 7 was valid forcracked concrete while the tests selected herein were performedin uncracked concrete. Assuming a ratio of uncracked to crackedstrength of 1.4, a value k = 9.8 (k = 7 � 1.4) was utilized for theevaluation of predicted capacities [10]. In ACI 349-06, edge break-out shear capacity of bolt was presented by Eq. (3) [15]. The mod-els based on Concrete Capacity Design (CCD) [16,17] and ModifiedCCD [12] were given in Eqs (4)–(6). The capacity of a single anchorin uncracked structural member under shear loading toward thefree edge is also described in Precast/Prestressed Concrete Institute(PCI) Design Handbook (fifth edition) [18]. Eqs. (7) and (8) of PCImethod are given in US customary and SI units below.
ACI 349-97 (in U.S. customary units) [14]:
VU ¼ 2pc21
ffiffiffiffif 0c
qðlbÞ ð1Þ
SI equivalent of this formula [13]:
VU ¼ 0:522c21
ffiffiffiffif 0c
qðNÞ ð2Þ
ACI 349-06 (in U.S. customary units) [15]:
VU ¼ 9:8ðl=d0Þ0:2ffiffiffiffiffid0
p ffiffiffiffif 0c
qc1:5
1 ðlbÞ ð3Þ
Concrete Capacity Design (CCD method) (in U.S. customary units)[16,17]:
VU ¼ 13ðl=d0Þ0:2ffiffiffiffiffid0
p ffiffiffiffif 0c
qc1:5
1 ðlbÞ ð4Þ
SI equivalent of this formula [11]:
VU ¼ 1:1ðl=d0Þ0:2ffiffiffiffiffid0
p ffiffiffiffiffif 0cc
qc1:5
1 ðNÞ ð5Þ
Modified CCD method (in SI units) [12]:
VU ¼ 3d0:1ðhef =c1Þ0 h0:1ðd0=c1Þ0:2
ef
ffiffiffiffiffif 0cc
qc1:5
1 ðNÞ ð6Þ
PCI method (in U.S. customary units) [18]:
VU ¼ 12:5c1:51
ffiffiffiffif 0c
qðlbÞ ð7Þ
SI equivalent of this formula [18]:
VU ¼ 5:2c1:51
ffiffiffiffif 0c
qðNÞ ð8Þ
where VU is the ultimate shear capacity of an adhesive anchor in un-cracked concrete (lb for the equation in U.S. customary units N forthe equation in S.I. unit); f 0c is concrete compressive strength (psifor the equations in U.S. customary units MPa for the equations inS.I. unit) to be verified using cylinders; f 0cc is concrete compressivestrength (MPa) to be verified using 200 mm cubes; hef is embed-ment depth (mm); do is diameter of anchor (in. for the equationsin U.S. customary units mm for the equations in S.I. unit); l is loadbearing length of anchor (in. for the equations in U.S. customaryunits mm for the equations in S.I. unit); and c1 is anchor edgedistance (in. for the equations in U.S. customary units mm for theequations in S.I. unit).
3. An overview of genetic programming (GP) and geneexpression programming (GEP)
A genetic algorithm (GA) is a search technique that has beenused in computing for finding precise or approximate solutionsto optimize or search problems. Genetic algorithms can be catego-rized as global search heuristics. They are a particular class of evo-lutionary computation. The techniques used by GA are inspired byevolutionary biology such as; inheritance, mutation, selection,crossover (recombination).
Genetic programming (GP), proposed by Koza [19] is essentiallyan application of genetic algorithms to computer programs. GP hasbeen applied successfully to solve discrete, non-differentiable,combinatory, and general nonlinear engineering optimizationproblems [20]. It is an evolutionary algorithm based methodologyinspired by biological evolution to find computer that performs atask defined by a user. Therefore, it is a machine learning techniqueused to construct a population of computer programs according to

718 M. Gesoglu et al. / Composites: Part B 60 (2014) 716–724
a fitness landscape determined by a program’s ability to perform agiven computational task. Similar to GA, the GP needs only the
Table 1Training data base used for development of the prediction model.
Sampleno
Independent variables (Xi) Dependentvariable (Y)
X1: Diameter(mm)
X2: Type ofinjection*
X3: Chemicaltype**
X4: Anchortype***
X5: Embedmentdepth (mm)
X6: Clearclearance (mm)
X7: fc(MPa)
X8: Edgedistance (mm)
Shear capacity(kN)
1 12.70 1 1 1 114 1.04 23.52 114.30 422 12.70 1 1 1 114 1.04 23.52 114.30 353 15.88 1 1 1 144 1.98 23.52 133.35 674 15.88 1 1 1 144 1.98 23.52 133.35 765 19.05 1 1 1 171 2.10 23.52 171.45 866 19.05 1 1 1 171 2.10 23.52 171.45 947 22.23 1 1 1 199 2.06 23.52 200.03 1398 22.23 1 1 1 199 2.06 23.52 200.03 1229 25.40 1 1 1 226 2.15 23.65 228.60 189
10 12.70 1 1 1 115 1.04 40.89 114.30 4911 15.88 1 1 1 144 1.98 40.89 142.88 7912 15.88 1 1 1 144 1.98 40.89 142.88 7113 19.05 1 1 1 173 2.07 40.89 171.45 11214 22.23 1 1 1 199 2.06 40.89 200.03 14915 22.23 1 1 1 199 2.06 40.89 200.03 13816 9.53 1 1 1 86 1.08 23.52 38.10 617 9.53 1 1 1 86 1.08 23.52 38.10 618 15.88 1 1 1 86 1.98 23.65 63.50 1619 15.88 1 1 1 86 1.98 23.65 63.50 1520 9.53 1 1 1 86 0.79 13.48 85.73 1921 12.70 1 1 1 114 0.79 13.48 85.73 3622 12.70 1 1 1 117 0.79 13.48 85.73 4223 15.88 1 1 1 117 1.59 13.48 142.88 6024 15.88 1 1 1 117 1.59 13.48 142.88 5725 19.05 1 1 1 169 1.59 13.48 171.45 6426 19.05 1 1 1 168 1.59 13.48 171.45 6527 19.05 1 1 1 175 1.59 13.48 171.45 7228 19.05 1 1 1 173 1.59 13.48 171.45 7229 22.23 1 1 1 201 4.76 13.48 200.03 10330 25.40 1 1 1 225 1.59 13.28 228.60 10731 25.40 1 1 1 230 1.59 13.28 228.60 11432 12.70 0 1 0 113 1.59 31.57 107.95 5433 15.88 0 1 0 133 1.59 31.57 127.00 6934 15.88 0 1 0 135 1.59 31.57 127.00 5735 19.05 0 1 0 178 1.59 31.57 155.58 8736 19.05 0 1 0 168 1.59 31.57 155.58 9037 22.23 0 1 0 164 3.18 31.57 168.28 12038 22.23 0 1 0 165 3.18 31.57 168.28 10039 25.40 0 1 0 210 3.18 31.57 203.20 14540 25.40 0 1 0 208 3.18 31.57 203.20 15141 12.70 0 1 0 103 1.59 13.13 107.95 3842 12.70 0 1 0 114 1.59 13.13 107.95 3843 15.88 0 1 0 133 1.59 13.13 127.00 4444 15.88 0 1 0 127 1.59 13.13 127.00 4945 19.05 0 1 0 162 1.59 13.13 171.45 7846 19.05 0 1 0 175 1.59 13.13 171.45 6547 22.23 0 1 0 165 3.18 13.34 177.80 7548 22.23 0 1 0 175 3.18 13.34 177.80 8749 25.40 0 1 0 203 3.18 13.34 203.20 12650 25.40 0 1 0 187 3.18 13.34 203.20 10351 8.00 0 0 1 80 1.00 15.00 40.00 952 8.00 0 0 1 80 1.00 43.00 40.00 1253 10.00 0 0 1 90 1.00 43.00 45.00 1754 12.00 0 0 1 110 1.00 15.00 55.00 1955 16.00 0 0 1 125 1.00 16.00 62.50 2456 16.00 0 0 1 125 1.00 16.00 125.00 5357 20.00 0 0 1 170 2.50 16.00 85.00 4458 20.00 0 0 1 170 2.50 16.00 170.00 7059 24.00 0 0 1 210 2.00 16.00 262.50 11560 24.00 0 0 1 210 2.00 28.00 105.00 6261 12.00 0 0 1 110 1.00 14.00 55.00 4562 12.00 0 0 1 110 1.00 14.00 165.00 6863 12.00 0 0 1 110 1.00 36.00 110.00 10664 12.00 0 0 1 110 1.00 36.00 137.50 106
* 1 for cartridge injection, 0 for glass capsule.** 1 for epoxy and 0 for unsaturated polyester.*** 1 for steel rebar, 0 for threaded bars.
problem to be defined. Then, the program searches for a solution ina problem-independent manner [19,21].

TabTes
* 1**
***
M. Gesoglu et al. / Composites: Part B 60 (2014) 716–724 719
Gene expression programming (GEP) is a natural developmentof genetic algorithms and genetic programming. GEP, introducedby Ferreira [22], is a natural development of GP. GEP evolves com-puter programs of different sizes and shapes encoded in linearchromosomes of fixed-length. Its algorithm begins with therandom generation of the fixed-length chromosomes of each indi-vidual for the initial population. Then, the chromosomes areexpressed and the fitness of each individual is evaluated basedon the quality of the solution it represents [23].
4. Construction of the prediction model
When loaded in shear, anchor’s adhesive layer bears on theconcrete. With enough force this will cause the edge of the con-crete to break out [11]. Fig. 1 shows a typical edge breakout failureof a single adhesive anchor. The test setup generally consists of aloading frame, loading plate, jack assembly, and load cell. The loadis applied to the anchor under force control in increasing percent-ages of the estimated capacity (such as 5%, 10%, 20%, and so forth tofailure) with loading frames oriented parallel to the concretesurface of each specimen. Load is continuously and very slowlyincreased to avoid abrupt failure. The clear distance between thesupports is arranged to allow for unrestricted formation of a con-crete breakout. Moreover, in some of these experimental studiesthe displacement of the anchor in the direction of load at the level
le 2ting data base used for evaluating the performance of the prediction model.
Sampleno
Independent variables (Xi)
X1: Diameter(mm)
X2: Type ofinjection*
X3: Chemicaltype**
X4: Anchortype***
X5: Embedmdepth (mm)
1 9.53 1 1 1 85.732 12.70 1 1 1 114.303 15.88 1 1 1 143.944 19.05 1 1 1 171.455 25.40 1 1 1 226.496 25.40 1 1 1 226.497 15.88 1 1 1 143.948 19.05 1 1 1 172.529 9.53 1 1 1 85.73
10 15.88 1 1 1 85.7311 12.70 1 1 1 117.3712 15.88 1 1 1 114.3313 19.05 1 1 1 170.9214 22.23 1 1 1 206.4515 22.23 1 1 1 200.0516 25.40 1 1 1 226.7017 15.88 0 1 0 133.3518 19.05 0 1 0 168.2819 22.23 0 1 0 168.2820 25.40 0 1 0 206.3821 12.70 0 1 0 106.3822 15.88 0 1 0 142.8823 19.05 0 1 0 155.5824 22.23 0 1 0 177.8025 25.40 0 1 0 177.8026 10.00 0 0 1 90.0027 10.00 0 0 1 90.0028 12.00 0 0 1 110.0029 16.00 0 0 1 125.0030 20.00 0 0 1 170.0031 24.00 0 0 1 210.0032 12.00 0 0 1 110.0033 12.00 0 0 1 110.0034 12.00 0 0 1 110.00
for cartridge injection, 0 for glass capsule.1 for epoxy and 0 for unsaturated polyester.1 for steel rebar, 0 for threaded bars.
of concrete top surface and axial strains in the anchor bolt areobserved as well as the failure load [10].
The models given in the design codes basically depend on thecompressive strength of the concrete and edge distance. Somemodels also consider embedment depth and diameter of theanchor bolt. However, clearance distance (see Fig. 1), type of theanchor, type of adhesive and method of injection have not yet beenconsidered in the formulation of shear capacity of the anchor. Forthis, anchor diameter, type of anchor (threaded bar or rebar), edgedistance, embedment depth, clear clearance of the anchor, type ofchemical adhesive (epoxy or unsaturated polyester), method ofinjection of the chemical (glass capsule or cartridge injection),and compressive strength of the concrete with the experimentalresults of shear capacity of the anchors were arranged to obtaina data set.
The adhesive anchors dealt with this study are steel anchorseither threaded rod or deformed bar inserted into a drilled holein normal strength concrete. A structural adhesive was utilized toachieve proper bonding between the concrete and anchor. Foradhesive anchors, the diameter of the drilled hole is typically notlarger than 1.5 times the diameter of the steel element [1]. Adhe-sive anchors are available in glass capsules or in injection systemsusing organic or inorganic compounds. The adhesives utilized inthis study are epoxy and unsaturated polyester. For example,test-1 in Table 1 has the following experimental parameters: steelrebar of 12.70 mm diameter was post installed into a concrete
Dependentvariable (Y)
ent X6: Clearclearance (mm)
X7:fc(MPa)
X8: Edgedistance (mm)
Shear capacity(kN)
1.08 23.52 85.73 261.04 23.52 114.30 411.98 23.52 133.35 772.10 23.52 171.45 912.15 23.65 228.60 1702.15 23.65 228.60 1491.98 40.89 142.88 782.07 40.89 171.45 1051.08 23.52 38.10 81.98 23.65 63.50 160.79 13.48 85.73 411.59 13.48 142.88 591.59 13.48 171.45 834.76 13.48 200.03 934.76 13.48 200.03 921.59 13.28 228.60 1161.59 31.57 127.00 711.59 31.57 155.58 963.18 31.57 168.28 1283.18 31.57 203.20 1261.59 13.13 107.95 411.59 13.13 127.00 481.59 13.13 171.45 783.18 13.34 177.80 833.18 13.34 203.20 981.00 15.00 45.00 141.00 15.00 67.50 191.00 43.00 55.00 271.00 36.00 62.50 372.50 36.00 85.00 632.00 16.00 105.00 511.00 14.00 110.00 571.00 38.00 55.00 601.00 38.00 110.00 91

720 M. Gesoglu et al. / Composites: Part B 60 (2014) 716–724
having a compressive strength of 23.52 MPa using cartridgeinjection system in which epoxy being the bonding agent.
The derivation of a genetic-programming-based explicit formu-lation is accomplished by means of the training data containinginput and output variables. Besides, in order to examine and testthe performance of the developed model, a supplementary dataset containing the same number and sequence of input and outputvariables is used. Therefore, in the current study, the ensemble ofavailable experimental data was arbitrarily divided into two partsto obtain the training and testing databases. Approximately 2/3 ofthe total data samples were used as the training set while the rest
Fig. 2. Expression tree for the GEP model [d0: Anchor diameter (mm), d1: Injection type (unsaturated polyester), d3: Type of anchor (1 for steel rebar, 0 for threaded bars), d4: Em(MPa), d7: Edge distance (mm) c0 and c1: constants (c0 = �7.08139 for Sub-ET3, c0
c1 = �6.227142 for Sub-ET1, c1 = 3.883179 for Sub-ET3, c1 = 8.091003 for Sub-ET5)].
was employed as the testing set, as shown in Tables 1 and 2,respectively. Thus, a total of 64 and 34 samples from trainingand testing sets, respectively were utilized in constructing themodel.
A software, named GeneXproTools.4.0 was employed forderivation the mathematical model presented in Eq. (9). The mod-els developed by GEP in its native language can be automaticallyparsed into visually appealing expression trees, permitting a quick-er and more complete comprehension of their mathematical/logi-cal intricacies. Fig. 2 demonstrates the expression tree for theterms used in the formulation of the GEP model which has the
1 for cartridge injection, 0 for glass capsule), d2: Chemical type (1 for epoxy and 0 forbedment depth (mm), d5: Clear clearance (mm), d6: Concrete compressive strength= 5.801483 for Sub-ET4, c0 = 5.138702 for Sub-ET5, c0 = �6.909272 for Sub-ET6,

Table 3GEP parameters used for the proposed model.
P1 Function set +, �, �, /,p
, ^, ln, exp, sin, tanP2 Number of generation 940,695P3 Chromosomes 40P4 Head size 10P5 Linking function MultiplicationP6 Number of genes 6P7 Mutation rate 0.044P8 Inversion rate 0.1P9 One-point recombination rate 0.3P10 Two-point recombination rate 0.3P11 Gene recombination rate 0.1P12 Gene transposition rate 0.1
Fig. 3. Performance of the proposed GEP model: (a) train set and (b) test set.
Fig. 4. Predicted shear capacity values from ACI 349-97.
Fig. 5. Predicted shear capacity values from ACI 349-06.
Fig. 6. Predicted shear capacity values from CCD method.
Fig. 7. Predicted shear capacity values from modified CCD method.
M. Gesoglu et al. / Composites: Part B 60 (2014) 716–724 721
parameters given in Table 3. As seen in Table 3 that various math-ematical operations were included to provide a reliable model.
VU ¼ V1 � V2 � V3 � V4 � V5 � V6 ð9Þ
V1 ¼ lnffiffiffiffiffiffiffiffiffiffiffiffiffiffiffiffiffiffiffiffiffiffiffiffiffiffiffiffiffiffiffiffiffiffiffiffiffiffiffiffiffiffiffiffiffiffiffiffiffiffiffiffiffiffiffiffiffiffiffiffiffiffiffiffiffiffiffiffiffiffiffiffiffiffiffiffiffiffiffiffi�6:227142þ X8 � X3 � X6 þ tanðX4
1Þ3q� �� �2
ð9aÞ
V2 ¼ ln
ffiffiffiffiffiffiffiffiffiffiffiffiffiffiffiffiffiffiffiffiffiffiffiffiffiffiffiffiffiffiffiffiffiffiffiffiffiffiffiffiffiffiffiffiffiffiffiffiffiðffiffiffiffiffiffiffiffiffiffiffiffiffiffiffiffiffiX2
7 þ X1
qÞ
sin2ðX7Þþ X1
3
s264
375 ð9bÞ

Fig. 8. Predicted shear capacity values from PCI method. Fig. 9. Prediction performance of the GEP, CCD, modified CCD, ACI 349-97, ACI 349-06, and PCI models for different concrete compressive strengths.
Fig. 10. Prediction performance of the GEP, CCD, modified CCD, ACI 349-97, ACI349-06, and PCI models for different edge distances.
722 M. Gesoglu et al. / Composites: Part B 60 (2014) 716–724
V3 ¼ ln½X7 � sin½ðX5 þ 3:883179Þ3� þ tanð�7:08139� X5Þ� ð9cÞ
V4 ¼ffiffiffiffiffiffiffiffiffiffiffiffiffiffiffiffiffiffiffiffiffiffiffiffiffiffiffiffiffiffiffiffiffiffiffiffiffiffiffiffiffiffiffiffiffiffiffiffiffiffiffiffiffiffiffiffiffiffiffiffiffiffiffiffiffiffiffiffiffiffiffiffiffiffiffiffiffiffiffiffiffiffiffiffiffiffiffiX7 þ X6 � ½tanðsin X7Þ � X4 þ 5:801483�6
qð9dÞ
V5 ¼ ln½lnðX1 � tanðX8 þ 8:091003� X4Þ � tanð5:138702
� X1ÞÞ� ð9eÞ
V6 ¼ ½lnðffiffiffiffiffiffiffiffiffiffiffiffiffiffiffiffiffiffiffiffiffiffiffiffiffiffiffiffiffiffiffiffiffiffiffiffiffiffiffiffiffiffiffiffiffiffiffiffiffiffiffiffiffiffiffiffiffiffiffiffiffiffiffiffiffiffiffiffiffiffiffiffiffiffiffiffiffiffiffiffiffiffitanðln X8Þ þ ð�6:909272ÞX2 þ X8 þ X4
3q
Þ�3
ð9fÞ
where VU is the ultimate shear capacity of adhesive anchor in un-cracked concrete (kN); X1: Anchor diameter (mm); X2: Injectiontype (1 for cartridge injection, 0 for glass capsule); X3: Chemicaltype (1 for epoxy and 0 for unsaturated polyester); X4: Type of an-chor (1 for steel rebar, 0 for threaded bars); X5: Embedment depth(mm); X6: Clear clearance (mm), X7: Concrete compressive strength(MPa), and X8: Edge distance (mm).
5. Performance of the prediction model
Performance of the proposed GEP prediction model in Eq. (9)was depicted in Fig. 3 for both train and testing data sets. More-over, the correlations between experimental and predicted shearcapacities for the existing models were also given in Figs. 4–8 forthe entire data. Fig. 3 revealed that a high estimation accuracywas accomplished for both training and testing data sets. The cor-relation coefficient of training set was 0.98 while that of testingwas 0.92. It is seen in Fig. 6 that despite having lower R2 value,CCD method presented similar trend as GEP model. As a result ofuniform scatter of the data, the correlation coefficients calculatedfor the other models also appeared to be very close to each other.However, the shear capacities computed from ACI 349-97, ACI 349-06, and PCI models underpredicted the actual values whileModified CCD method provided overprediction. Some statisticalparameters were also given in Table 4 for comparing the tendencyof the distribution of the predicted values. The proposed GEP
Table 4Statistical parameters of the proposed model as well as existing ones.
Parameters GEP model CC
Training data set Testing data set
Mean Square Error (MSE) 36.9 168.7 26Mean absolute percent error (MAPE) 10.0 14.2 18Root Mean Square Error (RMSE) 6.1 13.0 16Correlation coefficient (R2) 0.98 0.92 0.8
model had the lowest errors such that MAPE (mean absolutepercentage error) was about 10 and 14% for the train and test sets,respectively. However, when the existing models in the literaturewere considered, MAPE ranged from 19% to 66%, depending onthe prediction capability of the model. Therefore, this absoluteerror of the proposed GEP model seemed to be fairly reasonablewhen the noisy nature of the experimental results of adhesive an-chors was taken into account [24,25]. Of all the existing formulas,CCD method appeared to be the most reliable one attributed to itsrelatively lower prediction error.
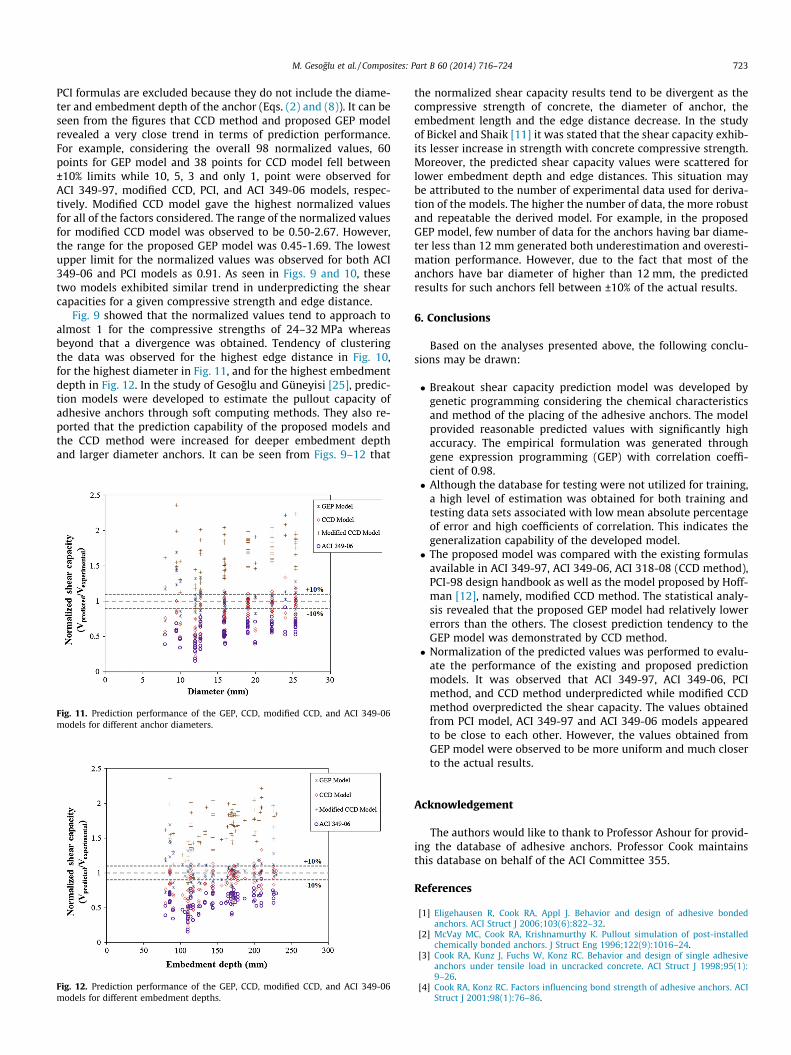
Figs. 9–12 indicate the variations of the normalized shearcapacity found by dividing the predicted over experimental values,versus compressive strength of the concrete, edge distance, diam-eter of anchor and embedment depth of the anchor, respectively.Since compressive strength of the concrete and edge distance arethe fundamental factors as being available in all of the predictionmodels, Figs. 9 and 10 contained all of the prediction models dealtwith this study. Nevertheless, in Figs. 11 and 12, ACI 349-97 and
D model Modified CCD model ACI 349-97 ACI 349-06 PCI model
1.3 3858.9 556.7 1051.5 1327.6.9 66.0 33.0 42.2 41.5.2 62.1 23.6 32.4 36.48 0.89 0.87 0.88 0.89
M. Gesoglu et al. / Composites: Part B 60 (2014) 716–724 723
PCI formulas are excluded because they do not include the diame-ter and embedment depth of the anchor (Eqs. (2) and (8)). It can beseen from the figures that CCD method and proposed GEP modelrevealed a very close trend in terms of prediction performance.For example, considering the overall 98 normalized values, 60points for GEP model and 38 points for CCD model fell between±10% limits while 10, 5, 3 and only 1, point were observed forACI 349-97, modified CCD, PCI, and ACI 349-06 models, respec-tively. Modified CCD model gave the highest normalized valuesfor all of the factors considered. The range of the normalized valuesfor modified CCD model was observed to be 0.50-2.67. However,the range for the proposed GEP model was 0.45-1.69. The lowestupper limit for the normalized values was observed for both ACI349-06 and PCI models as 0.91. As seen in Figs. 9 and 10, thesetwo models exhibited similar trend in underpredicting the shearcapacities for a given compressive strength and edge distance.
Fig. 9 showed that the normalized values tend to approach toalmost 1 for the compressive strengths of 24–32 MPa whereasbeyond that a divergence was obtained. Tendency of clusteringthe data was observed for the highest edge distance in Fig. 10,for the highest diameter in Fig. 11, and for the highest embedmentdepth in Fig. 12. In the study of Gesoglu and Güneyisi [25], predic-tion models were developed to estimate the pullout capacity ofadhesive anchors through soft computing methods. They also re-ported that the prediction capability of the proposed models andthe CCD method were increased for deeper embedment depthand larger diameter anchors. It can be seen from Figs. 9–12 that
Fig. 11. Prediction performance of the GEP, CCD, modified CCD, and ACI 349-06models for different anchor diameters.
Fig. 12. Prediction performance of the GEP, CCD, modified CCD, and ACI 349-06models for different embedment depths.
the normalized shear capacity results tend to be divergent as thecompressive strength of concrete, the diameter of anchor, theembedment length and the edge distance decrease. In the studyof Bickel and Shaik [11] it was stated that the shear capacity exhib-its lesser increase in strength with concrete compressive strength.Moreover, the predicted shear capacity values were scattered forlower embedment depth and edge distances. This situation maybe attributed to the number of experimental data used for deriva-tion of the models. The higher the number of data, the more robustand repeatable the derived model. For example, in the proposedGEP model, few number of data for the anchors having bar diame-ter less than 12 mm generated both underestimation and overesti-mation performance. However, due to the fact that most of theanchors have bar diameter of higher than 12 mm, the predictedresults for such anchors fell between ±10% of the actual results.
6. Conclusions
Based on the analyses presented above, the following conclu-sions may be drawn:
� Breakout shear capacity prediction model was developed bygenetic programming considering the chemical characteristicsand method of the placing of the adhesive anchors. The modelprovided reasonable predicted values with significantly highaccuracy. The empirical formulation was generated throughgene expression programming (GEP) with correlation coeffi-cient of 0.98.� Although the database for testing were not utilized for training,
a high level of estimation was obtained for both training andtesting data sets associated with low mean absolute percentageof error and high coefficients of correlation. This indicates thegeneralization capability of the developed model.� The proposed model was compared with the existing formulas
available in ACI 349-97, ACI 349-06, ACI 318-08 (CCD method),PCI-98 design handbook as well as the model proposed by Hoff-man [12], namely, modified CCD method. The statistical analy-sis revealed that the proposed GEP model had relatively lowererrors than the others. The closest prediction tendency to theGEP model was demonstrated by CCD method.� Normalization of the predicted values was performed to evalu-
ate the performance of the existing and proposed predictionmodels. It was observed that ACI 349-97, ACI 349-06, PCImethod, and CCD method underpredicted while modified CCDmethod overpredicted the shear capacity. The values obtainedfrom PCI model, ACI 349-97 and ACI 349-06 models appearedto be close to each other. However, the values obtained fromGEP model were observed to be more uniform and much closerto the actual results.
Acknowledgement
The authors would like to thank to Professor Ashour for provid-ing the database of adhesive anchors. Professor Cook maintainsthis database on behalf of the ACI Committee 355.
References
[1] Eligehausen R, Cook RA, Appl J. Behavior and design of adhesive bondedanchors. ACI Struct J 2006;103(6):822–32.
[2] McVay MC, Cook RA, Krishnamurthy K. Pullout simulation of post-installedchemically bonded anchors. J Struct Eng 1996;122(9):1016–24.
[3] Cook RA, Kunz J, Fuchs W, Konz RC. Behavior and design of single adhesiveanchors under tensile load in uncracked concrete. ACI Struct J 1998;95(1):9–26.
[4] Cook RA, Konz RC. Factors influencing bond strength of adhesive anchors. ACIStruct J 2001;98(1):76–86.

724 M. Gesoglu et al. / Composites: Part B 60 (2014) 716–724
[5] Cook RA. Behavior of chemically bonded anchors. J Struct Eng 1993;119(9):2744–62.
[6] Gesoglu M, Özturan T, Özel M, Güneyisi E. Tensile behavior of post-installedanchors in plain and steel fiber reinforced normal-and high-strength concretes.ACI Struct J 2005;102(2):224–31.
[7] Cook RA, Doerr GT, Klingner RE. Bond stress model for design of adhesiveanchors. ACI Struct J 1993;90(5):514–24.
[8] Higgins CC, Klingner RE. Effects of environmental exposure on the performanceof cast-in-place and retrofit anchors in concrete. ACI Struct J 1998;95(5):506–17.
[9] Fujikake K, Nakayama J, Sato H, Mindess S, Ishibashi T. Chemically bondedanchors subjected to rapid pullout loading. ACI Mater J 2003;100(3):246–52.
[10] Lee NH, Park KR, Suh YP. Shear behavior of headed anchors with largediameters and deep embedments. ACI Struct J 2010;107(2):146–56.
[11] Bickel TS, Shaik FA. Shear strength of adhesive anchors. PCI J 2002:92–102.[12] Hofmann J. Tragverhalten und Bemessung von Befestigungen am Bauteilrand
unter Querlasten mit beliebigem Winkel zur Bauteilkante (Load- BearingBehaviour and Design of Fasteners Close to an Edge under Shear Loading withan Arbitrary Angle to the Edge), PhD thesis, Institut für Werkstoffe imBauwesen, Universität Stuttgart, 2004. p. 235 (in German).
[13] Ueda T, Kitipornchai S, Ling K. Experimental investigation of anchor boltsunder shear. J Struct Eng 1990;116(910–92):1.
[14] ACI Committee 349. Code Requirements for Nuclear Safety-Related ConcreteStructures and Commentary (ACI 349-97). Farmington Hills, MI: AmericanConcrete Institute; 1997. p. 123.
[15] ACI Committee 349. Code Requirements for Nuclear Safety-Related ConcreteStructures and Commentary (ACI 349-06). Farmington Hills, MI: AmericanConcrete Institute; 2007. p. 153.
[16] ACI Committee 318. Building Code Requirements for Structural Concrete (ACI318-05) and Commentary (318R-08). Farmington Hills, MI: American ConcreteInstitute; 2008. p. 467.
[17] Fuchs W, Eligehausen R, Breen JE. Concrete Capacity Design (CCD) approach forfastening to concrete. ACI Struct J 1995;92:73–94.
[18] PCI Design Handbook. Precast-Prestressed Concrete. 5th ed. Chicago: Precast-Prestressed Concrete Institute; 1998.
[19] Koza JR. Genetic programming: On the programming of computers by meansof natural selection. MIT Press; 1992.
[20] Goldberg D. Genetic algorithms in search, optimization and machinelearning. MA: Addison-Welsley; 1989.
[21] Zadeh LA. Soft computing and fuzzy logic. IEEE Software 1994;11(6):48–56.[22] Ferreira C. Gene expression programming: a new adaptive algorithm for
solving problems. Complex Syst 2001;13(2):87–129.[23] Özbay E, Gesoglu M, Güneyisi E. Empirical modeling of fresh and hardened
properties of self-compacting concretes by genetic programming. Constr BuildMater 2008;22:1831–40.
[24] Sakla SSS, Ashour AF. Prediction of tensile capacity of single adhesive anchorsusing neural networks. Comput Struct 2005;83:1792–803.
[25] Gesoglu M, Güneyisi E. Prediction of load-carrying capacity of adhesiveanchors by soft computing techniques. Mater Struct 2007;40:939–51.