Embed Size (px)
Citation preview

2014 Full Year Results26 February 2015

Stephen HarrisChief Executive
Introduction
2

Agenda
3
Highlights
Financial review
Business review
Outlook

4
Highlights
Encouraging revenue growth, before adverse exchange effects
Further increases in Group headline margin and operating profit
Return on Capital Employed increased 80 basis points to 20.7%
Net cash of £36m
Final ordinary dividend of 9.8p, 14.4p for the year, up 7%
Special dividend of 20.0p

David LandlessFinance Director
Financial review
5

2014 2013 change constant currency
Revenue 609.1 619.6 -2% 4%
Headline: Operating profit 111.1 107.4 3% 9%Margin 18.2% 17.3% 90 bpProfit before tax 107.8 103.7 4% 10%
Net cash 35.7 15.0Headline EPS 43.8p 41.2p 6%
Return on Capital Employed 20.7% 19.9% 80 bp
DividendOrdinary 14.4p 13.5p 7%Special 20.0p 10.0p
£m
6
2014 Results summary

111.1
107.41.2
2.6
3.0 -0.92.2
1.8 -6.2
2013 Price minuscost
increases
Sales mix Sales volume Start-Ups Share-basedpayments
Central costs Foreignexchangetranslation
2014
7
Headline operating profit bridge£m

£m 2014 2013 changeconstant currency
ADE Divisions Revenue 263.0 261.8 - 5%Headline Operating Profit 70.6 70.7 - 4%Margin 26.8% 27.0%
AGI DivisionsRevenue 346.1 357.8 -3% 3%Headline Operating Profit 54.1 52.7 3% 9%Margin 15.6% 14.7%
8
Divisional summary

Headline Operating
Profit
Tax, WC & Interest
Capex
0
20
40
60
80
100
120
140
160
180
Headline EBITDA Uses of cash
Capex covered by depreciation Maintenance / expansionary capex split
approx 50:50 Low working capital 39.5p free cash per share
9
2014 Cash flow£m
£75m free cash
Headline EBITDA = £166m
See slide 33 for detailed cash flow disclosure
Depreciation

Headline Operating
Profit
Capex
0
20
40
60
80
100
120
140
160
180
Headline EBITDA Uses of cash
2012
Headline Operating
Profit
Capex
Headline EBITDA Uses of cash
2013
Headline Operating
Profit
Capex
Headline EBITDA Uses of cash
2014
10
Cash performance£m, at constant currency
Consistent alignment of capex and depreciation Free cash a major element of Bodycote’s value creation – whether invested in
acquisitions or returned to shareholders
£79m free cash
£74m free cash
£75m free cash
DepreciationDepreciation
Depreciation
Tax, WC& interest
Tax, WC& interest
Tax, WC& interest

£16.0m
Underlying central costs
11
£13.6m
Central costs
£15.7m
2012 2013 2014
Share based payments
One-off costs, principally asset impairments
Underlying

Currency
Finance charges
Taxation Effective tax rate 23.5% (2013: 25.7%) 2014 benefitted from a one-off settlement
Notes
12
£m 2014 2013Net interest payable 0.2 0.6Financing & other costs 2.5 2.5Pension finance charge 0.6 0.6Net finance charge 3.3 3.7
$ €2014 Average exchange rate 1.65 1.24Today's exchange rate 1.54 1.36
Potential effect on 2015 headline operating profit (£m) 4.4 (4.8)

13
Financial summary
4% constant currency revenue growth
Headline operating profit up 9% at constant currency
Headline margin 18.2%, up 90 basis points
Return on capital employed up 80 basis points to 20.7%
Headline operating cash of £100m, 90% conversion
Net cash of £36m

Five year perspectiveAt 2014 exchange rates
14
466532 569 586 609
2010 2011 2012 2013 2014
Revenue£m
49
8095 102 111
2010 2011 2012 2013 2014
Headline operating profit£m
10.4
15.116.8 17.3 18.2
2010 2011 2012 2013 2014
Headline margin%
10.2
16.3 17.919.9 20.7
2010 2011 2012 2013 2014
ROCE At actual rates%

Stephen HarrisChief Executive
Business review
15
Low Pressure Carburising (LPC)
LPC is a case hardening process carried out in a vacuum furnace using hydrocarbon gases at very low pressure and elevated temperatures to obtain a hardened surface layer of tempered martensite and a tough core. The treatment is used to increase the wear resistance and fatigue life of components.

-5%
0%
5%
10%
15%
16
Aerospace & Defence
Defence down 6%, weak in both North America and Europe Defence (including dual-use) approx 5% of total Group revenue Aerospace up 4% UK Aero revenue down 7%, impacted by OEM structural changes North America and France achieved good Q4 growth, following earlier weakness from
platform changeovers
YOY organic growth trend
Jan Dec
Revenue: £133m Constant currency growth: 1.7%Revenue: £133m Constant currency growth: 1.7%

-5%
0%
5%
10%
15%
17
Energy
Oil & Gas strongly ahead; 2013 impacted by severe destocking On-shore growth weakened as year progressed Strong sub-sea growth, driven by rapid adoption of HIP PF Power generation revenue softened with falling demand for new industrial gas turbines
Jan Dec
Revenue: £84m Constant currency growth: 7.4%Revenue: £84m Constant currency growth: 7.4%
YOY organic growth trend

-5%
0%
5%
10%
15%
18
AutomotiveRevenue: £151m Constant currency growth: 4.1%Revenue: £151m Constant currency growth: 4.1%
Car & light truck up 5% North America grew stongly driven by continued market share gains Improved sales & marketing efforts, particularly in France and Germany,
delivered good growth in Europe Heavy truck down 1%, growth in North America offset by decline in Western Europe Emerging markets grew strongly
YOY organic growth trend
Jan Dec

-5%
0%
5%
10%
15%
19
General Industrial
Strong outperformance versus the market in Western Europe Tooling, construction equipment and general machinery sales were robust S3P market expansion delivered strong growth, particularly in Medical Mining now <1% of Group revenue
Revenue: £241m Constant currency growth: 4.2%Revenue: £241m Constant currency growth: 4.2%
YOY organic growth trend
Jan Dec

Specialist Technologies
20
Classical Heat Treatment and Specialist Technologies
Classical Heat Treatment
Bodycote’s traditional business including: Nitriding Carburising Annealing Tempering and many more...
Different growth rates, margins and development routes
Six Bodycote technologies with: high growth rates margins in excess of 30% great future potential
Increasingly the focus of Group investment

Hot Isostatic PressingProduct Fabrication
Specialist TechnologiesWhat are they?
21
Specialty Stainless SteelProcesses
HIP Services
Surface Technology
Low Pressure Carburising
Corr-I-Dur®

38%
62%
2014 Revenue & headline operating profit split
22
2014 Revenue 2014 Headline operating profit
Specialist TechnologiesClassical Heat Treatment
24%
76%
Specialist Technologies now 24% of total Group revenue, up from 14% in 2007
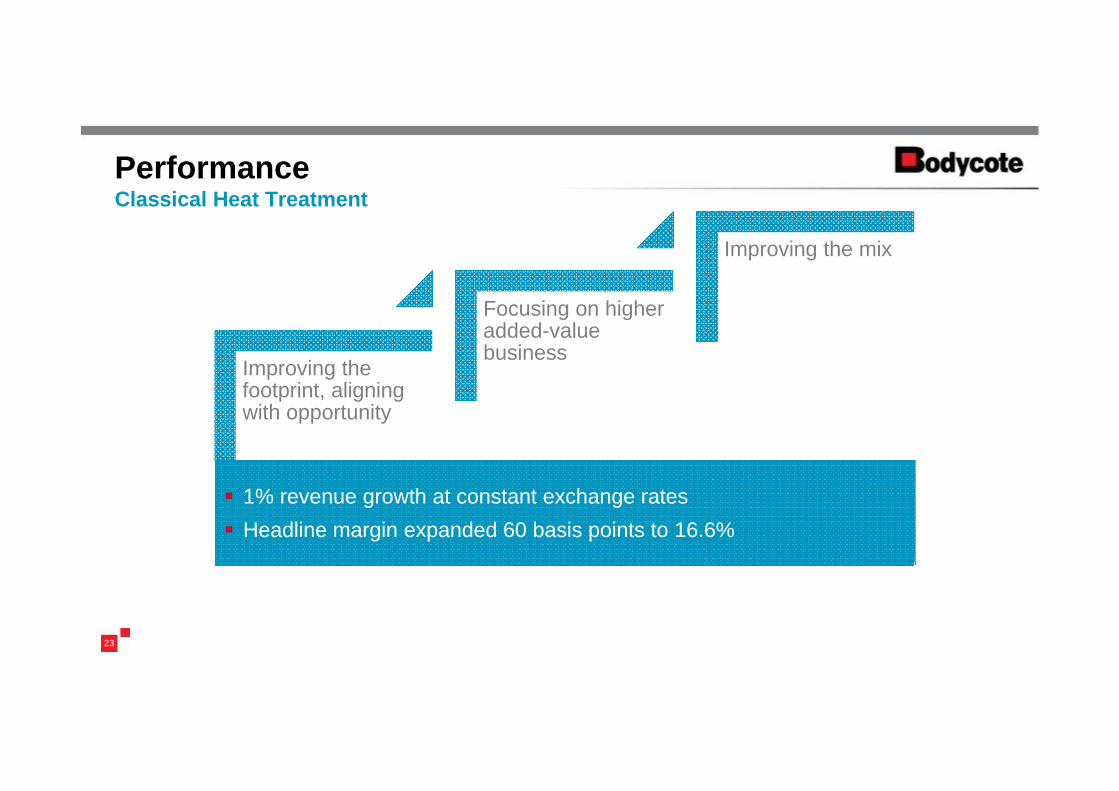
Improving the footprint, aligning with opportunity
Focusing on higher added-value business
Improving the mix
PerformanceClassical Heat Treatment
23
1% revenue growth at constant exchange rates Headline margin expanded 60 basis points to 16.6% 1% revenue growth at constant exchange rates Headline margin expanded 60 basis points to 16.6%

Business developmentsClassical Heat Treatment
24
Improving the footprint, aligning with opportunity
Focusing on higher added-value business
Improving the mix
Further expansion into rapid growth countries (greenfields opened in China and Turkey; capacity additions in Mexico)
Focus on improved efficiency including exit from several uneconomic, commodity oriented facilities in Europe
Continued mix improvements utilising the Bodycote Margin Model Aerospace capacity expanded in France and North America

Strong market positions
Superior margins
High growth
PerformanceSpecialist Technologies
25
17% revenue growth at constant exchange rates Headline margin 33% (stated before central costs)

Business developmentsSpecialist Technologies
26
Strong market positions
Superior margins
High growth
S3P - Capacity enhanced, good revenue growth
ST - Contract win for thermal spray on landing gear
HIP Services - High pressure capacity added in North America
HIP PF - Very strong revenue growth, mainly from sub-sea
CiD - Good revenue growth in developed economies, capacity added in Eastern Europe
LPC - New contract wins with Automotive OEMs in both North America and Europe

0
500
1,000
1,500
2,000
2,500
0.0
0.5
1.0
1.5
2.0
2.5
Jul-0
7
Dec
-07
May
-08
Oct
-08
Mar
-09
Aug
-09
Jan-
10
Jun-
10
Nov
-10
Apr
-11
Sep
-11
Feb-
12
Jul-1
2
Dec
-12
May
-13
Oct
-13
Mar
-14
Aug
-14
Jan-
15
Rig
s
£m p
er m
onth
Bodycote NA Oil & Gas revenue
US Rig Count
05
101520253035
Cap
ex $
Bn
27
Looking ahead
Onshore & offshore High correlation of revenue with rig count Approximate 3 month lag Majority of work is wear parts Demand expected to reduce as the year
progresses
Sub-sea Major projects, long lead times Long-term trend positive Oil price effect on new sub-sea projects
uncertain
Global Sub-sea Capex
Source: Infield Systems, Jan 2015Source: Baker Hughes, Bodycote revenue
Oil & Gas10% of Group revenue
Bodycote NA Oil & Gas Revenue & US Rig Count

28
Looking aheadAerospace17% of Group revenue
Good penetration on LEAP engine progamme UK will continue to be affected by OEM
structural changes, recovery expected post 2016
Expansion in France driven by A350 build rate
Automotive – Car & light truck20% of Group revenue
Steady build-rate growth forecast to continue in US and Europe
Low oil prices should boost automotive demand Expect to outperform general Auto demand due to:
Benefit from adoption of Specialist Technologies – LPC, S3P and CiD
Weighting towards premium autos
0
500
1,000
1,500
2,000Wide bodyNarrow body
Source: Boeing & Airbus, Credit Suisse estimates
Aircraft Deliveries
05,000
10,00015,00020,00025,00030,00035,00040,000
Uni
ts
Europe US
Car & light truck production
Source: Robert W. Baird & Co.

The Group delivered another good performance in 2014. Revenue, at constant exchange rates, was ahead 4% and we achieved further improvement in margin and return on capital employed, in addition to strong cash generation.
As we begin 2015 a number of macro-economic uncertainties persist. Nevertheless, at this early stage in the year, the Board believes that the strength of the Group’s Specialist Technologies and management’s continued focus on business improvement, particularly in the Classical Heat Treatment business, should enable further progress in 2015.
29
Outlook


Term Definition
Headline Operating Profit Operating profit before exceptional costs and amortisation of acquired intangibles
Headline Profit Before Tax Profit before tax, exceptional costs and amortisation of acquired intangibles
Headline Operating Cash Flow Cash generated by operations, less net capital expenditure and before cash flow relating to exceptional items
Headline EBITDA Earnings before interest, tax, depreciation, amortisation, impairment of fixed assets, profit or loss on disposal of property, plant and equipment, cash flow relating to restructuring, acquisition costs and share-based payments
Headline EPS Earnings per share excluding exceptional costs and tax on exceptional costs
Headline Operating Cash Conversion Headline operating cash flow divided by headline operating profit
ROCE Headline operating profit divided by the average of opening and closing capital employed as adjusted for certain items of goodwill written off
Capital Employed Net assets adjusted for net cash/(debt)
Definitions
31

2014 Statutory income statement
32
£m 2014 2013Revenue 609.1 619.6
Headline operating profit 111.1 107.4
Amortisation of acquired intangible fixed assets (3.9) (4.5)Acquisition costs (0.2) -Reorganisation costs - (0.8)
Operating profit 107.0 102.1
Net finance costs (3.3) (3.7)
Profit before tax 103.7 98.4
Headline earnings per share (pence) 2014 2013Basic 43.8p 41.2p

£m 2014 2013Headline operating profit 111.1 107.4
Add back: Depreciation and amortisation 52.5 57.9 Share-based payments 1.9 3.6
Headline EBITDA 165.5 168.9Net capital expenditure (53.8) (57.3)Net working capital movement (11.7) (2.7)
Headline operating cash flow 100.0 108.9Restructuring (3.0) (4.3)Acquisition expenses (0.2) -
Operating cash flow 96.8 104.6Financing costs (2.7) (3.3)Tax (19.0) (22.5)
Free cash flow 75.1 78.8Acquisitions (2.7) -Dividends (45.2) (24.0)Other (6.5) (5.6)
Increase in net cash 20.7 49.2
33
Cash flow detail
Net capex to depreciation ratio 1.0 times (Gross ratio = 1.1 x)
Includes payment of 2013 Special Dividend (£19.1m)

HIPProduct Fabrication
Specialty StainlessSteel Processes
HIP Services
Surface Technology
Low PressureCarburising
Corr-I-Dur®
34
Specialist TechnologiesWhat are they?
Application of high temperature and pressure to densify cast material Removal of porosity defects improves strength, toughness and machinability Can eliminate internal voids created by additive manufacturing methods
Method of manufacturing components by HIP technology using powder or solid Can create parts with the complexity of a casting but the strength of a forging Can be used to produce materials that can’t be manufactured by any other means
A family of proprietary technologies for the treatment of stainless steel Unique solution for improving the strength, hardness and wear resistance of stainless steels Does not affect the inherent corrosion-resistant properties of stainless steel
Comprises thermally sprayed ceramic and metallic coatings, and chemically-formed ceramics Prolongs component life by protecting from corrosion, abrasion and temperature Leads to reduced environmental impact by eliminating chrome
A ‘clean’ heat treatment process carried out under vacuum Provides a hardened surface and tough core – improves wear resistance and fatigue life Environmentally friendly
Proprietary heat treatment process for improving corrosion resistance and wear properties Successful alternative to hard chromium Leads to reduced environmental impact by eliminating chrome

Interest payable: decrease due to lower average net debt Financing costs: higher following extension of RCF in July 2014 Average remaining life of committed facility is 4.5 years Committed facility headroom of £230m at 31 December 2014 Closing net cash of £36m
Net finance charge/facilities
35
£m 2014 2013Net interest payable 0.2 0.6Financing costs 1.6 1.5Other charges 0.9 1.0Pension finance charge 0.6 0.6Net finance charge 3.3 3.7

Pension analysis
36
£m 2014 2013
UK Funded 1.0 4.8Other Western Europe Funded 1.6 1.2Other Western Europe Unfunded 13.7 12.1Western Europe Total 16.3 18.1
North America Funded 0.6 0.2Emerging Markets Unfunded 0.1 0.2Total retirement benefit obligations 17.0 18.5
£m 2014 2013Western Europe Unfunded:Italy 0.7 0.6France 8.9 8.2Germany 4.1 3.3
13.7 12.1

Financial information
37
5,603 5,532 5,720 5,813 5,836
2010 2011 2012 2013 2014
2014 2013Net Debt : Headline EBITDA net cash net cash Headline EBITDA Interest Cover 827x 282x Gearing (Net Debt:Total Equity) net cash net cash
Average headcount
Financial ratios2014 2013Weighted average 190.2m 189.4m
2014 2013EUR Average (P&L) 1.24 1.18
Closing (B/S) 1.29 1.20USD Average (P&L) 1.65 1.56
Closing (B/S) 1.56 1.66SEK Average (P&L) 11.31 10.20
Closing (B/S) 12.16 10.64
Analysis by currency: Sales ProfitEUR 36% 38%USD 34% 44%SEK 8% 8%
Shares in issue
Exchange rates

Divisional summary – 2014 H1 v H2£m
38
ADE Divisions H1 H2 Total
Revenue 133.5 129.5 263.0Headline operating profit 36.0 34.6 70.6Margin 27.0% 26.7% 26.8%
AGI Divisions H1 H2 Total
Revenue 178.8 167.3 346.1Headline operating profit 25.3 28.8 54.1Margin 14.1% 17.2% 15.6%