Embed Size (px)
Citation preview
2015 Full Year Results
25 February 2016
Stephen Harris
Group Chief Executive
Introduction
2
Agenda
3
Summary
Financial review
Business review
Outlook
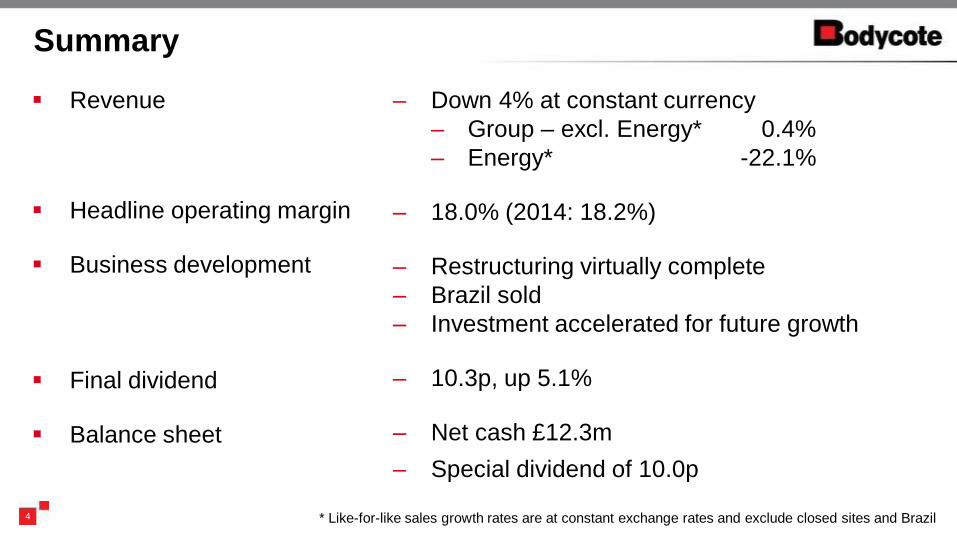
– Down 4% at constant currency
– Group – excl. Energy* 0.4%
– Energy* -22.1%
– 18.0% (2014: 18.2%)
– Restructuring virtually complete
– Brazil sold
– Investment accelerated for future growth
– 10.3p, up 5.1%
– Net cash £12.3m
– Special dividend of 10.0p
* Like-for-like sales growth rates are at constant exchange rates and exclude closed sites and Brazil 4
Summary
Revenue
Headline operating margin
Business development
Final dividend
Balance sheet
David Landless
Group Finance Director
Financial review
5
2015 2014 Currency
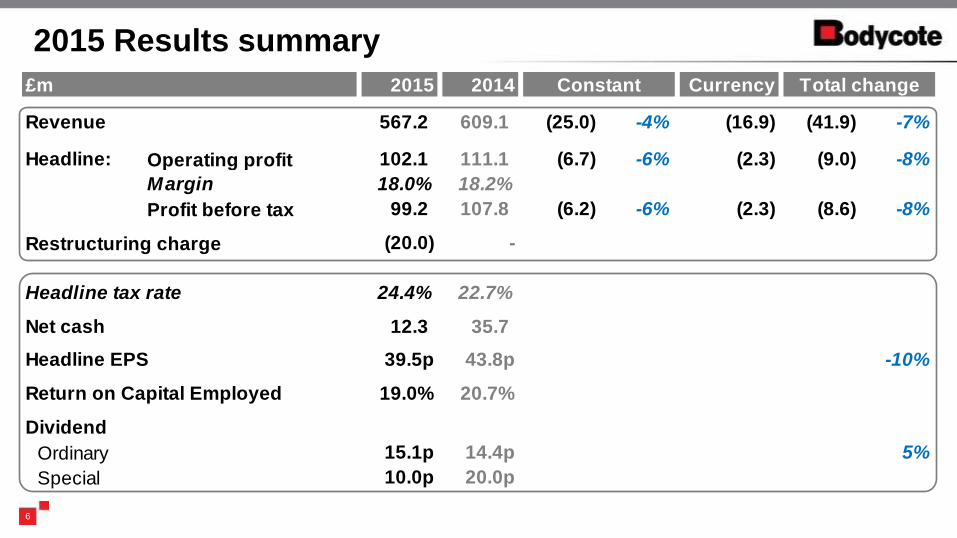
Revenue 567.2 609.1 (25.0) -4% (16.9) (41.9) -7%
Headline: Operating profit 102.1 111.1 (6.7) -6% (2.3) (9.0) -8%
Margin 18.0% 18.2%
Profit before tax 99.2 107.8 (6.2) -6% (2.3) (8.6) -8%
Restructuring charge (20.0) -
Headline tax rate 24.4% 22.7%
Net cash 12.3 35.7
Headline EPS 39.5p 43.8p -10%
Return on Capital Employed 19.0% 20.7%
Dividend
Ordinary 15.1p 14.4p 5%
Special 10.0p 20.0p
£m Constant Total change
6
2015 Results summary
£m 2015 2014 Currency
ADE Divisions
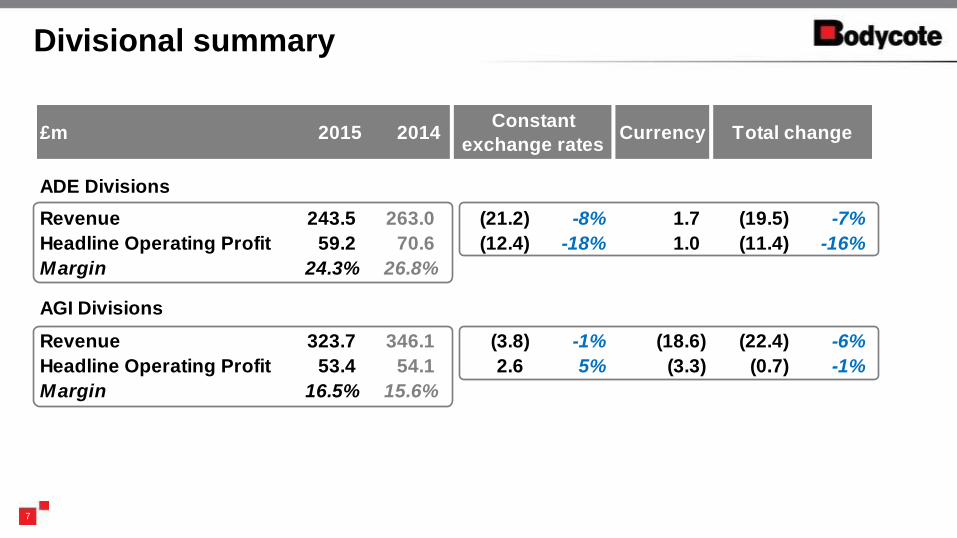
Revenue 243.5 263.0 (21.2) -8% 1.7 (19.5) -7%
Headline Operating Profit 59.2 70.6 (12.4) -18% 1.0 (11.4) -16%
Margin 24.3% 26.8%
AGI Divisions
Revenue 323.7 346.1 (3.8) -1% (18.6) (22.4) -6%
Headline Operating Profit 53.4 54.1 2.6 5% (3.3) (0.7) -1%
Margin 16.5% 15.6%
Constant
exchange ratesTotal change
7
Divisional summary
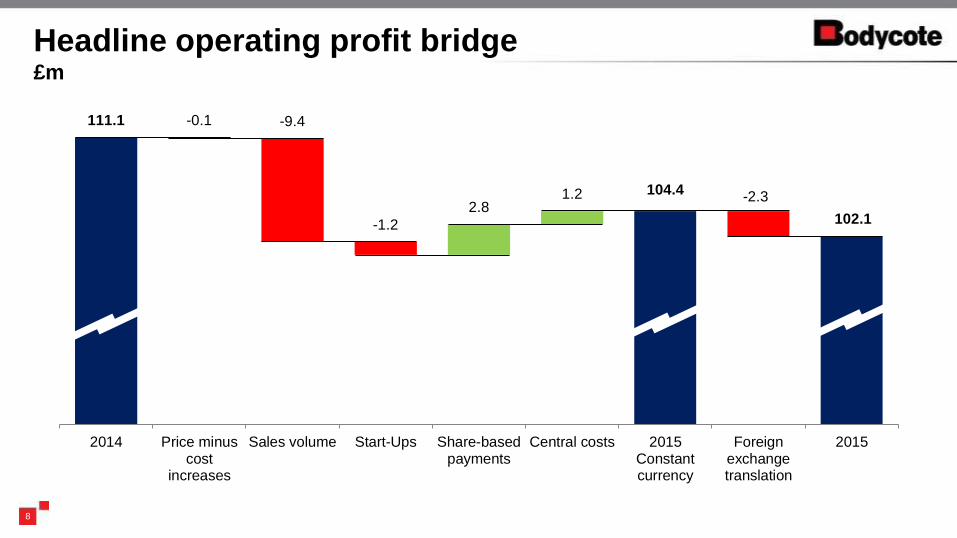
8
Headline operating profit bridge £m
104.4
102.1
111.1 -0.1 -9.4
-1.2
2.8 1.2 -2.3
2014 Price minuscost
increases
Sales volume Start-Ups Share-basedpayments
Central costs 2015Constantcurrency
Foreignexchangetranslation
2015
Headline Operating
Profit
Capex
Headline EBITDA Uses of cash
Headline Operating
Profit
Capex
0
20
40
60
80
100
120
140
160
180
Headline EBITDA Uses of cash
9
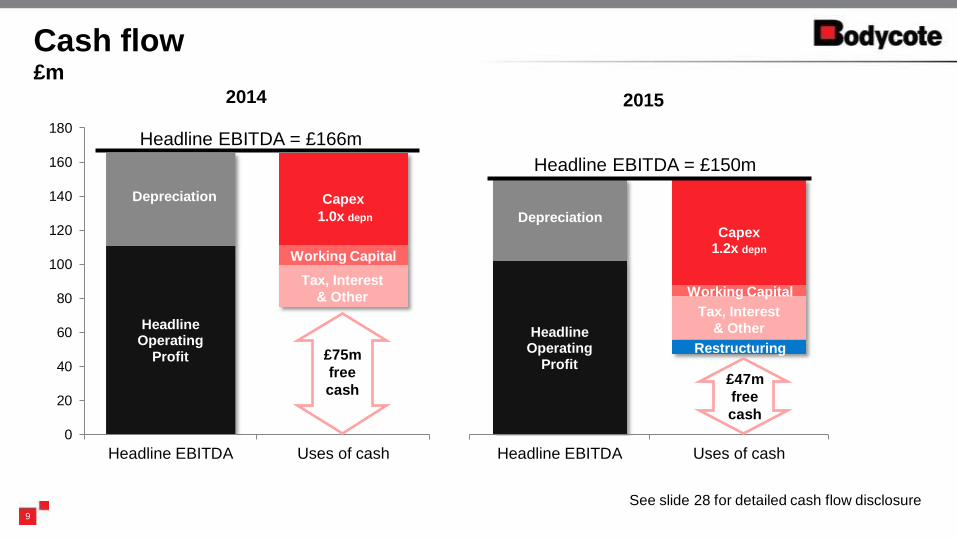
Cash flow £m
£47m
free
cash
2015
See slide 28 for detailed cash flow disclosure
Depreciation
2014
£75m
free
cash
Depreciation
Working Capital
Working Capital
Tax, Interest
& Other
Tax, Interest
& Other
Headline EBITDA = £150m
Headline EBITDA = £166m
Restructuring
1.0x depn
1.2x depn
10
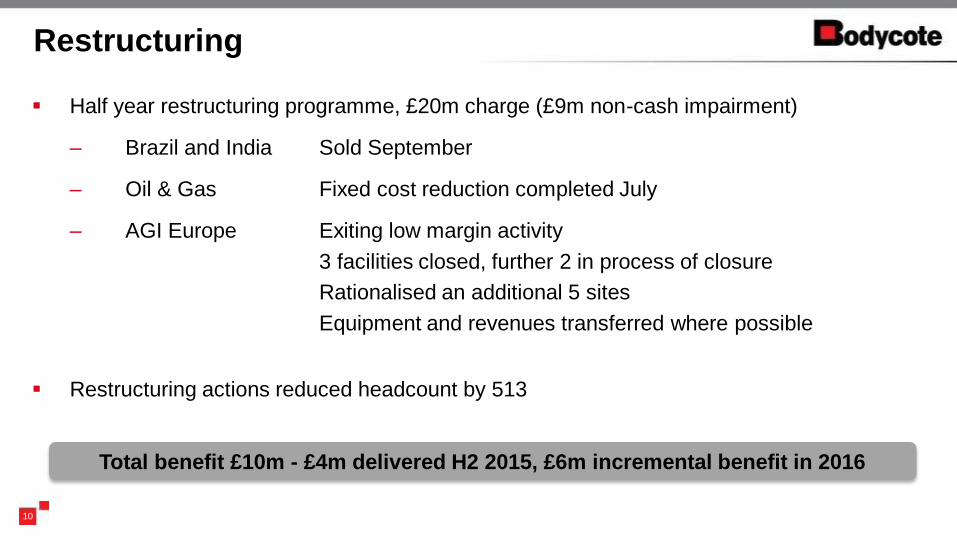
Restructuring
Total benefit £10m - £4m delivered H2 2015, £6m incremental benefit in 2016
Half year restructuring programme, £20m charge (£9m non-cash impairment)
– Brazil and India Sold September
– Oil & Gas Fixed cost reduction completed July
– AGI Europe Exiting low margin activity
3 facilities closed, further 2 in process of closure
Rationalised an additional 5 sites
Equipment and revenues transferred where possible
Restructuring actions reduced headcount by 513
Taxation
Headline tax rate 24.4% (2014: 22.7%)
Headline tax rate expected to be c.28% in 2016
– Historical tax losses now largely exhausted
– Proportion of profits from higher tax jurisdictions
Currency
Every cent change in the US dollar is worth c.£300k of operating profit
Every cent change in the Euro is worth c.£400k of operating profit
Notes
11
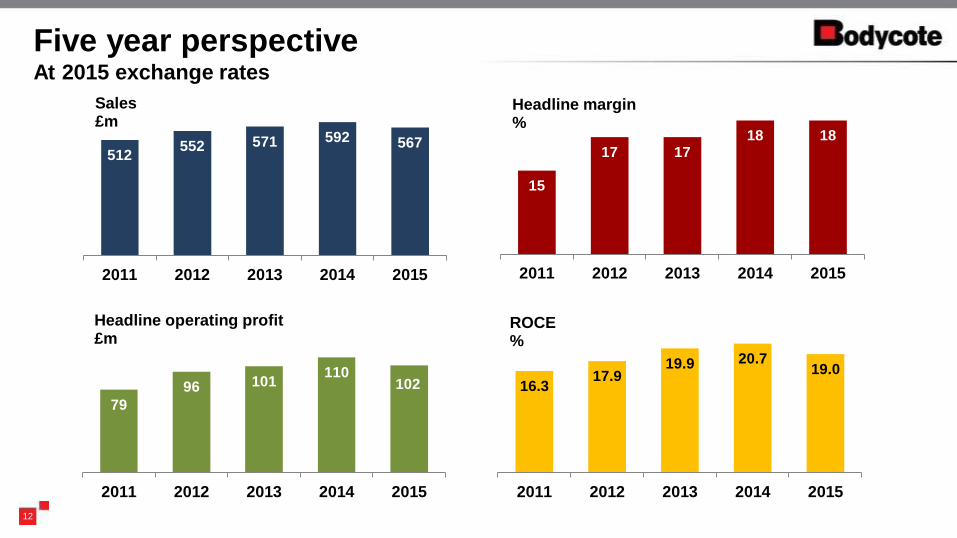
Five year perspective At 2015 exchange rates
12
512 552 571 592 567
2011 2012 2013 2014 2015
Sales £m
79
96 101 110
102
2011 2012 2013 2014 2015
Headline operating profit £m
15
17 17 18 18
2011 2012 2013 2014 2015
Headline margin %
16.3 17.9
19.9 20.7 19.0
2011 2012 2013 2014 2015
ROCE %
Stephen Harris
Group Chief Executive
Business review
13
-
10
20
30
40
50
60
70
80
H1 H2 H1 H2
2014 2015
14
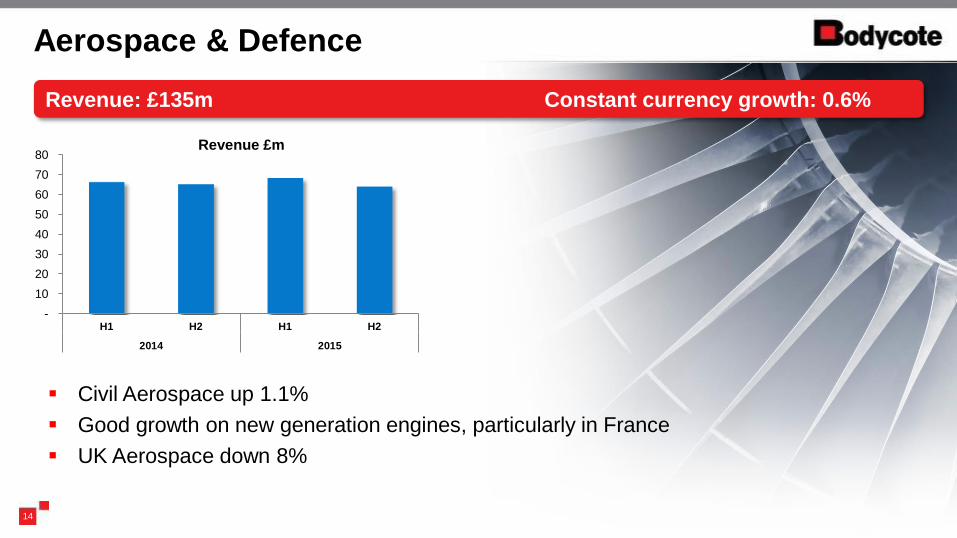
Aerospace & Defence
Revenue: £135m Constant currency growth: 0.6%
Civil Aerospace up 1.1%
Good growth on new generation engines, particularly in France
UK Aerospace down 8%
Revenue £m
15
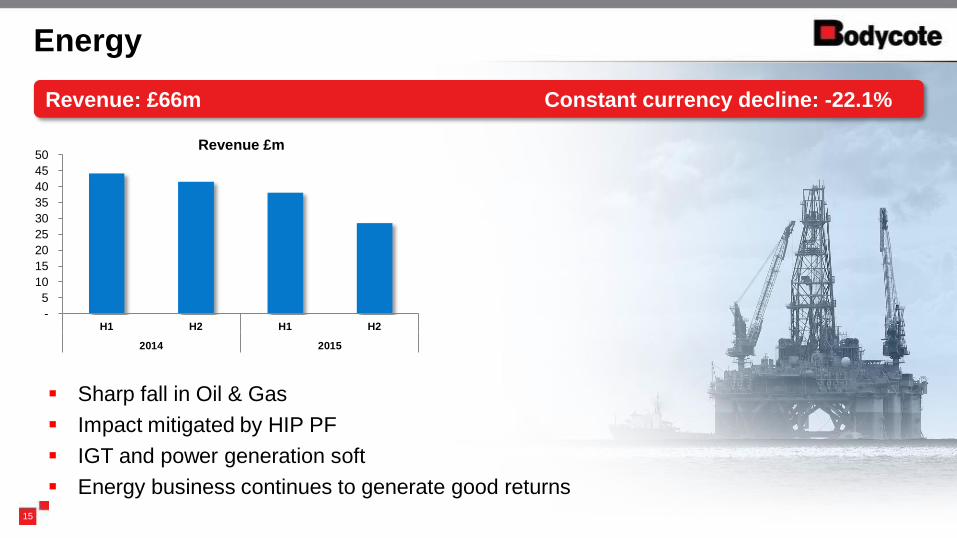
Energy
Revenue: £66m Constant currency decline: -22.1%
Sharp fall in Oil & Gas
Impact mitigated by HIP PF
IGT and power generation soft
Energy business continues to generate good returns
-
5
10
15
20
25
30
35
40
45
50
H1 H2 H1 H2
2014 2015
Revenue £m
50
55
60
65
70
75
80
85
H1 H2 H1 H2
2014 2015
16
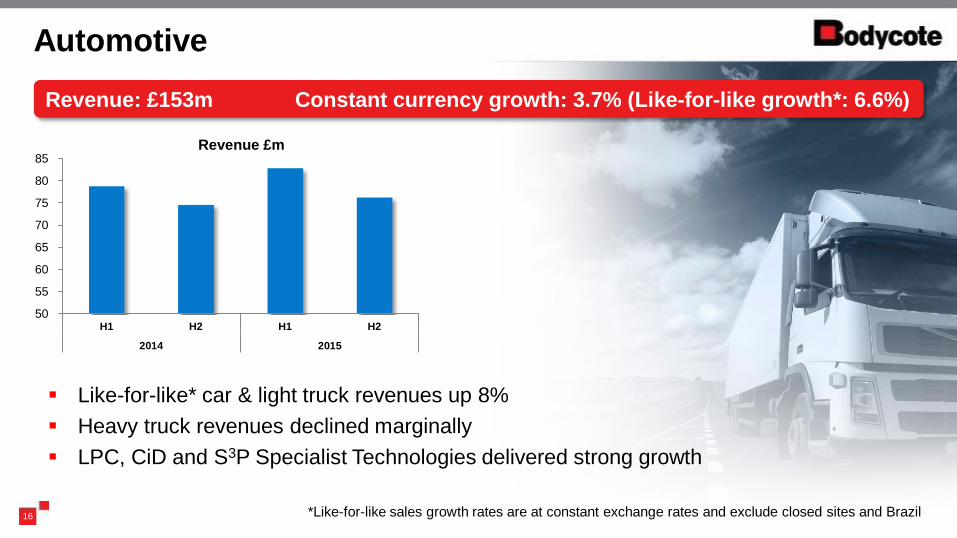
Automotive
Revenue: £153m Constant currency growth: 3.7% (Like-for-like growth*: 6.6%)
Revenue £m
Like-for-like* car & light truck revenues up 8%
Heavy truck revenues declined marginally
LPC, CiD and S3P Specialist Technologies delivered strong growth
*Like-for-like sales growth rates are at constant exchange rates and exclude closed sites and Brazil
-
20
40
60
80
100
120
140
H1 H2 H1 H2
2014 2015
17
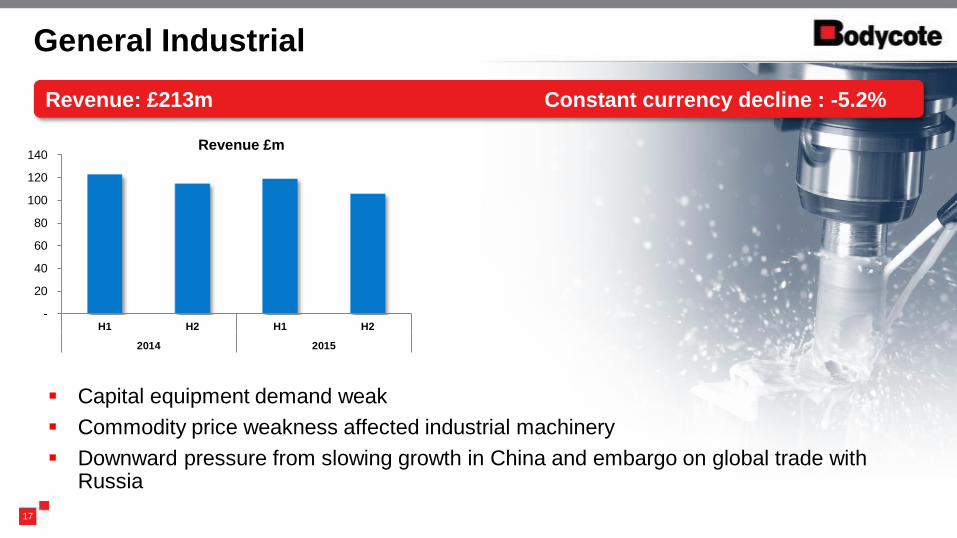
General Industrial
Revenue: £213m Constant currency decline : -5.2%
Revenue £m
Capital equipment demand weak
Commodity price weakness affected industrial machinery
Downward pressure from slowing growth in China and embargo on global trade with Russia
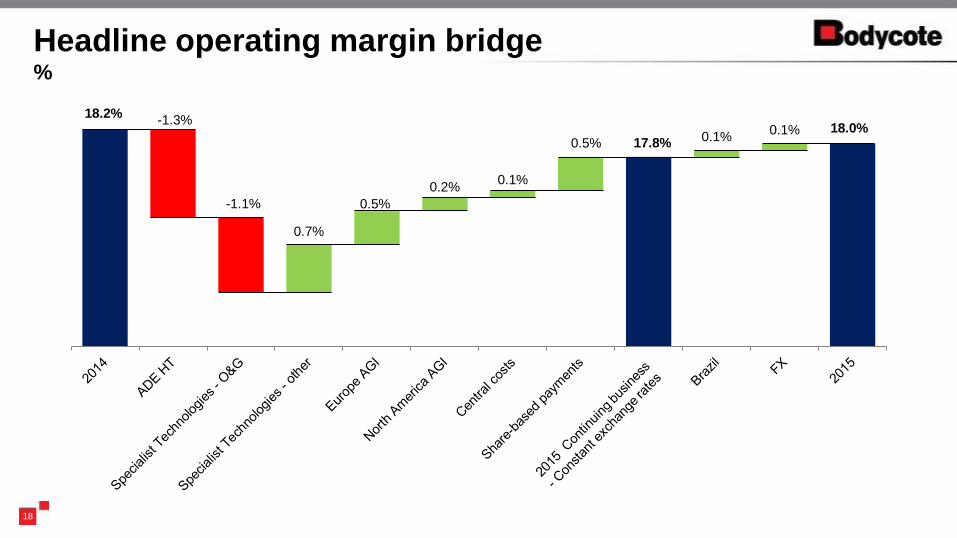
18
Headline operating margin bridge %
0.7%
0.5%
0.2% 0.1%
0.5% 0.1%
0.1%
18.2% -1.3%
-1.1%
17.8% 18.0%
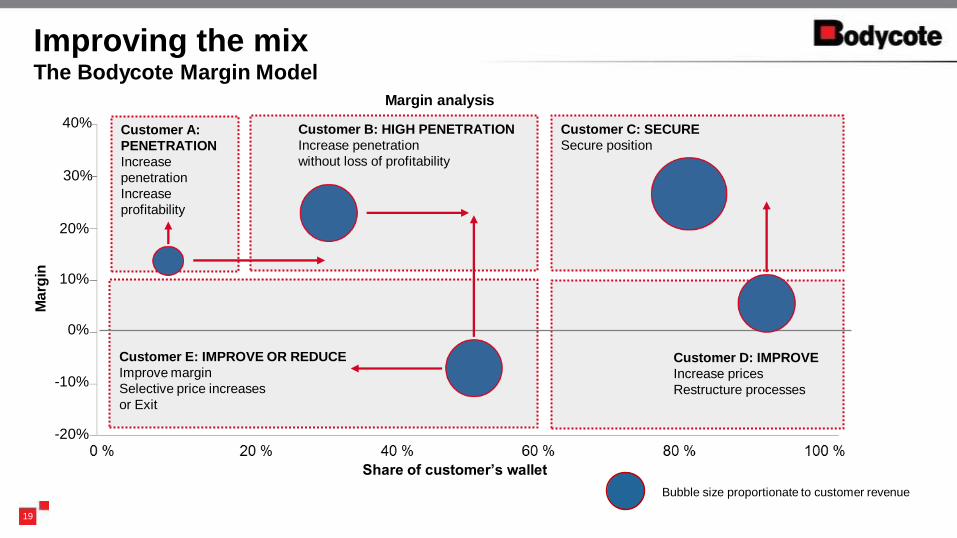
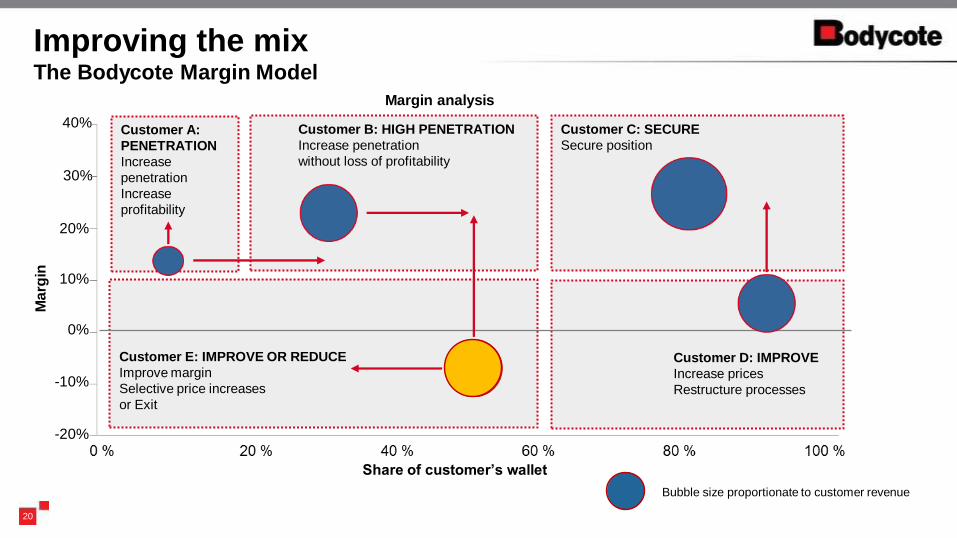
Bubble size proportionate to customer revenue
Customer B: HIGH PENETRATION
Increase penetration
without loss of profitability
Improving the mix The Bodycote Margin Model
19
Customer C: SECURE
Secure position
Customer D: IMPROVE
Increase prices
Restructure processes
Customer E: IMPROVE OR REDUCE
Improve margin
Selective price increases
or Exit
Customer A:
PENETRATION
Increase
penetration
Increase
profitability
40%
20%
10%
0%
-10%
-20%
Ma
rgin
30%
Share of customer’s wallet
Margin analysis
Bubble size proportionate to customer revenue
Customer B: HIGH PENETRATION
Increase penetration
without loss of profitability
Improving the mix The Bodycote Margin Model
20
Customer C: SECURE
Secure position
Customer D: IMPROVE
Increase prices
Restructure processes
Customer E: IMPROVE OR REDUCE
Improve margin
Selective price increases
or Exit
Customer A:
PENETRATION
Increase
penetration
Increase
profitability
40%
20%
10%
0%
-10%
-20%
Ma
rgin
30%
Share of customer’s wallet
Margin analysis
60%
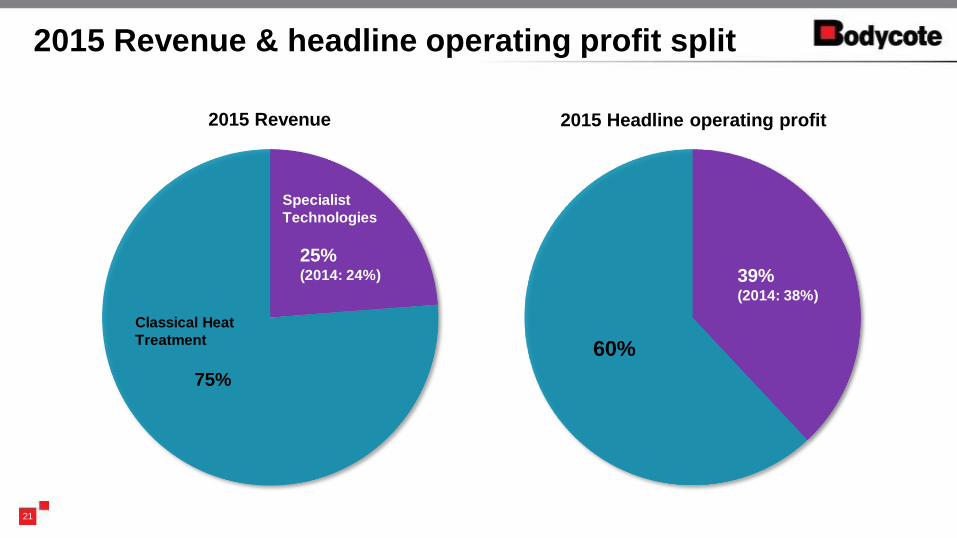
2015 Revenue & headline operating profit split
21
2015 Revenue 2015 Headline operating profit
75%
25% (2014: 24%) 39%
(2014: 38%)
Classical Heat
Treatment
Specialist
Technologies
22
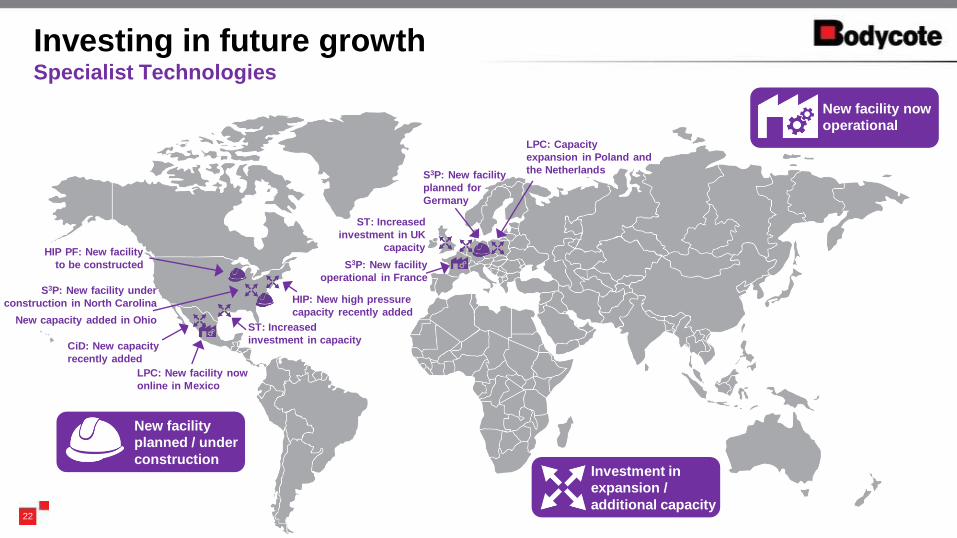
Investing in future growth Specialist Technologies
HIP PF: New facility
to be constructed
HIP: New high pressure
capacity recently added
S3P: New facility under
construction in North Carolina
New capacity added in Ohio
S3P: New facility
operational in France
S3P: New facility
planned for
Germany
LPC: New facility now
online in Mexico
ST: Increased
investment in capacity
ST: Increased
investment in UK
capacity
LPC: Capacity
expansion in Poland and
the Netherlands
New facility
planned / under
construction
New facility now
operational
Investment in
expansion /
additional capacity
CiD: New capacity
recently added
23
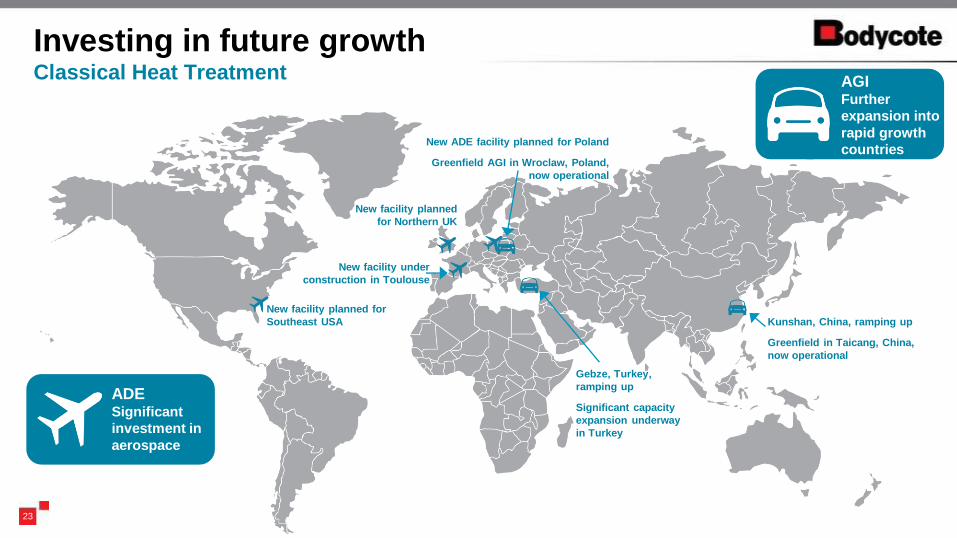
Investing in future growth Classical Heat Treatment
New facility planned for
Southeast USA
New facility planned
for Northern UK
New facility under
construction in Toulouse
New ADE facility planned for Poland
Greenfield AGI in Wroclaw, Poland,
now operational
Kunshan, China, ramping up
Greenfield in Taicang, China,
now operational
Gebze, Turkey,
ramping up
Significant capacity
expansion underway
in Turkey
ADE Significant
investment in
aerospace
AGI Further
expansion into
rapid growth
countries
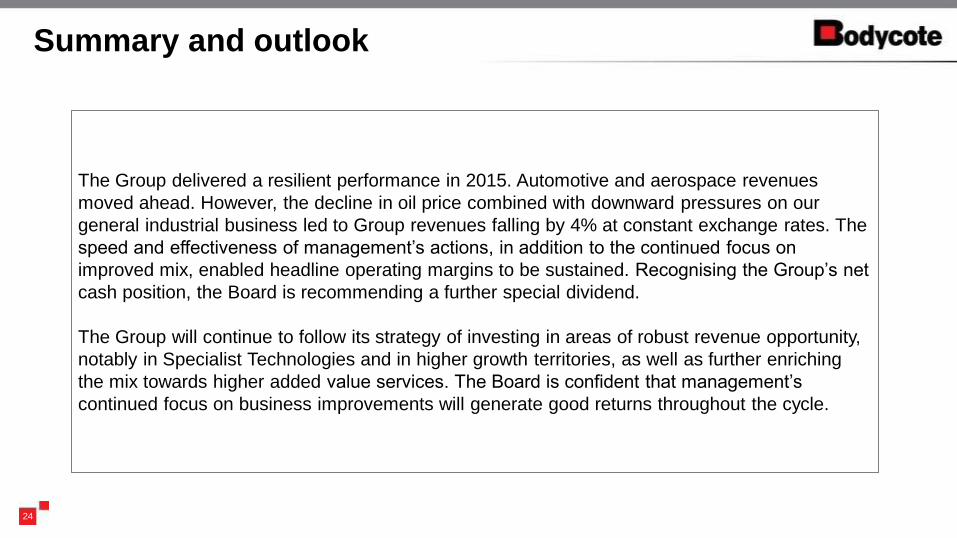
The Group delivered a resilient performance in 2015. Automotive and aerospace revenues
moved ahead. However, the decline in oil price combined with downward pressures on our
general industrial business led to Group revenues falling by 4% at constant exchange rates. The
speed and effectiveness of management’s actions, in addition to the continued focus on
improved mix, enabled headline operating margins to be sustained. Recognising the Group’s net
cash position, the Board is recommending a further special dividend.
The Group will continue to follow its strategy of investing in areas of robust revenue opportunity,
notably in Specialist Technologies and in higher growth territories, as well as further enriching
the mix towards higher added value services. The Board is confident that management’s
continued focus on business improvements will generate good returns throughout the cycle.
24
Summary and outlook
Definitions
26
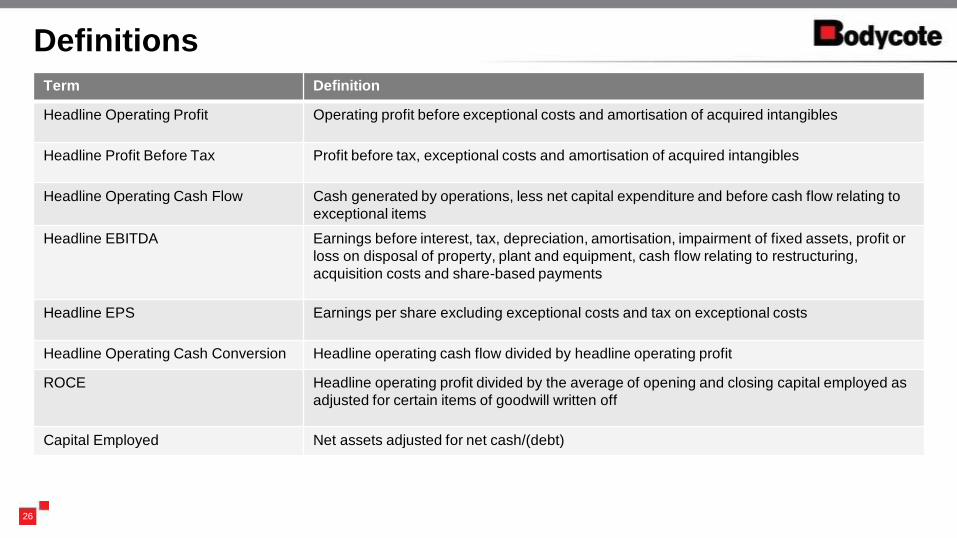
Term Definition
Headline Operating Profit Operating profit before exceptional costs and amortisation of acquired intangibles
Headline Profit Before Tax Profit before tax, exceptional costs and amortisation of acquired intangibles
Headline Operating Cash Flow Cash generated by operations, less net capital expenditure and before cash flow relating to
exceptional items
Headline EBITDA Earnings before interest, tax, depreciation, amortisation, impairment of fixed assets, profit or
loss on disposal of property, plant and equipment, cash flow relating to restructuring,
acquisition costs and share-based payments
Headline EPS Earnings per share excluding exceptional costs and tax on exceptional costs
Headline Operating Cash Conversion Headline operating cash flow divided by headline operating profit
ROCE Headline operating profit divided by the average of opening and closing capital employed as
adjusted for certain items of goodwill written off
Capital Employed Net assets adjusted for net cash/(debt)
2015 Statutory income statement
27
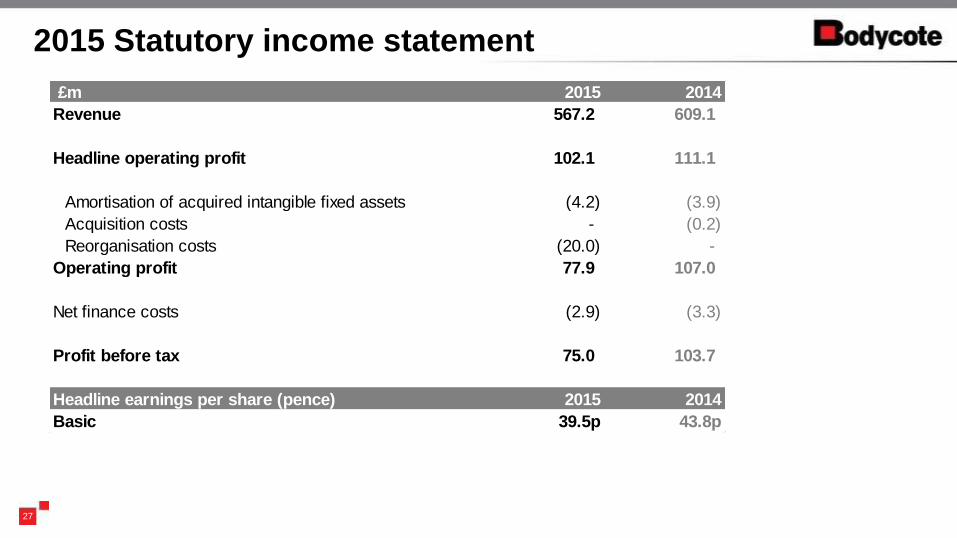
£m 2015 2014
Revenue 567.2 609.1
Headline operating profit 102.1 111.1
Amortisation of acquired intangible fixed assets (4.2) (3.9)
Acquisition costs - (0.2)
Reorganisation costs (20.0) -
Operating profit 77.9 107.0
Net finance costs (2.9) (3.3)
Profit before tax 75.0 103.7
Headline earnings per share (pence) 2015 2014
Basic 39.5p 43.8p
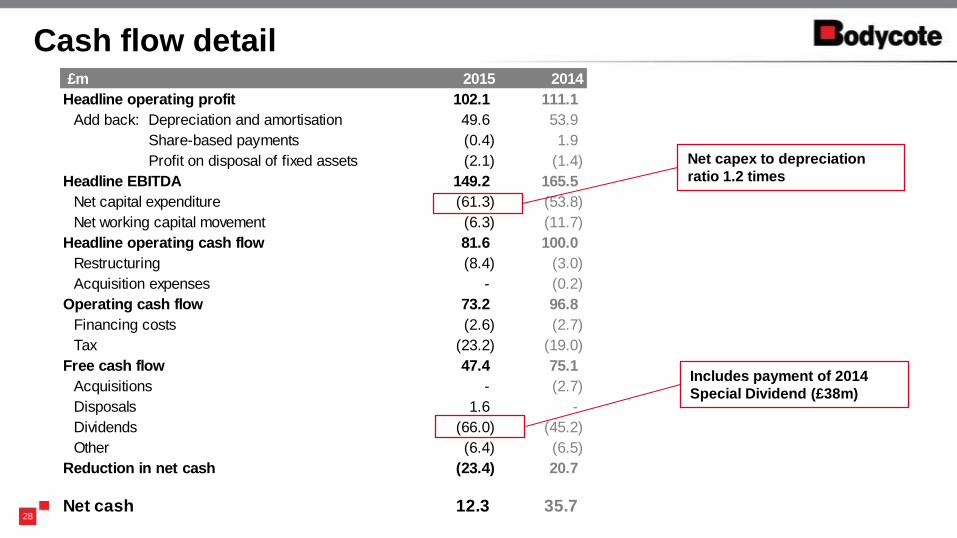
£m 2015 2014
Headline operating profit 102.1 111.1
Add back: Depreciation and amortisation 49.6 53.9
Share-based payments (0.4) 1.9
Profit on disposal of fixed assets (2.1) (1.4)
Headline EBITDA 149.2 165.5
Net capital expenditure (61.3) (53.8)
Net working capital movement (6.3) (11.7)
Headline operating cash flow 81.6 100.0
Restructuring (8.4) (3.0)
Acquisition expenses - (0.2)
Operating cash flow 73.2 96.8
Financing costs (2.6) (2.7)
Tax (23.2) (19.0)
Free cash flow 47.4 75.1
Acquisitions - (2.7)
Disposals 1.6 -
Dividends (66.0) (45.2)
Other (6.4) (6.5)
Reduction in net cash (23.4) 20.7
Net cash 12.3 35.728
Cash flow detail
Net capex to depreciation
ratio 1.2 times
Includes payment of 2014
Special Dividend (£38m)
HIP
Product Fabrication
Specialty Stainless
Steel Processes
HIP Services
Surface Technology
Low Pressure
Carburising
Corr-I-Dur®
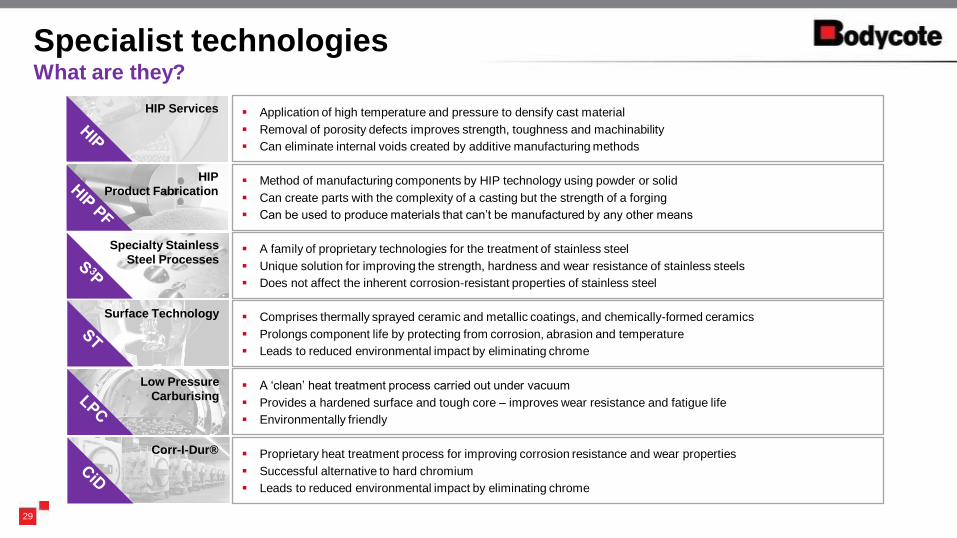
29
Specialist technologies What are they?
Application of high temperature and pressure to densify cast material
Removal of porosity defects improves strength, toughness and machinability
Can eliminate internal voids created by additive manufacturing methods
Method of manufacturing components by HIP technology using powder or solid
Can create parts with the complexity of a casting but the strength of a forging
Can be used to produce materials that can’t be manufactured by any other means
A family of proprietary technologies for the treatment of stainless steel
Unique solution for improving the strength, hardness and wear resistance of stainless steels
Does not affect the inherent corrosion-resistant properties of stainless steel
Comprises thermally sprayed ceramic and metallic coatings, and chemically-formed ceramics
Prolongs component life by protecting from corrosion, abrasion and temperature
Leads to reduced environmental impact by eliminating chrome
A ‘clean’ heat treatment process carried out under vacuum
Provides a hardened surface and tough core – improves wear resistance and fatigue life
Environmentally friendly
Proprietary heat treatment process for improving corrosion resistance and wear properties
Successful alternative to hard chromium
Leads to reduced environmental impact by eliminating chrome
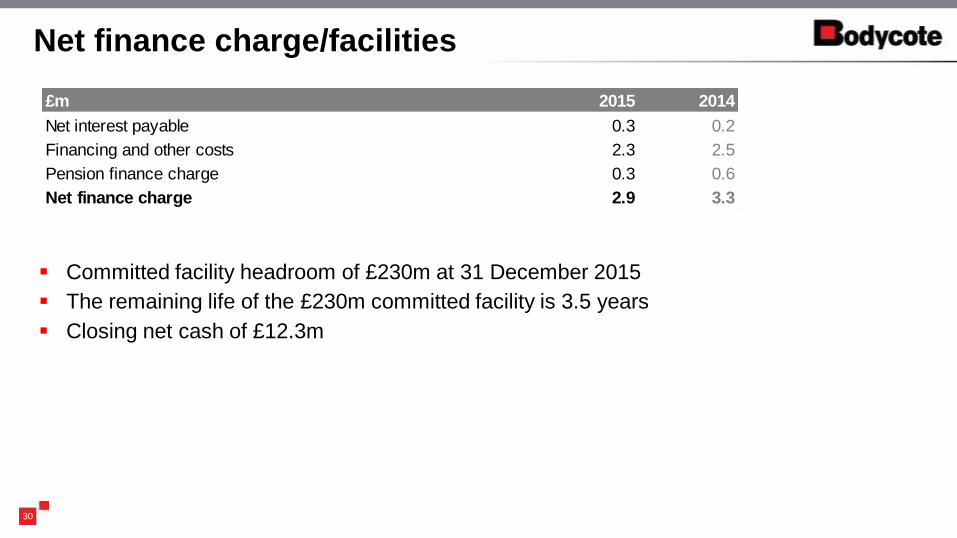
Net finance charge/facilities
30
£m 2015 2014
Net interest payable 0.3 0.2
Financing and other costs 2.3 2.5
Pension finance charge 0.3 0.6
Net finance charge 2.9 3.3
Committed facility headroom of £230m at 31 December 2015
The remaining life of the £230m committed facility is 3.5 years
Closing net cash of £12.3m
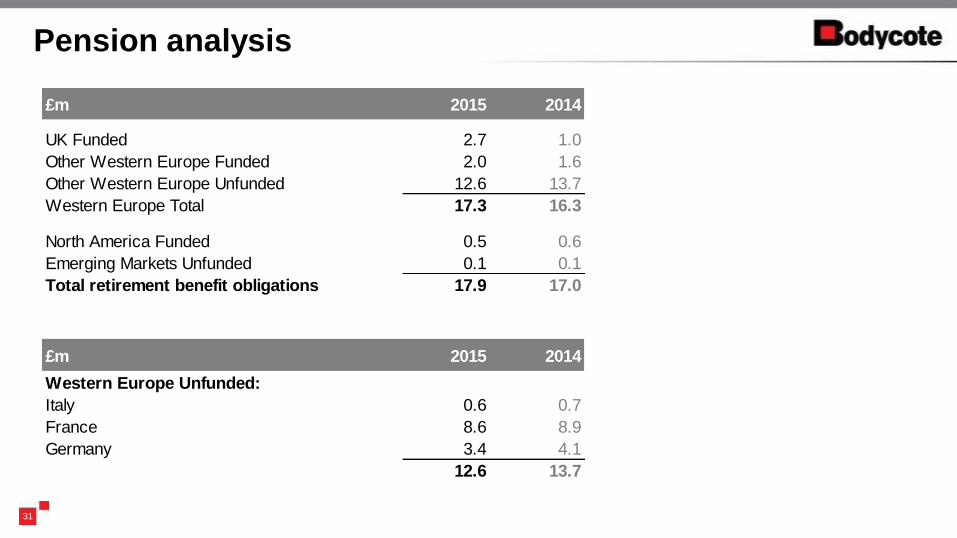
Pension analysis
31
£m 2015 2014
UK Funded 2.7 1.0
Other Western Europe Funded 2.0 1.6
Other Western Europe Unfunded 12.6 13.7
Western Europe Total 17.3 16.3
North America Funded 0.5 0.6
Emerging Markets Unfunded 0.1 0.1
Total retirement benefit obligations 17.9 17.0
£m 2015 2014
Western Europe Unfunded:
Italy 0.6 0.7
France 8.6 8.9
Germany 3.4 4.1
12.6 13.7
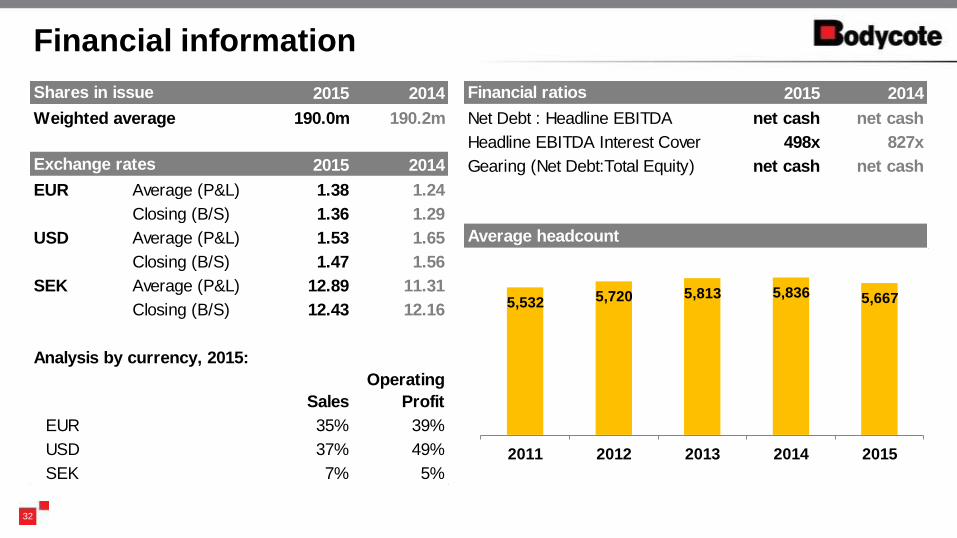
Financial information
32
5,532 5,720 5,813 5,836 5,667
2011 2012 2013 2014 2015
2015 2014
Weighted average 190.0m 190.2m
2015 2014
EUR Average (P&L) 1.38 1.24
Closing (B/S) 1.36 1.29
USD Average (P&L) 1.53 1.65
Closing (B/S) 1.47 1.56
SEK Average (P&L) 12.89 11.31
Closing (B/S) 12.43 12.16
Analysis by currency, 2015:
Sales
Operating
Profit
EUR 35% 39%
USD 37% 49%
SEK 7% 5%
Shares in issue
Exchange rates
2015 2014
Net Debt : Headline EBITDA net cash net cash
Headline EBITDA Interest Cover 498x 827x
Gearing (Net Debt:Total Equity) net cash net cash
Average headcount
Financial ratios
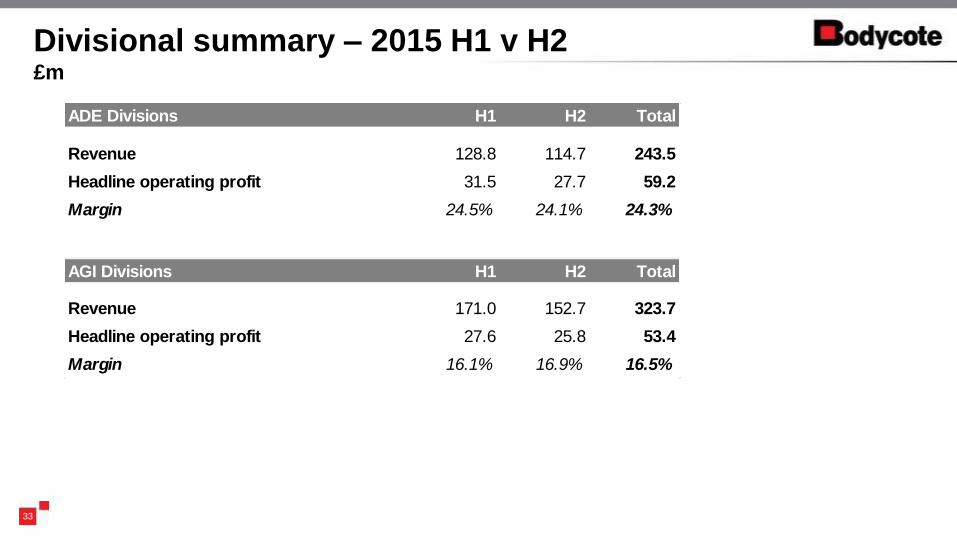
Divisional summary – 2015 H1 v H2 £m
33
ADE Divisions H1 H2 Total
Revenue 128.8 114.7 243.5
Headline operating profit 31.5 27.7 59.2
Margin 24.5% 24.1% 24.3%
AGI Divisions H1 H2 Total
Revenue 171.0 152.7 323.7
Headline operating profit 27.6 25.8 53.4
Margin 16.1% 16.9% 16.5%